Embed Size (px)
Citation preview

Economic and Demographic Scan
Town of Siler City
December 9, 2010

Overview of discussion
• Growing a local economy• Town and County demographics• Basis economic descriptors• Sources of income in the County• Regional perspective• Challenges
– County?– Town?

Growing the local economy
• Depends on your mix of resources– Place-based resources; land, natural resources,
amenities
– Competent, educated workforce, and
– Access to capital for investment
– Access to technology
• What is Siler City’s mix of resources?

Sustaining and Growing the Siler City Economy
Siler City Economy—retail trade, public and private services,
construction, finance,
manufacturing, etc.
Products and services for local area residents
Products and services for tourists
Products and services for local 2nd home and
retiree population
Manufactured products for export
Flow of products and services Flow of income
Export of labor (commuting out)
Import of goods, services and labor
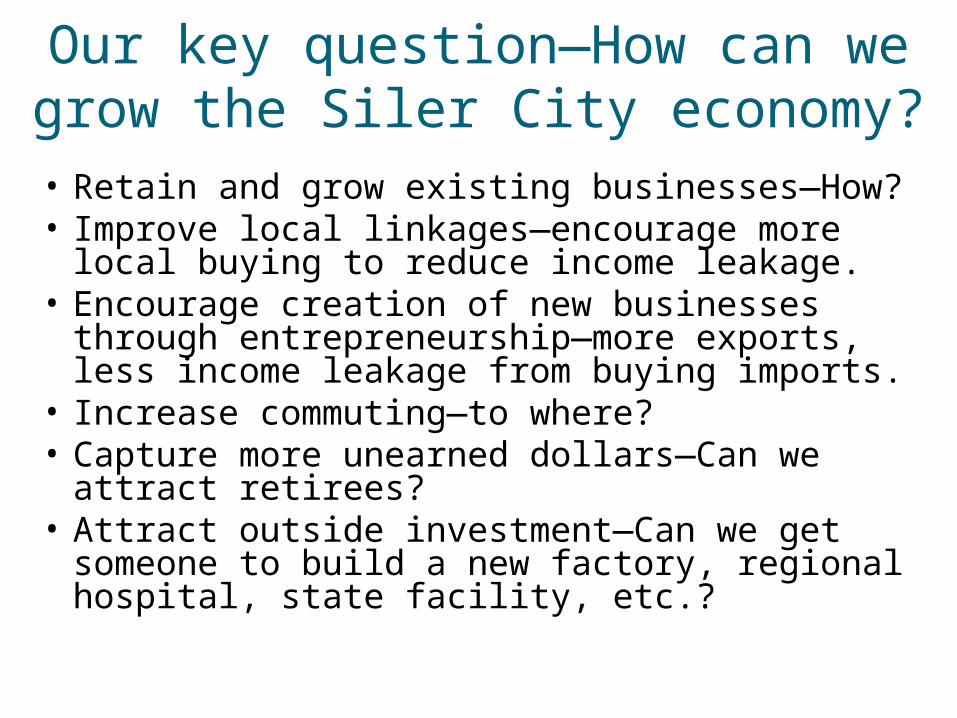
Our key question—How can we grow the Siler City economy?
• Retain and grow existing businesses—How?• Improve local linkages—encourage more local buying
to reduce income leakage.• Encourage creation of new businesses through
entrepreneurship—more exports, less income leakage from buying imports.
• Increase commuting—to where?• Capture more unearned dollars—Can we attract
retirees?• Attract outside investment—Can we get someone to
build a new factory, regional hospital, state facility, etc.?

Figure 1. Chatham County

Geography April 2000 Census Population
July 2008 Estimated Population
Percent change
Siler City 6,966 8,522 22.3
Chatham County 49,326 60,881 23.4
North Carolina 8,046,822 9,227,016 14.7
Table 1. Total Population.

Lived in Siler City Lived in Chatham County
Worked in Chatham County
2,45474.2%
11,01844.7%
Worked outside Chatham County
85225.8%
13,63955.3%
Table 2. Commuting by resident workers 16 years old or older (2000 Census)
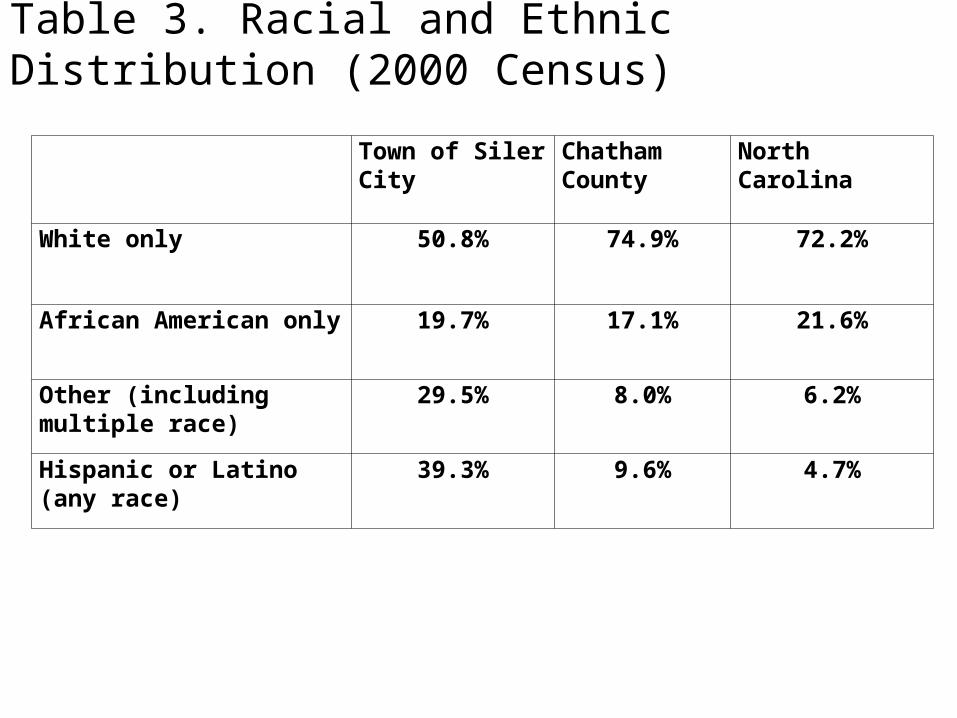
Town of Siler City Chatham County
North Carolina
White only 50.8% 74.9% 72.2%
African American only 19.7% 17.1% 21.6%
Other (including multiple race)
29.5% 8.0% 6.2%
Hispanic or Latino (any race) 39.3% 9.6% 4.7%
Table 3. Racial and Ethnic Distribution (2000 Census)

Age Town of Siler City (%) Chatham County (%)
0-19 years 27.9 24.5
20-24 years 9.9 5.2
25-44 years 32.2 30.5
45-64 years 16.8 24.7
65 years and older 13.1 15.1
Table 4. Age Distribution (2000 Census).

Town of Siler City ChathamCounty
North Carolina
High School Graduate or Higher
55.4% 77.9% 78.1%
Bachelor’s Degree or Higher
8.3% 27.6% 22.5%
Table 5. Educational Attainment of Population Age 25 or over (2000 Census)

Income Averages
• 2008 Per Capita Personal Income– Chatham County $43,894 Rank in NC 3rd
– North Carolina $35,249• Median Family Income in 1999 (2000 Census)
– North Carolina $46,335– Chatham County 50,909– Siler City 36,034
• Per Capita in 1999 (2000 Census): – Chatham County $23,355; Siler City $13,947

Income Component Chatham County (% of Total)
North Carolina (% of total)
Total Personal Income ($000)
$2,781,686 (100%) $325,953,820 (100%)
Farm Income 0.5 0.7
Earnings by place of work 33.7 74.8
Earnings by place of residence
61.7 65.7
Dividends, Interest and Rent 25.3 16.9
Personal Transfer Payments 13.1 17.4
Proprietors’ Income 8.9 7.2
Nonfarm Proprietors’ Income
8.6 6.7
Table 7. Components of Personal Income in 2008 for Chatham County and North Carolina (BEA data).

County 2001 Residence adjustment ($000)
2008 Residence Adjustment ($000)
Chatham 497,976 887,333
Alamance 124,427 193,861
Durham -4,341,478 -6,342,804
Guilford -2,003,846 -2,547,216
Lee -108,701 -124,945
Moore 99,289 168,402
Orange 275,695 485,115
Randolph 608,224 724,026
Wake 882,786 941,128
Table 8. Residence Adjustment Gross Flow of Earnings

NAICS Industry 2001 Number of Jobs
2001 Percent of Total
2008 Number of Jobs
2008 Percent of Total
Total employment (in county) 35,184 100.0 39,632 100.0
Proprietors’ Employment (also included in other categories)
18,172 51.6 22,090 55.7
Farm Employment (Farm and nonfarm added equals total employment)
1,338 3.8 1,152 2.9
Nonfarm employment 33,846 96.2 38,480 97.1
Construction 2,742 7.8 2,911 7.3
Manufacturing 6,581 18.7 5,107 12.9
Wholesale trade 676 1.9 771 1.9
Retail trade 3,430 9.7 3,293 8.3
Transportation and warehousing 674 1.9 670 1.7
Information 532 1.5 552 1.4
Finance and Insurance 927 2.6 1,209 3.1
Real Estate and Rental and Leasing 2,165 6.2 3,280 8.3
Professional, Scientific and Technical Services Undisclosed 4,723 11.9
Administrative and Waste Services 1,549 4.4 1,896 4.8
Educational services 785 2.2 1,268 3.2
Health care and social assistance 3,006 8.5 4,278 10.8
Arts, entertainment and recreation 1,369 3.9 1,777 4.5
Accommodation and Food Services 984 2.8 1,293 3.3
Other Services, Except Public Administration 1,940 5.5 2,358 5.9
Government and Government Enterprises 2,336 6.6 2,682 6.8
Table 9. Chatham County Total Full-time and Part-time Employment by Industry (BEA data, Selected Industries)

Taxable retail sales in 2008-09
2008-09 Taxable retail sales per capita (2008 population estimate State Data Center)
2008-09 Taxable retail sales as a percent of 2008 personal income
North Carolina $99,691,217,415 $10,804 30.6
Chatham $287,773,659 $4,727 10.3
Alamance $1,431,415,494 $9,805 30.7
Durham $3,630,249,377 $13,940 35.6
Lee $512,834,756 $8,919 28.0
Moore $743,499,477 $8,718 22.2
Orange $926,654,246 $7,167 15.5
Randolph $738,027,142 $5,235 18.4
Wake $10,378,048,804 $12,006 28.7
Table 10. Taxable Retail Sales.

Type NC Total NC Percent
Chatham Total
Chatham Percent
1, 2, 2.5 and 3% Tax Group
$653,685,532 0.7 $467,805 0.2
Apparel $3,628,009,462 3.6 $2,142,503 0.7
Automotive $5,365,725,864 5.4 $23,307,361 8.1
Food $19,982,766,504 20.0 $79,735,118 27.7
Furniture $3,854,662,360 3.9 $18,193,311 6.3
General Merchandise $27,281,044,201 27.4 $81,397,055 28.3
Lumber and Building Materials
$11,728,029,451 11.8 $57,371,830 19.9
Unclassified $27,197,294,041 27.3 $25,158,676 8.7
Total $99,691,217,415 100.0 $287,773,659 100.0
Table 11. 2008-09 Taxable Retail Sales by Type.

What does all this mean for Siler City?
• Effect of being a small town in a small county?
• Given your relative isolation, what can you realistically expect to accomplish?
• Is your goal growth or prosperity and is there a difference?
• What strategies are most likely to be successful?
• Resource constraints?
• What needs “fixing”?
• What are our key assets?

Remember our key question—How can we grow the Siler City economy?
• Retain and grow existing businesses—How?• Improve local linkages—encourage more local buying
to reduce income leakage.• Encourage creation of new businesses through
entrepreneurship—more exports, less income leakage from buying imports.
• Increase commuting—Where?• Capture more unearned dollars—Can we attract
retirees? • Attract outside investment—Can we get someone to
build a new factory, regional hospital, state facility, etc. in town or nearby?
• Prosperity without growth?

Next Steps
• Look at potential growth paths
• Brainstorm assets and limiting factors related to each potential growth path
• Visualize Siler City in 2020