Embed Size (px)
Citation preview

ECONOMIC AND SOCIAL BENEFITS ASSESSMENT
FINAL REPORT
Kamloops Regional Farmers’ Market
Kamloops, British Columbia Wednesday Downtown Market
A collaborative project of
British Columbia Association of Farmers’ Markets and
School of Environmental Planning, University of Northern British Columbia
October 6, 2012
Prepared by: David J. Connell, PhD MCIP
Jenica Frisque, MA MSc
Funding provided by:

BENEFITS ASSESSMENT: Kamloops Regional Farmers’ Market (Wednesday) Final Report
BC Association of Farmers’ Markets 1 University of Northern British Columbia
EXECUTIVE SUMMARY The demand for locally produced fresh, nutritious food by local consumers has grown rapidly over the past ten years. So too has the number of farmers’ markets. As the most visible and accessible component of our local food systems, farmers’ markets have strengthened their role as providing unique places for local producers and local consumers to connect. Although this role of farmers’ markets within local food systems is well recognised, it is important to know not only what markets contribute to local areas but also to know how much they contribute. This final report presents the findings from the assessment completed for the Kamloops Regional Farmers’ Market on Wednesday, August 1, 2012. It includes results of a province-wide assessment of BC’s farmers’ markets and incorporates some results from a national study of farmers’ markets completed in 2008i. The provincial project was completed by the BC Association of Farmers’ Markets, in collaboration with Dr. David Connell of the University of Northern British Columbia. The purpose of the provincial study was to measure the community and economic benefits of farmers’ markets across British Columbia in order to quantify the significant contributions of farmers’ markets and to increase their visibility both locally and provincially. This year’s project builds upon the success of a similar project completed in 2006. Six years later, by using similar methods we will be to assess changes that have taken place during this time. In total, 33 assessments were completed across the province in 2012. Highlights of results for the Kamloops Regional Farmers’ Market:
§ The estimated economic benefit of the Wednesday Kamloops Regional Farmers’ Market on the local economy is approximately $1.7 million annually
§ The estimated number of market customers on assessment day: 3,030 customers § Over 425 market visitors participated in the study § Average customer spending per visit: $20.77 § 60.5% of the survey respondents visit the market either ‘regularly’ (almost
weekly) or ‘frequently’ (2-3 times per month) The Kamloops Farmers’ Market assessment is part of a province-wide project. The purpose of the provincial study is to quantify the economic and social contributions of farmers’ markets. Together with the Saturday market, the Kamloops Regional Farmers’ Market on Wednesdays plays an important social, economic and environmental role in Kamloops.

BENEFITS ASSESSMENT: Kamloops Regional Farmers’ Market (Wednesday) Final Report
BC Association of Farmers’ Markets 2 University of Northern British Columbia
The Wednesday Kamloops Regional Farmers’ Market plays a fundamental role in the local food system by linking producers and consumers of local food. It also serves as a community meeting place where ideas, art, plans and politics are discussed and exchanged. The Market attracts tourists and residents alike to the downtown core all summer long. It also provides people working and living downtown access to fresh, local food, goods and crafts. When compared provincially, the Wednesday Kamloops Farmers’ Market has one of the highest average hourly crowd counts among other medium-sized markets across the province, second only to Main Street Station Farmers’ Market in Vancouver. However, the average spent per customer is low compared to other markets. The market could focus on increasing customers spending at the market as a way to grow the market. With the 2012 Social and Economic Benefits presented here, and as the farmers’ market continues to expand, with an increasing awareness about the benefits of shopping and eating locally, an increasing number of vendors and the growth of popular special days (such as the Salsa Competition), the future of the market and regional farmers looks very positive.

BENEFITS ASSESSMENT: Kamloops Regional Farmers’ Market (Wednesday) Final Report
BC Association of Farmers’ Markets 3 University of Northern British Columbia
DESCRIPTION OF MARKET The Kamloops Regional Farmers’ Market: description Market Website: www.kamloopsfarmersmarket.com Thirty years later after it first started, the Kamloops Regional Farmers’ Market is thriving and continues to be an inspiration – a great gathering place to make and /or meet friends and exchange ideas – a place to share your passion for food and community. It’s a family place with a festival atmosphere, often complete with clowns and musical entertainment.
Markets take place on Wednesday and Saturday and vendors offer a huge and growing variety of products, from bedding plants to fresh fruit, vegetables, meat, baking, eggs, and dairy products. There are also specialty items such as locally made noodles, salsa, condiments and even dog treats.
Availability: Open from May 2 to October 31st Wednesdays 8:00am – 2:00pm
# Vendors: 25
Location: 400 block of Victoria Street (in front of the library)
Contact Info: Wendy Makepeace Kamloops Regional Farmers Market Society Box 1282 Kamloops, BC V2C 6H3 [email protected]

BENEFITS ASSESSMENT: Kamloops Regional Farmers’ Market (Wednesday) Final Report
BC Association of Farmers’ Markets 4 University of Northern British Columbia
RESEARCH METHOD The assessment of individual markets in BC is organised around two sets of activities: rapid market assessment and market surveys. These are the same methods used for the BC study in 2006. 1) Rapid Market Assessment: The Rapid Market Assessment (RMA) technique was developed by researchers at Oregon State University for studying farmers’ markets. This method has been implemented successfully in markets throughout Oregon and Washington states. The RMA method consists of three parts: customer survey; crowd count; environmental observations. The environmental observations are optional for markets in this present study and so are not included in this report.
a) Flip-chart survey: The flip-chart survey method engaged consumers in friendly interaction through multiple-choice questions posted in large print on flip charts. This approach has a high response rate, thereby increasing validity and accuracy. The set of questions used for the survey (Box 1) were developed in two parts. The first four questions were developed by the research team and will be asked at all farmers’ markets participating in the project. Asking the same questions at all markets is necessary to complete the provincial analysis. Each participating market developed the fifth question to collect data that are relevant to making effective changes and improvements to the local market.
Box 1. Flip-chart survey questions 1. How often do you come to this farmers’ market?
2. When did you start shopping at this market? 3. How much have you spent, or do you plan to spend, at the market today?
4. If you plan to do additional shopping or eating while in this area of town today, how much do you plan to spend?
5. Where do you live?
b) Crowd count: During a ten-minute period of each hour the market is open,
members of the assessment team stood at each major entry point to the market and counted people entering. The total number of attendees is estimated from these systematic counts.

BENEFITS ASSESSMENT: Kamloops Regional Farmers’ Market (Wednesday) Final Report
BC Association of Farmers’ Markets 5 University of Northern British Columbia
2) Market surveys The analysis of community benefits of farmers’ markets involves more detailed surveys of market customers and local businesses.
a) Customer surveys. A small sample of customers was asked to participate in a short interview. People were asked about where they shop, factors they consider when buying food, how long they spend at the market, and how they spend their time when at the market. Customers were also asked if they shop at other businesses on the same day that they visit the farmers’ market. The small sample size means that the results cannot be generalised to all market customers. Nevertheless, the information collected expands upon the flip-chart survey information and lends further insights to market customers and the relation between the market and neighbouring businesses. Some of the customer survey data will be aggregated at the provincial level.
b) Business surveys. Businesses located near the farmers’ market were surveyed to
assess the influence of the market on neighbouring businesses and to explore the nature of the relationship. The information collected from these surveys is specific to each local market and will lend insight to how relations might be further developed. The business information will also help to understand the relation between farmers’ markets and businesses generally. Surveys were not completed at farmers’ markets that did not have other businesses located nearby.
Together, the market assessment and the more detailed market surveys improve our understanding of what makes the Kamloops Regional Farmers’ Market successful and how it contributes to the local area, in terms of both its economic and social benefits.

BENEFITS ASSESSMENT: Kamloops Regional Farmers’ Market (Wednesday) Final Report
BC Association of Farmers’ Markets 6 University of Northern British Columbia
RESULTS This section reviews the results of the rapid market assessment, including the crowd count estimates and flip-chart surveys. The results for the one-on-one customer interviews and business interviews follow Rapid Market Assessment The weather on the day of the assessment was sunny and hot. There were approximately 25 vendors present, with a variety of local produce for sale and some of the season’s first blueberries and raspberries. There were several non-profit organizations with information booths as well as musicians entertaining the visitors and vendors throughout the market. Crowd count The total estimated number of people attending the Kamloops Farmers’ Market on Wednesday August 1, 2012 was 3030. When asked, vendors at the market said market attendance was average for that time in the season, as compared with past years. The actual and extended counts for the assessment are shown in Table 1. The total estimated counts are also shown in Chart 1.
Table 1. Estimated Crowd Count
Time period Count period Actual count Extended total 1st hour (8:00-9:00) 8:25-8:35am 53 318 2nd hour (9:00-10:00) 9:25-9:35am 60 360 3rd hour (10:00-11:00) 10:25-10:35am 108 648 4th hour (11:00-12:00) 11:25-11:35pm 101 606 5th hour (12:00-1:00) 12:25-12:35pm 122 732 6th hour (1:00-2:00) 1:25-1:35pm 61 366 Estimated total crowd count on Wednesday, August 1, 2012 3,030
Chart 1 (below) shows the estimated crowd totals for each hour. Market attendance steadily builds over the first three hours, peaking during the fourth hour (accounted for most likely by the downtown workers out during their lunch hour), and then decreases for the final hour.

BENEFITS ASSESSMENT: Kamloops Regional Farmers’ Market (Wednesday) Final Report
BC Association of Farmers’ Markets 7 University of Northern British Columbia
Chart 1. Crowd counts by the hour
As shown in Chart 2, the number of shoppers attending the Kamloops Farmers’ Market is about average when compared to other markets that we assessed in BC. The data are based on the average number of shoppers attending a market on an hourly basis (not on the total number of shoppers). Chart 2. Number of shoppers at BC farmers’ markets (average hourly crowd at peak of season)

BENEFITS ASSESSMENT: Kamloops Regional Farmers’ Market (Wednesday) Final Report
BC Association of Farmers’ Markets 8 University of Northern British Columbia
Flip-chart survey Approximately 425 people responded to the dot survey, which is about 14% of the estimated crowd count. The following five charts show the results for each of the flip chart survey questions. Question 1. How much have you spent, or do you plan to spend at the market today? Overall, respondents spent an averageii of $20.77 each on the day of the assessment. Most customers surveyed (61%) said they would spend between $1-20 at the market that day. Chart 3. How much have you spent, or do you plan to spend, at the market today? (Market: n=425; BC: n=9,819; Canada (medium): n=996)
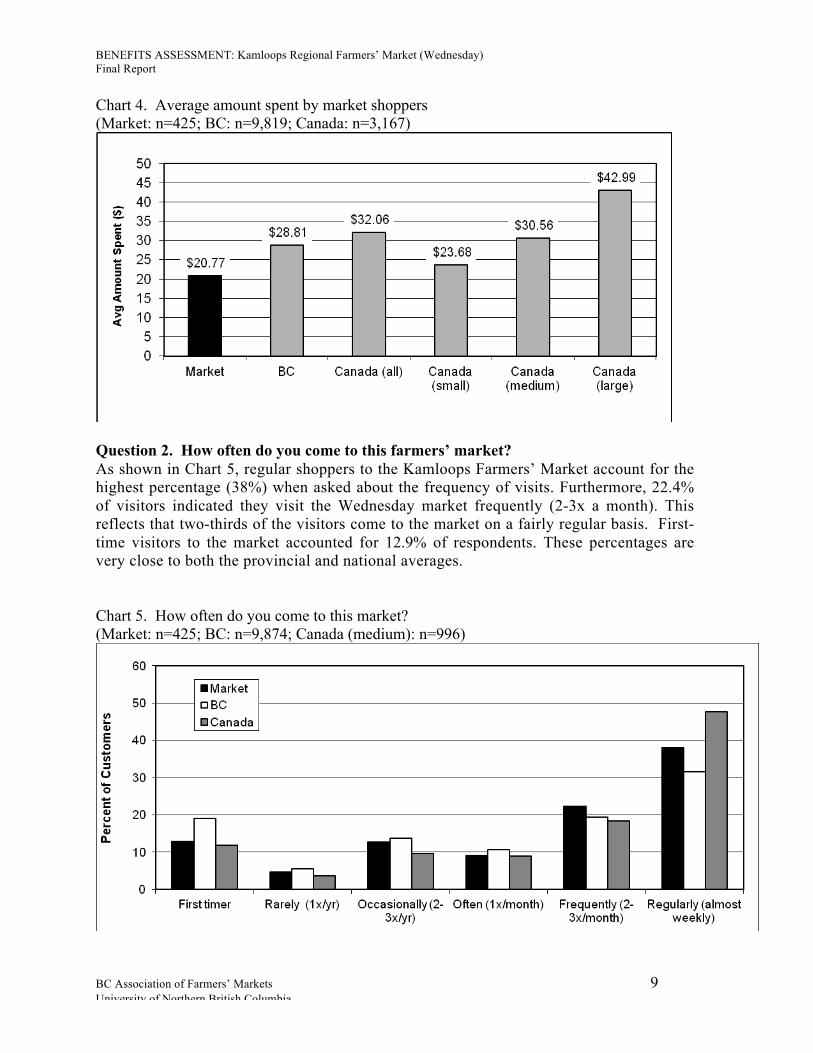
The results shown in Chart 4 illustrate how the Kamloops Wednesday Market compares to the average amount spent by customers at all BC markets and at small (<20 vendors), medium (20-39 vendors), and large farmers’ markets (40+ vendors) in Canada. As a medium market, the Kamloops Market’s amount spent is lower than the national and provincial averages.
BENEFITS ASSESSMENT: Kamloops Regional Farmers’ Market (Wednesday) Final Report
BC Association of Farmers’ Markets 9 University of Northern British Columbia
Chart 4. Average amount spent by market shoppers (Market: n=425; BC: n=9,819; Canada: n=3,167)
Question 2. How often do you come to this farmers’ market? As shown in Chart 5, regular shoppers to the Kamloops Farmers’ Market account for the highest percentage (38%) when asked about the frequency of visits. Furthermore, 22.4% of visitors indicated they visit the Wednesday market frequently (2-3x a month). This reflects that two-thirds of the visitors come to the market on a fairly regular basis. First-time visitors to the market accounted for 12.9% of respondents. These percentages are very close to both the provincial and national averages.
Chart 5. How often do you come to this market? (Market: n=425; BC: n=9,874; Canada (medium): n=996)

BENEFITS ASSESSMENT: Kamloops Regional Farmers’ Market (Wednesday) Final Report
BC Association of Farmers’ Markets 10 University of Northern British Columbia
Question 3. If you plan to do additional shopping or eating while in this area of town today, how much do you plan to spend? Chart 6 shows the range of additional spending by market customers, with 66.7% of respondents saying they would do additional shopping at neighbouring businesses that day. Close to 40% of customers surveyed said they would spend between $1-20. Furthermore 17.2% said they would spend between $20-40 in the downtown area after the Wednesday market. The average amount spent per customer at neighbouring businesses was $23.03. Given the variability among markets, no comparison is made with BC or national results. Chart 6. If you plan to do additional shopping or eating while in this area of town today, how much do you plan to spend? (n=424)
Question 4. When did you start shopping at this farmers’ market? As shown in Chart 7 (below), the Kamloops Wednesday market has a good portion of long-time, loyal customers. One-third of all customers surveyed (30.2%) have been coming to this market for 10 years or more, and 17% of all respondents have been coming to this market for 5-9 years. In addition to the long-time regulars, there were also 19.2% of respondents who were first-time visitors to this market.
Weighted average = $23.03

BENEFITS ASSESSMENT: Kamloops Regional Farmers’ Market (Wednesday) Final Report
BC Association of Farmers’ Markets 11 University of Northern British Columbia
Chart 7. When did you start shopping at this farmers’ market? (n=427)
Question 5. Where do you live? Chart 8 illustrates where the visitors to the market live in Kamloops. The numbers are fairly evenly distributed amongst the Kamloops neighbourhoods, although downtown residents made up almost a quarter of the responses (24.6%). Among Kamloops residents, the second highest percentage was residents from North Kamloops and Brucklehurst (16.5%). The number of out of town visitors made up 17.2% of respondents. Chart 8. Where do you live ? (n=431)
1 Down Town 5 Valleyview, Dallas, Juniper, Barnhartvale 2 Sahali 6 Westside, Rayleigh, Sunrivers, T'Kemlups Indian Reserve 3 Aberdeen, Dufferin, Pineview 7 Out of Town 4 North Kamloops, Brocklehurst

BENEFITS ASSESSMENT: Kamloops Regional Farmers’ Market (Wednesday) Final Report
BC Association of Farmers’ Markets 12 University of Northern British Columbia
Market surveys Customer Survey We conducted interviews with 291 customers at 33 markets in BC. The following charts show results of all the customers surveyed across the province. When interpreting the results of these surveys, it should be noted that the people who agreed to participate in the one-on-one interviews over-represent regular shoppers, as these people are also the ones who are more likely to participate in such market surveys. The over-representation of regular shoppers is evident when we compared the customer survey results (291 responses) against the results gathered from the flip chart surveys (9,819 responses). The flip chart surveys show a wider representation of market shoppers. The results in Chart 9 show the age range of farmers’ market customers in BC.
Chart 9. Age of respondents (BC: n=274)
1.1
36.5
21.5
27.0
13.9
0.0
5.0
10.0
15.0
20.0
25.0
30.0
35.0
40.0
<20 yrs 21-35 yrs 36-50 yrs 51-65 yrs >66 yrs
Perc
ent o
f Res
pond
ents
The household income of shoppers at farmers’ markets in BC is shown in Chart 10 on the next page. The results show that people from households with a range of incomes shop at BC’s markets.

BENEFITS ASSESSMENT: Kamloops Regional Farmers’ Market (Wednesday) Final Report
BC Association of Farmers’ Markets 13 University of Northern British Columbia
Chart 10. Household income (BC: n=233)
13.515.2
21.1
14.5
11.8
4.5
0.0
5.0
10.0
15.0
20.0
25.0
<$25,000 $25,000 -49,999
$50,000 -$74,999
$74,000 -$99,999
$100,000 -$199,999
>$200,000
Perc
ent o
f Res
pond
ents
Over forty percent of customers surveyed in BC shop at the market regularly (almost weekly), with an additional 17% shopping at least two to three times per month (Chart 11). Together, these results mean that almost six of every ten shoppers can be considered among the core group of market shoppers. Chart 11. Frequency of shopping at farmers’ markets (BC: n=251)
16.3
2.0
11.6 10.8
17.1
42.2
0
5
10
15
20
25
30
35
40
45
First timer Rarely (1x/yr)
Occasionally(2-3x/yr)
Often(1x/month)
Frequently(2-3x/month)
Regularly(almostweekly)
Per
cent
of C
usto
mer
s

BENEFITS ASSESSMENT: Kamloops Regional Farmers’ Market (Wednesday) Final Report
BC Association of Farmers’ Markets 14 University of Northern British Columbia
We also asked shoppers where and how often they buy groceries at other food retail outlets during the outdoor market season. The people surveyed indicated that they shop more often at the farmers’ market than at other food retail outlets (Chart 12). Chart 12. Where shoppers shop during the outdoor market season (BC: n=290) Note: a higher bar means shopping more often at the corresponding store.
Farmers
Market
Large
Groce
ry
Small G
rocery
Specia
lty/ethnic
Health Foo
d Stor
e
Direct
from fa
rm
Warehous
e
Convenie
nce S
tore
Freq
uenc
y of
sho
ppin
g(m
ean
scor
e)
1-2x/yr
1x/2-3mo
1x/mo
1x/2wks
1x/wk
>1x/wk
Never
Part of the answer to explain the shopping pattern of market customers is evident in Chart 13, which shows the relative importance of factors customers consider when buying food. During the farmers’ market season the five most important factors to market customers are:
• Nutritional content • Grown/produced in BC • In season • Grown/produced locally • Animal welfare
Brand name, low price, and certified organic are among the lowest rated factors that influence food purchasing decisions.

BENEFITS ASSESSMENT: Kamloops Regional Farmers’ Market (Wednesday) Final Report
BC Association of Farmers’ Markets 15 University of Northern British Columbia
Chart 13. Factors people consider when buying food: BC (n=289)
0.0
0.5
1.0
1.5
2.0
2.5
3.0
3.5
4.0
Nutrition
al con
tent
Grown/prod
uced
in BC
In se
ason
Grown/prod
uced
loca
lly
Animal
welfare
Food sa
fety
Grown/prod
uced
in C
anad
a
Fair tra
de
Packa
ging (
materia
ls)
Appea
rance
of prod
uct
Natural (n
ot ce
rtified
)
Grown/prod
uced
someon
e kno
wn
Certified
orga
nic
Low pr
ice
Ease of p
reparatio
n
Packa
ging (
aesth
etics
)
Brand n
ame
Ratin
g of
impo
rtanc
e (b
ased
on
mea
n; 4
.0 =
mos
t im
porta
nt)
We also asked customers how long they spend at the market (Chart 14) and how much of that time they spend talking with vendors and friends (Chart 15). The results for all BC shoppers surveyed highlight the important social aspect of farmers’ markets. Almost 70% of all respondents said that they spend over 30 minutes at the market, and over half (53.8%) of all respondents said they spend at least half their time at the market socialising with others. Chart 14. Amount of time customers spend at the market (BC: n=290)
4.1
27.1
36.132.6
0.0
5.0
10.0
15.0
20.0
25.0
30.0
35.0
40.0
<15 min. 15-30 min. 31 min. to 1 hr >1 hr
Perc
ent o
f Res
pond
ents

BENEFITS ASSESSMENT: Kamloops Regional Farmers’ Market (Wednesday) Final Report
BC Association of Farmers’ Markets 16 University of Northern British Columbia
Chart 15. Time spent talking with others at the market (BC: n=290)
5.2
41.0
24.8
16.612.4
0.0
5.0
10.0
15.0
20.0
25.0
30.0
35.0
40.0
45.0
None Some Half Most Almost all
Per
cent
of R
espo
nden
ts
The results of the above two questions are combined in Table 2. The shaded boxes highlight those people who spend at least half an hour at the market and at least half of that time talking with vendors, friends, and acquaintances. Altogether, these people represent 45% of the shoppers surveyed at BC’s farmers’ markets. Table 2. Time spent at market talking with others (percentage) (BC: n=290) How time spent Total None Some Half Most Almost all Time spent at market <15 min. 1 2 0 0 0 4 15-30 min. 2 17 5 3 0 27 31 min. to 1 hr 1 16 11 5 4 36 >1 hr 1 7 9 9 8 33
Total 5 41 25 17 12 100
Business survey There were several businesses located within visible range of the Wednesday Kamloops Farmers’ Market, as it takes place in the downtown core. Based on availability of businesses for interviews, and whether they are open on market days, we conducted surveys with four neighbouring businesses (Chart 16).
The three businesses that reported impacts from the market said that the market is good for getting people downtown and into their stores, although some said that the market limits parking. One business said that the market is great for them, as people come in to their business to eat both before and after the market. They also reported a definite sales increase during the market season, as compared to the winter season. The others expressed that while downtown foot traffic increased substantially on market days the sales did not necessarily increase.

BENEFITS ASSESSMENT: Kamloops Regional Farmers’ Market (Wednesday) Final Report
BC Association of Farmers’ Markets 17 University of Northern British Columbia
Chart 16. Affect of market on neighbouring businesses (n=4)
Economic Benefits The information collected in this assessment enables us to measure the economic benefits of the Wednesday Kamloops Regional Farmers’ Market. To measure the economic benefits of farmers’ markets means to measure the ripple effect of people spending dollars at the market: if I spend $1 at the market then how does this dollar benefit the local economy? The ripple effect includes both the profit to the market vendor and the monies the vendor spent on inputs to get to the market (e.g., seeds, feed, ingredients, etc.). Economic benefits, which can include direct, indirect, and some induced effects, are measured in terms of revenue ($), output ($), and employment (jobs). In this study we measure only revenues. We chose to calculate revenue benefits using a multiplier of 1.5iii. This multiplier means that for every dollar spent at the market, another $0.50 is spent in the local economy. Compared to some other studies of farmers’ markets, this multiplier is conservative. The annual economic benefit is calculated by multiplying direct annual sales by the multiplier (1.5). Direct annual sales are calculated as follows:
Average expenditure X Number of spending X Number of sessions X Seasonal
by customer customers per sessioniv per yearv factorvi For the Wednesday Kamloops Regional Farmers’ Market the seasonally adjusted annual direct sales are:

BENEFITS ASSESSMENT: Kamloops Regional Farmers’ Market (Wednesday) Final Report
BC Association of Farmers’ Markets 18 University of Northern British Columbia
$20.77 per customer visit X 2,273 spending customers X 27 (adjusted) sessions = $1,135,000 Using a multiplier of 1.5, the annual economic benefit is approximately:
Annual economic benefit (2012): $1.7 million This calculation means that the Wednesday Kamloops Farmers’ Market contributes an estimated $1.7 million to the local economy each year. These monies benefit not only market vendors but also the local businesses that supply these vendors. The total estimated annual economic benefit for all farmers’ markets in BC is $170.5 million. We can also assess the ‘spillover’ effect that the Wednesday market has on its neighbouring businesses. Based on survey results, we can estimate the benefits of market customers spending additional dollars at local businesses on the day of the market. Using the same formula as above, the annual economic benefit of additional spending at other neighbouring businesses is over $1.26 million.