Embed Size (px)
Citation preview
Univers
ity of
Cap
e Tow
n
University of Cape Town
ECONOMIC ASSESSMENT OF ENERGY EFFICIENCY IN
RESIDENTIAL BUILDINGS IN MOZAMBIQUE: CASE STUDY OF MAPUTO
A thesis submitted to the Faculty of Engineering & the Built Environment in
partial fulfillment for the award of the degree of
Master of Philosophy in Energy and Development Studies
by
Adélia Filosa Francisco Chicombo
Student Number: CHICADE001
Energy Research Centre
University of Cape Town
Cape Town
February 2015

The copyright of this thesis vests in the author. No quotation from it or information derived from it is to be published without full acknowledgement of the source. The thesis is to be used for private study or non-commercial research purposes only.
Published by the University of Cape Town (UCT) in terms of the non-exclusive license granted to UCT by the author.
Univers
ity of
Cap
e Tow
n

i
Declaration
I, Adélia Filosa Francisco Chicombo, hereby declare that this thesis is my own work,
both in concept and execution, except where stated otherwise. This thesis is being
submitted to partially fulfill the requirements for the degree of Master of Philosophy in
Energy and Development Studies at the University of Cape Town. It has not been
submitted for a degree or examination at this University or at any other University.
Signature:

ii
Dedication I dedicate this thesis to my beloved late father, Francisco Filipe Chicombo, who was
always there for me.

iii
Acknowledgements
Many people have contributed directly and indirectly for the success of this thesis, and I
am thankful to all of them. Above all I am thankful to God, for enlightening and guiding
me through my whole life. I am also grateful for all my family, especially my mother, for
the encouragement during my studies.
I want to express my sincere gratitude to my supervisor Dr. Amos Madhlopa and Co-
supervisor Dr. Daniel Baloi, for their orientation, availability and valid suggestions.
I am especially grateful to “Universidade Eduardo Mondlane” for the scholarship and the
Energy Research Center for the various forms of support. Thanks to my dearest friends
and classmates: Thuli and Julien.
I would like to express my gratitude to Luis Cristóvão for providing indispensable help in
organizing the thesis, Gaspar Matusse for help with plans of the energy efficient houses
in the Mozambican context, to Éssita Viagem for all the support and friendship.
I wish to thank all the households from the KaMpfumo municipal district of Maputo City,
for their collaboration in answering the questionnaires and all those who consented to be
interviewed. Finally, a special mention needs to be made to students from the Department
of Statistics of the “Universidade Eduardo Mondlane” for their help in the survey.

iv
Table of Contents
Declaration ..................................................................................................................................................... i
Dedication ..................................................................................................................................................... ii
Acknowledgements ...................................................................................................................................... iii
Abstract ....................................................................................................................................................... xii
Chapter 1: Introduction ................................................................................................................................. 1
1.1. Global context ............................................................................................................................... 1
1.2. Mozambican context ..................................................................................................................... 3
1.3. Objectives ..................................................................................................................................... 5
1.3.1. General Objective: ................................................................................................................ 5
1.3.2. Specific Objectives: .............................................................................................................. 5
1.4. Limitations .................................................................................................................................... 5
1.5. Importance of the Research ........................................................................................................... 6
1.6. Thesis Outline ............................................................................................................................... 9
Chapter 2: Literature Review ...................................................................................................................... 10
2.1. What is Energy Efficiency? ........................................................................................................ 10
2.2. The use of energy in the residential buildings worldwide .......................................................... 11
2.3. Mozambique and its energy profile ............................................................................................ 19
2.3.1. Economy and Development ................................................................................................ 19
2.3.2. Energy profile ..................................................................................................................... 21
2.3.3. Energy consumption in the Mozambican Residential Sector .............................................. 24
2.3.4. Economic performance of buildings in Mozambique ......................................................... 27
2.4. Advantages of Energy Efficient Measures Implementation ....................................................... 28
2.4.1. Improving Energy Security ................................................................................................. 29
2.4.2. Curbing the Economic costs ............................................................................................... 30
2.4.3. Avoiding Social and Environment implications ................................................................. 31
2.5. Current practices in building energy use and optimization ......................................................... 31
2.5.1. Building energy codes ......................................................................................................... 32
2.5.2. Setting standards and labeling for appliances ..................................................................... 33
2.5.3. Providing financial incentives programs ............................................................................. 34
2.5.4. Providing information and voluntary programs .................................................................. 35

v
2.5.5. Zero Energy Buildings ........................................................................................................ 35
2.6. Energy Efficiency Building Regulations .................................................................................... 36
2.7. Strategies for Achieving Energy Efficiency in the Built Environment ....................................... 36
2.7.1. Building orientation ............................................................................................................ 37
2.7.2. Insulation ............................................................................................................................. 38
2.7.3. Ventilation ........................................................................................................................... 38
2.7.4. Landscaping ........................................................................................................................ 38
2.7.5. Use of heat absorbing materials .......................................................................................... 39
2.7.6. Window placement, sizing and shading .............................................................................. 39
2.7.7. Use of energy efficient appliances ...................................................................................... 40
Chapter 3: Methodology ............................................................................................................................. 41
3.1. Research Design ............................................................................................................................... 41
3.2. Data Collection ................................................................................................................................ 42
3.2.1 Location ..................................................................................................................................... 42
3.2.2 Sampling .................................................................................................................................... 42
3.3 Data processing ................................................................................................................................. 44
3.3.1 Economic assessment ................................................................................................................. 44
3.3.2 Model for calculation of Life Cycle Cost .................................................................................. 45
3.3.3 Statistical analysis .......................................................................................................................... 47
Chapter 4: Results and Discussion .............................................................................................................. 49
4.1. General Data ............................................................................................................................... 49
4.2. Energy Consumption Data .......................................................................................................... 56
4.3. Life cycle cost of buildings ......................................................................................................... 61
4.3.1. LCC of type 2 and 3 houses ................................................................................................ 61
4.3.2. LCC of the buildings considering energy efficient appliances ........................................... 62
4.3.3. Building LCC considering building energy efficient elements ........................................... 64
4.3.4. LCC of energy efficient building with energy efficient appliances .................................... 67
Chapter 5: Conclusions and Recommendations .......................................................................................... 71
5.1. Conclusions ................................................................................................................................. 71
5.2. Recommendations ....................................................................................................................... 73
References ................................................................................................................................................... 74
Appendices .................................................................................................................................................. 85
vi
Appendix A: Survey questionnaire for energy efficiency study ............................................................. 85
Appendix B: Data Summary of the Survey ............................................................................................ 93
Appendix C: Interview questionnaire ................................................................................................... 104
Appendix D: LCC calculation of the type 2 and 3 houses .................................................................... 106
Appendix E: Cost estimation for the energy efficient house - type 2 ................................................... 111
Appendix F: Cost estimation for the energy efficient house - type 3 ................................................... 111
Appendix G: LCC calculation for type 2 and 3 houses – Considering 50% improvements over
appliances power capacity .................................................................................................................... 112
Appendix H: Blue print of energy efficient houses .............................................................................. 114
Appendix I: LCC for the energy efficient house – excluding appliances improvements ..................... 116
Appendix J: Energy consumption for energy efficient houses considering 50% improvements over
appliances .............................................................................................................................................. 118
Appendix K: Estimated cost for energy efficient appliances. ............................................................... 119
Appendix L: LCC calculation type 2 and 3 houses – Considering 50% improvements over appliances
power capacity and adoption of building energy efficiency strategies. ................................................ 120
vii
List of figures
Figure 1.1: Mozambique's Location in African Continent. ............................................................ 4
Figure 2.1: World total final energy consumption from 1971 to 2011 by fuel. ............................ 12
Figure 2.2: World primary energy supply, including international bunkers................................. 12
Figure 2.3: World CO2 emissions from 1971 to 2011 by fuel . ................................................... 13
Figure 2.4: World CO2 emissions by sector in 2011. ................................................................... 14
Figure 2.5: Share of various energy sources in the world residential energy consumption . ....... 14
Figure 2.6: Shares of sectors in total final energy consumption for the world. ............................ 15
Figure 2.7: Household energy use by end-use in the IEA19. ....................................................... 18
Figure 2.8: Mozambique map. ...................................................................................................... 19
Figure 2.9: GDP per capita, compared to neighbouring countries. .............................................. 21
Figure 2.10: Total Primary Energy Supply in 2011for Mozambique. .......................................... 22
Figure 2.11: Total final consumption in 2011for Mozambique. ................................................... 23
Figure 2.12: Energy sources of the residential sector between 2007 and 2011. ........................... 24
Figure 2.13: Sector share of electricity consumption from 2005 – 2010 for Mozambique. ......... 25
Figure 4. 1 : Ownership status of the surveyed houses ................................................................. 50
Figure 4.2: Age of the surveyed houses. ....................................................................................... 51
Figure H 1: Blue print of a type 2 energy efficient house. ......................................................... 114
Figure H 2: Blue print of a type 3 energy efficient house. ......................................................... 115

viii
List of tables
Table 2.1: Household energy use by end-use in selected houses from Maputo. .......................... 26
Table 2.2: Aggregated household energy use by end-use............................................................. 26
Table 3.1: Sample size. ................................................................................................................. 43
Table 4.1: Number of the surveyed houses and respective percentage. ....................................... 49
Table 4.2: Average of the houses acquisition and annual maintenance costs . ............................ 53
Table 4.3: Average costs for house acquisition and annual maintenance costs. ........................... 54
Table 4.4: Average of the floor area and number of compartments. ............................................ 55
Table 4.5: Average of the floor area and number of compartments to be considered for the
proposed energy efficient houses. ................................................................................................. 55
Table 4.6: Average number of appliance for the energy efficient house according to the type of
house. ............................................................................................................................................ 57
Table 4.7: Average of appliance power capacity for selected type of houses. ............................. 59
Table 4.8: Annual energy consumption according to each house type......................................... 59
Table 4.10: Data used to calculate LCC of type 2 and 3 houses. ................................................. 61
Table 4.11: LCC for type 2 and 3 houses. .................................................................................... 61
Table 4. 12: Improved energy efficiency of the appliances. ......................................................... 63
Table 4.13: LCC for type 2 and 3 houses - considering 50% improvement of the appliances..... 63
Table 4.14: Annual energy consumption of the type 2 and 3 houses including adjustments over
the operational time, without considering the use of energy efficient appliances. ....................... 66
Table 4.15 : LCC for type 2 and 3 houses that are energy efficient, without considering the use of
energy efficient appliances. .......................................................................................................... 67
Table 4.16: LCC for type 2 and 3 energy efficient houses, considering the use of energy efficient
appliances. ..................................................................................................................................... 68
Table 4.17: Resume of the LCC analysis...................................................................................... 69
Table B 1: Compiled answers for questions number 1 and 2 of the questionnaire. ..................... 93
Table B 2: Compiled answers for questions number 3, 4 and 5 of the questionnaire. ................. 94
Table B 3: Compiled answers for questions number 6 and 7 of the questionnaire. ..................... 95
Table B 4: Compiled answers for questions number 9 and 11 of the questionnaire. ................... 96
Table B 5: Compiled answers for question number 14a of the questionnaire. ............................. 97
ix
Table B 6: Compiled answers for question number 14b of the questionnaire. ............................. 98
Table B 7: Compiled answers for question number 14c (i) of the questionnaire. ........................ 99
Table B 8: Compiled answers for question number 14c (ii) of the questionnaire. ..................... 100
Table B 9: Compiled answers for question number 14c (iii) of the questionnaire. .................... 102
Table B 10: Compiled answers for question number 14d (vi) of the questionnaire. .................. 103
Table D 1: Estimation cost for acquiring the appliances. ........................................................... 106
Table D 2: LCC of type 2 houses................................................................................................ 107
Table D 3: LCC of type 3 houses................................................................................................ 108
Table E 1: Cost estimation for type 2 energy efficient house. .................................................... 106
Table F 1: Cost estimation for the type 3 energy efficient house. .......................................... 11107
Table G 1: LCC of type 2 house, considering 50% improvements over appliances power
capacity. ...................................................................................................................................... 108
Table G 2: LCC of a type 3 – Considering 50% improvements over appliances power capacity.
..................................................................................................................................................... 106
Table I 1: Data summary for LCC for type 2 house that includes only building's envelope energy
efficient ....................................................................................................................................... 108
Table I 2: Data summary for LCC for type 3 house that includes only building's envelope energy
efficient ....................................................................................................................................... 108
Table J 1: Energy consumption for energy efficient houses considering 50% improvements over
appliances .................................................................................................................................... 106
Table K 1: Estimated cost for energy efficient appliances ......................................................... 108
Table L 1: LCC of an energy efficient house type 2, considering 50% improvements of the
appliances power capacity. ......................................................................................................... 120
Table L 2: LCC of an energy efficient house type 3, considering 50% improvements of the
appliances power capacity. ......................................................................................................... 121
x
Abbreviations and acronyms
AC Air Conditioning
BREEM Building Research Establishment Environmental Assessment Method
CFL Compact Fluorescent Lights
CMM Conselho Municipal de Maputo
CNELEC Conselho Nacional de Energia
CO2 Carbon dioxide
CO2eq. Carbon dioxide equivalent
DOE Department of Energy
DSM Demand Side Management
EDM Electricidade de Moçambique
EJ Exajoules
EPBD Energy Performance of Buildings Directive
EU European Union
GDP Gross Domestic Product
GHG Greenhouse gases
GW Giggawatt
HCB Hidroeléctrica de Cahora Bassa
HVAC Heating, Ventilation and Air Conditioning
IEA International Energy Agency
INE Instituto Nacional de Estatística
IPCC Intergovernmental Panel on Climate Change
IRENA International Renewable Energy Agency
Ktoe Kilo tonnes of oil equivalent
kWh Kilowatts Hour
LCA Life Cycle Assessment
LCC Life Cycle Cost
LCCA Life Cycle Cost Analysis
LEED Leadership in Energy and Environmental Designs
LPG Liquefied Petroleum Gas

xi
m2 Meter square
MOZAL Mozambique Aluminium Smelter
MT Meticais
Mtoe Million tonnes of oil equivalent
MW Megawatt
Tcf Trillion Cubic Feet
TPES Total Primary Energy Supply
UE European Union
UN United Nations
UNDP United Nations Development Programme
UNFCCC United Nations Framework Convention on Climate Change
USA United State of America
W Watts

xii
Abstract
The world’s energy consumption has been increasing dramatically in recent years. Economic and
population growth are said to be the main drivers of this phenomenon. This change is held
responsible for the increase in greenhouse gas emissions into the atmosphere, the reduced energy
security and the negative socio-economic implications, especially in developing countries. From
a sectorial perspective, buildings are part of the large energy consumers, especially the
residential sector. It is in this view that measures to reduce this sector’s energy demand has been
largely recommended. One of these measures is promoting the deployment of energy efficient
buildings combined with the use of energy efficient appliances.
The aim of this study was to assess the economic feasibility associated with sustainable buildings
with emphasis on the energy efficiency component. The study concentrated on residential
buildings in Maputo, the capital city of Mozambique. The rationale behind the study lies in the
need to uncover the main variables involved in the economic feasibility of adopting energy
efficient practices within the building sector to help final users, policy makers and other
interested groups to better understand and handle energy efficiency matters.
A case study research design was used to achieve the main objective of this investigation. In this
regard, a survey of households and interviews were conducted to establish the energy
consumption pattern in Mozambique and its associated costs. The survey was conducted in the
Kampfumo Municipality District of Maputo, and the interviews were conducted with civil
engineering companies, electronic engineering, architects and building cost estimators. The
questionnaires were answered by 233 households. Findings from the survey were used to
perform a comparative analysis of the life cycle cost (LCC) of the buildings of the surveyed
households with that of the proposed energy efficient designs, which incorporates buildings
energy efficient elements and energy efficient appliances. .
Under the current circumstances, around 70 and 73% of the LCC of the houses occurs during the
building operational phase, for type 2 and type 3 houses, respectively. It was found that all
appliances that are currently being used by the households are relatively inefficient and could be

xiii
improved by 50%, which resulted in significant reduction of the building’s energy consumption,
accounting for 56% and 68% for the type 2 house and type 3 houses respectively.
The main conclusion of this thesis is that, in Mozambique, the implementation of energy
efficient measures in the type 2 and type 3 houses increases the building’s LCC, except when the
building envelope energy efficient measures are implemented in type 3 houses without taking
into account the suggested energy efficient improvements to the household appliances. The
finding was that under these circumstances, the LCC of type 3 houses is about 5% lower than
that of its equivalent that does take into account any energy efficient strategies. The reduction of
the LCC makes them attractive from the economic feasibility point of view. On the other hand,
in case of type 2, the LCC was of about 1.5% higher when compared to that which does not
incorporate energy efficient strategies.
Key words: Energy efficiency; residential buildings; energy efficient appliances; energy
efficient buildings; life cycle cost.
1
Chapter 1: Introduction
This chapter provides the scope of the study. It contextualizes the study and discusses the main
reasons underpinning the choice of the research topic, indicates the main objectives of the study,
the limitations that were encountered while conducting the research and also discusses the
importance of the research. Chapter two discusses the state of the art of previous work done
relating to the scope of study.
1.1. Global context
It was in the 1970s when the world faced for the first time the oil embargo challenge together
with high inflation rates in most commodities including energy. Since then, the world levels of
energy consumption have been one of the central points of debate and analysis, and resulted in a
massive adoption of energy efficiency policies worldwide, especially in the United States of
America (USA) and European Union (EU). These debates and analyses usually fall under aspects
such as:
a) Energy security: it is unquestionable that energy demand has been increasing
dramatically since the industrial revolution. This increase worsens the security of energy
systems regarding fuel availability, accessibility affordability as well as acceptability
(Kruyt et al., 2009).
b) Environmental implications: the increase of the greenhouse gases in the atmosphere is
indicated to have severe negative implications in the climate system, which is
contributing for example to global warming, climate change, air pollution and the
depletion of ozone layer.
c) Social and economic impacts: energy is a scarce commodity in many countries
especially in low income countries, usually with prohibitive prices that are constantly
increasing due to its high demand levels (Ryan and Campbell, 2012).
The first steps to address these issues were made by the USA and the United Nations (UN). In
1969 the USA promulgated two acts, namely: the National Environmental Policy Act, and the
Coal Mine Health and Safety, and in 1972 during the conference of the UN in Stockholm, it was
2
indicated that the importance of addressing environmental problems that affects both rich and
poor countries (Schipper and Meyers, 1992).
Despite these efforts, energy is still being consumed in an inefficient manner not only in
developing countries but also in developed economies, which presents an opportunity to
introduce improvements. The building sector is not an exception; it also presents a wide array for
improvements. The building sector alone consumes a great deal of energy worldwide making
this sector extremely important in the pursuit for improvements in the rational and efficient use
of energy at local and international levels. The International Energy Agency concurs with this,
and estimates that the primary energy consumed by this sector surpasses the figure of 40% (IEA,
2013a).
Population and economic growth are the main factors that contribute towards the increase of
energy consumption worldwide. Furthermore, the projections indicate that these two factors will
continue increasing in the years to come, which means that there will also be an upward trend in
the consumption of energy.
Fossil fuels, which are finite sources of energy, represent the main source of energy that the
world depends on. The global increase in energy consumption exacerbates the dependence on
these fuels, and also diminishes the level of energy security. In addition, this increase has also
been indicated to have severe negative socio-economic and environmental implications. Climate
change, depletion of the ozone layer and the increase in air pollution are considered to be some
of the adverse impacts caused by the increase in energy consumption.
Studies conducted by the IEA (2013b) and Intergovernmental Panel on Climate Change (IPCC,
2013), indicate that the negative implications resulting from the changes in the climate systems
are already being felt in all nations regardless of their developing stage, and because of the lack
of mitigations capacity, developing countries, such as Mozambique, have an aggravated risk of
suffering the most from the consequences of the increase in energy consumption.
This situation then raises concerns about how the humanity will keep balance between the
upward trend of energy consumption and the dependence on resources that are scarce and mostly
unsustainable. Throughout the world, different institutions and organization have been designing,
3
promoting, financing and implementing policies that contribute toward the reduction of energy
consumption as well as the dependence on fossil fuels.
In this perspective, in 2012 the United Nations General Assembly launched a global initiative
named “Sustainable Energy for All”, which among others, indicates energy efficiency to be one
of the pillars that could contribute toward the reduction of energy demand (REN21, 2013). For
that, this institution has set a goal for all nations to contribute in doubling the rate of
improvement in energy efficiency. Energy efficiency can be implemented in different sectors of
any economy, including but not limited to transport, industry, non-residential and residential
sectors and each of them is required to contribute toward reducing energy consumption. Hence,
the building sector is indicated to be the largest final energy consumer (Rebitzer et al., 2004;
IEA, 2010; Sharma et al., 2011).
Pérez-Lombard et al. (2007) indicates that in developed countries, buildings are held responsible
for 20% to 40% of the global final energy consumption, and in accordance with this, Pérez-
Lombard et al. (2011) states that, all across the world building sector is responsible for about
33% of the total primary energy consumption. A more recent study conducted by the IEA
indicates that, currently buildings account for 40% of global final energy consumption (IEA,
2013a). Moreover, according to this source the residential sector represents the bulk of this
figure, accounting for 23% of the global consumption. Therefore, this research will focus on the
building sector, particularly the residential building sector in Mozambique.
1.2. Mozambican context
Mozambique is a developing country located in Southern Africa. Figure 1.1 depicts Mozambique
location in African Continent. The country ratified the Kyoto protocol from the United Nations
Framework Convention on Climate Change (UNFCCC) in 1994. The main goal of this
convention is to stabilize the greenhouse gases (GHG) concentration in the atmosphere at levels
that prevents anthropogenic interferences in the climatic system. As per the convention rules,
non-annex I countries such as Mozambique have no legally binding commitment to reduce its
GHG (Fay et al., 2012). Nevertheless, as a responsible member of the global community the
country is called to make a contribution towards curbing climate change, since it affects all
society regardless of their development stages.

4
Mozambique has insignificant levels of GHG emissions when compared to developed countries.
In fact, even when compared to other developing countries such as South Africa, Zimbabwe,
Brazil and India the country still falls under these countries in terms of GHG emissions. Factors
such as services based economy, lower population density and poverty influence the economy to
have such minor GHG emissions. The country relies mainly on hydropower for electricity
generation and also consumes large amount of fire wood to supply most of the rural and peri
urban areas needs of energy. Nonetheless, implementing measures such as energy efficiency in
the residential sector may impact positively not only by increasing the country energy security
but also towards achieving the global goal of curbing climate change.
Figure 1.1: Mozambique's Location in African Continent.
The residential sector in Mozambique is responsible for consuming the bulk of the total final
energy. It accounted for over 70% of the total final consumption in 2011 (IEA, 2011). This large
contribution from the residential sector in the country could be explained by the fact that the
Industrial and Transportation sectors are not yet well developed. There are different ways in
which the residential sector energy consumption could be optimized. This research will focus
mainly on the use of technologies and models that are efficient within the households as well as
5
the adoption of efficient building, which could range from designing efficient building and use of
efficient materials.
1.3. Objectives
1.3.1. General Objective:
The overall research objective is to assess the economic feasibility related to the implementation
of energy efficiency measures in the residential building sector of Mozambique.
By implementing energy efficiency measures in buildings, the aim is to rationalize its energy
consumption, avoiding wastes while providing users of the residential building with all the
necessary services, as well as fulfilling the expected degree of comfort and functionality.
1.3.2. Specific Objectives:
To assess energy consumption in the residential sector in Maputo;
To detail the final end use of energy in the residential sector in Maputo;
To compare the theoretical energy performance of conventional buildings and buildings
employing innovative approaches of energy management;
To perform a comparative analysis of the cost of buildings implementing energy efficient
approaches with those associated with the conventional options.
1.4. Limitations
This research depended upon data provided by individuals, meaning that the quality of the
collected data is directly co-related to the degree of importance that the surveyed households
placed on the study. In case where the households showed interest to collaborate with the survey,
the data was of relatively high quality, and the opposite is also true.
It is important to note that some peculiar difficulties were encountered during the process of data
collection, particularly in Sommershiled. It was difficult to find the house’s tenants willingly to
participate in the study. The result of this situation was the reduced number of surveyed
households, which dropped from 23 to only 3 houses, reducing the sample size from 253 to 233
households.
6
Although the study focused on all house types identified by the National Institute of Statistics
(INE “Instituto Nacional de Estatística), only two types of houses represented the majority of the
surveyed houses, namely apartment blocks and conventional houses (houses with single floor).
Since one of the objectives of this study was to develop an energy efficient house, a base case
that would be used to project the efficient design was necessary. The suggestion an efficient
design for apartment blocks showed to bear many variables that would be difficult to keep track.
Therefore, to overcome this limitation this investigation combined the data of apartment blocks
and conventional houses. This combination made a distinction between each type of house,
meaning that an apartment block of two bedrooms was combined with a conventional house of
two bedrooms which resulted in what is designated as type 2 house and the same was done for
the three bedrooms houses, resulting in type 3 house.
The proposed efficient design was considered to use ready available materials. The study only
considered energy efficient strategies suggested by company A, which is basically the use of
elements such as: roof and wall insulations; cross ventilation; double clear glazing; well oriented
house as well as the use of window overhangs.
1.5. Importance of the Research
Since the advent of Industrial Revolution in the 17th
century, the level of consumption of energy
throughout the world has gained unprecedented momentum. This increase is, in part, responsible
for the rise in the concentration of greenhouse gases (GHGs) in the atmosphere, consequently
contributing towards climate change and its adverse implications on society (IPCC 2007;
Mackay 2009).
UNDP (2000) argues that, no country has reached economic development without having to
increase its energy consumption, at least during the early stages. Although developed countries
are capable of growing economically without exerting significant pressure on their energy
consumption, in developing countries the situation is different. In the case of the latter, each
incremental dollar in gross domestic product (GDP) generally implies an increase in energy
demand.

7
The increase in energy demand may have negative impact in future generations, as the energy
resources that the world depends on are mostly finite and non-renewables. Therefore, securing
the global energy future is of the utmost importance. International agencies including but not
limited to IEA, IPCC, UNFCCC and UNDP indicate that a paradigm shift that could result in an
immediate transition to a low-carbon economy is required. Reducing energy consumption for the
same service is one of the ways in which this shift can be accomplished. In light of this, one of
the 25 recommendations of the IEA indicates that governments should implement strategies to
improve energy efficiency in buildings that are proven to be cost-effective and deliver the
required positive changes in terms of energy conservation (IEA, 2010).
Over the last twenty years, building energy code schemes have been implemented by myriad
countries, including all the IEA member states (IEA, 2013a). This instrument represents a key
policy that assists governments in reducing the overall energy consumption in buildings (Kavgic
et al., 2010; Kelly et al., 2012). In parallel to building energy code scheme, energy performance
certification has also been implemented worldwide with the same objective; it can be either
mandatory or voluntary. For instance, the European Union Energy Performance of Buildings
Directive (European EPBD) is mandatory for all the European Union countries. On the other
hand, in the United States of America (USA) and Singapore, energy performance certification
has been implemented on a voluntary basis. Similarly, appliances efficiency standard and
labeling is also being implemented worldwide, to name but few, in the EU there is a scheme
called Eco-Design under which appliances are rated and labeled, the same principle is also being
massively implemented in USA under the ENERGY STAR scheme. These are clear examples of
the available courses of actions that are being pursued by many countries in order to reduce their
building sectors’ energy consumption.
Mozambique, on the other hand, does not have any of these schemes in place, either in
mandatory or even voluntary basis (EDM, 2012a). Nevertheless, as the country is a signatory to
the Kyoto Protocol, actions to reduce its GHG emissions are necessary, and he mentioned
schemes offer a possibility of reaching this global goal.
Kavgic et al. (2010) and Kelly et al. (2012) state that, in the absence of policy actions that will
improve energy efficiency in buildings, this sector will continue to exert great pressure on
primary energy supply and increase grid capacities. In Mozambique the scenario is even
8
alarming as the Hidroeléctrica de Cahora Bassa (HCB – Cahora Bassa Hydroelectricity), the
company responsible for electricity generation is currently operating in its full capacity, and the
Electricidade de Moçambique (EDM – National Utility) has deficient grid capacity to meet the
local demand. It is, therefore, in this perspective, that the building sector plays an important role,
not only in improving the energy security and meeting the global goal of reducing GHG
emissions by 50% by the year 2050, but also in reducing the need for additional power
generation and grid capacity at a local level.
The level of energy consumption in conventional buildings is usually higher than that in modern
and green buildings. Modern and green buildings make the transition from inefficient to energy
efficient buildings possible. In fact, these buildings also provide other dividends such as low
operational and maintenance costs. Therefore, providing measures that are cost effective to
ensure massive adoption of these alternative buildings is critical. For instance, a recent study
conducted in Finland indicates that minor increases in investment for new construction or in
renovation of buildings may result in savings in primary energy consumption in the region of 3.8
– 5.3% by 2020, respectively (Tuominen et al., 2013). Moreover, according to the European
Commission (2010), with high performance buildings, it is possible to reduce total energy use
between the years 2005 and 2020 by 20%.
The inefficient use of energy has adverse technical, economic, environmental and social impacts.
Furthermore, up until now little has been done by the Government of Mozambique, and
construction industry to widespread energy efficient measures and practices in buildings in
Mozambique. However, by adopting small changes including improving insulation, using lower
energy consuming lighting, using more efficient appliances, there could be a reduction of more
than 50% in the annual energy demand in Mozambique (Hankins, 2009).
In Mozambique, as the level of energy consumption has been accelerating over the recent years,
and is expected to continue increasing in the years to come, there has been a growing concern
from the Government related to energy availability and affordability to all of its citizens (EDM,
2012a). Measures to promote the rational use of energy are required in Mozambique in order to
ensure massive distribution of this resources and its affordability. It is therefore, in this
perspective that this research aims to evaluate the existing potential in Mozambique for rational

9
use of energy and energy efficient practices that enhance the reduction of energy consumption in
buildings, particularly in the residential sector.
The evaluation of available potential that may boost the rational use of energy in the residential
sector could, on the one hand, help building developers, real estate investors, house owners, and
other building sector stakeholders to make their decision about building design options and type
of appliances to use, taking into consideration energy efficiency parameters that reduce the
overall energy demand of a building throughout its lifespan. On the other hand, it may also be
used as a tool that the Mozambican Government could assess to develop policies and regulations
that target this particular sector. The combined impact will be on improving the way in which
energy is being used by the residential sector, thereby impacting positively on the overall energy
balance of the country.
1.6. Thesis Outline
This thesis consists of five chapters. The first chapter is the introduction, where the global and
local context related to energy consumption status in the residential sector is briefly discussed.
This is followed by the indication of the main objective and specific objectives that guides this
thesis. Additionally, the importance and outline of the thesis are also presented within the
chapter. Chapter 2 presents a review of relevant literature on the subject under discussion. In this
chapter, aspects such as the world energy status, the picture of energy use in the residential
building worldwide and locally are discussed. In addition, the rationale for energy efficiency in
residential buildings worldwide and in Mozambique, including current practices in building
energy use and optimization, worldwide and nationwide use are also discussed in this chapter.
Chapter 3 focuses on the methodology adopted to collect and analyze data. In this chapter, a brief
discussion of the design of the research is presented. It is also in this chapter where a detailed
methodology for data collection is described, followed by a brief discussion of the selected tools
used to analyze the data. Findings from this investigation are presented and discussed in Chapter
4. The main conclusions and recommendations drawn from the findings are discussed in Chapter
5.
10
Chapter 2: Literature Review
The objective of this study was to assess the economic feasibility of implementing energy
efficient measures within the Mozambican residential sector. Chapter 1 indicates the overall and
specific objectives of this thesis. This chapter on the other hand, makes an assessment of the use
of energy in the residential building at global and local levels and discusses its main drivers and
implications. The advantages of implementing energy efficient measures and the current
practices in energy use and optimization in buildings are also highlighted. It then examines
energy efficiency building regulations and lastly presents a brief discussion of the strategies for
achieving energy efficiency in the built environment.
2.1. What is Energy Efficiency?
Energy efficiency is generally defined as the act of using less energy to provide the same service
(Patterson, 1996 and Rodriguez-Ubinas et al., 2014a). According to Patterson (1996), energy
efficiency can be determined with the following ratio:
(2.1)
For instance, the energy efficiency of an electric geyser is equal to the ratio of the total thermal
energy absorbed by water to the total energy input to the heating element(s) of the geyser. The
concept of energy efficiency is different from that of energy conservation. Energy conservation
is reducing or forgoing a service to save energy, which can be accomplished with or without
energy efficient measures, depending on the elements that dictates the reduction. For example,
while turning down or using less air conditioner in summer is a process of energy conservation,
replacing incandescent light with compact fluorescent ones is an energy efficient action.
From the building point of view, the degree of its energy efficiency is usually linked to the
incorporation of factors such as, but not limited to, building envelope features that are energy
efficient and use of energy efficient appliances, to reduce the building energy requirement to
provide healthy and comfortable indoor environment throughout its lifetime. Rodriguez-Ubinas
et al. (2014a) concurs with this, and states that energy efficient buildings are those that combine
not only passive design solutions but also active designs to reduce energy consumption, and
indicate that passive design elements are usually more affordable than active design solutions.

11
2.2. The use of energy in the residential buildings worldwide
The world’s energy consumption levels have been increasing rapidly over the last decades. This,
then raises concerns regarding decrease on supply capacities, depletion of the energy resources,
social and economic impacts due to the increase of energy prices as well as adverse
environmental implications including but not limited to climate change, global warming as well
as the depletion of the ozone layer.
IPCC (2007) report indicates that the most outstanding environmental problem that the human
king faces currently is global warming. This problem is worsened by the constant and alarming
increase of GHG emissions (Carbon dioxide – CO2, Methane – CH4 and Nitrous Oxide – N2O)
into the atmosphere. However, since the findings from this report indicate that the main reason
for the increase in global temperature is the burning of fossil fuels, reducing energy consumption
that stems from fossil fuels seems to be one way of reducing GHG emissions.
Most of the energy that the world consumes comes from non-environmental friendly sources,
such as coal, oil, natural gas and other sources such as industrial waste and non-renewable
municipal waste. In the current scenario where there is heavy dependence on carbon intensive
sources of energy, high energy consumption level implies high levels of CO2-eq. emissions into
the atmosphere, therefore, curbing this scenario is of the utmost importance.
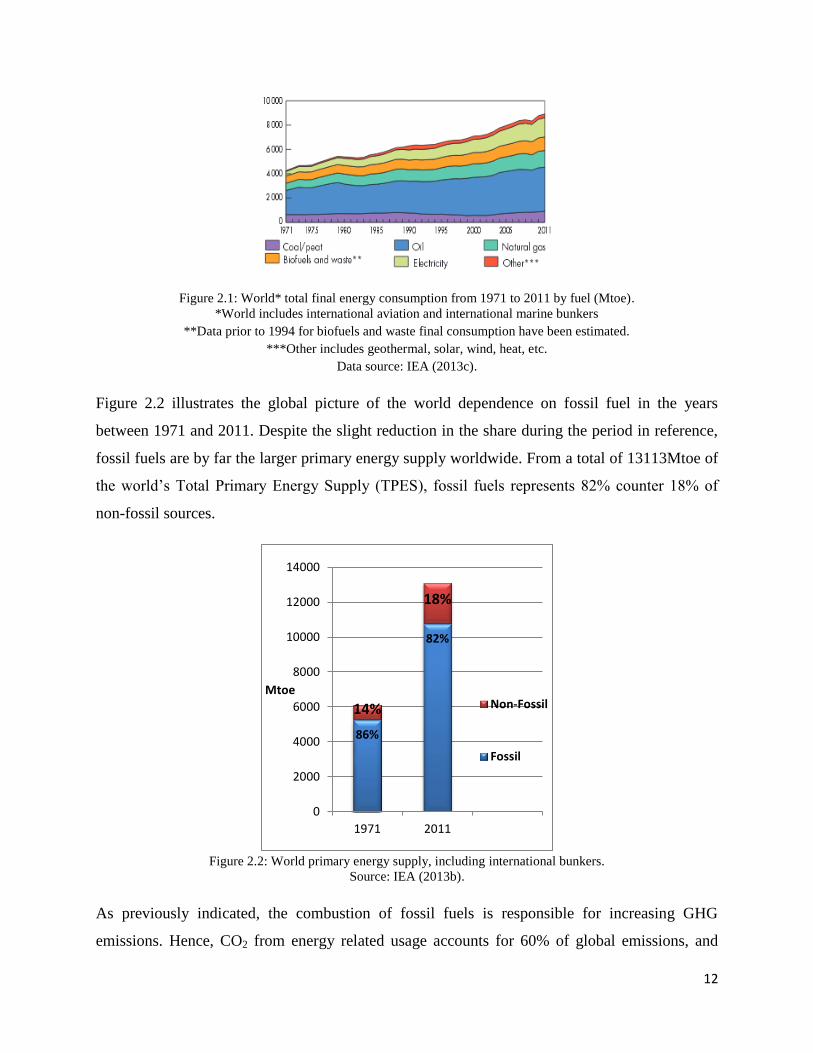
Figure 2.1 extracted from the IEA (2013c) elucidates that from 1971 to 2011, the world total
final consumption more than doubled throughout the period in reference. Fossil fuels are
basically the most relevant sources of energy all across the world, and Oil is by far the larger
contributor, followed by electricity, Natural Gas and Biofuels. The key factors that could explain
this trend are, economic and population growth.
12
Figure 2.1: World* total final energy consumption from 1971 to 2011 by fuel (Mtoe).
*World includes international aviation and international marine bunkers
**Data prior to 1994 for biofuels and waste final consumption have been estimated.
***Other includes geothermal, solar, wind, heat, etc.
Data source: IEA (2013c).
Figure 2.2 illustrates the global picture of the world dependence on fossil fuel in the years
between 1971 and 2011. Despite the slight reduction in the share during the period in reference,
fossil fuels are by far the larger primary energy supply worldwide. From a total of 13113Mtoe of
the world’s Total Primary Energy Supply (TPES), fossil fuels represents 82% counter 18% of
non-fossil sources.
Figure 2.2: World primary energy supply, including international bunkers.
Source: IEA (2013b).
As previously indicated, the combustion of fossil fuels is responsible for increasing GHG
emissions. Hence, CO2 from energy related usage accounts for 60% of global emissions, and
86%
82%
14%
18%
0
2000
4000
6000
8000
10000
12000
14000
1971 2011
Mtoe Non-Fossil
Fossil
13
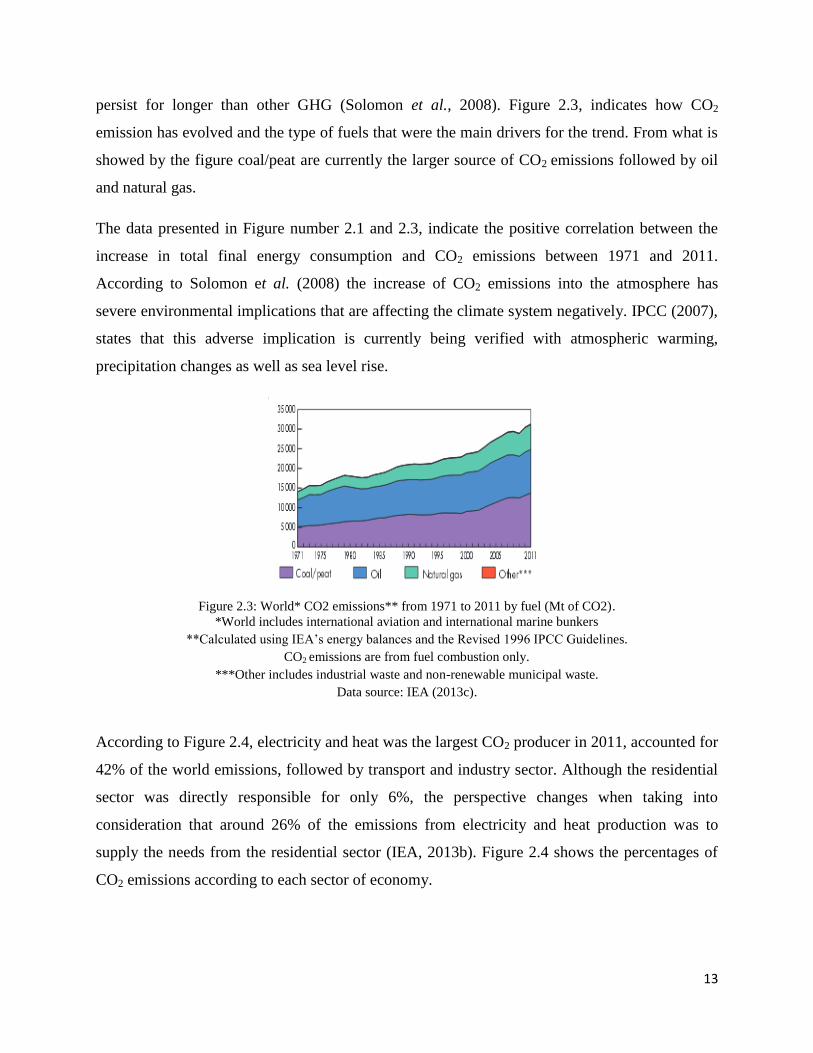
persist for longer than other GHG (Solomon et al., 2008). Figure 2.3, indicates how CO2
emission has evolved and the type of fuels that were the main drivers for the trend. From what is
showed by the figure coal/peat are currently the larger source of CO2 emissions followed by oil
and natural gas.
The data presented in Figure number 2.1 and 2.3, indicate the positive correlation between the
increase in total final energy consumption and CO2 emissions between 1971 and 2011.
According to Solomon et al. (2008) the increase of CO2 emissions into the atmosphere has
severe environmental implications that are affecting the climate system negatively. IPCC (2007),
states that this adverse implication is currently being verified with atmospheric warming,
precipitation changes as well as sea level rise.
Figure 2.3: World* CO2 emissions** from 1971 to 2011 by fuel (Mt of CO2).
*World includes international aviation and international marine bunkers
**Calculated using IEA’s energy balances and the Revised 1996 IPCC Guidelines.
CO2 emissions are from fuel combustion only.
***Other includes industrial waste and non-renewable municipal waste.
Data source: IEA (2013c).
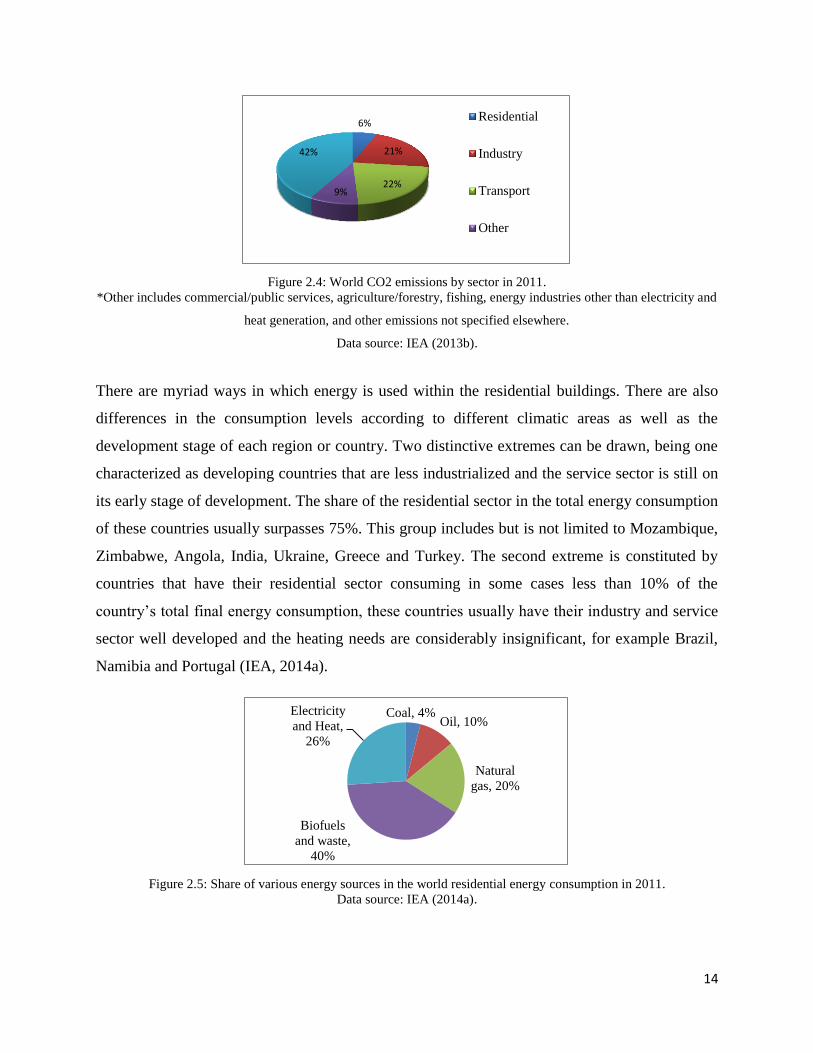
According to Figure 2.4, electricity and heat was the largest CO2 producer in 2011, accounted for
42% of the world emissions, followed by transport and industry sector. Although the residential
sector was directly responsible for only 6%, the perspective changes when taking into
consideration that around 26% of the emissions from electricity and heat production was to
supply the needs from the residential sector (IEA, 2013b). Figure 2.4 shows the percentages of
CO2 emissions according to each sector of economy.
14
Figure 2.4: World CO2 emissions by sector in 2011.
*Other includes commercial/public services, agriculture/forestry, fishing, energy industries other than electricity and
heat generation, and other emissions not specified elsewhere.
Data source: IEA (2013b).
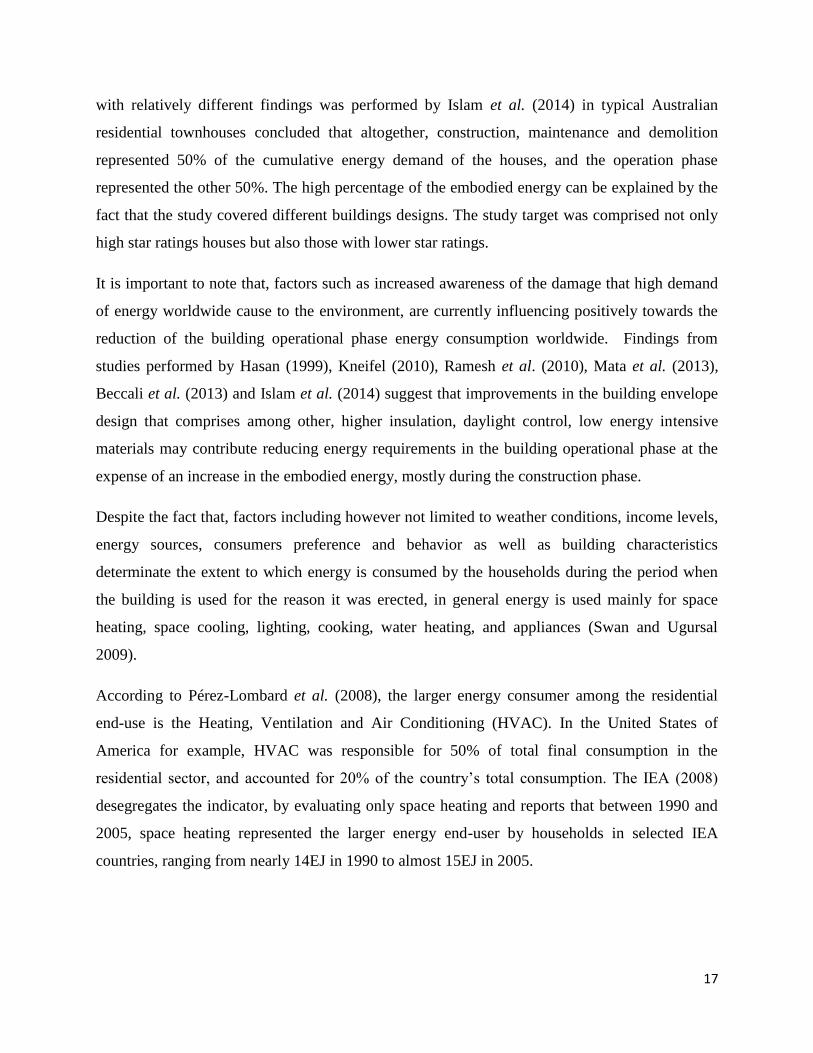
There are myriad ways in which energy is used within the residential buildings. There are also
differences in the consumption levels according to different climatic areas as well as the
development stage of each region or country. Two distinctive extremes can be drawn, being one
characterized as developing countries that are less industrialized and the service sector is still on
its early stage of development. The share of the residential sector in the total energy consumption
of these countries usually surpasses 75%. This group includes but is not limited to Mozambique,
Zimbabwe, Angola, India, Ukraine, Greece and Turkey. The second extreme is constituted by
countries that have their residential sector consuming in some cases less than 10% of the
country’s total final energy consumption, these countries usually have their industry and service
sector well developed and the heating needs are considerably insignificant, for example Brazil,
Namibia and Portugal (IEA, 2014a).
Figure 2.5: Share of various energy sources in the world residential energy consumption in 2011.
Data source: IEA (2014a).
6%
21%
22% 9%
42%
Residential
Industry
Transport
Other
Coal, 4% Oil, 10%
Natural
gas, 20%
Biofuels
and waste,
40%
Electricity
and Heat,
26%

15
Not only is the total final energy consumption different from country to country so do the share
of the main energy sources in the residential sector worldwide. Figure 2.5 demonstrates that
among all sources of energy of the residential sector, biofuels and waste represents the most
important source, with a share of 40%, followed by electricity and heat, and natural gas, with
shares of 26% and 20%, respectively. Oil and coal also contribute, however with minor shares of
10% and 4%, respectively.
The International Energy Agency (IEA) usually aggregates the main relevant final energy
consumers in four groups, namely: industry, transport, residential and services. Figure 2.6
depicts the share that these sectors have on the total final energy consumption, and the total
amount of energy consumed worldwide. The figures clearly indicate the significance of the
residential sector in terms of final energy consumption, representing 23% of the total final
energy consumed in 2011. However, it’s worth noticing that the industry and transport sectors
consumes even more energy than the residential sector, with shares of 29% and 27%
respectively.
Figure 2.6: Shares of sectors in total final energy consumption for the world (1973 and 2011).
*Other includes agriculture/forest, fishing, non-specified.
Data source: IEA (2014a).
Although, the residential sector share on the total final energy consumption remained the same in
2011 as those from 1973, its level of consumption has increased, since in 1973 the total final
consumption was only 4 674Mtoe counter 8 918Mtoe in 2011, which means that the sector total
33%
23%
23%
8%
7% 6%
Total (1973): 4 674Mtoe
Industry Transport
Residential Services
Other* Non-energy use
29%
27% 23%
8%
4% 9%
Total (2011): 8 918Mtoe
Industry Transport
Residential Services
Other* Non-energy use

16
final energy consumption almost doubled. This, increase can be explained by the growth in
population, increase in time spent in doors, rise of comfort levels as well as the pressure due to
more building services.
Throughout its life cycle, the building demand for energy is both, direct and indirect. On one
hand there is the direct energy demand occurring during the construction, operational and
demolition phases. On the other hand, there is an indirect demand result from the extraction of
the raw materials, the production of the materials needed for their construction and technical
installations (Sartori and Hestnes, 2007). It is important to note that, different quantities of
energy are consumed directly and indirectly, but the direct demand constitutes the bulk.
Studies carried out few decades ago by Hallquist (1987) and Hannon et al. (1987) cited by
Gillingham et al., (2006) indicated that 90-95% of the total energy required by a house during its
lifespan was consumed during the operational phase. This figure clearly indicates the relevance
of the building life cycle energy bill during the operational phase over other stages.
Later on, Adalberth (1997) performed a study in Sweden, whereby energy consumption in three
single-unit dwellings during their life cycle was assessed. The study concluded that 85% of the
total energy required by a building throughout its life cycle is used during the operational phase,
followed by embodied energy (to manufacture all materials needed for the building’s erection
and renovation), accounting for approximately 15%. Moreover, the study concluded that
transportation and energy process accounts for nearly 1% of the total energy during the
building’s erection and end of life disposal. These percentages, clearly indicate that if an
intervention towards reducing energy consumption in the building sector is ever to be achieved,
the emphasis should be in the building operational phase, since the energy consumed in other
phases such as, construction, renovation, demolition are minor.
Subsequent studies carried out by Utama and Gheewala (2008) and Ramesh et al. (2010)
conclude that embodied energy represented 10-20% and operating phase was responsible for
around 80-90% of the house’s total energy demand during its life time. Moreover, Beccali et al.
(2013) also performed life cycle assessment in single family house in Italy, where it was
concluded that operation phase represented 72% of the total energy consumed by the house
throughout its lifespan and the remaining 28% represented the embodied energy. Another study
17
with relatively different findings was performed by Islam et al. (2014) in typical Australian
residential townhouses concluded that altogether, construction, maintenance and demolition
represented 50% of the cumulative energy demand of the houses, and the operation phase
represented the other 50%. The high percentage of the embodied energy can be explained by the
fact that the study covered different buildings designs. The study target was comprised not only
high star ratings houses but also those with lower star ratings.
It is important to note that, factors such as increased awareness of the damage that high demand
of energy worldwide cause to the environment, are currently influencing positively towards the
reduction of the building operational phase energy consumption worldwide. Findings from
studies performed by Hasan (1999), Kneifel (2010), Ramesh et al. (2010), Mata et al. (2013),
Beccali et al. (2013) and Islam et al. (2014) suggest that improvements in the building envelope
design that comprises among other, higher insulation, daylight control, low energy intensive
materials may contribute reducing energy requirements in the building operational phase at the
expense of an increase in the embodied energy, mostly during the construction phase.
Despite the fact that, factors including however not limited to weather conditions, income levels,
energy sources, consumers preference and behavior as well as building characteristics
determinate the extent to which energy is consumed by the households during the period when
the building is used for the reason it was erected, in general energy is used mainly for space
heating, space cooling, lighting, cooking, water heating, and appliances (Swan and Ugursal
2009).
According to Pérez-Lombard et al. (2008), the larger energy consumer among the residential
end-use is the Heating, Ventilation and Air Conditioning (HVAC). In the United States of
America for example, HVAC was responsible for 50% of total final consumption in the
residential sector, and accounted for 20% of the country’s total consumption. The IEA (2008)
desegregates the indicator, by evaluating only space heating and reports that between 1990 and
2005, space heating represented the larger energy end-user by households in selected IEA
countries, ranging from nearly 14EJ in 1990 to almost 15EJ in 2005.
18
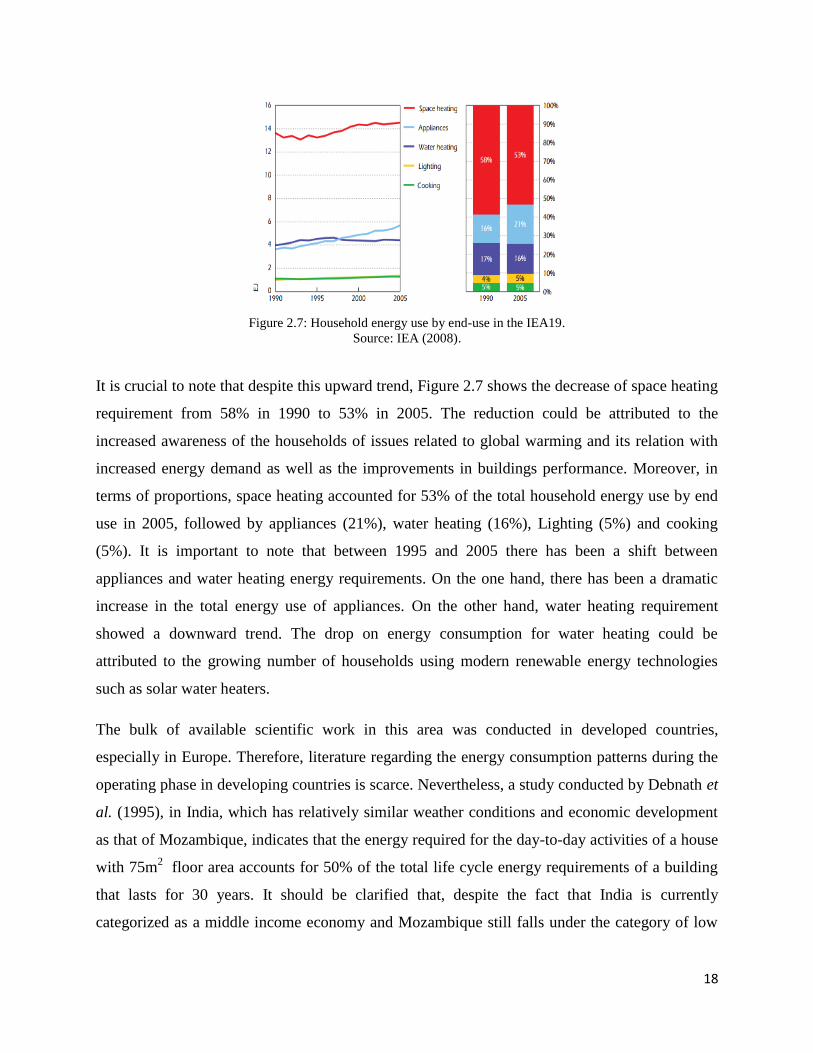
Figure 2.7: Household energy use by end-use in the IEA19.
Source: IEA (2008).
It is crucial to note that despite this upward trend, Figure 2.7 shows the decrease of space heating
requirement from 58% in 1990 to 53% in 2005. The reduction could be attributed to the
increased awareness of the households of issues related to global warming and its relation with
increased energy demand as well as the improvements in buildings performance. Moreover, in
terms of proportions, space heating accounted for 53% of the total household energy use by end
use in 2005, followed by appliances (21%), water heating (16%), Lighting (5%) and cooking
(5%). It is important to note that between 1995 and 2005 there has been a shift between
appliances and water heating energy requirements. On the one hand, there has been a dramatic
increase in the total energy use of appliances. On the other hand, water heating requirement
showed a downward trend. The drop on energy consumption for water heating could be
attributed to the growing number of households using modern renewable energy technologies
such as solar water heaters.
The bulk of available scientific work in this area was conducted in developed countries,
especially in Europe. Therefore, literature regarding the energy consumption patterns during the
operating phase in developing countries is scarce. Nevertheless, a study conducted by Debnath et
al. (1995), in India, which has relatively similar weather conditions and economic development
as that of Mozambique, indicates that the energy required for the day-to-day activities of a house
with 75m2 floor area accounts for 50% of the total life cycle energy requirements of a building
that lasts for 30 years. It should be clarified that, despite the fact that India is currently
categorized as a middle income economy and Mozambique still falls under the category of low

19
income economy, the study in reference was conducted in a period where the economic
characteristics of India were closely related to that of Mozambique in current days.
2.3. Mozambique and its energy profile
2.3.1. Economy and Development
Mozambique is a developing country located in Southern Africa with a warm and tropical
climate. According to the National Institute of Statistics (INE - Instituto Nacional de
Estatísticas) during summer the countries temperatures fluctuates between 24.1 ˚C and 41.5˚C,
however, in wither it ranges from 7.4˚C and 26.5˚C. The last census conducted in 2007 by INE
indicates that the country has around 20.07 million people. However, current estimation
indicated this number to be over 25.83 million people (World Bank, 2014). INE (2007) indicates
that over 70% of the Mozambican populations were living in rural areas. However, this number
has been shrinking as time goes by, caused mainly by rural exodus. In fact, current figures
indicate that in 2010 the percentage dropped to approximately 62% (World Bank, 2014).
Figure 2.8: Mozambique map.
Mozambique is the thirty fifth largest country in the world, with an area of 802,590 km2 divided
between land and water, with shares of 785,090km2 and 17.500km
2 respectively. Figure 2.8,
shows the Mozambique Map. The Map depicts that Mozambique shares border with six

20
countries, namely, South Africa and Swaziland to the southwest, to the northwest there is
Zimbabwe, Tanzania to the north and to the northwest it shares border with Malawi and Zambia.
Portuguese is the official language inherited from Portugal, which colonized the country. There
are 10 provinces in Mozambique, namely, Maputo (Capital City), Gaza, Inhambane, Sofala,
Manica, Tete, Zambézia, Nampula, Cabo Delgado and Niassa. The capital city, which is located
on the western shore of Maputo bay, at the southern end of the country, occupies the central
position in terms finance, policymaking, commerce, education and Infrastructure.
There are three main stages that mark the economy of Mozambique. First stage happens prior to
the proclamation of the country’s independence in 1975, when Portugal dominated the country,
and the economic development followed the rules and expectation of the colonizer. The second
stage happened during 1977-1992. During this period the country suffered from a civil war, led
by the two main parties “Frente de Libertação de Moçambique” (FRELIMO) and “Resistência
Nacional de Moçambique” (RENAMO). Not only did the war decimated lives, but also resulted
in huge sabotage of the industry as well as the devastation of most of the infrastructure inherited
after the independence. This situation drove the country to complete chaos, and stepped back the
country development goal adopted after the independence. The last stage started after the peace
agreement between the two parties, from this period started a new era of democracy and
multiparty system. Since then, the country has experience unprecedented economic growth rates.
Currently, Mozambique is member of Southern Africa Development Community (SADC).
According to the United Nation Development Program report, the country remains steeped in
poverty, despite the optimistic speeches from the politicians. The country is at position number
178 out of 187 countries, which represents a rose by seven places in overall score in comparison
to the 2012 position, moving from position number 185th
in 2012 to 178th
in 2013 (UNDP,
2014). Although the country is endowed with rich and extensive natural resources, its benefits
are yet to be evenly distributed among its citizens. This situation could explain the contradicting
information regarding the Mozambique economic growth and level of poverty alleviation.
The Foundation for Community Development, states that poverty levels have worsened, current
estimation indicates that there has been an upward trend from 54% in 2009 to 60% in 2013.
According to the International Monetary Fund (IMF), in 2013 Mozambique presented a Real
21
Gross Domestic Product (GDP) of 7.1% which was one of the highest within sub-Saharan
Africa. Moreover, the projections from the IMF indicated that the GDP may reach 8.3% and
7.9% in 2014 and 2015 respectively. This growth is mainly driven by the increase of public
expenditure as well as the foreign direct investment. However, the country’s fiscal revenue only
covers 65% of the annual budget.
The mining sector was the fastest growing sector in 2013, mostly due to the increase in coal
exportation. Agriculture still plays an important role in the countries income, currently, it
employs and provides livelihood to over 70% of the population, and according to Cuvilas et al.
(2010), the sector employs 80% of the labour force. The sector is not yet well developed, and the
majority of its players practice subsistence agriculture, which has a very small productive rate.
The industry sector was reasonably developed prior to the independence from colonial rule, thus,
the war against the colonialism followed by the civil war resulted in the destruction, sabotage
and foreclosure of many industries.
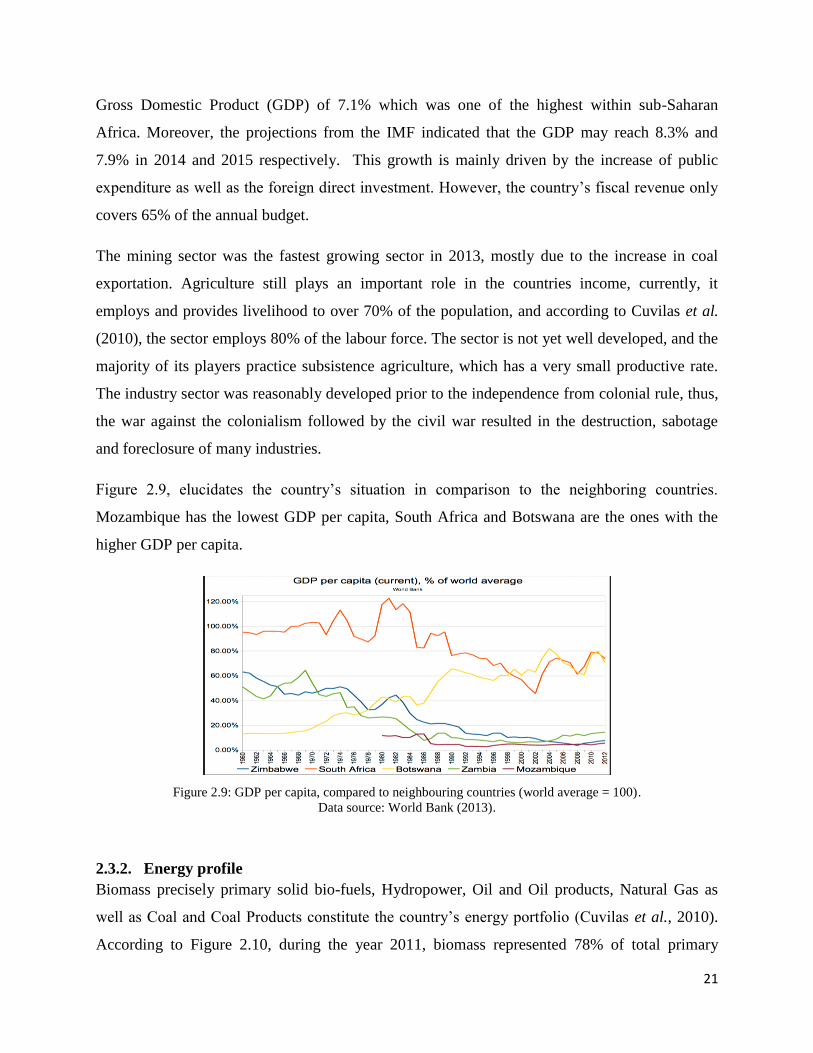
Figure 2.9, elucidates the country’s situation in comparison to the neighboring countries.
Mozambique has the lowest GDP per capita, South Africa and Botswana are the ones with the
higher GDP per capita.
Figure 2.9: GDP per capita, compared to neighbouring countries (world average = 100).
Data source: World Bank (2013).
2.3.2. Energy profile
Biomass precisely primary solid bio-fuels, Hydropower, Oil and Oil products, Natural Gas as
well as Coal and Coal Products constitute the country’s energy portfolio (Cuvilas et al., 2010).
According to Figure 2.10, during the year 2011, biomass represented 78% of total primary

22
energy supply, followed by hydropower (13.8%), Oil Products, (7.9%), Natural Gas (1.2%) and
Coal and Peat with a share of only (0.2%).
Figure 2.10: Total Primary Energy Supply in 2011for Mozambique.
Data source: Adapted from IEA (2013d).
In Mozambique, traditional biomass is being largely used not only by the rural households, but
also by many poor urban and peri-urban households. A study carried out by Brouwer and Falcão
(2004) estimates that in Maputo, 70-80% of the households use firewood and charcoal to meet
their energy requirements. It is therefore, important to mention that the collection of wood fuels
is mostly made in unsustainable manner. Additionally, Cuvilas et al. (2010) argues that, the use
these fuels is usually made in inefficient ways, which contribute to significant energy losses, and
deterioration of the household health conditions, causing severe respiratory diseases.
The lack of awareness of the potential damage caused by the unsustainable way in which
biomass is collected is held responsible for the alarming cases of deforestation, forest
degradation, soil erosion as well as land use change. Annually, over 22 million tonnes of
firewood and charcoal is being produced in Mozambique (Cuvilas et al., 2010). This situation
then exacerbates the adverse impact in the environment, the climate system, the economy as well
as to the society.
Despite the fact that Mozambique is endowed with significant amounts of coal, estimated at 20
billion tones in the Zambezi coal basin, up until now, the country still falls under the category of
less carbon intensive economy, accounting for 0.01% of global CO2 emissions in 2010, driven
mostly by the cement industry (Solomon et al., 2014). This relative low CO2 emission is mostly
because, on the one hand, the bulk of coal production is exported. On the other hand, there is use
0.2% 7.9% 1.2% 13.8%
77%
Total: 10 202 (Ktoe)
Coal and
PeatOil Products
Natural Gas
Hydro

23
of hydro resources to generate electricity in the country. However, this situation may change in
the coming decades.
According to Carneiro and Alberto (2014) and Solomon et al. (2014), the recent discoveries
made at Rovuma basin indicate this basin to have a plethora of natural gas reserves, accounting
for 100Tcf of gas, which could turn the country into one of the large natural gas producers in the
world. In this line, the government goal of building a Liquefied Natural Gas plant near to the
Rovuma basin, combined with the consideration of building a Coal-to-Liquids plant with 9GW
installed capacity, it is likely that CO2 emissions of the country will increase as these projects
come to realization (Carneiro and Alberto, 2014; Solomon et al., 2014).
Mozambique’s total energy consumption is about 8078ktoe, which is relatively low when
compared to countries such as South Africa and Brazil, which consumes 71127 ktoe, 217889
ktoe respectively. On the other hand, Zimbabwe’s total energy consumption is of about
8444ktoe, which is quite similar to that of Mozambique (IEA 2013d). South Africa and Brazil
have a very energy-intensive industrial sector, which consumes a great deal of the total final
energy within their economies. On the other hand, in countries such as Mozambique and
Zimbabwe the residential sector is the larger final energy consumer, accounting for more than
50% of the total consumption. According to Figure 2.11, in Mozambique, the sector is
responsible for 70.8% of the total final consumption, followed by the Industry, Transport, Non-
specified, Commercial and public services and the agriculture and forestry sector, with shares of,
19.9%, 7.9%, 0.7%, 0.6% and 0.1%, respectively.
Figure 2.11: Total final consumption in 2011for Mozambique.
Source: Adapted from IEA (2013d).
19.9% 7.9%
70.8%
0.6% 0.1% 0.7%
Total: 8 078 (Ktoe)
Industry
Transport
Residential
Commercial and
public servicesAgruculture/Forestry
Non-specified
24
2.3.3. Energy consumption in the Mozambican Residential Sector
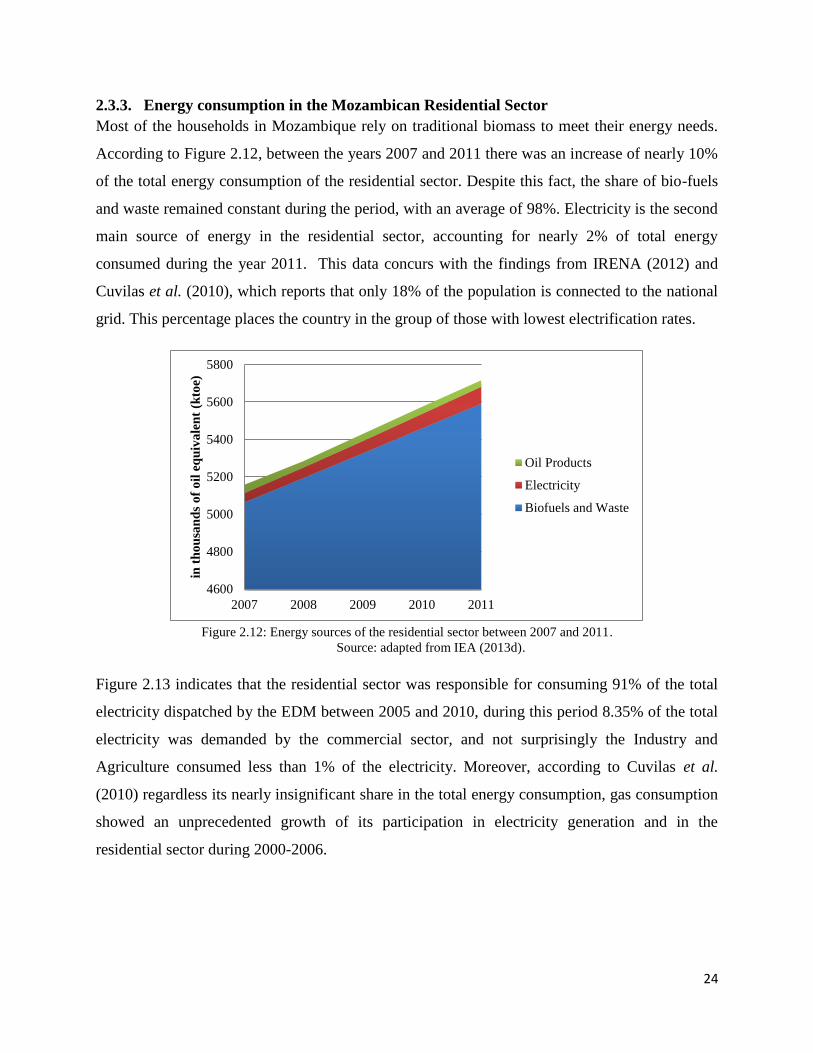
Most of the households in Mozambique rely on traditional biomass to meet their energy needs.
According to Figure 2.12, between the years 2007 and 2011 there was an increase of nearly 10%
of the total energy consumption of the residential sector. Despite this fact, the share of bio-fuels
and waste remained constant during the period, with an average of 98%. Electricity is the second
main source of energy in the residential sector, accounting for nearly 2% of total energy
consumed during the year 2011. This data concurs with the findings from IRENA (2012) and
Cuvilas et al. (2010), which reports that only 18% of the population is connected to the national
grid. This percentage places the country in the group of those with lowest electrification rates.
Figure 2.12: Energy sources of the residential sector between 2007 and 2011.
Source: adapted from IEA (2013d).
Figure 2.13 indicates that the residential sector was responsible for consuming 91% of the total
electricity dispatched by the EDM between 2005 and 2010, during this period 8.35% of the total
electricity was demanded by the commercial sector, and not surprisingly the Industry and
Agriculture consumed less than 1% of the electricity. Moreover, according to Cuvilas et al.
(2010) regardless its nearly insignificant share in the total energy consumption, gas consumption
showed an unprecedented growth of its participation in electricity generation and in the
residential sector during 2000-2006.
4600
4800
5000
5200
5400
5600
5800
2007 2008 2009 2010 2011
in t
ho
usa
nd
s o
f o
il e
qu
iva
len
t (k
toe)
Oil Products
Electricity
Biofuels and Waste
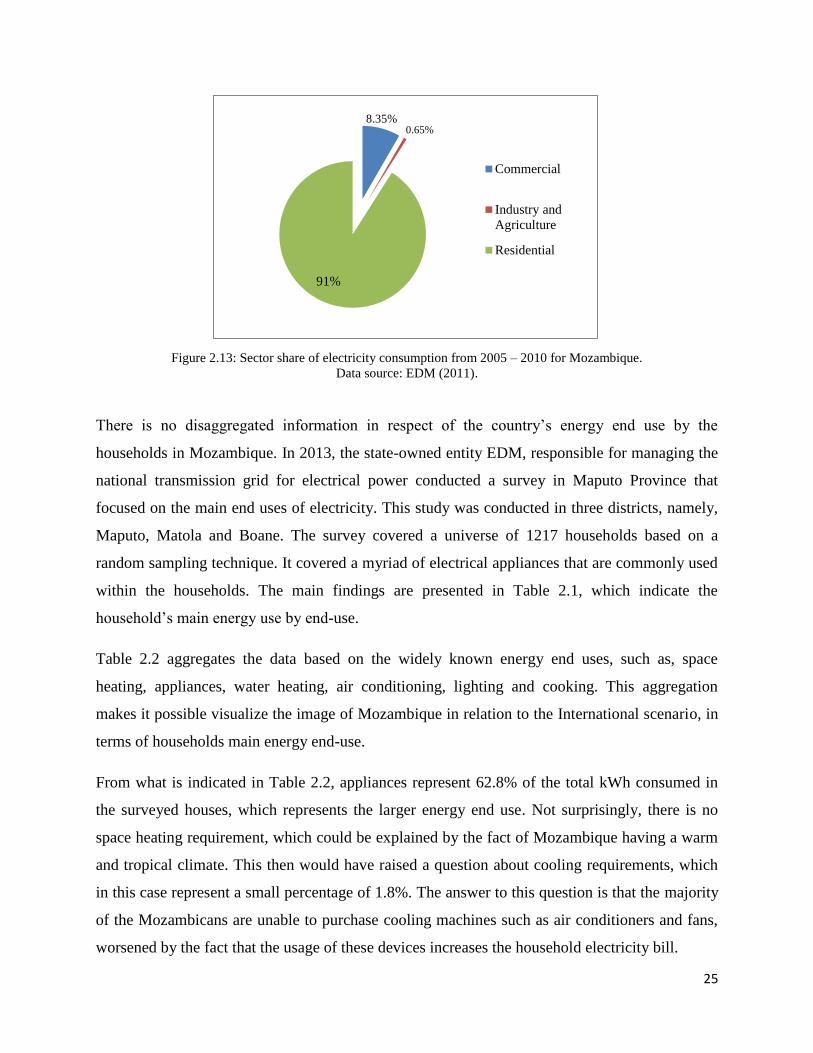
25
Figure 2.13: Sector share of electricity consumption from 2005 – 2010 for Mozambique.
Data source: EDM (2011).
There is no disaggregated information in respect of the country’s energy end use by the
households in Mozambique. In 2013, the state-owned entity EDM, responsible for managing the
national transmission grid for electrical power conducted a survey in Maputo Province that
focused on the main end uses of electricity. This study was conducted in three districts, namely,
Maputo, Matola and Boane. The survey covered a universe of 1217 households based on a
random sampling technique. It covered a myriad of electrical appliances that are commonly used
within the households. The main findings are presented in Table 2.1, which indicate the
household’s main energy use by end-use.
Table 2.2 aggregates the data based on the widely known energy end uses, such as, space
heating, appliances, water heating, air conditioning, lighting and cooking. This aggregation
makes it possible visualize the image of Mozambique in relation to the International scenario, in
terms of households main energy end-use.
From what is indicated in Table 2.2, appliances represent 62.8% of the total kWh consumed in
the surveyed houses, which represents the larger energy end use. Not surprisingly, there is no
space heating requirement, which could be explained by the fact of Mozambique having a warm
and tropical climate. This then would have raised a question about cooling requirements, which
in this case represent a small percentage of 1.8%. The answer to this question is that the majority
of the Mozambicans are unable to purchase cooling machines such as air conditioners and fans,
worsened by the fact that the usage of these devices increases the household electricity bill.
8.35% 0.65%
91%
Commercial
Industry and
Agriculture
Residential
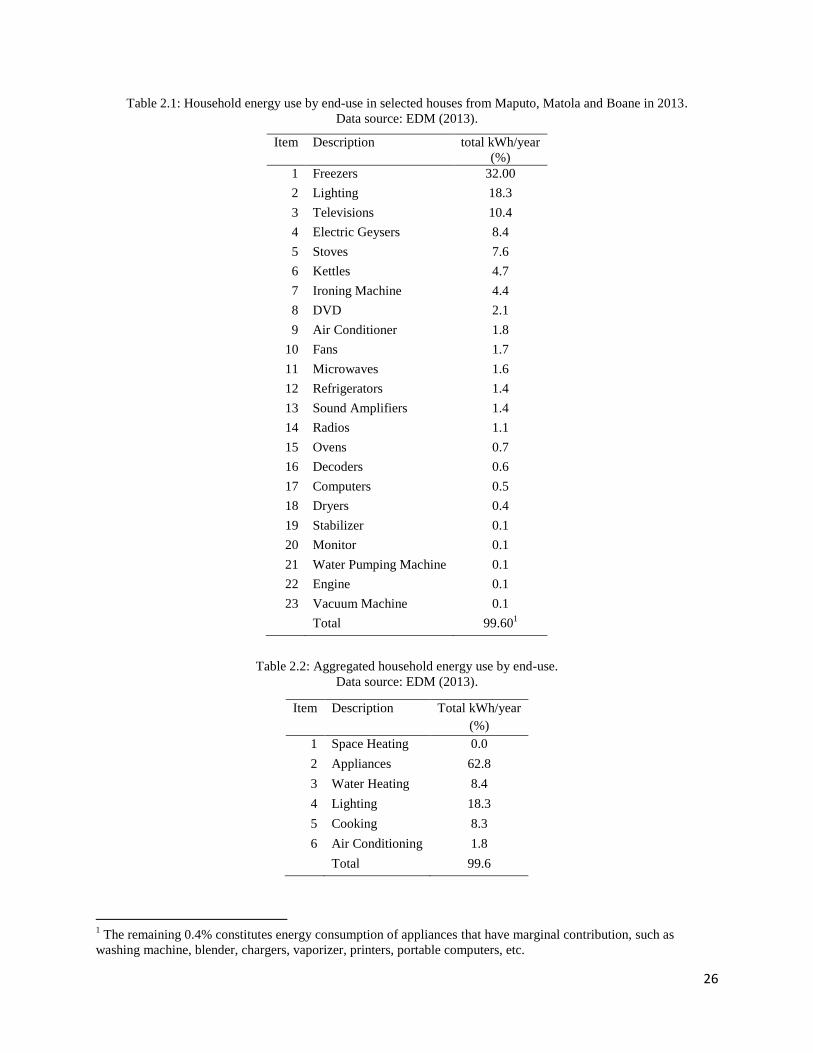
26
Table 2.1: Household energy use by end-use in selected houses from Maputo, Matola and Boane in 2013.
Data source: EDM (2013).
Item Description total kWh/year
(%)
1 Freezers 32.00
2 Lighting 18.3
3 Televisions 10.4
4 Electric Geysers 8.4
5 Stoves 7.6
6 Kettles 4.7
7 Ironing Machine 4.4
8 DVD 2.1
9 Air Conditioner 1.8
10 Fans 1.7
11 Microwaves 1.6
12 Refrigerators 1.4
13 Sound Amplifiers 1.4
14 Radios 1.1
15 Ovens 0.7
16 Decoders 0.6
17 Computers 0.5
18 Dryers 0.4
19 Stabilizer 0.1
20 Monitor 0.1
21 Water Pumping Machine 0.1
22 Engine 0.1
23 Vacuum Machine 0.1
Total 99.601
Table 2.2: Aggregated household energy use by end-use.
Data source: EDM (2013).
Item Description Total kWh/year
(%)
1 Space Heating 0.0
2 Appliances 62.8
3 Water Heating 8.4
4 Lighting 18.3
5 Cooking 8.3
6 Air Conditioning 1.8
Total 99.6
1 The remaining 0.4% constitutes energy consumption of appliances that have marginal contribution, such as
washing machine, blender, chargers, vaporizer, printers, portable computers, etc.

27
The table in reference indicates that there is a small amount of energy usage from the surveyed
households that is currently being used for cooling, and to a lesser extent this is applicable to
electric geysers for water heating. This is not because there is no need. Ideally, all households
should have cooling and heating devices installed in their houses. On the other hand, freezers
alone consume over 32% of the kWh per year; this value differs from findings of other countries,
such as South Africa, where electric geysers are the larger energy consumer. From the study
carried out by EDM, they consider freezers to run for 22hours per day, ignoring the runtime ratio
of the appliance (EDM, 2013).
The information presented in Table 2.2, bolds the great difference from what happens in many, if
not all, poor countries and developed countries. For example, space heating requirements in
developed countries is nearly 53% (See Figure 2.7), however, in Mozambique the requirements
is almost 0%. Moreover, when looking at appliances the differences is also dramatic, in
Mozambique, the household’s larger energy end-use is appliances, representing nearly 63% of
the total energy bill. On the other hand, in developed countries appliances represent only 21% of
the total energy consumed by the households.
It is important to note that, most households do not only depend on electricity to meet their
energy needs, a significant number of households in urban and peri-urban areas rely on other
energy sources such as Liquefied Petroleum Gas (LPG), charcoal, firewood and kerosene. These
alternative sources are used for cooking, water heating and other end uses. Moreover, some
families use electrical kettles for water heating, which in some cases is a substitute for electrical
geysers.
2.3.4. Economic performance of buildings in Mozambique
In Mozambique, little has been done to improve buildings energy performance. It also should be
noted that literature on this subject is scarce in Mozambique. However, there are some reported
works. For example, a study carried out by Wu (2012) that analyses data from 1997-2006 in 19
countries in Africa, including Mozambique, concluded that Mozambique is one of two countries
with unsatisfactory energy efficient rate during the period in reference, when elements such as,
energy consumption, electricity transmission and distribution losses were taken into
consideration.
28
The study carried out by Gabriel Auziane in 2010, is one of the first in the field of buildings
energy efficiency in Mozambique. The aim of the study was to evaluate buildings energy
performance in Maputo through modeling and simulations of energy use in buildings. To do that,
the study used technical instruments and methods such as Energy Barometer, which was used to
monitor climate data and DEROB-LTH Program (Dynamic Energy Response of Buildings –
Lunds Tekniska Högskola) used to estimate energy use, indoor thermal climate and visual
comfort in buildings. Furthermore, the building under which the study was performed is located
in the City of Maputo. It belongs to the Faculty of Engineering of the Eduardo Mondlane
University, and is called “3 de Fevereiro Building”.
The measurement instruments were installed in the houses from June to September 2009, to
monitor and evaluate the indoor and outdoor temperature and humidity, wind speed and
direction, global and diffuse solar radiation and rainfall. By assessing these elements, it was
possible to determine the building energy performance and its additional energy requirements for
HVAC to provide the households better indoor comfort. On the one hand, the study found that,
the building main façade is south oriented, which is in accordance with the principles of good
orientation, this principle is explained in detail further in this thesis, under the topic, strategies
for achieving energy efficiency in the built environment. On the other hand, despite this attempt,
the energy performance of the building in reference is very low, because energy in being used in
an inefficient manner.
2.4. Advantages of Energy Efficient Measures Implementation
The International Energy Agency (IEA) and the Intergovernmental Panel on Climate Change
(IPCC) have gathered important data regarding energy consumption trends and climate change,
respectively. The IEA (2013b) states that, the total final energy consumption has increased from
4 674Mtoe in 1973 to 8 918Mtoe in 2011 representing 52.4% of increase. Along with this, there
has also been an upward trend of GHG emissions into the atmosphere, according to IEA (2013b)
emissions in 2011 were twice from those verified in 1973. Furthermore, as indicated by the IPCC
(2007) observational evidence shows that there has been a dramatic increase of the global surface
temperature over the last two decades. This increase is being driven by the increase of the
anthropogenic GHG concentration in the atmosphere. Predictions from both IEA and IPCC
29
indicate that this trend will continue in future, and will be driven mostly by emerging economies
such as Brazil, China, India, South Africa and Middle East countries.
The building sector alone, accounts for 40% of the total end use of energy in most countries
across the world (IEA, 2013). Although the potential for energy efficiency improvements in
buildings has been neglected in many countries, there is great potential for improvements that
would contribute to the reduction of the building sector energy requirements provided that
energy efficient approaches are considered (Beccali et al., 2013; Lutz et al., 2006; Pérez-
Lombard et al, 2008; Ramesh et al., 2010; Tuominen et al., 2013). The decrease in final energy
consumption would potentially improve the climate system as well as the society wellbeing at
local and international levels. Moreover, the downward trend of final energy consumption in this
sector may also help reducing energy dependence in countries where part or all of the energy
consumed is imported.
Acknowledging this, the building sector has been indicated to be the heart of the 21st century’s
challenge by the IEA, and it argues that, by 2050 this sector may well contribute to the reduction
of around 1 509 Mtoe that the world consumes, consequently a significant amount of GHG
emissions could be reduced, since most countries rely on extremely polluting energy sources
(IEA, 2013a).
At a global level, the residential sector is responsible for over 23% of the total final energy
consumption (IEA 2013d). On the other hand, in Mozambique this sector is held responsible for
consuming over 70% of the total energy consumed within the country during the year 2011,
which clearly indicate the relevance of implementing energy efficient measures within the sector.
Lovins (2004) states that, the most important benefits that can result from implementing energy
efficient measures range from: avoiding direct economic and environmental costs as well as
improving energy security.
2.4.1. Improving Energy Security
According to EDM, currently Mozambique demands for around 750MW to meet its electricity
needs. However, the country can only obtain 500MW from Cahora Bassa Dam (HCB -
Hidroeléctica de Cahora Bassa), 150MW is purchased from South Africa and the remaining
50MW are supplied by three small scale hydropower plants, namely: Chicamba, Mavuzi, and

30
Temane (EDM, 2012a). It is important to note that HCB is the company that is responsible for
power generation in Mozambique and has an agreement to supply over 750MW to South Africa,
and currently the power plants are operating at full generation capacity (de Brito et al., 2008).
This situation is critical for Mozambique when looking at the energy security of the country. The
electricity that is purchased from South Africa is expensive for the Mozambique scenario where
electricity prices do not meet the costs incurred for generating, transmitting and distributing it to
the final users. Moreover, according to EDM (2012a) the country has now reached its demand
peak, which means in the absence of additional power production capacity the country may well
suffer from power shortage.
2.4.2. Curbing the Economic costs
Energy is a scarce commodity, and has significant costs to its users. These costs are usually
prohibitive in most low income economies, and they can either be financial or opportunity costs.
In case of poor countries, where a significant number of families are living under the poverty
line, energy affordability is of great concern to these families (Culillas et al., 2010). Therefore,
the reduction in energy demand, may contribute towards increasing energy availability,
consequently it could improve its affordability to low income households (UNDP, 2000).
From the macroeconomic point of view, the dependence on imported energy could be reduced
provided that the country gives privilege to the buildings that consumes less amount of energy
than what a conventional one would otherwise require and reduce the countries burden for
energy purchasing. The financial resources saved could be used to finance other pressing
developmental projects of the country (IEA, 2008). In Mozambique, for instance where the
Government has tremendous difficulties to finance primary need for the communities, such as
adequate education, housing and health care system the potential financial savings could be used
to address these issues.
Not only is the energy security a concern with respect to the need of implementing energy
efficiency measures but also is the need to contribute towards more sustainable economy. This
sustainability could be reached by promoting policies that can contribute toward improving the
climate systems as well as the environment (Lovins, 2004). Therefore, measures that could
influence people’s behavior towards energy consumption patterns and awareness of the
31
importance of energy efficiency could have positive impact in the national energy security, to the
environment as well as enhancing sustainable development.
2.4.3. Avoiding Social and Environment implications
Modernizing ways in which buildings are constructed, would moderate the energy end use in
these buildings, which have direct implication in the reduction of the GHG emission that pollutes
the environment. In developing countries, such as Mozambique, where the majority of the
population relies on traditional biomass to meet most of their energy needs, air pollution is
critical.
Biomass burning is responsible for causing severe respiratory ailments as well as environmental
problems, including but not limited to land degradation and deforestation (UNDP 2000). This
situation is worsened by the fact that the majority of the houses of the poor households are
usually poorly ventilated. On the other hand, efficient buildings are usually ventilated
adequately, which provides the residents with better indoor climate conditions and reduces their
cooling or heating needs. In comparison to conventional buildings, efficient building in this case
will lessen the energy bill to the owners, and reduces fuel poverty.
2.5. Current practices in building energy use and optimization
The extent to which citizens of different countries are aware about energy related issues depends
greatly on the development stage of the country they live in. People leaving in developed
countries are usually well informed about energy security, climate change, the exhaustion of
fossil fuels, global warming, and other energy related issues. So it is no secret that most of the
practice that involves reducing the quantity of energy that is required to deliver the same output
that would have been otherwise delivered with high energy quantity is not broadly adopted by
poor countries. Moreover, energy efficient measures are generally misunderstood and considered
to be costly.
Both, new and existing buildings present great potential for energy savings. The more energy
efficient practices and measures are implemented the greater are the possibilities for energy cost
reductions. Islam et al. (2014) and Mata et al. (2013) concluded that, the investments that are
made to reduce energy consumption of a particular building are usually recovered in short to
medium term, because of the consequent reduction in energy requirements for the building. In
32
developing countries where new buildings constitute the bulk of the existing buildings, the
potential savings at a national scale are even larger, because of their long lifespan (over 50
years), and the savings will occur throughout the building life time. These savings could be
equally profitable at a macro-economic scale, should a national policy be considered.
Energy efficiency policies have been broadly implemented by the bulk of developed countries.
These policies have been driven not only by the increase of energy price, but also to meet the
Kyoto protocol targets, which were binding to all of its signatories. Moreover, other countries
that were not signatories of the 1997 Kyoto Protocol, such as United States of America and
China, which consume a great deal of energy and are also responsible for emitting a larger
proportion of GHG, have adopted energy efficiency policies. Generally, their policies range
from:
2.5.1. Building energy codes
Building codes are a set of rules and standards that should be considered while erecting a
building. It has mostly to do with safety, public health, fire safety and ways of addressing energy
efficiency in buildings. This instrument has been widely adopted by many countries for many
years. However, since the begging of its implementations up until now, the building codes
evolved and turned more complex, yet with significant impact in the building energy
consumption. In order to rate buildings according to their energy performance, different rating
schemes have been implemented across the world. Rating building energy performance enables
tenants and buyers to compare performances between energy efficient buildings and those that
are not. The resulting data could influence buyers’ purchasing decision or owners to make their
investment decisions, either for repairmen or alterations of the building envelope.
Liu et al. (2014) conducted a study in China, which focused on a project developed in Wanke
city. Their study aim was to analyze energy performance of green buildings employing energy
efficient technologies. The main finding of the study was that energy efficient technology
applications results in high energy performance buildings, which brings not only economic
benefits, but also environmental benefits.
IPCC (2007) consider the building codes as one of the policy framework that police makers
should consider as an adaptation measure to minimize building energy consumption and curbing
33
climate change. Moreover, it also argues that the success of this and other measures depends
greatly on the government leadership, either in enforcing laws or by purchasing energy efficient
products.
A very significant number of governments throughout the world are implementing buildings
code schemes. In EU for example, building certification can be either mandatory, or voluntary.
Although other member states started decades ago implementing building code, a mandatory
scheme was first established in 2002 under the 2002/91/EC on Energy Performance of Building
Directive (EPBD), which binds its entire members to implement energy performance
certification and its main goal was to reduce building energy consumption. This directive was
followed by its revision in 2010, resulting in the Directive 2010/31/EU (Marszal et al., 2011).
Other mandatory building codes are also being implemented currently in Australia and Japan,
namely, ACTHERS and TGLSC respectively (Sayce et al., 2009). On the other hand, voluntary
schemes including but not limited to, ENERGY STAR, Leadership in Energy and Environmental
Designs (LEED), Green Point are currently being implemented in USA. However, LEED,
argues, Sayce et al. (2009), different from Energy Star, which focus mainly on the building
energy performance, is the main voluntary rating tool and targets various aspects related to the
building. Moreover, other voluntary tools such as Green Mark, Minergie, Building Research
Establishment Environmental Assessment Method (BREEAM) and Green Star, are also being
implemented in Singapore, Switzerland, United Kingdom and Australia, respectively.
2.5.2. Setting standards and labeling for appliances
Adopting more efficient lighting, by replacing incandescent lights by fluorescent light, has
reached a common agreement that reduces significant amount of energy that would have been
otherwise consumed by the former. Use of more efficient devices including but not limited to,
heating and cooling devices, efficient electrical appliances as well as improved cook stoves.
Appliances labeling is not a new concept, in fact, it is a widely known and implemented
technique in most developed countries, including but not limited to EU and USA. The Directive
79/530/EEC from the EU established in 1979 marks the first steps towards labeling household
appliances. Later on, the Directive 2010/31/EU is even more emphatic, in involving all
34
intervenient, from manufactures, retailers and buyers responsibilities. Furthermore, according to
Fuerst and McAllister (2011), in EU the use of eco-labels is mandatory in all EU members. In
USA, argues Gillingham et al. (2006) the use of appliances labeling was enforced in 1987 by the
National Appliance Energy Conservation Act (NAECA).
2.5.3. Providing financial incentives programs
Despite the fact that, the adoption of energy efficient measures resulting in the reduction of
energy bill, the upfront costs to adopt these measures are usually high and more likely to disperse
potential investors. These investments can be either for small appliances that are energy efficient
or even to buy or construct a building. Financial incentives can be in the form of government
subsides, taxes reliefs on certain goods that are energy efficient, loan programs or more directly,
by promoting programs that allows energy customers to have financial benefits from the
adoption of certain energy efficient technologies of behavior (Gillingham et al., 2006). For
example, if a particular country intends to replace incandescent light bulbs with fluorescent ones,
if the upfront cost is high for the customers, the Government could subsidize the costs and will
guarantee adoption of the technology. It is in this context that financial incentives programs are
critical for energy efficiency measures, if the desired outcomes are ever to prevail.
Another good example for the provision of financial incentives that is being successfully
implemented worldwide is the Demand-Side Management. The Demand-Side Management
(DSM) is a system whereby, the electrical utility uses different schemes to limit peak electricity
loads, by dispersing customer’s electricity use. This can be done by charging higher prices
during peak times and lower rates when there is less demand (Rankin and Rousseau, 2008). An
example of effective demand side management programs can be found in South Africa, a country
underwent an acute power shortage in 2008, as a result, in 2010, the country promulgated a
policy to support the energy efficiency and demand side management (DOE, 2010). This policy
enforced what was already being done by Eskom; the National State owned utility, since 2004.
However, the scope and targets of the Eskom program has since evolved and widen. Not only do
the program target households but it also have to do with the industrial sector.

35
2.5.4. Providing information and voluntary programs
Well informed people are more likely to make better energy related decisions. These decisions
could be for instance, adopting alternative energy sources that are cost effective, use of
appliances that are energy efficient or choosing energy efficient buildings over non energy
efficient ones.
In the absence of effective channels to disseminate information regarding available voluntary
programs relating to energy efficient practices, the program degree of success will be very
limited. In this perspective, providing accurate information about to all those mentioned actions
for energy efficiency practices, play a vital role in the attempt to turn the world more energy
efficient.
The provision of accurate information makes it possible to reduce problems related to market
failures, which is driven by environmental externalities and imperfect information. In fact, it
diminishes room for speculation, and makes it possible for all stakeholders to make their
decision based on reliable information. Moreover, as argued by Howarth et al. (2000) this
strategy is responsible for the success of the program developed to foster the deployment of
energy efficient technologies through voluntary programs in the United State of America.
2.5.5. Zero Energy Buildings
Zero energy building is still a relative new concept. Its assumption is that the building relies
mostly on renewable energy that is generated and distributed by a certain electricity utility to
meet the bulk of its energy requirements (Marszal et al., 2011). Despite its infancy stage, there
have been remarkable developments in placing policies for its future implementation worldwide.
The Directive 2010/31/EU on the EPBD foresees a “nearly zero energy building” by 2020 for all
new buildings. Additionally, in the USA a target of net zero for all new commercial buildings,
was established under the Energy Independence and Security Act of 2007 (EISA 2007) to be
attained by 2030. With zero energy building three potential dividends are likely to be
accomplished, namely, reduction of building energy demand, reduction of the relative CO2eq.
emissions, and increase of the renewable energy share globally.

36
2.6. Energy Efficiency Building Regulations
The Strategy of the energy sector in Mozambique was promulgated in 2009, and indicates the
efficient use of energy in its main principles (Ministério de Energia, 2010). However, up until
now there are no clear policies and regulations that are being implemented regarding energy
efficiency in Mozambique.
Although the CNELEC (Conselho Nacional de Energia – National Energy Council) the national
energy regulator, is among other responsibilities, allegedly in charge to develop or analyze
regulation proposals for the electricity supply industry that may be necessary and useful, as well
as promote the execution of relevant legislation for the electricity supply industry, there are
contributions of this council in terms of energy efficiency policies and practices promotion. In
addition to this, the Ministry of Energy has no clear policy that could enhance energy efficiency
practices in the country.
Regardless of these facts, EDM has endeavored to set an strategy that could guide the country to
be energy efficient aware by submitting proposals for energy efficient strategy, and a proposal
for banning incandescent light bulbs, which are yet to be approved by the Government (EDM,
2012a).
Within the Ministry of Energy there is the National Directorate of Electricity. This Directorate
has the function of promoting the efficient use of electricity. And yet, so far there is no clear
policy or regulation that indicates any intention of the government to implement the adoption of
energy efficient measures(Ministério de Energia, 2010).. This lack of government leadership is
resulting in the current situation verified in most households, where they are not aware of the
relevance of energy efficient measures (EDM, 2012a).
2.7. Strategies for Achieving Energy Efficiency in the Built Environment
Buildings participate actively in the consumption of energy through thermal exchange between
indoor and outdoor environment. In hot climates the thermal gains are larger and, together with
the internal gains of occupancy and equipment and lighting, it produces a thermal load that is
usually compensated by air conditioning systems. Therefore, the building envelope features can
increase or minimize heat absortion.

37
Designing a houses with relatively minimum energy requirement throughout its lifespan and still
provide a healthier, comfortable and aesthetic enviromnent for the homeownes is one of the
biggest challenges for house projectors and designers lattely. Despite the fact that, up until now,
energy efficient houses solutions are said to require relatively high initial investments when
compared to a typical house, many studies have proven that when looking at the long term,
efficient designs are the most cost effective solution, not only for the investors point of view, but
also at the enviromental impact prespective (Hasan, 1999; Hasan et al., 2008; Kneifel, 2010 and
Beccali et al., 2013).
Achieving the desired level of energy efficiency in any economy is a cross cutting issue that
depends upon the involvement of all sectors. In the case of the built environment, energy
efficiency achievements relies greatly on designing the right strategies according to the local
content, and have them widely known for its effective implementation. Discussion on necessary
course of action and policies that involves the government, private sector and individuals
participation have been reported by Clarke et al. (2008) and Dixon et al. (2010). Some of them
have also been discussed in this thesis under the topic: current practices in building energy use
and optimization. It is in this line, that the following paragraph discusses some strategies, that
can be implemented while projecting an energy efficient house.
2.7.1. Building orientation
The orientation of the building is one of the most important elements that influence greatly its
thermal performance (Pacheco et al., 2012 and Rodriguez-Ubinas et al., 20014b). A well
oriented building can save significant amount of energy needed for conditioning indoor
temperatures (Rodriguez-Ubinas et al., 2014a). The sun and wind are natural elements with
significant heat and cooling component, respectively. Therefore, building up a house taking into
consideration their movements is crucial while designing an efficient house.
A well oriented house is that, which allows the sun’s radiation to enter in the house during
winter, and expels it during summer. Moreover, it should also expose or protect the building
envelope from the wind (Rodriguez-Ubinas et al. 20014b). In hot and humid countries, ideally,
the buildings long façade should face opposite direction from that where the sun raises, to avoid
long exposure time to the solar radiation during the day. Meaning that, the building longer sides
38
should be oriented toward the north and south directions, with the shorter side toward the east
and west directions (Pacheco et al., 2012).
2.7.2. Insulation
Insulation is not a new concept in developed countries, where nearly all new and some existing
buildings were built taking into account this element. On the other hand, in developing countries
such as Mozambique, even though the concept is broadly known, its adoption is still in its
infancy, allegedly because of its high acquisition costs, and also because people are resistant to
change. Since it is a relatively new concept, people are usually afraid of trying, unless it is been
broadly deployed.
Considering that it is through the roof where most of the heat is gained and lost, them this part of
the house should be well thermally insulated. Additionally, floor and external walls can also be
thermal insulated (Pacheco et al., 2012). The combination of these measures can reduce
significantly the house’s energy demand for heating and cooling (Rodriguez-Ubinas et al.
20014b). Therefore, it is important to incorporate the element of insulation while designing
energy efficient houses.
2.7.3. Ventilation
The use of mechanical ventilation to control the thermal comfort and indoor atmosphere has been
increasing dramatically all across the world. However, due to its associated energy cost, lately,
measures to lessen its impact on the household’s energy bills have been increasing considerably.
Studies conducted by Kim and Park (2010) and Lee and Gao (2011) suggest natural ventilation
to reduce the households energy consumption. Moreover, Whang and Kim (2014) concur and
stipulate that indoor environment could be improved through a proper size and location of
windows and door of the building, taking into account wind speed and direction.
2.7.4. Landscaping
Proper house landscape makes it possible to elevate the quality of the indoor atmosphere during
all seasons. For example, planting trees not only gives the sense of fresh air, but can also
provide shade to the house, considering these trees are well positioned, especially planting
deciduous trees that shade the west side enables the house to have a cooling effect on hot

39
summer afternoons, and also enables solar radiation penetration during the winter (Akbari,
2002).
2.7.5. Use of heat absorbing materials
The materials that are used to build the house, which constitute the building envelope dictate the
complementary need for heat or cooling that the house will require to providing satisfactory
thermal comfort conditions for its tenants. Dense materials such as stone, concrete and brick
have high thermal mass, which is the ability to absorb and store heat. They heat up and cool
down very slowly, which means they take longer to heat up before beginning to cool down
(Rodriguez-Ubinas et al., 2014a).
According to Rodriguez-Ubinas et al. (2014a), provided that the house is well ventilated at
nights, a house built with high thermal material is preferable because it keeps the house cool
during summer, thus reducing the need of mechanical conditioning. However, it is important to
ensure that if these materials are used in external walls then a proper insulation that guarantees
separation between external from internal wall surfaces should be considered (Pacheco et al.,
2012).
When it comes to selecting the suitable colors for the house, they usually depend upon the
season. Ideally, during summer lighter colors should be used because they reflect the sun’s
radiation, while in winter dark colors are the most suitable since they will absorb solar heat,
therefore improving the heat storage of the house.
2.7.6. Window placement, sizing and shading
Windows are one of the house’s elements that affect the house energy consumption. They have
several functionalities, ranging from, trapping or collecting solar radiation, ventilate the house as
well as providing cross ventilation. Around 25% of the heat gained in a typical house is lost
through windows (DOE, 2000). The use of shades has great impact on controlling heat to
entering the house. However, most of the shading devices such as roller shades and overhangs, as
agued by Pacheco et al. (2012), are fixed and remain in the same position. Therefore, the best
shading device should be that, which responds to the household needs according to the season of
the year. The authors suggest the use of long projecting horizontal overhangs that can be adjusted
according to the need of households. Additionally, proper glazing should be considered while

40
designing an energy-efficient house. In hot humid climate, Pacheco et al. (2012) suggest a
double clear glazing.
2.7.7. Use of energy efficient appliances
Appliances contribute significantly to the amount of energy consumed by households during the
building lifetime. Therefore, using energy efficient appliances for heat, ventilation, air
conditioning, lighting, water heating and other appliances is crucial to reduce the total energy
consumed by the households.
The deployment of efficient appliances has been one of the top strategies to reduce energy
demand worldwide. Energy efficient appliances provide the same service with lesser energy
input, which explains why this policy has been proved to be efficient in countries where it is
being implemented. Due to its quick win characteristic, the replacement of incandescent light
with fluorescent ones has been one of the most implemented energy efficient policies regarding
the promotion of energy efficient appliances worldwide. According to Menanteau and Lafebvre
(2000), compact fluorescent lights not only use less energy with the same level of illumination,
but also last longer (from 5 to 10 times longer) when compared to incandescent lights.
41
Chapter 3: Methodology
This chapter discusses the methodology used to design the research, for the data collection and
data processing. First, it presents the research design and details of the methods used to meet the
research objectives. Then, a description of the data collection procedures and data processing
methodology is outlined. The following chapter reports the results from the survey and discusses
the main findings.
3.1. Research Design
This section describes the methods used to meet the objectives of this research. The research is
based on a descriptive study, whereby a household’s energy consumption pattern and its main
drivers are described. The research design type is comparative study of economic performance of
conventional and energy-efficient buildings, which was carried out in Maputo. Since the case
study area is relatively broad, a survey was conducted within given time and financial
constraints, which made it possible to structure a sample accordingly.
In order to achieve this, the investigation started by looking at the global status of energy and its
main related issues. It is pointed out that energy efficiency in building, principally in residential
buildings, is a way to overcome some of the energy related problems that are currently affecting
the world. The selection of energy efficiency was based on an extensive review of literature in
the available studies published by many academic journals that indicate this measure to be one of
the most cost-effective (Beccali et al., 2013; Marszal et al., 2011 and Wand et al., 2005).
An extensive literature review of energy efficient legislation that is being implemented in
different countries was carried out, in order to assess the available strategies that are there to
enhance energy efficiency within the residential sector. In addition, an investigation was carried
out to identify parameters and characteristics that distinguish a conventional building from an
energy efficient building. Then a questionnaire was designed to capture all relevant data to
answer questions including, but not limited to: the main energy end use within households in
Maputo, sources and cost of energy as well as type of the house.

42
3.2. Data Collection
3.2.1 Location
This research assesses the economic performance of conventional and energy efficient measures
in the residential buildings in Maputo city. The reason why Maputo was chosen is due to the fact
that so far the city has captured the bulk of investment in new buildings, either public or private,
also because the majority of civil construction companies are based in Maputo. In addition to
this, all ministries that participate in the energy and building sectors are located in Maputo,
which would facilitate data collection.
According to the municipality of Maputo City, there are seven (7) municipal districts, namely,
KaMpfumo, KaNhlamankulu, KaMaxakeni, KaMavota, KaMubukwana, KaTembe and KaNyaca.
There are different social groups living in these areas, however, for this research proposes two
different groups were considered, the high and middle income households. The reason for this
choice was because these two groups are considered by EDM (2013) to use many electrical
appliances due to their typical life standard in comparison to the low income households, which
according to Cuvilas et al., (2010) rely mostly on traditional energy carriers, which are not
compatible with electrical appliances. Therefore, this research focused on the municipality
district of KaMpumo, as, according to INE (2007) and CMM (2010), it bears most of the high
and middle income households, in relation of all other municipal districts that comprises the city
of Maputo.
According to the city planners, the municipality district of KaMpumo consists of 11
neighborhoods, namely, Central A, Central B, Central C, Alto Maé A, Alto Maé B,
Malhangalene A, Malhangalene B, PolanaCimento A, Polana Cimento B, Coop and
Sommerchield (CMM, 2010). The KaMpumo municipal district comprises 106,250 people,
representing 27,023 households.
3.2.2 Sampling
Due the time and financial constraints to cover all 27,023 households, the sample size was
determined according to the following formula (Calmorin and Calmorin, (2007), p.238).
[
]
[ ] (3.1)

43
Where:
N = Total number of population
n = number of households in each neighborhood
P = Larger possible proportion (0.5)
V = Standard value (2.58) of 1 percent level of probability with 99 percent reliability
Se = Sampling error (0.01)
Ss= Sample size
The sample size of Ss= 256 households, was calculated considering the universe of 27,023
households that are there in the KaMpumo municipality district, thus, this universe is not evenly
distributed in all neighborhood. Which means that each neighborhood have different population
size, therefore, in order to calculate the sample size for each neighborhood from the KaMpumo
municipality district, the total number of the population was dived by number of the households
in each neighborhood and then multiplied by the sample size. Moreover, the sampling design and
technique that this research will be considered is the random sampling. Table 3.1 indicates the
number of households that were subject of the questionnaire.
Table 3.1: Sample size.
Order Neighborhood Number of
households
Sample Size
1 Central A 2,548 24
2 Central B 2,862 27
3 Central C 2,158 20
4 Alto Maé A 2,053 19
5 Alto Maé B 2,959 28
6 Malhangalene A 1,725 16
7 Malhangalene B 4,051 38
8 Polana Cimento A 2,408 23
9 Polana Cimento B 2,370 22
10 Coop 1,417 13
11 Sommerchield 2,472 23
Total 11 27,023 253
To gather all the necessary data, this study utilized instruments such as desk-top surveys,
questionnaires and interviews. Questionnaires were used to gather information from the selected
households regarding their energy consumption levels, source of energy, types of appliances,
initial investment costs to build the house, maintenance costs, floor area of the house, number of

44
rooms among others. Detailed information is provided in the questionnaire in appendix.
Literature review was used to access other information that the questionnaire did not cover, such
as discount rate.
To gather information about energy efficient practices in the civil construction sector from
Mozambique four distinctive companies were interviewed, namely, companies A, B, C and D.
The results provided by the questionnaire combined with information provided by the city
planners and commercial banks made it possible to calculate the life cycle cost of r conventional
and energy efficient buildings.
3.3 Data processing
3.3.1 Economic assessment
The aim of this study was to assess the potential cost and benefits of implementing energy
efficient measures in residential buildings. Incorporating measures that are conducive to efficient
energy use in residential buildings requires investments in material and human resources. Early
studies carried out by Westphal and Lamberts (2005), Ramesh et al. (2010), Cabeza et al. (2013),
and Mata et al. (2013) point out different approaches that could be considered in buildings to
improve their efficiency in terms of energy consumption, and several models have been designed
in this regard. Thus, these studies main focus is on environmental issues rather than the cost
perspective.
In fact, most of the studies are based on the Life Cycle Assessment (LCA), and only a few
investigate the Life Cycle Cost Analysis (LCCA) perspective. Previous studies on LCCA that
focus on the minimization of life cycle cost of the building envelope design with the adoption of
energy efficient measures include the work reported by Arpke and Hutzler (2005), Fuller (2005)
and Lutz et al. (2006). This study considered some of the indicators used by these authors, such
as: (1) Payback period (2) cost of conserved energy and (2) Life Cycle Cost Analysis (LCCA).
However, it is important to note that the emphasis was on LCCA, because it captures the total
cost of the building over its lifetime.
This research mainly focused on the LCCA because it is a technique that enables the
determination of the total cost of owning and operating a facility over a specific period of time.
LCCA can be defined as the total discounted dollar cost of owning, operating, maintaining, and

45
disposing of a building system over its lifespan. With this indicator, the expectations are that a
real picture of the financial benefits that may result from owning an energy efficient building
could be verified.
The payback indicator would allow the calculation of the time frame that is needed to recover the
investment in efficient practices. This indicator enables users, investors and constructors to have
an overview of how much time an investment decision made today may need to be recovered
over the time that the building will be operating. The premise that was considered in this study is
that there are two alternatives to build a house: one is built in the conventional manner, which
means, it does not take into account energy efficient measures (the base case), and the other one
considers the most applicable and practicable energy efficient parameters (energy efficient
option).
If households are to be convinced to change their energy consumption patterns as well as make
better decisions while considering building a house in terms of the costs that each decision will
require throughout their life time, evaluation of the cost of energy efficiency is of the utmost
importance, as it provides to all the necessary information about operational costs. This indicator
enables the comparison between the costs that a conventional building is associated with those
that an energy efficient building would otherwise incur.
“The Life cycle cost of an item is the sum of all funds expended in support of the item from its
conception and fabrication through its operation to the end of its useful life” [White and Ostwald,
(1976), p.39]. Thus, it represents not only the acquisition cost, but also all subsequent costs
expected for operating and maintaining the building, as well as the residual value and any other
quantifiable benefits (Browns and Yanuck, 1985). LCC is an economic tool that makes it
possible the comparison between different alternative products or designs that provides similar
services to the user, its calculation process enables decision markers to select the best solution,
which presents the lower overall cost besed on existing information (Lutz et al., 2006).
3.3.2 Model for calculation of Life Cycle Cost
In this study, the models suggested by Fuller and Petersen (1996) combined with that from Lutz
et al. (2006) were used to calculate the LCC present value for annually recuring uniform
amounts and present value for annually recuring non-uniform amounts, respectively.

46
a) Present Value of Initial Investiment
The present value for the initial investment is equal to the amount of the initial investment, since
it is made at exactly the same time when the future costs are being discounted, and it is
comprised of the initial costs for building or buying and house and the acquisition of the
appliances
b) Present Value of Operanting Costs
i) For annual recurring uniform amounts
∑
*
+ (3.2)
ii) For annual recurring non-unifirm amounts
∑ (
)
(
) * (
)
+ (3.3)
Where:
PV= present value
Caoc= annual operating cost
e= escalation rate
d=is the discount rate
n= building life time
t=period of time that the costs will be occurring
To compute the PV for appliance replacement, annual operating cost (Caoc) in Eq.(3.3) was
replaced by the appliance replacement cost (Carc).
c) Present Value of Maintenance Costs
∑ (
)
(
) * (
)
+ (3.4)
Where:
47
Camc= annual maintenance cost
e= escalation rate
d= discount rate
n= building life time
t= period of time that the costs will be occurring
d) Present value of the Residual Value
(3.5)
Where:
Crv=residual value
d=discount rate
n=building life time
Sharma et al. (2011) and Beccali et al. (2013) indicate that, it is during the operating phase when
a residential building consumes the bulk of energy that the building requires throughout its life
time, ranging from 70-90%. Furthermore, the demolishment stage does not go beyond the figure
of 2%, and the remaining is consumed during the building erecting phase. It is in this perspective
that this research main focus was only on the operational stage, and construction phase.
However, during the construction phase, the study focused mainly on the initial investment costs,
which have the energy costs already embodied. Input data to the model is provided in Appendix
D.
3.3.3 Statistical analysis
A descriptive statistical technique was used to analyze the collected data on the households’
energy consumption patterns, main type of appliances being used as well as the building main
features. There is lack of green and energy efficient building, in Mozambique, most of the
building either existing or new, follow the construction idea that the country inherited from
Portugal, which is the country that colonized Mozambique, based on the idea of lasting for long,

48
which includes basically a strong structure made of cement and stone. This means that locally,
there is no benchmark case, which could be used to compare its performance to those that are not
energy efficient.
Therefore, in order to overcome this barrier, hypothetical prototypes that incorporate relevant
energy efficient indicators, were designed using ARCHICAD software, and information
concerned with energy consumption was provided by electro-technicians from EDM. These
designs were compared to the base case scenario, which was obtained from the results of the
questionnaire. The base case scenario was drawn by calculating the average size, sources of
energy, and energy consumption of the surveyed houses.
In order to analyze the potential outcomes from different energy efficiency alternatives a
sensitivity analysis was performed and its main focus was on three key components, namely:
i) Changes in the building envelope;
ii) Use of energy efficient appliances;
iii) Changes in the building envelope and energy efficient appliances.
To evaluate the cost/benefits of each of the hypothetical cases, tools, such as, LCCA and cost of
conserved energy were used. Its results were compared to those of the base case scenario.
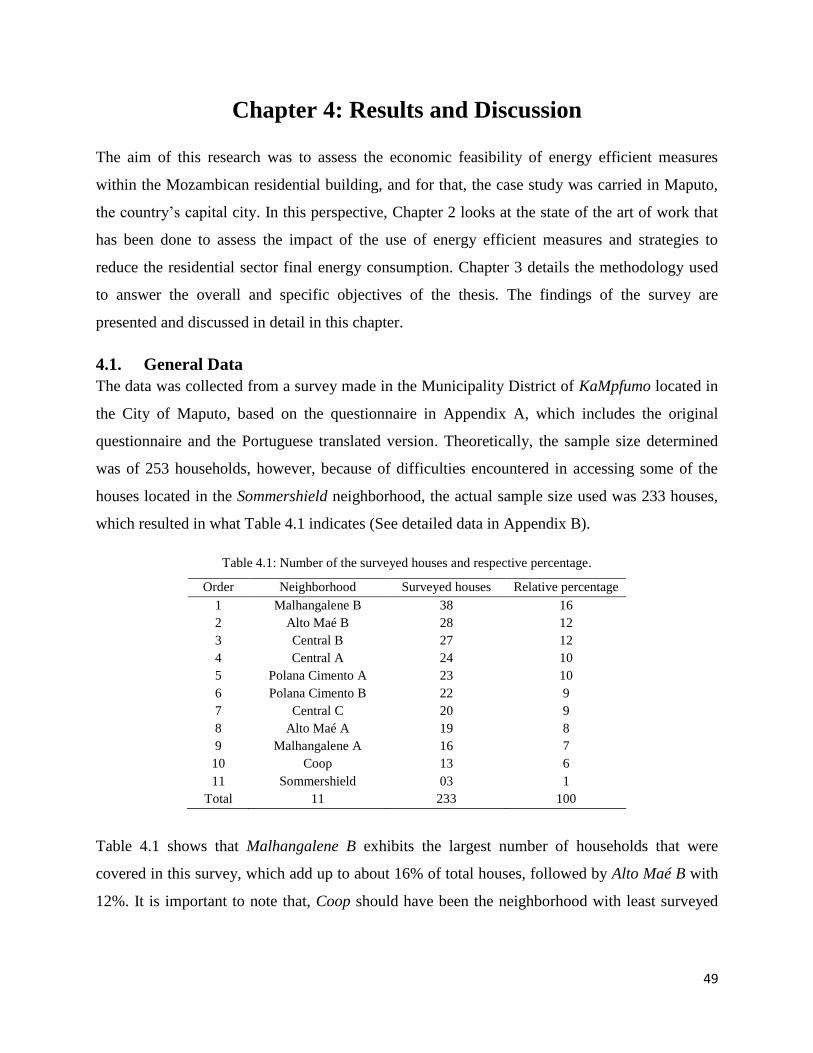
49
Chapter 4: Results and Discussion
The aim of this research was to assess the economic feasibility of energy efficient measures
within the Mozambican residential building, and for that, the case study was carried in Maputo,
the country’s capital city. In this perspective, Chapter 2 looks at the state of the art of work that
has been done to assess the impact of the use of energy efficient measures and strategies to
reduce the residential sector final energy consumption. Chapter 3 details the methodology used
to answer the overall and specific objectives of the thesis. The findings of the survey are
presented and discussed in detail in this chapter.
4.1. General Data
The data was collected from a survey made in the Municipality District of KaMpfumo located in
the City of Maputo, based on the questionnaire in Appendix A, which includes the original
questionnaire and the Portuguese translated version. Theoretically, the sample size determined
was of 253 households, however, because of difficulties encountered in accessing some of the
houses located in the Sommershield neighborhood, the actual sample size used was 233 houses,
which resulted in what Table 4.1 indicates (See detailed data in Appendix B).
Table 4.1: Number of the surveyed houses and respective percentage.
Order Neighborhood Surveyed houses Relative percentage
1 Malhangalene B 38 16
2 Alto Maé B 28 12
3 Central B 27 12
4 Central A 24 10
5 Polana Cimento A 23 10
6 Polana Cimento B 22 9
7 Central C 20 9
8 Alto Maé A 19 8
9 Malhangalene A 16 7
10 Coop 13 6
11 Sommershield 03 1
Total 11 233 100
Table 4.1 shows that Malhangalene B exhibits the largest number of households that were
covered in this survey, which add up to about 16% of total houses, followed by Alto Maé B with
12%. It is important to note that, Coop should have been the neighborhood with least surveyed
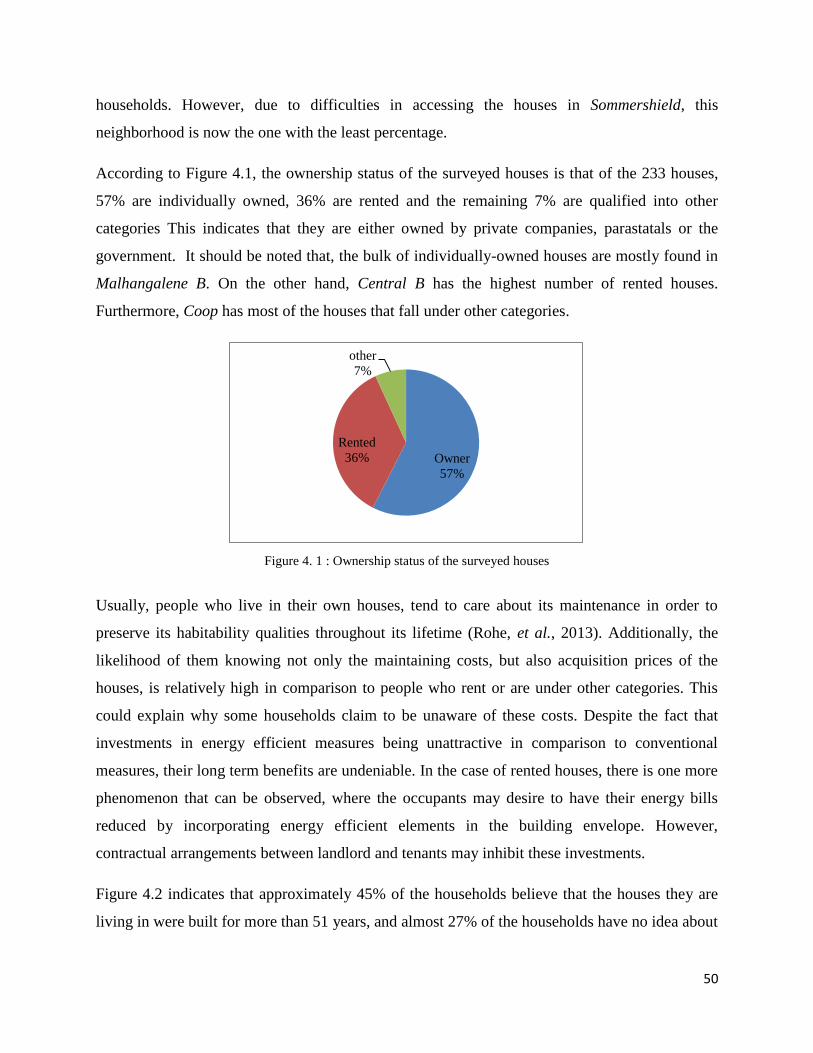
50
households. However, due to difficulties in accessing the houses in Sommershield, this
neighborhood is now the one with the least percentage.
According to Figure 4.1, the ownership status of the surveyed houses is that of the 233 houses,
57% are individually owned, 36% are rented and the remaining 7% are qualified into other
categories This indicates that they are either owned by private companies, parastatals or the
government. It should be noted that, the bulk of individually-owned houses are mostly found in
Malhangalene B. On the other hand, Central B has the highest number of rented houses.
Furthermore, Coop has most of the houses that fall under other categories.
Figure 4. 1 : Ownership status of the surveyed houses
Usually, people who live in their own houses, tend to care about its maintenance in order to
preserve its habitability qualities throughout its lifetime (Rohe, et al., 2013). Additionally, the
likelihood of them knowing not only the maintaining costs, but also acquisition prices of the
houses, is relatively high in comparison to people who rent or are under other categories. This
could explain why some households claim to be unaware of these costs. Despite the fact that
investments in energy efficient measures being unattractive in comparison to conventional
measures, their long term benefits are undeniable. In the case of rented houses, there is one more
phenomenon that can be observed, where the occupants may desire to have their energy bills
reduced by incorporating energy efficient elements in the building envelope. However,
contractual arrangements between landlord and tenants may inhibit these investments.
Figure 4.2 indicates that approximately 45% of the households believe that the houses they are
living in were built for more than 51 years, and almost 27% of the households have no idea about
Owner
57%
Rented
36%
other
7%
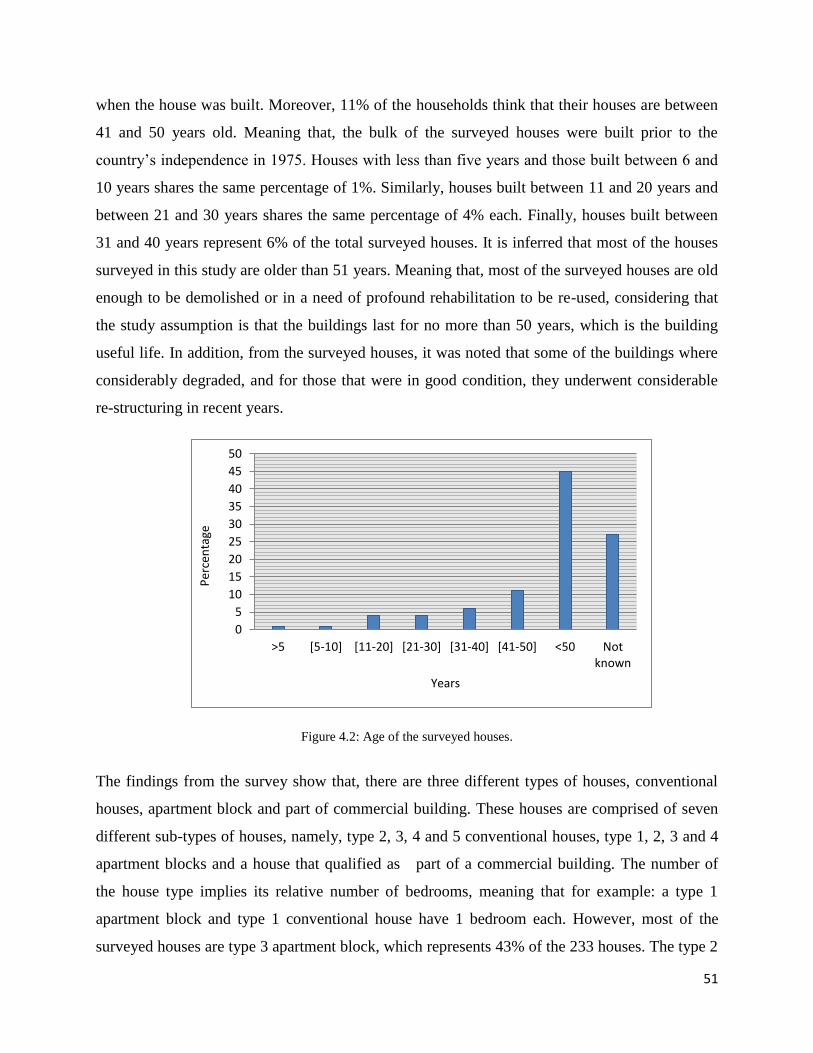
51
when the house was built. Moreover, 11% of the households think that their houses are between
41 and 50 years old. Meaning that, the bulk of the surveyed houses were built prior to the
country’s independence in 1975. Houses with less than five years and those built between 6 and
10 years shares the same percentage of 1%. Similarly, houses built between 11 and 20 years and
between 21 and 30 years shares the same percentage of 4% each. Finally, houses built between
31 and 40 years represent 6% of the total surveyed houses. It is inferred that most of the houses
surveyed in this study are older than 51 years. Meaning that, most of the surveyed houses are old
enough to be demolished or in a need of profound rehabilitation to be re-used, considering that
the study assumption is that the buildings last for no more than 50 years, which is the building
useful life. In addition, from the surveyed houses, it was noted that some of the buildings where
considerably degraded, and for those that were in good condition, they underwent considerable
re-structuring in recent years.
Figure 4.2: Age of the surveyed houses.
The findings from the survey show that, there are three different types of houses, conventional
houses, apartment block and part of commercial building. These houses are comprised of seven
different sub-types of houses, namely, type 2, 3, 4 and 5 conventional houses, type 1, 2, 3 and 4
apartment blocks and a house that qualified as part of a commercial building. The number of
the house type implies its relative number of bedrooms, meaning that for example: a type 1
apartment block and type 1 conventional house have 1 bedroom each. However, most of the
surveyed houses are type 3 apartment block, which represents 43% of the 233 houses. The type 2
0
5
10
15
20
25
30
35
40
45
50
>5 [5-10] [11-20] [21-30] [31-40] [41-50] <50 Notknown
Per
cen
tage
Years

52
apartment blocks constitutes 26% followed by type 3 and 2 conventional houses with
percentages of 12% and 7%, respectively. The other house type has minor representation, for
instance, apartment block and conventional houses of type 4 have a percentage of 5% and 3%,
respectively. The same was found for the type 1 apartment block with a percentage of 2%. There
was only 1 house for both, type 5 conventional houses and part of a commercial a building that
resulted in 0% of the relative percentage.
The reason why there is a plethora of apartment blocks is because the survey was conducted in
the city of Maputo, where there are many high rising buildings and a few conventional houses.
This is similar to many Capital cities across the world where the preferable house types are high
rising buildings (Gottmann, 1966). It is crucial to note that, this data was used to design energy
efficient houses, meaning that the type 2 and 3 houses were the two samples that were
considered while developing the energy efficiency design. The proposed energy efficient designs
were types 2 and 3 conventional houses with single floor.
The findings from the survey indicate that 46% of the targeted houses follow an East-West
orientation according the long axis of the building. This does not correlate with what the
principles of good orientation stipulates (DOE, 2000). For instance, in hot humid climate that
characterizes Mozambique, North-South orientation, in relation to building long axis, is the one
that when combined to other energy efficiency features would contribute in reducing or even
eliminate auxiliary cooling or heating requirements, thus reducing energy expenditures of the
households. Additionally, good orientation can also help improve indoor comfort levels for the
households (DOE, 2000).
From the interview with architects from company A, they also claimed that it is important to
avoid direct sun radiation, and this can be accomplished not only with good orientation but also
by using trees and adjoining buildings to shade the exposed facades of the houses. Moreover,
they also said that new technologies allow the use of architectural elements for solar protection,
such as vertical and horizontal flaps as well as adjacent windows that allows the air to flow
inside the house.
The householders when asked about the current cost of the house, only 42% knows about the
actual cost of the houses they are living in, and 58% of the households do not know. The same
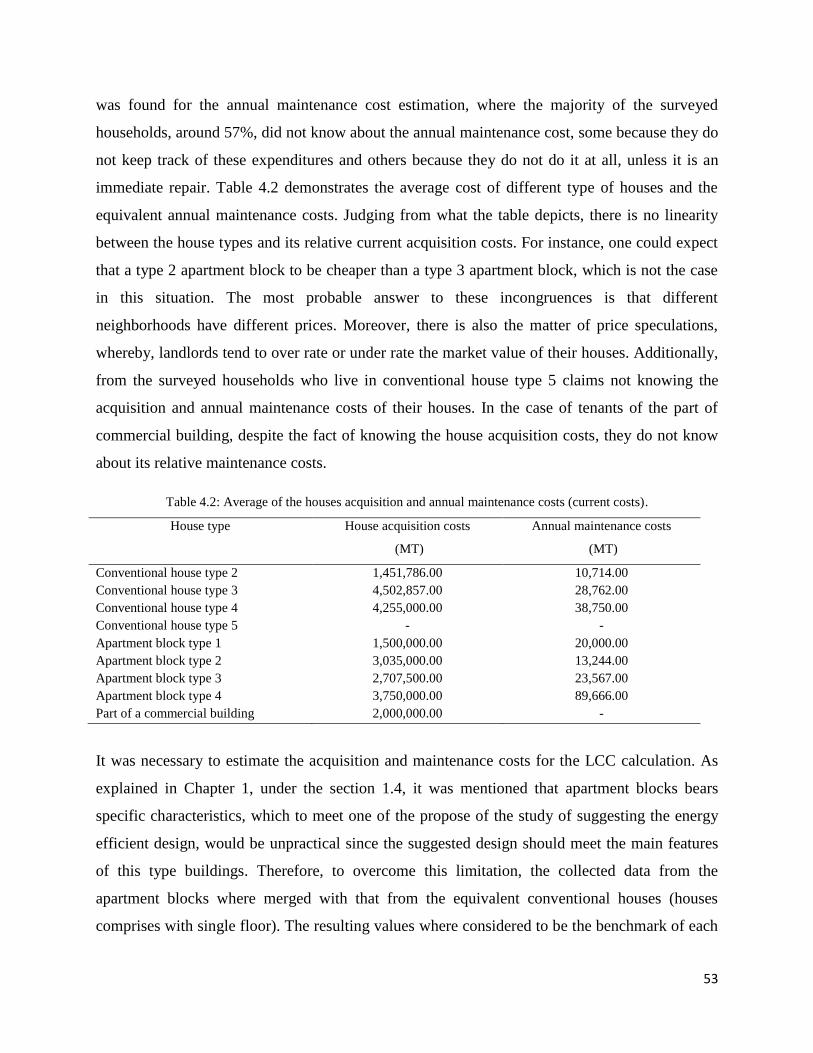
53
was found for the annual maintenance cost estimation, where the majority of the surveyed
households, around 57%, did not know about the annual maintenance cost, some because they do
not keep track of these expenditures and others because they do not do it at all, unless it is an
immediate repair. Table 4.2 demonstrates the average cost of different type of houses and the
equivalent annual maintenance costs. Judging from what the table depicts, there is no linearity
between the house types and its relative current acquisition costs. For instance, one could expect
that a type 2 apartment block to be cheaper than a type 3 apartment block, which is not the case
in this situation. The most probable answer to these incongruences is that different
neighborhoods have different prices. Moreover, there is also the matter of price speculations,
whereby, landlords tend to over rate or under rate the market value of their houses. Additionally,
from the surveyed households who live in conventional house type 5 claims not knowing the
acquisition and annual maintenance costs of their houses. In the case of tenants of the part of
commercial building, despite the fact of knowing the house acquisition costs, they do not know
about its relative maintenance costs.
Table 4.2: Average of the houses acquisition and annual maintenance costs (current costs).
House type House acquisition costs
(MT)
Annual maintenance costs
(MT)
Conventional house type 2 1,451,786.00 10,714.00
Conventional house type 3 4,502,857.00 28,762.00
Conventional house type 4 4,255,000.00 38,750.00
Conventional house type 5 - -
Apartment block type 1 1,500,000.00 20,000.00
Apartment block type 2 3,035,000.00 13,244.00
Apartment block type 3 2,707,500.00 23,567.00
Apartment block type 4 3,750,000.00 89,666.00
Part of a commercial building 2,000,000.00 -
It was necessary to estimate the acquisition and maintenance costs for the LCC calculation. As
explained in Chapter 1, under the section 1.4, it was mentioned that apartment blocks bears
specific characteristics, which to meet one of the propose of the study of suggesting the energy
efficient design, would be unpractical since the suggested design should meet the main features
of this type buildings. Therefore, to overcome this limitation, the collected data from the
apartment blocks where merged with that from the equivalent conventional houses (houses
comprises with single floor). The resulting values where considered to be the benchmark of each
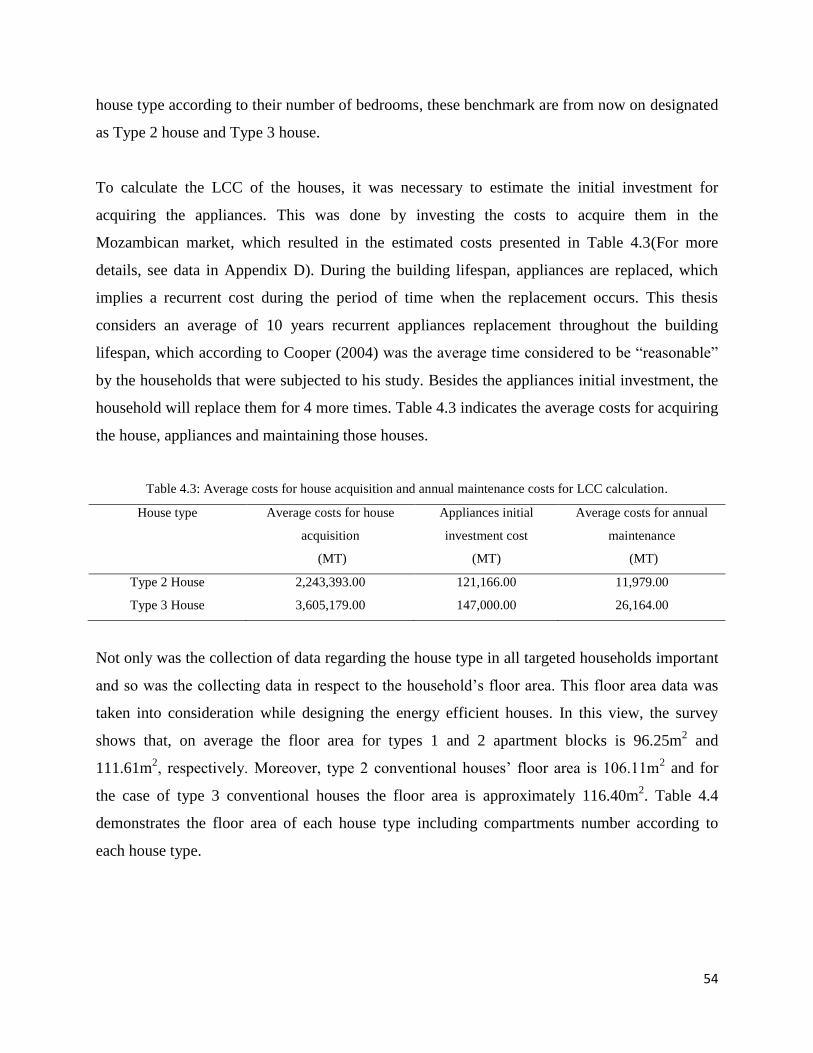
54
house type according to their number of bedrooms, these benchmark are from now on designated
as Type 2 house and Type 3 house.
To calculate the LCC of the houses, it was necessary to estimate the initial investment for
acquiring the appliances. This was done by investing the costs to acquire them in the
Mozambican market, which resulted in the estimated costs presented in Table 4.3(For more
details, see data in Appendix D). During the building lifespan, appliances are replaced, which
implies a recurrent cost during the period of time when the replacement occurs. This thesis
considers an average of 10 years recurrent appliances replacement throughout the building
lifespan, which according to Cooper (2004) was the average time considered to be “reasonable”
by the households that were subjected to his study. Besides the appliances initial investment, the
household will replace them for 4 more times. Table 4.3 indicates the average costs for acquiring
the house, appliances and maintaining those houses.
Table 4.3: Average costs for house acquisition and annual maintenance costs for LCC calculation.
House type Average costs for house
acquisition
(MT)
Appliances initial
investment cost
(MT)
Average costs for annual
maintenance
(MT)
Type 2 House 2,243,393.00 121,166.00 11,979.00
Type 3 House 3,605,179.00 147,000.00 26,164.00
Not only was the collection of data regarding the house type in all targeted households important
and so was the collecting data in respect to the household’s floor area. This floor area data was
taken into consideration while designing the energy efficient houses. In this view, the survey
shows that, on average the floor area for types 1 and 2 apartment blocks is 96.25m2 and
111.61m2, respectively. Moreover, type 2 conventional houses’ floor area is 106.11m
2 and for
the case of type 3 conventional houses the floor area is approximately 116.40m2. Table 4.4
demonstrates the floor area of each house type including compartments number according to
each house type.
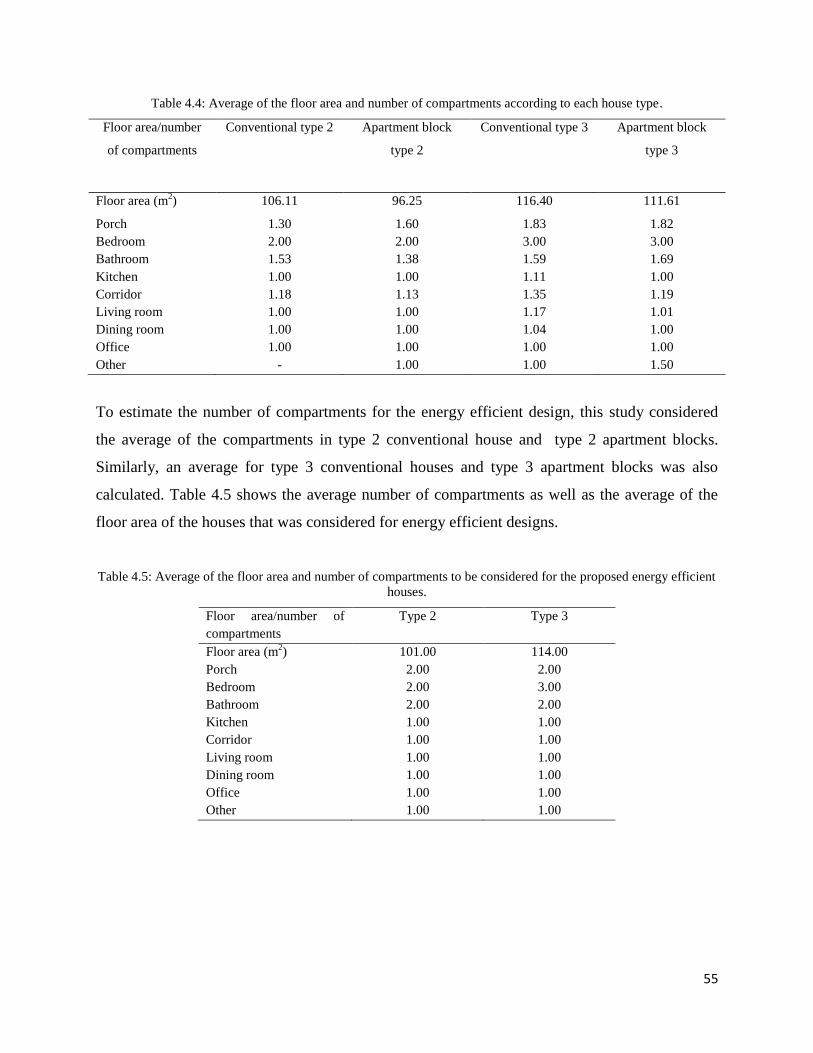
55
Table 4.4: Average of the floor area and number of compartments according to each house type.
Floor area/number
of compartments
Conventional type 2 Apartment block
type 2
Conventional type 3 Apartment block
type 3
Floor area (m2) 106.11 96.25 116.40 111.61
Porch 1.30 1.60 1.83 1.82
Bedroom 2.00 2.00 3.00 3.00
Bathroom 1.53 1.38 1.59 1.69
Kitchen 1.00 1.00 1.11 1.00
Corridor 1.18 1.13 1.35 1.19
Living room 1.00 1.00 1.17 1.01
Dining room 1.00 1.00 1.04 1.00
Office 1.00 1.00 1.00 1.00
Other - 1.00 1.00 1.50
To estimate the number of compartments for the energy efficient design, this study considered
the average of the compartments in type 2 conventional house and type 2 apartment blocks.
Similarly, an average for type 3 conventional houses and type 3 apartment blocks was also
calculated. Table 4.5 shows the average number of compartments as well as the average of the
floor area of the houses that was considered for energy efficient designs.
Table 4.5: Average of the floor area and number of compartments to be considered for the proposed energy efficient
houses.
Floor area/number of
compartments
Type 2 Type 3
Floor area (m2) 101.00 114.00
Porch 2.00 2.00
Bedroom 2.00 3.00
Bathroom 2.00 2.00
Kitchen 1.00 1.00
Corridor 1.00 1.00
Living room 1.00 1.00
Dining room 1.00 1.00
Office 1.00 1.00
Other 1.00 1.00
56
4.2. Energy Consumption Data
During the process of data collection, questions to access household energy consumption
patterns, such as sources of energy, type of existing appliances as well as the energy bill of the
households were asked. With the given answers it was possible to identify the sources of energy
of the households, the amount of money spent monthly, and the annual average expenditure.
Surprisingly, nearly all households claim to consume almost the same quantity of energy
monthly regardless of the season.
With respect to the sources of energy, it was possible to determine that 100% of the targeted
households use electricity to meet their energy needs, and almost 91% of them complement their
energy need with LPG, which is used mostly for cooking and water heating. Furthermore,
charcoal is also being used by nearly 52% of the surveyed families.
Malhangalene B, from all 11 neighborhood surveyed, is where almost all households
supplements electricity with LPG and charcoal. On the other hand, none of the households in
Central C uses charcoal as part of their energy source. This can be justified by the fact that this
area is inhabited by high income households, who usually use cleaner energy sources to meet
their requirements. Moreover, it was also possible to note that none of the surveyed households
uses other sources of energy such as Diesel oil-generator, coal, paraffin and firewood. Only one,
out of the 233 households, owns an installed solar panel, which is only used when there is no
electricity supply (See data in Appendix B).
On average, all households have at least one of the following appliances: freezers, television,
kettle, ironing machine, DVD, microwave, refrigerator, fans, stoves and computer. It is worth
noticing that, although computers did not appear in the questionnaire, it was one of the
appliances that appeared the most as other appliances owned by the households. Its exclusion
was due to its minor contribution reported in the survey made by EDM (2012a). Despite being
rare, some households indicated to own toasters, vacuum machine, electric shower, washing
machine, water pumping machines and sewing machines. Moreover, only a couple of the
surveyed households own sound amplifiers and radios.
While appliances such as, electric geysers and air conditioning are rare, mostly because the
households cannot afford them, some are not capable to cope with the required maintenance

57
routine as well as its allegedly high energy consumption, electric space heaters are also rare, but
the reason is different, in their case they are considered to be superfluous due to the local weather
conditions.
When looking at the number of lights, generally the number of compartments dictates the
household real need. It was also noticed that the majority of the households mixes the types of
lights, not only do they use compact fluorescent but also incandescent lights, which is an
indication of shifting to more efficient lights (fluorescent lights). To estimate the number of
appliances tk8hat each house should have, the average of existing appliances of a type 2
conventional houses and type 2 apartment blocks was calculated, and the same was done for the
type 3 conventional houses and type 3 apartment blocks. Table 4.6 illustrates the number of
appliance for the energy efficient house according to the type of house.
Table 4.6: Average number of appliance for the energy efficient house according to the type of house.
Type of
appliances
Number of appliances
A1* A2* A3* A4* A5* A6*
Freezers 1.05 1.11 1.00 1.25 1.08 1.00
CFL 6.62 7.81 11 8.73 8.03 12
Incandescent 3.83 4.98 0 6.97 5.48 0
Televisions 1.94 1.90 2.00 2.63 2.40 3.00
Electric Geysers 1.00 1.03 1.00 1.48 1.13 1.00
Stoves 1.14 1.14 1.00 1.25 1.07 1.00
Kettles 1.08 1.04 1.00 1.21 1.06 1.00
Ironing
Machine
1.30 1.13 1.00 1.28 1.18 1.00
DVD 1.22 1.08 1.00 1.57 1.16 1.00
Air conditioning 1.00 1.53 1.00 2.13 1.93 2.00
Fans 1.50 1.82 2.00 1.84 1.78 2.00
Microwave 1.00 1.01 1.00 1.17 1.01 1.00
Refrigerator 1.00 1.05 1.00 1.17 1.05 1.00
Sound
amplifiers
1.00 1.00 1.00 1.07 1.53 1.00
Radios 1.06 1.08 1.00 1.21 1.01 1.00
Space heaters 1.00 1.00 1.00 1.00 1.00 1.00
Other
appliances
Computers 1.16 1.03 1.00 1.44 1.22 1.00
Toasters 1.33 1.47 1.00 1.29 1.05 1.00
*Note: A1=Conventional type 2, A2=Apartment block type 2, A3=Average for the efficient design –type 2 house, A4=Conventional type 3,
A5=Apartment block type 3, A6=Average for the efficient design –type 3 house.
58
The degree to which certain appliances consume energy depends greatly on the power capacity,
usually measured in watts (W). It was from this point of view that accessing the power capacity
of the appliances used by the household was important; not only to determine if they could be
qualified as efficient or inefficient but also to determine which appliances contribute the most for
the monthly energy expenditure of the families.
The survey indicates that on average, the appliances are relatively young, approximately 4 years
old, except for freezers and refrigerators, which are nearly 6 and 6.5 years old, respectively.
These two appliances are the ones that remain operational for long hours, almost 24 hours a day
(See data in Appendix B). Furthermore, households that own electric geysers and air
conditioners, tend to keep them operational for over thirteen and eight hours a day, respectively.
Due to their relatively high power capacity, these appliances contribute significantly to the
household’s energy burden. In case of television, and compact fluorescent lights, which are
owned by almost all targeted families, the average time that these appliances are kept operational
is of approximately nine hours a day. Contrary to electric geysers and air conditioners, these
appliances do not have high impact on the total energy demand, due to their relatively low power
capacity.
Stoves are by far, the appliance that has high power capacity, with an average of 2,774.50W,
followed by air conditioners, with an average of approximately 2,000.00W. Freezers and
refrigerators average of power capacity range from 405.09W and 828.02W, respectively. It is
important to note that despite some appliances having high power capacity, their levels of energy
consumption will vary according to the time that the appliance remains operational. For instance,
a comparison was made between stoves and air conditioners, the conclusion indicated that for
those houses that have these appliances, air conditioners are the ones that contribute the most for
the household energy bill regardless of its relatively low power capacity, this can be explained by
the fact that this appliance usually remains operational for long hours than stoves.
Table 4.7 indicates the average power capacity of the existing appliances in selected types of
houses, which will be used as the base to design the energy efficient house. From what the table
depicts, it is possible to determine that there is no correlation between the size of house and the
appliances power capacity, this could be because the houses are quite similar except for the
number of rooms.
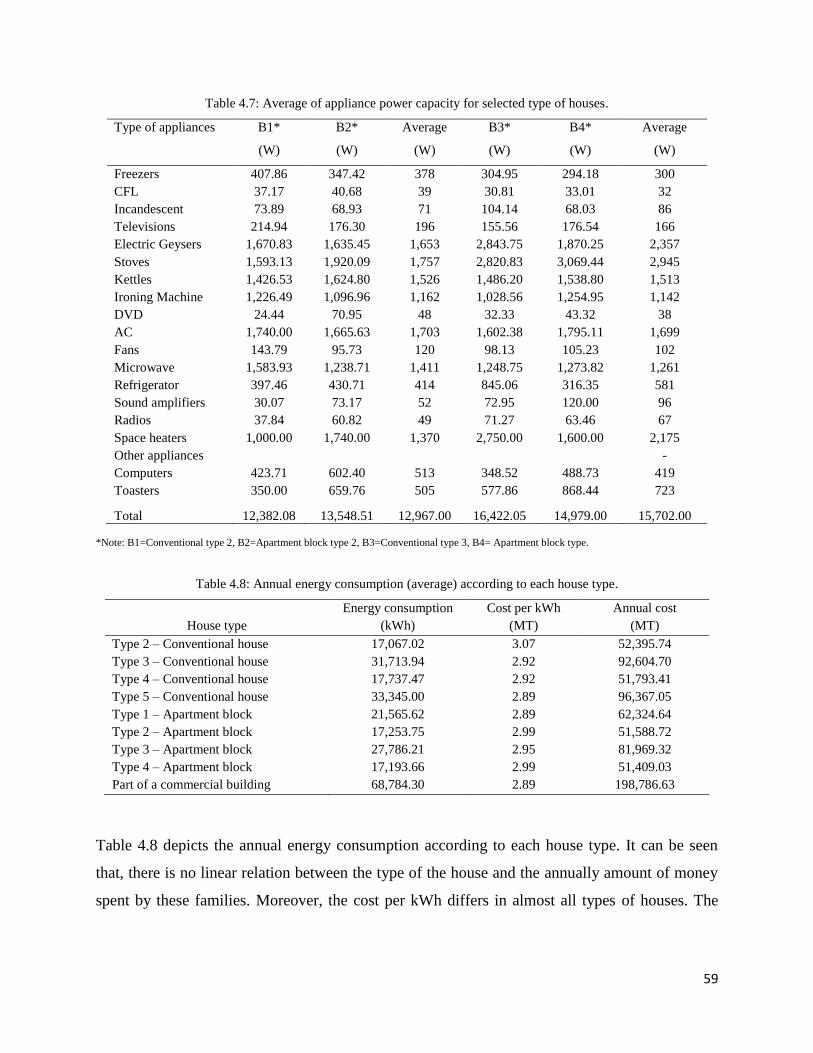
59
Table 4.7: Average of appliance power capacity for selected type of houses.
Type of appliances B1*
(W)
B2*
(W)
Average
(W)
B3*
(W)
B4*
(W)
Average
(W)
Freezers 407.86 347.42 378 304.95 294.18 300
CFL 37.17 40.68 39 30.81 33.01 32
Incandescent 73.89 68.93 71 104.14 68.03 86
Televisions 214.94 176.30 196 155.56 176.54 166
Electric Geysers 1,670.83 1,635.45 1,653 2,843.75 1,870.25 2,357
Stoves 1,593.13 1,920.09 1,757 2,820.83 3,069.44 2,945
Kettles 1,426.53 1,624.80 1,526 1,486.20 1,538.80 1,513
Ironing Machine 1,226.49 1,096.96 1,162 1,028.56 1,254.95 1,142
DVD 24.44 70.95 48 32.33 43.32 38
AC 1,740.00 1,665.63 1,703 1,602.38 1,795.11 1,699
Fans 143.79 95.73 120 98.13 105.23 102
Microwave 1,583.93 1,238.71 1,411 1,248.75 1,273.82 1,261
Refrigerator 397.46 430.71 414 845.06 316.35 581
Sound amplifiers 30.07 73.17 52 72.95 120.00 96
Radios 37.84 60.82 49 71.27 63.46 67
Space heaters 1,000.00 1,740.00 1,370 2,750.00 1,600.00 2,175
Other appliances -
Computers 423.71 602.40 513 348.52 488.73 419
Toasters 350.00 659.76 505 577.86 868.44 723
Total 12,382.08 13,548.51 12,967.00 16,422.05 14,979.00 15,702.00
*Note: B1=Conventional type 2, B2=Apartment block type 2, B3=Conventional type 3, B4= Apartment block type.
Table 4.8: Annual energy consumption (average) according to each house type.
House type
Energy consumption
(kWh)
Cost per kWh
(MT)
Annual cost
(MT)
Type 2 – Conventional house 17,067.02 3.07 52,395.74
Type 3 – Conventional house 31,713.94 2.92 92,604.70
Type 4 – Conventional house 17,737.47 2.92 51,793.41
Type 5 – Conventional house 33,345.00 2.89 96,367.05
Type 1 – Apartment block 21,565.62 2.89 62,324.64
Type 2 – Apartment block 17,253.75 2.99 51,588.72
Type 3 – Apartment block 27,786.21 2.95 81,969.32
Type 4 – Apartment block 17,193.66 2.99 51,409.03
Part of a commercial building 68,784.30 2.89 198,786.63
Table 4.8 depicts the annual energy consumption according to each house type. It can be seen
that, there is no linear relation between the type of the house and the annually amount of money
spent by these families. Moreover, the cost per kWh differs in almost all types of houses. The

60
reason underneath is probably that EDM applies different prices for pre-paid and post-paid
electricity. For pre-paid, the price is 3.20MT/kWh, and for post-paid the price is 2.89MT/kWh.
To calculate LCC, this thesis considered the average cost of the two selected house type, then an
average of the type 2 conventional houses and type 2 apartment blocks was calculated, and the
same was applied to the type 3 conventional houses and type 3 apartment blocks. Table 4.9
illustrates the annual average cost of electricity for type 2 and type 3 houses. The annual average
costs of electricity for type 2 and type 3 houses were 51,992.23MT and 87,287.01MT,
respectively.
Almost all surveyed households believe that it is important to use energy efficiently. However,
only 50% of them implement measures that enable them to have the same service with less
energy. These measures range from, use of charcoal or LPG for water heating, use of LPG and
charcoal in substitution of electricity for cooking, switching the lights off when not in use, avoid
using appliances simultaneously, use of efficient lights, avoidance of using electrical geysers, use
of appliances rationally, turning appliances off completely, to leaving them unplugged
instandbye mode.
By interviewing architects from company A, claim that, despite their efforts to persuade their
clients to consider energy efficient elements while projecting their houses, roughly all of them
are resistant to change their previous ideas, which in generally have no energy efficient
components. In the few cases were they agree, they tend to disregard the architects suggestion
when extra investments are required. However, the architects indicate that, not only the
incremental investments are the reasons behind this attitude, so is the lack of awareness of the
benefits of energy efficiency buildings and the environmental issues that are behind the global
attempt to curb climate change and its negative implications.
When asked about energy related issues that are currently affecting the world, around 82% claim
to have no information about it. However, the other 18% mentioned issues such as deforestation,
exhaustion of fossil fuels, environmental degradation, global warming, climate change, increase
of energy prices, constant blackouts, floods cause by dams constructed for electricity generation,
and so on (See data in Appendix B).

61
4.3. Life cycle cost of buildings
4.3.1. LCC of type 2 and 3 houses
The LLC calculation was made based on the data provided in Table 4.10. For more datail see
appendix D.
Table 4.9: Data used to calculate LCC of type 2 and 3 houses.
Data Type 2 House Type 3 House
Initial Investment to acquire the house (MT) 2,243,393.00 3,605,179.00
Initial Investment to acquire appliances (MT) 121,160.00 147,000.00
Annual electricity consumption (kWh) 17,160 29,750
Annual maintennance costs (MT) 11,979 26,164
Discount rate (%) 10 10
Energy price escalation rate (%) 9.8 9.8
Maintanance price escalation rate (%) 2.6 2.6
Life time (years) 50 50
Amortization rate (%) 5 5
Based on data provided in Table 4.10 the calculation made resulted in what Table 4.11 indicates.
For more details of the calculation see Appendix D, which demonstrates the calculation of the
LCC of the two types of houses.
Table 4.10: LCC for type 2 and 3 houses.
Item Description of cost Present Value of Type 2
House
(MT)
Present Value of Type
3 House
(MT)
1 Total Initial Investment (house and appliances) 2,364,558.86 3,752,178.57
2 Total cost for appliances replacement 5,153,761.29 6,252,603.12
3 Operating costs for the first 6 years 309,996.59 521,461.93
4 Operating costs, for the remaining 44 years 897,465.42 1,509,007.56
5 Maintenance costs 160,986.32 351,613.01
6 Residual Value (1,470.45) (2,363.05)
7 Total LCC 8,885,298.02 12,384,501.13
While evaluating future cost, it is important to know that there are uncertainities that may happen
in the future, in order to lessen its impact on the results, a correctional factor was considered. In
order to approximate this cost to the reality, this study used the energy price escalation price
suggested by EDM (2012b), which indicates a constant escalation rate of 9.8% from 2015 until
2020 (6 years), and from there on the prices stabilise.
62
The results found in Table 4.11 suggest that in Mozambique, the total LCC of type 2 house is of
about 8,885,298.02MT and for type 3 house, the total cost is of about 12,384,501.13MT. The
operating phase for a type 3 house represents nearly 70% of the total cost of owning, operating,
and disposing the building, which is almost the same finding for the type 2 houses, that indicates
the operating stage is responsible for around 73% of the total cost of the house during its life
time.
4.3.2. LCC of the buildings considering energy efficient appliances
The first option considers a house that only improves the energy efficiency of its appliances, and
the remaining factors are kept constant. While looking at the average power capacity of the
appliances that are being used by the surveyed households, company D, suggested that these
appliances could be replaced by their equivalents, which will consume 50% less energy than
what the current appliances consume.
This assertion goes along with findings from studies conducted by Granda (2012) and Josephy et
al. (2014). The former concluded that it is possible to consume between 50 and 60% less
electricity with heat pump driers, provided that energy efficiency is enhanced. The latter
indicated that a washing machine can consume 70% less electricity when used at lower
temperatures. Moreover, according to Topten International Group (2014), there is already
available technology on the market that allows improvements over energy consumption of
appliances that can reach 60 to 85% efficiency compared to inefficient models being sold and
used in many countries.
Table 4.12 indicates the resulting power capacity of the appliances when the recommended
improvement is applied according to each type of house. Incandescent lights have been proven
by Menanteau and Lafebvre (2000) to be extremely inefficient, and for the LCC calculation they
were replaced by an equivalent CFL lights. With these measures, the results indicated a decrease
in the annual energy consumption, from the original 17,160.39kWh/year to 7,373.70kWh/year
for type 2 house, and from 29,750.08kWh/year to 9,608.40kWh/year for a Type 3 house.

63
Table 4. 11: Improved energy efficiency of the appliances.
Type of appliance C1*
(W)
C2*
(W)
C3*
(W)
C4*
(W)
Freezers 378 189 300 150
CFL 39 20 32 16
CFL 39 20 32 16
Televisions 196 98 166 83
Electric Geysers 1,653 827 2,357 1179
Stoves 1,757 879 2,945 1473
Kettles 1,526 763 1,513 757
Ironing Machine 1,162 581 1,142 571
DVD 48 24 38 19
AC 1,703 852 1,699 850
Fans 120 60 102 51
Microwave 1,411 706 1,261 631
Refrigerator 414 207 581 291
Sound amplifiers 52 26 96 48
Radios 49 25 67 34
Space heaters 1,370 685 2,175 1088
Other appliances
Computer 513 257 419 210
Toasters 505 253 723 362
*Note: C1=Average of appliances power capacity (W) of type 2 house, C2=Average of appliances power capacity (W) for type 2 house,
considering improvement of 50%, C3=Average of appliances power capacity (W) of type 3 house, C4=Average of appliances power capacity (W) for type 3 house, considering improvement of 50%.
Table 4.12: LCC for type 2 and 3 houses - Considering 50% improvement of the appliances.
Item Description of cost Present Value of Type 2
House
(MT)
Present Value of Type
3 House
(MT)
1 Total Initial Investment (house and appliances) 2,425,141.86 3,825,678.57
2 Total cost for appliances replacement 7,731,602.46 9,378,904.67
3 Operating costs for the first 6 years 133,203.38 168,416.85
4 Operating costs, for the remaining 44 years 385,634.64 487,365.02
5 Maintenance costs 160,986.32 351,613.01
6 Residual Value (1,470.45) (2,363.05)
7 Total LCC in MT 10,835,098.19 14,210,780.40
The calculation of LCC indicated in Table 4.13 indicates that, considering that the households
use appliances that are 50% more energy efficient than those that they have been using, the LCC
increases by 18% and 13% for type 2 and type 3 houses, respectively. Despite the relative
decrease of energy costs the overall cost increases due to the increased cost of acquiring efficient
appliances. It should be noted that, the estimation of appliances initial investments was done by
assuming that due to their energy efficiency improvements the cost was aggravated by a factor of

64
50%. In this assumption, no change is made to the building envelope. For more details of the
LCC calculation, see Appendix G.
4.3.3. Building LCC considering building energy efficient elements
The following sensitivity analysis focuses on the use of building energy efficient elements. As
argued by company A, the adoption of elements such as roof and wall insulations, cross
ventilation, double clear glazing, well oriented house as well as the use of window overhangs
the actual energy consumption can be reduced significantly while providing the house occupants
with the required indoor comfort. Furthermore, they claim that the use of these elements
eliminates or reduce significantly the need for critical appliances such as electric heater and air
conditioning, respectively. Despite the existence of other energy efficiency strategies that can be
adopted while promoting an energy efficient building (some of them have been discussed within
this thesis) only elements suggested by companies A, B and D are considered in this discussion.
The energy efficient design suggested by company A is presented in Appendix H, which
indicates the house plan for types 2 and 3. In Appendices 5 and 6, the relative investment costs
estimated by company B are indicated. Table 4.14 illustrates the total energy consumption of the
type 2 and 3 houses when appliances operational time is adjusted, without taking into account the
use of energy efficient appliances. However, adjustment of appliances operational time were
considered, for instance, the surveyed houses on average kept their lights on for 9 hours,
however considering energy efficient practices, the suggested time by company A, is of 5 hours.
The use of electric heaters was eliminated, mostly because the Mozambican weather condition
allows this elimination, considering that the houses are well oriented and insulated, as indicated
by company A.
The running time ratio for freezers and refrigerators was determined according to the findings
from the study carried out by Homes and Melo (2009). They concluded that the runtime of these
appliances when controls for thermostat and damper are at maximum level is a factor of 0.66.
This means that these appliances run for about 66% of the day 16 hours per day. This factor was
used to correct the data from the survey, because almost all respondents indicated that
refrigerators and freezers run for 24 hours, which is not the case. The same factor was also used
for the proposed energy efficient houses.

65
The study considered the maximum factor because Mozambique is a hot and humid country
which makes these appliances to run for longer periods when compared to cold environments.
Borges et al. (2011) state that, the runtime ratio for a refrigerator under 32˚C ambient
temperature is about 50%, and when the temperature drops to 25˚C the runtime ratio is lower,
and can reach 38%. Factors such as door opening, defrost strategies and internal loads also
contribute to the optimum runtime ratio (Saidur et al., 2002 and Borges et al., 2011). The level of
influence of each of these factors varies according to each situation and is difficult to capture,
which justifies the use of the maximum ratio for this research.
Moreover, in the case of electric geysers, it was found that the respondents tried to estimate the
real runtime, which is why the average runtime ratio for this appliance was about 13 hours.
However, for the LCC calculation for the proposed energy efficient house, the average runtime
was adjusted, from the previous 13 hours per day to 2 hours per day, as suggested by Company
A. Company A also indicated that the use of air conditioning and fans, could be adjusted taking
into account that on average the summer season lasts for 8 months in Mozambique, households
could still use these devices for at least 5 hours a day starting from the middle of September until
the middle April. Table 4.14 indicates that when the afore-mentioned adjustments are
considered, the total consumption of energy reduces by 16% and 54% for type 2 and type 3
houses, respectively.
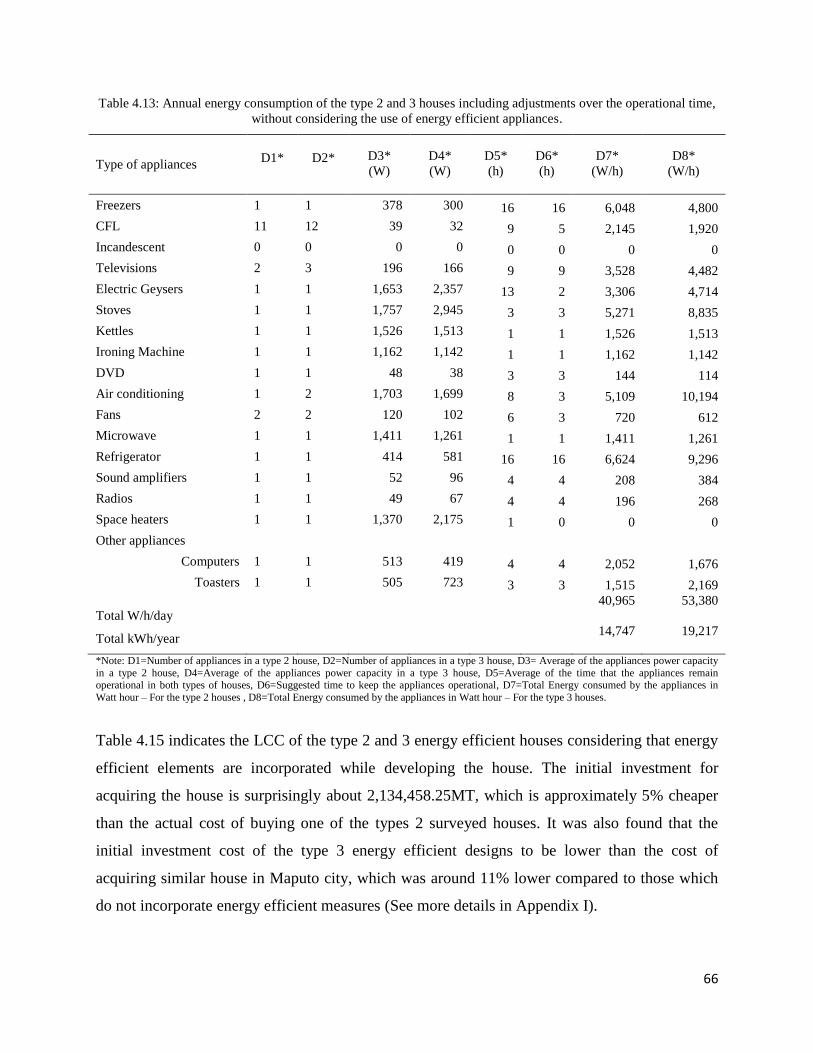
66
Table 4.13: Annual energy consumption of the type 2 and 3 houses including adjustments over the operational time,
without considering the use of energy efficient appliances.
Type of appliances
D1*
D2*
D3*
(W)
D4*
(W)
D5*
(h)
D6*
(h)
D7*
(W/h)
D8*
(W/h)
Freezers 1 1 378 300 16 16 6,048 4,800
CFL 11 12 39 32 9 5 2,145 1,920
Incandescent 0 0 0 0 0 0 0 0
Televisions 2 3 196 166 9 9 3,528 4,482
Electric Geysers 1 1 1,653 2,357 13 2 3,306 4,714
Stoves 1 1 1,757 2,945 3 3 5,271 8,835
Kettles 1 1 1,526 1,513 1 1 1,526 1,513
Ironing Machine 1 1 1,162 1,142 1 1 1,162 1,142
DVD 1 1 48 38 3 3 144 114
Air conditioning 1 2 1,703 1,699 8 3 5,109 10,194
Fans 2 2 120 102 6 3 720 612
Microwave 1 1 1,411 1,261 1 1 1,411 1,261
Refrigerator 1 1 414 581 16 16 6,624 9,296
Sound amplifiers 1 1 52 96 4 4 208 384
Radios 1 1 49 67 4 4 196 268
Space heaters 1 1 1,370 2,175 1 0 0 0
Other appliances
Computers 1 1 513 419 4 4 2,052 1,676
Toasters 1 1 505 723 3 3 1,515 2,169
Total W/h/day
40,965
53,380
Total kWh/year
14,747
19,217
*Note: D1=Number of appliances in a type 2 house, D2=Number of appliances in a type 3 house, D3= Average of the appliances power capacity
in a type 2 house, D4=Average of the appliances power capacity in a type 3 house, D5=Average of the time that the appliances remain operational in both types of houses, D6=Suggested time to keep the appliances operational, D7=Total Energy consumed by the appliances in
Watt hour – For the type 2 houses , D8=Total Energy consumed by the appliances in Watt hour – For the type 3 houses.
Table 4.15 indicates the LCC of the type 2 and 3 energy efficient houses considering that energy
efficient elements are incorporated while developing the house. The initial investment for
acquiring the house is surprisingly about 2,134,458.25MT, which is approximately 5% cheaper
than the actual cost of buying one of the types 2 surveyed houses. It was also found that the
initial investment cost of the type 3 energy efficient designs to be lower than the cost of
acquiring similar house in Maputo city, which was around 11% lower compared to those which
do not incorporate energy efficient measures (See more details in Appendix I).
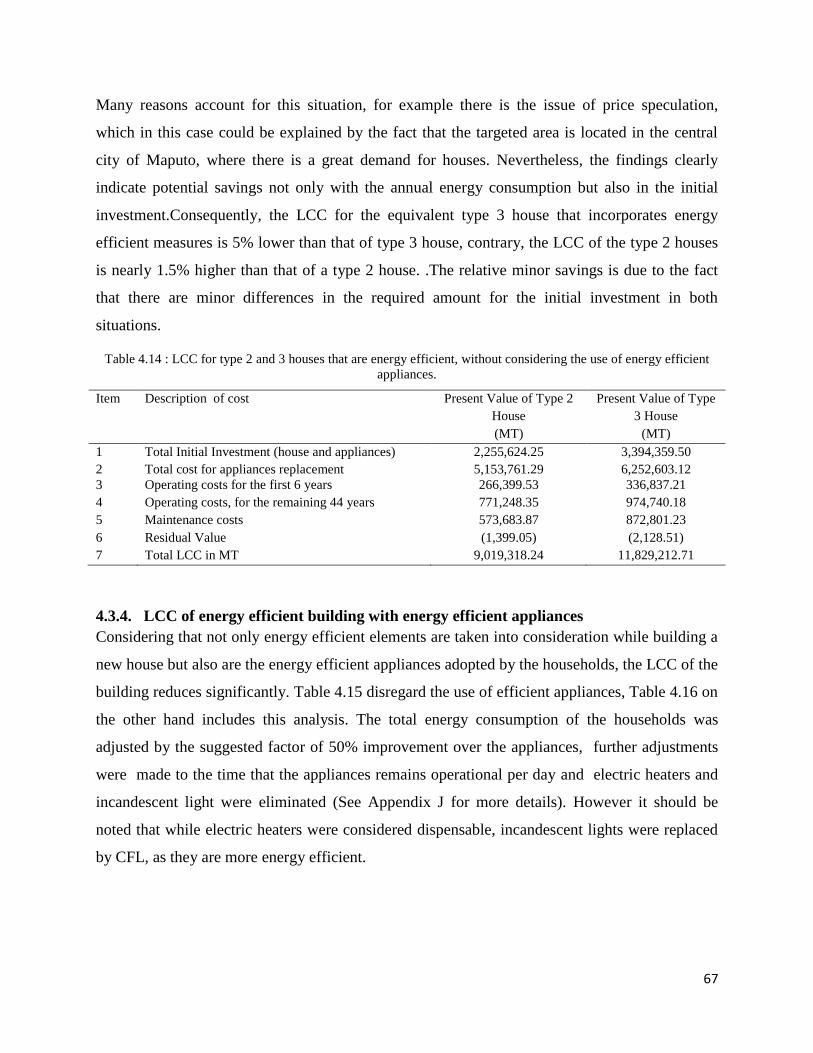
67
Many reasons account for this situation, for example there is the issue of price speculation,
which in this case could be explained by the fact that the targeted area is located in the central
city of Maputo, where there is a great demand for houses. Nevertheless, the findings clearly
indicate potential savings not only with the annual energy consumption but also in the initial
investment.Consequently, the LCC for the equivalent type 3 house that incorporates energy
efficient measures is 5% lower than that of type 3 house, contrary, the LCC of the type 2 houses
is nearly 1.5% higher than that of a type 2 house. .The relative minor savings is due to the fact
that there are minor differences in the required amount for the initial investment in both
situations.
Table 4.14 : LCC for type 2 and 3 houses that are energy efficient, without considering the use of energy efficient
appliances.
Item Description of cost Present Value of Type 2
House
(MT)
Present Value of Type
3 House
(MT)
1 Total Initial Investment (house and appliances) 2,255,624.25 3,394,359.50
2 Total cost for appliances replacement 5,153,761.29 6,252,603.12
3 Operating costs for the first 6 years 266,399.53 336,837.21
4 Operating costs, for the remaining 44 years 771,248.35 974,740.18
5 Maintenance costs 573,683.87 872,801.23
6 Residual Value (1,399.05) (2,128.51)
7 Total LCC in MT 9,019,318.24 11,829,212.71
4.3.4. LCC of energy efficient building with energy efficient appliances
Considering that not only energy efficient elements are taken into consideration while building a
new house but also are the energy efficient appliances adopted by the households, the LCC of the
building reduces significantly. Table 4.15 disregard the use of efficient appliances, Table 4.16 on
the other hand includes this analysis. The total energy consumption of the households was
adjusted by the suggested factor of 50% improvement over the appliances, further adjustments
were made to the time that the appliances remains operational per day and electric heaters and
incandescent light were eliminated (See Appendix J for more details). However it should be
noted that while electric heaters were considered dispensable, incandescent lights were replaced
by CFL, as they are more energy efficient.

68
Table 4.15: LCC for type 2 and 3 energy efficient houses, considering the use of energy efficient appliances.
Item Description of cost E1*
(MT)
E2*
(MT)
1 Initial Investment (house and appliances) 2,316,207.25 3,467,859,50
2 Total cost for appliances replacement 7,730,641.93 9,378,904.67
3 Operating costs for the first 6 years 139,778.91 168,416.85
4 Operating costs, for the remaining 44 years 385,634.64 487,365.02
5 Maintenance costs 573,683.87 872,801.23
6 Residual Value (1,399.05) (2,128.51)
7 Total LCC (MT) 11,144,547.55 14,773,814.08
*Note: E1= Present value for type 2 house considering an improvement of 50% of the appliances power capacity, E2=Present value for type 3
house considering an improvement of 50% of the appliances power capacity.
According to Table 4.16 the LCC of the building considering energy efficient building combined
with 50% improvements of the household’s appliances indicates an increase of about 20% and
14% of the building LCC of the proposed type 2 and type 3 energy efficient houses in
comparison to each similar typical house. This relative high LCC is the result of additional costs
that will be required to acquire the energy efficient appliances, despite the fact of the initial
investment of acquiring both energy efficient proposed being relative cheaper than the type 2 and
3 houses, see Appendix L for more details.
Table 4.17 illustrates the sensitivity analysis of the implementation of different energy efficient
measures in the type 2 and type 3 houses, as well as on the proposed energy efficient designs.
The combination of energy efficiency strategies in the building envelope and use of more energy
efficient appliances result in the increase of the LCC of the both types of houses. The table
indicates cost reductions of the building energy consumption during its useful life time in the
cases where energy efficient measures are considered, ranging with reductions of 56% and 68%
for the types 2 and 3 houses, respectively.
Previous studies by Adalberth (1997) and Baccali et al., (2013) indicate that throughout their life
time, it is during the operational phase when buildings consumes most of the required energy to
provide its tenants with reasonable indoor comfort, accounting for 85 and 72%, respectively.
The study found that, the additional initial investment to build energy efficient houses is about 2
and 8% for type 2 and type 3 houses, respectively. This is comparable to the 9.5% increase in
cost from the study of Keoleian et al. (2011).

69
Table 4.16: Resume of the LCC analysis.
Item Description
of cost
Description of the intervention
F*1 F2* F3* F4*
Type 2
house
Type 3
house
Type 2
house
Type 3
house
Type 2
house
Type 3
house
Type 2
house
Type 3
house
1 G1* (MT)
2,364,559
3,752,179
2,425,142
3,825,679
2,255,624
3,394,360
2,316,207
3,476,860
2 G2* (MT)
5,153,761
6,252,603
7,731,602
9,378,905
5,153,761
6,252,603
7,730,642
9,378,905
3 G3* (MT)
309,997
521,462
133,203
168,417
266,400
336,837
139,779
168,417
4 G4* (MT)
897,465
1,509,008
385,635
487,365
771,248
974,740
385,635
487,365
5 G5* (MT)
160,986
351,613
160,986
351,613
573,684
872,801
573,684
872,801
6 G6* (MT)
(1,470)
(2,363)
(1,470)
(2,363)
(1,399)
(2,129)
(1,399)
(2,129)
7 G7*(MT)
8,885,298
12,384,501
10,835,098
14,209,615
9,019,318
11,829,213
11,144,548
14,373,219
*Note: F1= No intervention is made, F2=50% improvements on appliances energy efficiency, F3= Improvement only on the building envelope,
F4= Improvements on the energy efficiency of the building envelope and appliances, G1= Initial Investment (house and appliances), G2= Total
cost for appliances replacement, G3= Operating costs for the first 6 years, G4= Operating costs, for the remaining 44 years, G5= Maintenance
costs, G6= Residual Value, G7=Total LCC.
When energy efficient measures for the building envelope are taken into account without
considering the use of energy efficient appliances the LCC of a type 3 house is 5% lower than
that of the equivalent type 3 houses, which does not incorporate any energy efficient measure.
This means that the economic feasibility of the proposed energy efficient is only attained for the
type 3 house using appliances that are considered to be less efficient, however, more affordable
in comparison to those that was considered to be more energy efficient.
These findings are comparable to what Keoleian et al. (2001) found in their study. The authors
concluded that due to the use of 4% discount rate for the possible mortgage that households
would require to invest on the energy efficient measures, the savings were offset, with resulting
LCC that is closer to that of house which does not incorporate energy efficient measures. In the
Mozambican case, the degree in which the potential savings are offset are even higher, due to the
relative high discount rate (around 10%) and inflation rates (and average of 2.6%) that increases
the actual cost of adopting energy efficient measures. This is worsen by the fact that all
appliances are not locally made, rather they are imported, and are relatively expensive in
comparison to countries where they are manufactured.

70
Moreover, in Mozambique, although the total energy consumption decreases, its real savings are
usually offset because of the relatively low electricity prices, when compared to other countries.
Each kWh of energy costs between 2.89Mt to 3.20Mt/kWh, which is equivalent to aproximatelly
0.09 to 0.1UDS/kWh, while in South Africa for instance, each kWh costs about 1.4ZAR/kWh,
equivalent to 0.14USD/kWh (Eskom, 2015).

71
Chapter 5: Conclusions and Recommendations
The conclusions and recommendations resulting from the study are highlighted in this chapter.
The chapter begins by presenting the main conclusions resulting from the survey, highlighting
their relation to the objectives of the thesis. The conclusions are based upon the findings
presented and discussed in Chapter 3. Finally, the chapter recommends some necessary actions
to be taken to enable the use of energy efficient strategies for the building envelope and
appliances, and also recommends further work.
5.1. Conclusions
Energy consumption has been increasing worldwide, and has been one of the central points of
debate and analysis recently, mainly because of concerns about supply capacities, depletion of
the energy resources, and the adverse environmental implications such as climate change. To
lessen these negative effects, many countries and organizations have joined forces to design and
implement policies to minimize the global pressure on energy resources. One of the strategies
has been to promote the adoption of energy efficiency across all sectors especial within the
building sector. However, the residential sector is the largest contributor of this share.
Similar to many other low income countries, Mozambique relies mainly on biofuels and waste to
meet most of its energy needs, and nearly 71% of the country’s total final consumption is used
by the residential sector, consequently the country’s’ CO2 emissions are relatively negligible. In
Mozambique, the residential sector consumes 91% of the electricity generated by the EDM, yet,
only 18% of the population is connected to the national grid. Regardless of having access to
clean energy carriers, most of the connected houses still rely on traditional energy carriers to
meet part of their energy needs, not only in rural areas but also in urban and peri-urban areas.
Throughout their life cycle buildings consume a great deal of energy. However, it is on its
operating stage when most of this consumption takes place, ranging from 72 – 90%, driven by
the need to provide its occupant with an acceptable degree of indoor comfort. Therefore, this
research’s focus was on this particular phase of the building lifetime. Optimizing building energy
consumption can potentially achieve three dividends, namely, improve energy security,
contribute to reduce economic costs and avoid social and environmental implications.
72
To attain these dividends, different schemes have been implemented worldwide with emphasis
on energy efficient practices. They range from building energy codes, setting standards and
labeling of appliances, promoting financial incentives programs and providing information in
voluntary programs. In terms of building codes, the focus has been on strategies that will lessen
the building energy burden throughout its useful lifespan, and strategies such as building
orientation, insulation, natural ventilation, landscaping, the use of heat absorbing material and
window sizing and shading have been widely discussed and proven to be cost effective. In
Mozambique, little has been done to promote the adoption of such strategies, and the result is
that the most of the existing buildings do not meet these requirements.
The objective of this study was to assess the economic feasibility related to the implementation
of energy efficiency measures in the residential building sector of Mozambique. In this regard
case study of this research took place in Mozambique, in the Municipal District of KaMpfumo in
Maputo city. The survey was conducted in 11 neighborhood of the district, and 233 households
were subjected to the questionnaire. The aim of the survey was to estimate the households’
energy consumption patterns. From the survey it was noted that of the 233 houses, 57% are
individually owned, 36% are rented and the remaining 7% are qualified into other categories. It
was inferred that most of the houses surveyed are older than 51 years and the majority are type 2
and type 3 houses, which were the house types considered for the proposed energy efficiency
design.
Under the current circumstances, around 70 and 73% of the LCC of the houses occurs during the
building operational phase, for type 2 and 3 houses, respectively. It was found that all appliances
that are currently being used by the households are relatively inefficient and could be improved
by 50%, which resulted in significant reduction of the building’s energy consumption,
accounting for 56% for type 2 houses and about 68% for type 3 houses.
Overall, the use of energy efficient measures increases the building LCC, except for the case
when only energy efficient strategies are incorporated in the building envelope and no
improvement is made over the appliances power capacity. The answer for the thesis main
objective is that, the economic feasibility of the implementation of energy efficient measures in
the residential building of Mozambique, is only verified when these measures are implemented
73
on a type 3 building envelope alone, and improvements over appliances power capacity are
disregarded.
5.2. Recommendations
a) The government should enforce policies to enhance energy efficiency practices, such as
phasing-out incandescent light bulbs, this could be done by providing tax incentives for the
market operators to produce and/or import CFL. The same could be done for all electric
appliances used by households, as their cost affects the LCC of the buildings. Moreover, similar
to other countries that are enhancing the adoption of building codes, the government could
empower certain strategies that are cost effective in the short term, and gradually increase its
deployment according to local conditions.
b) Architects and building designers companies should play the role of helping investors and end
users to better understand about energy efficient strategies, which in some cases do not have an
upfront cost, such as building orientation, and the use of cross ventilation strategies that enables
the building to rip the benefits of natural ventilation. As mentioned in the thesis, these strategies
reduce the building energy consumption.
b) There is a need for massive dissemination of the advantages of energy efficient practices to
the building’s end users in the Mozambican to increase their awareness about the potential
benefits that these measures can accomplish. This dissemination’s focus should not only be on
the cost effectiveness of these practices, but also the emphasis should be placed on the potential
environmental benefits.
c) Further studies should analyze the pay-back period of new buildings, taking into consideration
energy efficient strategies during the building conceptual and operating phases, in relation to
conventional buildings solutions. This analysis could help building sector stakeholders to better
understand the advantages or disadvantages of implementing energy efficiency practices in the
Mozambican residential sector.
74
References Adalberth, K. (1997). Energy use during the life cycle of single unit dwellings: Examples.
Journal of Buildings and Environment, 32 (4), pp. 321-329.
Akbari, H. (2002). Shade trees reduce building energy use and CO2 emissions from power plants.
Journal of Environmental Pollution, 116 (1), pp. 119-126.
Amecke, H., Deason, J., Hobbs, A., Novikova, A., Xiu, Y. and Shengyuan, Z. (2013). Buildings
energy efficiency in China, Germany, and the United States. Climate Policy Initiative.
American Society for Testing and Materials - International (2013).Standard Practice for
Measuring Life-Cycle Costs of Buildings and Buildings Systems.West Conshohocken, PA:
ASTM International. [Online] Available:
http://enterprise1.astm.org/DOWNLOAD/E917.1627886-1.pdf. [Last accessed: 03 November
2013].
Arpke A. and Hutzler N. (2005). Operational life-cycle assessment and life-cycle cost analysis
for water use in multi-occupant buildings. Journal of Architectural Engineering, 11 (3), pp. 99–
109.
ASHRAE (2013). Standard Practice for Measuring Life-Cycle Costs of Buildings and Buildings
Systems.West Conshohocken, PA: ASTM International. Retrieved from:
http://enterprise1.astm.org/DOWNLOAD/E917.1627886-1.pdf. (03.11.2014).
Auziane, G. (2010). Energy Assessment Methodologies and Climatic Measurements – A Field
Monitoring Project in Maputo City. Division of Building Science, Department of Construction
Sciences, Lund University, Sweden.
Beccali, M., Cellura, M., Fontana, M., Longo, S. and Mistretta, M. (2013). Energy retrofit of a
single-family house: Life cycle net energy saving and environmental benefits. Journal of
Renewable and Sustainable Energy Reviews, 27, pp. 283-293.
Borges, B. N., Hermes, C. J. L., Gonçalves, J. M. and Melo, C. (2011). Transient simulation of
hosehold refrigerators: A semi-empirical quasi-steady approach. Journal of Applied Science, 88,
pp.748-754.
75
Browns, R.J. and Yanuk, R. R. (1985). Introduction to life cycle costing. The Fairmont Press,
Inc. ePrentice – Hall, Inc – USA.
Cabeza, L., Rincón, L., Vilariño, V., Pérez, G. and Castell, A. (2013). Life cycle assessment
(LCA) and life cycle energy analysis (LCEA) of buildings and the building sector: A review.
Journal of Renewable and Sustainable Energy Reviews, 29, pp. 394-416.
Calmorin, L. P. and Calmorin, M. A. (2007). Research Methods and thesis writing (2nd
Edition).
Rex Publishing Manila, Philippines.
Carneiro, J. F. and Alberto, M. (2014). Preliminary assessment of CO2 Storage potential in the
Rovuma sedimentary basin, Mozambique. Journal of Energy Procedia, 63, pp. 5141-5152.
Clarke, J. A., Johnstone, C. M., Kelly, N. J., Strachan, P. A., and Tuohy, P. (2008). The role of
built environment energy efficiency in a sustainable UK energy economy. Journal of Energy
Policy, 36 (12), pp. 4605-4609.
CMM (2010). Perfil Estatístico do Município de Maputo. Retrieved from:
http://www.cmmaputo.gov.mz/PhotoHandler.ashx?i=4027 (14.05.2014).
Cooper, T. (2004). Inadequate life? Evidence of consumer attitudes to product obsolescence.
Journal of consumer policy, 27, pp. 421-449.
Cuvilas, C. A., Jirjis, R. and Lucas, C. (2010). Energy situation in Mozambique: A review.
Journal of Renewable and Sustainable Energy Reviews, 14 (7), pp. 2139 – 2146.
Debnath, A., Singh, S.V. and Singh, Y.P. (1995). Comparative assessment of energy requirement
for different types of residential buildings in India. Journal of Energy and Buildings, 23, pp. 141-
146.
Brito, L. Castel-Branco, C., Chichava, S. and Francisco, A. (2008). Reflecting about Economic
question: papers presented at the inaugural conference of the Institute for social and Economic
Studies (IESE).
Direcção Geral de Energia (2002). Eficiência Energética nos Edifícios, E4. Lisboa, Portugal.
76
Dixon, R.K., McGowan, E., Onysko, G., and Scheer, R. M. (2010). US energy conservation and
efficiency policies: Challenges and opportunities. Journal of Energy Policy, 38, pp. 6398-6408.
DOE (2000). Elements of an Energy-Efficient House. Energy Efficiency and Renewable Energy.
EREC. USA.
DOE (2010). Policy to support the Energy Efficiency and Demand Side Management Program
for the Electricity Sector through the Standard Offer Incentives Scheme. Pretoria, South Africa.
DOE (2010). Policy to support the Energy Efficincy and Demand Side Management Program for
the Electricity Sector, through the Standard Offer Incentive Scheme. Republic of South Africa.
Economidou, M., Atanasiu, B., Despret, C., Maio, J., Nolte, I., and Rapf, O. (2011). Europe’s
buildings under the microscope. A country-by-country review of the energy performance of
buildings. Buildings Performance Institute Europe (BPIE).
EDM (2011). Statistical Summary 2010. Maputo: Corporate Performance and Business
Development. Maputo, Mozambique.
EDM (2012a). Energy Efficiency and Demand Side Managements Strategy/Master Plan.
Maputo, Mozambique.
EDM (2012b). Revisão do decreto 29/2003 de 23 de Junho sistema tarifário de venda de energia
da electricidade de Moçambique. Maputo, Mozambique.
EDM (2013). Domestic/Commercial Customers Survey Results. Maputo, Mozambique.
Eskom (2015). Tariffs and charges. Retrieved from:
http://www.eskom.co.za/CustomerCare/TariffsAndCharges/Pages/Tariffs_And_Charges.aspx
(10.02.2015).
Fay, J., Kapfudzaruwa, F., Na, L., and Matheson, S. (2012). A comparative policy analysis of the
Clean Development Mechanism in South Africa and China. Journal of Climate and
Development, 4 (1), pp. 37-41.
77
Fuller, S. K.. and Petersen, S. R.(1996). Life-Cycle Costing Manual for the Federal Energy
Management Program, 1995 Edition. NIST handbook 135.
Fuller, S.K. (2005). Guidance on Life-Cycle Cost Analysis Required by Executive Order 13123.
Retrieved from: http://www1.eere.energy.gov/femp/pdfs/lcc_guide_05.pdf.(03.11.2013).
Gillingham, K., Newell, R., and Palmer, K. (2006). Energy Efficiency Policies: A Retrospective
Examination. Journal of Annual Review of Environment and Resources, 31, pp. 161-192.
Gonçalves, H. (2006). Regulamentação Energética dos Edifícios. Lisboa. Retrieved from:
http://www.buildingsplatform.eu/epbd_publication/doc/Apresentacao_Regulamentacao_Energeti
ca_HelderGoncalves_p2759.pdf (17.11.2014).
Gottmann, J. (1966). Why the Skyscraper? Journal of Geographical Review, 56 (2), pp. 190-212.
Granda, C. (2012). Market transformation for clothes dryers:Lessons learned from the European
experience. Retrieved from: www.topten.eu/uploads/file/Granda48_13%20120320pdf
(15.05.2015).
Hankins, M. (2009). A Renewable Energy Plan for Mozambique. Retrieved from:
http://www.internationalrivers.org/files/attached-files/clean_energy_for_mz_30_9_09.pdf
(17.11.2014).
Hasan, A. (1999). Optimizing insulation thickness for buildings using life cycle cost. Journal of
Applied Energy, 63 (2), pp. 115-124.
Hasan, A., Vuolle, M., and Sirén, K. (2008). Minimisation of life cycle cost of a detached house
using combined simulation and optimisation. Journal of Building and Environment, 43, pp.
2022-2034.
Hermes, C.J.L. and Melo, C. (2009). Assessment of the energy performance of household
refrigerators via dynamic simulation. Journal of Applied Science, 26 (5-6), pp. 1153-1165.
78
Howarth, R.B., Haddad, B.M., and Paton, B. (2000). The economics of energy efficiency:
insights from voluntary participation programs. Journal of Energy Policy, 28, pp. 477-486.
IEA (2008). Energy Efficiency Requirements in Building Codes, Energy Efficiency Policies for
New Buildings. IEA/OECD, Paris. Retrieved from:
http://www.iea.org/publications/freepublications/publication/Building_Codes-1.pdf.
(19.10.2013).
IEA (2010). Energy Performance Certification of Buildings: A policy tool to improve energy
efficiency. Retrieved from:
http://www.iea.org/publications/freepublications/publication/buildings_certification.pdf.
(19.10.2013).
IEA (2013a). Modernising Building Energy Codes to Secure our Global Energy Future.
IEA/OECD, Paris.
IEA (2013b). CO2 emissions from fuel combustion. Highlights. IEA/OECD, Paris.
IEA (2013c). Key World Energy Statistics. IEA/OECD, Paris. Retrieved from:
http://www.iea.org/publications/freepublications/publication/KeyWorld2013.pdf (15.10.2014).
IEA (2013d) Energy Statistics. IEA/OECD, Paris. Retrieved from:
http://www.iea.org/stats/WebGraphs/MOZAMBIQUE4.pdf. ( 20.06.2014).
IEA (2013d). Mozambique: Indicators for 2011 Retrieved from:
http://www.iea.org/statistics/statisticssearch/report/?&country=MOZAMBIQUE&year=2011&pr
oduct=Indicators (20.11.2014).
IEA (2014a). Energy Efficiency indicators: Essentials for policy making. IEA/OECD, Paris.
Retrieved from:
http://www.iea.org/publications/freepublications/publication/IEA_EnergyEfficiencyIndicators_E
ssentialsforPolicyMaking.pdf. (15.10.2014).
79
INE (2007). Recenseamento geral da população e Habitação 2007: Indicadores sócio-
demográficos Distritais, Maputo Cidade. Retrieved from:
http://www.ine.gov.mz/pt/resourcecenter (21.02.2014).
International Monetary Fund (2014). World Economic Outlook – Recovery strengthens, remains
uneven. Washington, April 2014.
IRENA (2012). Mozambique Renewable Readiness Assessment 2012.
Islam, H., Jollands, M., Setunge, S., Ahmed, I., and Haque, N. (2014). Life cycle assessment and
life cycle cost implications of wall assemblages designs. Journal of Energy and Buildings, 84,
pp. 33-45.
Joseph, B. Bush, E., Nipkow, J., Kleeli, K. and Glanzmann, S. (2014). Cold wash-Do prejudices
impede high energy savings?
Kavgic, M., Mavrogianni, A., Mumovic, D., Summerfield, A., Stevanovic, Z. and Djurovic-
Petrovic, M. (2010). A review of bottom-up building stock models for energy consumption in the
residential sector. Journal of Building and Environment, 45 (7), pp. 1683-1697.
Kelly, S., Crawford-Brown, D. and Pollitt, G. M. (2012). Building Performance evaluation and
certification in the UK: Is SAP fit for purpose. Journal of Renewable and Sustainable Energy
Reviews, 16 (9), pp. 6861-6878.
Keoleian, G. A., Blanchard, S. and Reppe, P. (2001). Life-cycle, costs, and strategies for
improving a Single-Family House. Journal of Industrial Ecology, 4 (2), pp. 135-156.
Kim, H. C., Koeleian, G. A. and Horie, Y. A. (2006). Optimal household refrigerator
replacement policy for life cycle energy, greenhouse gas emissions and cost. Journal of Energy
Policy, 34 (4), pp. 2310-2323.
Kim, T. J. and Park, J. S. (2010). Natural Ventilation with traditional Korean opening in
contemporary houses. Journal of Building and Environment, 45, pp. 51-57.
80
Kneifel, J. (2010). Life-cycle carbon and cost analysis of energy efficiency measures in new
commercial buildings. Journal of Energy and Buildings, 42 (3), pp. 333-340.
Kruyt, B., van Vuuren, D. P., de Vries H.J.M., and Groenenberg, H. (2009). Indicators for
Energy Security. Journal of Energy Policy, 36 (6), pp. 2166‐2181.
Lee, W. L. and Gao, C. F. (2011). Evaluating the influence of openings configuration on natural
ventilation performance of residential units in Hong Kong. Journal of Building and Environment,
46, 961-969.
Liu, Y., Guo, X., and Hu, F. (2014). Cost-benefit analysis on green building energy efficiency
technology application: A case in China. Journal of Energy and Buildings, 82, pp. 37-46.
Lovins, A.B. (2004). Energy Efficiency, Taxonomic Overview. Journal of Encyclopedia of
Energy, 6 (2), pp. 383-401.
Lutz, J., Lekov, A., Chan, P., Whitehead, C., Mayers, S., &McMahon,J. (2006). Life-cycle cost
analysis of energy efficiency design options for residential furnaces and boilers. Journal of
Energy, 31, pp. 311-329.
Mackay, D. (2009). Sustainable energy without the hot air. England: UIT Cambridge Ltd.
Retrieved from: http://www.withouthotair.com/ (21.10.2014).
Marszal, A.J., Heiselberg, P., Bourrelle, J.S., Musall, E., Voss, K., Sartori, I. and Napolitano, A.
(2011). Zero Energy Building – A review of definitions and calculation methodologies. Journal
of Energy and Buildings, 43 (4), pp. 971 – 979.
Mata E., Kalagasidis A.S.,Johnsson F. (2013). A modelling strategy for energy, carbon, and cost
assessments of building stocks. Journal of Energy and Buildings, 56, pp. 100–108.
Menanteau, P. and Lefebvre, H. (2000). Competing technologies and the diffusion of
innovations: the emergence of energy-efficient lamps in the residential sector. Journal of
Research Policy, 29 (3), pp. 375-389.
Ministerio da Energia (2010). Estratégia de Desenvolvimento de Energias Novas e Renováveis
(EDENR) para o período de 2011-2025. República de Moçambique.
81
Pacheco, R., Ordóñez, J., and Martínez, G. (2012). Energy efficient design of building: A review.
Journal of Renewable and Sustainable Energy Reviews, 16 (6), pp. 3559-3573.
Patterson, M. G. (1996). What is energy efficiency? Concepts, indicators and methodological
issues. Journal of Energy Policy, 24 (5), pp. 377-390.
Pérez-Lombard, L., Ortiz, J., and Pout, C. (2008). A review on buildings energy consumption
information. Journal of Energy and Buildings. 40 (3), pp. 394-398.
Pérez-Lombard, L., Ortiz, J., Coronel, J.F., Maestre, I.R. (2011). A review of HVAC systems
requirements in buildings energy regulations. Journal of Energy and Buildings. 43 (2-3), pp.
255-268.
Ramesh, T., Prakash, R. and Shukle, K (2010). Life Cycle energy analysis of buildings: An
overview. Journal of Energy and Buildings, 42 (10), pp. 1592 – 1600. Retrieved from:
http://www.sciencedirect.com (14.05.2014).
Rankin, R. and Rousseau, P.G. (2008). Demand side management in South Africa at industrial
residence water heating systems using in line water heating methodology. Journal of Energy
Conversion and Management, 49 (1), pp. 62-74.
Rebitzer, G., Ekvall, T., Frischknecht, R., Hunkeler, D., Norris, G., Rydberg, T., Schmidt, W.,
Suh, S., Weidema B.P., and Pennington, D. (2004). Life Cycle Assessment – Part 1: Framework,
goal and scope definition, inventory analysis, and applications. Journal of Environment
International, 30 (5), pp. 701-720.
Reddy, B.V., and Jagadish, K.S. (2003). Embodied energy of common and alternative building
materials and technologies. Journal of Energy and Buildings, 35 (2), pp. 129-137.
REN21 (2013). Renewables 2013: Global Future Report. Paris: REN21 Secretariat. Retrieved
from: http://www.worldfuturecouncil.org/fileadmin/user_upload/PDF/REN21_GFR_2013.pdf.
(19.10.2014).

82
Rodriguez-Ubinas, E., Montero, C., Porteros, M., Vega, S., Navarro, I., Castillo-Cagigal, M.,
Matallanas, E., and Gutiérres, A. (2014b). Passive design strategies and performance of Net
Energy Plus Houses. Journal of Energy and Buildings, 83, pp. 10-22.
Rodriguez-Ubinas, E., Rodriguez, S., Voss, K.., and Todorovic, M. S. (2014a). Energy efficiency
evaluation of zero energy houses. Journal of Energy and Buildings, 83, pp. 23-35.
Rohe, W.M., Van Zandt, S., and McCarthy, G. (2013). The social benefits and costs of
homeowenership: A critical assessment of the research. The afforadable houseing reader (pp.
196-212). New York: Library of Congress Cataloging in Publication Data.
Ryan, L. and Campbell, N. (2012). Spreading the net: the multiple benefits of energy efficiency
improvements. International Energy Agency, Insights Series 2012. Retrieved from:
http://www.iea.org/publications/insights/insightpublications/Spreading_the_Net.pdf
(04.06.2014).
Sadineni, S. B., Madala, S., and Boehm, R.F. (2011). Passive building energy savings: A review
of building envelope components. Journal of Renewable and Sustainable Energy Reviews, 15
(8), pp. 3617-3631.
Sartori, I. and Hestnes, A. (2007). Energy use in the life cycle of conventional and low-energy
buildings: A review article. Journal of Energy and buildings, 39 (3), pp. 249-257.
Sayce, S.,Soundberg, A., and Clements, B. (2010). Is sustainability reflected in commercial
property prices: an analysis of the evidence base. Research Report. RICSRESEACH. Retrieved
from: http://eprints.kingston.ac.uk/15747/1/Sayce-S-15747.pdf (04.06.2014).
Schipper, L. and Meyers, S. (1992). Energy Efficiency and Human Activities: Past Trends,
Future Prospects (1st Edition). Cambridge University Press. New York, USA.
Sharma, A., Saxena, A., Sethi, M., Shree, V. and Varun (2011). Life cycle assessment of
Buildings: A review. Journal of Renewable and Sustainable Energy Reviews. 15 (1), pp. 871-
875.
83
Solomon, S., Bureau-Cauchois, G., Ahmed, N., Aarnes, J., and Holtedahl, P. (2014). CO2
Storage Capacity Assessment of Deep Saline Aquifers in the Mozambique Basin. Journal of
Energy Procedia, 63, pp. 5266-5283.
Solomon, S., Plattner, G., Knutti, R. and Friedlingstein, P. (2008) Irreversible climate change
due to carbon dioxide emissions. Journal of The National Academy of Science of the USA, 106
(6), pp. 1704-1709. Retrieved from:
www.pnas.org/cgi/content/full/0812721106/DCSupplemental. (15.10.2014).
Solomon, S., Qin, D., Manning, M., Chen, Z., Marquis, M., Averyt, K. B., Tignor, M., and
Miller, H. L. (2007). IPCC, 2007: climate change 2007: the physical science basis." Contribution
of Working Group I to the fourth assessment report of the Intergovernmental Panel on Climate
Change.
Stocker, T. F., Qin, D., Plattner, G. K., Tignor, M., Allen, S. K., Boschung, J., Nauels, A., Xia,
Y., Bex, B., and Midgley, B. M. (2013). IPCC, 2013: climate change: The physical science
basis. Contribution of working group I to the fifth assessment report of the intergovernmental
panel on climate change.
Tuominen, P., Forsstrõm, J., and Honkatukia, J. (2013). Economic effects of energy efficiency
improvements in the Finnish building stock. Journal of Energy Policy Journal, 52 (201), pp. 181
– 189.
Topten International group (2014). Best products of Europe. Retrieved from: www.topten.eu
(15.05.2015).
UNDP (2000). World Energy Assessment: Energy and the challenge of Sustainability. New
York.
UNDP (2014). Human Development Report. New York.
Utama, A. and Gheewala, S. H. (2008). Life cycle energy of single landed houses in Indonesia.
Journal of Energy and Buildings, 40 (10), pp. 1911-1916.

84
Varone, F. and Aebischer, B. (2001). Energy efficiency: the challenges of policy design. Journal
of Energy Policy, 29 (8), pp. 615-629.
Wang, W., Zmeureanu& R., Rivard, H. (2005). Applying multi-objective genetic algorithms in
green building design optimization. Journal of Building and Environment, 40 (11), pp. 1512–25.
Westphal, F. and Lamberts, R. (2005).Building Simulation Calibration Using Sensitivity
Analysis, Journal of Building Simulation. Ninth International IBPSA Conference. Canada, pp.
1331-1338. Retrieved from:
http://citeseerx.ist.psu.edu/viewdoc/download?doi=10.1.1.135.5829&rep=rep1&type=pdf (21.
10.2014).
Whang, S. and Kim, S. (2014). Determining sustainable design management using passive
design elements for a zero emission house during the schematic design. Journal of Energy and
Buildings, 77, pp. 304-321.
White, G. E. and Ostwald, P. F. (1976). The life cycle cost of an item is the sum off all funds
expended in support of the item from its conception and fabrication through its operation to the
end of its useful life. Journal of Management Accounting, 57 (7), pp. 39-42.
World Bank (2013). GDP per capita. Retrieved from:
http://data.worldbank.org/indicator/NY.GDP.PCAP.CD (10.04.2014).
World Bank (2014). World Development Indicators: Mozambique. Retrieved from:
http://data.worldbank.org/country/mozambique (10.04.2014).
Wu, J. (2012). The study on Energy Efficiency in Africa. Journal of Physics, 24, pp. 458-464.

85
Appendices
Appendix A: Survey questionnaire for energy efficiency study
A1: English version of the questionnaire
SURVEY QUESTIONNAIRE FOR ENERGY EFFICIENCY STUDY
This questionnaire aim to evaluate how much does households spend for energy bills, throughout
the lifetime of a building. For that, it will access aspects such as sources and cost of energy,
appliances that are currently being used, and how much energy do they require for operating
among others. With the information provided, suggestions of energy efficient practices that could
result in reducing the energy bill could be drawn. Moreover, the suggested improvements may
help reduce the increasing pressure towards energy demand within the country. Your responses
will be confidential and will be used only for the survey propose.
1. What is the ownership status of this dwelling?
Owned
Rented
Other (specify)
2. What is the dwelling type of building?
Designation Tick where it is applicable
Conventional house
Flat/Apartment block
Hut
makeshift home
mixed house
Basic house
Part of a commercial building
Other (specify)
3. How old is the building?
Designation Tick where it is applicable
Less than 5 years
Between 6 and 10 years

86
Between 11 and 20 years
Between 21 and 30 years
Between 31 and 40 years
Between 41 and 50 years
More than 51 years
Not known
4. Do you know how much does the house costs currently?
Yes
No
5. If yes, can you tell, how much is it in National currency?
________________________ Meticais.
6. Do you know the annual average costs for the house maintenance?
Yes
No
7. If yes, can you tell, how much is it in National currency?
________________________ Meticais.
8. What is the floor area of this dwelling?
_______m2
9. What is the orientation of the house according to the long axis of the building ?
East-West
North South
other
10. How many compartments the household has?
Compartment type Quantity
Porch
Bedroom
Bathroom
Kitchen
Corridor
Living room
Dining room
Office
Other

87
11. Energy cost monthly
Months Electricity
(kwh)
LPG
(Kg)
Charcoal
(kg)
Diesel Oil
-generator
(Litres)
Coal
(kg)
Querosene
(litres)
Firewood
(Kg)
Other
Cost per
unit
January
February
March
April
May
June
July
August
September
October
November
December
12. Does the household have solar PV system installed and operational
Yes
No
13. If yes, what is the installed capacity? To what propose is it being used?
________________________________________________________________________
________________________________________________________________________
14. Which of the following appliances are currently being used by the household?
Designation Age
(years)
Power
Capacity
(W)
Quantity Time:
h/day
Total Energy
consumption
(KWh)
Freezers
Lighting Compact
Fluorescent
Incandescent
Televisions
Electric Geysers
Stoves
Kettles

88
Ironing Machine
DVD
Air conditioning
Fans
Microwave
Refrigerator
Sound amplifiers
Radios
Electric space heaters
Other appliances
1.
2.
15. Do you think that it is important to use energy efficiently?
Yes
No
Other
16. If yes, what measures do you adopt?
a) _____________________________________________________________________
b) _____________________________________________________________________
c) _____________________________________________________________________
d) None
17. Can you name two energy related issues affecting the world?
a) ____________________________________________________________________
b) ____________________________________________________________________
c) Do not know.
Thank you for answering the questions
A2: Questionnaires’ Portuguese version:
QUESTIONÁRIO PARA PESQUISA SOBRE EFICIÊNCIA ENERGÉTICA EM
EDIFÍCIOS RESIDENCIAIS
Este questionário tem como objetivo avaliar níveis de consumo de energia pelos agregados
familiares, ao longo do tempo de vida útil do edifício. Para isso, ele vai incidir sobre aspectos
como fontes e custo da energia, aparelhos que estão sendo usados, e quanta energia estes
necessitam para operar entre outros. Com as informações fornecidas, espera-se desenhar
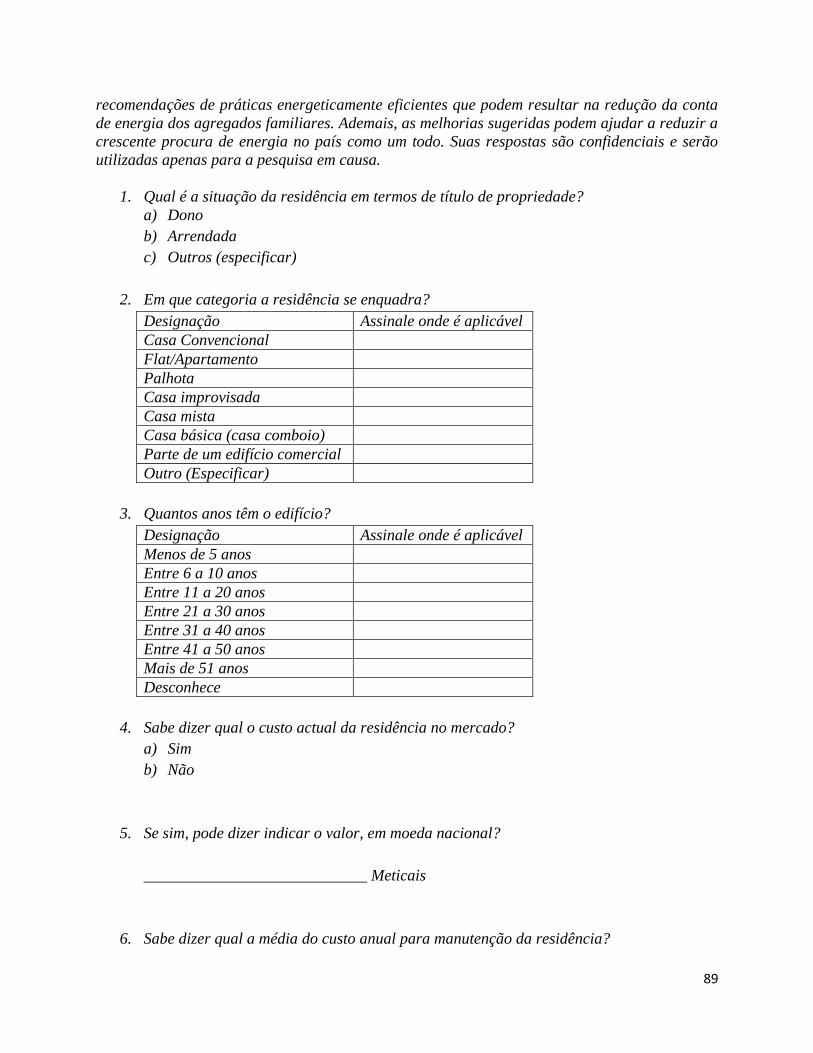
89
recomendações de práticas energeticamente eficientes que podem resultar na redução da conta
de energia dos agregados familiares. Ademais, as melhorias sugeridas podem ajudar a reduzir a
crescente procura de energia no país como um todo. Suas respostas são confidenciais e serão
utilizadas apenas para a pesquisa em causa.
1. Qual é a situação da residência em termos de título de propriedade?
a) Dono
b) Arrendada
c) Outros (especificar)
2. Em que categoria a residência se enquadra?
Designação Assinale onde é aplicável
Casa Convencional
Flat/Apartamento
Palhota
Casa improvisada
Casa mista
Casa básica (casa comboio)
Parte de um edifício comercial
Outro (Especificar)
3. Quantos anos têm o edifício?
Designação Assinale onde é aplicável
Menos de 5 anos
Entre 6 a 10 anos
Entre 11 a 20 anos
Entre 21 a 30 anos
Entre 31 a 40 anos
Entre 41 a 50 anos
Mais de 51 anos
Desconhece
4. Sabe dizer qual o custo actual da residência no mercado?
a) Sim
b) Não
5. Se sim, pode dizer indicar o valor, em moeda nacional?
____________________________ Meticais
6. Sabe dizer qual a média do custo anual para manutenção da residência?
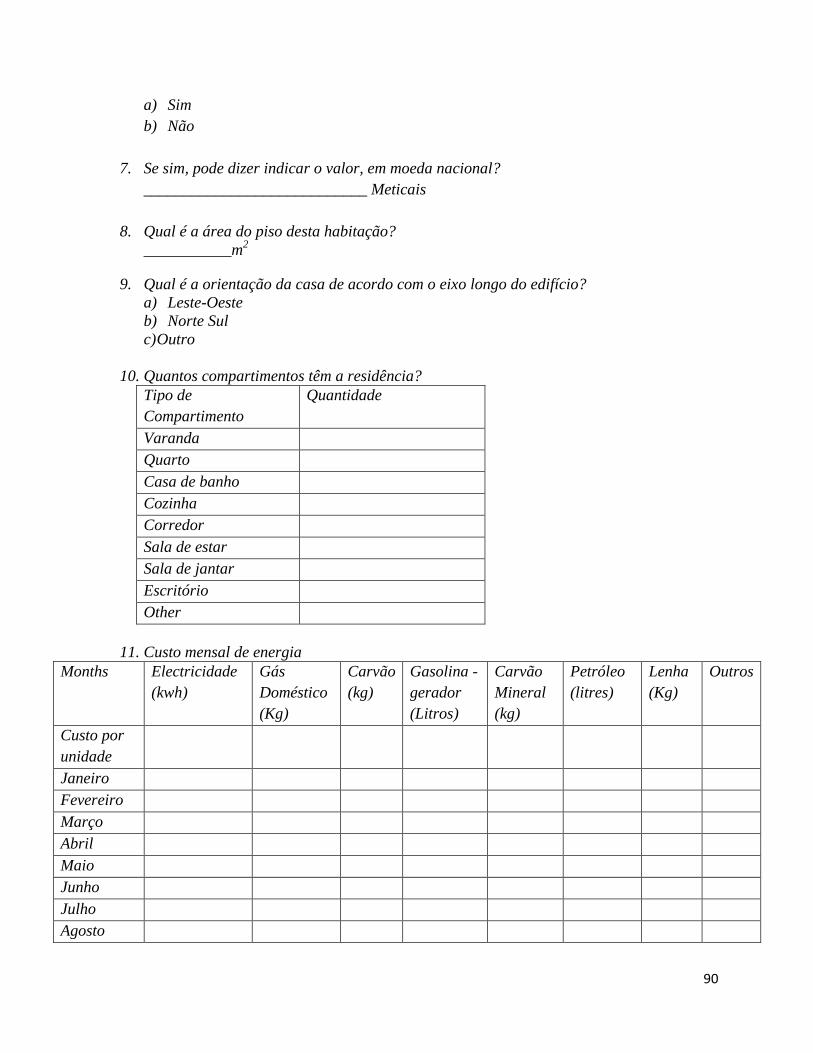
90
a) Sim
b) Não
7. Se sim, pode dizer indicar o valor, em moeda nacional?
____________________________ Meticais
8. Qual é a área do piso desta habitação?
___________m2
9. Qual é a orientação da casa de acordo com o eixo longo do edifício?
a) Leste-Oeste
b) Norte Sul
c) Outro
10. Quantos compartimentos têm a residência?
Tipo de
Compartimento
Quantidade
Varanda
Quarto
Casa de banho
Cozinha
Corredor
Sala de estar
Sala de jantar
Escritório
Other
11. Custo mensal de energia
Months Electricidade
(kwh)
Gás
Doméstico
(Kg)
Carvão
(kg)
Gasolina -
gerador
(Litros)
Carvão
Mineral
(kg)
Petróleo
(litres)
Lenha
(Kg)
Outros
Custo por
unidade
Janeiro
Fevereiro
Março
Abril
Maio
Junho
Julho
Agosto
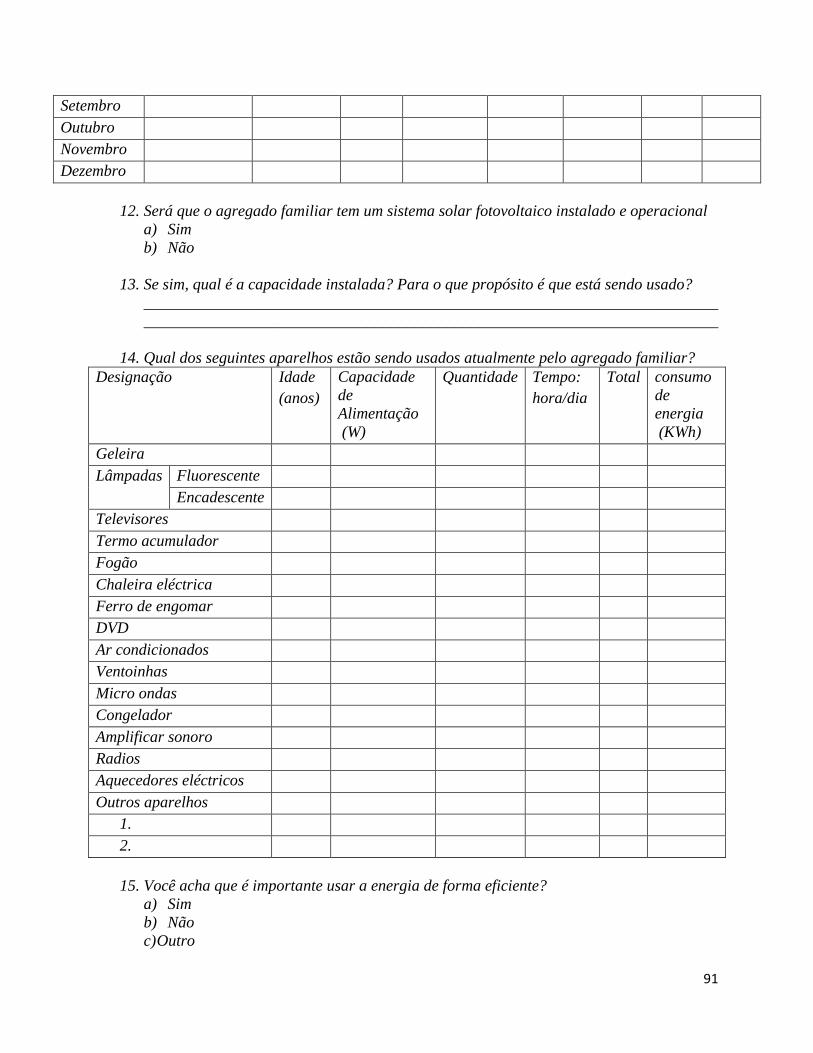
91
Setembro
Outubro
Novembro
Dezembro
12. Será que o agregado familiar tem um sistema solar fotovoltaico instalado e operacional
a) Sim
b) Não
13. Se sim, qual é a capacidade instalada? Para o que propósito é que está sendo usado?
________________________________________________________________________
________________________________________________________________________
14. Qual dos seguintes aparelhos estão sendo usados atualmente pelo agregado familiar?
Designação Idade
(anos)
Capacidade
de
Alimentação
(W)
Quantidade Tempo:
hora/dia
Total consumo
de
energia
(KWh)
Geleira
Lâmpadas Fluorescente
Encadescente
Televisores
Termo acumulador
Fogão
Chaleira eléctrica
Ferro de engomar
DVD
Ar condicionados
Ventoinhas
Micro ondas
Congelador
Amplificar sonoro
Radios
Aquecedores eléctricos
Outros aparelhos
1.
2.
15. Você acha que é importante usar a energia de forma eficiente?
a) Sim
b) Não
c) Outro

92
16. Se, sim que medidas tem adoptado?
a) _____________________________________________________________________
b) _____________________________________________________________________
c) _____________________________________________________________________
d) Nenhuma
17. Você pode citar duas questões relacionadas com a energia que afetam o mundo
a) _____________________________________________________________________
b) _____________________________________________________________________
c) Desconhece
OBRIGADA POR RESPONDER AS QUESTÕES.

93
Appendix B: Data Summary of the Survey
Table B 1: Compiled answers for questions number 1 and 2 of the questionnaire.
Neighborhood
Malhang
. B
Alto
Mae
B
Centra
l B
Centra
l A
P.
Cimto
. A
Sommershiel
d
P.Cimto
. B
Centra
l C
Alt
o
Ma
e A
Malhang.
A
Coo
p
Total
Sample Size 38 28 27 24 23 23 22 20 19 16 13 253
Number of surveyed houses 38 28 27 24 23 3 22 20 19 16 13 233
% 16%
12% 12% 10% 10% 1% 9% 9% 8% 7% 6%
100%
Question 1 Ownership status of the house.
Total %
Owner 30 17 10 18 11 2 16 8 12 9 1 134 58%
Rented 8 11 13 4 12 1 5 12 7 7 3 83 36%
other - - 4 2 - - 1 - - - 9 16 7%
Total 38 28 27 24 23 3 22 20 19 16 13 233 100%
Question 2 Building type
Total %
Conventional house type 2 7 2 0 0 0 0 0 0 0 8 0 17 7%
Conventional house type 3 8 3 2 3 2 3 4 0 3 0 1 29 12%
Conventional house type 4 6 0 0 0 0 0 0 0 2 0 0 8 3%
Conventional house type 5 1 0 0 0 0 0 0 0 0 0 0 1 0%
Flat/Apartment block type
1 0 0 1 0 0 0 0 4 0 0 0 5 2% Flat/Apartment block type
2 4 7 13 4 7 0 6 8 4 3 5 61 26%
Flat/Apartment block type 3 9 16 10 17 9 0 12 8 7 5 7 100 43%
Flat/Apartment block type
4 3 0 0 0 5 0 0 0 3 0 0 11 5% Part of a commercial
building 0 0 1 0 0 0 0 0 0 0 0 1 0%
Total 38 28 27 24 23 3 22 20 19 16 13 233 100%

94
Table B 2: Compiled answers for questions number 3, 4 and 5 of the questionnaire.
Neighborhood
Malhan
g. B
Alto Mae
B
Cent
ral B
Centra
l A
P.
Cimto.
A
Sommershi
eld
P.Cimto. B
Centra
l C
Alt
o
M
ae
A
Malhan
g.A
Coop
Total
Age of the building. Total %
Less than 5 years 0 1 1 0 0 0 0 0 0 0 0 2 1%
Between 6 and 10
years 1 0 0 1 0 0 0 0 0 0 0 2 1%
Between 11 and 20
years 0 3 0 1 1 2 0 0 0 0 3 10 4%
Between 21 and 30
years 1 0 1 0 1 0 1 0 0 0 6 10 4%
Between 31 and 40
years 2 0 0 2 6 0 1 0 1 1 1 14 6%
Between 41 and 50
years 9 0 1 1 3 0 3 0 2 5 2 26 11%
More than 51 years 18 16 14 6 1 0 13 14 16 8 0 106 45%
Not known 7 8 10 13 11 1 4 6 0 2 1 63 27%
Total 38 28 27 24 23 3 22 20 19 16 13 233 100%
Cost of the houses. Total %
Yes 26 12 4 6 5 2 9 3 16 12 3 98 42%
No 12 16 23 18 18 1 13 17 3 4 10 135 58%
Total 38 28 27 24 23 3 22 20 19 16 13 233 100%
Average acquisition cost in National currency.
Total
Avera
ge
Conventional house
type 2
1,312,
500
2,500,0
00 - -
- - - - 542,857 -
4,355,3
57
1,451,
786
Conventional house
type 3
2,014,
286
3,500,0
00 - -
6,500,000
7,000,0
00 -
3,500,0
00 - -
22,514,
286
4,502,
857
Conventional house
type 4
2,760,
000 - - -
- - -
5,750,0
00 - -
8,510,0
00
4,255,
000
Conventional house
type 5 - - - -
- - - - - - - -
Flat/Apartment
block type 1 - - - -
- -
1,500,0
00 - - -
1,500,0
00
1,500,
000
Flat/Apartment
block type 2
2,800,
000
5,500,0
00
2,750,00
0
3,600,
000
1,500,
000 -
5,666,6
67
1,500,0
00
4,333,3
33 700,000
2,000,
000
30,350,
000
3,035,
000
Flat/Apartment
block type 3
2,000,
000
1,625,0
00
6,000,00
0
1,850,
000
1,750,
000 -
4,625,0
00
1,700,0
00
4,000,0
00 775,000
2,750,
000
27,075,
000
2,707,
500
Flat/Apartment
block type 4
2,500,
000 - - -
- - -
5,000,0
00 - -
7,500,0
00
3,750,
000
Part of a commercial
building - -
2,000,00
0 -
- - - - - -
2,000,0
00
2,000,
000
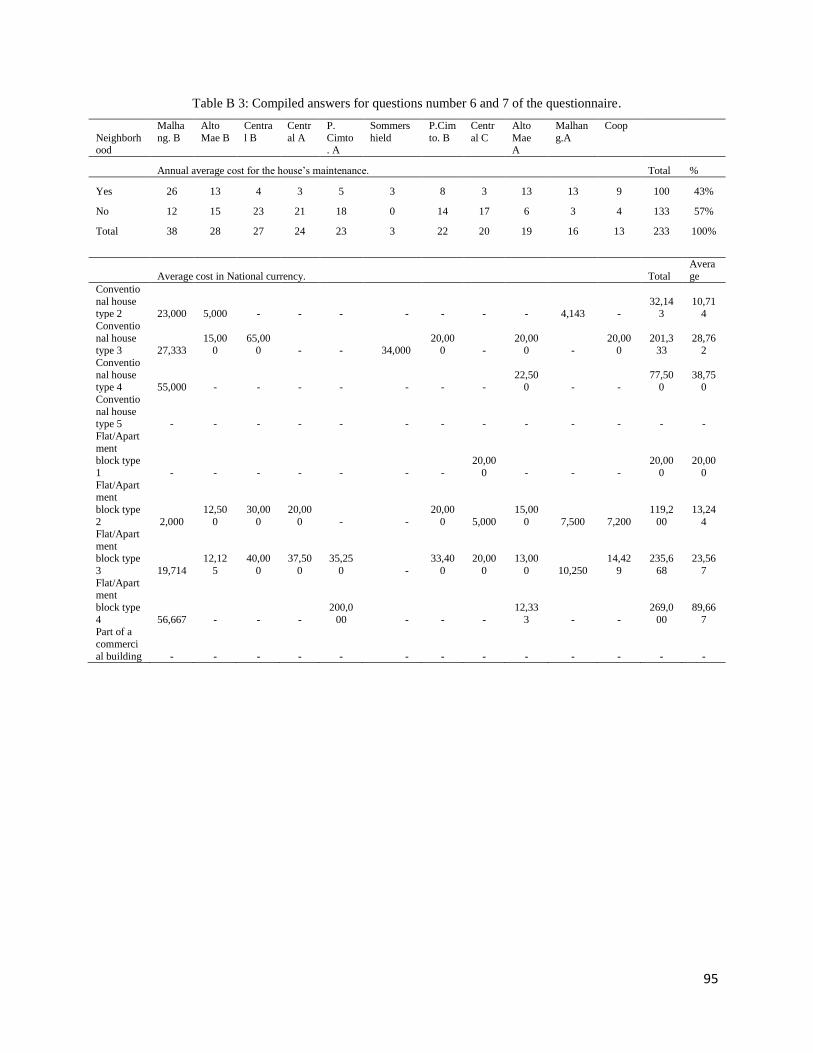
95
Table B 3: Compiled answers for questions number 6 and 7 of the questionnaire.
Neighborhood
Malha
ng. B
Alto
Mae B
Centra
l B
Centr
al A
P.
Cimto. A
Sommers
hield
P.Cim
to. B
Centr
al C
Alto
Mae A
Malhan
g.A
Coop
Annual average cost for the house’s maintenance. Total %
Yes 26 13 4 3 5 3 8 3 13 13 9 100 43%
No 12 15 23 21 18 0 14 17 6 3 4 133 57%
Total 38 28 27 24 23 3 22 20 19 16 13 233 100%
Average cost in National currency. Total
Avera
ge
Conventio
nal house type 2
23,000
5,000
-
-
- -
-
-
-
4,143
-
32,143
10,714
Conventio
nal house type 3
27,333
15,000
65,000
-
- 34,000
20,000
-
20,000
-
20,000
201,333
28,762
Conventio
nal house type 4
55,000
-
-
-
- -
-
-
22,500
-
-
77,500
38,750
Conventio
nal house type 5
-
-
-
-
- -
-
-
-
-
-
-
-
Flat/Apart
ment block type
1
-
-
-
-
- -
-
20,00
0
-
-
-
20,00
0
20,00
0
Flat/Apartment
block type
2
2,000
12,50
0
30,00
0
20,00
0
- -
20,00
0
5,000
15,00
0
7,500
7,200
119,2
00
13,24
4 Flat/Apart
ment
block type
3
19,714
12,12
5
40,00
0
37,50
0
35,25
0 -
33,40
0
20,00
0
13,00
0
10,250
14,42
9
235,6
68
23,56
7
Flat/Apartment
block type
4
56,667
-
-
-
200,0
00 -
-
-
12,33
3
-
-
269,0
00
89,66
7 Part of a
commerci
al building
-
-
-
-
- -
-
-
-
-
-
-
-
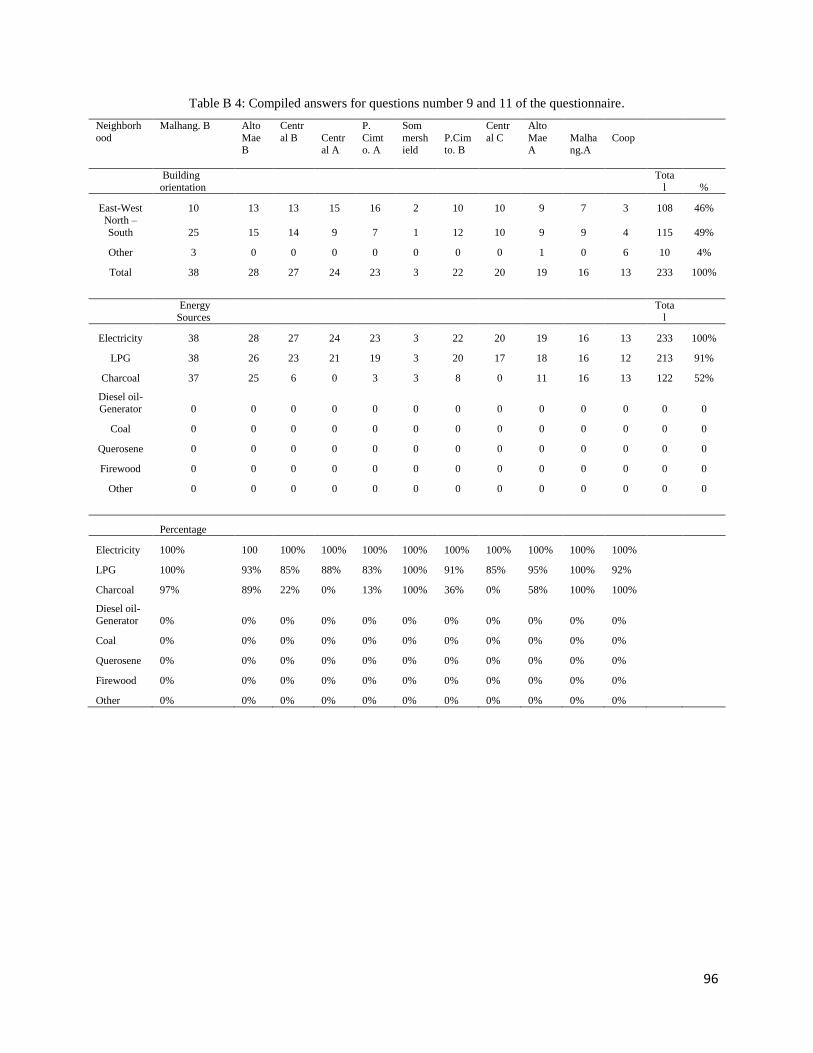
96
Table B 4: Compiled answers for questions number 9 and 11 of the questionnaire.
Neighborh
ood
Malhang. B
Alto
Mae B
Centr
al B
Central A
P.
Cimto. A
Som
mershield
P.Cimto. B
Centr
al C
Alto
Mae A
Malhang.A
Coop
Building orientation
Total %
East-West 10 13 13 15 16 2 10 10 9 7 3 108 46% North –
South 25 15 14 9 7 1 12 10 9 9 4 115 49%
Other 3 0 0 0 0 0 0 0 1 0 6 10 4%
Total 38 28 27 24 23 3 22 20 19 16 13 233 100%
Energy Sources
Total
Electricity 38 28 27 24 23 3 22 20 19 16 13 233 100%
LPG 38 26 23 21 19 3 20 17 18 16 12 213 91%
Charcoal 37 25 6 0 3 3 8 0 11 16 13 122 52%
Diesel oil- Generator 0 0 0 0 0 0 0 0 0 0 0 0 0
Coal 0 0 0 0 0 0 0 0 0 0 0 0 0
Querosene 0 0 0 0 0 0 0 0 0 0 0 0 0
Firewood 0 0 0 0 0 0 0 0 0 0 0 0 0
Other 0 0 0 0 0 0 0 0 0 0 0 0 0
Percentage
Electricity 100% 100 100% 100% 100% 100% 100% 100% 100% 100% 100%
LPG 100% 93% 85% 88% 83% 100% 91% 85% 95% 100% 92%
Charcoal 97% 89% 22% 0% 13% 100% 36% 0% 58% 100% 100%
Diesel oil- Generator 0% 0% 0% 0% 0% 0% 0% 0% 0% 0% 0%
Coal 0% 0% 0% 0% 0% 0% 0% 0% 0% 0% 0%
Querosene 0% 0% 0% 0% 0% 0% 0% 0% 0% 0% 0%
Firewood 0% 0% 0% 0% 0% 0% 0% 0% 0% 0% 0%
Other 0% 0% 0% 0% 0% 0% 0% 0% 0% 0% 0%

97
Table B 5: Compiled answers for question number 14a of the questionnaire.
Neighbor
hood
Malha
ng. B
Alto
Mae
B
Cent
ral B
Cent
ral A
P.
Cim
to.
A
Sommers
hield
P.Cim
to. B
Cent
ral C
Alto
Mae
A
Malhan
g.A
Coop
Age of the appliances
Tot
al
Aver
age
Freezers
4
7
6
5
5 3 9
5
13 3
4
65
6
CFL
1
3
1
1
1 1 2
1
4 1
1
15
1
Incandesc
ent
0
2
1
1
1 1 2
1
2 1
0
11
1
Televisio
ns
4
5
4
5
4 2 8
4
7 2
2
49
4
Electric
Geysers
1
4
3
5
4 4 8
5
2 1
8
44
4
Stoves
3
4
3
4
4 3 7
5
6 3
1
44
4
Kettles
2
4
2
1
2 1 4
2
7 1
1
28
3
Ironing
Machine
2
3
2
4
3 2 5
3
6 1
3
34
3
DVD
4
4
3
3
4 3 5
2
7 1
2
39
4
Air
conditioni
ng
2
2
3
1
4 3 8
4
10 3
3
43
4
Fans
2
3
3
2
2 5 7
4
12 1
2
42
4
Microwav
e
2
3
3
3
2 2 5
3
8 2
2
34
3
Refrigerat
or
5
6
6
9
3 4 11
7
12 4
5
71
6
Sound
amplifiers
3
4
4
2
6 3 4
4
14 2
2
48
4
Radios
3
6
5
9
2 6 9
5
4 1
3
53
5
Electric
space
heaters
1
1
1
2
1 2 8
1
2 0
5
23
2
Other
- - -
- -
-
- -
Computer
s
3
4
3
2
3 2 5
6
9 2
2
40
4
Toasters
1
4
2
2
2 2 6
3
10 3
1
36
3

98
Table B 6: Compiled answers for question number 14b of the questionnaire.
Neighbor
hood
Malha
ng. B
Al
to
M
ae
B
Cent
ral B
Cent
ral A
P.
Cim
to.
A
Sommers
hield
P.Ci
mto.
B
Cent
ral C
Al
to
M
ae
A
Malhan
g.A
C
oo
p
Time that the appliances remain turned on per day.
Tota
l
Aver
age
Freezers 16 16 16 16 16 16 16 16 16 16 16 176 16
CFL 9 8 10 13 8 9 8 10 6 12 9 102 9
Incandesc
ent 9 8 5 10 5 6 7 8 5 12 5 81 7
Televisio
ns 10 6 10 16 9 14 7 11 3 8 8 102 9
Electric
Geysers 4 1 20 18 11 24 13 27 1 7 19 144 13
Stoves 4 2 3 2 2 7 3 3 1 4 1 32 3
Kettles 1 1 1 1 1 0 1 1 1 0 0 8 1
Ironing
Machine 2 1 1 1 2 2 1 1 1 3 1 15 1
DVD 5 3 3 3 3 3 2 4 3 3 1 34 3
Air
condition
ing 10 3 9 10 7 11 7 8 4 16 4 88 8
Fans 8 4 7 3 10 0 4 8 3 15 2 64 6
Microwa
ve 1 1 0 1 0 0 1 1 1 2 0 9 1
Refrigera
tor 16 16 16 24 16 16 16 16 16 16 16 176 16
Sound
amplifier
s 4 3 4 1 7 3 2 6 6 3 0 39 4
Radios 4 4 3 5 7 4 4 4 1 5 0 40 4
Electric
space
heaters 1 0 2 1 5 1 3 0 0 1 0 14 1
Other
appliance
s
0 0 0 0 0 0 0 0 0
Computer
s 5 5 7 1 7 3 3 9 3 4 1 47 4
Toasters 1 1 2 2 2 5 2 10 2 4 0 30 3

99
Table B 7: Compiled answers for question number 14c (i) of the questionnaire.
Neigh
borhoo
d
Malhan
g. B
Alto
Mae B
Central
B
Central
A
P.
Cimto.
A
Sommer
shield
P.Cimt
o. B
Central
C
Alto
Mae A
Malhan
g.A
Coop
Total Energy consumption of the appliances for type 2 apartment block.
Total
Averag
e
Freeze
rs
5,600
6,560
17,009
3,360
5,866
-
3,744
3,040
3,840
9,226
2,048
60,295
6,029
CFL
3,625 707
4,372 9,120
1,128 - 2,737 1,420
848 4,540
2,419
30,916 3,092
Incad.
2,440 1,665
2,804 1,800
3,276 - 4,880 2,086
2,700 3,800
1,710
27,161 2,716
TV
1,185 1,221
3,111 2,610
2,350 - 2,652 2,741
863 6,440
1,898
25,071 2,507
Geyser
12,000 1,500
76,357 12,000
28,750 - 21,350 57,000 - -
30,120
239,077 29,885
Stoves
10,900 4,375
7,786 8,000
2,667 - 7,600 9,900 - 9,333 -
60,561 7,570
Kettles
419 835
2,005 1,343
963 - 974 2,435
1,300 667
679
11,619 1,162
Iron.
3,650 830
1,235 981
1,038 - 540 1,786
788 3,200
1,460
15,508 1,551
DVD
175 50
519 90
71 - 99 194
97 85
8
1,387 139
AC - -
44,000 18,800
17,500 - 23,100 10,400
10,400 40,300
3,450
167,950 20,994
Fans
2,060 452
1,200 965
1,950 - 380 1,053
387 1,747
5
10,198 1,020
Micro
wave
2,200 1,688
672 1,500
419 - 863 650
1,075 2,067
129
11,262 1,126
Refrig.
5,333 3,787 36,016 2,240 5,680 - 3,960 2,480 3,040 5,680 2,880 71,096 7,110
Sound
amplif.
111 183
2,295 -
90 - 137 2,550
130 175
2
5,673 630
Radios
106 381
108 407
1,800 - 130 200
80 -
7
3,219 358
heaters - 750
- 2,000 - - 7,750 13 - 4,200 -
14,713 2,943
Other
Comp.
3,300 974
2,633 -
1,930 - 1,337 813
467 2,200
121
13,774 1,530
Toast.
2,700 250
2,965 -
253 - 865 6,000
250 5,000
85
18,368 2,041
Total
w/h/da
y
40,478.
00
17,213.0
0
114,56
2.38
41,911.
25
44,457.
62
-
54,465.
94
53,421.
90
13,026.
25
75,113.
33
47,019.9
7
501,669.
66
50,166.
97
Total
Kwh/d
ay
40,478 17,213
114,56
2
41,911 44,458 - 54,466 53,422 13,026 75,113 47,020 501,670 50,167
Cost
per
kWh
40 17 115 42 44 - 54 53 13 75 28 483 48
Daily
cost
3 3 3 3 3 - 3 3 3 3 3 30 3
Month
ly cost
130 55 339 127 133 - 163 154 38 217 85 1,441 144
Total
annual
cost
3,886 1,652 10,176 3,803 3,990 - 4,885 4,632 1,129 6,512 2,559 43,225 4,322
kWh/y
ear
6,631 19,829 122,11
4
45,635 47,878 - 58,621 55,580 13,553 78,148 30,710 518,698 51,870

100
Table B 8: Compiled answers for question number 14c (ii) of the questionnaire.
Neigh
borho
od
Malhan
g. B
Alto
Mae B
Central
B
Central
A
P.
Cimto.
A
Somme
rshield
P.Cimt
o. B
Central
C
Alto
Mae A
Malhan
g.A
Coop
Total Energy consumption of the appliances for type 2 apartment block
Total
Averag
e
Freez
ers
7,093
7,027
7,456
3,120
3,952
-
2,942
2,936
2,800
11,936
2,120
51,383
5,138
CFL
2,720 580
4,654
6,090
1,257 - 1,105 2,449
1,171
5,112
2,624
27,762 2,776
Incan
3,709 1,479
3,408
3,641
6,768 - 2,133 1,800
1,100
4,620
1,861
30,519 3,052
TV
6,300 1,562
4,138
13,884
5,599 - 1,804 5,912
1,223
8,914
2,199
51,535 5,154
Geyse
rs
17,338 1,044
46,933
44,160
32,700 - 28,240 53,600
3,500
34,500
63,000
325,015 32,502
Stove
s
14,996 3,171
31,300
3,508
6,690 - 6,400 8,833
7,250
11,920
5,600
99,668 9,967
Kettle
486 1,023
863
990
984 - 908 1,704
1,280
745
625
9,607 961
Iron.
4,038 506
1,985
962
1,960 - 934 2,017
893
9,520
1,591
24,407 2,441
DVD
239 116
149
96
2,250 - 78 127
158
129
81
3,423 342
AC.
77,440 3,800
82,963
58,608
42,544 - 25,484 29,095
6,200
57,450
1,350
384,935 38,493
Fans
1,643 589
3,260
223
500 - 840 920
663
4,090
231
12,959 1,296
Micro
wave
1,867 1,565
818
757
296 - 647 1,084
1,200
3,440
952
12,625 1,263
Refrig
10,560
5,017
8,360
3,947
6,333
-
4,889
3,337
4,200
6,432
1,947
55,022
5,502
Sound
ampli
f
202 143
849
364
800 - 165 828
840
185
51
4,427 443
Radio
162 552
205
550
54 - 270 240
150
720
87
2,990 299
heater
- -
8,000
4,000
30,000 - 6,000 - - -
600
48,600 9,720
Other
- - -
-
- - - - - - -
Comp
.
3,328 817
4,483
536
5,428 - 3,649 2,975
527
3,475
64
25,282 2,528
Toast.
2,525 120
954
4,220
2,832 - 1,278 888
513
3,100
139
16,567 1,657
Total
W/h/d
ay
106,384
19,250
136,861
102,895
93,772
-
64,311
60,111
15,509
121,29
3
51,453
771,839
77,184
kWh/
day
106
19
137
103
94
-
64
60
16
121
51
772
77
Cost/
kWh
3
3
3
3
3
-
3
3
3
3
3
29
3
daily
cost
333
60
397
303
271
-
186
174
45
351
149
2,268
227
Mont
hly
cost
9,992
1,803
11,925
9,091
8,130
-
5,576
5,212
1,345
10,516
4,461
68,050
6,805

101
Annu
al
cost
119,908
21,635
143,100
109,091
97,560
-
66,909
62,539
16,136
126,19
3
53,532
816,604
81,660
kWh
per
year
38,298
6,930
49,270
37,042
33,758
-
23,152
21,640
5,583
43,665
18,523
277,862
27,786

102
Table B 9: Compiled answers for question number 14c (iii) of the questionnaire.
Neighbor
hood
Malhan
g. B
Alto
Mae B
Central
B
Central
A
P.
Cimto.
A
Somme
rshield
P.Cimt
o. B
Central
C
Alto
Mae A
Malha
ng.A
Coop
Total Energy consumption of the appliances for type 2 conventional houses. Total
Averag
e
Freezers 8,411 4,000
- -
- - - -
-
8,766 -
21,177 7,059
CFL
2,880 412
- -
- - - -
-
6,188 -
9,480
3,160
Incandesc
ent
2,800 880
- -
- - - -
-
4,370 -
8,050
2,683
Televisio
ns
3,071 1,487
- -
- - - -
-
6,247 -
10,805
3,602
Electric
Geysers
8,433 -
- -
- - - -
-
9,150 -
17,583
8,792
Stoves
8,811 3,125
- -
- - - -
-
9,189 -
21,126
7,042
Kettles
464 1,933
- -
- - - -
-
763 -
3,161
1,054
Ironing
Machine
2,370 825
- -
- - - -
-
6,466 -
9,661
3,220
DVD
228 75
- -
- - - -
-
100 -
403
134
Air
condit.
24,940 -
- -
- - - -
-
25,880 -
50,820
25,410
Fans
1,829 720
- -
- - - -
-
4,995 -
7,544
2,515
Microwa
ve
900 -
- -
- - - -
-
3,650 -
4,550
2,275
Refrigera
tor
6,331 3,467
- -
- - - -
-
9,280 -
19,078
6,359
Sound
amplifier
s
151 90
- -
- - - -
-
132 -
373
124
Radios
170 720
- -
- - - -
-
80 -
970
323
Electric
space
heaters
- 500
- -
- - - -
-
- -
500
500
Other appliances
-
- -
Computer
s
1,640 1,375
- -
- - - -
-
3,677 -
6,692
2,231
Toasters
- -
- -
- - - -
-
2,267 -
2,267
2,267
Total
W/h/day
49,602
14,519
-
-
-
-
-
-
-
78,104
-
142,225
47,408
Total
kWh/day
49.60
14.52
-
-
-
-
-
-
-
78.10
-
142.23
47.41
Cost per
kWh
3.11
3.20
-
-
-
-
-
-
-
2.89
-
9.20
3.07
Total
daily cost
156.15
46.46
-
-
-
-
-
-
-
225.72
-
428.33
142.78
Monthly
cost
4,684
1,394
-
-
-
-
-
-
-
6,772
-
12,850
4,283
Total
annual
cost
56,214
16,726
-
-
-
-
-
-
-
81,259
-
154,199
51,400
kWh per
year
17,857
5,227
-
-
-
-
-
-
-
28,117
-
51,201
17,067
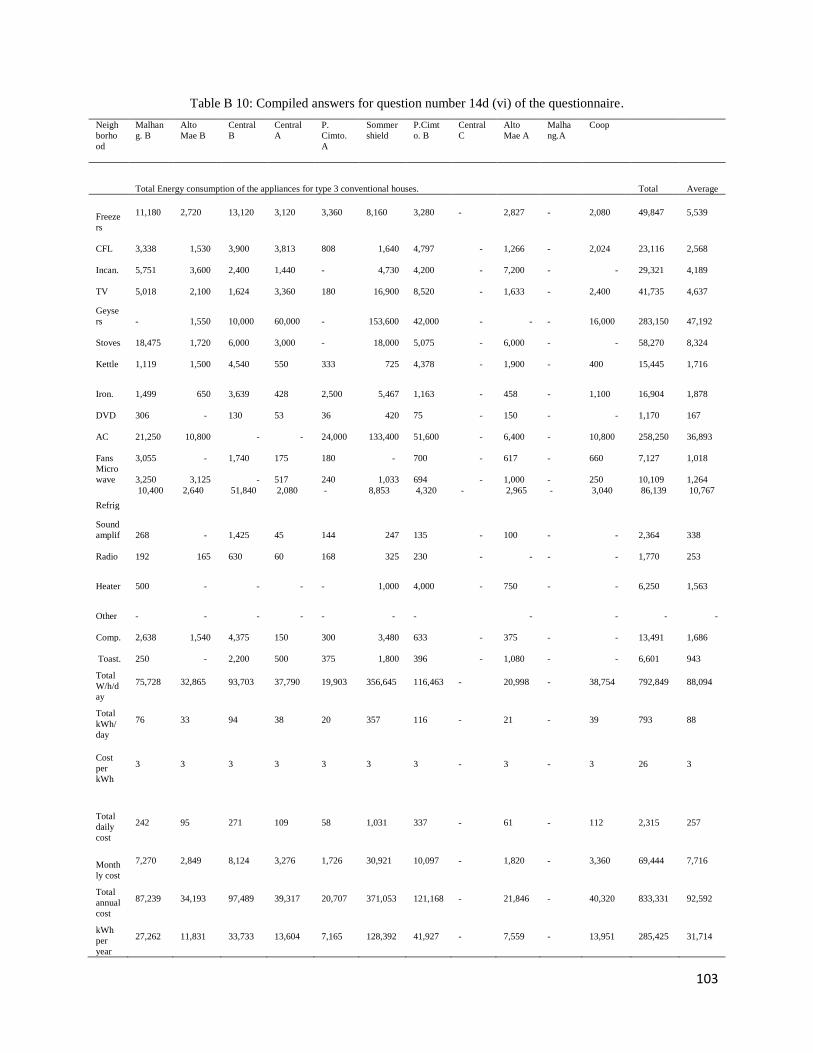
103
Table B 10: Compiled answers for question number 14d (vi) of the questionnaire.
Neigh
borho
od
Malhan
g. B
Alto
Mae B
Central
B
Central
A
P.
Cimto.
A
Sommer
shield
P.Cimt
o. B
Central
C
Alto
Mae A
Malha
ng.A
Coop
Total Energy consumption of the appliances for type 3 conventional houses. Total Average
Freeze
rs
11,180
2,720
13,120
3,120
3,360
8,160
3,280
-
2,827
-
2,080
49,847
5,539
CFL
3,338 1,530
3,900
3,813
808 1,640
4,797 -
1,266
-
2,024
23,116
2,568
Incan.
5,751 3,600
2,400
1,440
- 4,730
4,200 -
7,200
- -
29,321
4,189
TV
5,018 2,100
1,624
3,360
180 16,900
8,520 -
1,633
-
2,400
41,735
4,637
Geyse
rs
- 1,550
10,000
60,000
- 153,600
42,000 - -
-
16,000
283,150
47,192
Stoves
18,475 1,720
6,000
3,000
- 18,000
5,075 -
6,000
- -
58,270
8,324
Kettle
1,119 1,500
4,540
550
333 725
4,378 -
1,900
-
400
15,445
1,716
Iron.
1,499 650
3,639
428
2,500 5,467
1,163 -
458
-
1,100
16,904
1,878
DVD
306 -
130
53
36 420
75 -
150
- -
1,170
167
AC
21,250 10,800 - -
24,000 133,400
51,600 -
6,400
-
10,800
258,250
36,893
Fans
3,055 -
1,740
175
180 -
700 -
617
-
660
7,127
1,018
Micro
wave
3,250 3,125 -
517
240 1,033
694 -
1,000
-
250
10,109
1,264
Refrig
10,400 2,640 51,840 2,080 - 8,853 4,320 - 2,965 - 3,040 86,139 10,767
Sound
amplif
268 -
1,425
45
144 247
135 -
100
- -
2,364
338
Radio
192 165
630
60
168 325
230 - -
- -
1,770
253
Heater
500 - - -
- 1,000
4,000 -
750
- -
6,250
1,563
Other
- - - -
- -
-
-
- - -
Comp.
2,638 1,540
4,375
150
300 3,480
633 -
375
- -
13,491
1,686
Toast.
250 -
2,200
500
375 1,800
396 -
1,080
- -
6,601
943
Total
W/h/d
ay
75,728
32,865
93,703
37,790
19,903
356,645
116,463
-
20,998
-
38,754
792,849
88,094
Total
kWh/
day
76
33
94
38
20
357
116
-
21
-
39
793
88
Cost
per
kWh
3
3
3
3
3
3
3
-
3
-
3
26
3
Total
daily
cost
242
95
271
109
58
1,031
337
-
61
-
112
2,315
257
Month
ly cost
7,270
2,849
8,124
3,276
1,726
30,921
10,097
-
1,820
-
3,360
69,444
7,716
Total
annual
cost
87,239
34,193
97,489
39,317
20,707
371,053
121,168
-
21,846
-
40,320
833,331
92,592
kWh
per
year
27,262
11,831
33,733
13,604
7,165
128,392
41,927
-
7,559
-
13,951
285,425
31,714
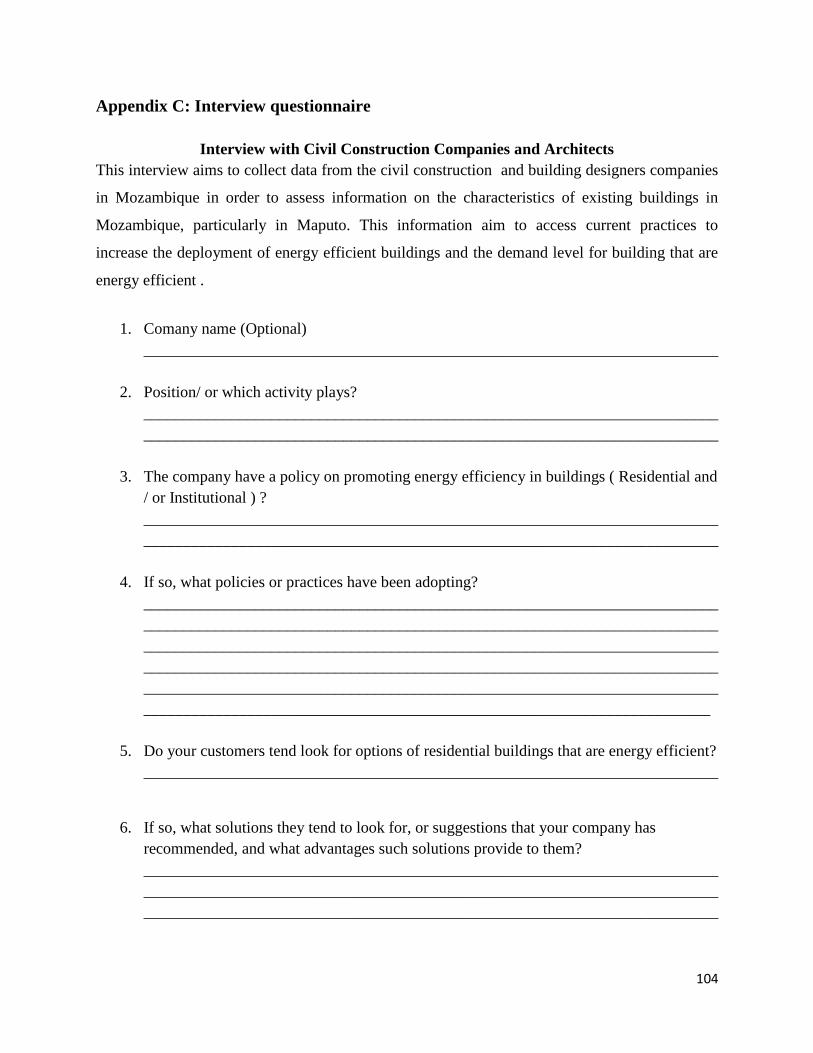
104
Appendix C: Interview questionnaire
Interview with Civil Construction Companies and Architects
This interview aims to collect data from the civil construction and building designers companies
in Mozambique in order to assess information on the characteristics of existing buildings in
Mozambique, particularly in Maputo. This information aim to access current practices to
increase the deployment of energy efficient buildings and the demand level for building that are
energy efficient .
1. Comany name (Optional)
________________________________________________________________________
2. Position/ or which activity plays?
________________________________________________________________________
________________________________________________________________________
3. The company have a policy on promoting energy efficiency in buildings ( Residential and
/ or Institutional ) ?
________________________________________________________________________
________________________________________________________________________
4. If so, what policies or practices have been adopting?
________________________________________________________________________
________________________________________________________________________
________________________________________________________________________
________________________________________________________________________
________________________________________________________________________
_______________________________________________________________________
5. Do your customers tend look for options of residential buildings that are energy efficient?
________________________________________________________________________
6. If so, what solutions they tend to look for, or suggestions that your company has
recommended, and what advantages such solutions provide to them?
________________________________________________________________________
________________________________________________________________________
________________________________________________________________________
105
7. In your view , what reasons motivate or discourage potential customers to opt for such
solutions?
________________________________________________________________________
________________________________________________________________________
________________________________________________________________________
8. What suggestions would you popularize to promote the construction of residential
buildings that are energy efficient?
________________________________________________________________________
________________________________________________________________________
________________________________________________________________________
9. Do you think that, in our economic reality there are practical conditions for such
massification ?
________________________________________________________________________
10. If so , what factors would compete for this?
________________________________________________________________________
________________________________________________________________________
________________________________________________________________________
________________________________________________________________________
Thank you for your answers

106
Appendix D: LCC calculation of the type 2 and 3 houses
Table D 1: Estimation cost for acquiring the appliances.
Type of
appliances H1* H2* H3* Total cost H4* H5* H6* Total cost
Freezers 378 1
30,000.00
30,000.00 300 1
35,000.00
35,000.00
CFL 39 11
106.00
1,166.00 32 12
150.00
1,800.00
Incandes. 0 0
-
- 0 0
- -
TV 196 2
5,000.00
10,000.00 166 3
7,000.00
21,000.00
Geysers 1653 1
7,000.00
7,000.00 2357 1
5,000.00
5,000.00
Stoves 1757 1
10,000.00
10,000.00 2945 1
8,000.00
8,000.00
Kettles 1526 1
1,500.00
1,500.00 1513 1
1,500.00
1,500.00
Ironing 1162 1
1,500.00
1,500.00 1142 1
1,500.00
1,500.00
DVD 48 1
2,000.00
2,000.00 38 1
2,500.00
2,500.00
AC 1703 1
10,000.00
10,000.00 1699 2
10,000.00
20,000.00
Fans 120 2
1,000.00
2,000.00 102 2
1,500.00
3,000.00
Microwav 1411 1
5,000.00
5,000.00 1261 1
5,000.00
5,000.00
Refriger. 414 1
7,000.00
7,000.00 581 1
7,000.00
7,000.00
Sound
amplifiers 52 1
6,000.00
6,000.00 96 1
5,000.00
5,000.00
Radios 49 1
1,000.00
1,000.00 67 1
700.00
700.00
Heaters 1370 1
10,000.00
10,000.00 2175 1
10,000.00
10,000.00
Other -
- - -
Computer 513 1
15,000.00
15,000.00 419 1
18,000.00
18,000.00
Toaster 505 1
2,000.00
2,000.00 723 1
2,000.00
2,000.00
Total cost
121,166.00
147,000.00
*Note: H1= power capacity (type 2 house), H2= type 2 house (appliances quantity), H3= estimated cost, H4= power capacity (type 3 house), H5=
type 3 house (appliances quantity), H6= estimated costs.

107
a) Data Summary
Table D 2: LCC of type 2 houses.
Item Description of the Costs (1) Estimated Cost at
the reference Point
(2)
Discount Factor (3) Present Value (4) =
(2)x(3)
1 Initial Investment for house Acqusition 2,243,392.86
equal to the initial
investment 2,243,392.86
2 Initial Investment for Appliances 121,166.00
equal to the initial
investment 121,166.00
3 Total Initial Investment 2,364,558.86 - 2,364,558.86
4
Apliances Replacement 1(constant
escalation rate of 2.6%) 121,166.00
6.96
842,723.33
5
Apliances Replacement 2 (constant
escalation rate of 2.6%) 121,166.00
10.42
1,262,706.39
6
Appliances Replacement 3(constant
escalation rate of 2.6%) 121,166.00
12.15
1,472,010.87
7
Appliances Replacement 4(constant
escalation rate of 2.6%) 121,166.00
13.01
1,576,320.71
8
Annual Electricity bill: 17,160.39kWh at
3.03MT/kWh ( considering an escalation
rate of 9.8% during the first 6 years) 51,995.98 5.96 309,996.59
9
Annual Electricity bill: 17,160.39kWh at
5.31*MT/kWh (constant price during the
remaining 44 years) 91,121.67 9.85 897,465.42
10
Maintenance cost (constant escalation
rate of 2.6%) 11,979.37 13.44 160,986.32
11 Residual Value (172,617.81) 0.01 (1,470.45)
12 Total LCC (MT)
8,885,298.02
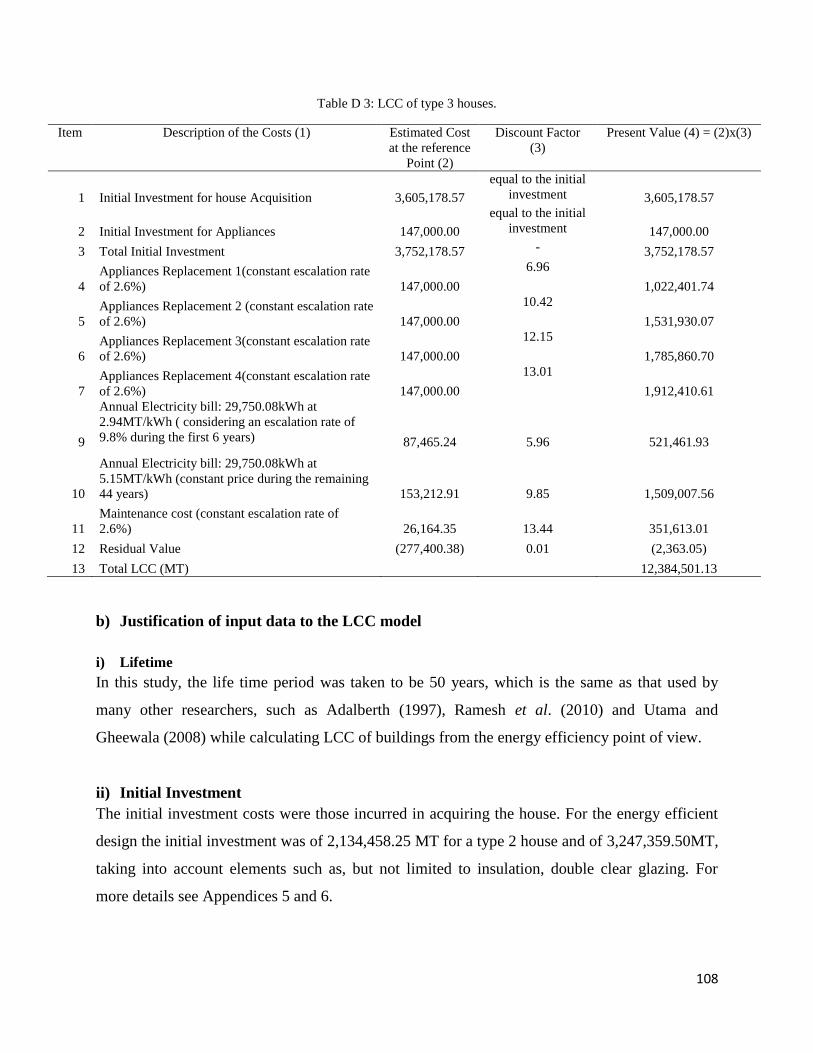
108
Table D 3: LCC of type 3 houses.
Item Description of the Costs (1) Estimated Cost
at the reference
Point (2)
Discount Factor
(3)
Present Value (4) = (2)x(3)
1 Initial Investment for house Acquisition 3,605,178.57
equal to the initial
investment 3,605,178.57
2 Initial Investment for Appliances 147,000.00
equal to the initial
investment 147,000.00
3 Total Initial Investment 3,752,178.57 - 3,752,178.57
4
Appliances Replacement 1(constant escalation rate
of 2.6%) 147,000.00
6.96
1,022,401.74
5
Appliances Replacement 2 (constant escalation rate
of 2.6%) 147,000.00
10.42
1,531,930.07
6
Appliances Replacement 3(constant escalation rate
of 2.6%) 147,000.00
12.15
1,785,860.70
7
Appliances Replacement 4(constant escalation rate
of 2.6%) 147,000.00
13.01
1,912,410.61
9
Annual Electricity bill: 29,750.08kWh at
2.94MT/kWh ( considering an escalation rate of
9.8% during the first 6 years) 87,465.24 5.96 521,461.93
10
Annual Electricity bill: 29,750.08kWh at
5.15MT/kWh (constant price during the remaining
44 years) 153,212.91 9.85 1,509,007.56
11
Maintenance cost (constant escalation rate of
2.6%) 26,164.35 13.44 351,613.01
12 Residual Value (277,400.38) 0.01 (2,363.05)
13 Total LCC (MT)
12,384,501.13
b) Justification of input data to the LCC model
i) Lifetime
In this study, the life time period was taken to be 50 years, which is the same as that used by
many other researchers, such as Adalberth (1997), Ramesh et al. (2010) and Utama and
Gheewala (2008) while calculating LCC of buildings from the energy efficiency point of view.
ii) Initial Investment
The initial investment costs were those incurred in acquiring the house. For the energy efficient
design the initial investment was of 2,134,458.25 MT for a type 2 house and of 3,247,359.50MT,
taking into account elements such as, but not limited to insulation, double clear glazing. For
more details see Appendices 5 and 6.

109
iii) Operating costs
The operating costs in this thesis are the energy related costs that the household spends during
the building lifespan. Despite the fact that, these household energy costs include electricity, LPG
and charcoal, for the purpose of this analysis only electricity costs wasconsidered, since they
represent their most significant energy cost. The same assumption was considered to estimate the
operating costs for the energy efficient designs, for that the research considered the appliances
power capacity that company C suggested to be energy efficient (see table4.12). Moreover, this
data was combined with what company A?, indicated to be satisfactory in terms of indoor
thermal comfort when the suggested estrategies to improve the building energy efficieny are
taken into account. It is worth to note that, as stated by company A?, the requirements for air
condidioning and heaters for indoor thermal comfort reduces dramatically. Meaning that its
usage may be reduced to only few periods of the year.
iv) Maintenance costs
The maintenance cost is the annual cost of maintaining the building during its useful time, in
order to preserve its functionalities. The assumption is that these costs vary throughout the life
time of the building, in a constant escalating rate. In the case of energy efficient designs this
research used an annual cost of 2% of the initial investment, based on what company D,
estimated as maintenance costs for the houses in reference.
v) Discount rate
From the finance point of view, there are two different types of finance costs that a particular
household could consider while evaluating the benefits of certain financial decision. The first
discount rate is that, which banks charge their costumers when borrowing money from them.
Additionally, investors could also make the decision based on the opportunity cost of buying a
house in detriment of saving the money in financial institutions and earn principal interest (Lutz
et al., 2006). In this case it represents the opportunity cost, which should yield at least the
equivalent interest rate of the profitability of current financial applications with little risk. In this
view, this study considered the opportunity cost based on the average tax that commercial banks
from Mozambique were paying for their customers who were interested in saving their financial
resources, which is of around 10%.
110
vi) Escalation Rate
While evaluating future cost, it is important to know that there are many uncertainities that may
happen in the future, so, in order to lessen its impact on the results, a correctional factor was
considered. In the case of operating costs, they are usually affected by the government decisions,
since up until now it is the goverment who regulates the electricity sector. So, in order to
approximate this cost to the reality, this studyusedthe energy price escalation price suggested by
a study conducted by EDM (2012b), which indicates a constant escalation rate of 9.8% from
2015 until 2020 (6 years), and from there on the prices will stabilise.. However, it should be
noted that this price aggravation is yet to approved by the parliament. On the other hand,
maintenance costs should also be updated year to year, so the maintenance costs escalation rate
was based on the inflation rate of 2.6%. This corresponds to the average of the country’s
inflation rate during 2014. The study considered inflation rate because it affects the prices of
goods and services that are part of the costs of the household maintenance expenditures.
vii) Residual Value
The residual value constitutes the market value of the building after its expected useful life. To
calculate the residual value of the buildings under analysis, the amortization method at constant
rates was applied, with a rate of 5%during the lifetime of the building. This rate was based on
what civil engineers indicated to be the annual average tax of the buildings degradation.
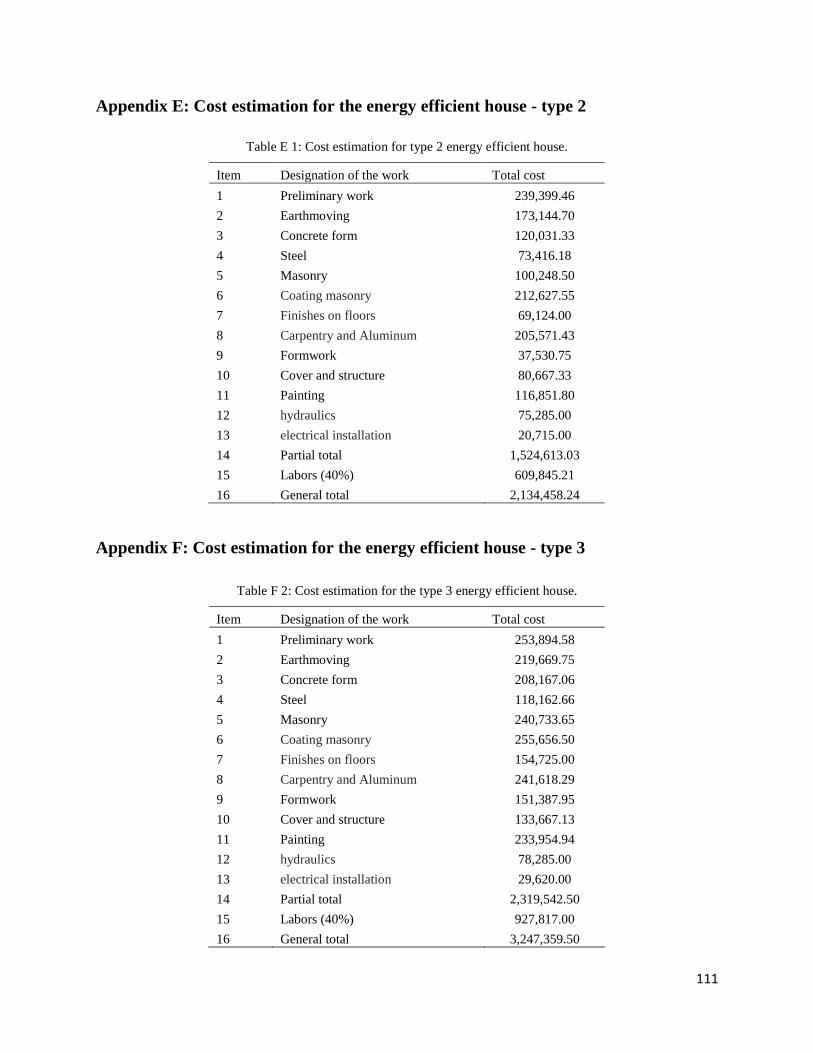
111
Appendix E: Cost estimation for the energy efficient house - type 2
Table E 1: Cost estimation for type 2 energy efficient house.
Item Designation of the work Total cost
1 Preliminary work 239,399.46
2 Earthmoving 173,144.70
3 Concrete form 120,031.33
4 Steel 73,416.18
5 Masonry 100,248.50
6 Coating masonry 212,627.55
7 Finishes on floors 69,124.00
8 Carpentry and Aluminum 205,571.43
9 Formwork 37,530.75
10 Cover and structure 80,667.33
11 Painting 116,851.80
12 hydraulics 75,285.00
13 electrical installation 20,715.00
14 Partial total 1,524,613.03
15 Labors (40%) 609,845.21
16 General total 2,134,458.24
Appendix F: Cost estimation for the energy efficient house - type 3
Table F 2: Cost estimation for the type 3 energy efficient house.
Item Designation of the work Total cost
1 Preliminary work 253,894.58
2 Earthmoving 219,669.75
3 Concrete form 208,167.06
4 Steel 118,162.66
5 Masonry 240,733.65
6 Coating masonry 255,656.50
7 Finishes on floors 154,725.00
8 Carpentry and Aluminum 241,618.29
9 Formwork 151,387.95
10 Cover and structure 133,667.13
11 Painting 233,954.94
12 hydraulics 78,285.00
13 electrical installation 29,620.00
14 Partial total 2,319,542.50
15 Labors (40%) 927,817.00
16 General total 3,247,359.50

112
Appendix G: LCC calculation for type 2 and 3 houses – Considering 50%
improvements over appliances power capacity
Table G 3: LCC of type 2 house, considering 50% improvements over appliances power capacity.
Item Description of the Costs (1) Estimated Cost at the
reference Point (2)
Discount Factor
(3)
Present Value (4)
= (2)x(3)
1
Initial Investment for house Acquisition
2,243,392.86
equal to the
initial
investment
2,243,392.86
2
Initial Investment for Appliances
181,749.00
equal to the
initial
investment
181,749.00
3
Total Initial Investment
2,425,141.86
- 2,425,141.86
4
Appliances Replacement 1(constant
escalation rate of 2.6%)
181,749.00
6.96 1,264,973.04
5
Appliances Replacement 2 (constant
escalation rate of 2.6%)
181,749.00
10.42
1,893,824.58
6
Appliances Replacement 3(constant
escalation rate of 2.6%)
181,749.00
12.15 2,208,250.35
7
Appliances Replacement 4(constant
escalation rate of 2.6%)
181,749.00
13.01 2,364,554.49
8
Annual Electricity bill: 7,373.70kWh at
3.03MT/kWh ( considering an escalation
rate of 9.8% during the first 6 years)
22,342.31
5.96 133,203.38
9
Annual Electricity bill: 7,373.70kWh at
5.31*MT/kWh (constant price during the
remaining 44 years)
39,154.35
9.85
385,634.64
10
Maintenance cost (constant escalation rate
of 2.6%)
11,979.37
13.44
160,986.32
11
Residual Value
(172,617.81)
0.01
(1,470.45)
12 Total LCC (MT)
10,835,098.19
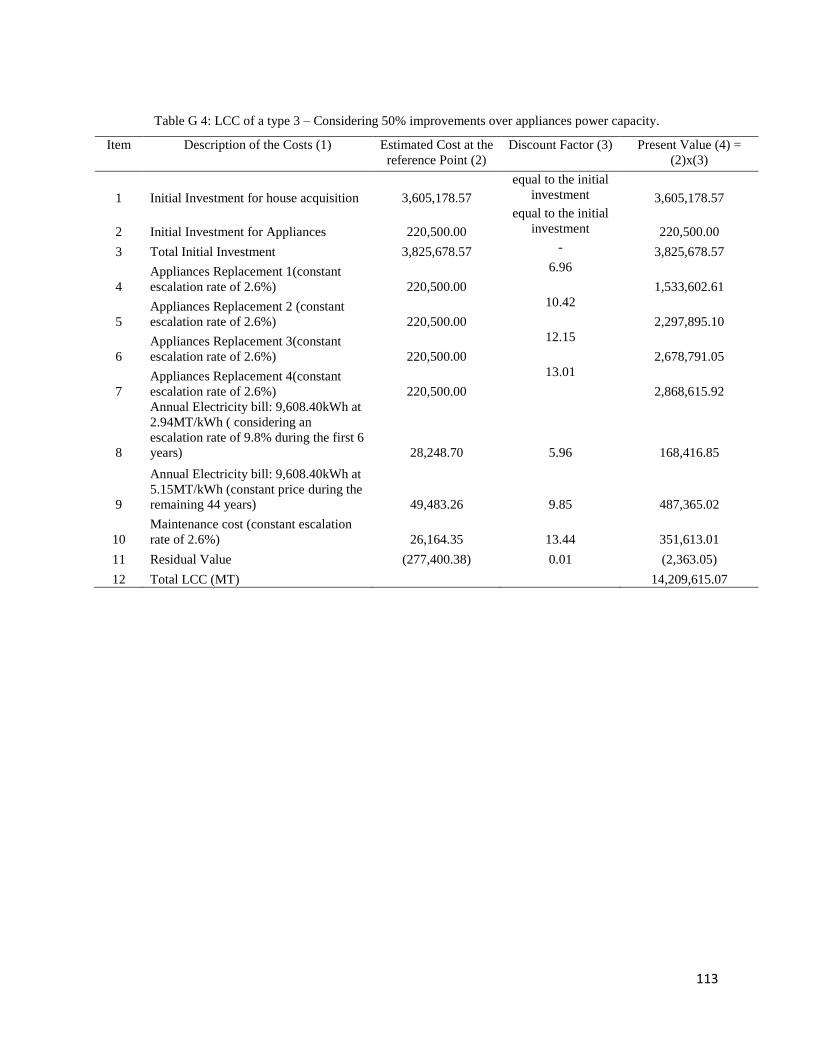
113
Table G 4: LCC of a type 3 – Considering 50% improvements over appliances power capacity.
Item Description of the Costs (1) Estimated Cost at the
reference Point (2)
Discount Factor (3) Present Value (4) =
(2)x(3)
1 Initial Investment for house acquisition 3,605,178.57
equal to the initial
investment 3,605,178.57
2 Initial Investment for Appliances 220,500.00
equal to the initial
investment 220,500.00
3 Total Initial Investment 3,825,678.57 - 3,825,678.57
4
Appliances Replacement 1(constant
escalation rate of 2.6%) 220,500.00
6.96
1,533,602.61
5
Appliances Replacement 2 (constant
escalation rate of 2.6%) 220,500.00
10.42
2,297,895.10
6
Appliances Replacement 3(constant
escalation rate of 2.6%) 220,500.00
12.15
2,678,791.05
7
Appliances Replacement 4(constant
escalation rate of 2.6%) 220,500.00
13.01
2,868,615.92
8
Annual Electricity bill: 9,608.40kWh at
2.94MT/kWh ( considering an
escalation rate of 9.8% during the first 6
years) 28,248.70 5.96 168,416.85
9
Annual Electricity bill: 9,608.40kWh at
5.15MT/kWh (constant price during the
remaining 44 years) 49,483.26 9.85 487,365.02
10
Maintenance cost (constant escalation
rate of 2.6%) 26,164.35 13.44 351,613.01
11 Residual Value (277,400.38) 0.01 (2,363.05)
12 Total LCC (MT)
14,209,615.07
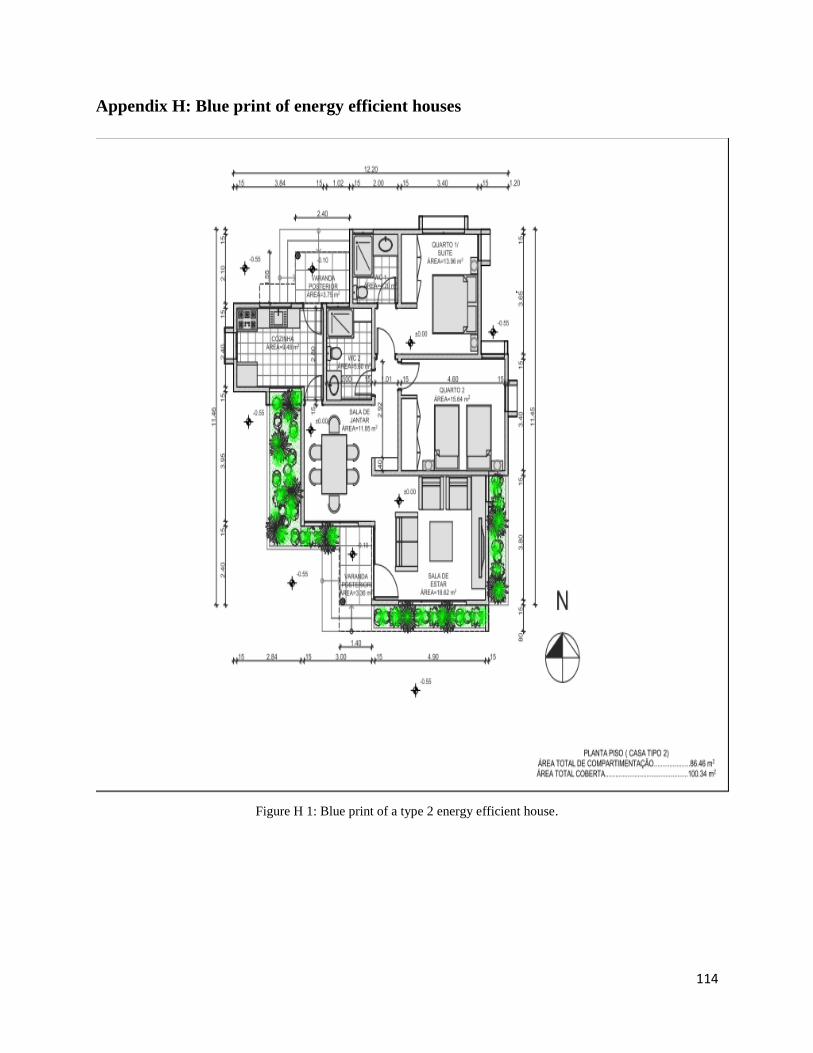
114
Appendix H: Blue print of energy efficient houses
Figure H 1: Blue print of a type 2 energy efficient house.

115
Figure H 2: Blue print of a type 3 energy efficient house.

116
Appendix I: LCC for the energy efficient house – excluding appliances
improvements
Table I 2: Data summary for LCC for type 2house that includes only building's envelope energy efficient.
Item Description of the Costs (1) Estimated Cost at
the reference Point
(2)
Discount Factor
(3)
Present Value (4) =
(2)x(3)
1 Initial Investment for house acquisition 2,134,458.25
equal to the initial
investment 2,134,458.25
2 Initial Investment for Appliances 121,166.00
equal to the initial
investment 121,166.00
3 Total Initial Investment 2,255,624.25 - 2,255,624.25
4
Appliances Replacement 1(constant
escalation rate of 2.6%) 121,166.00
6.96
842,723.33
5
Appliances Replacement 2 (constant
escalation rate of 2.6%) 121,166.00
10.42
1,262,706.39
6
Appliances Replacement 3(constant
escalation rate of 2.6%) 121,166.00
12.15
1,472,010.87
7
Appliances Replacement 4(constant
escalation rate of 2.6%) 121,166.00
13.01
1,576,320.71
8
Annual Electricity bill: 14,747kWh at
3.03MT/kWh ( considering an
escalation rate of 9.8% during the first
6 years) 44,683.41 5.96 266,399.53
9
Annual Electricity bill: 14,747kWh at
5.31*MT/kWh (constant price during
the remaining 44 years) 78,306.57 9.85 771,248.35
10
Maintenance cost (constant escalation
rate of 2.6%) 42,689.17 13.44 573,683.87
11 Residual Value (164,235.84) 0.01 (1,399.05)
12 Total LCC (MT)
9,019,318.24

117
Table I 3: Data summary for LCC for type 3 house that includes only building's envelope energy efficient.
Item Description of the Costs (1) Estimated Cost at
the reference Point
(2)
Discount Factor (3) Present Value (4) =
(2)x(3)
1 Initial Investment for house acquisition 3,247,359.50
equal to the initial
investment 3,247,359.50
2 Initial Investment for Appliances 147,000.00
equal to the initial
investment 147,000.00
3 Total Initial Investment 3,394,359.50 - 3,394,359.50
4
Appliances Replacement 1(constant
escalation rate of 2.6%) 147,000.00
6.96
1,022,401.74
5
Appliances Replacement 2 (constant
escalation rate of 2.6%) 147,000.00
10.42
1,531,930.07
6
Appliances Replacement 3(constant
escalation rate of 2.6%) 147,000.00
12.15
1,785,860.70
7
Appliances Replacement 4(constant
escalation rate of 2.6%) 147,000.00
13.01
1,912,410.61
8
Annual Electricity bill: 19,217kWh at
2.94MT/kWh ( considering an escalation
rate of 9.8% during the first 6 years) 56,497.98 5.96 336,837.21
9
Annual Electricity bill: 21,545kWh at
5.15MT/kWh (constant price during the
remaining 44 years) 98,967.55 9.85 974,740.18
10
Maintenance cost (constant escalation
rate of 2.6%) 64,947.19 13.44 872,801.23
11 Residual Value (249,868.00) 0.01 (2,128.51)
12 Total LCC (MT)
11,829,212.71

118
Appendix J: Energy consumption for energy efficient houses considering 50%
improvements over appliances
Table J 2: Energy consumption for energy efficient houses considering 50% improvements over appliances.
Type of
appliances
F1*
F2*
F3*
F4*
Operational
time
(h)
Suggested
time
(h)
F5*
(W/h)
F6*
(W)
Freezers 1 1 189.0 150.0 16 16
3,024.00
2,400.00
CFL 11 12 19.5 16.0 9 5 1,072.50 960.00
Incandescent 0 0 - - 0 0 - -
Televisions 2 3 98.0 83.0 9 9 1,764.00 2,241.00
Electric Geysers 1 1 826.5 1,178.5 13 2 1,653.00 2,357.00
Stoves 1 1 878.5 1,472.5 3 3 2,635.50 4,417.50
Kettles 1 1 763.0 756.5 1 1 763.00 756.50
Ironing Machine 1 1 581.0 571.0 1 1 581.00 571.00
DVD 1 1 24.0 19.0 3 3 72.00 57.00
Air conditioning 1 2 851.5 849.5 8 3 2,554.50 5,097.00
Fans 2 2 60.0 51.0 6 3 360.00 306.00
Microwave 1 1 705.5 630.5 1 1 705.50 630.50
Refrigerator 1 1 207.0 290.5 16 16 3,312.00 4,648.00
Sound amplifiers 1 1 26.0 48.0 4 4 104.00 192.00
Radios 1 1 24.5 33.5 4 4 98.00 134.00
Space heaters 1 1 685.0 1,087.5 1 0 - -
Other appliances 0 - -
Computers 1 1 256.5 209.5 4 4 1,026.00 838.00
Toasters 1 1 252.5 361.5 3 3 757.50 1,084.50
Total W/h/day
20,482.50
26,690.00
Total kW/h/day 23.44 29.92
Total Kwh/year
7,373.70
9,608.40
*Note: F1=Appliances Quantity in type 2 houses, F2=Appliances Quantity in type 3 houses, F3=Appliances Power Capacity in type 2 houses,
F4=Appliances Power Capacity in type 3 houses, F5=Total energy consumed for an energy efficient house - type 2, F6=Total energy consumed
for an energy efficient house - type 3.

119
Appendix K: Estimated cost for energy efficient appliances.
Table K 1: Estimated cost for energy efficient appliances.
Type of
appliance I1* I2* I3* Total cost I4* I5* I6* Total cost
Freezers 189 1
45,000.00 45,000.00 150 1 52,500.00 52,500.00
CFL 19.5 11
159.00 1,749.00 16 12 225.00 2,700.00
Incandescent 0 0
- - 0 0 - -
Televisions 98 2
7,500.00 15,000.00 83 3 10,500.00 31,500.00
Electric
Geysers 826.5 1
10,500.00 10,500.00 1178.5 1 7,500.00 7,500.00
Stoves 878.5 1
15,000.00 15,000.00 1472.5 1 12,000.00 12,000.00
Kettles 763 1
2,250.00 2,250.00 756.5 1 2,250.00 2,250.00
Ironing
Machine 581 1
2,250.00 2,250.00 571 1 2,250.00 2,250.00
DVD 24 1
3,000.00 3,000.00 19 1 3,750.00 3,750.00
Air
conditioning 851.5 1
15,000.00 15,000.00 849.5 2 15,000.00 30,000.00
Fans 60 2
1,500.00 3,000.00 51 2 2,250.00 4,500.00
Microwave 705.5 1
7,500.00 7,500.00 630.5 1 7,500.00 7,500.00
Refrigerator 207 1
10,500.00 10,500.00 290.5 1 10,500.00 10,500.00
Sound
amplifiers 26 1
9,000.00 9,000.00 48 1 7,500.00 7,500.00
Radios 24.5 1
1,500.00 1,500.00 33.5 1 1,050.00 1,050.00
Space heaters 685 1
15,000.00 15,000.00 1087.5 1 15,000.00 15,000.00
Other
appliances
- - - -
Computer 256.5 1
22,500.00 22,500.00 209.5 1 27,000.00 27,000.00
Toaster 252.5 1
3,000.00 3,000.00 361.5 1 3,000.00 3,000.00
Total cost 181,749.00 220,500.00
*Note: I1=power capacity (type 2 house), I2= type 2 house (appliances quantity), I3= estimated cost, I4= power capacity (type 3 house), I5= type
3 house (appliances quantity), I6= estimated costs.
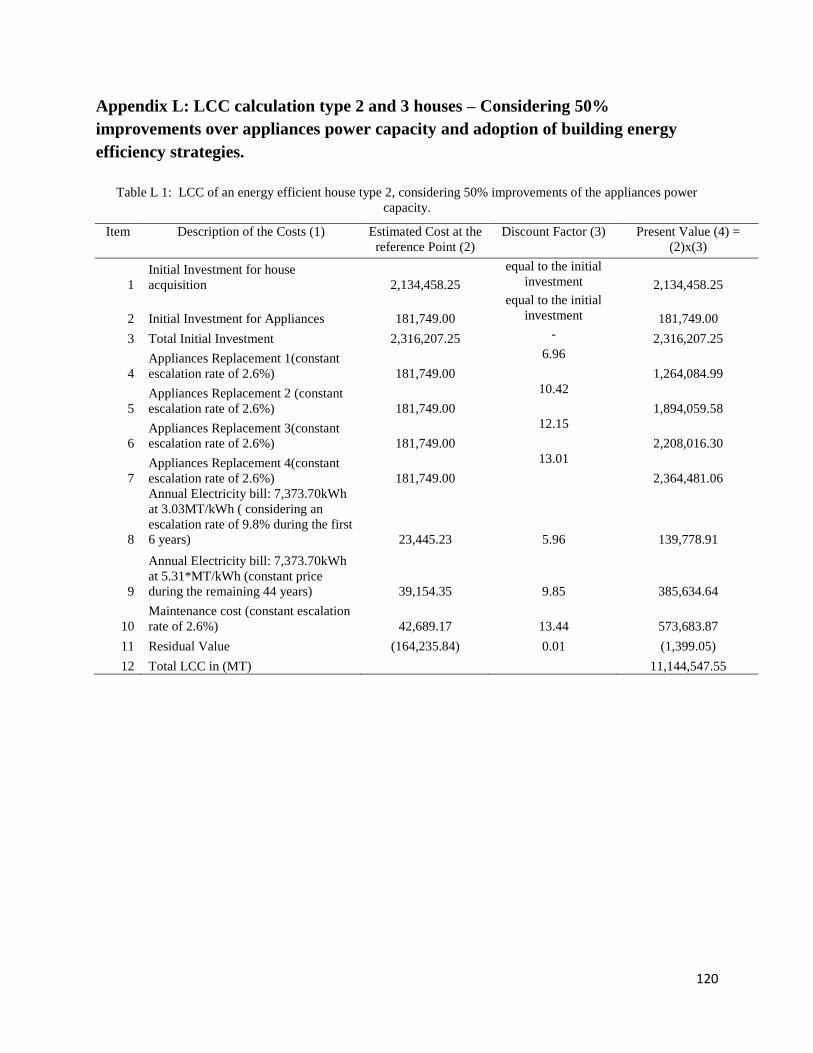
120
Appendix L: LCC calculation type 2 and 3 houses – Considering 50%
improvements over appliances power capacity and adoption of building energy
efficiency strategies.
Table L 1: LCC of an energy efficient house type 2, considering 50% improvements of the appliances power
capacity.
Item Description of the Costs (1) Estimated Cost at the
reference Point (2)
Discount Factor (3) Present Value (4) =
(2)x(3)
1
Initial Investment for house
acquisition 2,134,458.25
equal to the initial
investment 2,134,458.25
2 Initial Investment for Appliances 181,749.00
equal to the initial
investment 181,749.00
3 Total Initial Investment 2,316,207.25 - 2,316,207.25
4
Appliances Replacement 1(constant
escalation rate of 2.6%) 181,749.00
6.96
1,264,084.99
5
Appliances Replacement 2 (constant
escalation rate of 2.6%) 181,749.00
10.42
1,894,059.58
6
Appliances Replacement 3(constant
escalation rate of 2.6%) 181,749.00
12.15
2,208,016.30
7
Appliances Replacement 4(constant
escalation rate of 2.6%) 181,749.00
13.01
2,364,481.06
8
Annual Electricity bill: 7,373.70kWh
at 3.03MT/kWh ( considering an
escalation rate of 9.8% during the first
6 years) 23,445.23 5.96 139,778.91
9
Annual Electricity bill: 7,373.70kWh
at 5.31*MT/kWh (constant price
during the remaining 44 years) 39,154.35 9.85 385,634.64
10
Maintenance cost (constant escalation
rate of 2.6%) 42,689.17 13.44 573,683.87
11 Residual Value (164,235.84) 0.01 (1,399.05)
12 Total LCC in (MT)
11,144,547.55
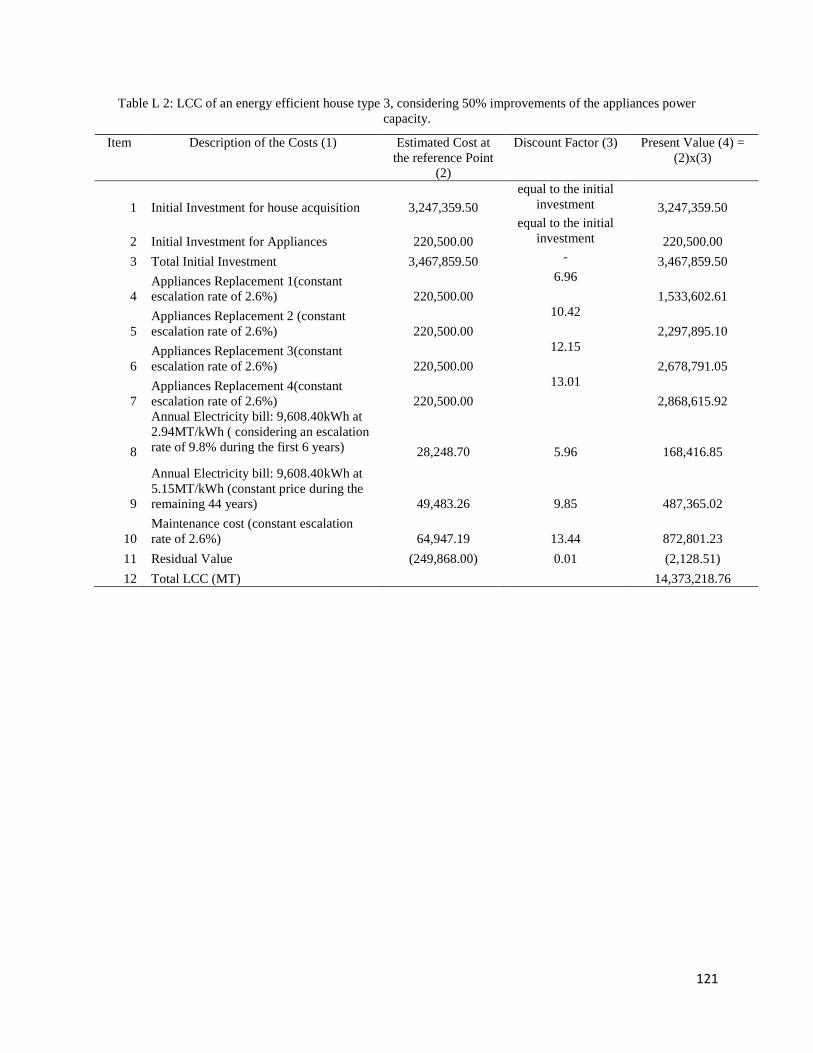
121
Table L 2: LCC of an energy efficient house type 3, considering 50% improvements of the appliances power
capacity.
Item Description of the Costs (1) Estimated Cost at
the reference Point
(2)
Discount Factor (3) Present Value (4) =
(2)x(3)
1 Initial Investment for house acquisition 3,247,359.50
equal to the initial
investment 3,247,359.50
2 Initial Investment for Appliances 220,500.00
equal to the initial
investment 220,500.00
3 Total Initial Investment 3,467,859.50 - 3,467,859.50
4
Appliances Replacement 1(constant
escalation rate of 2.6%) 220,500.00
6.96
1,533,602.61
5
Appliances Replacement 2 (constant
escalation rate of 2.6%) 220,500.00
10.42
2,297,895.10
6
Appliances Replacement 3(constant
escalation rate of 2.6%) 220,500.00
12.15
2,678,791.05
7
Appliances Replacement 4(constant
escalation rate of 2.6%) 220,500.00
13.01
2,868,615.92
8
Annual Electricity bill: 9,608.40kWh at
2.94MT/kWh ( considering an escalation
rate of 9.8% during the first 6 years) 28,248.70 5.96 168,416.85
9
Annual Electricity bill: 9,608.40kWh at
5.15MT/kWh (constant price during the
remaining 44 years) 49,483.26 9.85 487,365.02
10
Maintenance cost (constant escalation
rate of 2.6%) 64,947.19 13.44 872,801.23
11 Residual Value (249,868.00) 0.01 (2,128.51)
12 Total LCC (MT)
14,373,218.76