Embed Size (px)
Citation preview

CHEMINFO
Economic Assessment of the Integrated Steel Industry
Final Report
Submitted To: Canadian Steel Producers Association
September 24th, 2019
Prepared By:
Cheminfo Services Inc. 22 Pilgrim Drive
Markham, Ontario L6C 1R9 Phone: (905) 944-1160
E-mail: [email protected] Website: www.cheminfoservices.com

i
CHEMINFO
Acknowledgements The Canadian Steel Producers Association (CPSA) acknowledges the valuable content and insights that were provided by each of the integrated steel producers in Ontario (Algoma Steel, ArcelorMittal Dofasco and Stelco) to ensure that this document is a comprehensive, accurate and useful resource.
About the Canadian Steel Producers Association The CSPA is the national voice of Canada’s steel industry, which generates revenues of $15 billion annually. Member companies of the CSPA produce approximately 13 million tonnes of primary steel annually as well as over 1 million tonnes of steel pipe and tube products in facilities located across Canada. Canadian steel producers are a critical component of Canada’s economic infrastructure, serving the needs of North American manufacturing customers with high quality, competitive, and innovative products. Key market segments for the steel industry cluster include:(i) automotive; (ii) oil and gas discovery, extraction, and transport; (iii) major infrastructure projects; (iv) commercial/residential construction; and (v) many general manufacturing applications. Steel production is considered a key strategic industry in many countries. CSPA’s primary role is to work with Canadian governments and industry partners to advance public policies that enable a competitive business environment for the domestic steel industry and supply chain stakeholders. The CSPA is committed to fostering a strong and sustainable future for Canada’s vital steel sector and enabling members to prosper in both domestic and international markets.

ii
CHEMINFO
Table of Contents
1. INTRODUCTION ..................................................................................................... 1
1.1 BACKGROUND ...................................................................................................... 1 1.2 PURPOSE OF THIS REPORT .................................................................................... 1 1.3 INTRODUCTION TO THE INTEGRATED IRON AND STEEL SECTOR IN ONTARIO ....... 1
2. OVERVIEW OF INTEGRATED IRON AND STEEL MILLS ........................... 5
2.1 A COMPLEX PRODUCTION PROCESS .................................................................... 5 2.2 AIR EMISSIONS .................................................................................................... 6 2.3 ENERGY CONSUMPTION ....................................................................................... 9
3. CHALLENGES TO PROFITABILITY ................................................................ 12
3.1 INTRODUCTION .................................................................................................. 12 3.2 GLOBAL EXCESS STEELMAKING CAPACITY ....................................................... 12 3.3 “DUMPING” OF STEEL INTO THE CANADIAN MARKET ........................................ 19 3.4 TRADE IMBALANCE AND IMPORT PENETRATION OF STEEL PRODUCTS .............. 21 3.5 LACK OF LONG-TERM APPRECIATION IN STEEL PRICES ..................................... 24 3.6 IMPOSITION OF TARIFF AND NON-TARIFF BARRIERS ON CANADIAN PRODUCED
STEEL ................................................................................................................ 27 3.7 COSTS OF ENVIRONMENTAL COMPLIANCE ......................................................... 30 3.8 HIGHER COST BUSINESS ENVIRONMENT IN ONTARIO ........................................ 34 3.9 ACCESS TO CAPITAL FROM INTERNATIONAL HEADQUARTERS ........................... 35 3.10 CYCLICAL NATURE OF STEEL MARKETS AND PRICES ........................................ 35
4. IMPACTS ON THE CANADIAN INTEGRATED IRON AND STEEL SECTOR ................................................................................................................... 37
4.1 INTRODUCTION .................................................................................................. 37 4.2 REDUCTION IN LONG-TERM PRODUCTION LEVELS ............................................ 37 4.3 REDUCED MARKET SIZE FOR SEMI-FINISHED AND FINISHED STEEL PRODUCTS IN
CANADA ............................................................................................................ 38 4.4 REDUCED EMPLOYMENT LEVELS ....................................................................... 41 4.5 FINANCIAL HEALTH OF THE GLOBAL/CANADIAN IRON AND STEEL SECTOR ...... 41
5. CONCLUSION ........................................................................................................ 43
6. BIBLIOGRAPHY .................................................................................................... 44

iii
CHEMINFO
List of Figures in the Report Figure 1: Location of Integrated Iron and Steel Mills in Canada ................................................................... 3 Figure 2: Trend in GHG Emissions and GHG Emissions Intensity from the Integrated Iron and Steel Sector
in Ontario (2004-2017) ......................................................................................................................... 8 Figure 3: Comparison of the Energy Intensity of Major Canadian Industries ...............................................11 Figure 4: Canadian, Chinese and Global Trend in Steelmaking Capacity .....................................................13 Figure 5: Global Crude Steelmaking Capacity and Crude Steel Production - Capacity-Production Gap .....15 Figure 6: Trend in Global Crude Steel Production (1998-2018) ...................................................................16 Figure 7: Trend in New Steel Anti-dumping/ Countervailing Duty Investigations (1990-2018) ..................17 Figure 8: Trend in Canadian Exports and Imports of Semi-Finished and Finished Steel (1998-2017) .........22 Figure 9: Trend in Canadian Trade Deficit for Semi-Finished and Finished Steel Products (1998-2017) ....23 Figure 10: Trend in the Percentage of the Canadian Market for Semi-Finished and Finished Steel Captured
by Imports (1998-2017) .......................................................................................................................24 Figure 11: Trend in World Steel Prices (2008-2018) ....................................................................................25 Figure 12: Steel Price Index for Flat Products, By Region............................................................................26 Figure 13: Monthly Exports of Steel (HS Code 72) from Canada to the U.S. ...............................................28 Figure 14: Monthly Imports of Steel (HS 72) from World to Canada ...........................................................29 Figure 15: Trend in Canadian Production of Crude Steel (1998-2017) .........................................................38 Figure 16: Trend in the Canadian Market for Semi-Finished and Finished Steel (1998-2017) .....................39 Figure 17: Trend in the Number of Vehicles Produced in Canada (1999-2018) ...........................................40 Figure 18: Employment in the Ontario Integrated Iron and Steel Sector (1995-2017) ..................................41
List of Tables in the Report Table 1: Current Production Capacity of Integrated Iron and Steel Producers in Ontario ............................. 2 Table 2: Summary of Key Economic Statistics for the Iron and Steel Sector in Canada ............................... 4 Table 3: Trend in Emissions and Emissions Intensity of Criteria Air Contaminants from the Integrated Iron
and Steel Sector in Ontario (1998-2017) .............................................................................................. 7 Table 4: Trend in Emissions of Other Key Substances from the Integrated Iron and Steel Sector in Ontario
(2004-2017) .......................................................................................................................................... 9 Table 5: Main Energy Inputs within Integrated Iron and Steel Mills ............................................................10 Table 6: Trend in North American Motor Vehicle Production ......................................................................40

1
CHEMINFO
1. Introduction
1.1 Background Ontario Regulation 419/05: Air Pollution – Local Air Quality established under the Environmental Protection Act was created to protect communities against the adverse effects from local sources of air emissions. The Regulation places limits on the concentration of contaminants in the natural environment that are caused by emissions from a facility. During the development of new or revised air standards, certain sectors may be identified that would be ideally addressed by a technical standard. Complying with a technical standard is an alternative to complying with the air standards that are based on contaminant concentrations. The integrated iron and steel sector has been identified for the development of technical standards under Ontario Regulation 419/05. In support of this process, the Ontario Ministry of the Environment, Conservation and Parks has asked the Canadian Steel Producers Association to prepare an economic assessment of Ontario’s integrated steelmaking industry to support the development of a technical standard.
1.2 Purpose of this Report The objective of this report is to describe the competitiveness issues faced by the Ontario integrated iron and steel sector, the cyclical nature of the industry and assess the economic and competitive stresses on the industry. In this regard, the report is to communicate the risks and challenges faced by the integrated iron and steel sector in Ontario of additional regulatory burden.
1.3 Introduction to the Integrated Iron and Steel Sector in Ontario Steel producers in Canada include both integrated iron and steel plants as well as mini-mills that produce steel through the use of electric arc furnaces (EAFs). The focus of this analysis is on the integrated iron and steel industry, although in some instances statistics for the broader industry (including mini-mills) are provided. There are three integrated iron and steel companies in Ontario (and Canada), with a combined annual production capacity of 10.4 million tonnes of steel. The Stelco plant in Hamilton, ON has not produced any primary steel from its basic oxygen furnace since late 2010, although the plant continues to operate coke-making facilities and various steel products finishing lines.

2
CHEMINFO
Table 1: Current Production Capacity of Integrated Iron and Steel Producers in Ontario
(million tonnes)
Company Location 2010 2019 ArcelorMittal Dofasco Hamilton, ON 4.7 4.7 Algoma Steel Inc. Sault Ste. Marie, ON 2.9 2.9 Stelco Inc. Nanticoke, ON 2.4 2.4 Stelco Inc. Hamilton, ON 2.0 - Total 12.0 10.0
Notes: • Algoma Steel also has idled blast furnace capacity that is not included in the totals above. • ArcelorMittal Dofasco’s capacity includes electric arc furnace capacity. Source: Information published by the respective companies in publicly available documents as well as interviews with/information provided by the above companies. Canadian steel producers provide a critical foundation for Canada’s automotive, energy, transportation, construction, and general manufacturing supply chains. For instance, it has been estimated that two-thirds of all manufactured goods contain some variety of steel components. As such, the Canadian steel sector is critically important in providing raw materials to facilitate Canada’s manufacturing sector. Steel production has the net effect of diversifying the benefits to Canada associated with ongoing economic activity, large-scale commercial developments, and public sector investment in Canada's infrastructure needs.1
1 Canadian Steel Producers Association (2016), Presentation by Mr. Joseph Galimberti (President, Canadian Steel Producers Association) to the Standing Committee on Industry, Science and Technology.

3
CHEMINFO
Figure 1: Location of Integrated Iron and Steel Mills in Canada
Steel manufacturing is globally recognized as a linchpin industry. The presence of steel manufacturing operations in a community generates significant economic benefits. The transport of raw materials and finished products, development of support technology, service of equipment, and supply and maintenance of the steelmaking facilities themselves are all capital and labour-intensive ongoing activities that provide substantive benefit to host communities.2 The availability of locally sourced steel in a given community also attracts secondary value-added economic activity, such as steel fabrication operations, auto parts manufacturing, and specialized production of steel products.3
2 Ibid. 3 Ibid.

4
CHEMINFO
Table 2: Summary of Key Economic Statistics for the Iron and Steel Sector in Canada
Summary – Integrated Iron and Steel Mills
Number of Operating Plants 41 Employment 10,381 Annual Production - 2017 (kilotonnes) 7,271
Summary – Iron and Steel Sector Production Capacity - 2017 (kilotonnes) 15,600 Annual Production – 2017 (kilotonnes) 13,614 Exports (kilotonnes) 6,482 GDP (at basic prices; chained 2012 dollars) $2.4 billion % of Manufacturing GDP 1.4%
1 Stelco (Hamilton) is not currently producing steel, however other operations are active at the facility (e.g. coke-making, finishing lines). Sources: • World Steel Association (November, 2018), Steel Statistical Yearbook 2018. • National Pollutant Release Inventory. • Organisation for Economic Cooperation and Development, Steelmaking Capacity Database. • Statistics Canada, Gross Domestic Product (GDP) at Basic Prices, by Industry, Annual Average, Industry
Detail (x 1,000,000), accssed at https://www150.statcan.gc.ca/t1/tbl1/en/tv.action?pid=3610043406.

5
CHEMINFO
2. Overview of Integrated Iron and Steel Mills
2.1 A Complex Production Process Integrated iron and steel plants are among the most complex industrial facilities, involving: solids - coal, coke and iron ore – processing; gas and liquid (e.g. by-product fuels including coke oven gas, blast furnace gas and basic oxygen furnace gas) processing; molten metal processing; and solid steel and slag processing. The processes require substantial quantities of fuel and electric energy, some of which are produced on-site. Integrated steel mills in Ontario use the blast furnace/basic oxygen furnace (BF/BOF) process to produce steel, a complex process covering areas up to several square kilometres. Integrated steel mills are characterized by networks of interdependent material and energy flows between the various production units, with key processes being coke oven plants, blast furnaces, basic oxygen furnaces, casting plants, hot rolling mills and cold rolling mills. In an integrated steel mill, the blast furnace is the main operational unit where the primary reduction of iron oxide ore takes place resulting in the production of liquid iron. The main raw materials that are added to blast furnaces are as follows: • Iron ore pellets – the source of iron to the blast furnace. Iron ore pellets are thermally
agglomerated iron ore fines made into a spherical shape and generally are between 8-20 mm in diameter (e.g. size of a marble). They contain approximately 63-65% iron. Smaller constituents of iron ore pellets, which act as fluxes, include silica and aluminum oxide (<5%) and calcium oxide/magnesium oxide (<3%). Fluxed pellets exhibit good strength, improved reducibility, swelling and softening melting characteristics. Iron ore pellets are typically transported to the integrated steel mills in Ontario by ship or by rail from iron ore pelletization plants in Quebec, Michigan or Minnesota;
• Coke, pulverized coal or natural gas – as sources of carbon, these are the main reducing agents in the blast furnace. They react to form carbon monoxide and hydrogen, which reduces the iron oxides in the ore. Coke is produced from coal by means of dry distillation in the coke ovens. It has better physical and chemical characteristics than coal. Integrated steel mills in Ontario receive coal shipments at their facilities, which are used to produce coke at on-site heated coke oven batteries. The heated volatile portion of the coal is vapourized to form coke oven gases, which contain some commercial chemicals and valuable fuel components; and
• Limestone (i.e. calcium carbonate) - added to a blast furnace to remove impurities in the iron ore, for instance silica.
The blast furnace is charged from the top with a burden typically consisting of alternate layers of coke and a mixture of pellets and flux. In the furnace, the iron ore is continuously reduced and liquid iron and slag are collected at the bottom of the furnace. When ready, a drill opens a tap hole in the bottom of the furnace and molten iron or slag is poured out. The slag from the

6
CHEMINFO
blast furnace is air cooled and either granulated or pelletized and is often sold to cement plants or as an aggregate. The liquid iron from the blast furnace (called pig iron or hot metal) is then desulphurized and transported to a basic oxygen furnace. The purpose of the basic oxygen furnace is to refine the hot metal produced in the blast furnace into raw liquid steel (by reducing the carbon content from approximately 4% to less than 1%, thereby resulting in steel). The basic oxygen furnace also removes phosphorus from the hot metal and optimizes the steel temperature so that any further treatments prior to casting can be performed with minimal reheating or cooling of the steel. The primary raw materials for the basic oxygen furnace are 70-80% liquid hot metal from the blast furnace with the remaining being steel scrap. Oxygen is “blown” into the basic oxygen furnace at supersonic velocities in order to oxidize the carbon and silicon contained in the hot metal as well as to melt the steel scrap (by igniting carbon in the liquid iron). Fluxes of burnt lime or dolomite are added to the basic oxygen furnace in order to promote the removal of impurities and protect the lining of the furnace. Upstream ladle desulphurization of the hot metal and downstream ladle metallurgy of the steel is generally applied in order to produce steel with the required quality. On leaving the basic oxygen furnace, the liquid steel is cast into semi-finished billets, blooms or slabs by means of continuous casting. In some cases vacuum degassing is applied in order to further improve the quality of the steel. Casting products, whether slabs, billets or blooms, are subsequently processed in rolling mills and product finishing lines (e.g. coating lines) in order to prepare them for the market and are delivered as steel in strip, plate, section or bar form.
2.2 Air Emissions The production of steel within integrated iron and steel plants is an energy and raw materials intensive process. As such, there are several significant sources of air emissions from these facilities, among them raw material handling and storage, coke production, the blast furnace, and the basic oxygen furnace. A wide range of pollutants are emitted by integrated iron and steel mills covering criteria air contaminants, greenhouse gases as well as a variety of other contaminants. Integrated iron and steel mills in Ontario have invested significant capital over the last several decades into advanced air pollution control equipment as well as modified production processes that along with the adoption of best environmental practices has contributed to significant declines in air emissions from these facilities.

7
CHEMINFO
The table below demonstrates the almost continuous decline in criteria air contaminants from Ontario’s integrated iron and steel mills over the 2004-2017 time-period, where volatile organic compound (VOC) and carbon monoxide emissions have declined by over 60%, particulate matter (PM) emissions by 26-43% as well as nitrogen oxide (NOx) and sulphur oxide (SOx) emissions by approximately 26%.
Table 3: Trend in Emissions and Emissions Intensity of Criteria Air Contaminants from the Integrated
Iron and Steel Sector in Ontario (1998-2017) (tonnes)
2004 2009 2013 2017 Percentage Decline in Emissions
(2004-2017)
Percentage Decline in
Emissions Intensity (2004-2017)
PM 5,184 2,863 3,670 3,825 26.2% 2.1% PM10 3,387 1,426 2,114 2,121 37.4% 16.9% PM2.5 2,295 1,078 1,386 1,310 42.9% 24.2% SOx 19,141 12,465 14,394 14,194 25.9% 1.6% NOx 10,247 6,507 7,748 7,605 25.8% 1.5% VOCs 1,621 521 574 596 63.2% 51.2% CO 35,396 13,849 13,640 14,018 60.4% 47.4%
Note: The data in the table above is based on emissions estimated for the “Iron and Steel Industry – Primary (Blast Furnace and DRI)” in Ontario. Source: Environment and Climate Change Canada (https://pollution-waste.canada.ca/air-emission-inventory). While some of these emission reductions can be attributed to the cessation of basic oxygen furnace steelmaking at the Stelco plant in Hamilton, ON, the emissions intensity for each criteria air contaminant released by the integrated iron and steel sector in Ontario has also declined over the 2004-2017 time-period, as outlined in the table above. The reduction in emissions and emissions intensity of criteria air contaminants from the integrated iron and steel sector in Ontario is attributed to the installation of a wide range of air pollution control technologies, adoption of better process controls, modernization of equipment, implementation of improved energy efficiency measures as well as the application of best management practices. A few examples of these technologies/practices include the installation of a variety of baghouses/wet scrubbers throughout the plant, addition of low-NOx burners on steel reheat furnaces, flaring and afterburners on streams containing VOCs, leak detection and repair (LDAR) programs, continuous emissions monitoring systems and utilization of a variety of work practices to mitigate fugitive dust emissions (e.g. sweeper trucks, dust suppressants, sprinklers, water tankers).

8
CHEMINFO
Reductions in greenhouse gas (GHG) emissions have also been realized within the integrated iron and steel sector in Ontario, declining from just over 15,700 kilotonnes of CO2e in 2004 to just under 11,000 kilotonnes in 2017, representing a reduction of 30.3% over this time-period. GHG emissions intensity has also declined over this time-period from 1.63 to 1.51 kilotonnes of GHG emissions per kilotonne of production, an improvement in GHG emissions intensity of 7.5%. These GHG emission intensity improvements have been achieved through the adoption of a wide range of energy efficient measures and improved utilization of waste energy, including the installation of cogeneration facilities in some instances. It is valuable to note that emissions intensity is lower when facilities are operating at a higher rate of capacity utilization. Therefore when production suffered in the 2009 global recession year, emissions intensity increased.
Figure 2: Trend in GHG Emissions and GHG Emissions Intensity from the Integrated Iron and Steel Sector in Ontario (2004-2017)
Sources: • GHG Emissions- Facility reporting of GHG emissions to Environment and Climate Change Canada
(https://www.canada.ca/en/environment-climate-change/services/climate-change/greenhouse-gas-emissions/facility-reporting/data.html)
• Production - World Steel Association, Steel Statistical Yearbook [for multiple years].

9
CHEMINFO
Even more significant declines in emissions of other key air contaminants from the integrated iron and steel sector in Ontario have been realized, including those of polycyclic aromatic hydrocarbons (PAHs), benzo(a)pyrene, hexachlorobenzene and benzene. Emissions of all four of these pollutants have declined by more than 60% over the 2004-2017 time-period and 90% and above for PAHs and benzo(a)pyrene. In addition, the emissions intensity of these four pollutants has also declined significantly over this time-period, as outlined in the table below. A variety of improvements to coke making operations, a major source of these pollutants, have occurred amongst integrated steelmakers in order to achieve these significant emission reductions.
Table 4: Trend in Emissions of Other Key Substances from the Integrated Iron and Steel Sector in Ontario (2004-2017)
(tonnes)
Year
2004 2009 2013 2017 Percentage Decline in Emissions
(2004-2017)
Percentage Decline in
Emissions Intensity (2004-2017)
PAHs 3.7 0.6 0.5 0.4 90.0% 86.7% Benzo(a)pyrene 1.3 0.2 0.2 0.1 90.1% 86.9% Hexachlorobenzene 0.2 <0.1 0.1 0.1 72.4% 63.3% Benzene 207.0 89.3 90.3 80.0 61.4% 48.7% Sources: • Data for PAHs, benzo(a)pyrene and hexachlorobenzene are based on the “Iron and Steel Industry –
Primary (Blast Furnace and DRI)” in Ontario. The source of this information is as follows: Environment and Climate Change Canada (https://pollution-waste.canada.ca/air-emission-inventory).
• Data for benzene is aggregated from submissions of the four relevant facilities to the NPRI. The source of this information is as follows: (https://pollution-waste.canada.ca/national-release-inventory/archives/index.cfm?lang=en).
2.3 Energy Consumption Energy constitutes a significant portion of the cost of steel production, from 20% to 40%. As such, competitive energy prices and conservation are crucial to ensure the competitiveness of the industry and to minimize environmental impacts, such as GHG emissions. By far the dominant consumer of energy within integrated iron and steel mills is the combination of the blast furnace - basic oxygen furnace. It has been estimated that approximately 89% of a blast furnace – basic oxygen furnace’s energy input originates from coal/coke, 7% from electricity, 3% from natural gas and 1% from other gases and sources.4 However. the basic oxygen furnace is self-sufficient in energy, utilizing the heat generated by the ignition of the residual carbon contained in pig iron to provide the necessary energy within the furnace. 4 World Steel Association (2019), Fact Sheet – Energy Use in the Steel Industry.

10
CHEMINFO
Table 5: Main Energy Inputs within Integrated Iron and Steel Mills
Energy Input
Application as Energy
Application as Energy and Reducing Agent
Coal Coking Plant Coke Production, Blast Furnace Pulverized Coal Injection
Electricity Rolling Mills and Motors - Natural Gas Furnaces, Power Generators Blast Furnace Injection
Source: Adapted from World Steel Association (2019), Fact Sheet – Energy Use in the Steel Industry. Notes: • Each of these energy inputs does not necessarily occur at all of the integrated iron and steel plants in
Ontario. • Oil is typically only used to produce steam on rare (emergency) occasions at integrated iron and steel
mills. By-product gases from the coke oven, blast furnace and basic oxygen furnace are also used within integrated steel mills, saving on additional fossil fuel and energy resources. By-product gases typically contribute to more than 60% of a steel plant’s energy requirements and are used either as a direct fuel substitute or for the internal generation of electricity.5 The steel industry is a large industrial energy user in Canada, accounting for approximately 2% of the nation’s primary energy consumption or 7.5% of Canada’s industrial energy demand.6 Apart from being one of the largest energy consumers amongst industry in Canada, the steel industry is also one of the most energy-intensive industries in Canada, consuming an estimated 83.8 MJ of energy per $ of GDP generated (2007 dollars) according to the Canadian Energy Emissions and Data Centre.7
5 Ibid. 6 Canadian Industry Program for Energy Conservation (2007), Benchmarking Energy Intensity in the Canadian Steel Industry. 7 Accessed at the website of the Canadian Energy and Emissions Data Centre (https://cieedacdb.rem.sfu.ca/naics-database/#).

11
CHEMINFO
Figure 3: Comparison of the Energy Intensity of Major Canadian Industries (Megajoules/$GDP)
Source: Canadian Energy and Emissions Data Centre (https://cieedacdb.rem.sfu.ca/naics-database/#). It is also important to note that steel is the most recycled material globally with more steel recycled annually than all other materials combined.8 As a result, steel conserves significant amounts of energy over its many life cycles through its 100% recyclability.
8 Accessed at the website of the Steel Recycling Institute (www.steelsustainability.org/recycling).

12
CHEMINFO
3. Challenges to Profitability
3.1 Introduction The main determinants of profitability for the integrated iron and steel sector in Ontario are the following: (i) the price spreads between steel and the main raw material inputs (e.g. coking coal, iron ore, steel scrap) plus the energy/natural gas/electricity prices; and (ii) the ability to cover the large fixed costs by operating at high capacity utilization rates. However, there are a variety of issues faced by the Ontario integrated iron and steel sector that challenge their ability to sustain profitability. The root cause of the variety of issues challenging profitability for steelmakers in Ontario is global excess steelmaking capacity. This excess capacity leads to “dumping” of very low-priced steel into the Canadian market, a negative trade balance in steel products with import quantities capturing a significant percentage of the Canadian market, and the lack of long-term price appreciation for steel products. Other factors that pose challenges to profitability are: (i) the range of tariff and non-tariff barriers that have been placed on Canadian-made steel; (ii) the costs of environmental management incurred by Canadian plants that is not required of many international competitors; (iii) Ontario’s high cost business environment (including high electricity prices/costs); (iv) lack of access to capital from international headquarters, in some instances; and (v) the cyclical nature of steel markets and prices. The remainder of this chapter elaborates on these issues.
3.2 Global Excess Steelmaking Capacity The global steel industry’s capacity to produce crude steel has increased rapidly since the early 2000s. Most of this capacity expansion has occurred in emerging economies, to support construction and manufacturing activity. Some countries have viewed national steelmaking as strategically important in laying the foundation for building economic infrastructure.9 Much of the new capacity has been constructed with investments from sovereign wealth funds or government assistance. However capacity has expanded to an extent that there is now significant excess global steelmaking capacity. The excess global capacity is a major challenge for the steel industry, affecting the financial and economic sustainability of the Canadian steel sector10 and its ability to compete internationally.11
9 Kingdom of Belgium and the Organisation for Economic Cooperation and Development (2016), High-Level Meeting – Excess Capacity and Structural Adjustment in the Steel Sector – Background Note No. 2 – Capacity Developments in the World Steel Industry. 10 Organisation for Economic Cooperation and Development (2018), Steel Market Developments Q2 2018. 11 Report of the Standing Committee on International Trade (June, 2017), The Canadian Steel Industry’s Ability to Compete Internationally.

13
CHEMINFO
The overcapacity phenomenon has been driven by China, whose steel sector is largely state-owned and controlled.12 China ascended to the World Trade Organization in December, 2001 which opened up global steel markets for Chinese steelmakers. Since that time, China has expanded its capacity from 150 million tonnes per year to current levels that have now reached just over a billion tonnes of steel annually. Annual Chinese domestic demand for steel is approximately 835 million tonnes, resulting in approximately 180 million tonnes of capacity that is made available just for the export market. Entire steel mills have been constructed in China exclusively to service the export market. China produces steel at a rate well in excess of its domestic demand in order to maximize their capacity utilization. The steel capacity China established exclusively for export markets (i.e. approximately 180 million tonnes) is over 15 times Canada’s annual production of steel (i.e. approximately 13 million tonnes - including EAF production) and larger than the entire North American annual market for steel. As can be seen in the figure below, over the 2000-2018 time-period Chinese steelmaking capacity increased by approximately 575%, while Canadian steelmaking capacity declined by 12.4%.
Figure 4: Canadian, Chinese and Global Trend in Steelmaking Capacity (million tonnes per year)
Note: Canada’s steel production capacity declined from 17.8 million tonnes in 2000 to 15.6 million tonnes in 2018. Note that estimated Canadian capacity includes Stelco’s Hamilton facility which is currently permanently idled. This capacity has been kept in the figure above in order to maintain consistency in the data source that was utilized. There may be Chinese and global steelmaking plants in “permanently idled” status which will also be included in estimates of the Chinese and global steelmaking capacity as published by the OECD and reflected in this figure. Source: Organisation for Economic Cooperation and Development, Steelmaking Capacity Database.
12 State-owned enterprises often have advantages conferred on them by their government owners such as preferential tax rates, public grants and capital injections.

14
CHEMINFO
Chinese state ownership and support for its steel sector is the single largest force disrupting established trade patterns and degrading pricing of steel products globally.13 In 2015, China through a variety of state supports (e.g. export subsidies and other market distorting practices), maintained more than 425 million tonnes of surplus production capacity despite its declining domestic demand. Chinese steel is government subsidized, produced at artificially low prices with little regards to profit or losses, and dumped into international markets, often below true cost in order to meet employment and production quotas.14 As a result, it is typically not possible to compete with the prices that Chinese steelmakers sell their product for on international markets. Other countries besides China also contribute to the global excess steelmaking capacity phenomena and sell steel internationally at below production cost. For instance, South Korea is the second-largest exporter of steel to North America and unfair South Korean pricing has caused disruptions in many segments of the Canadian market.15 Vietnam, Taiwan, Turkey and India are additional countries that have been contributing to the problem of global excess steelmaking capacity. While the gap between annual global steelmaking capacity and production has declined over the last three years from its high in 2015, it is still over 400 million tonnes of steel (which is 30 times Canada’s annual production of steel). Unfortunately, the modest reductions in excess steelmaking capacity that has occurred in 2016-2018 fall short of alleviating global excess capacity.
13 United Steelworkers and the Canadian Steel Producers Association (2016), Open Letter to the Prime Minister on Global Overcapacity in the Steel Sector. 14 Report of the Standing Committee on International Trade (June, 2017), The Canadian Steel Industry’s Ability to Compete Internationally. 15 Ibid.
15
CHEMINFO
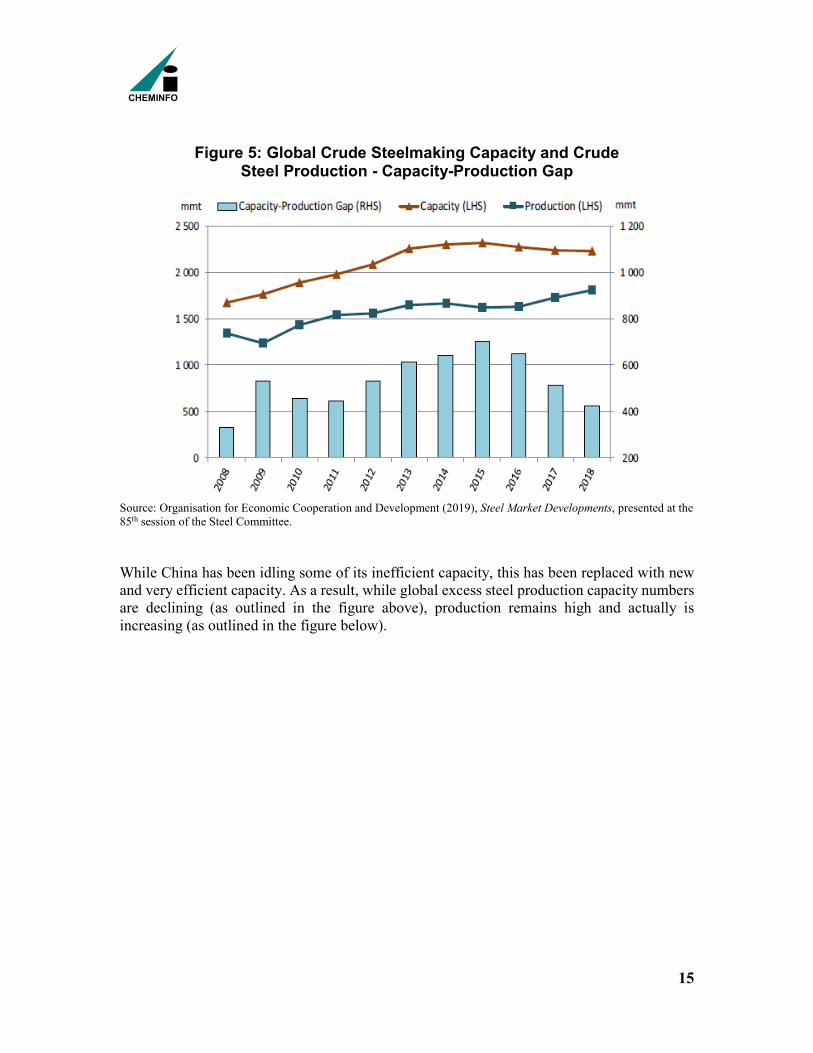
Figure 5: Global Crude Steelmaking Capacity and Crude Steel Production - Capacity-Production Gap
Source: Organisation for Economic Cooperation and Development (2019), Steel Market Developments, presented at the 85th session of the Steel Committee. While China has been idling some of its inefficient capacity, this has been replaced with new and very efficient capacity. As a result, while global excess steel production capacity numbers are declining (as outlined in the figure above), production remains high and actually is increasing (as outlined in the figure below).

16
CHEMINFO
Figure 6: Trend in Global Crude Steel Production (1998-2018) (million tonnes per year)
Sources: • World Steel Association, Steel Statistical Yearbook [multiple issues]. • Organisation for Economic Cooperation and Development (2019), Steel Market Developments.
In general, low steel prices, weak profitability, trade disturbances in some jurisdictions, and an escalation of trade actions against steel imports are some of the immediate impacts of excess steelmaking capacity that are being incurred by steel manufacturers globally.16 The number of new trade remedy investigations have increased sharply in recent years, with allegations of dumped or subsidized steel exports on the rise in a number of economies. A large number of safeguard cases and import duty increases have also been observed recently, which indicate a growing willingness to restrict imports of fairly traded steel from a broader range of trading partners.17
16 Kingdom of Belgium and the Organisation for Economic Cooperation and Development (2016), High-Level Meeting – Excess Capacity and Structural Adjustment in the Steel Sector – Background Note No. 2 – Capacity Developments in the World Steel Industry. 17 Ibid.

17
CHEMINFO
Figure 7: Trend in New Steel Anti-dumping/ Countervailing Duty Investigations (1990-2018)
Source: Organisation for Economic Cooperation and Development (2019), Recent Trade Policy Developments, prepared for discussion at the 86th Session of the Steel Committee. In addition, global excess steelmaking capacity is quite problematic from a business uncertainty point of view. This excess capacity represents a future threat to Canadian production and can significantly curtail aspirations of future investment for expansion for Canadian steelmaking operations. Characteristics of the steel sector and inefficient policy settings heighten barriers to exit18 for inefficient global steelmaking capacity that tend to prolong or even hinder structural
18 “Barriers to exit” refers to those economic and policy factors that increases the difficulty of actually permanently closing an integrated iron and steel plant.

18
CHEMINFO
adjustment. As a result, restructuring is more challenging in the steel sector than in many other manufacturing industries.19 Some of the key barriers to exit of inefficient global steelmaking capacity include the following:20 • Many governments view steel as a strategically important industry. Therefore, the steel
sector is particularly prone to direct (e.g. tax benefits, loans and debt instruments) and indirect (e.g. artificially low input prices) forms of government support. If not well-designed these support mechanisms allow inefficient firms and plants to remain in the market.
• Steel production is characterized by high fixed costs. Moreover, investments in equipment and facilities are considerable, and can last for several decades. These characteristics reduce the incentives for firms to close inefficient plants. In addition when operating, companies need to produce close to 100% of capacity or their fixed costs cannot be adequately spread over their production in order to maintain profitability.
• The plant closure decision also depends on the salvage value of the existing plant. The closure of a plant is unlikely to occur when the expected stream of revenues from continued operation is above the salvage value. The salvage value of steel plants is usually very low because of the lack of alternative uses for steelmaking facilities and equipment on the one hand, and the costs associated with removing the bulky steelmaking equipment on the other. As a result, steel firms might prefer keeping an inefficient plant in operation even when incurring losses for an extended period. In addition, in the current context of global excess capacity, steel firms seeking to close inefficient capacity may have difficulty finding buyers for their physical assets, which further lowers salvage values and acts as a barrier to exit.
• Incentives for closing inefficient steel production units can also vary according to the steelmaking technology used. For example, basic oxygen furnaces entail higher costs of suspending production temporarily in comparison to other technologies such as EAFs.
Apart from significant barriers to exit for inefficient steelmaking operations, there are also continued investments in new capacity hindering solutions to the global excess steelmaking capacity issue. Information on announced investment projects suggests that, globally, 88 million tonnes of gross capacity additions are currently underway and could come on stream during the three-year period of 2019-2021. An additional 22.4 million tonnes of capacity additions are currently in the planning stages for possible start-up during the same time period. Should these projects be realized, global steelmaking capacity could increase by approximately 4-5% between 2019 and 2021 in the absence of closures.21
19 Organisation for Economic Co-operation and Development (2018), Facilitating Structural Adjustment in the Steel Sector. 20 Ibid. 21 Organisation for Economic Cooperation and Development (2019), Latest Developments in Steelmaking Capacity.

19
CHEMINFO
3.3 “Dumping” of Steel into the Canadian Market Due to excess capacity in the global steel industry and the generous subsidies given to steel producers in some countries, the dumping of steel products on the Canadian market is a problem that prevents Canadian steel producers from competing on a level playing field with their foreign counterparts.22 Steel from a number of countries is being imported into Canada with great regularity and sold at very low prices on the Canadian market, often substantially lower than prices established in Canada for domestically produced steel. Even with the improved trade remedy system in Canada, low-priced imports are still being witnessed in very large quantities. As a result, some international trade in steel products is not considered a free or fair market, where outcomes are being determined based on the competitiveness of the product.23 Excess global steelmaking capacity has led to a significant increase in market distorting dumping and circumvention practices, both from China directly and from a host of other global producers whose home markets have in many cases suffered as a result of Chinese competition. Once their home markets are inundated with subsidized product from China, other global producers are left with no choice but to export aggressively – dumping yet more product onto global markets and further degrading global prices.24 This has forced reductions in steel output, and ultimately the bankruptcy of several market-based steelmakers in various countries. Given the global nature of the industry, excess steelmaking capacity in some regions can displace production in other regions thereby creating significant difficulties for many steel producers in both advanced and developing economies. As a result, employment within the Canadian steel sector is under major threat from unfairly traded imports that are heavily subsidized, dumped, or otherwise produced under non-market conditions.25 With trading partners moving ahead with protectionist measures (e.g. section 232 tariffs in the U.S. and safeguards in other jurisdictions), Canada is increasingly becoming a primary target for surges in unfairly traded steel goods that get diverted from countries with strong defenses in place.26 For instance, the U.S. has essentially closed their borders to steel imports from most countries. The European Union, Russia and Turkey have also increased the stringency of their measures. There was considerable concern that with the new barriers being established by other countries/regions, international trade in steel would be diverted to Canada if there was not a properly functioning trade remedy system in place. This has been a concern since Canada is one of the largest remaining open markets in the world. While there are specific trade remedy actions in place against certain countries and products in Canada, the market for steel is otherwise open to others.
22 Report of the Standing Committee on International Trade (June, 2017), The Canadian Steel Industry’s Ability to Compete Internationally. 23 Ibid. 24 United Steelworkers and the Canadian Steel Producers Association (2016), Open Letter to the Prime Minister on Global Overcapacity in the Steel Sector. 25 Canadian Steel Producers Association, Canadian Steel Producers Association (CSPA) 2017 Pre-Budget Submission. 26 Ibid.

20
CHEMINFO
For the Canadian steel industry to be able to compete on an even playing field, Canada must be able to defend against unfair trade practices by foreign companies and countries. The Special Import Measures Act (SIMA), administered by the Canada Border Services Agency (CBSA) and the Canadian International Trade Tribunal (CITT) protects Canadian producers against injury caused by the dumping and subsidization of imported goods through anti-dumping and countervailing duties.27 SIMA includes tools to address the impact of unfair international trade practices on Canadian steel producers (primarily when imported products are dumped, subsidized, or produced under non-market conditions).28 Without this trade remedy system in place, the Canadian steel sector would be decimated by a flood of unfairly-traded low-cost steel from a range of countries. Steel manufacturers in Canada have to continually engage Canada’s trade remedy system in order to maintain and obtain new rulings on unfairly traded steel that is “dumped” into the Canadian market. While Canada’s trade remedy system is vital to protecting the Canadian market from unfairly traded (i.e. “dumped”) steel, steelmakers in certain countries are continuously looking for opportunities to circumvent Canada’s trade remedy system. For instance, Chinese steel producers have been known to move their steel through Vietnam to avoid paying anti-dumping duties on Chinese products.29 In other instances, steel from China has been shipped to Indonesia, where the steel has had a small amount of value added to it and then exported to Canada through an “advance ruling” where Canadian steelmakers were never informed and therefore not provided the opportunity to participate in that advance ruling.30 In these instances, tariffs that have been established would be minimal, even though the steel originated from China. Some of these off-shore countries are now also entering into downstream markets (e.g. auto parts) since existing trade remedy actions against them in Canada limits their ability to sell primary steel products into the Canadian market. Over the last few years, the Federal government has been working with the steel industry in Canada to make sure the trade remedy system in Canada is updated, fast, reliable, and will prevent any industrious importer or exporter from finding loopholes.31 For instance, the federal government incorporated a number of amendments to the SIMA and related trade remedy regulations in August, 2019. These amendments create a new mechanism for Canadian producers to file a complaint regarding trade and business practices specifically intended to avoid trade remedy duties (anti-circumvention investigations) and provide greater discretion to the CBSA when assessing the reliability of prices in the exporting country in anti-dumping investigations where the CBSA finds that prices are distorted due to the presence of a “particular market situation.” The Federal government has also indicated that they will be
27 Report of the Standing Committee on International Trade (June, 2017), The Canadian Steel Industry’s Ability to Compete Internationally. 28 Canadian Steel Producers Association, Canadian Steel Producers Association (CSPA) 2017 Pre-Budget Submission. 29 Report of the Standing Committee on International Trade (June, 2017), The Canadian Steel Industry’s Ability to Compete Internationally. 30 Ibid. 31 Ibid.

21
CHEMINFO
making regulatory amendments to allow unions to participate as interested parties in trade remedy proceedings.32 Despite these advances, there are still areas for improvement to Canada’s trade remedy system. For instance, the trade remedy system in Canada has been characterized as a retrospective system, where the steel sector has to wait and incur injury before it can bring a case to the CBSA/CITT. For instance, a total of 3% or more of imports in a certain steel product category have to originate from a single country or 7% or more from a group of three or more countries (each contributing less than 3% of imports of the particular steel product) before a trade case can be filed by the steel sector. While not an established rule by the CBSA, the steel sector has found that these level of imports have to be observed for three consecutive quarters before a successful compliant can be initiated. Subsequent to the complaint, the CBSA/CITT have 250 days (i.e. approximately 8 months) to render a decision. Therefore over this time-period (i.e. around 1.5 years), the unfairly traded steel exports continue to arrive in Canada. A more beneficial trade remedy system would be one that was able to be initiated quicker and responded in a more timely fashion. Another area for improvement to the current trade remedy system is with respect to import licensing/permitting. There is very little transparency in the current system in terms of the collection and communication of data. For instance, the reconciliation of the data received through the import licensing system can take 3-6 months or even a year before it becomes available to the steel sector. In addition, there are errors in the data that becomes available. This hinders the ability to base a case against importers. Therefore overall the timeliness and accuracy of the data available to steelmakers in Canada needs to be improved.
3.4 Trade Imbalance and Import Penetration of Steel Products Semi-finished and finished steel products are widely traded internationally. Semi-finished steel products include such items as billet, blooms and slabs. These products can be made by direct continuous casting of hot steel or by pouring the liquid steel into ingots, which are then hot rolled into semi-finished products. Meanwhile finished steel products are obtained by the hot rolling/forging of semi-finished steel (blooms/billets/slabs) and cover broad categories of products, such as: (i) long products; (ii) flat products; and (iii) and pipe/tubular products.33 Every year over the 1998-2017 time-period, imports of finished and semi-finished steel products into Canada have exceeded Canadian exports. Canadian exports were at the highest levels over this time frame in 2008 when just under 7,500 kilotonnes of finished and semi-finished steel was exported from Canada. Since 2011, exports have been relatively stable at slightly above or below 6,000 kilotonnes per year. However Canadian imports have increased
32 Ibid. 33 Ingots are a metal block cast in a particular shape for convenient further processing. Long products are a type of finished rolled steel product like rail and steel bars. Flat products are a type of finished rolled steel product like steel strip and plate. Pipe and tubular products cover all hollow products of steel and are normally produced in a cylindrical shape.

22
CHEMINFO
significantly since 2008, with more than 8,000 kilotonnes of finished and semi-finished steel imported into Canada annually since 2010 (with one exception – 2016 where imports were estimated at just below 8,000 kilotonnes). Imports of semi-finished and finished steel even exceeded 10,000 kilotonnes in 2006, 2011 and 2014.
Figure 8: Trend in Canadian Exports and Imports of Semi-Finished and Finished Steel (1998-2017)
(kilotonnes)
Source: Based on data contained in World Steel Association (November, 2018), Steel Statistical Yearbook 2018. As a direct result of global excess steelmaking capacity and the subsequent “dumping” of steel into the Canadian market, Canada operates at a significant trade deficit for semi-finished and finished steel products. This trade deficit was just barely negative in 2008, however has expanded considerably since that time reaching levels above 4,000 kilotonnes in 2011 and 2014. From 2010-2017, the trade deficit in semi-finished and finished steel products averaged approximately 3,000 kilotonnes, while from 1998-2009, the trade deficit only averaged slightly above 2,400 kilotonnes. This trade deficit in Canada for semi-finished and finished steel provides an indication of the levels of subsidy in the system and the willingness of many global producers to forego profit. Typically the exceptionally high price of transporting steel cannot be absorbed while maintaining positive sale margins. However, the cost structure for many imported steel products is deeply distorted and therefore these foreign manufacturers willingly absorb the very high transportation costs, often at the expense of positive profits.

23
CHEMINFO
Figure 9: Trend in Canadian Trade Deficit for Semi-Finished and Finished Steel Products (1998-2017)
(kilotonnes)
Source: Based on data contained in World Steel Association (November, 2018), Steel Statistical Yearbook 2018. With the high levels of semi-finished and finished steel imports, international competitors are capturing a very significant share of the Canadian market for these products. It is estimated that since 2008, more than 50% of the Canadian market for semi-finished and finished steel products have been captured by imports. In three years (i.e. 2010, 2011 and 2014), it is estimated that imports captured over 60% of the Canadian market. Over the 2010-2017 time-period, imports have averaged just under 58% of the Canadian market for semi-finished and finished steel products. Meanwhile from 1998-2009, imports only captured on average 46% of the Canadian market. These figures indicate, as does the figure below, that imports are continuing to capture higher shares of the Canadian market for semi-finished and finished steel. In terms of the origin point for these imports, in 2017 approximately 59% originated form the U.S. and Mexico with the remaining 41% from off-shore countries34 (e.g. China, South Korea). Imports enter the Canadian market since Canadian producers do not supply the entire spectrum of steel products that are consumed in Canada and there is also unfairly traded steel being imported into Canada.
34 Phoenix SPI (December, 2018), Canadian Steel Imports and Market Share Monthly Report, prepared for the Canadian Steel Producers Association.

24
CHEMINFO
Figure 10: Trend in the Percentage of the Canadian Market for Semi-Finished and Finished Steel Captured by Imports (1998-2017)
Source: Based on data contained in World Steel Association (November, 2018), Steel Statistical Yearbook 2018.
3.5 Lack of Long-term Appreciation in Steel Prices The steel sector has stated that global overcapacity in steel has led to unfair pricing in the Canadian market and job losses in Canada. In addition, the lower prices caused by global excess steelmaking capacity forces producers to access increasing amounts of short-term debt and operate at unsustainable levels of indebtedness.35 The excess supply of steel on the global market creates downward pressure on global steel prices, unfairly undermining competition in open markets like Canada. The latest information available on the long-term trend in steel prices indicates that prices realized towards the end of 2018 were below levels that were observed at the beginning of 2008. This indicates that there has not been any significant long-term consistent price appreciation of steel products over that 10 year time-period.
35 Report of the Standing Committee on International Trade (June, 2017), The Canadian Steel Industry’s Ability to Compete Internationally.

25
CHEMINFO
Figure 11: Trend in World Steel Prices (2008-2018)
Note: The coefficients of variation (CV) are defined as the ratio of the standard deviation of the regional Platts price series making up the indices to their (arithmetic) mean, and thus captures price dispersion across regions. Source: Organisation for Economic Cooperation and Development (2019), Steel Market Developments, presented at the 85th session of the Steel Committee. A major reason for the lack of long-term price appreciation in steel prices is the fact that Chinese steel demand accounts for approximately 45% of global demand, and exports account for a significant share of world steel exports (e.g. 27% of world steel exports in the first 8 months of 2017 originated from China). This places China as the largest steel exporter in the world. As such, any developments in Chinese steel prices are likely to have an important effect on the development of global steel prices as a whole. As outlined in the figure below, prices for Chinese flat steel products are the lowest amongst all regions globally, placing downward pressure on overall global steel prices.

26
CHEMINFO
Figure 12: Steel Price Index for Flat Products, By Region
Source: Organisation for Economic Cooperation and Development (2019), Steel Market Developments, presented at the 85th session of the Steel Committee. For non-market economies (e.g. China) there is no profit incentive, with steelmaking being subsidized and production occurring at a loss. Instead of being driven by profits, these countries focus on building their steel industries and employment within the sector. In fact, since China is lacking in the key raw materials required to produce steel, integrated steelmakers in China should incur much higher raw material costs (versus Canada) since they need to import coal and iron ore long distances (e.g. from Brazil and Australia). However, these costs are not incorporated into the price that Chinese steelmakers sell their steel. Since the costs of doing business are not being incorporated into the steel price, they sell at low prices which deflates the entire global steel price. The price on offshore imported steel into Canada is typically lower than offered by Canadian steelmakers. In order for Canadian producers to compete for this business and preserve market share, they must price-match these lower imports levels. Some offshore countries, such as China, have far less environmental laws and regulation while Canada has far better environmental standards. When Chinese steel displaces Canadian steel, there is a net negative environmental impact globally.

27
CHEMINFO
3.6 Imposition of Tariff and Non-Tariff Barriers on Canadian Produced Steel
Canadian steel producers need trade that is free and fair with the U.S. Over 15 million tonnes of steel were traded between the two countries in 2018. Canada exported C$7.6 billion in steel to the U.S., representing 82% of domestic steel exports in 2018.36 At the same time, Canada was the number one destination for U.S. steel exports,37 accounting for nearly 50% of U.S. steel exports and having a value of C$5.2 billion.38 The Canadian and U.S. steel industries are deeply integrated, and underpin continental supply chains that strengthen the global competitiveness of the North American economy.39 Since 1994 trade in steel between Canada and the U.S. was based on the North American Free Trade Agreement (NAFTA). In March 2018 the U.S. imposed 25% tariffs on steel imported from some countries under Section 232 of the U.S. Trade Expansion Act. On June 1st, 2018, these unilateral duties were extended to include Canada, Mexico, and the European Union. In response, Canada imposed a corresponding 25% tariff on imports of American-made steel beginning July 1st, 2018. Canada also applied a 25% provisional safeguard tariff on imports of certain steel goods originating from some other countries beginning on October 25th, 2018 to avoid becoming a dumping ground for steel diverted from the U.S. as a result of the Section 232 tariffs. On May 17th, 2019, Canada and the U.S. reached an understanding to eliminate all tariffs the U.S. imposed under Section 232 and all tariffs Canada imposed in response to the actions taken by the U.S. The effect of the 25% tariffs on steel applied by the U.S. was to artificially increase the price of Canadian steel sold in that country. The resulting lost sales by Canadian suppliers are evident in the following figure that shows the decline in monthly exports of steel from Canada to the U.S. over the period following the initial introduction of U.S. tariffs. These lost sales were costly for Canadian manufacturers, and resulted in increased inventories, lower prices paid by other customers, and increased transportation costs to those other customers. In addition, the tariffs introduced a further atmosphere of uncertainty about markets for Ontario’s steel producers in the short- and longer-term.
36 Government of Canada, Trade Data Online, Trade by Product, Steel (HS 72), data for 2018, 2017, and 2016. (https://www.ic.gc.ca/eic/site/tdo-dcd.nsf/eng/home). 37 International Trade Administration, Global Steel Trade Monitor, Steel Exports Report: United States, March 2019 (https://www.trade.gov/steel/countries/pdfs/exports-us.pdf). 38 Government of Canada, Trade Data Online, Trade by Product, Steel (HS 72), data for 2018, 2017, and 2016. (https://www.ic.gc.ca/eic/site/tdo-dcd.nsf/eng/home). 39 Government of Canada, Steel and Aluminum (https://www.international.gc.ca/trade-commerce/controls-controles/steel_alum-acier_alum.aspx?lang=eng).

28
CHEMINFO
Figure 13: Monthly Exports of Steel (HS Code 72) from Canada to the U.S. ($ Millions of Canadian Dollars)
Source: Data from Government of Canada, Trade Data Online, Trade by Product, HS 72. The decline in exports does not describe the full extent of impacts on Canadian steel producers resulting from the Section 232 tariffs. Notably, some Canadian steel producers continued to export to U.S. markets (e.g. due to long-term contracts or to preserve market share) but earned a significantly lower return (or completely eliminated any positive return) per tonne of steel sold than they otherwise would have as they largely bore the costs of these tariffs. In addition, there remains a continued risk to steel producers that new tariffs will be introduced at some point in the future, if the U.S. determines that there has been a surge in imports, which presents a significant level of uncertainty for Canadian steelmakers.

29
CHEMINFO
A further effect of the 25% tariffs applied by the U.S. was a surge of imports of foreign steel into Canada, perhaps initially destined for the U.S. Specifically, an impact of the 232 tariffs imposed by the U.S. was that the next best alternative for steel producing nations that had been exporting to the U.S. was to then ship to Canada (where there were initially no tariffs). The following figure shows an increase in steel imports to Canada following the application of the U.S. tariffs in March 2018. The spike in imports reduces Canada’s balance of trade, and further disrupts the Canadian market with discounted steel imported from off-shore. Steel imports fell following the application of a Canadian tariff on steel from the U.S. in July 2018 and fell further with the introduction of quotas and an over-quota tariff on seven categories of steel products (including hot-rolled steel, pre-painted sheet and heavy plate) from other countries in October 2018.
Figure 14: Monthly Imports of Steel (HS 72) from World to Canada (Millions of Canadian Dollars)
Source: Government of Canada, Trade Data Online, Trade by Product, HS 72. There has also been a substantial increase in the application of non-tariff measures (NTMs) as a means to raise barriers to trade in the steel sector over the last decade. This is because tariff measures are relatively easy to detect and their impacts on trade volumes are quantifiable in a

30
CHEMINFO
manner that allows comparison.40 The five types of NTMs commonly found in the steel industry include: (i) import licensing procedures; (ii) technical barriers to trade; (iii) quotas and other quantitative restriction measures; (iv) government procurement restrictions; and (v) export restrictions and export-related measures.41 For instance, the “Buy America” policy was strengthened by the Trump administration in July, 2019 which now requires that 95% of steel and iron used in any public contract be from the U.S.42 The U.S. government has been granted exemptions for these measures in its free trade agreements. Innovation, Science and Economic Development Canada has indicated that Canada’s trade agreement obligations do not provide it with the same ability as the U.S. to favour domestic steel producers for government contracts.43 Apart from directly harming Canadian steel producers, potential border adjustment taxes, expanded U.S. Buy America policies (particularly for private projects) as well as expansion of U.S. trade rules may result in diversion of offshore steel (away from the U.S.) into Canada.44
3.7 Costs of Environmental Compliance Integrated iron and steel makers in Ontario operate in one of the most stringent jurisdictions globally with respect to environmental requirements. These requirements result in significant investments of capital for the adoption of leading-edge technology as well as annual operating and maintenance costs to ensure compliance. Many of the costs that are incurred by integrated iron and steel manufactures for meeting environmental obligations in Ontario are not faced by international competitors, particularly those in countries that have been most problematic from a global excess steelmaking capacity viewpoint. The environmental costs, especially the cost of carbon, can significantly reduce or potentially even eliminate the profitability of integrated iron and steel manufacturers in Ontario, particularly during low points in the profitability cycle. The stringent environmental operating requirements in Ontario impact the competitiveness of steelmakers and even diminishes their ability to survive. Below is a discussion of the two most prevalent future environmental compliance costs that will be faced by integrated iron and steel manufacturers in Ontario as well as examples of other environmental costs that have been or will be incurred.
40 Organisation for Economic Cooperation and Development (2018), Steel Trade and Trade Policy Developments: A Closer Look at NTMs, presented at the 84th Session of the OECD Steel Committee. 41 Ibid. 42 CBC News (July, 2019), Trump Makes Buy America Rules More Restrictive, Demanding 75% U.S. Components. 43 Report of the Standing Committee on International Trade (June, 2017), The Canadian Steel Industry’s Ability to Compete Internationally. 44 Ibid.

31
CHEMINFO
3.7.1 Climate Change The most significant environmental cost for the integrated iron and steel sector in Ontario has arisen from the federal Greenhouse Gas Pollution Pricing Act (GGPPA) and related regulations. The GGPPA received royal assent on June 21st, 2018. It provides the legal framework and enabling authorities for the federal backstop carbon pollution pricing system that currently applies in Ontario. This system has two parts: the Output-Based Pricing System (OBPS) for industrial facilities; and a regulatory charge on fossil fuels (the Clean Fuel Standard - CFS). Both will affect Ontario’s steel producers, either directly and/or indirectly. Output-Based Pricing System The Output-Based Pricing System Regulations were registered on June 21st, 2019 (the Department of the Environment also published a Notice of Intent on December 20th, 2018 that allowed the Regulations to take effect on January 1st, 2019). Under the OBPS, industrial facilities will face a carbon price on the portion of their emissions that are above a limit. For example, the production of steel in a basic oxygen furnace has an output-based standard of 0.164 tonnes of CO2e per tonne of steel produced. This standard is based on 95% of the production-weighted average emissions intensity of the sector. A facility whose emissions are above this limit will have three options to meet its obligation: • paying a charge to the Government of Canada set at $20 per tonne CO2e in 2019 and
increasing by $10 per tonne CO2e each year to $50 per tonne CO2e in 2022; • submitting surplus credits issued by the federal government; and/or • submitting eligible offset credits. There is a great deal of uncertainty in the magnitude of costs that will be incurred by integrated iron and steel manufacturers in Ontario due to the OBPS. However based on early expectations, these costs may be in the range of $120 million over the first four years of the program. In addition, these estimates are just direct costs to integrated iron and steel manufacturers. There will also be indirect costs as well, for instance as raw material suppliers (e.g. lime manufacturers) to the steel industry pass along a portion of the costs they incur due to the OBPS. Many other jurisdictions that compete with Ontario’s integrated iron and steel makers will not be faced with carbon charges, including most of the U.S. and most45 of those nations that have been largely responsible for the global excess steel capacity phenomenon. In fact, integrated steel mills in the U.S. are all situated in jurisdictions which currently do not have a carbon pricing system in-place. The steel industry in Ontario has been discussing with the Federal
45 South Korea’s Emissions Trading Scheme (KETS) was launched on January 1st, 2015 and includes the iron and steel sector.

32
CHEMINFO
government how to equalize carbon charges at the border (e.g. higher tariffs) or though some other mechanism in order to protect integrated iron and steel makers in Canada. As China is the largest off-shore exporter of steel into the Canadian market, it is important to consider the impacts on global CO2 emissions should Ontario steel production be transferred to China due to a carbon charge that is faced by Ontario mills, but not by those in China. While there is limited data on CO2 emissions from the direct production of steel in China, the CO2 emissions associated with the shipment of iron ore and coal to China (which does not have access to these raw materials domestically) from other countries such as Brazil and Australia is significant. In addition, the CO2 emissions associated with the shipment of steel products from China to Canada is also significant. Also, electricity generation in China is still largely based on coal-fired generation plants. These are all lifecycle CO2 emissions that are much smaller for Ontario steel manufacturers that receive their raw materials from origin points much closer to their mills and ship their steel to end-users that are also much closer to their mills (with their consumed electricity also no longer being generated through coal-fired power plants). Overall it has been estimated that the lifecycle CO2 emissions associated with steel imported into Canada from China will be 3-4 times more carbon intensive than steel produced in Canada and sold to customers in Canada. As such, if steel production shifts from Canada to China due to the imposition of the carbon tax, global CO2 emissions of steel production will increase (i.e. carbon leakage). There is no feasible technology available at present to achieve significant reductions in CO2 emissions from integrated iron and steel manufacturers. Each of the integrated iron and steel makers in Ontario are working on potential solutions to reduce their CO2 emissions, however the alternatives for significantly less carbon-intensive steel are still many years away. Investments required to just investigate the potential of advanced CO2 reduction options are multi-million dollars in scope. In addition, Ontario’s steel industry is uncertain how the significant revenues generated by the OBPS will be utilized to help support investments in carbon reduction or other technical or economic programs for the sector. As such, the OBPS represents a significant cost to Ontario’s steel manufacturers, one that their major competitors in the U.S. and in most locations outside of the European Union do not face, and that contributes to decreased competitiveness. Clean Fuel Standard (Fossil Fuel Charge) The fuel charge component of the federal carbon pollution pricing system came into effect in Ontario on April 1st, 2019. This charge affects a wide range of fuels. For example, the charges applicable for the period beginning on April 1st, 2019 and ending on March 31st, 2020 in Ontario are: • $0.0442 / litre gasoline; • $0.0537/ litre light fuel oil; • $0.0637 / litre heavy fuel oil; and • $0.0391 / cubic metre marketable natural gas.

33
CHEMINFO
Steel manufacturers, as registered emitters, are exempt from direct application of the fuel charge (i.e. greenhouse gas emissions from integrated steel producers are subject to the OBPS). However, there will be indirect cost impacts to the sector. The fuel charges will be applied to the activities of shipping companies. Therefore the shipment of raw materials to integrated iron and steel plants and final steel products to customers will result in the application of fuel charges (depending on the origin/destination points of these materials). Some portion of the charges associated with this transportation will get passed along to steel manufacturers. Other indirect costs of carbon that may be passed along to integrated iron and steel manufacturers include on-site electricity consumption, electricity consumption by certain raw material suppliers (e.g. industrial gas suppliers) and fuel costs by contractors and suppliers. Estimates of the indirect costs of the Fossil Fuel Charge to the integrated iron and steel sector in Ontario are not available, however they are anticipated to be significant. 3.7.2 Coke Oven Gas Desulphurization In order to comply with the Pollution Prevention Notice issued by Environment and Climate Change Canada, each integrated iron and steel plant will be required to implement coke oven gas desulphurization technology by January 1st, 2026 to mitigate their SO2 emissions. It is currently proposed that the Ontario Ministry of the Environment, Conservation and Parks align provincial standards with the federal requirement. It has been estimated that the capital cost of coke oven gas desulphurization technology will be approximately $40-50 million per installation or in the vicinity of approximately $160-200 million for the sector as a whole in Ontario. Some U.S. and European integrated iron and steel makers will have similar obligations (with some facilities already installing the necessary technology), however many steelmakers (e.g. located in countries in the developing world) will not have to incur these costs. It is also important to note that coke oven gas desulphurization technology is very maintenance-intensive, will require raw materials and other operating expenses, which will be additional costs (beyond the capital costs) that steelmakers in Ontario will have to continually incur in the future. 3.7.3 Examples of Other Environmental Costs While the cost of carbon emissions and coke oven gas desulphurization are the two most significant anticipated future environmental costs that will be incurred by integrated iron and steel manufacturers in Ontario, there are many additional environmental costs that have been and will be incurred. These include addressing legacy environmental issues on their manufacturing sites through soil, sediment and groundwater remediation, achieving site-specific standards for coke-making operations, improvements to water discharges, mitigation of emissions from the basic oxygen furnace, etc. For the integrated iron and steel sector in Ontario in aggregate, these capital environmental expenditures can amount to more than $100 million in some years. It is also important to note that on-going compliance costs (e.g. monitoring, testing and reporting) are very significant for integrated iron and steel makers in Ontario. Each of the integrated iron and steel manufacturers also have an extensive ISO 14001 management system in place. These and many other environmental obligations require investments of several

34
CHEMINFO
million dollars per year per facility, costs which many steelmakers exporting steel into the Canadian market do not have to incur.
3.8 Higher Cost Business Environment in Ontario Apart from the stringent environmental obligations and resulting costs that are required of manufacturing operating in Ontario, there are several other factors that contribute to Ontario being considered a higher cost business environment in which to operate. Examples of these factors include the following: • Electricity pricing in Ontario is higher than in any neighbouring jurisdiction. For instance,
it has been estimated that the cost of electricity in Ontario is $C70 per MWh while in Pennsylvania it is approximately $C45 per MWh. There are also limited opportunities to reduce electricity costs without taking production and productivity penalties. Algoma Steel commissioned a cogeneration facility at their plant in Sault Ste. Marie in 2009 at significant cost. This operation utilizes by-product fuels from the coke battery and blast furnace to reduce electricity costs.
• Ontario is captive from a trade-labour point of view, as the prices of labour associated with capital expenditures will not be much, if at all, different throughout Canada. However in other regions there is a free movement of labour, for instance between countries in Europe. This allows steel companies to retain labourers from countries that have lower prices (e.g. from eastern Europe) than what is available within their domestic location.
• The southern U.S. and Mexico are still growing their industrial base and are not as developed as the northern U.S. and Ontario. Therefore generally labour associated with capital cost expenditures will be less expensive in those locations than in Ontario.
In addition, the Southern U.S. has been quite aggressive in providing very attractive incentives for re-location/expanding within their jurisdictions, specifically with regards to major end-users of steel. These incentives come in the form of land, training and tax breaks. These jurisdictions are more flexible for incentivising businesses to re-locate to their jurisdictions (versus Ontario) including some incentives (e.g. cash incentives) that are simply not available in Ontario. As such, there has been a significant movement of end-users of steel to the southern U.S., including automobile assembly plants and auto part manufacturers. Therefore, the higher cost business environment in Ontario as well as the attractive incentives being offered by some jurisdictions not too far from Ontario are eroding the manufacturing base in Ontario and preventing expansions of existing facilities or the establishment of new facilities in the Province. This has led to a continual decline in the number of customers available within the Ontario market for integrated iron and steel makers.

35
CHEMINFO
3.9 Access to Capital from International Headquarters One of the integrated iron and steel manufacturers in Ontario is internationally owned and part of a multi-national steel conglomerate with facilities located in several different countries. As such, it is in constant competition to secure the capital required from their headquarters in order to fund ongoing process modernization and technology implementation in order to maintain and grow their competitive position.46 As profitability draws investment, those steel mills located in countries with lower profits (e.g. due to much higher environmental compliance costs) may have difficulty securing the capital that is requested, with this capital shifted to the company’s more profitable operations in those countries with significantly reduced environmental compliance costs. In these instances, capital is available for those investments that are needed in order to meet government requirements, for instance purchases of equipment to mitigate air emissions. However the capital available is constrained, and with capital diverted to meet environmental obligations (some of which will have associated productivity benefits) there is less capital available to undertake strategic investments to sustain and improve their competitiveness. This can have the effect over time of eroding the competitiveness of the plant.
3.10 Cyclical Nature of Steel Markets and Prices Steel markets have traditionally been on an 8-10 year cycle which is similar to the overall economy. However steel markets are far more volatile than what they have been historically. There are now frequent changes to steel market conditions and the market is currently better characterized as being quarter to quarter or even month to month. Some of the key factors that contribute to the cyclical nature of steel markets and pricing include the following: • Raw material costs, which fluctuate with worldwide demand and natural disasters (e.g.
flooding of iron ore mines which can have dramatic impacts on iron ore availability and pricing);
• Artificial trade barriers (e.g. tariffs); • Currency swings; • Extent of imports that arrive in Canada on a month-to-month basis; • Demand (e.g. in 2009-2010 there was a significant decline in auto production); • Transportation – supply of truck drivers is declining, rail car availability; and • Capacity additions on a regional or global basis. Steel prices fluctuate significantly with short-term price swings of $200-500/tonne possible. These dramatic swings in prices presents challenges with respect to establishing long-term contracts and long-term pricing by steel manufacturers. Generally few customers want to establish long-term contracts as they fear they will be locked into a contract at a substantially 46 Canadian Steel Producers Association (2016), Presentation by Mr. Joseph Galimberti (President, Canadian Steel Producers Association) to the Standing Committee on Industry, Science and Technology.
36
CHEMINFO
higher price than what they could have obtained on the spot market. As a result, spot business is becoming more and more prevalent for steel manufacturers. This rapid variability in pricing also hurts long-term investments because of the uncertainty (and consequently risk) in committing capital to capacity expansions. Unfortunately there is no expectation that these significant fluctuations in pricing will change in the foreseeable future. Global excess steelmaking capacity contributes to the significant fluctuations in pricing and this continues to plague global steel markets with no immediate solution in sight. Steel manufacturers are faced with raw material prices and prices of finished steel that are not necessarily tied together. These prices are sometimes impacted by different factors. Therefore the spread between raw material prices necessary to produce a tonne of steel and the ultimate price of steel can contract quite rapidly through a combination of events, as outlined in the list above. This contributes to the volatility and uncertainty within the steel sector at present.

37
CHEMINFO
4. Impacts on the Canadian Integrated Iron and Steel Sector
4.1 Introduction The global steel sector continues to face long-term challenges such as the decline in the intensity of steel use in some economies, excess global steelmaking capacity (expressed in very low global capacity utilization rates) as well as in the still fragile financial situation of many steel firms.47 Outlined in this chapter is an analysis of a series of variables that demonstrate the relative weakness within the Canadian integrated iron and steel sector as a result of the range of issues discussed in the previous chapter. Analyses are provided on the following factors: (i) reduction in long-term production levels; (ii) reduced market size for semi-finished and finished steel products in Canada; (iii) reduced employment levels; and (iv) financial health of the global/Canadian iron and steel sector.
4.2 Reduction in Long-Term Production Levels Production of steel through basic oxygen furnaces at integrated iron and steel mills in Canada declined by 21.1% from 1998 to 2017 from approximately 9,200 kilotonnes in 1998 to just under 7,300 kilotonnes in 2017. The most significant reduction in steel production at integrated mills in Canada over this time-period occurred in 2009 as a result of the economic crisis and the resulting idling in 2010 (and eventual shutdown in 2013) of steel production at the U.S. Steel Canada plant in Hamilton, ON (which is now owned by Stelco). From a global perspective, Canada produced 2.0% of all steel through basic oxygen furnaces in 1998, where in 2017, this percentage declined to 0.6%.48 This is a result primarily of increased global steel production, but also to a decline in domestic production.
47 Organisation for Economic Co-operation and Development (2018), Steel Market Developments Q2 2018. 48 Based on data contained in World Steel Association, Steel Statistical Yearbook [versions for 1999 and 2018]

38
CHEMINFO
Figure 15: Trend in Canadian Production of Crude Steel (1998-2017) (kilotonnes)
Source: Based on data contained in World Steel Association (November, 2018), Steel Statistical Yearbook 2018. The over 21% decline in production at integrated steel mills in Canada during the last 20 years has occurred at a time when the estimated Canadian market for finished and semi-finished steel has declined by only 13.8%. This reduced production at integrated iron and steel mills has not been replaced by a commensurate increase in production of steel within mini-mills through electric arc furnaces. Over the 1998-2017 time-period, production of steel through electric arc furnaces in Canada has also declined, albeit by only 4.1% (from just over 6,600 kilotonnes in 1998 to approximately 6,350 kilotonnes in 2017). The decline in production at both integrated iron and steel mills as well as electric arc furnaces in Canada over the last 20 years has been a result of imports capturing a higher share of the Canadian market and the declining market for semi-finished and finished steel in Canada.
4.3 Reduced Market Size for Semi-Finished and Finished Steel Products in Canada
The Canadian market for semi-finished and finished steel products has been in decline for the last 20 years. In 1998, estimated demand was 18,500 kilotonnes while demand in 2017 has been estimated at 15,950 kilotonnes, representing a decline of 13.8% over this time-period.

39
CHEMINFO
Figure 16: Trend in the Canadian Market for Semi-Finished and Finished Steel (1998-2017)
(kilotonnes)
Source: Based on data contained in World Steel Association, Steel Statistical Yearbook [multiple issues].
Canada’s automotive sector represents approximately one-third of the annual demand from Canadian steel mills.49 As a result, a prosperous Canadian auto assembly and auto-parts manufacturing cluster is inextricably linked to the health of the steel manufacturing sector. It is important to note that the automotive sector provides a high value-added market segment for specialized grades of Canadian steel. This higher priced market segment is increasingly becoming vulnerable to imports from China and other countries. The outlook for the automotive manufacturing sector in Canada is not optimistic based upon recent events as well as the long-term trend in vehicle manufacturing in Canada. In 2018 General Motors announced the planned closure of their vehicle manufacturing plant in Oshawa, Ontario by the end of 2019 – impacting 2,600 employees. Meanwhile in March of 2019, Fiat Chrysler announced the cancellation of the third shift at their Windsor, Ontario automotive assembly plant – at the expense of 1,500 jobs. These recent closures are part of a long-term trend that has seen vehicle production in Canada decline by approximately one-third since the late 1990’s (i.e. annual vehicle production in Canada has declined by over a million vehicles per year over the 1999-2018 time-period). It is important to note that the sharp decline over the 2016-2018 time-period shown in the figure below does not include the significant expected impact of the full and partial plant closures described above and which are occurring in 2019.
49 Canadian Steel Producers Association (2016), House of Commons Standing Committee on International Trade – Study on the Trans-Pacific Partnership (TPP) Agreement.

40
CHEMINFO
Figure 17: Trend in the Number of Vehicles Produced in Canada (1999-2018)
Source: International Organization of Motor Vehicle Manufacturers Website, Production Statistics. There has been a trend in the movement of North American vehicle assembly operations away from Canada and the U.S. to Mexico, as outlined in the table below. In addition, key companies in the automotive parts sector such as Magna and Martin-Marietta have moved operations from Ontario to Mexico.
Table 6: Trend in North American Motor Vehicle Production (number of vehicles produced)
Country 2000 2018 % Change Canada 2,963,614 2,020,840 -32% Mexico 1,934,927 4,100,525 112% USA 12,799,857 11,314,705 -12%
Total Vehicles 17,700,398 17,438,088 -1% Source: Organization of International Motor Vehicle Manufacturers (OICA), http://www.oica.net/category/production-statistics/2018-statistics/. http://www.oica.net/category/production-statistics/2000-statistics/ The geographic proximity of steel manufacturers to the automotive industrial cluster in Ontario has allowed them to work on product improvements directly with customers and collaborate on R&D with post-secondary institutions and other organizations.50 As auto manufacturing continues to decline, and the resulting demand for steel from both the OEMs and their parts supplier’s declines, these opportunities for Canada’s steel sector may evaporate.
50 Hamilton Chamber of Commerce, (2018), Support the Canadian Steel Industry and its Supply Chain.

41
CHEMINFO
It is also important to note that new markets are not emerging to replace the decline in the automotive sector as well as other traditional steel-consuming sectors in Canada. As a result, there are fewer customers now for steel products in Canada than there have been historically, which increases the purchasing power of the remaining customers (i.e. a further pressure for reductions in the price of steel products).
4.4 Reduced Employment Levels Employment within the integrated iron and steel sector in Canada has declined by approximately 50% over the 1995-2017 time-period from approximately 20,600 employees in 1995 to 10,400 in 2017. Employment losses have occurred at all three integrated steel companies in Ontario since 1995.
Figure 18: Employment in the Ontario Integrated Iron and Steel Sector (1995-2017)
Source: National Pollutant Release Inventory.
4.5 Financial Health of the Global/Canadian Iron and Steel Sector The Organisation for Economic Cooperation and Development (OECD) released a report51 in 2017 on the financial health of the global steel industry. The analysis required constructing a large dataset of financial indicators at the firm level, with around 70 basic variables covering
51 Organisation for Economic Cooperation and Development (2017), Evaluating the Financial Health of the Steel Industry.

42
CHEMINFO
more than 800 steelmaking companies over 23 years. The financial data analyzed suggested that: • after a period of robust financial strength during the mid-2000s, the financial performance
of the steel industry has been deteriorating rapidly in recent years; • the industry’s financial performance has reached very weak levels, to some extent close to
those of the late 1990s and early 2000s; • average operating profitability is well below sustainable levels, and companies appear to
be increasingly relying on short-term debt; and • financial performance varies significantly across companies. While most companies are
not performing well, a small number of firms remain resilient. In the context of global excess steelmaking capacity, the steel industry’s financial situation is weaker than it has been in years. Even though the steel industry has experienced crises in the past, the most recent downturn is of particular concern given its depth and length. Moreover, recent trends in key financial indicators raise serious concerns and suggest that the global industry is in a very difficult economic and financial situation. Overall the study concluded that: • the financial performance of the global steel industry had deteriorated to levels not seen
since the steel crisis of the late 1990s; • there was a statistically significant relationship between excess capacity and the industry’s
profitability; and • the industry’s profitability was expected to remain weak due to continued excess capacity,
though the future evolution of many other factors that also determine profitability (such as input prices) was highly uncertain.
With respect to profitability, measures of aggregated free cash-flows for the global steel industry have been negative or barely positive in recent years, indicating that the steel industry is in need of external funds to cover any investment or even to maintain operational activities. As a consequence, debt ratios are rising, bringing into question the solvency of many companies.52 The relative weakness in the financial health of the global steel sector can be easily seen within Canada’s integrated iron and steel sector. Two of the three integrated steel companies in Ontario, covering three mills, have recently emerged from approximately three years of creditor protection under the Companies’ Creditors Arrangement Act (i.e. Stelco Inc. in June, 2017 and Algoma Steel in November, 2018).
52 Kingdom of Belgium and the Organisation for Economic Cooperation and Development (2016), High-Level Meeting – Excess Capacity and Structural Adjustment in the Steel Sector – Background Note No. 2 – Capacity Developments in the World Steel Industry.

43
CHEMINFO
5. Conclusion Canadian steel producers provide a critical foundation for Canada’s automotive, energy, transportation, construction, and general manufacturing supply chains as well as make significant direct contributions to the Canadian economy. For instance, the integrated iron and steel sector in Ontario employs over 10,000 people, while the steel sector as a whole in Canada represents 1.4% of total manufacturing GDP. Current domestic and global steel market conditions continue to pose significant challenges for Ontario’s integrated iron and steel sector to sustain an acceptable level of profitability. Globally, the issue of global excess steelmaking capacity continues to plague steelmakers, leading to unfairly traded steel continuing to be “dumped” into the Canadian market at price points well below those established by Canadian steelmakers. Offshore steelmakers continue to capture and expand their share of the domestic market for steel, putting downward pressure on domestic steel prices. Trade actions on steel products are increasing globally, further increasing the risk of off-shore steelmakers targeting Canada with their low cost imports. Domestically, key historical markets for the steelmakers (e.g. automotive manufacturing, general manufacturing) continue to exit Canada, leaving fewer and fewer customers. These issues have been and continue to erode the industry’s financial situation. The Ontario integrated iron and steel sector invests millions of dollars annually in various projects to reduce their emissions of a variety of contaminants. This has led to a continual reduction in emissions as well as emission intensity of criteria air contaminants, greenhouse gases and a variety of other air contaminants from the sector. Future environmental expenses that will be incurred by these companies will be significant, including the cost of carbon and coke oven gas desulphurization technologies. Capital investments to address these and other environmental issues are expected to total hundreds of millions of dollars. Many of these environmental costs have not and will not be incurred by some of the international steelmakers which Ontario steelmakers compete against. The trade exposure within the steel sector is higher than any other sector globally. The costs of any additional environmental restrictions required of integrated iron and steel manufacturers should be carefully considered, given the importance of the sector to the Canadian economy and the precarious operating and financial situation that global and domestic steel markets have dictated for the sector.

44
CHEMINFO
6. Bibliography 1. Canadian Industry Program for Energy Conservation (2007), Benchmarking Energy Intensity in the
Canadian Steel Industry. 2. Canadian Steel Producers Association (2016), House of Commons Standing Committee on International
Trade – Study on the Trans-Pacific Partnership (TPP) Agreement. 3. Canadian Steel Producers Association (2016), Presentation by Mr. Joseph Galimberti (President,
Canadian Steel Producers Association) to the Standing Committee on Industry, Science and Technology. 4. Canadian Steel Producers Association, Canadian Steel Producers Association (CSPA) 2017 Pre-Budget
Submission. 5. CBC News (July, 2019), Trump Makes Buy America Rules More Restrictive, Demanding 75% U.S.
Components. 6. Government of Canada, Steel and Aluminum. 7. Government of Canada, Trade Data Online, Trade by Product, HS 72. 8. Hamilton Chamber of Commerce, (2018), Support the Canadian Steel Industry and its Supply Chain. 9. International Organization of Motor Vehicle Manufacturers Website, Production Statistics. 10. International Trade Administration (2019), Global Steel Trade Monitor, Steel Exports Report: United
States. 11. Kingdom of Belgium and the Organisation for Economic Cooperation and Development (2016), High-
Level Meeting – Excess Capacity and Structural Adjustment in the Steel Sector – Background Note No. 2 – Capacity Developments in the World Steel Industry.
12. OECD (2018), Steel Trade and Trade Policy Developments: A Closer Look at NTMs, presented at the 84th Session of the OECD Steel Committee.
13. Organisation for Economic Cooperation and Development (2017), Evaluating the Financial Health of the Steel Industry.
14. Organisation for Economic Co-operation and Development (2018), Facilitating Structural Adjustment in the Steel Sector.
15. Organisation for Economic Co-operation and Development (2018), Recent Developments in Steelmaking Capacity.
16. Organisation for Economic Cooperation and Development (2019), Recent Trade Policy Developments, prepared for discussion at the 86th Session of the Steel Committee.
17. Organisation for Economic Co-operation and Development (2018), Steel Market Developments Q2 2018.
18. Organisation for Economic Cooperation and Development (2019), Steel Market Developments, presented at the 85th session of the Steel Committee.
19. Organisation for Economic Cooperation and Development, Steelmaking Capacity Database. 20. Phoenix SPI (December, 2018), Canadian Steel Imports and Market Share Monthly Report, prepared
for the Canadian Steel Producers Association. 21. Report of the Standing Committee on International Trade (June, 2017), The Canadian Steel Industry’s
Ability to Compete Internationally. 22. United Steelworkers and the Canadian Steel Producers Association (2016), Open Letter to the Prime
Minister on Global Overcapacity in the Steel Sector. 23. World Steel Association (2019), Fact Sheet – Energy Use in the Steel Industry. 24. World Steel Association, Steel Statistical Yearbook [multiple issues].