Embed Size (px)
Citation preview
Economic Conditions in New England and the Nation
Yolanda Kodrzycki Vice President and Director, NEPPC
Federal Reserve Bank of Boston
Joint Economic BriefingNew Hampshire House and Senate
Finance and Ways and Means CommitteesJanuary 7, 2013

The Federal Reserve Bank of Boston promotes sound growth and financial stability in New England and the nation. The Bank contributes to local communities, the region, and the nation through its high-quality research, regulatory oversight, and financial services, and through its commitment to leadership and innovation.
The New England Public Policy Center promotes better public policy in New England by conducting and disseminating objective, high-quality research and analysis of strategically identified regional economic and policy issues. When appropriate the Policy Center works with regional and Bank partners to advance identified policy options.

Outline:
• Status of the economic recovery in New England and nationally.
• Federal Reserve Open Market Committee forecast for the nation.
• Discussion of risks:– Federal budget decisions– Eurozone economic problems

Employment is recovering in both New England and the nation, but job counts remain 3 percent below peak.
Source: Bureau of Labor Statistics and NBER/Haver Analytics
US NE NH
Employment Change from Peak to Nov-2012
-4.2mil -219.0k -26.5k

Since hitting bottom, employment growth has been slower in New England than nationwide.
Source: Calculations Based on Bureau of Labor Statistics Data/Haver Analytics
US NE NH
Employment Change from Trough to Nov-2012
+4.6mil +128.7k +4.9k

Of the New England states, only MA has kept pace with U.S. job growth in the past year.
Source: Calculations Based on Bureau of Labor Statistics Data/Haver Analytics
US NE NH
Employment Change from Nov-2011 to Nov-2012
+1.9mil +46.8k -1.7k
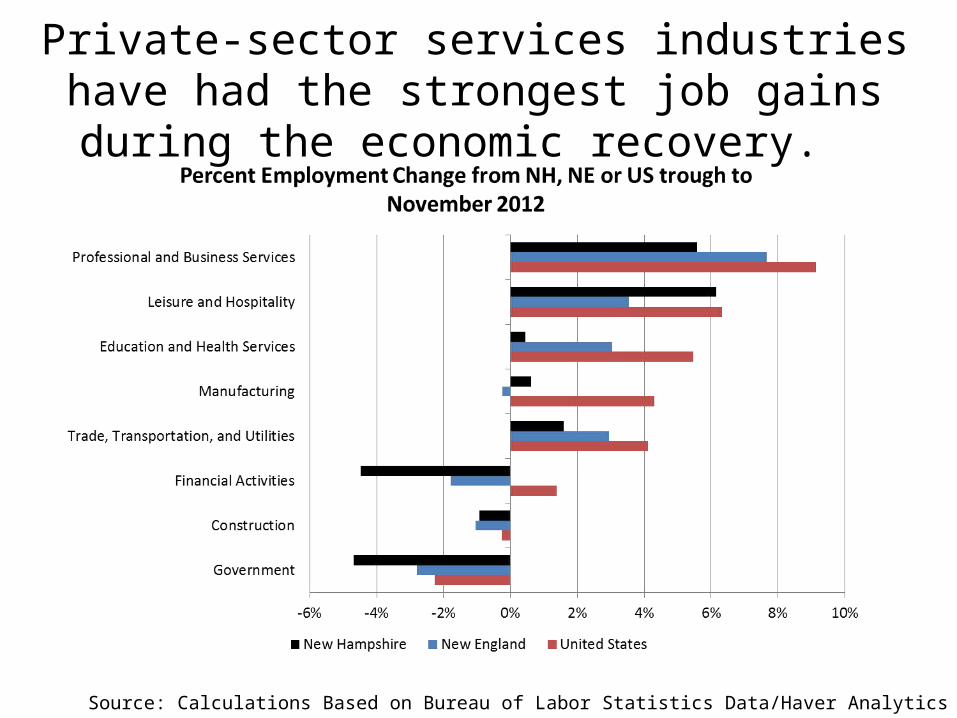
Private-sector services industries have had the strongest job gains during the economic recovery.
Source: Calculations Based on Bureau of Labor Statistics Data/Haver Analytics

Industry patterns remained similar during the past year.
Source: Calculations Based on Bureau of Labor Statistics Data/Haver Analytics

Unemployment continues to fall nationally, but has increased recently in New England.
Source: Bureau of Labor Statistics and NBER/Haver Analytics
US NE NH
Current Unemployment Rate 7.8%(Dec)
7.3%(Nov)
5.6%(Nov)

A broader measure of labor underutilization shows U.S. and New England unemployment at 14 percent.
Source: Bureau of Labor Statistics and NBER/Haver Analytics
US NE NH
Current U-6 Unemployment Rate 14.4%(Dec)
13.8%(Q3)
11.1%(Q3)
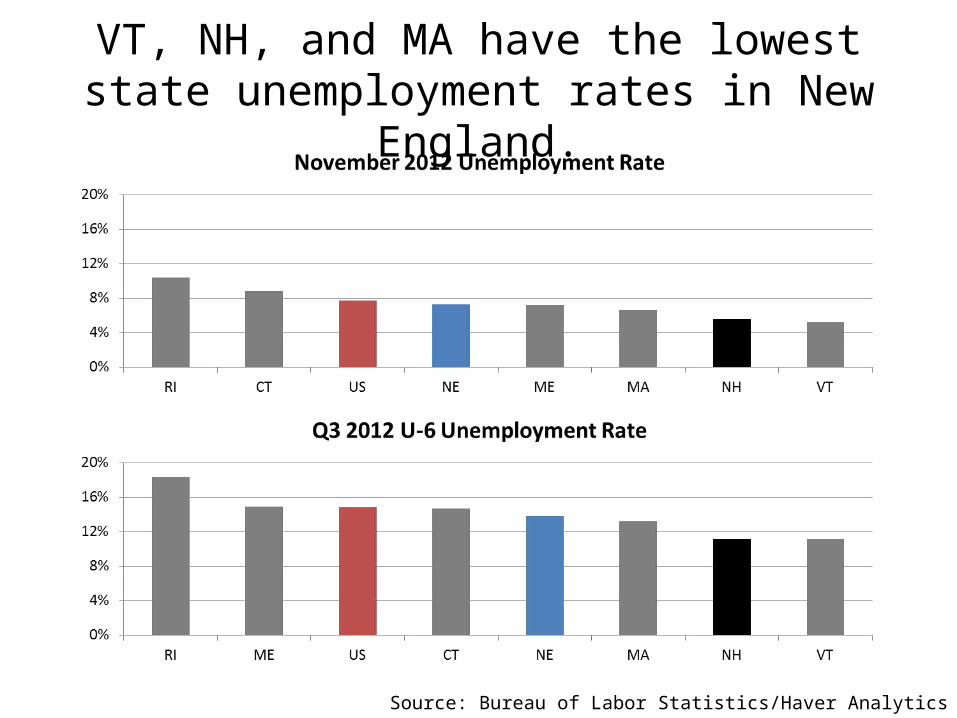
VT, NH, and MA have the lowest state unemployment rates in New England.
Source: Bureau of Labor Statistics/Haver Analytics

House prices are finally stabilizing at levels roughly 20 percent below peak.
Source: Federal Housing Finance Authority, Zillow Home Value Index, and NBER/Haver Analytics
US NE NH
Peak FHFA Index 100 100 100
Current FHFA Index 83(-17%)
85(-15%)
82(-18%)
Peak Median Home Price (Zillow) $193.7k $244.5k
Current Median Home Price (Zillow)
$152.7k(-21%)
$184.1k(-25%)

House prices in RI, CT, and NH remain slightly down from year-earlier, according to both FHFA and Zillow.
*Vermont Median Home Price change reflects Q2 2011 to Q2 2012.Source: Federal Housing Finance Authority and Zillow Home Value Index/Haver Analytics

Foreclosure rates have fallen well below their 2009-10 peak levels.
Source: Mortgage Bankers Association and NBER/Haver Analytics
US NE NH
Current Foreclosure Starts – Percentage of All Home Loans 0.9% 0.9% 0.8%
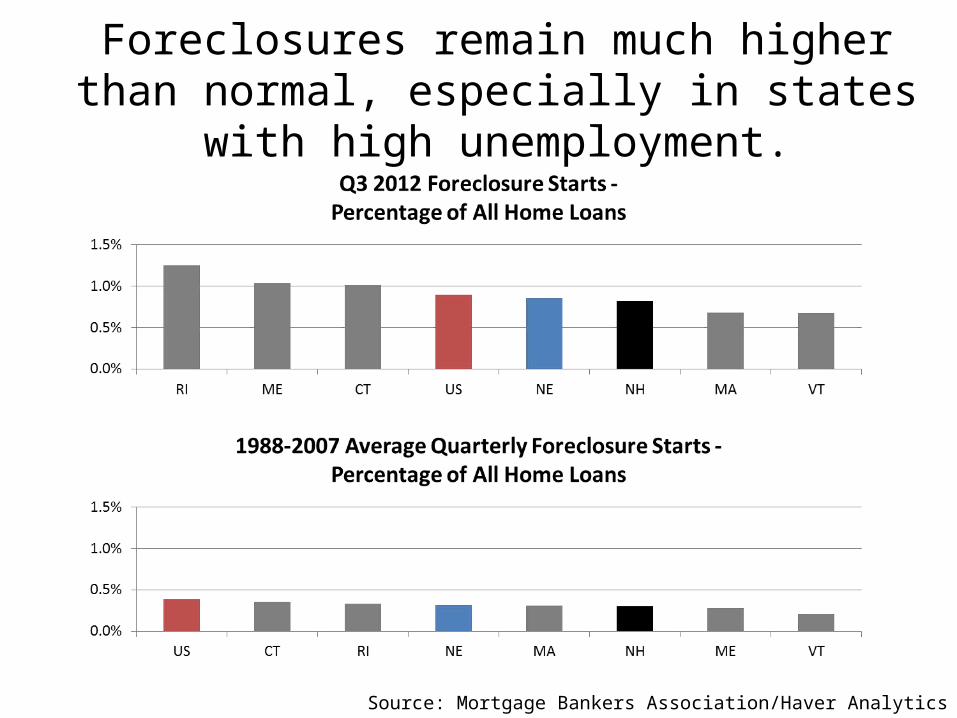
Foreclosures remain much higher than normal, especially in states with high unemployment.
Source: Mortgage Bankers Association/Haver Analytics

U.S. exports have grown since the recession ended but New England exports have slowed during the past year.
Source: WISER and NBER/Haver Analytics

Exports declined in most of the New England states in 2012.
Source: WISER/Haver Analytics

Federal Reserve officials expect somewhat elevated unemployment but low inflation through 2014-15.
Source: Federal Open Market Committee, Summary of Economic Projections for the Meeting of December 11-12, 2012. Bureau of Labor Statistics and Bureau of Economic Analysis/Haver Analytics. Table shows central tendencies among the Federal Reserve Board governors and Federal Reserve Bank presidents.
Note: Projections are fourth-quarter–to- fourth-quarter growth rates except for the unemployment rate, which is the fourth quarter level. PCE = personal consumption expenditures.
Actual Forecast
CY 2011Q4
CY 2012Q4
CY 2013Q4
CY 2014Q4
CY 2015Q4
Longer Run
Real GDP growth (%) 2.0 1.7 to 1.8 2.3 to 3.0 3.0 to 3.5 3.0 to 3.7 2.3 to 2.5
Unemployment rate (%) 8.7 7.8 to 7.9 7.4 to 7.7 6.8 to 7.3 6.0 to 6.6 5.2 to 6.0
PCE inflation (%) 2.5 1.6 to 1.7 1.3 to 2.0 1.5 to 2.0 1.7 to 2.0 2.0

Fed set economic criteria for continuing its accommodative policies.
• Federal funds rate target remains between 0 and ¼ percent.
• Economic criteria for maintaining this target range: • unemployment above 6½ percent• inflation expectations below 2½ percent
• Continued efforts to reduce longer-term interest rates (“QE3”)• Purchases of agency mortgage-backed securities ($40 billion
per month) and longer-term Treasury securities ($45 billion per month)
• No specific end date
Source: Federal Open Market Committee Press Release of Meeting of December 12, 2012

Fed cited continued economic headwinds.
• Tight credit conditions for some borrowers.
• Uncertainty about federal fiscal policy.
• Slowdown in global economic growth and uncertainty about European fiscal and banking situation.
Source: Federal Open Market Committee Minutes of Meeting of December 11-12, 2012.
No reasonable way to quantify the effects of a worst-case scenario.
• Possible worst-case scenarios:• United States: impasse over raising the federal government
debt ceiling• Europe: sovereign debt default or breakdown of euro area• ???
• Would likely have major financial-market and economic implications globally.
• New England state economies would suffer along with the rest of the nation.
• Fortunately, political leaders have been able to “muddle through” so far.
Measure other vulnerabilities by looking at GDP effects.
• Possible scenarios for 2013:• U.S. federal government reduces its spending more than
forecasters currently assume.• European economies are weaker than forecasters currently
assume.
• Economic forecaster methodology:• Translate these “what if” scenarios into their effects on U.S.
GDP (in percentage points). • Subtract from current forecasts (roughly 2.3 to 3 percent
U.S. GDP growth in 2013).
• Today’s presentation: provide guide to magnitudes and relative rankings of the New England states relative to the U.S. average.

Federal spending on procurement and pay accounts for about 3% to 6% of GDP in the New England
states.
Source: Pew Center on the States, “The Impact of the Fiscal Cliff on the States.” November 2012.

In addition, any cutbacks in federal grants would have direct effects on state budgets.
Source: Pew Center on the States, “The Impact of the Fiscal Cliff on the States.” November 2012.

Europe accounts for a higher-than-average share of foreign sales for New England exporters.
Source: WISER and Census Bureau/Haver Analytics

European exports range from 0.7% to 2.4% of GDP in the New England states
Source: WISER, Census Bureau, and BEA/Haver Analytics

Summary
• The U.S. and New England economies continue to recover at a moderate pace. Unemployment remains elevated, but the housing market is showing signs of recovery.
• Seeing “more of the same,” the Federal Reserve has committed to maintaining an accommodative monetary policy until specific thresholds are reached.
• How Washington resolves the spending side of the fiscal cliff matters a lot to state economies and state budgets.
• Foreign trade patterns indicate that New England has relatively high exposure to European economies.