Embed Size (px)
Citation preview

Economic Consequences of Pollinator Declines: A Synthesis
Dana Marie Bauer and Ian Sue Wing
Submitted ARER – August 1, 2010
Dana Bauer is Assistant Professor and Ian Sue Wing is Associate Professor, both in the
Department of Geography and Environment at Boston University.
This paper is based on an invited presentation at the Northeastern Agricultural and Resource
Economics Association annual meeting held in Atlantic City, New Jersey, June 13-15, 2010.
This invited paper has not undergone the journal’s normal refereeing process.
The authors are grateful to Rachel Ann Nalepa and Carrie-Anne Solana for valuable research
assistance.

1
Abstract
This paper surveys the literature on pollinator declines and related concerns regarding global
food security. Methods for valuing the economic risks associated with pollinator declines are
also reviewed. A computable general equilibrium approach is introduced to assess the effects of
a global catastrophic loss of pollinators. There appears to be evidence supporting a trend
towards future pollinator shortages in the U.S. and other regions of the world. Results from the
CGE model show economic risks to both direct crop sectors and indirect non-crop sectors in the
economy, with some amount of regional heterogeneity.
Key Words: ecosystem services, pollinators, food security, valuation, computable general
equilibrium modeling

2
Introduction
This paper deals with the impacts on the economy of changes in the supply of the services
provided by natural ecosystems. A key challenge for research on this topic is the multi-faceted
nature of ecosystem services, in terms of not only the scope of benefits they provide to society,
but also their own characteristics and the channels through which their influence is felt. Even if
we restrict the scope of our investigation to agriculture, the myriad ecosystem services provided
to and generated by the sector (e.g., Zhang et al. 2007) are too numerous to rigorously review in
a single article-length manuscript. Thus, rather than give a broad and superficial overview of the
topic, we focus in more depth on a single well-defined service: pollination, whose primary
impact on the economy is through the productivity of a comparatively narrow slate of crops. We
synthesize the literature on pollinator declines with the objective of characterizing the associated
risks, and quantifying what those risks might mean in terms of adverse shocks to yields in
different crop categories and regions. We then briefly review existing methods for valuing such
shocks before introducing a novel general equilibrium assessment approach and highlighting a
few of its preliminary results.
Pollination is a valuable ecosystem service, providing a variety of benefits including food
and fiber, plant-derived medicines, ornamentals and other aesthetics, genetic diversity, and
overall ecosystem resilience (MEA 2003; Naban and Buchmann 1997). The issue of pollinator
declines began to receive widespread attention in 2006 when the popular press reported on the
mysterious disappearances of managed honey bee colonies across the U.S. Bees were leaving
their colonies in search of pollen and nectar—a typical day of work for a honey bee—but not
returning to the hive. There does not appear to be any single pest or pathogen responsible for
this phenomenon, which scientists have named Colony Collapse Disorder (CCD), and the U.S. is
3
currently spending millions of dollars to investigate its potential causes and develop management
guidelines and mitigation strategies (Pettis and Delaplane 2010).
At the global scale, declines in pollinator populations and species diversity more broadly
have raised concerns regarding potential risks to global food security and economic
development, particularly in countries where agriculture is a large portion of the economy
(Kluser and Peduzzi 2007; Steffan-Dewenter et al. 2005; Allen-Wardell et al. 1998). From an
ecological perspective, pollinator declines present additional risks to ecosystem stability and loss
of biodiversity, not only of the pollinator species themselves but also the plants they pollinate
(Biesmeijer et al. 2006; Kearns et al. 1998). Evidence exists of local and regional declines of
both managed and wild insect pollinators (vanEngelsdorf and Meixner 2010; NRC 2007; Potts et
al. 2010), which appear to be a result of pests, diseases, pesticides, habitat destruction and
agricultural intensification (vanEngelsdorf and Meixner 2010; Winfree et al. 2009; Le Feon et al.
2010; Kremen et al. 2002; Cunningham 2000).
Flowering plants require pollination to produce seed or fruit. Some plants are wind
pollinated and others are self-pollinated, but many plant species require animal-mediated cross-
pollination (NRC 2007). Even in those plant species capable of self-pollination, animal
pollination can increase the quantity and quality of production (Klein et al. 2003; Roubik 2002).
At the global level, 75% of primary crop species and 35% of crop production rely on some level
of animal pollination (Klein et al. 2007). Gallai et al. (2009a) estimate the value of this
pollination service to be €153 billion (~$200 billion). In the United States, more than half of
primary crop species and 20% of primary crop production rely in part on animal pollination. A
recent study estimates the value of honey bee pollination alone in the U.S. at $14.6 billion, which
reflects both direct crop and indirect livestock feed values (Morse and Calderone 2000).

4
Including the benefits of wild pollination services would increase the value further. The key
issue addressed by the paper is the extent to which these figures fully capture the opportunity
costs of pollination services, and in turn accurately account for the economic losses that would
be experienced in the event of a sudden pollinator decline.
The remainder of the paper is organized as follows. The next section describes the role
of managed and wild pollinators in crop production and surveys our current understanding of the
risks associated with pollinator declines and their dependence on key trends in agriculture.
Drawing on these discussions we offer an assessment of the potential effects of a sudden
pollinator decline on global crop yields. In section three, we critically review the various
approaches previously used for valuing pollination services, and, by extension, estimate the
economic consequences of a reduction in their supply. Section four presents a new approach to
assessing the economy-wide effects of pollinator declines based on the application of computable
general equilibrium (CGE) models, and discusses the insights it can provide into the spillover
impacts of pollinator declines on the costs of production in agriculture and non-agricultural
sectors, changes in the relative prices of commodities and factors, and consumers’ welfare. In
the final section, we summarize our findings and offer suggestions for future research.
Agriculture’s Dependence on Pollinators
Animal pollinators include many insect species, as well as several species of birds and bats
(Naban and Buchmann 1997). Animal pollination of agricultural crops is provided by both
managed and wild pollinators. European honey bees (Apis mellifera) are the most common
managed pollinator species, which possess several characteristics that make them good
pollinators (NRC 2007). First, they are generalist pollinators that are physically capable of

5
pollinating many different plant species. Second, they exist in large, perennial colonies with up
to 30,000 individuals that are available for crop pollination year round. Third, they are able to
forage over large distances, so that their placement within large monoculture fields allows them
to provide pollination services over a wide area. Fourth, they communicate with other members
of the hive regarding location of food sources, making them highly efficient pollinators. And,
finally, honey bees produce honey, a valuable, commercially-marketed product.
Wild pollinators are also important for agricultural production (Veddeler et al. 2008;
Klein et al. 2003). Although honey bees can pollinate many plant species, they are not always
the most efficient pollinator on a bee-per-plant-visit basis. For example, yucca plants are highly
dependent on yucca moths for their pollination (NRC 2007). Principal pollinators vary by plant
species, geographical location, and time of year (NRC 2007; Kearns et al. 1998). In many
developing regions, wild pollinators are the sole provider of pollination services available to
small scale farmers because of the high costs associated with maintaining managed colonies
(Kasina et al. 2009). Wild and managed pollinators can also have complementary behavioral
relationships which increase the efficiency of pollination (Greenleaf and Kremen 2006; Klein et
al. 2003). And lastly, as discussed below, there are insufficient numbers of managed honey bees
available to fully service all pollinator-dependent crops. Thus, both managed and wild
pollinators contribute to the global production of agricultural crops, although the relative
populations of the two categories and the mix of pollinator species vary substantially by crop and
region.
Pollinator dependency is a measure of the level of impact that animal pollination has on
the productivity of particular plant species. Klein et al. (2007) recently reviewed the literature on
animal pollination and developed a classification system for animal pollinator dependency:

6
1. essential – production reduced by ≥ 90% without pollinators
2. great – production reduced by 40 to <90%
3. modest – production reduced by 10 to <40%
4. little – production reduced by >0 to <10%
5. none – no reduction in production
6. unknown – no literature available.
In their review, Klein et al. (2007) found that 87 out of 115 global primary food crops
require some level of animal pollination. The level of pollinator dependency varies dramatically
among crops, with the highest level of dependence found predominantly in fruits, vegetables, and
nuts. Crops that are essentially dependent on animal pollination include Brazil nuts, cantaloupe,
cocoa beans, kiwi fruit, pumpkins, squash, vanilla, and watermelon (Klein et al. 2007). Many
crops have reduced production in the quantity or quality of the plant part consumed directly by
humans, while other crops have reduced production of seeds that are used to produce the
vegetative parts of plants that humans consume.
The Risk from Pollinator Declines
The potential adverse effects of pollinator declines include direct economic losses incurred by
reduced crop yields as well as broader impacts on agricultural activity as a consequence of lower
productivity in the ecosystems which sustain it (through, e.g., nutrient cycling). While there is
concern that the magnitude of the latter effects may be very large, the relevant causal chains—
from reduced animal pollination to the population dynamics of wild plant species to changes in
the structure of food webs, the health of ecosystems, and the supplies of their services to
agriculture—have yet to be systematically elaborated. Perhaps in recognition of the enormity of

7
this task, the literature on the societal impacts of pollinator declines has tended to focus on the
direct implications for crop production and global food security.
But even the magnitude of the direct impact is the subject of controversy (Ghazoul
2005a, 2005b; Steffan-Dewenter et al. 2005). While Klein et al. (2007) found that 75% of
primary global food crop species relies on some amount of animal pollination, only 35% of crop
production is pollinator dependent. At least 60% of global food crop production comes from
plant species that do not require animal pollination (e.g., cereals and grains), while 5% of
production comes from crops with unknown pollinator dependency. Comparing pollinator-
dependent and non-dependent crop production at the global level suggests that all regions exhibit
a consistently heavy reliance on non-dependent food crops (Figure 1). Aizen et al. (2009) found
similar results when dividing the world into developed and developing countries and Ashworth
et al. (2009) found similar results for Mexico alone. Thus, from a total caloric perspective, there
does not appear to be a current risk to food security from pollinator declines.
INSERT FIGURE 1 NEAR HERE
Some have argued, however, that there may be a global food security risk from a micro-
nutrient perspective, as the majority of pollinator dependent crops are fruits, vegetables, and nuts
(Gallai et al. 2009; Steffan-Dewenter et al. 2005). This raises the question of future trends in
food consumption vis-à-vis nutritional content. Figure 2 shows an increase in the percentage of
total harvested acreage due to pollinator-dependent crops, suggesting an increasing reliance on
animal pollinators. Aizen et al. (2009, 2008) provide a more detailed discussion of this global
trend.

8
INSERT FIGURE 2 NEAR HERE
U.S. crop production data also indicate an increase in the harvested acreage of pollinator-
dependent crops, from less than 20% of total acres harvested in 1961 to greater than 25% in 2008
(Figure 3). The majority of this growth occurred in crops that are classified as modestly
dependent on animal pollination (i.e., 10-40% of yields would be lost without pollination
services). Particularly large increases in harvested acreage occurred for almonds, soybeans, and
sunflower seeds.
INSERT FIGURE 3 NEAR HERE
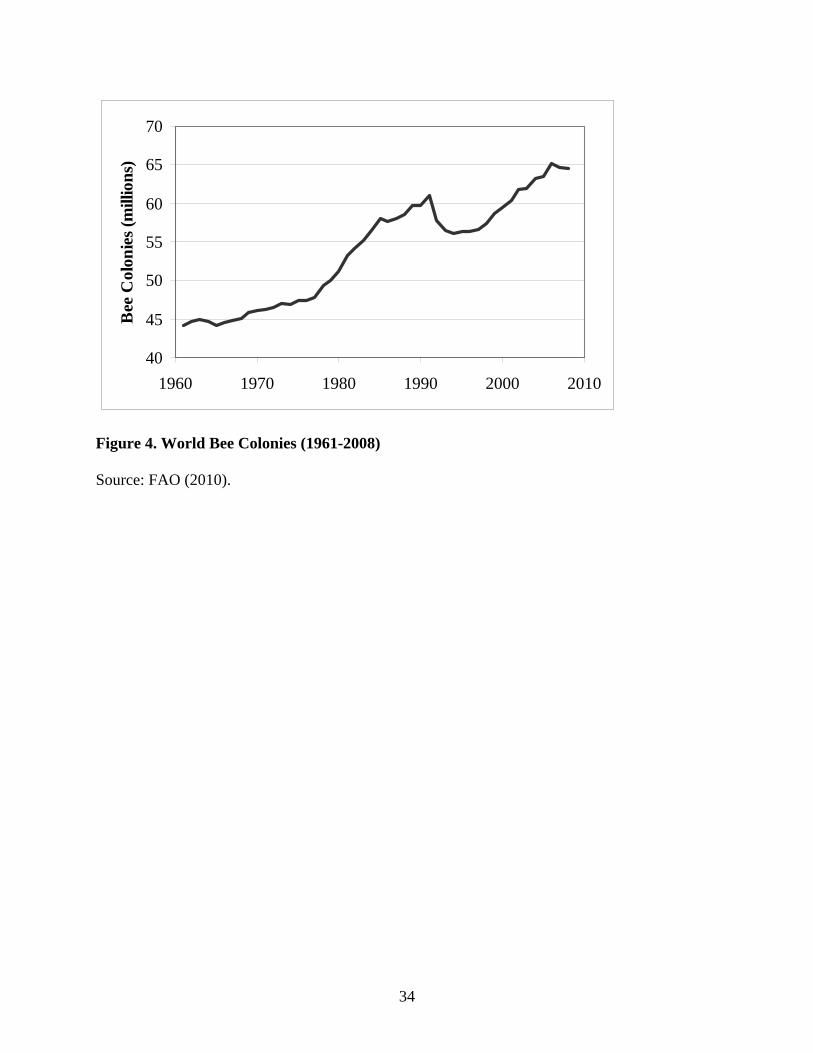
It is difficult, if not impossible, to assess the status of wild pollinators on a global scale
(Aizen and Harder 2009). However, studies have shown declines at the local and regional level,
particularly in Europe and North America (Potts et al. 2010; Beismeijer et al. 2006). In terms of
managed pollinators, the number of colonies globally has steadily increased over the past 50
years (Figure 4; Aizen and Harder 2009). However, similar to wild bees, managed bee colonies
have declined on a regional scale, especially in Europe and North America (Figure 5; Aizen and
Harder 2009; vanEngelsdorp and Meixner 2010).
INSERT FIGURES 4 AND 5 NEAR HERE

9
Figure 6 (solid line) shows a decline in U.S. honey-producing colonies over the past
twenty years. While some of this decline can be explained by lower world prices for and
increasing imports of honey causing beekeepers to leave the industry (vanEngelsdorp and
Meixner 2010; Sumner and Borriss 2006), other bee colony losses are due to parasites,
pathogens, and Colony Collapse Disorder (Johnson 2010; vanEngelsdorp et al. 2008, 2009). The
trend for total honey bee colonies is less obvious (Figure 6 square dots). There appears to have
been a decline in the total number of colonies between 1987 and 2002, however, the recent sharp
increase in 2007 provides circumstantial evidence that some beekeepers who exited the honey-
producing market may have now entered the pollination market.
INSERT FIGURE 6 NEAR HERE
In attempting to address the food security question, it is important to distinguish between
pollinator declines and pollinator shortages (Aizen et al. 2009, 2008). A pollinator decline is a
reduction in population size (i.e., the number of individuals) or biodiversity (i.e., the number of
species), while a pollinator shortage occurs when the demand for pollination services exceeds the
available supply. Despite evidence of local and regional declines among managed and wild
pollinators, little evidence of current pollinator shortages appears in the literature. However, we
argue here that three current trends due indeed indicate the potential for future shortages both
regionally and in the U.S. First, the demand for pollination services, as indicated by acreage for
pollinator-dependent crops, is increasing (Figures 2 and 3), while the supply of managed bees is
declining in some regions (Figures 5 and 6). In addition, the rate of growth in the global supply
of managed bees is less than the rate of growth in global demand for pollination services, as

10
indicated by pollinator-dependent crop acreage, suggesting the potential for future shortages of
pollination services on a global scale (Aizen and Harder 2009).
Second, prices for managed honey bee colony rentals in California, the Pacific
Northwest, and the mid-Atlantic have increased dramatically over the past few years (Burgett et
al. 2010; Caron 2010; Sumner and Borriss 2006), reflecting both the increase in demand for
pollination services particularly from almond growers in California, and declines in the supply of
honey bee colonies (Sumner and Borriss 2006). The average bee colony rental fee in the Pacific
Northwest has risen from $19.25 per colony in 1992 to $89.90 in 2009 (Burgett 2009). In
addition, an insufficient supply of honey bee colonies for almond growers in 2007, due to a high
rate of CCD winter kills, resulted in the loosening of trade restrictions on the import of honey
bee queens (vanEngelsdorp and Meixner 2010). The California almond industry currently
accounts for 66% of California and 34% of Pacific Northwest honey bee colony rentals (Burgett
et al. 2010). Many of these colonies travel to a second crop field later in the growing season, but
this level of almond pollination services does suggest the potential for a shortage of managed
bees for other pollinator-dependent crops.
Third, the number of managed honey bee colonies available per hectare of pollinator-
dependent harvested crop acreage over the past 47 years has declined both globally and for the
U.S. (Figure 7). By way of comparison, recommended managed honey-bee colony densities
range between 0.5 and 2.5 colonies per acre (1.2 to 6.2 colonies per hectare) for various
pollinator-dependent crops (Burgett et al. 2010).
INSERT FIGURE 7 NEAR HERE

11
All three of these trends suggest an increasingly heavy reliance on wild pollinators for
agricultural production both globally and in the U.S and that this reliance on non-marketed
ecosystem services is increasing. As a non-rival and non-exclusive public good, wild pollination
services will be under-provided without some type of government program or policy
intervention. This issue is compounded by substantial land use change across the U.S. and other
countries that continues to reduce the availability of pollinator habitat (Brown et al. 2005;
Hansen et al. 2005; Alig and Plantinga 2004; Theobold 2001). With continual losses of wild
pollinator habitat and corresponding regional declines in wild pollinator populations and
diversity, these results would seem to portend future pollinator shortages.
Reading these tea leaves, the principal question that arises is what exactly a sudden
decline in the supply of pollination services might mean for global and U.S. crop yields. One
way to arrive at an answer is to summarize the quantity of agricultural production at risk on a
regional basis, which Figure 1 does. Its aggregation across different crop yields on a mass basis
would seem to suggest that the relevant figures are small; however such a conclusion is belied by
the fact that the crops in question differ widely in their characteristics, economic uses, and
therefore value. Our preferred summary measure is presented in Table 1, which weights the
yields of different crops by their prices, calculating the fractions of the value of three key crop
groups that are pollinator-dependent—and therefore at risk. These numbers point to a very
different conclusion: while a disappearance in pollination services is unlikely to be catastrophic,
in every region of the world it nonetheless constitutes a serious adverse shock to the production
of fruits and nuts.

12
It is then natural to ask how big an economic loss is associated with the decline in yields
underlying Table 1. To come to grips with this issue it is necessary to confront the thorny
problem of how pollination services should be valued, which is the subject of the next section.
Valuing Pollination Services
Economic valuation of pollination services provides information on the economic consequences
of potential pollination shortages and contributes to the decision-making process regarding
selection of alternative mitigation strategies. Valuation studies focused on pollination services
supplied to agriculture have thus far fallen into one of five categories. The first category
contains studies that value the pollination services provided by managed, commercially-available
bee colonies. Because these pollination services are exchanged through markets, the price can be
used as a direct per-unit measure of value (Burgett et al. 2010; Caron 2010; Burgett 2009).
Although several species of insects are managed for commercial pollination, by far the dominant
managed species is the honey bee (NRC 2007). Rental fees for managed honey bees depend on
several factors including the price of honey, the price of the pollinated crop, the quality of the
honey that gets produced when pollinating a particular crop, the costs of maintaining a colony,
and the winter mortality rate which itself is a function of pests, disease, and weather. Prices for
bee colony rentals in 2009 in the Pacific Northwest ranged between $38 per colony for berries
and $150 per colony for almonds (Burgett 2009).
The second category of pollination valuation uses an approach that calculates the value of
total annual crop production that can be directly attributed to animal pollination. The calculation
typically entails a simple formula:
EVIP = D × Q × P (1)

13
where EVIP is the economic value due to insect pollination, D is the share of crop yield that
depend on pollinators (the “dependency ratio”), Q is annual crop production, and P is crop price.
The idea is that if there were a sudden “catastrophic” loss of pollinators, what would be the
instantaneous effect on crop production? This approach underlies the construction of Table 1,
and has been used to value managed bees (Morse and Calderone 2000; Robinson et al. 1989),
wild bees (Losey and Vaughan 2006), and both types of pollinators combined (Gallai et al.
2009a). However, it has been criticized for relying on untenable assumptions (Allsopp et al.
2008; Muth and Thurman 1995). The key weaknesses of the approach are its complete omission
of the costs of other inputs (e.g., chemicals, labor, and capital) to crop production, its assumption
that demand is perfectly elastic and that no price increase will result from the reduction in crop
supply, and its lack of recognition of options to substitute for animal pollination, including
mechanized and hand pollination or switching to a different less pollinator-dependent cultivar.
The third category of valuation studies addresses some of these limitations by measuring
the economic value of pollination as the sum of the changes to producer and consumer surplus
induced by the decrease in production due to a loss of pollination services (Kevan and Phillips
2001). This method has been applied to valuing the pollination services provided by managed
bees in a developed country context (Southwick and Southwick 1992) and by wild bees in a
developing country context (Kasina et al. 2009). In a variant of this approach, Gallai et al.
(2009a) estimate the loss in consumer surplus using a constant price elasticity of demand for all
crops and then conducting sensitivity analysis over a range of elasticity values. In each case, the
result is a partial equilibrium estimate that ignores the indirect effects of changes in crop
productivity on the rest of the economy, including changes in other input or output markets. For

14
example, a reduction in the supply of fruit and vegetables will also impact producers of
processed foods, as well as raising prices and the cost of food purchases to ultimate consumers.
The fourth type of analysis uses a replacement cost approach, whereby non-animal
pollination alternatives are considered viable substitutes. The idea is to estimate the costs of
other market-based pollination alternatives involving labor (hand pollination) or capital
(mechanized pollen dusting) that would be needed to maintain the level of crop production at
that specific level provided by animal pollinators (Allsopp et al. 2008). However, caution must
be used when applying replacement costs as they do not reflect individual preferences or actual
behavior and, thus, are not true welfare measures (NRC 2005). Farmers might not be willing to
pay the full amount for equivalent pollination services, particularly if the lost ecosystem services
were “free” non-marketed public goods.
In the final category of pollination valuation, a landscape-based approach is used to value
wild pollinator habitat. The objective of these studies is to relate the characteristics of habitat
fragments (e.g., size, shape, distance to crop land, density and diversity of pollinator species) to
crop yields (Morandin and Winston 2006; Oleschewski et al. 2006; Ricketts et al. 2004). The
strengths of this approach include its ability to rank a set of alternative landscape configurations
based on net benefits, benefits of increased crop yields less costs associated with modifying or
restoring the landscape, (Morandin and Winston 2006) and to simulate the effects of future land
use change scenarios (Priess et al. 2007). Analyses of this kind have thus far concentrated on the
production of coffee (Coffea arabica), a high-valued crop which grows mainly in tropical
countries where managed pollinators are not widespread (Veddeler et al. 2008; Priess et al 2007;
Oleschewski et al. 2006; Ricketts et al. 2004). Although coffee is a self-fertilizing plant species,
15
it benefits substantially from animal pollination in both quality and quantity of production (Klein
et al 2003).
Economic Consequences of Declining Pollination Services: General Equilibrium Analysis
In an effort to address some of the limitations of existing methods for assessing the economic
implications of pollinator loss, we developed a multi-region, multi-sector CGE model of
agricultural production and trade which incorporates the pollinator dependency of primary
agricultural crops. For two decades, CGE models have been widely used to perform numerical
assessments of the economy-wide consequences of agricultural policies and programs (Fraser
and Waschik 2005; Roe et al. 2005; Hertel and Tsigas 1988) and the mitigation of large-scale
environmental externalities such as climate change (Sue Wing, 2009; Bohringer and Loschel
2006). By comparison, the use of CGE models to investigate the potential impacts of
environmental change—including climate impacts and changes in the supply of ecosystem
services—on prices and welfare is still in its infancy (Carbone and Smith 2010, 2008; Carbone et
al. 2009; Espinosa and Smith 1995). The crucial improvement of the general equilibrium
modeling approach over the valuation methods described above lies in its ability to track changes
in prices across multiple interrelated markets in a consistent fashion, summarize the
macroeconomic effects of shocks by utilizing theoretically derived measures of welfare change,
and test the consequences of different possibilities to substitute for pollination inputs. Apart
from highly stylized theoretical work on the topic (Gallai et al. 2009b), to the best of our
knowledge, we are the first to pursue this kind of analysis.
Our model is a static simulation of the global economy which divides the world into 18
regions, each containing13 producing sectors, chosen to resolve detail in interrelated agricultural

16
markets. The model is numerically calibrated on the Global Trade Analysis Project (GTAP)
benchmark input-output dataset for the year 2004 (Narayanan and Walmsley 2008), augmented
with ancillary data from FAOSTAT on crop prices and production (FAO 2010). The model
incorporates Klein et al.’s (2007) pollinator dependency ratios as exogenous neutral shocks to
four broad crop sectors, in which production was represented using nested constant elasticity of
substitution (CES) functions that combined inputs of labor, capital, land and intermediate
commodities to create the output good.
Pollinator loss scenarios were envisaged to be catastrophic shocks to each regional
economy, with the services of pollinators (globally or regionally) being completely lost and the
productivity of pollinator-dependent crops declining by the mean fraction of the corresponding
dependency category (Klein et al. 2007). The model computes the changes in the prices of
commodities and factors and in sectors’ activity levels and households’ income levels necessary
to re-establish equilibrium in commodity, factor, and international trade markets in every world
region. In the process, it generates estimates of welfare loss (expressed as percent equivalent
variation) and revised prices, domestic production, imports, and household expenditures. The
simulated values of output losses were compared to the results of a partial-equilibrium “value of
pollinator-dependent production” calculation based on the same crop data and the same
catastrophic pollinator loss.
The estimated annual value of the reduction in global production due to lost pollination
services is listed in Table 2. By definition, the partial equilibrium analysis includes only those
losses in the agricultural crop sector. In comparison, the general equilibrium analysis includes
both direct crop sector effects and indirect non-crop sector effects. The partial equilibrium
analysis estimates the economic risk due to pollinator loss at $138.3 billion, while the general

17
equilibrium analysis estimates the crop sector losses to be $10.5 billion, an order of magnitude
less, but total economy-wide losses to be $334.1 billion, more than twice as much. Thus, the
partial equilibrium approach dramatically overestimates the direct impact to farmers while
underestimating the total impact on the economy by not accounting for price effects on
downstream sectors and households.
INSERT TABLE 2 NEAR HERE
Although the precise values of losses presented here are intended to be illustrative, three
important insights emerge from them. The first, mentioned above, is that the general equilibrium
model captures both direct and indirect effects of pollinator loss. While the indirect effects are
substantially larger than the direct effects in absolute dollar value (Table 2), when viewed as
percent changes from their baseline values, the direct effects (Figure 8) outweigh both the
indirect and the total effects (Figures 9 and 10). Second, the interregional distribution of the
burden of pollinator losses is more heterogeneous in the general equilibrium framework.
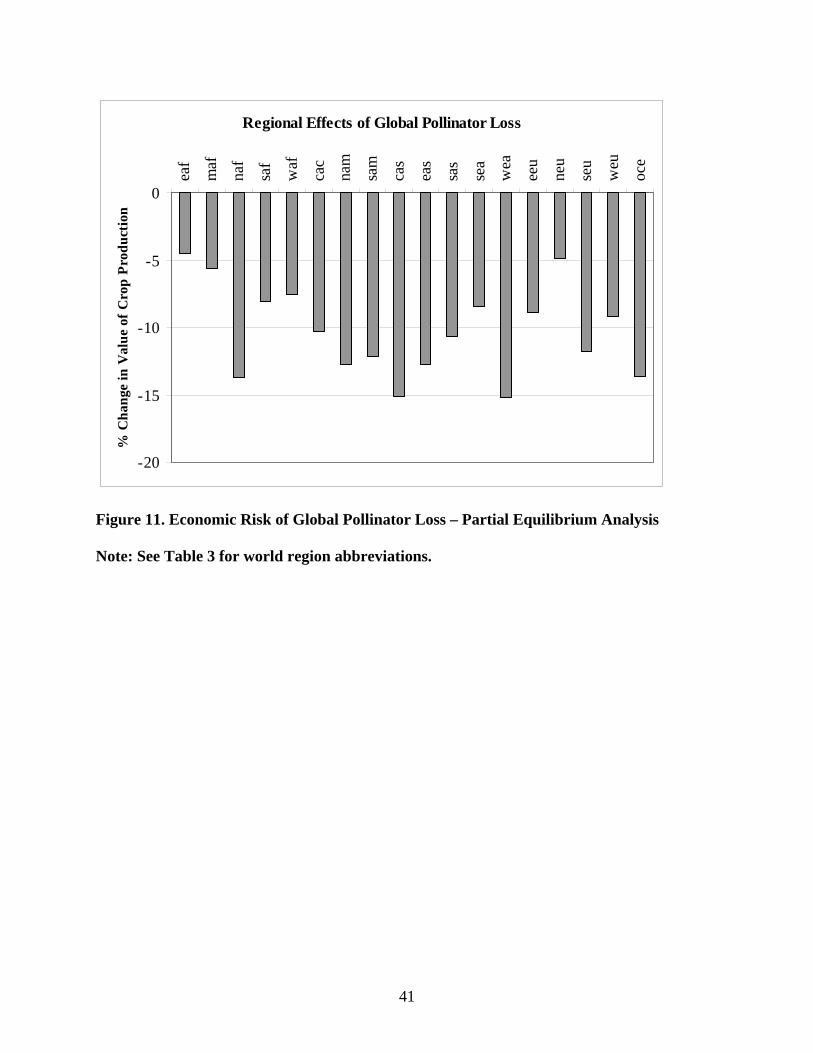
Although the partial equilibrium calculations indicate that a number of developed and developing
regions are economically vulnerable (Figure 11), our general equilibrium analysis helps put these
shocks in context. Thus, Western Africa appears to be particularly vulnerable (Figures 8 and 10)
because pollinator-dependent crops make up a relatively large share of that region’s agricultural
output, and agriculture sectors accounts for a substantial proportion of aggregate income. Third,
in some regions it is possible for pollinator declines to have a positive direct impact on the value
of crop production because agricultural products experience increases in their prices which

18
outweigh the decreases in their yields. For example, agricultural producers in Southern Africa
appear to benefit despite the fact that the region’s economy as a whole suffers a loss (Figure 9).
These examples highlight the enormous potential of our general equilibrium approach,
which we note is also capable of simulating the consequences of pollinator declines for
employment, welfare, and the terms of trade. Elaboration of these impacts is the subject of
ongoing research.
INSERT FIGURES 8-11 AND TABLE 3 NEAR HERE
Conclusions and Future Work
In this paper, we argue that there is compelling evidence for impending local or regional
shortages of pollination services that could have dramatic economic implications. We initially
characterized the effects of a global pollinator loss by estimating the value of crop production
that would be lost due to an instantaneous shock to the system with no allowance for substitution
or mitigation. Using a general equilibrium approach that simulates the full spectrum price and
quantity changes across agricultural and non-agricultural sectors of the economy, we show that
pollinator declines affect both sets of sectors, that the effects on downstream industries can be
quite large, and that some regions of the world (e.g., Africa) suffer much heavier burdens than
others.
However, improving the precision and establishing the robustness of our results will
likely necessitate modifications to the structure and parameterization of our nested CES
representation of the crop production process. In particular, the extent to which our current
implementation is able to capture the full range of substitution and mitigation strategies available

19
to crop producers is not clear. The principal reason is our incomplete understanding of the role
played by pollination services in the production of crops with different degrees of dependency,
especially quantifying the degree to which managed pollinators can substitute for wild species,
mechanized or hand pollination can substitute for pollination by animals, or the effect on yields
of inputs such as agro-chemicals that might enable them to act as substitutes for pollination
altogether. Remedying these gaps in our knowledge will likely entail a separate, complementary
program of empirical research, which in turn must await the development of datasets on
pollinator-dependent crop production that resolve pollination services as a separate input.
In terms of characterizing more radical margins of adjustment, future research could also
explore the role of technology-based and conservation-based mitigation strategies. Technology-
based strategies include the development of management regimes for more effective pollinator
pest and pathogen control, more efficient mechanized pollen dusters, and plant cultivars that are
less dependent on animal pollination, while conservation-based mitigation strategies include both
on-farm and off-farm habitat conservation. A more sophisticated understanding of substitution
and mitigation alternatives will greatly improve our understanding of producer decision-making
and enhance our ability to characterize the risks associated with pollinator declines.

20
References
Aizen, M.A. and L.D. Harder. 2009. “The global stock of domesticate honey bees is growing
slower than agricultural demand for pollination.” Current Biology 19:915-918.
Aizen, M.A., L.A. Garibaldi, S.A. Cunningham, and A.M. Klein. 2009. “How much does
agriculture depend on pollinators? Lessons from long-term trends in crop production.”
Annals of Botany 103:1579-1588.
Aizen, M.A., L.A. Garibaldi, S.A. Cunningham, and A.M. Klein. 2008. “Long-term global trends
in crop yield and production reveal no current pollination shortage but increasing pollinator
dependency.” Current Biology 18:1572-1575.
Alig, R.J. and A. Plantinga. 2004. “Future forestland area: impacts from population growth and
other factors that affect land values.” Journal of Forestry. 102(8): 19-24.
Allen-Wardell, G., P. Bernhardt, R. Bitner, A. Burquez, et al. 1998. “The potential consequences
of pollinator declines on the conservation of biodiversity and stability of food crop yields.”
Conservation Biology 12:8-17.
Allsopp, M.H., W.J. de Lange, and R.Veldtman. 2008. “Valuing insect pollination services with
cost replacement.” PLos ONE 3:e3128.
Ashworth, L., M. Quesada, A. Casas, R. Aguilar, and K. Oyama. 2009. “Pollinator-dependent
food production in Mexico.” Biological Conservation 142:1050-1057.
Biesmeijer, J.C., S.P.M. Roberts, M. Reemer, R. Ohlemuller, et al. 2006. “Parallel declines in
pollinators and insect-pollinated plants in Britain and the Netherlands.” Science 313:351-354.
Bohringer, C., and A. Loschel. 2006. “Computable general equilibrium models for sustainable
impact assessment: status quo and prospects.” Ecological Economics 60:49-64.

21
Brown, D.G., K.M. Johnson, T.R. Loveland, and D.M. Theobald. 2005. “Rural land-use trends in
the conterminous United States, 1950-2000.” Ecological Applications 15:1851-1863.
Burgett, M. 2009. “Pacific Northwest honey bee pollination economics survey 2009.” National
Honey Report 29:10-16.
Burgett, M., S. Daberkow, R. Rucker, and W. Thurman. 2010. “U.S. pollination markets: recent
changes and historical perspective.” American Bee Journal 150:35-41.
Carbone, J.C., C.Helm, and T.F. Rutherford. 2009. “The case for international emission trade in
the absence of cooperative climate policy.” Journal of Environmental Economics and
Management 58:266-280.
Carbone, J.C. and V.K. Smith. 2010. “Valuing ecosystem services in general equilibrium.”
NBER Working Paper No. w15844.
Carbone, J.C. and V.K. Smith. 2008. “Evaluating policy interventions with general equilibrium
externalities.” Journal of Public Economics 92:1254-1274.
Caron, D.M. 2010. “Bee colony pollination rental prices, eastern US with comparison to west
coast.” Available at http:/maarec.cas.psu.edu/pdfs/Pollination-rentals.pdf (downloaded
6/10/10).
Cunningham, S.A. 2000. “Depressed pollination in habitat fragments causes low fruit set.”
Proceedings of the Royal Society of London Series B 267:1149-1152.
Espinosa, J.A. and V.K. Smith. 1995. “Measuring the environmental consequences of trade
policy: a nonmarket CGE analysis.” American Journal of Agricultural Economics 77:772-
777.

22
Faehn, T. and E. Holmoy. 2003. “Trade liberalization and effects on pollutive emissions to air
and deposits of solid waste: a general equilibrium assessment for Norway.” Economic
Modeling 20:703-727.
FAO (Food and Agriculture Organization of the United Nations). 2010. FAOSTAT. Available at
http://faostat.fao.org.
Fraser, I. and R. Waschik. 2005. “Agricultural land retirement and slippage: lessons from an
Australian case study.” Land Economics 81:206-226.
Gallai, N., J.-M. Salles, J. Settele, and B.E. Vaissiere. 2009a. “Economic valuation of the
vulnerability of world agriculture with pollinator decline.” Ecological Economics 68:810-
821.
Gallai, N., J.-M. Salles, C. Figuieres, and B.E. Vaissiere. 2009b. “Economic assessment of an
insect pollinator decline: a general equilibrium analysis.” University of Montpellier Working
Paper 09-17. Available at http://ideas.repec.org/p/lam/wpaper/09-17.html.
Garibaldi, L.A., M.A. Aizen, S.A. Cunningham, and A.M. Klein. 2009. “Pollinator shortage and
global crop yield.” Communicative and Integrative Biology 2:37-39.
Ghazoul, J. 2005a. “Buzziness as usual? Questioning the global pollination crisis.” Trends in
Ecology and Evolution 20:367-373.
Ghazoul, J. 2005b. “Response to Steffan-Dewenter et al.: Questioning the global pollination
crisis.” Trends in Ecology and Evolution 20:652-653.
Greenleaf, S.S. and C. Kremen. 2006. “Wild bees enhance honey bees’ pollination of hybrid
sunflower.” Proceedings of the National Academy of Sciences 103:13890-13895.

23
Hansen, A.J., R.L. Knight, J.M. Marzluff, S. Powell, et al. 2005. “Effects of exurban
development on biodiversity: patterns, mechanisms, and research needs.” Ecological
Applications 15:1893-1905.
Hertel, T.W. and M.E. Tsigas. 1988. “Tax policy and U.S. agriculture: a general equilibrium
analysis.” American Journal of Agricultural Economics 70:289-302.
Johnson, R. 2010. Honey Bee Colony Collapse Disorder. CRS Report for Congress.
Congressional Research Service 7-5700.
Kasina, J.M., J. Mburu, M. Kraemer, and K. Holm-Mueller. 2009. “Economic benefit of crop
pollination by bees: a case of Kakamega small-holder farming in western Kenya.” Journal of
Economic Entomology 102:467-473.
Kearns, C.A., D.W. Inouye, and N.M. Waser. 1998. “Endangered mutualisms: the conservation
of plant-pollinator interactions.” Annual Review of Ecology and Systematics 29:83-112.
Kevan, P.G. and T.P. Phillips. 2001. “The economic impacts of pollinator declines: an approach
to assessing consequences.” Ecology and Society 5:1.
Klein, A.-M., B.E. Vaissiere, J.H. Cane, I. Steffan-Dewenter, et al. 2007. “Importance of
pollinators in changing landscapes for world crops.” Proceedings of the Royal Society B
274:303-313.
Klein, A.-M., I. Steffan-Dewenter, and T. Tshcarntke. 2003. “Fruit set of highland coffee
increases with the diversity of pollinating bees.” Proceedings of the Royal Society of London
Series B 270:955-961.
Kluser, S. and P. Peduzzi. 2007. Global Pollinator Decline: A Literature Review. UNEP/GRID-
Europe.

24
Kremen, C., N.M. Williams, and R.W. Thorp. 2002. “Crop pollination from native bees at risk
from agricultural intensification.” Proceedings of the National Academy of Sciences
99:16812-16816.
Kremen, C., N.M. Williams, R.L. Bugg, J.P. Fay, and R.W. Thorp. 2004. “The area requirements
of an ecosystem service: crop pollination by native bee communities in California.” Ecology
Letters 7:1109-1119.
Le Feon, V., A. Sshermann-Legionnet, Y. Delettre, S. Avioron, et al. 2010. “Intensification of
agriculture, landscape composition and wild bee communities: a large scale study in four
European countries.” Agriculture, Ecosystems and Environment 137:143-150.
Losey, J.E. and M. Vaughan. 2006. “The economic value of ecological services provided by
insects.” BioScience 56:311-323.
MEA (Millenium Ecosystem Assessment). 2003. Ecosystems and Human Well-Being: A
Framework for Assessment. Island Press, Washington, DC.
Morandin, L.A. and M.L. Winston. 2006. “Pollinators provide economic incentive to preserve
natural land in agroecosystems.” Agriculture, Ecosystems & Environment 116:289-292.
Morse, R.A. and N.W. Calderone. 2000. “The value of honey bees as pollinators of U.S. crops in
2000.” Bee Culture 128:1-15.
Muth, M.K. and W.N. Thurman. 1995. “Why support the price of honey?” Choices 10:19-21.
Naban, G.P. and S.L. Buchmann. 1997. “Services provided by pollinators.” In Daily, G.C., ed.
Nature’s Services: Societal Dependence on Natural Ecosystems. Island Press, Washington,
DC.
Narayanan, G. B. and T.L. Walmsley, Eds. 2008. Global Trade, Assistance, and Production: The
GTAP 7 Data Base, Center for Global Trade Analysis, Purdue University.

25
NRC (National Research Council). 2007. Status of Pollinators in North America. National
Academies Press, Washington, DC.
NRC (National Research Council). 2005. Valuing Ecosystem Services: Towards Better
Environmental Decision-Making. National Academy Press, Washington, DC.
Olschewski, R., T. Tscharntke, P.C. Benitez, S. Schwartze, and A.-M. Klein. 2006. “Economic
evaluation of pollination services comparing coffee landscapes in Ecuador and Indonesia.”
Ecology and Society 11:7.
Pettis, J.S. and K.S. Delaplane. 2010. “Coordinated responses to honey bee decline in the USA.”
Apidologie 41:256-263.
Potts, S.G., J.C. Biesmeijer, C. Kremen, P. Neumann, O. Schweiger, and W.E. Kunin. 2010.
“Global pollinator declines: trends, impacts and drivers.” Trends in Ecology and Evolution
25:345-353.
Priess, J.A., M. Mimler, A.-M. Klein, S. Schwartze, et al. 2007. “Linking deforestation scenarios
to pollination services and economic returns in coffee agroforestry systems.” Ecological
Applications 17:407-417.
Ricketts, T.H., G.C. Daily, P.R. Ehrlich, and C.D. Michener. 2004. “Economic value of tropical
forest to coffee production.” Proceedings of the National Academy of Sciences 101:12579-
12582.
Robinson, W.S., R. Nowogrodzki, and R.A. Morse. 1989. “The value of honey bees as
pollinators as pollinators of U.S. crops.” American Bee Journal 129:411-423, 477-487.
Roe, T., A. Dinar, Y. Tsur, and X. Diao. 2005. “Feedback links between economy-wide and
farm-level policies: with application to irrigation water management in Morocco.” Journal of
Policy Modeling 27:905-928.

26
Roubik, D.W. 2002. “The value of bees to the coffee harvest.” Nature 417:708.
Southwick, E.E. and L. Southwick. 1992. “Estimating the economic value of honey bees
(Hymenoptera: Apidae) as agricultural pollinators in the United States.” Journal of Economic
Entomology 85:621-633.
Steffan-Dewenter, I., S.G. Potts, and L. Packer. 2005. “Pollinator diversity and crop pollination
services are at risk.” Trends in Ecology and Evolution 12:651-652.
Sue Wing, I. 2009. “Computable general equilibrium models for the analysis of energy and
climate policies.” In J. Evans and L.C. Hunt, eds. International Handbook on the Economics
of Energy. Edward Elgar, Cheltenham.
Sumner, D.A. and H. Borriss. 2006. “Bee-conomics and the leap in pollination fees.”
Agricultural and Resource Economics Update 9:9-11.
Theobold, D. 2001. “Land-use dynamics beyond the American fringe.” The Geographical
Review 91:544-564.
USDA (Unites States Department of Agriculture). 2010a. Bee and Honey Inquiry. National
Agricultural Statistics Survey. Available at
http://www.nass.usda.gov/Surveys/Guide_to_NASS_Surveys/Bee_and_Honey.
USDA (Unites States Department of Agriculture). 2010b. Census of Agriculture. National
Agricultural Statistics Survey. Available at http://www.agcensus.usda.gov.
vanEngelsdorp, D. and M.D. Meixner. 2010. “A historical review of managed honey bee
populations in Europe and the United States and the factors that may affect them.” Journal of
Invertebrate Pathology 103:S80-S95.
vanEngelsdorp, D., J.D. Evans, C. Saeferman, C. Mullin, et al. 2009. “Colony Collapse Disorder:
a description study.” PloS ONE 4:e6481.

27
vanEngelsdorp, D., J. Hayes, R.M. Underwood, and J. Pettis. 2008. “A survey of honey bee
colony losses in the U.S., fall 2007 to spring 2008.” PloS ONE 3:e4071.
Veddeler, D., R. Olschewski, T. Tscharntke, and A.-M. Klein. 2008. “The contribution on non-
managed social bees to coffee production: new economic insights based on farm-scale yield
data.” Agroforestry Systems 73:109-114.
Winfree, R., R. Aguilar, D.P. Vazquez, G. LeBuhn, and M.A. Aizen. 2009. “A meta-anlaysis of
bees’ responses to anthropogenic disturbance.” Ecology 90:2068-2076.
Zhang, W., T.H. Ricketts, C. Kremen, K. Carney, and S.M. Swinton. 2007. “Ecosystem services
and dis-services to agriculture.” Ecological Economics 64:253-260.

28
Table 1. Percent Change in Value of Production of Select Crop Sectors Due to Global
Pollinator Loss
Africa Asia Europe
North
America
South
America Oceania
Fruits 18.54 30.25 15.26 43.07 27.55 29.02
Vegetables 2.07 5.98 3.33 6.81 6.99 4.21
Nuts 21.69 39.72 23.50 13.40 19.23 26.12

29
Table 2. Reduction in Value of Global Production Due to Global Pollinator Loss ($ billions)
Partial Equilibrium General Equilibrium
Value of Production Crop Sectors Non-Crop Sectors Total
138.3 10.5 323.6 334.1

30
Table 3. World Region Abbreviations
eaf Eastern Africa
maf Middle Africa
naf Northern Africa
saf Southern Africa
waf Western Africa
cac Central America and the Caribbean
nam Northern America
sam South America
cas Central Asia
eas Eastern Asia
sas Southern Asia
sea Southeastern Asia
wea Western Asia
eeu Eastern Europe
neu Northern Europe
seu Southern Europe
weu Western Europe
oce Oceania

31
0
500
1000
1500
2000
2500
3000
Africa Asia Europe NorthAmerica
SouthAmerica
Oceania
Prod
uctio
n (m
illio
ns to
nnes
)Pollinator Dependent Non-Dependent
Figure 1. World Crop Production by Pollinator Dependency by Continent (2008)
Source: FAO (2010), Klein et al. (2007).

32
0
5
10
15
20
25
30
35
1961 1965 1970 1975 1980 1985 1990 1995 2000 2005 2008
Perc
ent o
f Har
vest
ed A
crea
geEssential Great Modest Little
Figure 2. World Crop Pollinator Dependency (1961-2008)
Source: FAO (2010), Klein et al. (2007).

33
0
5
10
15
20
25
30
35
40
1961 1965 1970 1975 1980 1985 1990 1995 2000 2005 2008
Perc
ent o
f Har
vest
ed A
crea
geEssential Great Modest Little
Figure 3. U.S. Crop Pollinator Dependency (1961-2008)
Source: FAO (2010).
34
40
45
50
55
60
65
70
1960 1970 1980 1990 2000 2010
Bee
Col
onie
s (m
illio
ns)
Figure 4. World Bee Colonies (1961-2008)
Source: FAO (2010).

35
0
5
10
15
20
25
Africa Asia Europe NorthAmerica
SouthAmerica
Oceania
Bee
Col
onie
s (m
illio
ns)
1980 1995 2008
Figure 5. World Bee Colonies by Continent (1980, 1995, and 2008)
Source: FAO (2010).

36
2.0
2.5
3.0
3.5
4.0
1985 1990 1995 2000 2005 2010
Col
onie
s (m
illio
ns)
Honey Producing Colonies All Honey Bee Colonies
Figure 6. U.S. Honey Bee Colonies (1987- 2009)
Source: USDA (2010a, 2010b).

37
0.00
0.05
0.10
0.15
0.20
0.25
0.30
1960 1970 1980 1990 2000 2010
Col
onie
s per
Hec
tare
United States World
Figure 7. Managed Bee Colonies per Pollinator-Dependent Harvested Acreage (1961-2008)
Source: FAO (2010), Klein et al. (2007).

38
Direct Effects of Global Pollinator Loss
-15
-10
-5
0
5
10ea
f
maf
naf
saf
waf
cac
nam
sam
cas
eas
sas
sea
wea
eeu
neu
seu
weu
oce
% C
hang
e in
Val
ue o
f Cro
p Pr
oduc
tion
Figure 8. Economic Risk of Global Pollinator Loss to Crop Sectors – General Equilibrium
Analysis
Note: See Table 3 for world region abbreviations.

39
Indirect Effects of Global Pollinator Loss
-2
-1
0ea
f
maf
naf
saf
waf
cac
nam
sam
cas
eas
sas
sea
wea
eeu
neu
seu
weu
oce
% C
hang
e in
Val
ue o
f Non
-Cro
p Pr
oduc
tion
Figure 9. Economic Risk of Global Pollinator Loss to Non-Crop Sectors – General
Equilibrium Analysis
Note: See Table 3 for world region abbreviations.

40
Total Effects of Global Pollinator Loss
-3
-2
-1
0ea
f
maf
naf
saf
waf
cac
nam
sam
cas
eas
sas
sea
wea
eeu
neu
seu
weu
oce
% C
hang
e in
Val
ue o
f Tot
al P
rodu
ctio
n
Figure 10. Economic Risk of Global Pollinator Loss to All Sectors – General Equilibrium
Analysis
Note: See Table 3 for world region abbreviations.
41
Regional Effects of Global Pollinator Loss
-20
-15
-10
-5
0ea
f
maf
naf
saf
waf
cac
nam
sam
cas
eas
sas
sea
wea
eeu
neu
seu
weu
oce
% C
hang
e in
Val
ue o
f Cro
p Pr
oduc
tion
Figure 11. Economic Risk of Global Pollinator Loss – Partial Equilibrium Analysis
Note: See Table 3 for world region abbreviations.