Embed Size (px)
Citation preview
Economic Considerationsin the Framework
of Sustainable Development Initiativesin Africa
Spring 1998
Phillip LeBelProfessor of Economics
Center for Economic Research on AfricaDepartment of Economics and Finance
Montclair State UniversityUpper Montclair, New Jersey 07043

- 2 -
- 3 -
Abstract
Economic Considerationsin the Framework of Sustainable Development Initiatives in Africa
This paper elaborates key economic considerations essential to sustainable growth anddevelopment. While the economics literature on sustainable growth and development is rich andrapidly evolving, it is not always cast in a form that lends itself to basic policy alternatives. As aresult, policymakers concerned with allied issues such as governance and good stewardship in themanagement of environmental and natural resources do not always weigh the importance ofeconomic considerations, often with disappointing results. Ultimately, good policy depends oninclusion of clearly stated economic fundamentals if sustainable growth and development are to berealized.
As is now widely recognized, traditional measures of economic growth and development donot incorporate some of the broader issues essential to sustainable improvements in social welfare.Two factors are largely responsible for this limitation, both of which involve either the under-pricing, or the absence of pricing, of natural resources. One is the under-pricing of market activitydue to the presence of environmental pollution. Although the literature on externalities suggests theuse of corrective taxes and subsidies, for developing countries, the design of efficient pricingmechanisms and institutions is still largely unresolved, an issue that we seek to address in thispaper.
The other limitation in standard measures of growth and development is the under-pricing ofnatural resources in a way that is consistent with their socially optimal replacement. In bothinstances, the absence of well-defined property rights is the principal reason why market prices areinefficient. The result is that growth and development that appear to be economically sustainable donot meet the broader test of sustainability once we account for the depletion of natural resourcesand take into consideration the impact of external costs.
The objective of this paper is to define the broader economic conditions under which growthand development can be sustainable, with applications to countries in Sub-Saharan Africa.Drawing on various economic models, we emphasize the role of exhaustible resources,environmental externalities, and renewable resource dynamics to sustainable growth anddevelopment alternatives. Ultimately, economic incentives built around a socially competitiveallocation of resources are necessary if sustainable growth and development are to succeed.
- 4 -
Acknowledgments
This paper derives from the work of the Policy Consultative Group of World Resources Inc.The PCG was established to provide a forum for examining issues relating to Africa’senvironmental and natural resource management policies, and works in close consultation with theWorld Bank, U.S. AID, and other bilateral public and private development organizations. Itsmembership draws from representatives from academia, public development organizations, privatenon-governmental organizations, and individual experts with specializations and experience in abroad variety of policy issues in Africa. I express particular appreciation to Tom Fox, founder ofthe PCG at WRI, Tony Pryor in U.S. AID, Peter Veit at WRI, and Christine Elias of WRI. Allconclusions drawn here are my own, as are any faults of commission and omission.
Much of the work of the PCG has focused on issues of governance in Africa, with particularemphasis on how governance helps to shape good stewardship in the management of theenvironment and natural resources in Africa. Members of the PCG have added much to the issueof governance, even though it may not always be readily evident in this paper. The motivation forthis paper derives from the challenge of linking issues of governance to economics. It is achallenge in that economists have developed an approach to policy issues that often is highlytechnical, abstract, and seemingly removed from specific issues. Economics does, however, guidethe allocation of resources, whether from the presence of market forces, or from intervention byvarious public agencies. The key is thus to draw from economics those issues that are pertinent tosustainable growth and development and to present them in as non-technical manner as possible,which is what drives the content of this paper.
One might ask more directly the question of how can one develop a closer integration betweenissues of environmental and natural resource governance and economic policy alternatives. Theessential precondition for this to occur is to establish a framework for analysis that can be used tolink these two domains into a more mutually comprehensible perspective. To do so requires thatone draw on both the conceptual and empirical framework that has evolved in reference toenvironmental and natural resource utilization in a way that is more accessible to a broad group ofspecialists than has been the case up to now. If this paper succeeds to any extent in achieving thisgoal, then it will have been a success.
- 5 -
ContentsI. Economics for Sustainable Development .. . . . . . . . . . . . . . . . . . . . . . . . . . . . . . . . . . . . . . . . . . . . . . . . .1
II. Economic Growth and Sustainable Resource Use........................................2Benchmarks of Growth and Development.................................................2Accountability in International Aid, Trade, and Investment .. . . . . . . . . . . . . . . . . . . . . . . . . . . .2
III. Economic and Environmental Perspectives on Sustainability ... . . . . . . . . . . . . . . . . . . . . . . . .3IV. Dimensions of Sustainable Resource Use ... . . . . . . . . . . . . . . . . . . . . . . . . . . . . . . . . . . . . . . . . . . . . . .5
A. Exhaustible Resource Use...............................................................51. Sustainable Development Initiatives
with Exhaustible Resource Dependency ... . . . . . . . . . . . . . . . . . . . . . . . . . . . . . . . . . . . . . . .8B. Thermodynamics, Externalities, and Sustainable Development .. . . . . . . . . . . . . . . . .11
1. Economic Choices for Correcting Environmental Externalities .. . . . . . . . . . . . .162. Implications of Environmental Externalities for Sustainable
Development Initiatives in Africa .. . . . . . . . . . . . . . . . . . . . . . . . . . . . . . . . . . . . . . . . . . . . . . .18C. Renewable Natural Resources and Sustainable Economic Growth .. . . . . . . . . . . . .20
1. The Common Property Resource Problem ... . . . . . . . . . . . . . . . . . . . . . . . . . . . . . . . . . .202. Renewable Natural Resources and Sustainable Economic Growth
in Africa.............................................................................213. Biophysical Sustainability .. . . . . . . . . . . . . . . . . . . . . . . . . . . . . . . . . . . . . . . . . . . . . . . . . . . . . . .25
V. Economic Incentives for the Efficient Valuation of Natural Resources...............29
List of FiguresFigure 1 Exhaustible Resource Pricing Scenarios......................................8Figure 2 The Choice of Natural Resources in Production...........................12Figure 3 Traditional Fuel Share of Commercial Energy Consumption
and Per Capita GDP...........................................................13Figure 4 Aggregate Energy Intensity and Per Capita GDP
in Sub-Saharan Africa .. . . . . . . . . . . . . . . . . . . . . . . . . . . . . . . . . . . . . . . . . . . . . . . . . . . . . . .14Figure 5 Aggregate Energy Intensity and per Capita GDP
(global sample, 1994-1995)..................................................15Figure 6 Pricing Adjustments for Exhaustible Energy Resources..................17Figure 7 Sub-Saharan Africa Natural Resource Sustainable Growth Index ... . . .23Figure 8 Renewable Natural Resource Logistical Growth Function...............25Figure 9 Maximum Sustainable Yield Function for a Renewable
Natural Resource..............................................................25Figure 10 Logistical Growth Function and MSY Steady-State
Growth Production............................................................26Figure 11 Technical Change in Renewable Natural Resource Production..........27Figure 12 Maximum Sustainable Yield Functions for a Renewable
Natural Resource with Alternative Rates of Technical Change .. . . . . . . . .27Figure 13 Maximum Sustainable Yield Harvests for a Renewable
Natural Resource with Alternative Rates of Technical Change .. . . . . . . . .28Figure 14 Annualized Present Value Streams for the Maximum
Sustainable Yield Harvest of a Renewable Natural Resourceunder Alternative Discount Rates............................................28
Figure 15 Present Value of the MSY Harvest of a Renewable Natural Resource..29
List of TablesTable 1 Aggregate Energy Intensity and Environmental Emissions
in Sub-Saharan Africa .. . . . . . . . . . . . . . . . . . . . . . . . . . . . . . . . . . . . . . . . . . . . . . . . . . . . . . .19Table 2 Sustainable Growth Natural Capital Indicators
in Sub-Saharan Africa .. . . . . . . . . . . . . . . . . . . . . . . . . . . . . . . . . . . . . . . . . . . . . . . . . . . . . . .22Table A-1 Sub-Saharan Africa Energy Profile .. . . . . . . . . . . . . . . . . . . . . . . . . . . . . . . . . . . . . . . .33Table A-2 Sub-Saharan Africa Natural Resource Indicators..........................34
- 6 -
Economic Considerationsin the
Framework of Sustainable Development Initiatives
I. Economics for Sustainable Development
Most societies seek in some fashion to achieve sustained increases in per capita income overtime. In turn, the goal of rising per capita incomes is linked to some underlying standard of equityand social participation, along with the notion that these increases should be accomplished whilepreserving an economy’s environmental and natural resource base, i.e., its natural capital.1 This iswhat many people have in mind when they use the term sustainable development. Whether thisconception of sustainable development is accurate, or even appropriate, to choices for increasingper capita incomes, it often seems to have more attention by environmental specialists than it has byeconomists. What is needed is a framework that is mutually understood and agreed upon by botheconomists and environmental specialists.
The purpose of this paper is to link economic incentives to the policy framework of sustainableresource use and economic growth, drawing on examples in Africa. While structural adjustment inAfrica has been very much driven by economic considerations, the role of economics in achievingsustainable economic growth has been less clearly drawn. To redress this imbalance, I willemphasize the economic dimensions of natural resource use and the environment, and link them topolicy choices for sustainable economic growth. The examples that follow are based on variousmodels, which are presented here at a level that can be linked to various developmental initiatives.
Economies experience rising levels of per capita income through two fundamental processes:increases in the stock of resources, and improvements in the efficiency in the use of resources,i.e., technical change. By resources we mean the quantity and quality of land(which embodies boththe environment and the stock of natural resources), labor, capital, and entrepreneurial skill. Formany countries in Africa, weaknesses in the accumulation and management of physical and humancapital often has meant greater reliance on natural capital. In turn, this has caused concern that theenvironmental and natural resource base will experience gradual deterioration as well.
In Africa, as elsewhere, whether or not economic growth is occurring, there is increasingpressure on the underlying natural resource base. This stems partly from population growth andpartly from the economic and environmental policies thus far in place. The extent of thesepressures on the environment and natural resource base leads many to the conclusion that economicgrowth is unsustainable. The challenge of sustainable economic development thus is to find waysto improve the management of the natural resource base while at the same time achieving higher
1 “Natural” capital refers to those resources within the environment that are extractable within the economy. Theycan be renewable or exhaustible. See Martin L. Weitzman, “Sustainability and Technical Progress”, ScandinavianJournal of Economics, March 1997, 99(1), pp. 1-13; David Pearce and Giles Atkinson, “Measuring SustainableDevelopment,” in Daniel W. Bromley, editor, The Handbook of Environmental Economics (Cambridge, Mass.:Basil Blackwell Publishers, 1995), pp. 166-181; Herman E. Daly and John B. Cobb, Jr., For the Common Good(Boston, Mass.: Beacon Press, 1989), pp. 69-76; Charles Perrings, “Ecological Resilience in the Sustainability ofEconomic Development”, in Sylvie Faucheux, David Pearce, and John Proops, editors, Models of SustainableDevelopment (Brookfield, Vermont: Edward Elgar Publishing Company, 1996), pp. 231-252; Ismail Serageldin,Robert Goodland, and Herman Daly, “The Concept of Sustainability”, in Wouter Van Dieren, Editor, Taking NatureInto Account (New York: Springer-Verlag, 1995), pp. 99-123; Richard Carpenter, “Limitations in MeasuringEcosystem Sustainability”, in Thaddeus C. Trzyna, editor, A Sustainable World (London: Earthscan Publications,Ltd., 1995), pp. 175-197; and Salah El Serafy, “The Environment as Capital”, in Robert Costanza, editor,Ecological Economics (New York: Columbia University Press, 1991), pp. 168-175.
- 7 -
standards of per capita income over time. Given the growing commitment of national governmentsin Africa and the international community to achieve sustainable growth and development in theregion, we need to develop an analytical framework that can provide useful guidance to theseinitiatives.
II. Economic Growth and DevelopmentBenchmarks of Growth and DevelopmentPer capita income is the traditional benchmark for assessing policies for economic growth.
While per capita GNP, and more recently, per capita GDP, serve as the usual yardsticks for percapita income, a more accurate measure is the use of purchasing power parity, or PPP, variants.2
PPP measures of per capita income help to eliminate distortions in international comparisons thatare caused by exclusive reliance on nominal exchange rates. Wherever available, we will use eitherthe PPP level of per capita GNP or the PPP level of per capita GDP as our measure of per capitaincome.3
Where appropriate, we also will take into consideration other measures of development such asthe index of human development published in the UNDP’s annual Human Development Report.4
Economists have long recognized that even a PPP measure of per capita GDP can not capture manyof the broader dimensions of development, much less serve as the only yardstick of progress.While the use of a human development index adds an important dimension to our understanding ofdevelopment, because many of the components in a human development index do not translatereadily into market price measures, it makes is difficult to use such an index in guiding theallocation of scarce resources. In drawing this distinction, we thus begin with the fundamentalquestion that development is a multi-faceted process that depends on the allocation of productiveresources. The longer term challenge is thus to link benchmarks of human development to somemeasure of their economic as well as social value so that societies may make clear choices with fullknowledge of the trade advantages that may be present. To say that this is the case wheredevelopment is concerned in general today, or in a developing region such as Africa, it is clear thatmuch remains to be done.
Accountability in International Aid, Trade, and InvestmentInsofar as international aid, trade, and investment are concerned, resource commitments are
made to the extent that they make differences in a country’s level of per capita income along with anumber of associated human development goals. If international aid in the form of grants or loansis the instrument, the first question is whether over the longer term donor resources producemeasurable increases in per capita incomes of recipient countries. In turn, this first criterion isoften linked to the notion of whether increases in per capita incomes are also economically
2 See, for example, The World Bank Atlas, 1997 (Washington, D.C.: The World Bank, 1997), which containsestimates for the Gross National Product, Gross Domestic Product, and purchasing power parity estimates of GNPper capita. The PPP is defined as the number of units of a country’s currency required to buy the same amounts ofgoods and services in the domestic market as one dollar would buy in the United States.3 It should be noted that even a purchasing power parity measure of per capita income does not capture all of thedimensions of development. Other indices, such as the UNDP Index of Human Development, can also sharpen ourunderstanding. The basic HDI includes life expectancy, adult literacy, the combined school enrollment ratio, inaddition to PPP Per Capita GDP. Yet to the extent that social indicators of development are positively correlatedwith purchasing power parity measures of per capita income, we will use for a per capita income measure as ourprincipal benchmark for economic growth. It should be emphasized that PPP estimates of GNP or GDP per capitado not incorporate adjustments for changes in an economy’s natural capital and environmental quality. Formeasurement and definitions used, see UNDP, Human Development Report 1995. (New York: Oxford UniversityPress, 1995), pp. 134-135, and which began to incorporate gender consequences as well. The HDI is a simpleaverage of the life expectancy index, educational attainment index and the adjusted real PPP GDP per capita index.4 Op. Cit., p. 122.

- 8 -
beneficial to donor countries in the form of expanded trade and investment choices.5 Internationalaid programs that fail to meet at least the first test eventually generate pressures for reductions orelimination of international aid in donor countries, a point that should be kept in mind as weexamine the issue of sustainable growth and development.
For international trade and investment, the benchmarks are more narrowly focused becausethey already are framed within a market framework. Simply put, firms participate in internationaltrade and investment only insofar as it is profitable for them to do so. If the economic framework isnot conducive to trade and investment in a developing country, then either the developing countryhas adopted policies to discourage both domestic and international trade and investment, or theycan only do so through some form of restructuring that may call for international support, such asthrough the IMF, the World Bank, or some other international public financial institution.Distortions in market prices can still create non-productive trade and investment, which is whystructural adjustment is so important if resource allocation decisions are to result in positive rates ofeconomic growth and development.
III. Economic and Environmental Perspectives on Sustainability
If the economic benchmarks for economic growth and development are fairly well established,what do we mean by sustainability? Goldin and Winters (1995) offer a straightforward generaldefinition based on the Brundtland Report of 1987 and the 1992 Rio Summit: “‘Sustainable’ isoften defined as development that meets the needs of present generations without compromisingthe ability of future generations to meet their needs.”6 If we add to this definition a fewqualifications, we can then apply it to the current framework of sustainable development initiativesto derive policy alternatives.
It should be understood from the definition offered by Goldin and Winters that “meeting theneeds” means that each generation seeks to maximize a level of satisfaction subject to the resourceconstraints and technology at each moment in time. As such, “sustainability” makes no priorstipulation on the level of per capita resource use over time, nor does it make any prior stipulationon the composition of per capita resource use. Moreover, sustainability also makes no priorstipulation on the level of per capita income, even though increases in per capita income is a majorgoal of most societies over time.7 For our purposes, we will look at sustainability first of all withinthe context of the goal of increases in per capita income, and then in relation to the notion of asteady-state approach to sustainability.
5 The first criterion may be thought of as redistributive, while the second may be thought of as growth-driven. Fortow countries, A and B, where A has a relatively high level of per capita income, the positive impact of the firstcriterion is met by 0<δA/δB<1, while for the second, the positive impact may be judged by 0<δA/δΒ≅1. In eithercase, δA/δB<0 and δA/δB>1 are ruled out by assumption, the former representing sheer incompetence and the latterrepresenting economic exploitation. Ruling these out by assumption does not mean that they may be ruled out inpractice.6 Alan Goldin and L. Alan Winters, The Economics of Sustainable Development (Cambridge, U.K.: CambridgeUniversity Press, 1996), p. 1. See also United Nations, Report of the United Nations Conference on Environmentand Development, Rio de Janeiro, 3-14 June 1992, Vol I. Resolutions Adopted by the Conference (New York:United Nations, 1992); World Commission on Environment and Development, Our Common Future (TheBrundtland Report). (New York: Oxford University Press, 1987);7 This question has a long history in economic thought. In his Wealth of Nations (1776), Adam Smith suggestedthat once an economy has achieved a level of development, it would then enter into a steady-state in which thenotion of continuous increases in per capita income would no longer be a goal. This theme is echoed in Herman E.Daly and John B. Cobb, Jr., For the Common Good (Boston: Beacon Press, 1989), and in Herman Daly’s Steady-State Economics (San Francisco: W.H. Freeman, 1977). Daly argues that there are intergenerational equity issuesthat call for the adoption of a steady-state policy, a point that may have some support in developed countries, butwhich developing countries largely reject on the grounds that they are not yet developed.
- 9 -
One issue that arises in most discussions of sustainable resource use is whether per capitaeconomic growth is a necessary part of the definition. Grossman (1995) offers an analyticframework that looks at the relationship between growth and environmental pollution that suggeststhat countries that achieve higher levels of per capita income also reduce the level of per capitaenvironmental pollution, stopping short of concluding that economic growth is a necessary pre-requisite to sustainable growth.8 Baldwin (1995), however, goes further and contends thateconomic growth is a necessary condition for sustainability to occur.9
The basis of these economic sustainability positions is straightforward: countries with lowlevels of per capita income do not enjoy access to the kinds of technologies that would enable themto adopt more prudent use of the environmental and natural resource base. Despite the efforts ofthe international development community to identify appropriate technologies, their adoption indeveloping countries makes economic sense only if there is an economic return to the resourcesnecessary for their creation and utilization. The empirical evidence in support of this proposition issignificant, and it is this perspective that drives most discussions of sustainable growth anddevelopment in the international development community.10
What does the notion of economic sustainability have to do with environmental sustainability?“Environmental sustainability” does not mean some straw counter-proposition to economicsustainability. What it does suggest is that human activity results in environmental degradation, bethat in terms of excessive rates of extraction of natural resources, or in terms of irreversiblechanges in the environment. If natural resources are being extracted at a rate faster than they arebeing replaced directly or in terms of an equivalent, then this obviously is not sustainable. In turn,human activity produces environmental pollution, which lowers the quality of life, and whichtranslates into altered rates of life expectancy.
Although environmental and natural resource use are major determinants of any sustainablepath of economic growth and development, it does not follow that they are mutually exclusivechoices. If environmental and natural resource degradation occurs with economic activity, it is dueat least in part to the absence of pricing mechanisms that enable users and policymakers to makesocially constructive choices. No pricing mechanism can eliminate environmental risks, butenvironmental quality can be better preserved in the presence of an efficient pricing system than inits absence.
Creating pricing mechanisms for sustainable resource use depends in turn on issues ofgovernance. Good governance implies broad-based participation, and this remains the goal ofmany developing countries as they shift emphasis from reliance on the public sector to an expandedrole of markets.11 However, good governance by itself is not a guarantee that sustainable growth 8 Gene Grossman, “Pollution and Growth: What Do We Know?” in Goldin and Winters, op. cit., pp. 19-46).9 Richard Baldwin, “Does Sustainability Require Growth?”, in Goldin and Winters, op. cit., pp. 51-76.10 See, inter alia, Robert Barro (1991),”Economic Growth in a Cross-Section of Countries”, Quarterly Journal ofEconomics, 106(2): pp. 407-44; Greg Mankiw, D. Romer, and D. Weil (1992), “A Contribution to the Empirics ofEconomic Growth”, Quarterly Journal of Economics, 107: 407-37;11 The World Resources Institute has devoted considerable attention to issues of good governance in natural resourceuse, and there is little question that in the absence of good governance that sustainable growth and development canoccur. What must be understood by good governance is that it can only proceed when there is a system of clearlydefined property rights. Together with civil rights, clearly defined property rights depend in turn on the strength ofthe institutions of civil society. See, for example, Derick W. Brinkerhoff and Peter G. Veit, “DemocraticGovernance and Environmental/Natural Resources Policy in Africa: Exploring the Linkages”, (Washington, D.C.:Natural Resources Policy Consultative Group for Africa, World Resources Institute, October 1997); Allan Hoben,Pauline Peters, and Dianne Rocheleau, “Participation, Civil Society, and Development Assistance in Africa”,Natural Resources Policy Consultative Group for Africa, Discussion Paper (Washington, D.C.: World Resources
- 10 -
and development will occur, especially if there is no corresponding development of an efficientpricing mechanism that provide an accurate measure of the relative value of resources.12
The critical link between environmental and economic sustainability depends ultimately on theestablishment of a system of clearly defined property rights. Property rights exist in formalcontracts as well as in implicit contracts. Land reform, particularly land reform driven by suchissues as redistribution, may well fail to create a system of property rights in which an efficientallocation of environmental and natural resources may be determined. Ultimately, clearly definedproperty rights, like civil rights, depend on the institutions of civil society. With this perspective inmind, we now turn to economic considerations in sustainable development initiatives.
IV. Dimensions of Sustainable Resource Use
There are three dimensions critical to the economics of sustainable resource use. These are,respectively, the allocation of exhaustible resources, the role of environmental externalities, and theallocation of renewable resources. In each case we are looking at natural resources from whichboth useful energy and materials are extracted for use within the economy. All three dimensions aregoverned by the fundamental laws of thermodynamics, namely, the conversion of matter intoenergy from a finite stock of both in the universe, and the technical efficiency through which theseconversions can be accomplished in both an engineering and economic sense, and the role ofentropy in the allocation of resources over time.
In terms of economic theory on sustainable resource use, there are essentially two approaches:the classical economic tradition of Adam Smith and David Ricardo, and the neoclassical tradition ofAlfred Marshall and the bulk of contemporary writers in economics. In this paper, we will use theneoclassical approach, taking into consideration the classical framework as it relates to issues ofsustainable development initiatives. The reasons for the choice of a neoclassical framework willbecome clear as key aspects of sustainable development are examined.
A. Exhaustible Resource UseExhaustible resources such as minerals and fossil fuels are so classified since their ultimate
stocks diminish with each conversion from one state to another over time. If the stock of thesefinite resources were known with precision, the economic problem would be under whatconditions would society consume a fraction of those resources today and how much would beconsumed by each subsequent generation. Long ago, Harold Hotelling (1931) devised a solutionfor the efficient allocation of exhaustible resources over time, namely, that if the market structurewere a competitive one, extraction would proceed in such a fashion that the rental value, or usercost, would increase at the prevailing rate of interest, or discount.13 If the rate of discount were to
Institute, November 1996); and Aaron Zazueta, 1995, “Policy Hits the Ground: Participation, Equity andEnvironmental Decision-Making”, (Washington, D.C.: World Resources Institute, 1994). See also, Dal O.Didia(1997), “Democracy, Political Instability, and Tropical Deforestation”, Global Environmental Change (7):1,pp. 63-76; Gerald W. Scully (1988), “The Institutional Framework and Economic Development”, Journal ofPolitical Economy 96, pp. 652-662; and Derick W. Brinkerhoff with George Honadle, “Co-Managing NaturalResources in Africa: Implementing Policy and Institutional Changes in Five Countries”, (Washington, D.C.: U.S.AID, Implementing Policy Change Project, IPC Monograph Number 4, October 1996).12 As an example, see R. Mendelsohn (1994), “Property Rights and Tropical Deforestation”, Oxford EconomicPapers 46, pp. 750-756;13 Harold Hotelling (1931), “The Economics of Exhaustible Resources”, Journal of Political Economy, 39, 137-175.The literature on exhaustible resources is extensive. For a good survey, see Partha S. Dasgupta and Geoffrey M.Heal, Economic Theory and Exhaustible Resources (Cambridge: Cambridge University Press, 1979), and AnthonyC. Fisher, Resource and Environmental Economics (Cambridge: Cambridge University Press, 1981). See alsoDavid W. Pearce and R. Kerry Turner, Economics of Natural Resources and the Environment (Baltimore: The Johns
- 11 -
increase, production would be shifted from the future to the present, and vice versa. In a zerodiscount environment, the amount of the exhaustible resource would be equi-proportional for eachtime period.
Hotelling’s solution to the exhaustible resource problem was in terms of efficiency, notsustainability, even though there is an implicit relationship between the two in his model. If thetime frame for the allocation of exhaustible resources is extended ex ante, then each generationwould consume a proportionately smaller fraction of the total stock.14 In the limit, as the number oftime periods approaches infinity, the consumption of exhaustible resources in each time periodwould approach zero. As long as society adopts an infinite time horizon consistent with someunderlying notion of sustainable resource use, then economic activity could no longer be sustainedon the basis of exhaustible resource use. This was the implication put forth in a famous essay byWilliam Stanley Jevons (1865) long ago in reference to England’s then reliance on coal.15 It wasechoed in later writings, notably Frank Ramsey (1928), who advocated the use of a zero discountrate for exhaustible resources, thus extending their prospective extractive life for as long aspossible.16 Even if one adopts Ramsey’s rule, the problem is that for an infinite time horizon, therewould be virtually no consumption of the exhaustible resource in any given time period.
How does one get beyond the dilemma of exhaustible resource dependence? The neoclassicaleconomic answer is that even if one adopts a finite horizon and any positive rate of discount,technological innovation brought through successive periods of economic growth would permit acontinuous stream of resource substitution possibilities. In the medium term, this takes place inthree basic ways. First, it occurs in the form of new discoveries that become economically feasible,thus adding to proven reserves. Second, it occurs as technological innovation improves thetechnical efficiency of exhaustible resource use, much as has been the case in the global economyfollowing the energy crisis of the 1970’s. Third, it occurs as eventual increases in the price ofexhaustible resources induces a shift to renewable resource technologies.
Hopkins University Press, 1990), and Phillip G. LeBel, Energy Economics and Technology (Baltimore: The JohnsHopkins University Press, 1982).14 If one seeks to maximize utility from the consumption of an exhaustible resource, then the problem is tomaximize the present value of utility derived from a consumption stream over a given time period. This can be
expressed as: Max U(c)e− tent dt,∫ where; U(c) is the utility associated with a per capita consumption flow of c, n is
the rate of growth of population, δ is the rate of discount, subject to an income constraint of the form C + ∆K =F(K,S,L,t), where F = a returns to scale parameter in the economy’s production function, K = the stock of capital; R= the flow of exhaustible natural resources, L = the stock of labor, and t = time. If society’s production function isbased on a Cobb-Douglas unitary elasticity of substitution form , then the underlying production function can beexpressed explicitly as C+ ∆K = Kα1Rα2Lα3eλt, where λ = the rate of technical progress. As to the dependence onexhaustible resources, the extractive flow at any one time is based on R(t)dt=S, where S = the stock of theeconomy’s exhaustible resources. Stiglitz(1974) used this framework to suggest that if society’s utility function islogarithmic (i.e., U = ln(c)), then the optimal extraction rate of exhaustible resources is equal to the pure rate of timediscount minus the rate of population growth, i.e., R/S = δ - n. If δ - n is 2 percent, then society should consumeup to up to 2 percent of its remaining stocks of exhaustible resources each year. Stiglitz’ formula for optimal utilityis R/S = ([δ(1-α1)-vλ])/(1-αl-a2v) - n, where v - the elasticity of utility with respect to time. See, J.E. Stiglitz,“Growth with Exhaustible Natural Resources: Efficient and Optimal Growth Paths,” Review of Economic Studies,Symposium on the Economics of Exhaustible Resources, 1974, pp. 123-138.15 William Stanley Jevons, The Coal Question, ed. A.M. Flux (1865; reprint edition, New York: Augustus M.Kelley, 1965). Jevons, as others after him, did not foresee the rise of alternative technologies and resources, whichin England’s case was the shift from coal to petroleum and natural gas that occurred just a few decades after his essaywas published.16 Frank P. Ramsey, “A Mathematical Theory of Saving”, Economic Journal 38 (December 1928); 543-559.
- 12 -
Goeller and Weinberg (1976) provide a clear statement of the neoclassical notion of continuingsubstitutability as a basis for sustainable economic growth.17 It should be noted that this positionis embodied implicitly or explicitly in virtually all standard models of economic growth anddevelopment, as well as in the basic framework of policy initiatives in developing countries. Itimplies, among other things, that while sustainable growth and development require that one needsto take into account not just trends in current resource markets, but also that one devise suitableinstitutional mechanisms for research and development essential to creating opportunities fortransitional paths to sustainable growth. In this sense, public support for continuing research intoappropriate technologies is an important part of the framework for sustainable developmentinitiatives, and whose social rates of return may be viewed as a function of prospective rates ofincreases in per capita incomes over time.
The neoclassical model is based on a number of important institutional considerations, amongthem efficient markets. When markets work imperfectly, as they do in many parts of thedeveloping world, there is no clear basis for anticipating how resource substitutability is likely tooccur. Much of the inefficiency of these markets derives in turn from imperfections in thedefinition of property rights, which is why institutional governance does matter.
We could limit our discussion to limitations in property rights as the critical constraint onsustainable growth and development. While there is certainly is value in focusing on incentives forefficient property rights, before we do so, we first need to look at how the presence of efficientproperty rights and markets will shape decisions on the environment and natural resource use inreference to sustainable development initiatives.
What does the neoclassical model of exhaustible resource use imply for economic developmentin a region such as Africa? We note first of all that some countries are exhaustible resource netexporters, while others are net importers. By itself, the international net position a country has interms of exhaustible resources does not lead to any conclusion on sustainable growth possibilities.Where it does become relevant is in the context of global resource use, and how global exhaustibleresource markets function provides important indicators as to whether one is in a phase of rising orfalling relative scarcity, and whether changes in the real prices of these resources is around anexhaustible resource trend.
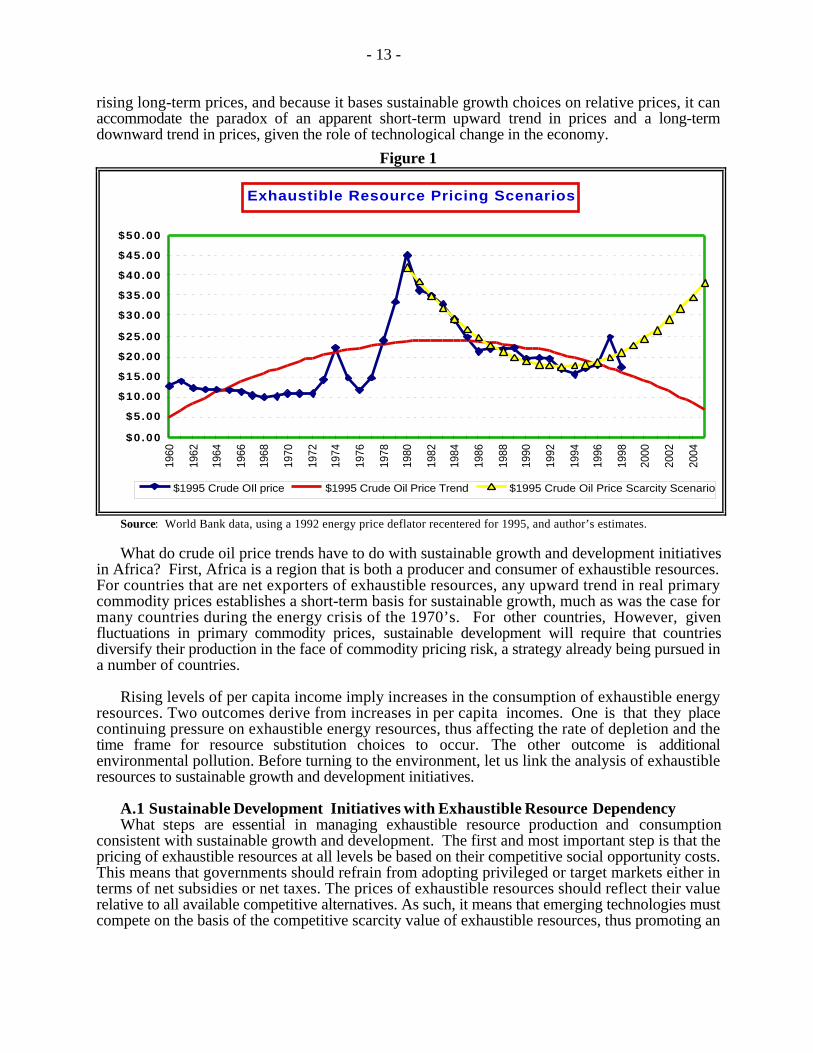
Figure 1 illustrates the issue of global resource scarcity in the case of a key exhaustibleresource, crude oil. Measured in constant dollars, the real price of crude oil hit a peak at the end ofthe 1970’s, much as did the prices of many other primary commodities in Africa. Since then, crudeoil prices have been trending downward, along with the prices of other primary commodities. Thequestion is whether current pricing behavior is indicative of a longer term downward trend or onethat is about to reverse in a way consistent with the classical theory of long-term scarcity.
If we take a long-run trend based on data back as far as 1960, we would wind up with adowntrend price scenario. However, if we look at prices just since the peak in 1980, we may bewitnessing an end to downward movement in crude oil prices and may be on the verge of a newupward trend that will become more obvious in the next few years. The classical economic modelimplies that long-run exhaustible resource scarcity may be setting in and under current conditions,per capita growth would not be sustainable under the present degree of dependence on oil and otherfossil fuels.
If, on the other hand, we look at the determinants that gave rise to the downward trend in the1980’s, part of the shift was due to increases in end use energy efficiency, which in turn reflectscontinuing rates of innovation in the economy consistent with the neoclassical view. Because theneoclassical economic model does not rule out the eventual depletion of exhaustible resources and 17 H.E. Goeller and A.M. Weinberg(1976), “The Age of Substitutability,” Science 191: 683-689.
- 13 -
rising long-term prices, and because it bases sustainable growth choices on relative prices, it canaccommodate the paradox of an apparent short-term upward trend in prices and a long-termdownward trend in prices, given the role of technological change in the economy.
Figure 1
Exhaustible Resource Pricing Scenarios
$0.00
$5.00
$10.00
$15.00
$20.00
$25.00
$30.00
$35.00
$40.00
$45.00
$50.00
1960
1962
1964
1966
1968
1970
1972
1974
1976
1978
1980
1982
1984
1986
1988
1990
1992
1994
1996
1998
2000
2002
2004
$1995 Crude OIl price $1995 Crude Oil Price Trend $1995 Crude Oil Price Scarcity Scenario
Source: World Bank data, using a 1992 energy price deflator recentered for 1995, and author’s estimates.
What do crude oil price trends have to do with sustainable growth and development initiativesin Africa? First, Africa is a region that is both a producer and consumer of exhaustible resources.For countries that are net exporters of exhaustible resources, any upward trend in real primarycommodity prices establishes a short-term basis for sustainable growth, much as was the case formany countries during the energy crisis of the 1970’s. For other countries, However, givenfluctuations in primary commodity prices, sustainable development will require that countriesdiversify their production in the face of commodity pricing risk, a strategy already being pursued ina number of countries.
Rising levels of per capita income imply increases in the consumption of exhaustible energyresources. Two outcomes derive from increases in per capita incomes. One is that they placecontinuing pressure on exhaustible energy resources, thus affecting the rate of depletion and thetime frame for resource substitution choices to occur. The other outcome is additionalenvironmental pollution. Before turning to the environment, let us link the analysis of exhaustibleresources to sustainable growth and development initiatives.
A.1 Sustainable Development Initiatives with Exhaustible Resource DependencyWhat steps are essential in managing exhaustible resource production and consumption
consistent with sustainable growth and development. The first and most important step is that thepricing of exhaustible resources at all levels be based on their competitive social opportunity costs.This means that governments should refrain from adopting privileged or target markets either interms of net subsidies or net taxes. The prices of exhaustible resources should reflect their valuerelative to all available competitive alternatives. As such, it means that emerging technologies mustcompete on the basis of the competitive scarcity value of exhaustible resources, thus promoting an
- 14 -
efficient allocation of investment in alternative technologies as well as an efficient use ofexhaustible resources.
If markets are efficient, they also will incorporate premia for the degree of uncertainty in thepricing of any resource. Creating and strengthening forward and option pricing for exhaustibleresources is an important step in bringing about such efficiency. While some exhaustible resourcesalready utilize these financial options, there are far too few such products available on local marketson which many end users depend. This is as important for net exporters of exhaustible resourcesin developing countries as it is for net importing countries, and certainly no less true for developingcountries in Africa.18
The second essential step in managing exhaustible resources is to structure end-user markets inways that promote greater flexibility. This means reducing barriers to entry and exit in exhaustibleresource markets, not just at the international level, but also at the local level.19 In Africa, aselsewhere, entrepreneurs have often developed inexpensive and competitive technologies forexhaustible resources, but often find that they can not succeed because certain markets are givenprivileged positions as either state-owned monopolies or as state-sanctioned private monopolies.Opening these markets to greater competition will serve not only the consumer but also theeconomy overall in helping to generate greater flexibility in the choice of technologies. Ifsustainable development initiatives to promote technological innovations in Africa have not donewell, it is usually because the marketing conditions did not permit the emergence of commerciallyviable products that could satisfy end-user needs. Market-based reforms will accelerate theinnovation of many of these products, thus increasing the economic efficiency in the use ofexhaustible resources.
Third, creating greater market efficiency also means investing in human resources. Improvingthe knowledge and skills base is essential in the process of decentralization, particularly inreference to initiatives in support of democracy and governance in Africa. Strengthening civilsociety is an important step in this direction, particularly insofar as it also strengthens transferable
18 Commodity price risk management is not new to Africa. Commodity price stabilization boards have a long, andoften disappointing, history, as tools for managing risk. Part of the failure of commodity price stabilization boardsin the past as that they were poorly linked to a country’s overall liability management options. Some evidenceexists to show that there are offsetting effects between commodity price, quantity, import price, and exchange ratemovements, but that they have been small. improving commodity risk management requires that external risksshould be measured and managed with respect to net liabilities (which are external liabilities minus all external assetssuch as foreign exchange reserves), and net external liabilities have to managed on the basis of tradeoffs between theexpected effective cost of a particular financial instrument and the uncertainty of its effective cost, where both costand uncertainty have to be measured in relation to an economy’s ability to pay. An economy’s optimal externalliability is thus divided between a speculative component and a hedging component. Claessens and Qian (1993) use amodel of optimal liability portfolios for Sub-Saharan Africa and show that risk reductions using hedging instrumentscould reduce per capita dollar risk of up to 90 percent in comparison to standard practices. See Stijn Claessens andYing Qian, “Financial Risk Management in Sub-Saharan Africa”, in Stign Claessens and Ronald C. Duncan,editors, Managing Commodity Price Risk in Developing Countries (Washington, D.C.: The World Bank, 1993),pp. 330-357.19 Energy-conservation initiatives such as those devised under the CILSS (Comité Inter-étatique pour la Lutte contrela Séchéresse du Sahel) serve as a good example. When the energy crisis of the 1970’s hit Sub-Saharan Africa, itwas compounded by an expanded period of drought. CILSS was designed to mobilize resources for short-term reliefas well as to devise long-term strategies to alleviate adverse conditions among affected populations. FEWS, theFamine Early Warning System, was designed to anticipate prospective harvesting shortfalls. However, in manyinstances, excessive government controls over farmer producer prices turns out to have had at least as much to dowith famine conditions as any climatic variations. Major donor organizations have moved to dismantle such pricecontrols, and local production has again begun to expand.
- 15 -
property rights that can be priced at their social opportunity cost.20 At the same time, it should beemphasized that good governance by itself does not guarantee that sustainable growth anddevelopment can be achieved. What is critical is the establishment of legal systems that createtransparency and enforceability of contracts, without which ownership of exhaustible resourceswill be incomplete and largely ineffectual.21 Education and training that broadens the participationbase, especially for women in Sub-Saharan Africa, is an important step in strengthening marketinstitutions.22
Fourth, greater flexibility in the mix of exhaustible versus renewable resource technologies canonly be accomplished through ongoing efforts in research and development. However, forresearch and development expenditures to be efficiently used, new technologies can succeed only ifthe pricing of existing resources is based on the competitive opportunity cost standard. In Africa,as elsewhere in the developing world, there are a number of technology research initiativesdesigned to increase the range of economic choices. Funding, which often comes from publicnational and international agencies, can be deployed productively only if the pricing of existingexhaustible resources is consistent with opportunity costs.23
Finally, performance indicators need to be developed that link funding of research anddevelopment to measured changes in per capita income, and thus to the ability of recipient countriesto amortize the costs of resources made available through grants and loans. Until this occurs, therelatively few scarce resources that do go into alternative technologies are likely to be inefficientlyused. Moreover, investment in research and development is likely to be far lower than optimal, andcertainly far less than what is necessary for sustainable growth and development, largely becausethe presence of positive external benefits may not be captured by individual research anddevelopment, which is why public support of such expenditures becomes important.24
20The institutions of civil society may be an essential pre-condition for the emergence of democratic society. Thishas been emphasized in Robert Barro, Determinants of Economic Growth (Cambridge: MIT Press, 1996); and morerecently by Fareed Zakaria, “The Rise of Illiberal Democracy,”Foreign Affairs 76:6 (November/December 1997), pp.22-43.21 There is a growing literature on the economics of property rights that has much relevance to the design ofsustainable development initiatives. A useful reference is Yoram Barzel, Economic Analysis of Property Rights,second edition (New York: Cambridge University Press, 1997), while a more rigorous presentation of sometheoretical issues can be found in Bernard Salanié, The Economics of Contracts (Cambridge: MIT Press, 1997),published originally in French as Théorie des contracts (Paris: Economica, 1994).22 In its review of sustainable bank initiatives, the World Bank places emphasis on improving the participation ofwomen. While there is considerable emphasis on the role of education for women in enhancing environmentalquality, there is little apparent linkage of such programs to the role of exhaustible resource management. See,Andrew Steer et.al., Advancing Sustainable Development: The World Bank and Agenda 21 (Washington, D.C.:The World Bank, Environentally Sustainable Development Studies and Monographs Series No. 19, 1997). 23 Support for institution capacity building in Africa already represents an important part of internationaldevelopment initiatives. The Global Environmental Facility, the Consultative Group on International AgriculturalResearch, the Economic Development Institute, are but three examples of education and training programs supportedby the World Bank. The problem that these programs pose for sustainable development initiatives is that they givecurrent emphasis to environmental issues and have shifted away from a once prominent role placed on exhaustibleenergy and primary commodity markets, which may reflect a tendency to associate sustainable development onlywith envrionmental and renewable resource technologies even though exhaustible resources are very much part of anysustainable development strategy.24In the abstract, the optimal level of research and development is that amount where the rate of return is just equalto the opportunity cost of capital. This may be obvious is the research is applied and has a near-market potential,but is less so in the case of pure research. Private market institutions may be better prepared to manage the former,while society at large may best choose the level of support for pure research, consistent with returns that can belinked to an economy’s overall rate of increase in per capita income, a relationship that may only be approximated in
- 16 -
B. Thermodynamics, Externalities, and Sustainable DevelopmentThe laws of thermodynamics govern all resource conversions from one state to another.25
Economists have often been accused of creating models, including the neoclassical one, by simplyignoring the these laws, even though they have given extensive consideration to environmentalexternalities which are a byproduct of them.26 Thermodynamics tells us that energy can be neithercreated nor destroyed, only changed from state into another. Moreover, the technical efficiency ofany energy conversion will be determined by the state of technology, which in turn will govern theratio of useful to rejected energy. The greater is the ratio of the combustion temperature of anyenergy conversion process to the ambient temperature level, the higher will be the fraction of anyenergy transformation that is converted into useful energy. Over time, given the state of knowledgeon the distribution of energy resources and technology, an economy would be expected to shiftfrom low entropy forms to higher entropy forms, a process that is irreversible.
The relationship of thermodynamics to economics is that to the extent that markets incorporateefficient information on energy resources, then the statement that the economy will engage in agradual shift from lower to higher entropy forms of energy will be true. For example, coal, oil,and natural gas are lower entropy energy forms than fuelwood, so one would expect an economyto rely first on the consumption of its exhaustible fossil fuels and then shift to renewable energyresources, be that fuelwood, or higher technology variants such as solar and wind technologies.
As simple and as appealing as the thermodynamic framework may seem, it is not consistentwith much observed economic behavior. This is not to say that the laws of thermodynamics arewrong. The problem is that markets may be economically inefficient for a variety of reasons,among them being barriers to entry and exit, the fact that energy prices may not embody all of thecosts and benefits in the consumption of a resource, as well as the state of technology.
When market prices do not embody all of the costs and benefits from the consumption of aresource, they result in external costs and benefits that affect parties other than buyers and sellersof a good. Environmental pollution arising from the purchase and operation of a road vehicle is atypical example of an external cost, while the lowered costs of farm exports arising the creation andoperation of a road system represents an external benefit. The higher is the share of these costs andbenefits as a percentage of the market value of a good, the less efficient will be the allocation ofresources. Net external costs, unless otherwise corrected, result in excess production of a goodwhile net external benefits will produce an under allocation of resources. Correcting for theseexternalities thus is an important step in improving the efficiency of markets, and plays a centralrole in shaping sustainable development initiatives.
most instances, but nevertheless an important one to consider. See, for example, H. van Meijl, “Measuring theImpact and Indirect R&D on the Productivity Growth of Industries”, Economic Systems Research 9(2), pp. 205-211;J. Greenwood; Z. Hercowitz, and P. Krusell, “Long-Run Implications of Investment-Specific Technological Change”American Economic Review (June 1997) 87(3), pp. 342-362.25See, for example, V. Kadambi and Manohar Prasad, An Introduction to Energy Conversion (New York: JohnWiley and Sons, Halsted Press, 1976). Entropy, the tendency toward rising chaos with each successive conversionover time, has often served as a focal point of environmental criticisms of neoclassical economics. A good exampleis found in Nicholas Georgescu-Roegen, The Entropy Law and the Economic Process (Cambridge, Mass.: HarvardUniversity Press, 1971), especially chapters 5 through 9. See also M. Faber, H. Niemes, D.G. Stephan, Entropy,Environment and Resources: An Essay in Physico-Economics (Heidelberg: Springer-Verlag, 1987); and KennethBoulding, “The economics of the coming spaceship Earth”, in H. Jarrett, ed., Environmental Quality in a GrowingEconomy (Baltimore: The Johns Hopkins University Press, 1966); and Charles Perrings, Economy and Environment(Cambridge: Cambridge University Press, 1987).26See, for example, “Externalities”, in P.S. Dasgupta and G.M. Heal, Economic Theory and Exhaustible Resources,op.cit., pp. 39-94.
- 17 -
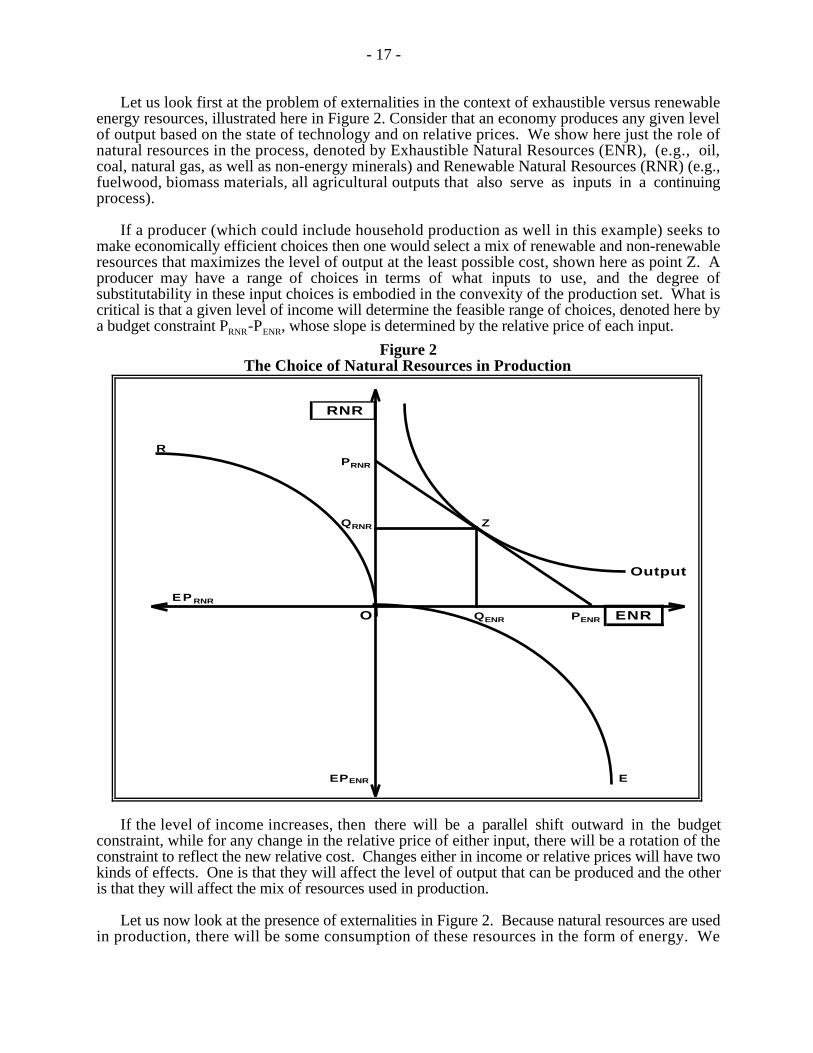
Let us look first at the problem of externalities in the context of exhaustible versus renewableenergy resources, illustrated here in Figure 2. Consider that an economy produces any given levelof output based on the state of technology and on relative prices. We show here just the role ofnatural resources in the process, denoted by Exhaustible Natural Resources (ENR), (e.g., oil,coal, natural gas, as well as non-energy minerals) and Renewable Natural Resources (RNR) (e.g.,fuelwood, biomass materials, all agricultural outputs that also serve as inputs in a continuingprocess).
If a producer (which could include household production as well in this example) seeks tomake economically efficient choices then one would select a mix of renewable and non-renewableresources that maximizes the level of output at the least possible cost, shown here as point Z. Aproducer may have a range of choices in terms of what inputs to use, and the degree ofsubstitutability in these input choices is embodied in the convexity of the production set. What iscritical is that a given level of income will determine the feasible range of choices, denoted here bya budget constraint PRNR-PENR, whose slope is determined by the relative price of each input.
Figure 2The Choice of Natural Resources in Production
RNR
R PRNR
QRNR Z
Output
EP RNR
O QENR PENR ENR
EPENR E
If the level of income increases, then there will be a parallel shift outward in the budgetconstraint, while for any change in the relative price of either input, there will be a rotation of theconstraint to reflect the new relative cost. Changes either in income or relative prices will have twokinds of effects. One is that they will affect the level of output that can be produced and the otheris that they will affect the mix of resources used in production.
Let us now look at the presence of externalities in Figure 2. Because natural resources are usedin production, there will be some consumption of these resources in the form of energy. We
- 18 -
denote rejected energy, or environmental pollution, as embodied for each resource, along therespective curves, OE, and OR, and as measured respectively along the axes, EPENR and EPRNR.The convexity of the functions OE and OR reflects both the underlying laws of thermodynamics aswell as the state of technology at commercially available prices.
If the relative price of exhaustible resources increases, the first effect will be to reduce theirconsumption and to switch some consumption to renewable natural resources. This occurs as thebudget constraint PRNR-PENR rotates inward from PRNR resulting in a new point of tangency of thebudget constraint with some lower output function below the one already shown.
As this relative price change occurs, output will be lowered at least initially by some amount, aswill the level of external cost arising from the reduced consumption of the exhaustible energyresource. In order to sustain output levels, producers now place increasing efforts to use renewableenergy resources such as fuelwood. In the presence of efficient natural resource market pricing,there would be an increase in the price of renewable energy resources reflecting the increase indemand.
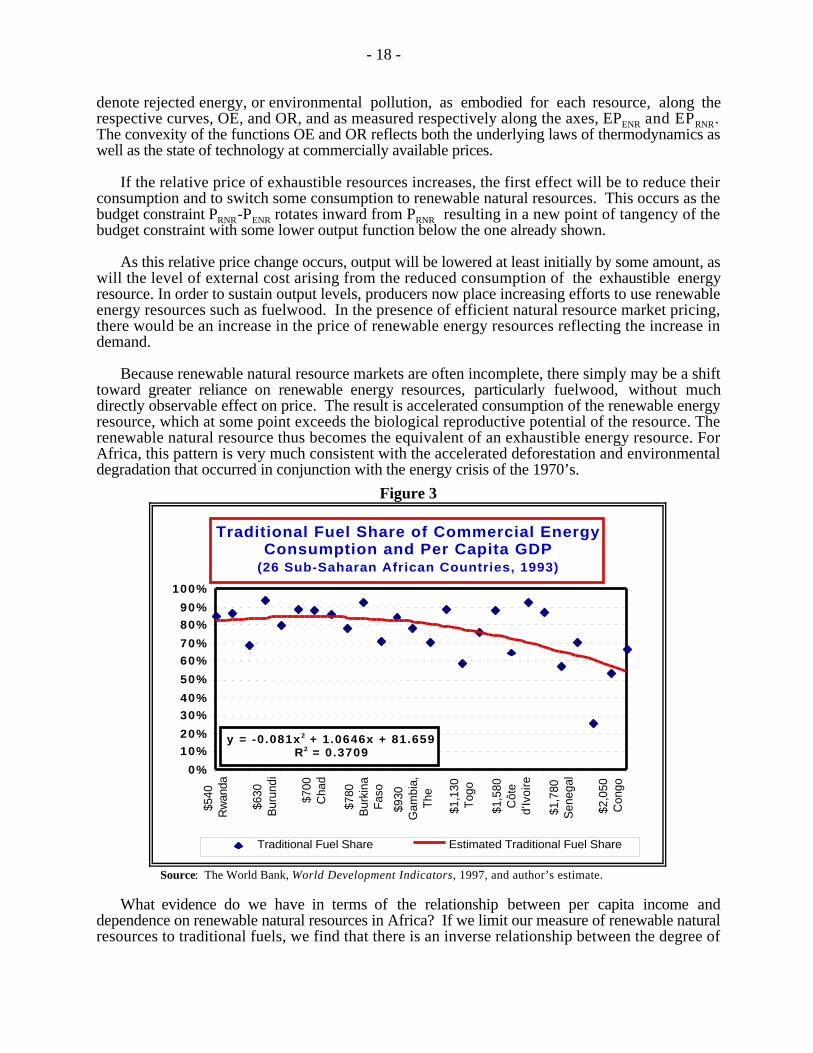
Because renewable natural resource markets are often incomplete, there simply may be a shifttoward greater reliance on renewable energy resources, particularly fuelwood, without muchdirectly observable effect on price. The result is accelerated consumption of the renewable energyresource, which at some point exceeds the biological reproductive potential of the resource. Therenewable natural resource thus becomes the equivalent of an exhaustible energy resource. ForAfrica, this pattern is very much consistent with the accelerated deforestation and environmentaldegradation that occurred in conjunction with the energy crisis of the 1970’s.
Figure 3
Traditional Fuel Share of Commercial Energy Consumption and Per Capita GDP
(26 Sub-Saharan African Countries, 1993)
y = -0.081x 2 + 1.0646x + 81.659R2 = 0.3709
0%
10%
20%
30%
40%
50%
60%
70%
80%
90%
100%
$540
Rw
anda
$630
Bur
undi
$700
Cha
d
$780
Bur
kina
Fas
o
$930
Gam
bia,
The
$1,1
30T
ogo
$1,5
80C
ôte
d'Iv
oire
$1,7
80S
eneg
al
$2,0
50C
ongo
Traditional Fuel Share Estimated Traditional Fuel Share
Source: The World Bank, World Development Indicators, 1997, and author’s estimate.
What evidence do we have in terms of the relationship between per capita income anddependence on renewable natural resources in Africa? If we limit our measure of renewable naturalresources to traditional fuels, we find that there is an inverse relationship between the degree of
- 19 -
dependence on traditional fuels and per capita GDP, and which is shown here in Figure 3. This isconsistent with the position already noted by Baldwin (1995) that economic growth is an importantdeterminant of sustainable growth in that it would reduce the degree of reliance on traditional fuelsas the level of income increases. This is not to say that traditional fuels can not play a role insustainable growth and development, but that at current rates of consumption relative toproduction, the current pattern of economic growth for many developing countries is simply notsustainable.
Over a broader range of income, we would expect a u-shaped relationship between the degreeof dependence of an economy on renewable natural resources and the level of per capita GDP.There would be, however, a qualitative difference in this dependence between the form ofconsumption of renewable natural resources at lower levels of per capita income than at high ones,reflecting differences in the state and distribution of technology. An important consequence of thisexpected relationship is that the thermodynamic efficiency in energy consumption also will differacross income levels. In terms of Figure 2, this means that technological advances can result inreduced environmental pollution for each level of production, and which would reflect changes inthe convexity of the OE and OR curves, respectively, toward the ENR and RNR axes, thoughnever achieving perfect congruence by virtue of the laws of thermodynamics.
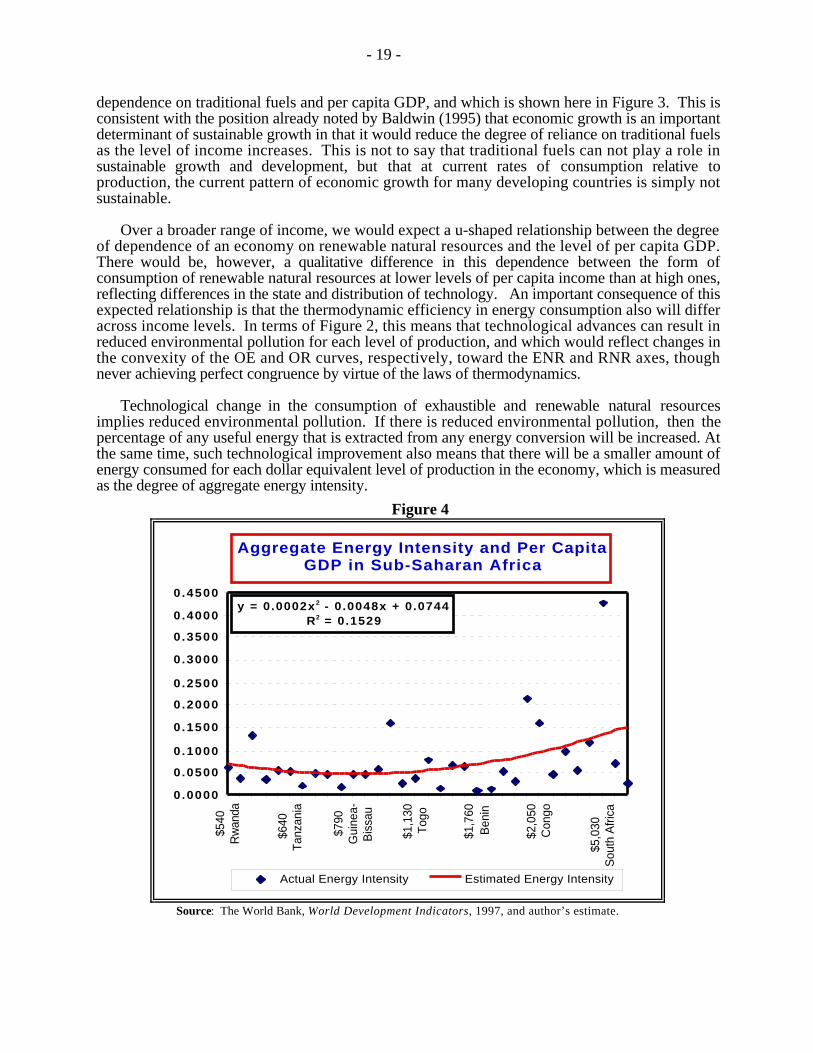
Technological change in the consumption of exhaustible and renewable natural resourcesimplies reduced environmental pollution. If there is reduced environmental pollution, then thepercentage of any useful energy that is extracted from any energy conversion will be increased. Atthe same time, such technological improvement also means that there will be a smaller amount ofenergy consumed for each dollar equivalent level of production in the economy, which is measuredas the degree of aggregate energy intensity.
Figure 4
Aggregate Energy Intensity and Per Capita GDP in Sub-Saharan Africa
y = 0.0002x 2 - 0.0048x + 0.0744R2 = 0.1529
0.0000
0.0500
0.1000
0.1500
0.2000
0.2500
0.3000
0.3500
0.4000
0.4500
$540
Rw
anda
$640
Tanz
ania
$790
Gui
nea-
Bis
sau
$1,1
30To
go
$1,7
60B
enin
$2,0
50C
ongo
$5,0
30S
outh
Afri
ca
Actual Energy Intensity Estimated Energy Intensity
Source: The World Bank, World Development Indicators, 1997, and author’s estimate.
- 20 -
What kind of resource transition is Africa like to experience as increases in per capita incometake place? Figure 4 illustrates one likely pattern, based on a cross-section of 26 countries in 1994-1995. With increases in per capita income, as the transition from dependence on renewable naturalresources to exhaustible natural resources occurs, there is likely to be an increase in aggregateenergy intensity. This has both positive and negative consequences. One possible positive outcomeis that a transition to exhaustible resources may relieve some of the pressure now bearing on theconsumption of renewable natural resources. However, we are speaking here primarily in terms ofa shift in the consumption of energy resources, and by no means is it a foregone conclusion thatnon-energy renewable natural resources will experience such a reduction in demand as long asother factors continue to be present.
On the negative side, increasing aggregate energy intensity arising from a shift to dependenceon exhaustible natural resources implies rising environmental pollution, as the per capita level ofvehicle and mechanical equipment consumption increases. Since developing countries have seensuch a transition as a necessary step to a path of sustainable growth, the projected increase inenvironmental pollution has had much to do with negotiations on improved management of theglobal environment, most recently at the Kyoto summit in 1997.
Figure 5
Aggregate Energy Intensity and Per Capita GDP(global sample, 1994-1995)
Y = -0.0001x 2 + 0.0096x + 0.0343R2 = 0.4494; n=38
0 .00
0 .05
0 .10
0 .15
0 .20
0 .25
0 .30
0 .35
0 .40
0 .45
$440
Sud
an
$580
Sie
rra
Leon
e
$650
Gui
nea
$930
Zam
bia
$3,5
00G
abon
$5,5
80B
otsw
ana
$16,
300
New
Zea
land
$19,
950
Net
herla
nds
$21,
230
Den
mar
k
$25,
860
Sw
itzer
lan
d
EnCon/$PPP GNPEstimated Energy Intensity
Kyoto-StyleOutcome
Source: The World Bank, World Development Indicators (Washington, D.C.: 1997), and author estimates.
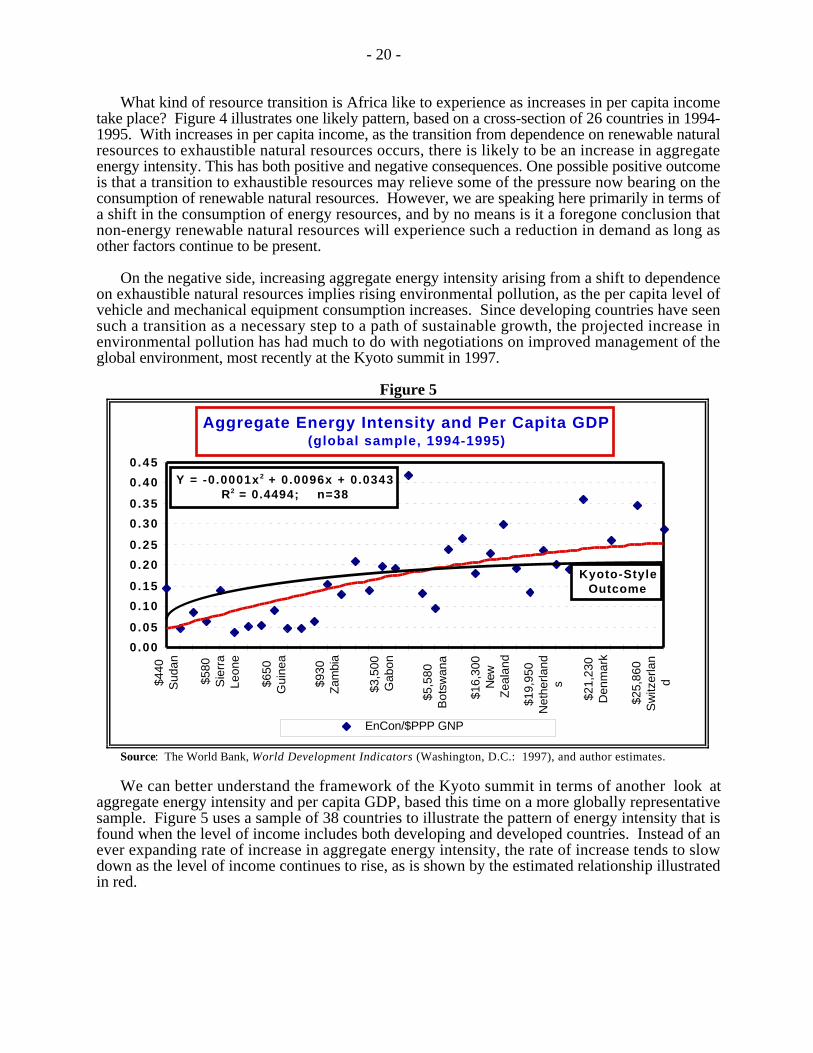
We can better understand the framework of the Kyoto summit in terms of another look ataggregate energy intensity and per capita GDP, based this time on a more globally representativesample. Figure 5 uses a sample of 38 countries to illustrate the pattern of energy intensity that isfound when the level of income includes both developing and developed countries. Instead of anever expanding rate of increase in aggregate energy intensity, the rate of increase tends to slowdown as the level of income continues to rise, as is shown by the estimated relationship illustratedin red.
- 21 -
If countries continue to rely on present trends, the level of global environmental pollution islikely to rise, as several forecasting models have indicated in recent years.27 Increases in carbondioxide in the atmosphere, along with particulate emissions, may produce increases in globaltemperatures as a greenhouse effect takes place, with significant effects on global climate.28 It ison this basis that the Kyoto summit produced an agreement that would allow developing countriesgreater latitude to make a transition from a dependence on traditional renewable natural resources toincreased use of exhaustible natural resources. The rotated Kyoto-style curve embodies acompromise in which developed countries would continue to make efforts to reduce environmentalpollution, even as they allow some greater margin of intensity among developing countries in aresource-base transition. It also embodies a commitment to a reduction in the level of globalenvironmental emissions in which developing and developed countries can make use of pollutiontrading rights as a device to promote greater flexibility in achieving global objectives.
B.1 Economic Choices for Correcting Environmental ExternalitiesExternalities, be they negative or positive, reflect incomplete markets. As suggested in Figure
2, as long as market prices for resources do not reflect the social costs and benefits of their use,economies can send the wrong signals that lead to an inefficient use of resources. Sinceexternalities have long been a pre-occupation among economists, it is worth noting how someproposed solutions may be applied to developing countries and what they imply for sustainabledevelopment initiatives now under way. It also should be emphasized that by virtue of the laws ofthermodynamics, no alteration in the pricing of natural resources will eliminate completely thepresence of environmental externalities. The worth of any proposal thus is whether any changeproduces a net improvement from the status quo, taking into account the social costs and benefits .
There are two basic approaches to managing natural resource markets in the presence ofenvironmental externalities. One is to use government intervention in the form of regulation, taxes,and subsidies to correct for the incomplete valuation of natural resources using market prices alone.The other approach is to create markets for environmental pollution in the form of trading permitsand set permit prices at levels that correspond to their environmental impact. While the Kyotosummit evoked the use of the latter, it is important to address the use of government interventionsince this has traditionally served as the primary means of managing the level of environmentalpollution.
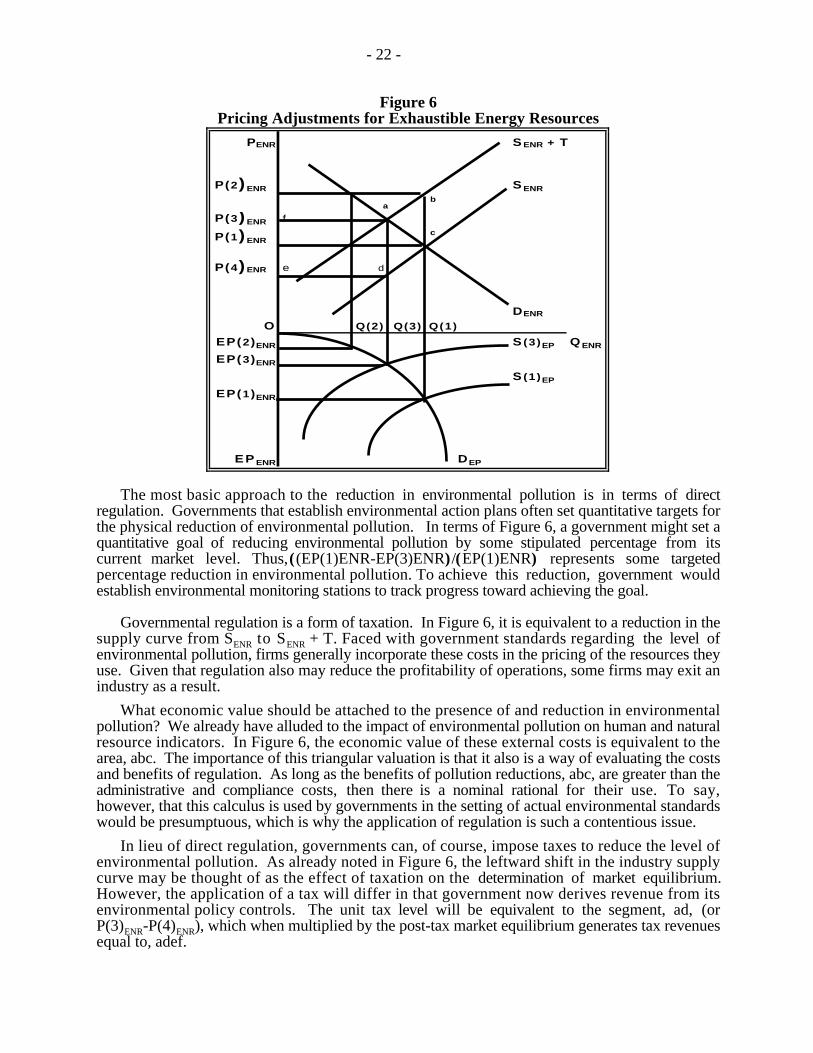
Figure 6 illustrates the various ways in which both tradable permits and governmentintervention can be applied. Consider a market for an exhaustible natural resource such aspetroleum. Market demand (DENR) and Supply (SENR) determine an initial equilibrium price(P(1)ENR) and quantity (Q(1)). Corresponding to this market equilibrium also will be a level ofenvironmental pollution (EP(1)ENR)). Because the market is incomplete, the economic consequenceof this environmental pollution is unpriced directly in the petroleum equilibrium price. There are,however, environmental costs arising from the petroleum market, whose value will be determinedindirectly in terms of reductions in the quality and health of the natural environment. Themeasurement of this external cost would be derived not from a PPP measure of per capita income,but in terms of human health indicators from a human development index, and, in terms of anindex of environmental quality. The challenge, then, is to create institutional property rights suchthat adjusted market prices can make a more efficient allocation of resources.
27 See, for example, William A. Pizer, “Optimal Choice of Policy Instrument and Stringency under Uncertainty:The Case of Climate Change”, (Washington, D.C.: Resources for the Future, working paper, December 1996);William Nordhaus, Managing the Global Commons (Cambridge: MIT Press, 1994); and William Cline, TheEconomic of Global Warming (Washington, D.C.: Institute of International Economics, 1992).
- 22 -
Figure 6Pricing Adjustments for Exhaustible Energy Resources
PENR S ENR + T
P(2)ENR S ENR
a b
P(3)ENR f
P(1)ENR c
P(4)ENR e d
DENR
O Q(2) Q(3) Q(1)
EP(2)ENR S (3)EP Q ENR
EP(3)ENR
S (1)EP
EP(1)ENR
EP ENR DEP
The most basic approach to the reduction in environmental pollution is in terms of directregulation. Governments that establish environmental action plans often set quantitative targets forthe physical reduction of environmental pollution. In terms of Figure 6, a government might set aquantitative goal of reducing environmental pollution by some stipulated percentage from itscurrent market level. Thus,((EP(1)ENR-EP(3)ENR) /(EP(1)ENR) represents some targetedpercentage reduction in environmental pollution. To achieve this reduction, government wouldestablish environmental monitoring stations to track progress toward achieving the goal.
Governmental regulation is a form of taxation. In Figure 6, it is equivalent to a reduction in thesupply curve from SENR to SENR + T. Faced with government standards regarding the level ofenvironmental pollution, firms generally incorporate these costs in the pricing of the resources theyuse. Given that regulation also may reduce the profitability of operations, some firms may exit anindustry as a result.
What economic value should be attached to the presence of and reduction in environmentalpollution? We already have alluded to the impact of environmental pollution on human and naturalresource indicators. In Figure 6, the economic value of these external costs is equivalent to thearea, abc. The importance of this triangular valuation is that it also is a way of evaluating the costsand benefits of regulation. As long as the benefits of pollution reductions, abc, are greater than theadministrative and compliance costs, then there is a nominal rational for their use. To say,however, that this calculus is used by governments in the setting of actual environmental standardswould be presumptuous, which is why the application of regulation is such a contentious issue.
In lieu of direct regulation, governments can, of course, impose taxes to reduce the level ofenvironmental pollution. As already noted in Figure 6, the leftward shift in the industry supplycurve may be thought of as the effect of taxation on the determination of market equilibrium.However, the application of a tax will differ in that government now derives revenue from itsenvironmental policy controls. The unit tax level will be equivalent to the segment, ad, (orP(3)ENR-P(4)ENR), which when multiplied by the post-tax market equilibrium generates tax revenuesequal to, adef.
- 23 -
How should an environmental tax be evaluated? One is in terms of effectiveness, i.e., whetherthe tax achieves the target percentage reduction in environmental pollution. Another approach is toevaluate the efficiency of the tax. Here the appropriate measure is the deadweight social welfareloss arising from the tax, as measured by the triangle, acd, as a percentage of total tax revenuesraised, adef. If the excess burden tax ratio of acd to adef exceeds some threshold level, then thetax may still be effective but it is not an efficient method of achieving the desired environmentalstandard.
The third variant of government intervention is in terms of environmental subsidies. Here,government may impose taxes elsewhere in the economy and use the proceeds to fosterenvironmentally more benign technologies. In this case, the price P(1)ENR and quantity Q(3) maystill be the level of natural resource use generated in the market, but subsidies have enabled theadoption of a production technology that rotates the DEP curve closer to the x axis. Thus, for anygiven level of natural resource demand and supply there will be a correspondingly lower level ofenvironmental pollution and the gap between the private and social market price will becorrespondingly smaller.
Evaluation of an environmental technology subsidy should proceed with several considerationsin mind. One might logically ask why should public resources be used to reduce the environmentalpollution arising from private market transactions. The simple answer is that society derivesbenefits from their reduction and so it is in their collective self-interest to undertake the costs ofabatement. The problem with this approach is that it seems to absolve a polluting firm from anyresponsibility for the environmental damage that it is causing. The flip side of this proposition isthat as long as society has a demand for the goods whose production requires the creation ofenvironmental pollution, then there is a basis for society to participate in the costs of its reduction.
What about tradable pollution permits? This approach takes as a point of departure thatgovernment regulation, taxes, and subsidies may be inefficient to implement and that a principalreason why this be the case is that there is no visible market valuation of the environmentalpollution process. Tradable permits are based on the notion that markets for pollution rights can beestablished which would allocate pollution to those firms and industries that have the highestmarket value of their goods and services. The price of these permits would be determined on thebasis of the level of environmental pollution that could be absorbed by the environment withminimal damage. The greater the damage from a given unit of pollution, the higher would be thepermit price, recognizing that there is no positive pollution permit price that would equate to a levelof zero pollution. This is, in effect, the solution embraced in the Kyoto summit, and it will haveimplications for firms, industries, and countries in Africa as the new system evolves.
B.2 Implications of Environmental Externalities for Sustainable Development Initiatives in Africa
With some exceptions, countries in Africa suffer less from the environmental pollution arisingfrom the consumption of exhaustible natural resources than they do from the environmental costsof a declining renewable natural resource base. This is not to dismiss the importance of exhaustiblenatural resource environmental pollution. Indeed, to the extent that African countries succeed inachieving the kind of energy transition already noted, then there will be a corresponding greateremphasis on the choice of alternative policies along the lines suggested here.
Beyond the issue of relative dependence on renewable versus exhaustible natural resources,African countries do confront the question of establishing more efficient pricing for naturalresource markets. Regulation will undoubtedly be used as a tool, if for no other reason than therelatively simplicity of its application. However, as investment in human resources expands, it alsois important to consider the fostering of improved natural resource markets, including the use ofenvironmental pollution trading permits. To do so is not to embrace the expansion of

- 24 -
environmental pollution, but rather to consider ways in which efficient valuations of naturalresource markets may be made.
Thirdly, one important step toward improved environmental management in Africa is thedevelopment of markets for product recycling. Some markets for product recycling have longexisted in Africa, as in the case of steel plating used in agricultural tools, household kerosenelamps, and a variety of other products. To the extent that recycling markets can flourish, theyreduce the costs of environmental restoration, and thus the need for environmental taxes or otherforms of public sector intervention. For recycling market to expand, however, governments willneed to develop enabling policies that enhance rather than reduce the level of market competition.
Table 1Aggregate Energy Intensity and Environmental Emissions
in Sub-Saharan AfricaPPP Energy Kg of CO2
GNP/P.C. Intensity Emissions per1 9 9 5 EnCon/$PPP GNP $ of GDP,1992
Sudan $440 0.15 0.20Ethiopia $450 0.05 0.40
Zaire $490 0.09 0.70Rwanda $540 0.06 0.20
Mali $550 0.04 0.20Sierra Leone $580 0.14 0.60
Burundi $630 0.04 0.10Madagascar $640 0.05 0.30
Tanzania $640 0.05 0.50Guinea $650 0.09 0.40
Chad $700 0.02 0.20Malawi $750 0.05 0.40Niger $750 0.05 0.50
Burkina Faso $780 0.02 0.20Guinea-Bissau $790 0.05 1.00
Mozambique $810 0.05 0.60Gambia, The $930 0.06 0.60
Zambia $930 0.15 1.00CAR $1,070 0.03 0.20
Togo $1,130 0.04 0.60Nigeria $1,220 0.13 2.60Angola $1,310 0.06 0.60Kenya $1,380 0.08 0.60
Uganda $1,470 0.02 0.10Mauritania $1,540 0.07 2.90
Côte d'Ivoire $1,580 0.06 0.60Benin $1,760 0.01 0.30
Senegal $1,780 0.06 0.60Ghana $1,990 0.05 0.60
Zimbabwe $2,030 0.21 0.70
Congo $2,050 0.14 1.60Cameroon $2,110 0.05 0.20
Gabon $3,500 0.20 1.30Namibia $4,150 0.20 1.10
South Africa $5,030 0.42 3.50Botswana $5,580 0.10 0.90Mauritius $13,210 0.03 0.50
Source: The World Bank, World Development Indicators 1997.

- 25 -
Table 1 provides a summary profile of aggregate energy intensity and environmental emissionsin Sub-Saharan Africa. Tests on these data using an energy price variable show that energyintensity declines in response to an increase in the price of energy, much as one would expect.29
In turn, because energy intensity is directly related to CO2 emissions intensity, maintaining arelatively high energy price is an effective way to achieve lower CO2 emissions.30 However, asnoted in reference to Figure 2, the higher the price of commercial energy, the greater is likely to bethe shift to accelerated consumption of traditional renewable energy resources. To the extent thatthis shift accelerates the consumption of traditional renewable energy resources beyond theirnatural replacement rate, then reductions in the intensity of environmental emissions are likely toreduce an economy’s natural capital stock.
C. Renewable Natural ResourcesThe third element in any sustainable development initiatives is the management of renewable
natural resources. Renewable natural resources can be produced in a state of nature, or in theframework of a market economy. For those renewable natural resources that are produced in aneconomic framework, property rights become as important as they are in the case of exhaustiblenatural resources. Let us look first at the common property resource problem and then examine thespecifics of renewable natural resources in the context of sustainable development initiatives.
C.1 The Common Property Resource ProblemAs in the case of environmental pollution, common property resources pose valuation problems
that also can lead to a mis-allocation of resources. For example, markets may not exist for commonproperty resources because property rights have not been clearly determined. A common propertyresource may be managed by a community, as often is the case in many African countries, butprices are not applied in a visible market sense. One may, for example, acquire simple usufructrights on the basis of being a member of the community. In the absence of a pricing mechanism,as population increases, the community may simply assign smaller quotas to its members as a formof economic triage. Such efforts to provide community equity may bear no resemblance to the pricethat a resource needs to command if it is to be replenished at rates that provide for steady-statestocks.
Figure 6 also can be used to illustrate the common property resource problem. Instead ofenvironmental pollution being portrayed in the fourth quadrant, we can think of DEP as representingthe stock of common property natural resources. Each time a market transaction occurs, or what isequivalent, the right to harvest is decided by a community, the supply of the natural resource willbe affected. If the harvesting rate exceeds the production rate, then this is equivalent to a leftwardshift in the supply curve and a corresponding lower level of common property natural resourcestocks, as in the movement from EP(1)ENR to EP(3)ENR. If, on the other hand, a community devises
29 The rate of change in energy intensity was estimated as a function of the rate of change in the price of energy andthe rate of change in per capita GDP. The resulting equation is: Ln(Energy Intensity) = -.014654 - 3.959316 Ln(GasolinePrice) - 0.0021 Ln(Per Capita GDP) (-170.41)t (-.368358)t Adjusted R2 = .99; DW = 1.95; F=15354. Energy prices thus overwhelm the role of rising per capitaincome, which is not statistically significant in this equation.30 Energy pollution intensity, as measured by the ratio of CO2 emissions per dollar equivalent of GDP, are afunction of energy intensity, which also can be explained in terms of per capita GDP and the relative price of energy. Estimating the rate of change in pollution emissions per dollar of GDP as a function of the rate of change in percapita GDP and the rate of change in the price of energy, we find the following: Ln (CO2/GDP) = -.97729 + .31026 Ln(PC GDP) -2.745 Ln(Gasoline Price) (2.413)t (5.241)t Adjusted R2 = .5234; DW = 2.308; F = 20.772. Although rising per capita income tends to increase the rate ofemissions intensity, it is offset by the rate of change in energy prices.
- 26 -
a way to increase the rate of common property natural resource stock growth relative to demand,there will be a net increase in the supply curve to the right and stocks will increase accordingly.This can occur from improved management of existing resources or through biotechnologyadvances in the production of natural resources.
In both cases, the valuation problem is similar. Market prices tend to undervalue the commonproperty resource, leading to greater rates of harvesting than is sustainable. Creating systems oftransferable property rights is an important step in bringing market valuations closer to sustainablevaluation levels. Establishing transferable property rights requires, however, some mechanism forplacing a value on the assets in the common property resource. It may be, for example, thatsociety is less interested in extracting the physical resources from the environment than frompreserving it in a state of nature, much as is illustrated by efforts to preserve wildlife diversity inmany parts of Africa.
Establishing property rights for a state of nature requires that one devise a method of contingentvaluation.31 This is a well established method in economics and it involves essentially thedetermination of the willingness of individuals to pay for the right to enjoy the environmentwithout any extraction of the natural assets that are found within it. Eco-tourism represents amarket for such initiatives and creates a market-based solution to the valuation of common propertyresources.32 This is just as valid for wild animals as it is for marine sanctuaries designed to protectendangered species. The pricing of these resources should be set at the level sufficient to deterconsumption of the resources beyond some steady-state rate in the growth of natural stocks.
C.2 Renewable Natural Resources and Sustainable Economic Growth in AfricaWhile there has been fairly widespread agreement on the use of economic benchmarks for
international development initiatives, there has been less consensus on the meaning andmeasurement of natural capital, and thus the definition of sustainable natural resource use.33 Thesimple reason why this occurs is that changes in natural capital may not be reflected in marketprices, and thus in national income accounts that are used to measure changes in per capita income.The challenge of sustainable growth thus turns very much on the extent to which we fashioninstitutions to generate efficient pricing of natural resources.
Independent of human action, renewable natural resources follow growth cycles that areshaped by the broader environment. They do so singly, and in complex interactions in nature, asin predator-prey relationships among animal species. Some of these dynamics are yet to bediscovered, which forms the primary case for a commitment to biodiversity.34
31 Contingent Valuation is the setting of prices on the basis of the willingness to pay for access to a resource to bepreserved in its natural state or improved, or equivalently, the minimum they would be willing to accept for a declinein environmental quality if a market existed for the good. For a critical review, see Anil Markandya, “The Value ofthe Environment: A State of the Art Survey”, in Anil Markandya and Julie Richardson, Environmental Economics:A Reader. (New York: St. Martin’s Press, 1992), pp. 142-166. Closely related to contingent valuation is thenotion of option prices and existence values for wildlife resources. See in the same volume, David S. Brookshire,Larry S. Eubanks and Alan Randall, “Estimating Option Prices and Existence Values for Wildlife Resources”, pp.112-128. Option prices become particularly critical in the case of wildlife species. See, for example, Curtis H.Freese, editor, Harvesting Wild Species: Implications for Biodiversity Conservation (Baltimore: The JohnsHopkins University Press, 1997).32 See, for example, Erin O. Sills, “Contingent Valuation of a Forest Ecosystem: Evidence from Indonesia”,working paper, ASSA annual meeting, Chicago, Illinois, January 4, 1998.33 One approach is to developed an environmentally adjusted system of national income accounts. See, for example,United Nations Statistical Office, SNA Draft Handbook for Integrated Environmental and Economic Accounting(New York: United Nations, 1992). While there will be continuing efforts to develop such “green” macro-accounting systems, we will focus here on the micro-foundations of sustainable growth initiatives.34 Op. cit., Edward O. Wilson, The Diversity of Life.
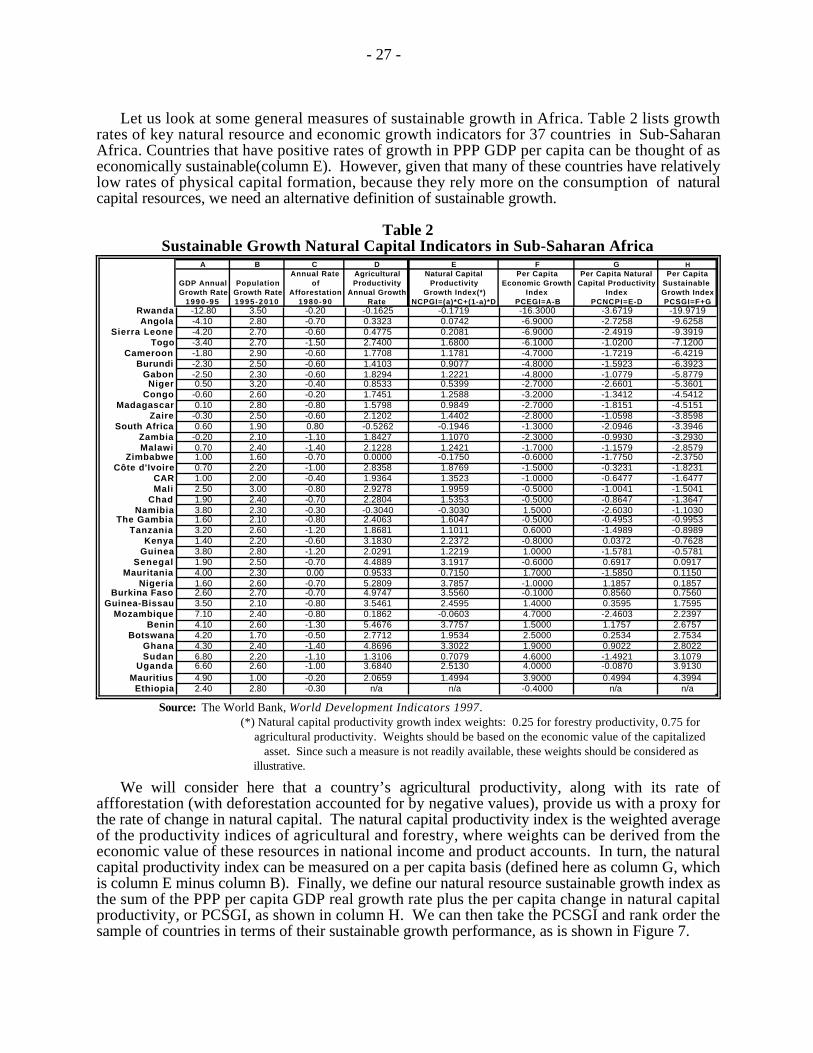
- 27 -
Let us look at some general measures of sustainable growth in Africa. Table 2 lists growthrates of key natural resource and economic growth indicators for 37 countries in Sub-SaharanAfrica. Countries that have positive rates of growth in PPP GDP per capita can be thought of aseconomically sustainable(column E). However, given that many of these countries have relativelylow rates of physical capital formation, because they rely more on the consumption of naturalcapital resources, we need an alternative definition of sustainable growth.
Table 2Sustainable Growth Natural Capital Indicators in Sub-Saharan Africa
A B C D E F G HAnnual Rate Agricultural Natural Capital Per Capita Per Capita Natural Per Capita
GDP Annual Population of Productivity Productivity Economic Growth Capital Productivity Sustainable Growth Rate Growth Rate Afforestation Annual Growth Growth Index(*) Index Index Growth Index
1990-95 1995 -2010 1980-90 Rate NCPGI=(a)*C+(1-a)*D PCEGI=A-B PCNCPI=E-D PCSGI=F+GRwanda -12.80 3.50 -0.20 -0.1625 -0.1719 -16.3000 -3.6719 -19.9719Angola -4.10 2.80 -0.70 0.3323 0.0742 -6.9000 -2.7258 -9.6258
Sierra Leone -4.20 2.70 -0.60 0.4775 0.2081 -6.9000 -2.4919 -9.3919Togo -3.40 2.70 -1.50 2.7400 1.6800 -6.1000 -1.0200 -7.1200
Cameroon -1.80 2.90 -0.60 1.7708 1.1781 -4.7000 -1.7219 -6.4219Burundi -2.30 2.50 -0.60 1.4103 0.9077 -4.8000 -1.5923 -6.3923
Gabon -2.50 2.30 -0.60 1.8294 1.2221 -4.8000 -1.0779 -5.8779Niger 0.50 3.20 -0.40 0.8533 0.5399 -2.7000 -2.6601 -5.3601
Congo -0.60 2.60 -0.20 1.7451 1.2588 -3.2000 -1.3412 -4.5412Madagascar 0.10 2.80 -0.80 1.5798 0.9849 -2.7000 -1.8151 -4.5151
Zaire -0.30 2.50 -0.60 2.1202 1.4402 -2.8000 -1.0598 -3.8598South Africa 0.60 1.90 0.80 -0.5262 -0.1946 -1.3000 -2.0946 -3.3946
Zambia -0.20 2.10 -1.10 1.8427 1.1070 -2.3000 -0.9930 -3.2930Malawi 0.70 2.40 -1.40 2.1228 1.2421 -1.7000 -1.1579 -2.8579
Zimbabwe 1.00 1.60 -0.70 0.0000 -0.1750 -0.6000 -1.7750 -2.3750Côte d'Ivoire 0.70 2.20 -1.00 2.8358 1.8769 -1.5000 -0.3231 -1.8231
CAR 1.00 2.00 -0.40 1.9364 1.3523 -1.0000 -0.6477 -1.6477Mali 2.50 3.00 -0.80 2.9278 1.9959 -0.5000 -1.0041 -1.5041
Chad 1.90 2.40 -0.70 2.2804 1.5353 -0.5000 -0.8647 -1.3647Namibia 3.80 2.30 -0.30 -0.3040 -0.3030 1.5000 -2.6030 -1.1030
The Gambia 1.60 2.10 -0.80 2.4063 1.6047 -0.5000 -0.4953 -0.9953Tanzania 3.20 2.60 -1.20 1.8681 1.1011 0.6000 -1.4989 -0.8989
Kenya 1.40 2.20 -0.60 3.1830 2.2372 -0.8000 0.0372 -0.7628Guinea 3.80 2.80 -1.20 2.0291 1.2219 1.0000 -1.5781 -0.5781
Senegal 1.90 2.50 -0.70 4.4889 3.1917 -0.6000 0.6917 0.0917Mauritania 4.00 2.30 0.00 0.9533 0.7150 1.7000 -1.5850 0.1150
Nigeria 1.60 2.60 -0.70 5.2809 3.7857 -1.0000 1.1857 0.1857Burkina Faso 2.60 2.70 -0.70 4.9747 3.5560 -0.1000 0.8560 0.7560
Guinea-Bissau 3.50 2.10 -0.80 3.5461 2.4595 1.4000 0.3595 1.7595Mozambique 7.10 2.40 -0.80 0.1862 -0.0603 4.7000 -2.4603 2.2397
Benin 4.10 2.60 -1.30 5.4676 3.7757 1.5000 1.1757 2.6757Botswana 4.20 1.70 -0.50 2.7712 1.9534 2.5000 0.2534 2.7534
Ghana 4.30 2.40 -1.40 4.8696 3.3022 1.9000 0.9022 2.8022Sudan 6.80 2.20 -1.10 1.3106 0.7079 4.6000 -1.4921 3.1079
Uganda 6.60 2.60 -1.00 3.6840 2.5130 4.0000 -0.0870 3.9130Mauritius 4.90 1.00 -0.20 2.0659 1.4994 3.9000 0.4994 4.3994
Ethiopia 2.40 2.80 -0.30 n/a n/a -0.4000 n/a n/a
Source: The World Bank, World Development Indicators 1997. (*) Natural capital productivity growth index weights: 0.25 for forestry productivity, 0.75 for
agricultural productivity. Weights should be based on the economic value of the capitalized asset. Since such a measure is not readily available, these weights should be considered as illustrative.
We will consider here that a country’s agricultural productivity, along with its rate ofaffforestation (with deforestation accounted for by negative values), provide us with a proxy forthe rate of change in natural capital. The natural capital productivity index is the weighted averageof the productivity indices of agricultural and forestry, where weights can be derived from theeconomic value of these resources in national income and product accounts. In turn, the naturalcapital productivity index can be measured on a per capita basis (defined here as column G, whichis column E minus column B). Finally, we define our natural resource sustainable growth index asthe sum of the PPP per capita GDP real growth rate plus the per capita change in natural capitalproductivity, or PCSGI, as shown in column H. We can then take the PCSGI and rank order thesample of countries in terms of their sustainable growth performance, as is shown in Figure 7.
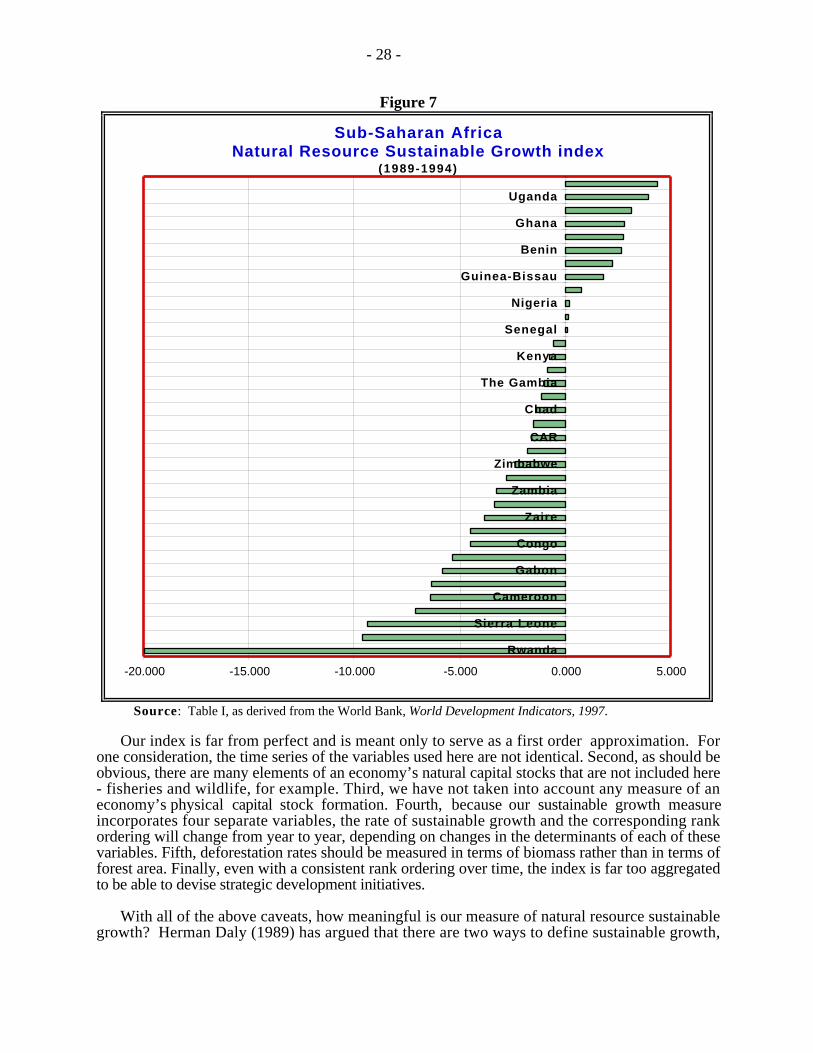
- 28 -
Figure 7
Sub-Saharan Africa Natural Resource Sustainable Growth index
(1989-1994)
-20.000 -15.000 -10.000 -5.000 0.000 5.000
Rwanda
Sierra Leone
Cameroon
Gabon
Congo
Zaire
Zambia
Zimbabwe
CAR
Chad
The Gambia
Kenya
Senegal
Nigeria
Guinea-Bissau
Benin
Ghana
Uganda
Source: Table I, as derived from the World Bank, World Development Indicators, 1997.
Our index is far from perfect and is meant only to serve as a first order approximation. Forone consideration, the time series of the variables used here are not identical. Second, as should beobvious, there are many elements of an economy’s natural capital stocks that are not included here- fisheries and wildlife, for example. Third, we have not taken into account any measure of aneconomy’s physical capital stock formation. Fourth, because our sustainable growth measureincorporates four separate variables, the rate of sustainable growth and the corresponding rankordering will change from year to year, depending on changes in the determinants of each of thesevariables. Fifth, deforestation rates should be measured in terms of biomass rather than in terms offorest area. Finally, even with a consistent rank ordering over time, the index is far too aggregatedto be able to devise strategic development initiatives.
With all of the above caveats, how meaningful is our measure of natural resource sustainablegrowth? Herman Daly (1989) has argued that there are two ways to define sustainable growth,

- 29 -
namely, strong and weak sustainability.35 Strong sustainability would require that the ratio ofnatural capital stocks to per capita income remain constant or increasing over time, while weaksustainability would require that the combined stock of natural and physical capital relative to percapita income be constant or increasing over time.
There are several difficulties with strong sustainability. In the extreme, it would require thatpopulation increase no faster than the slowest growing species of plant or animal life, regardless ofdifferential rates of biological life cycles and independent of any human intervention. However,what makes this measure equally problematic is that it does not take into consideration the costsand benefits of these resources, and which is why we have such contentious debates such as thevalue of spotted owls in a commercial forest, or the snail darter along a commercial riverway. Inshort, absent any economic valuation, we risk engaging in a Noah syndrome, which is toinventory all species with a view toward their conservation independent of any other criteria. Inshort, we need to measure the cost of the boat as we load up the species.
Daly recognizes that strong sustainability may not be readily achievable, but argues that policiesin developing countries do not even meet the test of weak sustainability in many cases. He thusargues that weak sustainability should serve as a benchmark floor in devising sustainable growthalternatives. We will keep both concepts in mind as we look to the economics of sustainablegrowth.
Where, then, can we move the discussion on natural resource use such that we can establishsome economic comparability consistent with our underlying definitions of sustainable growth anddevelopment? Several steps are needed to answer this question. First is to define sustainable usein terms of the underlying physical dynamics of natural resources. Second is to define marketprices consistent with the dynamics of supply and a corresponding level of demand. Third is todevise incentives to provide economic values to the natural resource base and to determine the limitvalues consistent with some underlying notion of preservation and expansion of a society’s stockof natural capital. Finally, we need to integrate these steps with institutional and policy initiativesto establish a consistent framework for sustainable economic growth. Let us consider each in turn.
C.3 Biophysical SustainabilityFrom a purely environmental perspective, sustainable resource use means that the extraction
rate of a renewable natural resource does not exceed the replacement rate. The standardinterpretation in environmental resource accounting is that the harvesting of a renewable naturalresource cannot exceed the maximum sustainable yield level. Any rate above this rate eventuallywill deplete the renewable natural resource to zero. Any positive rate of harvesting less than themaximum sustainable yield will generate an eventual steady-state production path whose value willdepend on whether harvesting begins before the maximum sustainable yield rate or after.
Figure 8 illustrates the natural growth rate of a given renewable natural resource. Growthoccurs initially at an increasing rate, followed by a decreasing rate, and eventually at a zero rate.The carrying capacity of the natural environment is the upper limit of growth, whose rate of changeis zero. While there are several variants of natural resource growth curves, we will use the logitcurve as a first order approximation.36
35 Op.cit., Daly(1989), pp. 71-72.36 The curve was first put forth by P. Verhulst in “Notice sur la loi que la population suit dans son accroissement,”Correspondance Mathématique et Physique 10 (1838), pp. 113-121. See also, Colin W. Clark, MathematicalBioeconomics, second edition. (New York: John Wiley and Sons, 1990); and D’Arcy Wentworth Thompson, OnGrowth and Form, revised edition (New York: Dover Reprint edition, 1992); For an empirical approximation, seeJudd Hammack and Gardner Mallard Brown, Jr., Waterfowl and Wetlands: Toward Bioeconomic Analysis.(Washington, D.C.: Resources for the Future 1974). Figure 1 is based on a logistical growth equation of the form:
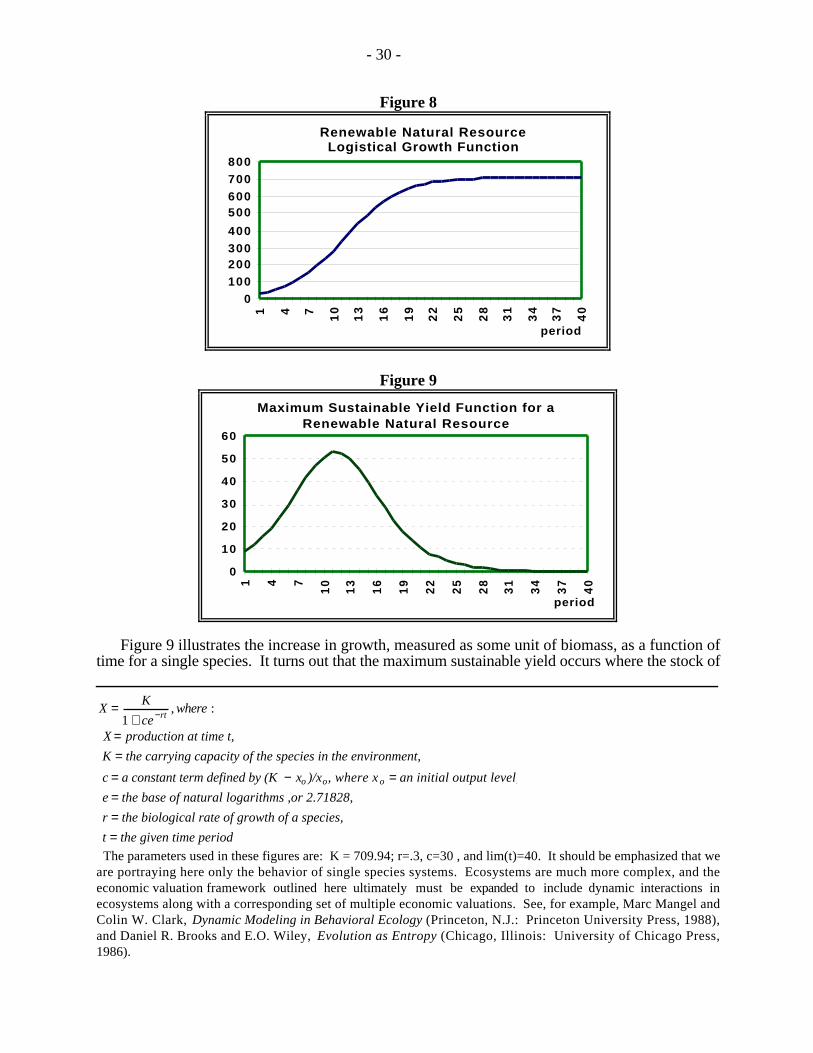
- 30 -
Figure 8
Renewable Natural Resource Logistical Growth Function
0100200300400
500600700800
1 4 7 10
13
16
19
22
25
28
31
34
37
40
period
Figure 9
Maximum Sustainable Yield Function for a Renewable Natural Resource
0
10
20
30
40
50
60
1 4 7
10
13
16
19
22
25
28
31
34
37
40
period
Figure 9 illustrates the increase in growth, measured as some unit of biomass, as a function oftime for a single species. It turns out that the maximum sustainable yield occurs where the stock of
X = K
1 + ce −rt, where :
X = production at time t,
K = the carrying capacity of the species in the environment,
c = a constant term defined by (K − xo )/xo, where x o = an initial output level,
e = the base of natural logarithms ,or 2.71828,
r = the biological rate of growth of a species,
t = the given time period
The parameters used in these figures are: K = 709.94; r=.3, c=30 , and lim(t)=40. It should be emphasized that weare portraying here only the behavior of single species systems. Ecosystems are much more complex, and theeconomic valuation framework outlined here ultimately must be expanded to include dynamic interactions inecosystems along with a corresponding set of multiple economic valuations. See, for example, Marc Mangel andColin W. Clark, Dynamic Modeling in Behavioral Ecology (Princeton, N.J.: Princeton University Press, 1988),and Daniel R. Brooks and E.O. Wiley, Evolution as Entropy (Chicago, Illinois: University of Chicago Press,1986).
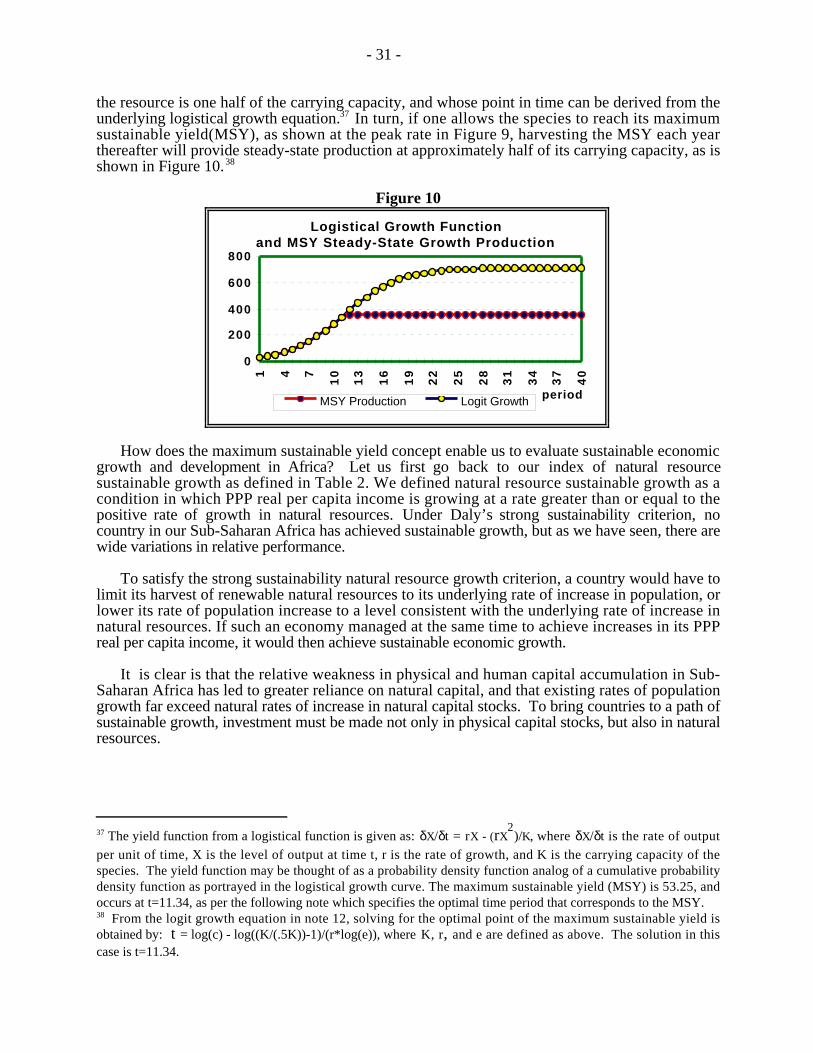
- 31 -
the resource is one half of the carrying capacity, and whose point in time can be derived from theunderlying logistical growth equation.37 In turn, if one allows the species to reach its maximumsustainable yield(MSY), as shown at the peak rate in Figure 9, harvesting the MSY each yearthereafter will provide steady-state production at approximately half of its carrying capacity, as isshown in Figure 10.38
Figure 10
Logistical Growth Functionand MSY Steady-State Growth Production
0
200
400
600
8001 4 7
10
13
16
19
22
25
28
31
34
37
40
MSY Production Logit Growth period
How does the maximum sustainable yield concept enable us to evaluate sustainable economicgrowth and development in Africa? Let us first go back to our index of natural resourcesustainable growth as defined in Table 2. We defined natural resource sustainable growth as acondition in which PPP real per capita income is growing at a rate greater than or equal to thepositive rate of growth in natural resources. Under Daly’s strong sustainability criterion, nocountry in our Sub-Saharan Africa has achieved sustainable growth, but as we have seen, there arewide variations in relative performance.
To satisfy the strong sustainability natural resource growth criterion, a country would have tolimit its harvest of renewable natural resources to its underlying rate of increase in population, orlower its rate of population increase to a level consistent with the underlying rate of increase innatural resources. If such an economy managed at the same time to achieve increases in its PPPreal per capita income, it would then achieve sustainable economic growth.
It is clear is that the relative weakness in physical and human capital accumulation in Sub-Saharan Africa has led to greater reliance on natural capital, and that existing rates of populationgrowth far exceed natural rates of increase in natural capital stocks. To bring countries to a path ofsustainable growth, investment must be made not only in physical capital stocks, but also in naturalresources.
37 The yield function from a logistical function is given as: δX/δt = rX - (rX
2)/K, where δX/δt is the rate of output
per unit of time, X is the level of output at time t, r is the rate of growth, and K is the carrying capacity of thespecies. The yield function may be thought of as a probability density function analog of a cumulative probabilitydensity function as portrayed in the logistical growth curve. The maximum sustainable yield (MSY) is 53.25, andoccurs at t=11.34, as per the following note which specifies the optimal time period that corresponds to the MSY.38 From the logit growth equation in note 12, solving for the optimal point of the maximum sustainable yield isobtained by: t = log(c) - log((K/(.5K))-1)/(r*log(e)), where K, r, and e are defined as above. The solution in thiscase is t=11.34.
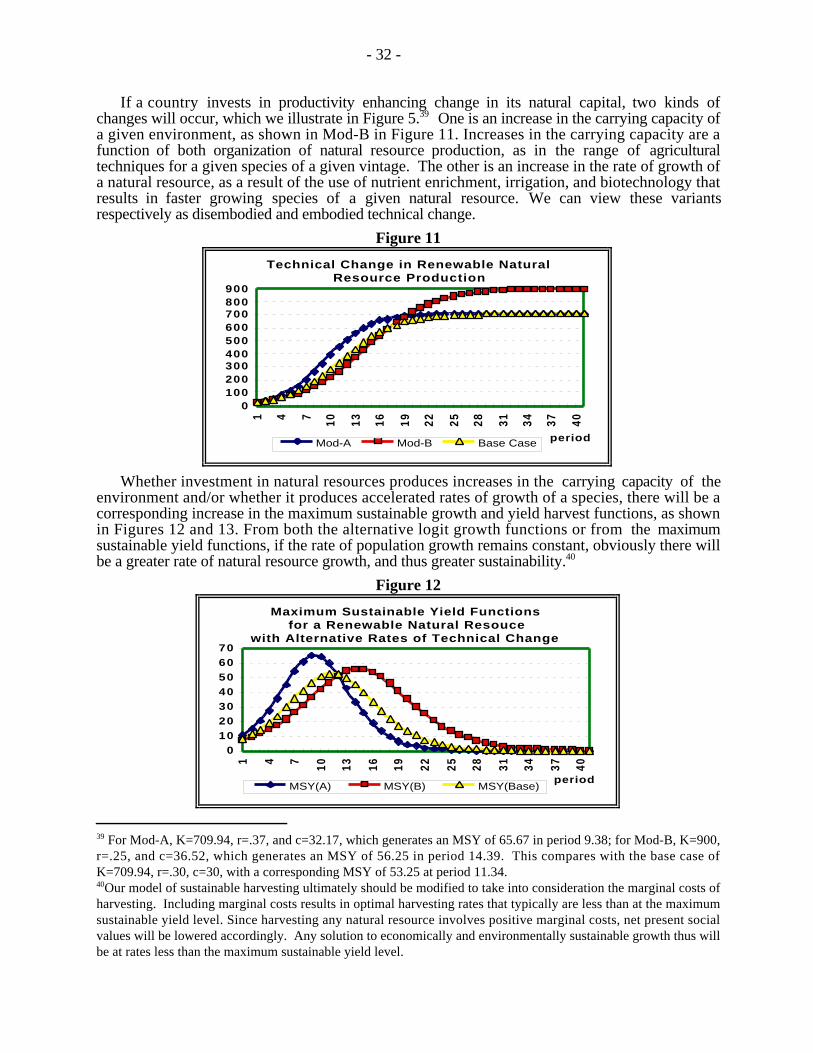
- 32 -
If a country invests in productivity enhancing change in its natural capital, two kinds ofchanges will occur, which we illustrate in Figure 5.39 One is an increase in the carrying capacity ofa given environment, as shown in Mod-B in Figure 11. Increases in the carrying capacity are afunction of both organization of natural resource production, as in the range of agriculturaltechniques for a given species of a given vintage. The other is an increase in the rate of growth ofa natural resource, as a result of the use of nutrient enrichment, irrigation, and biotechnology thatresults in faster growing species of a given natural resource. We can view these variantsrespectively as disembodied and embodied technical change.
Figure 11
Technical Change in Renewable Natural Resource Production
0100200300400500600700800900
1 4 7 10 13 16 19 22 25 28 31 34 37 40
Mod-A Mod-B Base Case period
Whether investment in natural resources produces increases in the carrying capacity of theenvironment and/or whether it produces accelerated rates of growth of a species, there will be acorresponding increase in the maximum sustainable growth and yield harvest functions, as shownin Figures 12 and 13. From both the alternative logit growth functions or from the maximumsustainable yield functions, if the rate of population growth remains constant, obviously there willbe a greater rate of natural resource growth, and thus greater sustainability.40
Figure 12
Maximum Sustainable Yield Functions for a Renewable Natural Resouce
with Alternative Rates of Technical Change
010203040506070
1 4 7 10 13 16 19 22 25 28 31 34 37 40
MSY(A) MSY(B) MSY(Base)period
39 For Mod-A, K=709.94, r=.37, and c=32.17, which generates an MSY of 65.67 in period 9.38; for Mod-B, K=900,r=.25, and c=36.52, which generates an MSY of 56.25 in period 14.39. This compares with the base case ofK=709.94, r=.30, c=30, with a corresponding MSY of 53.25 at period 11.34.40Our model of sustainable harvesting ultimately should be modified to take into consideration the marginal costs ofharvesting. Including marginal costs results in optimal harvesting rates that typically are less than at the maximumsustainable yield level. Since harvesting any natural resource involves positive marginal costs, net present socialvalues will be lowered accordingly. Any solution to economically and environmentally sustainable growth thus willbe at rates less than the maximum sustainable yield level.
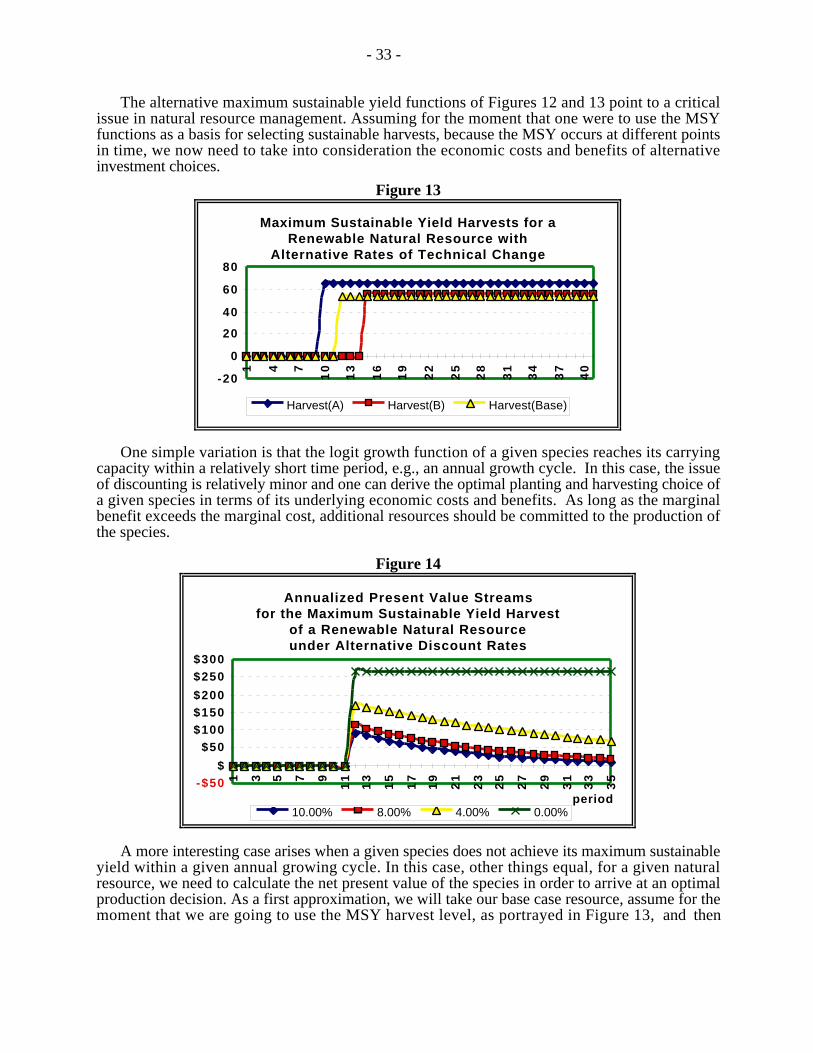
- 33 -
The alternative maximum sustainable yield functions of Figures 12 and 13 point to a criticalissue in natural resource management. Assuming for the moment that one were to use the MSYfunctions as a basis for selecting sustainable harvests, because the MSY occurs at different pointsin time, we now need to take into consideration the economic costs and benefits of alternativeinvestment choices.
Figure 13
Maximum Sustainable Yield Harvests for a Renewable Natural Resource with
Alternative Rates of Technical Change
-20
0
20
40
60
80
1 4 7
10
13
16
19
22
25
28
31
34
37
40
Harvest(A) Harvest(B) Harvest(Base)
One simple variation is that the logit growth function of a given species reaches its carryingcapacity within a relatively short time period, e.g., an annual growth cycle. In this case, the issueof discounting is relatively minor and one can derive the optimal planting and harvesting choice ofa given species in terms of its underlying economic costs and benefits. As long as the marginalbenefit exceeds the marginal cost, additional resources should be committed to the production ofthe species.
Figure 14
Annualized Present Value Streams for the Maximum Sustainable Yield Harvest
of a Renewable Natural Resource under Alternative Discount Rates
-$50$
$50$100$150$200
$250$300
1 3 5 7 9
11
13
15
17
19
21
23
25
27
29
31
33
35
10.00% 8.00% 4.00% 0.00%period
A more interesting case arises when a given species does not achieve its maximum sustainableyield within a given annual growing cycle. In this case, other things equal, for a given naturalresource, we need to calculate the net present value of the species in order to arrive at an optimalproduction decision. As a first approximation, we will take our base case resource, assume for themoment that we are going to use the MSY harvest level, as portrayed in Figure 13, and then

- 34 -
calculate the annualized present values of the resource, as is shown above in Figure 14, and forwhich the sum is the Present Value of the MSY harvest, as shown in Figure 15:41
Figure 15
Present Value of the MSY Harvest of a Renewable Natural Resource
$
$2,000
$4,000
$6,000
$8,000
$10,000
$12,000
$14,000
0%
2%
4%
6%
8%
10
%
12
%
14
%
16
%
18
%
20
%
Determination of the optimal investment in a renewable natural resource can now be determinedas the net present value of the resource at the opportunity cost of capital, or discount rate. As longas the Net Present Value(or NPV) of the investment discounted at the opportunity cost of capital ispositive, the investment should be undertaken.
V. Economic Incentives for the Efficient Valuation of Natural ResourcesAlthough we have now established a basic economic framework for investment in natural
resources, it does not follow that the necessary institutions are in place to achieve an efficientallocation of resources. It also does not follow that an efficient allocation of resources also will besustainable. Furthermore, even if we achieve sustainable growth through the maximum sustainableyield criterion, this may not necessarily be the optimal harvest rate for a renewable naturalresource, especially if we take into account the present value of the marginal cost of production incomparison to the present value of the marginal benefit. In this section, we look at each of theseconsiderations with the goal of establishing appropriate economic incentives for the efficientvaluation of natural resources, and in a way that is consistent with sustainable growth.
Let us consider for our present purposes the question of a pure allocation of resourcesnecessary to achieve sustainable growth in natural resources per capita. We will thus set aside thequestion of external effects such as environmental pollution that arise from any economic process,and we also will defer consideration of the issue of property rights. In this simplified framework, 41 Using the MSY, since it will be generated in perpetuity for the life of the renewable natural resource, we multiplythe quantity in each time period times the market value of the harvested resource. In Figure 7, we are using a priceof $5.00 times the MSY of 53.25, or VMSY, beginning in period 12, at alternative discount rates of 10%, 8%, 4%and 0%. The lower the discount rate, the closer the annualized present values will approximate a constant stream ofbenefits, with the zero discount option shown in blue at the top in Figure 7. These streams are thus given
as: APV =VMSY 0(1 + r)0 ,
VMSY 1(1 + r)1 ,
VMSY 2(1 + r) 2 ..., which when added together yield the present value: PV =
VMSY t(1 + r)t
t = 0
n
∑
The continuous time version of the present valuation is: (VMSY)e−rt
0
t
∫ dt − (VMSY)e −rt
0
t(msy)
∫ dt . In both cases,
present valuations must take into account that no harvesting would begin until the maximum sustainable yield isachieved. Since we are looking only at the present value of benefits, the MSY may not be economically optimalonce one takes costs into consideration.

- 35 -
the question now is what amount of investment is necessary to guarantee that a constant orincreasing level of natural resources per capita will be available. If the population growth rate iszero, we thus can calculate the ratio of per capita natural resources that will be available under themaximum sustainable yield. While some would stipulate that this ratio should also be coupled witha minimum target level consistent with human reproduction, we will consider here only theeconomic requirements necessary to achieve the maximum sustainable yield.
The first point is that if maximum sustainable yield requires deferred consumption until anatural resource has reached its maximum sustainable yield rate, there will be zero consumption ofthis resource up to the point where maximum sustainable yield harvests can be undertaken, muchas was illustrated in Figures 13 and 14. The question then is, even in the presence of a zeropopulation growth rate, how could one arrive at sustainable economic growth in which themaximum sustainable yield of the resource is invariant over time?
The answer is that there must be technical change in the consumption of the natural resourcesuch that a higher level of per capita income can be achieved from a constant production stream ofthe renewable natural resource. Here we are looking at the underlying thermodynamics of naturalresource conversion. As one moves from lower entropy to higher entropy conversions, themarginal cost of additional efficiency will rise. As long as the economic return to each additionalconversion is at least equal to the opportunity cost of capital, the process can continue. There is,however, no automatic mechanism that will guarantee this outcome, particularly if technologicalchange in the conversion of renewable natural resources is a discontinuous process dependent onan uneven flow of innovation.
What happens when a renewable natural resource is produced under conditions of increasingpopulation? Here the problem is more complicated in that we confront the twin issues of thenecessary waiting period before a maximum sustainable yield harvest can begin, and the fact thatthis will no longer correspond to a sustainable growth standard over time. This means that theremust be a stream of investment necessary to raise the maximum sustainable yield level in such away that the per capita level of natural resource availability over time is constant or increasing.John Pezzey has derived the conditions necessary to achieve sustainable growth under theseconditions.42 His solution, for a single species, is that sustainable welfare growth, i.e., per capitaincome growth with a constant level of renewable natural resources per capita, is possible as longas the renewable natural resource growth rate exceeds the sum of both the discount rate and thepopulation growth rate.
Several conclusions can be derived from the framework of renewable resource growth models.One is that as long as population is increasing, investment in renewable resource production must
42 John Pezzey, “Economic Analysis of Sustainable Growth and Sustainable Development” Working Paper No. 15(Washington, D.C.: World Bank Environment Department, 1989). Pezzey’s essay defines not only the necessarycondition for sustainable growth in per capita welfare, but also the necessary condition that the per capita renewablenatural resource base meets some other minimum criterion, e.g., biological reproducibility of the human speciesbased on the initial production conditions of the renewable natural resource. Pezzey’s formulation, which hecharacterizes as a ‘corn-eating’ model with a minimum subsistence level, can be summarized maximizing the presentdiscounted value of utility derived from a personally-owned stock over an infinite time horizon:
Maximize u[c(t )]e−( − )tdt0
∞
∫ . By maximizing discounted unweighted utility, the differential equation optimal
solution for the optimal corn stock s(t) is (1 − v) s••
+ [ − (2 − v)] s•+ ( − )s = ( − )cm , where γ=ρ−λ. This
linear equation yields the following solutions for per capita variables: Resource stock s*(t)=cm//γ + (sΟ − cm/γ ) eηt ,
where η=(ρ−λ−δ)/(1−υ); Consumption c*(t)= cm + (γ−η)(s0-cm/γ )eηt; and utility u*(t) = [(γ−η)(s0-cm/γ ) eηt]v.
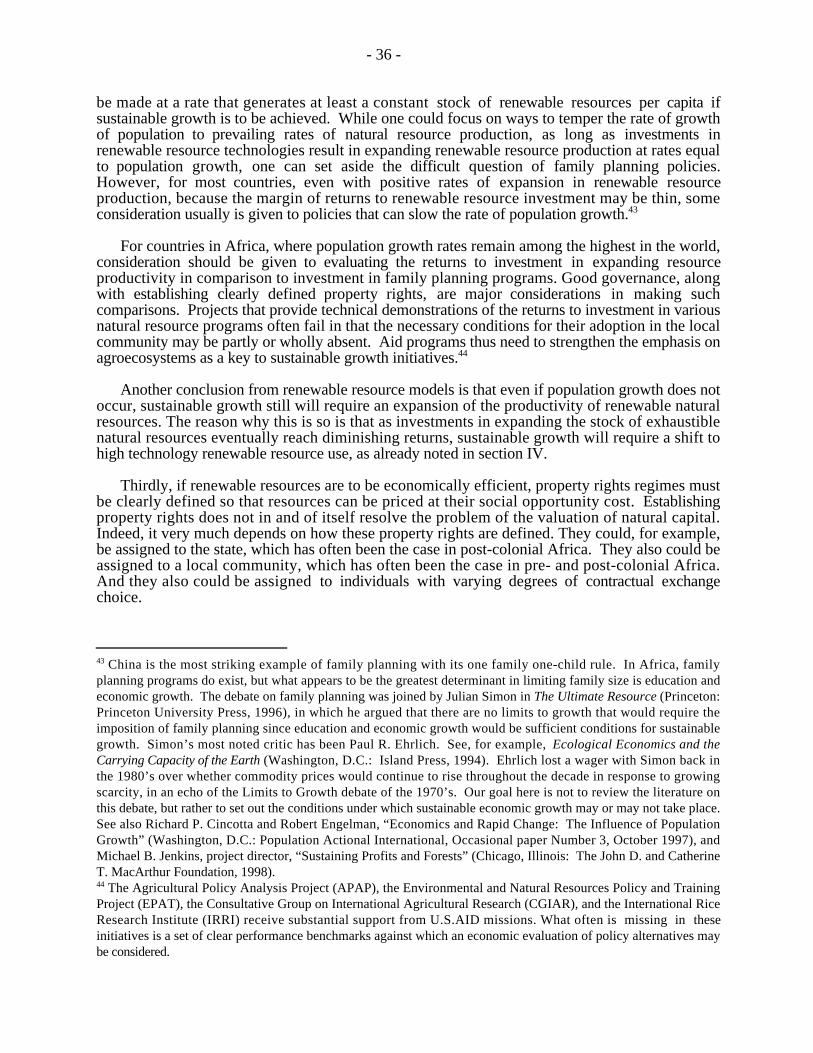
- 36 -
be made at a rate that generates at least a constant stock of renewable resources per capita ifsustainable growth is to be achieved. While one could focus on ways to temper the rate of growthof population to prevailing rates of natural resource production, as long as investments inrenewable resource technologies result in expanding renewable resource production at rates equalto population growth, one can set aside the difficult question of family planning policies.However, for most countries, even with positive rates of expansion in renewable resourceproduction, because the margin of returns to renewable resource investment may be thin, someconsideration usually is given to policies that can slow the rate of population growth.43
For countries in Africa, where population growth rates remain among the highest in the world,consideration should be given to evaluating the returns to investment in expanding resourceproductivity in comparison to investment in family planning programs. Good governance, alongwith establishing clearly defined property rights, are major considerations in making suchcomparisons. Projects that provide technical demonstrations of the returns to investment in variousnatural resource programs often fail in that the necessary conditions for their adoption in the localcommunity may be partly or wholly absent. Aid programs thus need to strengthen the emphasis onagroecosystems as a key to sustainable growth initiatives.44
Another conclusion from renewable resource models is that even if population growth does notoccur, sustainable growth still will require an expansion of the productivity of renewable naturalresources. The reason why this is so is that as investments in expanding the stock of exhaustiblenatural resources eventually reach diminishing returns, sustainable growth will require a shift tohigh technology renewable resource use, as already noted in section IV.
Thirdly, if renewable resources are to be economically efficient, property rights regimes mustbe clearly defined so that resources can be priced at their social opportunity cost. Establishingproperty rights does not in and of itself resolve the problem of the valuation of natural capital.Indeed, it very much depends on how these property rights are defined. They could, for example,be assigned to the state, which has often been the case in post-colonial Africa. They also could beassigned to a local community, which has often been the case in pre- and post-colonial Africa.And they also could be assigned to individuals with varying degrees of contractual exchangechoice.
43 China is the most striking example of family planning with its one family one-child rule. In Africa, familyplanning programs do exist, but what appears to be the greatest determinant in limiting family size is education andeconomic growth. The debate on family planning was joined by Julian Simon in The Ultimate Resource (Princeton:Princeton University Press, 1996), in which he argued that there are no limits to growth that would require theimposition of family planning since education and economic growth would be sufficient conditions for sustainablegrowth. Simon’s most noted critic has been Paul R. Ehrlich. See, for example, Ecological Economics and theCarrying Capacity of the Earth (Washington, D.C.: Island Press, 1994). Ehrlich lost a wager with Simon back inthe 1980’s over whether commodity prices would continue to rise throughout the decade in response to growingscarcity, in an echo of the Limits to Growth debate of the 1970’s. Our goal here is not to review the literature onthis debate, but rather to set out the conditions under which sustainable economic growth may or may not take place.See also Richard P. Cincotta and Robert Engelman, “Economics and Rapid Change: The Influence of PopulationGrowth” (Washington, D.C.: Population Actional International, Occasional paper Number 3, October 1997), andMichael B. Jenkins, project director, “Sustaining Profits and Forests” (Chicago, Illinois: The John D. and CatherineT. MacArthur Foundation, 1998).44 The Agricultural Policy Analysis Project (APAP), the Environmental and Natural Resources Policy and TrainingProject (EPAT), the Consultative Group on International Agricultural Research (CGIAR), and the International RiceResearch Institute (IRRI) receive substantial support from U.S.AID missions. What often is missing in theseinitiatives is a set of clear performance benchmarks against which an economic evaluation of policy alternatives maybe considered.

- 37 -
Fourthly, decentralization of property rights as closely as possible to end users is certainly animportant element of an efficient system. However, the principal factor that will determineeconomic efficiency in the use of natural resources is the extent to which transactions costsinvolving property rights can be minimized, as was noted long ago by Ronald Coase.45 Ascountries embrace national environmental action plans, what is needed is to provide explicitconsideration of the transactions costs associated with the transfer and use of property rights innatural resource management. Unless systems can be adopted that keep transactions costs relativelylow, markets will fail to provide for an efficient allocation of natural resources, and sustainablegrowth initiatives will be limited accordingly.
Where, then, does this leave us in terms of the role of economics in achieving sustainablegrowth and development in Africa? As noted in the beginning of this paper, African countries placegrowing emphasis on policies designed to achieve sustainable growth and development.Unfortunately, many of these initiatives still tend to be highly centralized and undertaken with littleregard to the social costs of implementation. While these conventions may provide lists of what ispermitted and what is not, regulation as such does not produce an efficient economic valuation ofnatural resources. Absent such economic valuation, we will continue to witness a process ofperiodic revision of regulated lists, using at best proxy measures of natural resource value whereno incentive to reach such an evaluation has been established. While better than doing nothing, itwavers between outright prohibition to achieve no use and overuse because of incomplete estimatesof the underlying dynamics of natural resource stocks. Clearly, we need to develop comparabilityyardsticks for these conventions, and to link them to broader measures of economic and socialwelfare, which is why economic measurement is important. Ultimately, it is not just the adoptionof economic measures of natural resource use, but the creation of incentives that can enable market-based institutions to allocate these resources in a more sustainable fashion than has been the caseup to now.
45 Ronald Coase, “The Problem of Social Cost,” Journal of Law and Economics (October 1960), 3: 1-44. WhileCoase’s article signaled the importance of transactions costs to the determination of property rights, it did notdetermine on what basis property rights would evolve. As pointed out in note 21, the literature on transactions costsand property rights has expanded substantially, and extends not just to market transactions, but also to the structureof firms. See, for example, Oliver Williamson, Markets and Hierarchies (New York: The Free Press, 1975); YoramBarzel, Economic Analysis of Property Rights (New York: Cambridge University Press, 1989); Barnard Salanié,The Economics of Contracts (Cambridge: MIT Press, 1997); and Susan S. Hanna, Carl Folke, and Karl-Gî ranMÑler, Rights to Nature: Ecological, Economic, Cultural, and Political Principles of Institutions for theEnvironment. Washington, D.C.: Island Press, 1996). As much of this literature affirms, the assignment andefficiency of economic property rights turns critically on the level and distribution of information. As noted insection IV.A, efficient markets depend ultimately on the capacity of market institutions to develop products tomanage decisions in the presence of incomplete information. Futures and options markets in natural resources thushave an important role to play in helping to reduce transactions costs, and thus to generate a process for the sociallyefficient allocation of these resources.

- 38 -
Table A.1 Sub-Saharan Africa Energy Profile
Population Population PPP GNP PPP Comm.En. Comm.En. Energy Import Energy Energy Millions Growth Rate $millions GNP/P.C. Prod. 1994 Cons.1994 Dependence Consumption Efficiency
1 9 9 5 1995 -2010 1 9 9 5 1 9 9 5 10^3 mtoe 10^3mtoe KG Per Capita KG per capita KG per $GNPAngola 11 2.80 $14,410 $1,310 24914 931 2180.27 84.64 0.06
Benin 5 2.60 $8,800 $1,760 315 107 41.60 21.40 0.01
Botswana 1 1.70 $5,580 $5,580 248 549 -301.00 549.00 0.10Burkina Faso 10 2.60 $7,800 $780 0 160 -16.00 16.00 0.02
Burundi 6 2.50 $3,780 $630 5 143 -23.00 23.83 0.04Cameroon 13 2.90 $27,430 $2,110 5782 1335 342.08 102.69 0.05
CAR 3 2.00 $3,210 $1,070 22 93 -23.67 31.00 0.03
Chad 6 2.40 $4,200 $700 0 100 -16.67 16.67 0.02Congo 3 2.60 $6,150 $2,050 9428 847 2860.33 282.33 0.14
Côte d'Ivoire 14 2.20 $22,120 $1,580 425 1406 -70.07 100.43 0.06Ethiopia 56 2.80 $25,200 $450 156 1193 -18.52 21.30 0.05
Gabon 1 2.30 $3,500 $3,500 15998 692 15306.00 692.00 0.20
The Gambia 1 2.10 $930 $930 0 60 -60.00 60.00 0.06Ghana 17 2.40 $33,830 $1,990 523 1542 -59.94 90.71 0.05
Guinea 7 2.80 $4,550 $650 57 418 -51.57 59.71 0.09Guinea-Bissau 1 2.10 $790 $790 0 39 -39.00 39.00 0.05
Kenya 27 2.20 $37,260 $1,380 488 2872 -88.30 106.37 0.08
Madagascar 14 2.80 $8,960 $640 83 479 -28.29 34.21 0.05Malawi 10 2.40 $7,500 $750 152 370 -21.80 37.00 0.05
Mali 10 3.00 $5,500 $550 42 205 -16.30 20.50 0.04Mauritania 2 2.30 $3,080 $1,540 0 229 -114.50 114.50 0.07
Mauritius 1 1.00 $13,210 $13,210 34 431 -397.00 431.00 0.03Mozambique 16 2.40 $12,960 $810 161 619 -28.63 38.69 0.05
Namibia 2 2.30 $8,300 $4,150 0 1624 -812.00 812.00 0.20Niger 9 3.20 $6,750 $750 55 327 -30.22 36.33 0.05
Nigeria 111 2.60 $135,420 $1,220 102138 17503 762.48 157.68 0.13
Rwanda 6 3.50 $3,240 $540 46 209 -27.17 34.83 0.06Senegal 8 2.50 $14,240 $1,780 0 803 -100.38 100.38 0.06
Sierra Leone 4 2.70 $2,320 $580 0 323 -80.75 80.75 0.14South Africa 41 1.90 $206,230 $5,030 117691 86995 748.68 2121.83 0.42
Sudan 27 2.20 $11,880 $440 81 1731 -61.11 64.11 0.15
Tanzania 30 2.60 $19,200 $640 165 95 2.33 3.17 0.00Togo 4 2.70 $4,520 $1,130 0 183 -45.75 45.75 0.04
Uganda 19 2.60 $27,930 $1,470 179 425 -12.95 22.37 0.02Zaire 44 2.50 $21,560 $490 1877 1902 -0.57 43.23 0.09
Zambia 9 2.10 $8,370 $930 890 1296 -45.11 144.00 0.15
Zimbabwe 11 1.60 $22,330 $2,030 3567 4722 -105.00 429.27 0.21
Source: The World Bank, World Development Indicators 1997.
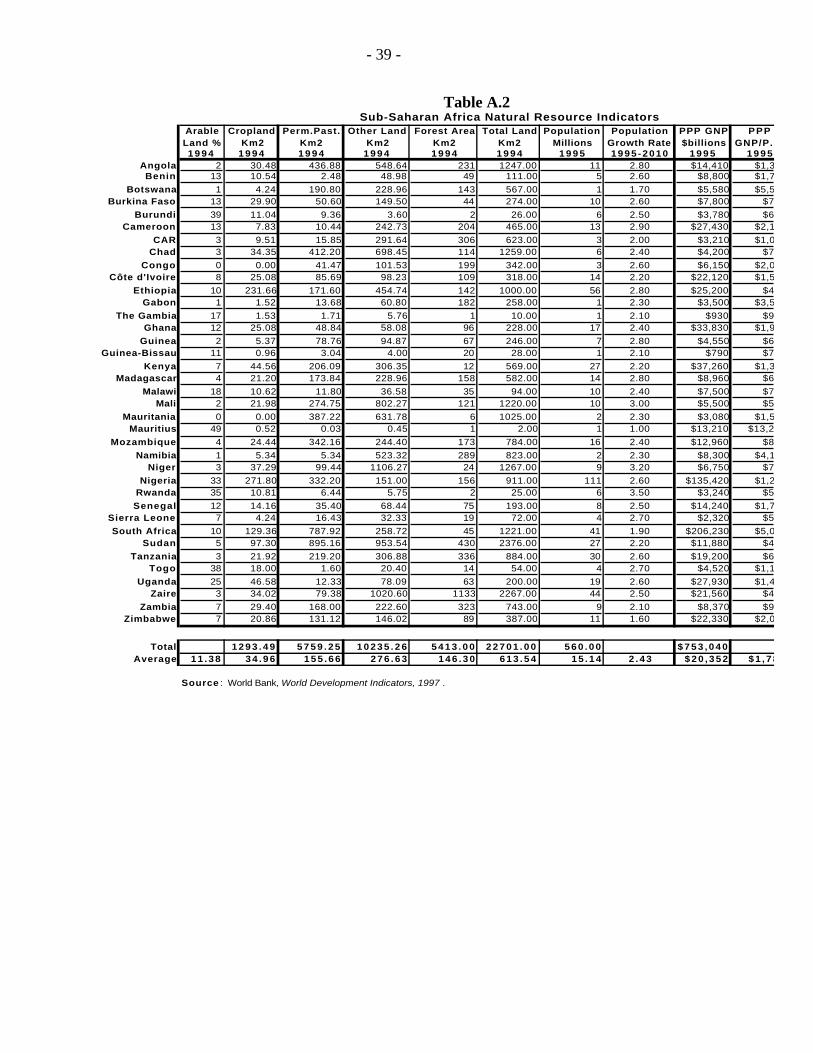
- 39 -
Table A.2Sub-Saharan Africa Natural Resource Indicators
Arable Cropland Perm.Past. Other Land Forest Area Total Land Population Population PPP GNP PPPLand % Km2 Km2 Km2 Km2 Km2 Millions Growth Rate $billions GNP/P.C.1 9 9 4 1 9 9 4 1 9 9 4 1 9 9 4 1 9 9 4 1 9 9 4 1 9 9 5 1995 -2010 1 9 9 5 1 9 9 5
Angola 2 30.48 436.88 548.64 231 1247.00 11 2.80 $14,410 $1,310Benin 13 10.54 2.48 48.98 49 111.00 5 2.60 $8,800 $1,760
Botswana 1 4.24 190.80 228.96 143 567.00 1 1.70 $5,580 $5,580Burkina Faso 13 29.90 50.60 149.50 44 274.00 10 2.60 $7,800 $780
Burundi 39 11.04 9.36 3.60 2 26.00 6 2.50 $3,780 $630Cameroon 13 7.83 10.44 242.73 204 465.00 13 2.90 $27,430 $2,110
CAR 3 9.51 15.85 291.64 306 623.00 3 2.00 $3,210 $1,070Chad 3 34.35 412.20 698.45 114 1259.00 6 2.40 $4,200 $700
Congo 0 0.00 41.47 101.53 199 342.00 3 2.60 $6,150 $2,050Côte d'Ivoire 8 25.08 85.69 98.23 109 318.00 14 2.20 $22,120 $1,580
Ethiopia 10 231.66 171.60 454.74 142 1000.00 56 2.80 $25,200 $450Gabon 1 1.52 13.68 60.80 182 258.00 1 2.30 $3,500 $3,500
The Gambia 17 1.53 1.71 5.76 1 10.00 1 2.10 $930 $930Ghana 12 25.08 48.84 58.08 96 228.00 17 2.40 $33,830 $1,990
Guinea 2 5.37 78.76 94.87 67 246.00 7 2.80 $4,550 $650Guinea-Bissau 11 0.96 3.04 4.00 20 28.00 1 2.10 $790 $790
Kenya 7 44.56 206.09 306.35 12 569.00 27 2.20 $37,260 $1,380Madagascar 4 21.20 173.84 228.96 158 582.00 14 2.80 $8,960 $640
Malawi 18 10.62 11.80 36.58 35 94.00 10 2.40 $7,500 $750Mali 2 21.98 274.75 802.27 121 1220.00 10 3.00 $5,500 $550
Mauritania 0 0.00 387.22 631.78 6 1025.00 2 2.30 $3,080 $1,540Mauritius 49 0.52 0.03 0.45 1 2.00 1 1.00 $13,210 $13,210
Mozambique 4 24.44 342.16 244.40 173 784.00 16 2.40 $12,960 $810
Namibia 1 5.34 5.34 523.32 289 823.00 2 2.30 $8,300 $4,150Niger 3 37.29 99.44 1106.27 24 1267.00 9 3.20 $6,750 $750
Nigeria 33 271.80 332.20 151.00 156 911.00 111 2.60 $135,420 $1,220Rwanda 35 10.81 6.44 5.75 2 25.00 6 3.50 $3,240 $540
Senegal 12 14.16 35.40 68.44 75 193.00 8 2.50 $14,240 $1,780Sierra Leone 7 4.24 16.43 32.33 19 72.00 4 2.70 $2,320 $580
South Africa 10 129.36 787.92 258.72 45 1221.00 41 1.90 $206,230 $5,030Sudan 5 97.30 895.16 953.54 430 2376.00 27 2.20 $11,880 $440
Tanzania 3 21.92 219.20 306.88 336 884.00 30 2.60 $19,200 $640Togo 38 18.00 1.60 20.40 14 54.00 4 2.70 $4,520 $1,130
Uganda 25 46.58 12.33 78.09 63 200.00 19 2.60 $27,930 $1,470Zaire 3 34.02 79.38 1020.60 1133 2267.00 44 2.50 $21,560 $490
Zambia 7 29.40 168.00 222.60 323 743.00 9 2.10 $8,370 $930Zimbabwe 7 20.86 131.12 146.02 89 387.00 11 1.60 $22,330 $2,030
Total 1 2 9 3 . 4 9 5 7 5 9 . 2 5 1 0 2 3 5 . 2 6 5 4 1 3 . 0 0 2 2 7 0 1 . 0 0 5 6 0 . 0 0 $ 7 5 3 , 0 4 0Average 1 1 . 3 8 3 4 . 9 6 1 5 5 . 6 6 2 7 6 . 6 3 1 4 6 . 3 0 6 1 3 . 5 4 1 5 . 1 4 2 .43 $ 2 0 , 3 5 2 $ 1 , 7 8 2
Source : World Bank, World Development Indicators, 1997 .