Embed Size (px)
Citation preview
Economic Contribution of
the Music Industry to
South Australia, 2015/16
A report to
MDO
(Music Development Office)
Prepared by
18 August 2017
EconSearch
A Division of BDO
Level 7, BDO Centre, 420 King William Street
Adelaide SA 5000
Tel: +61 (8) 7324 6190
www.econsearch.com.au

e c o n s e a r c h
MDO Economic Contribution of SA Music
Page| i
AKNOWLEDGEMENTS
EconSearch and the Music Development Office (MDO) received key support from a range of
individuals and organisations. We acknowledge that this report would not have been possible
without their help. This support was integral to the robustness of the estimates as it ensured
that they were well researched and bounded by accurate administrative data at an aggregate
level.
We acknowledge the key survey partners and data providers for the study:
AHA South Australia
APRA AMCOS
City of Adelaide
Music SA
South Aussie with Cosi
Three D Radio
We acknowledge the following interviewees for their input:
5/4 entertainment
Adelaide Festival Centre
Adelaide Fringe
Adelaide Symphony Orchestra
Clarity Records
Dan Crannitch
Disk-Edits Pty Ltd
Elder Conservatorium of Music
Festivals Adelaide
Fresh 92.7
Grace Emily Hotel
Joe Hay Consulting
Little Acorn Music
Live Music Office
Mixmasters
Music SA
Novatech Creative Event Technology
Radio Adelaide
Roundabout Records
South Australian Tourism Commission
Sunset Rehearsals
The Magenta Group
The Porch Sessions
Three D Radio
Tsuba Records
Yewth
Finally, we acknowledge the 1,369 anonymous individuals who provided usable responses to the
electronic survey and Simon Molloy for his role as an independent reviewer of this study.
e c o n s e a r c h
MDO Economic Contribution of SA Music
Page| ii
CONTENTS Aknowledgements ..................................................................................................................... i
Contents ................................................................................................................................... ii
Tables ...................................................................................................................................... iii
Figures ..................................................................................................................................... iv
Abbreviations ........................................................................................................................... v
Document History and Status ................................................................................................... vi
Executive Summary ................................................................................................................. vii
1. Introduction .................................................................................................................... 1
2. Method ........................................................................................................................... 2
2.1 Economic Contribution .......................................................................................... 2
2.1.1 Indicators of Economic Contribution ......................................................... 4
2.1.2 Direct, Flow-on and Total Economic Contribution ..................................... 5
2.1.3 RISE Economic Models .............................................................................. 5
2.2 Survey ................................................................................................................... 5
2.2.1 Interviews ................................................................................................. 5
2.2.2 Electronic Survey ...................................................................................... 6
2.3 Data ...................................................................................................................... 7
2.3.1 Consumers ................................................................................................ 7
2.3.2 Musicians.................................................................................................. 9
2.3.3 Venues.................................................................................................... 10
2.4 Description of the Sample ................................................................................... 10
2.4.1 Consumers .............................................................................................. 11
2.4.2 Musicians................................................................................................ 14
2.4.3 Venues.................................................................................................... 16
2.4.4 Businesses .............................................................................................. 17
2.5 Survey Analysis.................................................................................................... 18
2.5.1 Survey Weighting .................................................................................... 18
2.5.2 Benchmarking ......................................................................................... 20
3. Results .......................................................................................................................... 21
3.1 Overall Music Industry......................................................................................... 21
3.2 Live Music ........................................................................................................... 23
References .............................................................................................................................. 25
Appendix 1 Detailed Economic Contribution Results.................................................. 26
e c o n s e a r c h
MDO Economic Contribution of SA Music
Page| iii
TABLES Table ES-1 Economic contribution of the music industry to South Australia, 2015/16 .......... viii
Table ES-2 Economic contribution of live music to South Australia, 2015/16 ....................... viii
Table 2-1 Expenditure profile for event attendees in South Australia .................................. 13
Table 2-2 Interstate and overseas visitors to music events in South Australia ..................... 14
Table 2-3 Musician activities and average fte jobs of respondents ...................................... 15
Table 2-4 Expenditure profile for musicians in South Australia ............................................ 16
Table 2-5 Expenditure profile for music venues in South Australia ...................................... 16
Table 2-6 Expenditure profile for music businesses (excluding venues) in South Australia .............................................................................................................. 18
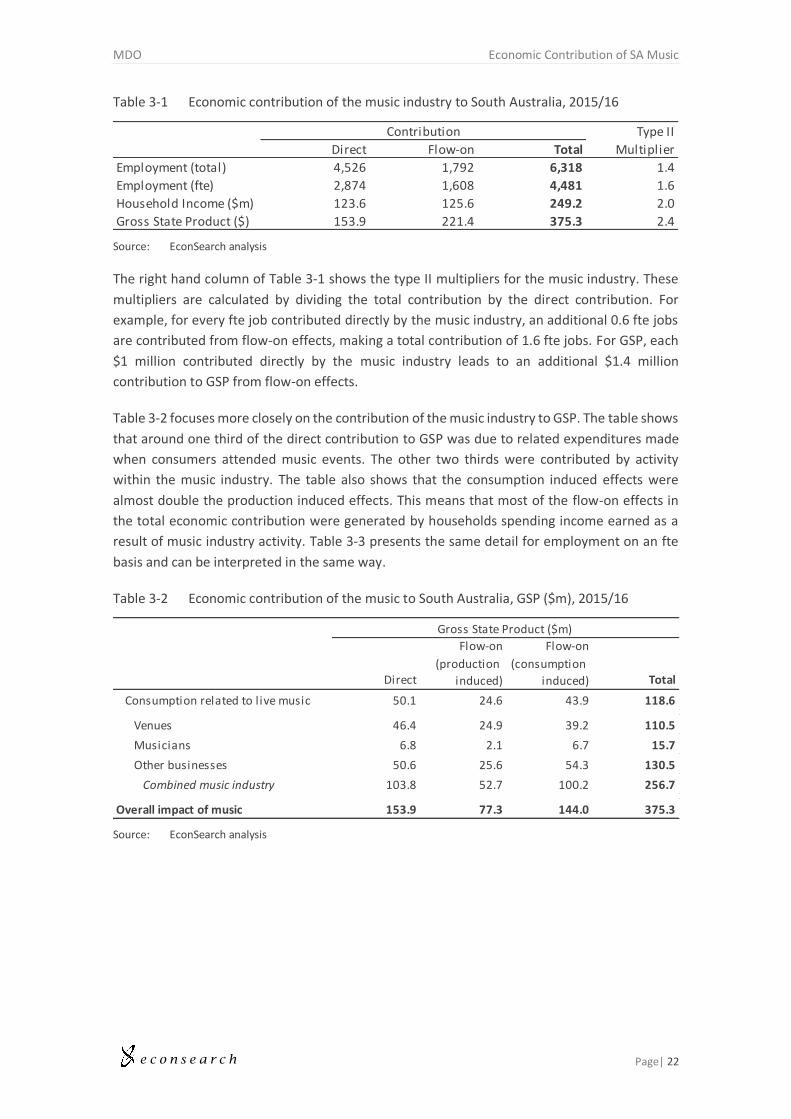
Table 3-1 Economic contribution of the music industry to South Australia, 2015/16 ........... 22
Table 3-2 Economic contribution of the music to South Australia, GSP ($m), 2015/16 ........ 22
Table 3-3 Economic contribution of the music to South Australia, employment (fte), 2015/16 .............................................................................................................. 23
Table 3-4 Economic contribution of live music to South Australia, 2015/16 ........................ 23
Table 3-5 Economic contribution of live music to South Australia, GSP ($m), 2015/16 ........ 24
Table 3-6 Economic contribution of live music to South Australia, employment (fte), 2015/16 .............................................................................................................. 24
e c o n s e a r c h
MDO Economic Contribution of SA Music
Page| iv
FIGURES Figure 2-1 Concept of economic contribution ........................................................................ 3
Figure 2-2 Population for benchmarking purposes, proportion who attend by genre ............. 8
Figure 2-3 Population income distribution ............................................................................. 9
Figure 2-4 Population age distribution ................................................................................... 9
Figure 2-5 Activities of survey respondents .......................................................................... 10
Figure 2-6 Categorisation of survey respondents ................................................................. 11
Figure 2-7 Age distribution of survey respondents and population (consumers) ................... 12
Figure 2-8 Income distribution of survey respondents (consumers) ..................................... 12
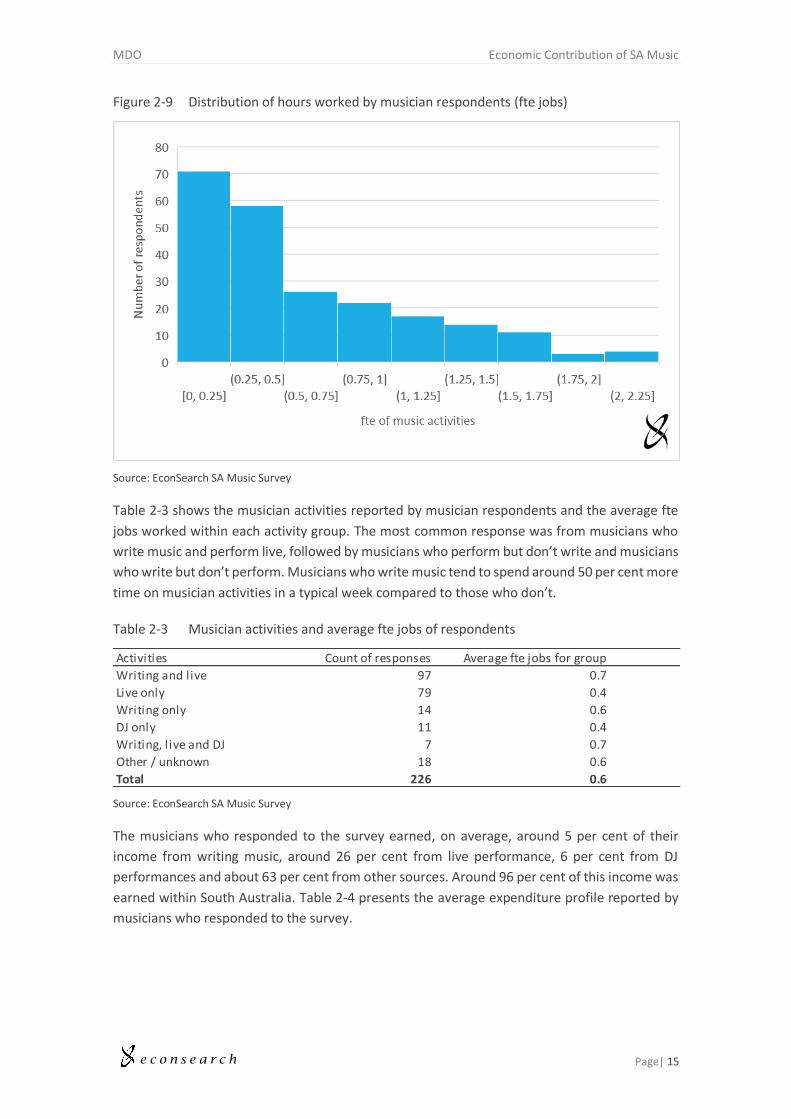
Figure 2-9 Distribution of hours worked by musician respondents (fte jobs) ........................ 15
Figure 2-10 Business activities of sample of businesses .......................................................... 17
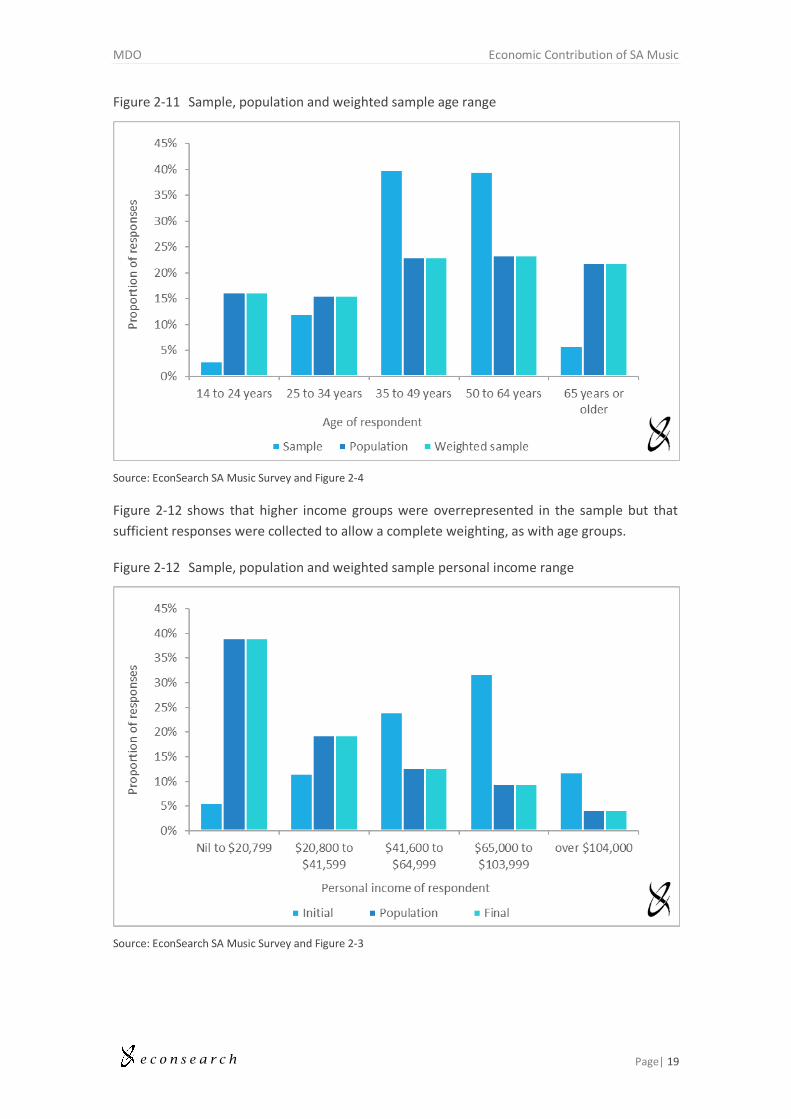
Figure 2-11 Sample, population and weighted sample age range ........................................... 19
Figure 2-12 Sample, population and weighted sample personal income range ....................... 19
Figure 2-13 Sample, population and weighted sample live music activity level ....................... 20

e c o n s e a r c h
MDO Economic Contribution of SA Music
Page| v
ABBREVIATIONS ABS Australian Bureau of Statistics
AMCOS Australasian Mechanical Copyright Owners Society
APRA Australasian Performing Right Association
fte full time equivalent
GSP gross state product
I-O Input-Output
MDO Music Development Office
RISE Regional Industry Structure & Employment
SA South Australia
UNESCO United Nations Educational, Scientific and Cultural Organization
e c o n s e a r c h
MDO Economic Contribution of SA Music
Page| vi
DOCUMENT HISTORY AND STATUS Doc
Version
Doc
Status
Issued To Qty
elec
Qty
hard
Date Reviewed Approved
1 Draft Karen Marsh
Simon Molloy
1 - 25/7/17 JBM JBM
2 Draft Karen Marsh 1 - 17/8/17 JBM JBM
2 Final Karen Marsh 1 - 18/8/17 JBM JBM
Printed: 18/08/2017 1:28:00 PM
Last Saved: 18/08/2017 1:28:00 PM
File Name: I:\EconSearch\1_Projects\Current\1718_Music Industry in SA\Reports\SA
Music Industry_Final_170818.docx
Project Manager: Julian Morison
Principal Author/s: Anders Magnusson
Name of Client: Music Development Office
Name of Project: Economic Contribution of the Music Industry to South Australia
Document Version: 3
Job Number: 1718
e c o n s e a r c h
MDO Economic Contribution of SA Music
Page| vii
EXECUTIVE SUMMARY
Adelaide has music at its cultural core, as recognised by its designation as a UNESCO City of
Music since 2015 (UNESCO 2015). Adelaide’s population was around 1.3 million people in 2016,
making up most of South Australia’s population of almost 1.7 million (Australian Bureau of
Statistics 2016b).
The Music Development Office (MDO) is the office within Department of State Development,
Government of South Australia that is dedicated to supporting creative and industry
development for the music sector in South Australia. The MDO contracted EconSearch, an
economics consultancy with a unique understanding of the South Australian economy, to
establish the economic contribution of the music industry to South Australia in the 2015/16
financial year.
The estimates in this report are intended to form a baseline of the level of activity in the music
industry that can be used to compare it with other industries in South Australia and with the
music industry in the future as it develops. Comparing the music industry with other industries
requires describing it in the same tangible terms. Therefore, this report estimates the economic
contribution of the music industry terms of gross state product (GSP), employment and
household income. The report does not estimate the intangible value of the music industry so
should be interpreted as one component of its total value to South Australians.
The study drew upon several sources of aggregate data to determine the size of the music
industry on several dimensions such as number of venues licenced for music, number of
attendances, ticket revenue, number of working musicians and royalty income of musicians. It
collected data on the activities and relationships within the industry and linkages to the broader
economy through a survey of consumers and businesses (1,369 respondents) and 27 interviews
with key industry stakeholders.
Overall Music Industry Contribution
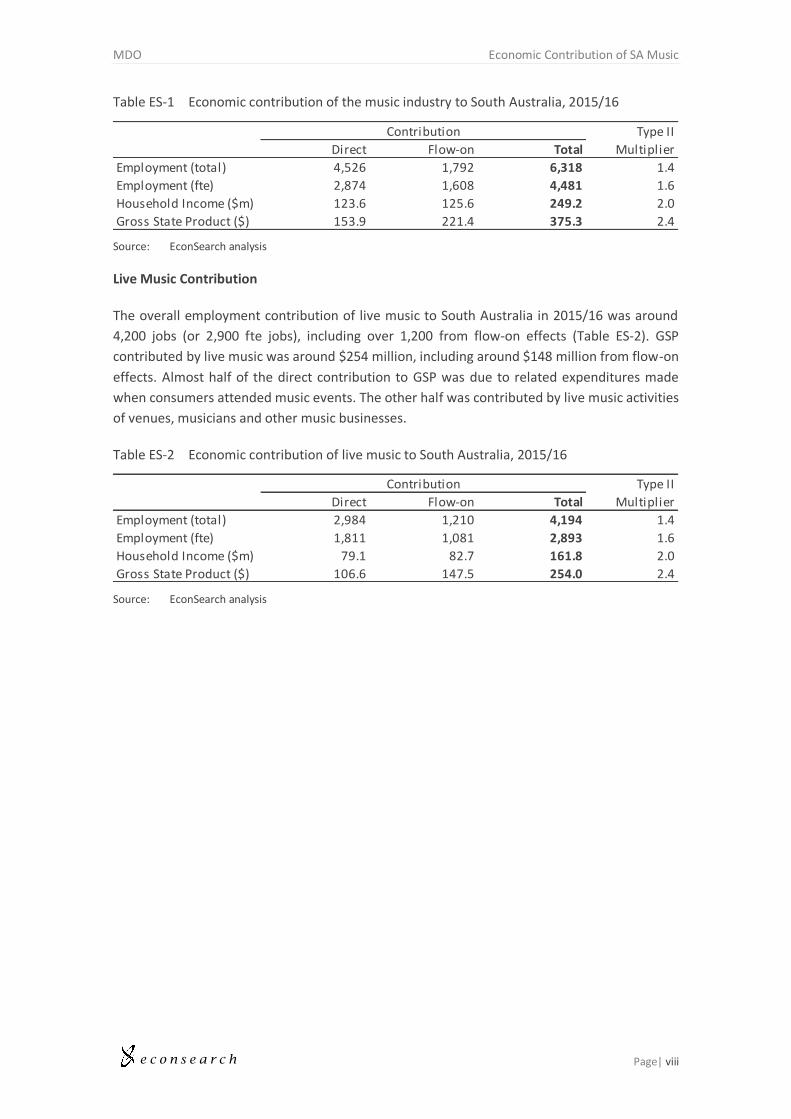
The study found that the overall employment contribution of the music industry (all elements
including live music) to South Australia in 2015/16 was around 6,300 jobs (equivalent to 4,500
full-time jobs), including almost 1,800 from flow-on effects (Table ES-1). Flow-on effects are the
effects of the broad economic activity that begins with the music industry and spreads out across
South Australia as businesses supply one another, pay their employees and sell consumption
goods to households. Gross state product contributed by the music industry was around $375
million, including $221 million from flow-on effects. Around one third of the direct contribution
to GSP was due to related expenditures made when consumers attended music events. The
other two thirds were contributed by the activities of musicians, venues and other music
businesses.
e c o n s e a r c h
MDO Economic Contribution of SA Music
Page| viii
Table ES-1 Economic contribution of the music industry to South Australia, 2015/16
Source: EconSearch analysis
Live Music Contribution
The overall employment contribution of live music to South Australia in 2015/16 was around
4,200 jobs (or 2,900 fte jobs), including over 1,200 from flow-on effects (Table ES-2). GSP
contributed by live music was around $254 million, including around $148 million from flow-on
effects. Almost half of the direct contribution to GSP was due to related expenditures made
when consumers attended music events. The other half was contributed by live music activities
of venues, musicians and other music businesses.
Table ES-2 Economic contribution of live music to South Australia, 2015/16
Source: EconSearch analysis
Type II
Direct Flow-on Total Multiplier
Employment (total) 4,526 1,792 6,318 1.4
Employment (fte) 2,874 1,608 4,481 1.6
Household Income ($m) 123.6 125.6 249.2 2.0
Gross State Product ($) 153.9 221.4 375.3 2.4
Contribution
Type II
Direct Flow-on Total Multiplier
Employment (total) 2,984 1,210 4,194 1.4
Employment (fte) 1,811 1,081 2,893 1.6
Household Income ($m) 79.1 82.7 161.8 2.0
Gross State Product ($) 106.6 147.5 254.0 2.4
Contribution
e c o n s e a r c h
MDO Economic Contribution of SA Music
Page| 1
1. INTRODUCTION
Adelaide has music at its cultural core, as recognised by its designation as a UNESCO City of
Music since 2015 (UNESCO 2015). Adelaide’s population was around 1.3 million people in 2016,
making up most of South Australia’s population of almost 1.7 million (Australian Bureau of
Statistics 2016b).
The Music Development Office (MDO) is the office within Department of State Development,
Government of South Australia that is dedicated to supporting creative and industry
development for the music sector in South Australia. The MDO contracted EconSearch, an
economics consultancy with a unique understanding of the South Australian economy, to
establish the economic contribution of the music industry to South Australia in the 2015/16
financial year.
The estimates in this report are intended to form a baseline of the level of activity in the music
industry that can be used to compare it with other industries in South Australia and with the
music industry in the future as it develops. Comparing the music industry with other industries
requires describing it in the same tangible terms. Therefore, this report estimates the economic
contribution of the music industry terms of gross state product (GSP), employment and
household income. The report does not estimate the intangible value of the music industry so
should be interpreted as one component of its total value to South Australians.
Each stage of the music supply chain is represented in South Australia, from writing, rehearsing,
recording and mastering, through to publishing and performing. These activities are supported
by instrument and equipment manufacturers, educators, retailers, repair and hire shops, artist
services, broadcasters and media agencies and well as those focused on events – promoters,
event technology services and nationally renowned music venues. Each part of the supply chain
has linkages interstate and internationally that work in both directions (imports and exports).
Venues, for example, import the services of musicians from interstate but also export live music
services when visitors from interstate attend shows. Likewise, mastering studios that export by
servicing interstate clients, carry out the creative part of their process in Adelaide then import
by contracting the physical duplication of media interstate.
First, this report outlines the data sources and methods used for analysis. The population of
interest and the sample used in the analysis are described. Then the resulting estimates of the
economic contribution of the music industry to South Australia are presented and interpreted.
e c o n s e a r c h
MDO Economic Contribution of SA Music
Page| 2
2. METHOD
2.1 Economic Contribution
Determining the economic contribution of an industry requires data on the aggregate size of the
industry, the activities and relationships within the industry, the linkages between the industry
and the broader economy, and the characteristics of the broader economy itself. This study drew
upon several sources of aggregate data to determine the size of the music industry on several
dimensions. It collected data on the activities and relationships within the industry and linkages
to the broader economy through a survey of consumers and businesses and interviews with key
stakeholders.
The main components of net direct economic contribution to South Australia are surpluses
made by music industry businesses in South Australia, wages and drawings1 paid to South
Australians, and surplus and wages associated with expenditures made by those businesses into
other domestic (South Australian) industries. Regarding live music, related expenditures by
event attendees (such as food and beverages, taxis and accommodation) also lead to economic
contributions that can be attributed to the event, and therefore, the music industry. Where
multiple linked activities take place within an industry, transactions between the businesses that
carry them out are simply transfers within the industry, not net economic contributions.
Payments outside of South Australia (imports) are also not economic contributions to South
Australia. This is why an understanding of these linkages is necessary to make a reasonable
estimate of the economic contribution of the industry.
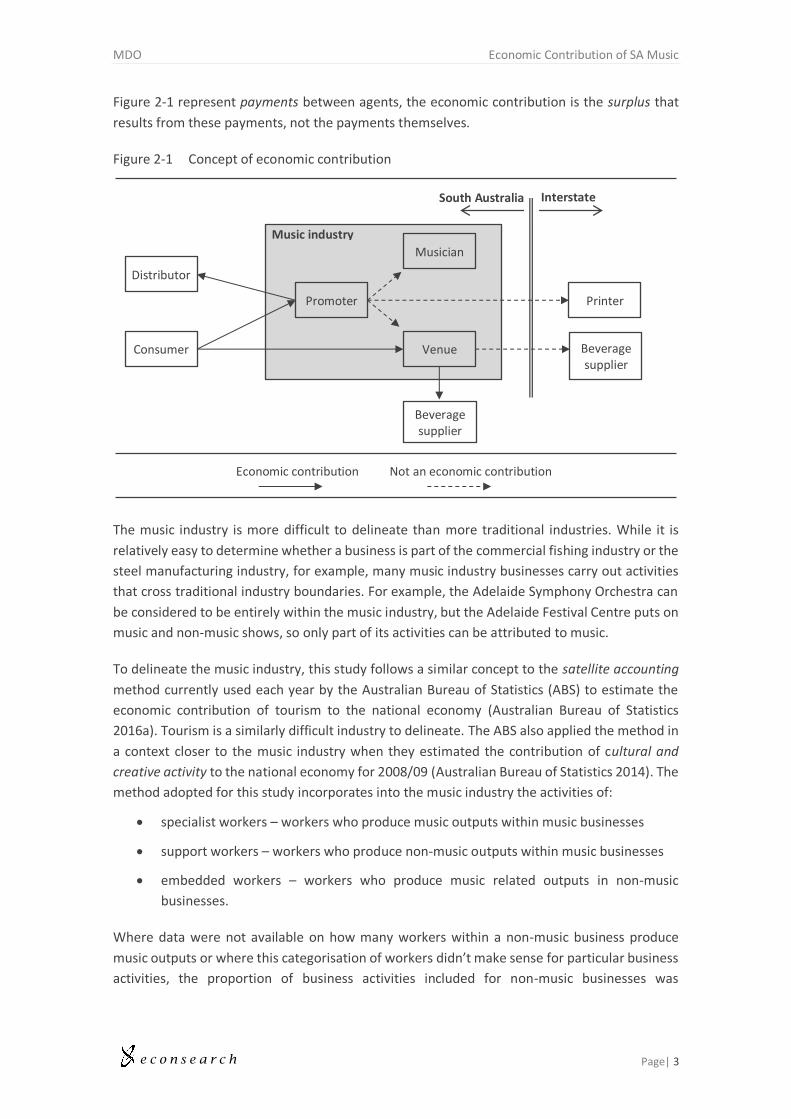
For example, when a live music promoter pays a musician for performing at their event, the
payment is simply a transfer within the industry of money that entered the industry when
attendees of the event bought their tickets. Counting both the ticket sale and the payment to
the musician (as well as the fees paid to the event technology services provider, the audio
engineer and the hire fee to the venue) would double-count the economic contribution so these
are cancelled out in this analysis and counted only once. The same promoter may have printed
promotional materials interstate and distributed them through an agency in South Australia.
The expenditure on printing does not lead to an economic contribution to South Australia as it
is an import, the fee charged by the local distribution agent however, does lead to an economic
contribution because it occurs domestically and is outside of the music industry (so it is not just
a transfer). Likewise, domestic expenditures by the venue (such as with beverages suppliers)
lead to economic contributions, while those occurring outside of South Australia do not. Finally,
when attendees at the venue spend money on beverages or other items, this also leads to an
economic contribution. This example is illustrated in the Figure 2-1. Importantly, the arrows in
1 Drawings are income drawn by business owners from their business’ operating surplus.
e c o n s e a r c h
MDO Economic Contribution of SA Music
Page| 3
Figure 2-1 represent payments between agents, the economic contribution is the surplus that
results from these payments, not the payments themselves.
Figure 2-1 Concept of economic contribution
The music industry is more difficult to delineate than more traditional industries. While it is
relatively easy to determine whether a business is part of the commercial fishing industry or the
steel manufacturing industry, for example, many music industry businesses carry out activities
that cross traditional industry boundaries. For example, the Adelaide Symphony Orchestra can
be considered to be entirely within the music industry, but the Adelaide Festival Centre puts on
music and non-music shows, so only part of its activities can be attributed to music.
To delineate the music industry, this study follows a similar concept to the satellite accounting
method currently used each year by the Australian Bureau of Statistics (ABS) to estimate the
economic contribution of tourism to the national economy (Australian Bureau of Statistics
2016a). Tourism is a similarly difficult industry to delineate. The ABS also applied the method in
a context closer to the music industry when they estimated the contribution of cultural and
creative activity to the national economy for 2008/09 (Australian Bureau of Statistics 2014). The
method adopted for this study incorporates into the music industry the activities of:
specialist workers – workers who produce music outputs within music businesses
support workers – workers who produce non-music outputs within music businesses
embedded workers – workers who produce music related outputs in non-music
businesses.
Where data were not available on how many workers within a non-music business produce
music outputs or where this categorisation of workers didn’t make sense for particular business
activities, the proportion of business activities included for non-music businesses was
Promoter
Consumer Venue
Printer
Musician
Interstate South Australia
Music industry
Economic contribution Not an economic contribution
Beverage supplier
Beverage supplier
Distributor
e c o n s e a r c h
MDO Economic Contribution of SA Music
Page| 4
determined by a proxy. The proxy was selected on a case-by-case basis but was usually
attendance numbers, expenditures or revenue.
2.1.1 Indicators of Economic Contribution
The economic contribution of the music industry is conceptualised in this report as the economic
activity that occurs within the music industry as it exists and the activity that occurs outside of
the music industry as a result of this activity. This is conceptually different to economic impact
in that impact refers to a change or shock so the marginal effect of the change is important. For
example, estimating the economic impact of starting up or closing down a music festival would
have to take into consideration the way that consumers will react and how affected prices and
resource allocations within the economy might change because of the marginal change in
activity in the industry. The focus of this report is the contribution of the music industry to the
economy of South Australia as it exists so marginal effects aren’t relevant. The key economic
activity indicators considered in the analysis are employment, gross state product (GSP) and
household income (a component of GSP).
Employment units: Employment numbers are usually reported in either full time equivalent (fte)
units or total job units. Both are presented in this report. They are defined as follows:
fte: is a way to measure a worker's involvement in a project or industry activity. An fte
of 1.0 means that the person is equivalent to a full-time worker, while an fte of 0.5
signals that the worker is only half-time. Typically, different scales are used to calibrate
this number, depending on the type of industry and scope of the analysis but the basic
calculation is the total hours worked divided by average annual hours worked in full-
time jobs. This report considers 48 weeks at 38 hours per week to be 1.0 fte job.
Jobs: is used to refer to the number of workers employed in an industry or on a project
at any point in time. The report uses the average number of workers over the analytical
period of the 2015/16 financial year.
Gross state product (GSP): is a measure of the contribution of an activity to the economy. GSP is
measured as value of gross output (business revenue) less the cost of goods and services
(including imports) used in producing the output. In other words, it can be measured as the sum
of household income, gross operating surplus and gross mixed income net of payments to owner
managers and taxes less subsidies on products and production. It represents payments to the
primary inputs of production (labour, capital and land). Using GSP as a measure of economic
contribution avoids the problem of double counting that may arise from using value of output
for this purpose.
Household income: is a component of GSP, it is the payments to the labour input of production
described above. Household income is reported separately to GSP in this report in order to
indicate the contribution of the industry to South Australians who derive income from labour
(employees), rather than through ownership of land and capital.

e c o n s e a r c h
MDO Economic Contribution of SA Music
Page| 5
2.1.2 Direct, Flow-on and Total Economic Contribution
A useful way to think about economic activity and economic contribution (as measured by
employment, GSP and income) is using the concept of a ‘supply chain’. Broadly speaking there
are four categories of contribution along the supply chain. To take employment as an example:
1. Direct employment – this is employment in those firms, businesses and organisations
that are directly engaged in producing music goods and services.
2. First round employment – refers to employment in firms that supply inputs and services
to the ‘direct employment’ businesses, i.e. those categorised under point 1.
3. Industrial-support employment – is the term applied to 'second and subsequent round'
effects as successive waves of output increases occur in the economy to provide
industrial support, as a response to the original expenditure. This category excludes any
employment associated with increased household consumption.
4. Consumption-induced employment – is the term applied to those effects induced by
increased household income associated with the original expenditure. The expenditure
of household income associated with all three categories of employment (direct, first
round and industrial-support) will generate economic activity that will, in itself, generate
jobs.
Flow-on (or indirect) economic contribution is the sum of categories 2, 3 and 4. Total contribution
is the sum of direct and flow-on contribution. In this analysis direct, flow-on and total
employment, GSP and household income generated by the supply chain have been reported. A
more detailed breakdown of results is presented in Appendix 1 with flow-on effects broken
down into production (2 and 3) and consumption (4) induced.
2.1.3 RISE Economic Models
Input-output (I-O) models are widely used to assess the economic contribution of existing levels
of economic activity and economic impact of shocks. The economic contribution analysis
presented here uses an extension of the conventional input-output method. Over the past
decade EconSearch has developed an extended input-output model known as the RISE model
(Regional Industry Structure & Employment). The RISE model provides a comprehensive
economic framework that is extremely useful for interpreting the linkages between industries.
The RISE models are frequently used by the Government of South Australia. A RISE model for
the economy of South Australia was used for this assessment.
2.2 Survey
2.2.1 Interviews
Twenty-seven semi-structured interviews were carried out by EconSearch with key industry
stakeholders between June and July of 2017. Stakeholders were selected based on their active
role in the music industry and their knowledge of their section of it. Most interviews were
conducted face-to-face and took between 15 minutes and 2 hours, depending on the variety of

e c o n s e a r c h
MDO Economic Contribution of SA Music
Page| 6
activities that the stakeholder was involved in. A full list of interviewees appears in the
Acknowledgements section of this report. Roles covered by interviews included:
Rehearsal studio Music focused media Education (informal)
Recording studio Artist services Venue operation
Mastering studio Event promotion Musician
Media duplication Major festival promotion Industry association
Music retailer Instrument manufacture Policy maker
Event technology services Equipment manufacture
Music focused radio Education (formal)
The intention of the study, concept of economic contribution, and reason for selection were
explained to each stakeholder at the beginning of the interview. They were informed that their
individual responses would not be published in any way that could be personally identifiable,
but all agreed to be acknowledged by name in the report. Regarding their role, each stakeholder
was then led to explain their:
business activities
employment activities
income and expenditures for the 2015/16 financial year
other areas of economic contribution
interstate and overseas expenditure and income
degree to which their business activities are attributable to music
understanding of other businesses operating in their section of the industry.
2.2.2 Electronic Survey
An electronic survey was carried out over 5 weeks in June and July of 2017. The intention of the
survey was to collect more detailed data on businesses in the music industry as well as to
understand the related expenditures that consumers tend to make when they attend live music
events.
Early interviews suggested that a single survey instrument would be required to capture the
various business activities together with consumer data as each individual respondent would
likely cover multiple roles in the industry while also being a consumer. The questionnaire first
asked each respondent which roles they played in the music industry, including business and
consumption activities, then presented the respondents with questions related to their selected
roles.
Questions relating to business activities captured the same information as the interviews but
were customised to the type of activities that the respondents carried out. For example, venue
operators were asked about the number and type and attendance of music events at their venue
and musicians were asked about their time spent and income earned from performing and
writing music. These additional data aided imputation of incomplete data during analysis.
e c o n s e a r c h
MDO Economic Contribution of SA Music
Page| 7
Questions relating to consumption activities captured data on live music attendance and
consumption of recorded music, music equipment and instruments for consumptive uses (as
opposed to business use as a musician). Age of respondent and personal income was also
captured.
Regarding live music consumption, the questionnaire captured the number of music events each
respondent attended in the last year, by genre, and by whether or not each event was free.
Respondents were asked to indicate where the events were and the proportion that were by
South Australian performers. To understand the kind of expenditures each respondent tends to
make when they attend a music event, respondents were asked about a memorable event (such
as a concert or a typical night at a music venue) that they attended in the last year. They were
asked about the name, genre and location of the event, as well as whether they attended with
interstate friends or relatives. They were asked how much money they spent on the ticket (if
any) and on other items in relation to the event. Finally, they were asked to indicate whether or
not they would have attended if the cost had been 10 per cent, 50 per cent or double what it
was.
Regarding recorded music, music equipment and musical instrument consumption, respondents
were asked how much money they spend on each in a typical year (or month for recorded music)
as well as how much of that expenditure occurred within South Australia.
2.3 Data
2.3.1 Consumers
Data used to estimate the aggregate activity of music consumers in South Australia included:
total population of South Australia – 1.7 million (Australian Bureau of Statistics 2016b)
age distribution of South Australian population (Australian Bureau of Statistics 2016b)
income distribution of South Australian population (Australian Bureau of Statistics
2016b)
proportion of South Australians (15 years and over – as reported) who attended live
contemporary music (35 per cent) and classical, musical theatre or opera events (18 per
cent) in 2013/14 (Australian Bureau of Statistics 2015)
ticket sales and revenue for contemporary music (398,307 tickets, $33.8 million) and
classical, musical theatre and opera (155,147 tickets, $14.1 million) in 2015 (Live
Performance Australia 2016)
EconSearch SA Music Survey data were used to estimate number of free event
attendances per paid attendance for contemporary music (0.8 per paid attendance) and
classical, musical theatre or opera (0.3 per paid attendance)
Fringe 2017 number of visitors to South Australia – 18,655 (Adelaide Fringe 2017) was
used to impute proportion of attendance to music events by visitors (around 3 per cent).

e c o n s e a r c h
MDO Economic Contribution of SA Music
Page| 8
Figure 2-2 illustrates the population used in this analysis. The population is all South Australians
14 years and over2, plus visitors from interstate or overseas who attend live music in South
Australia (a total around 1.42 million people). Assuming that the proportion who attended music
events in 2013/14 is the same as in 2015/16: around 58 per cent of this population did not attend
any music events in 2015/16; around 26 per cent attended contemporary music events only;
around 6 per cent attended classical, musical theatre or opera events only; and around 9 per
cent attended both types of event.
Figure 2-2 Population for benchmarking purposes, proportion who attend by genre
Source: Australian Bureau of Statistics (2016b), Live Performance Australia (2016) and Australian Bureau of Statistics (2014)
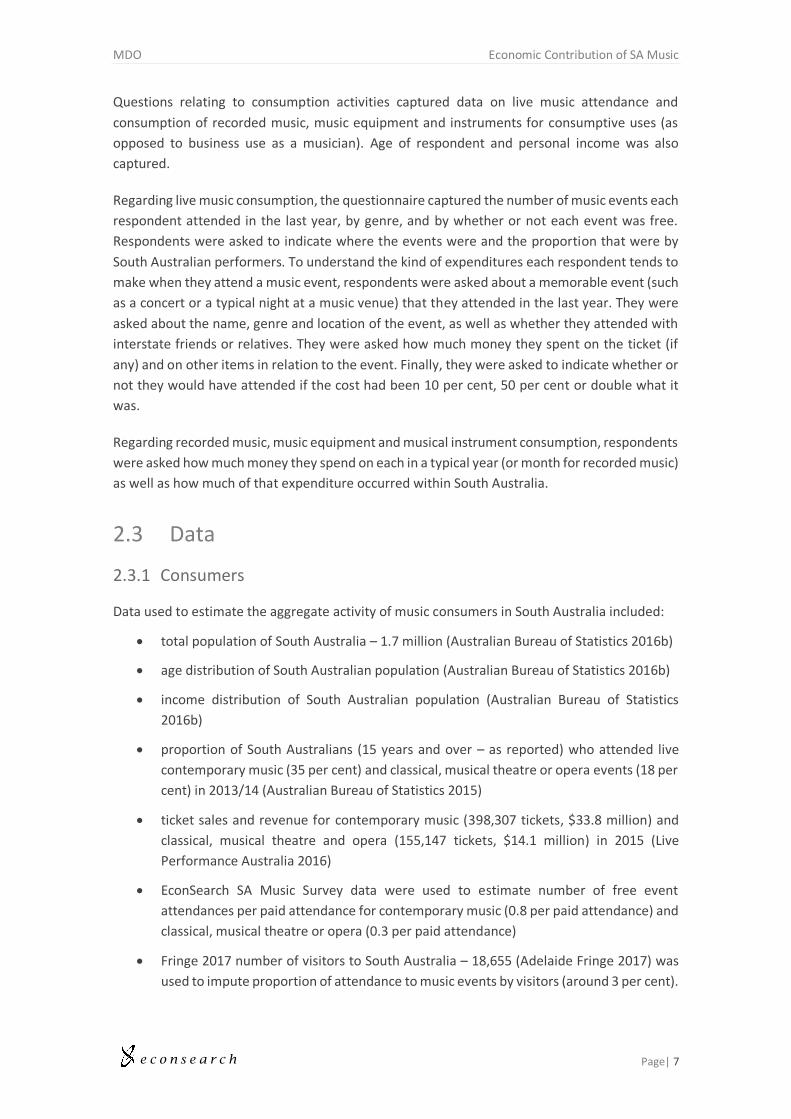
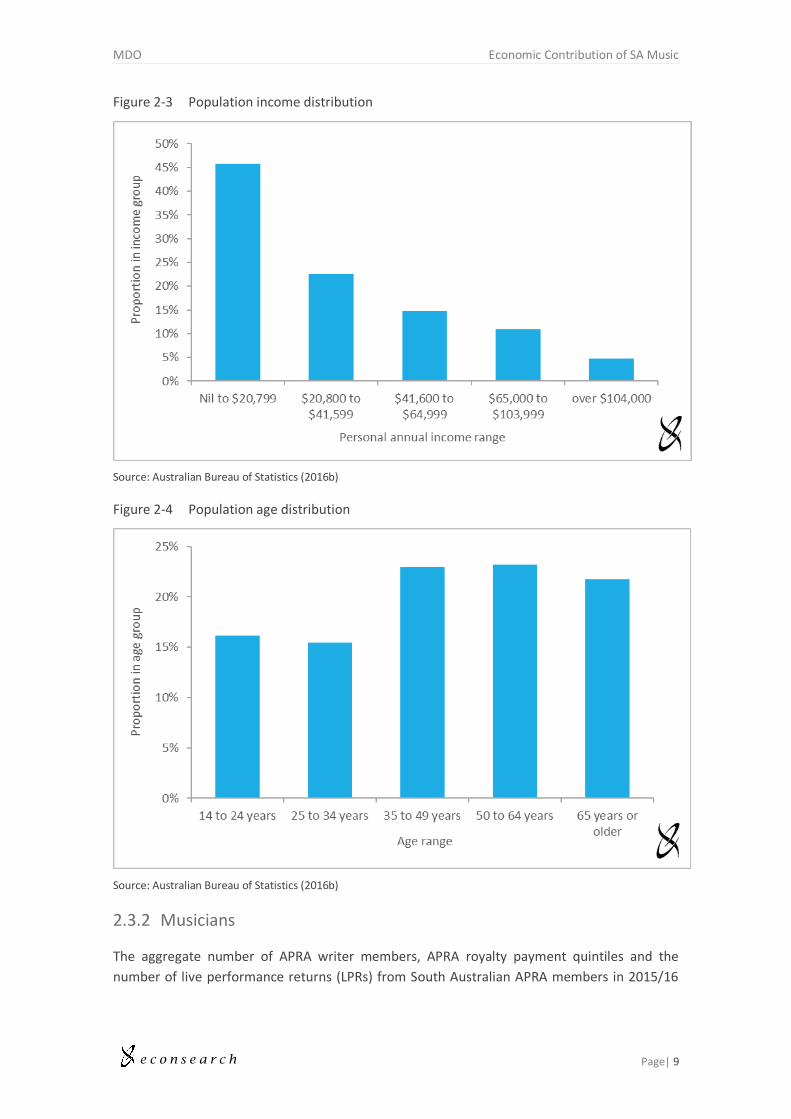
The income (Figure 2-3) and age (Figure 2-4) distributions of the population are presented
below. These distributions were used to weight the consumption survey responses.
2 The survey sample was limited to people over 14 years of age for ethical reasons. We allowed responses from people under 18 years of age (but no less than 14) as the data were not political or private in nature.
e c o n s e a r c h
MDO Economic Contribution of SA Music
Page| 9
Figure 2-3 Population income distribution
Source: Australian Bureau of Statistics (2016b)
Figure 2-4 Population age distribution
Source: Australian Bureau of Statistics (2016b)
2.3.2 Musicians
The aggregate number of APRA writer members, APRA royalty payment quintiles and the
number of live performance returns (LPRs) from South Australian APRA members in 2015/16
e c o n s e a r c h
MDO Economic Contribution of SA Music
Page| 10
were provided under confidentiality by APRA (2017). These data were used as benchmarks to
weight the musician responses to the electronic survey.
2.3.3 Venues
A list of South Australian venues licenced by APRA to perform live music or recorded music for
dance use was provided under confidentiality by APRA (2017). The list included a range for
annual expenditure on live music for most venues and a range for gross revenue from
attendances for some venues. This list was treated as a census of venues in South Australia and
was matched with the EconSearch SA Music Survey responses to estimate aggregate activity.
A list of relevant businesses in the City of Adelaide area was provided under confidentiality by
the City of Adelaide and included the number of full-time and part-time employees at each
business. These data were used to estimate the activity of City of Adelaide music venues that
did not respond to the electronic survey.
2.4 Description of the Sample
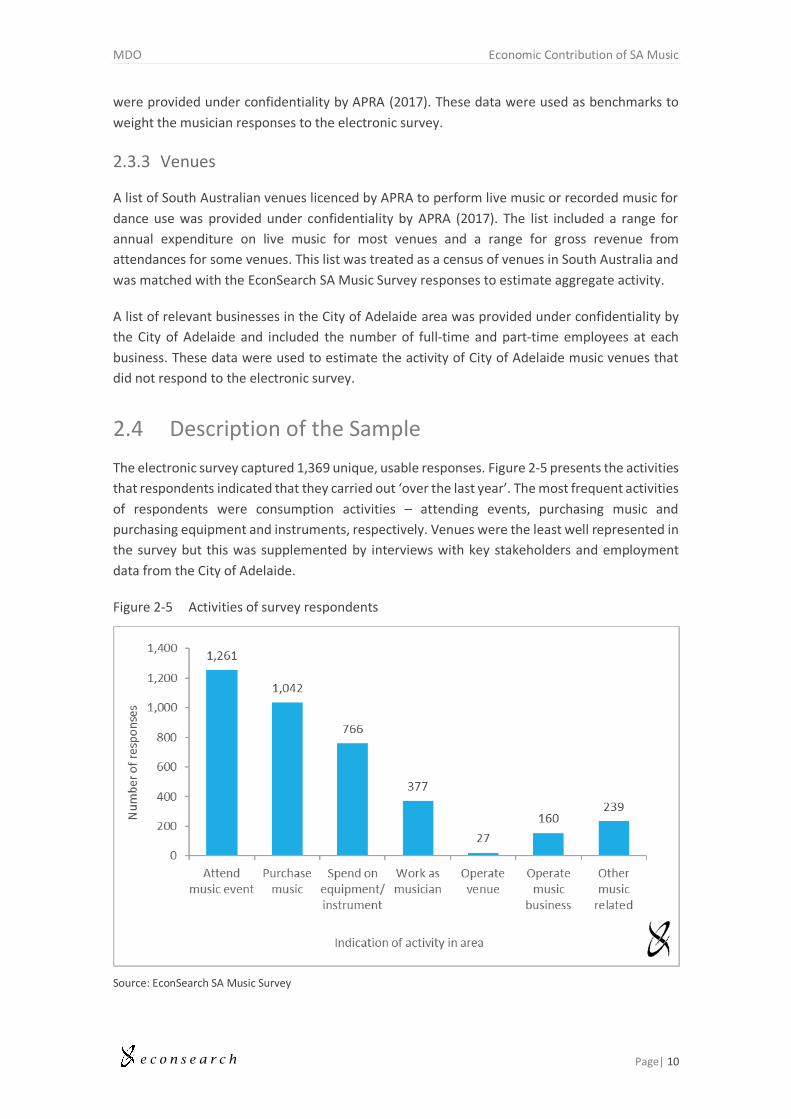
The electronic survey captured 1,369 unique, usable responses. Figure 2-5 presents the activities
that respondents indicated that they carried out ‘over the last year’. The most frequent activities
of respondents were consumption activities – attending events, purchasing music and
purchasing equipment and instruments, respectively. Venues were the least well represented in
the survey but this was supplemented by interviews with key stakeholders and employment
data from the City of Adelaide.
Figure 2-5 Activities of survey respondents
Source: EconSearch SA Music Survey
e c o n s e a r c h
MDO Economic Contribution of SA Music
Page| 11
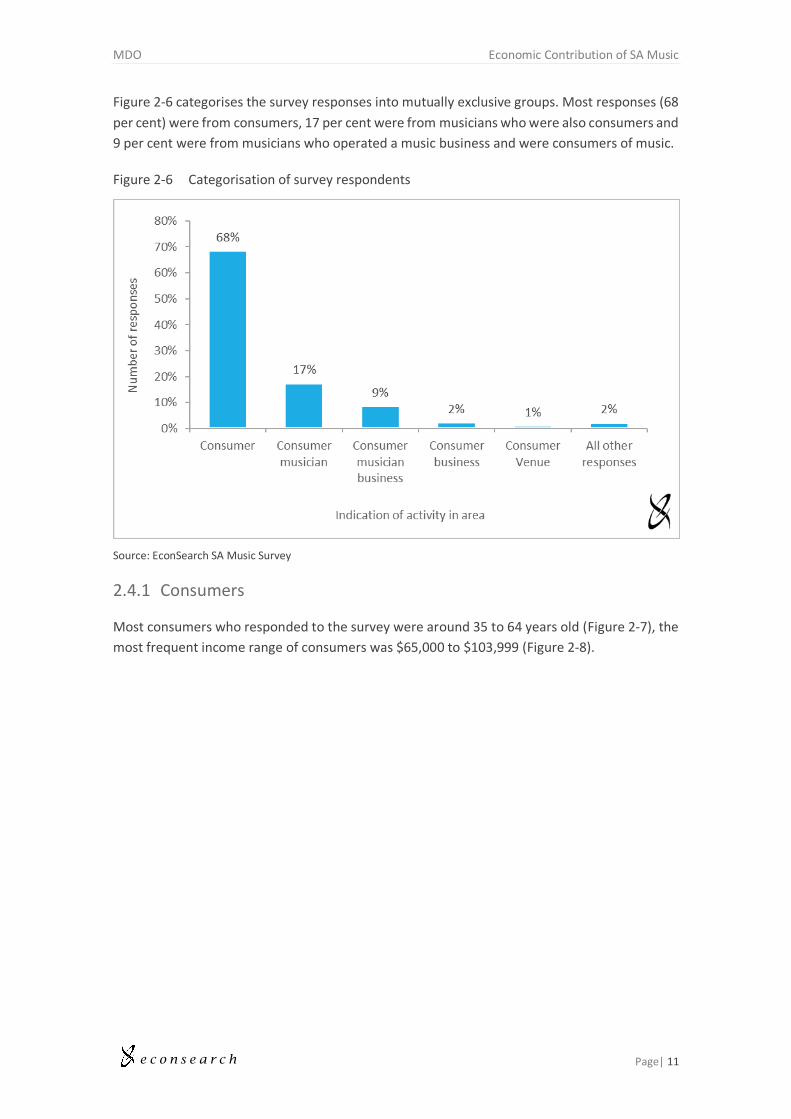
Figure 2-6 categorises the survey responses into mutually exclusive groups. Most responses (68
per cent) were from consumers, 17 per cent were from musicians who were also consumers and
9 per cent were from musicians who operated a music business and were consumers of music.
Figure 2-6 Categorisation of survey respondents
Source: EconSearch SA Music Survey
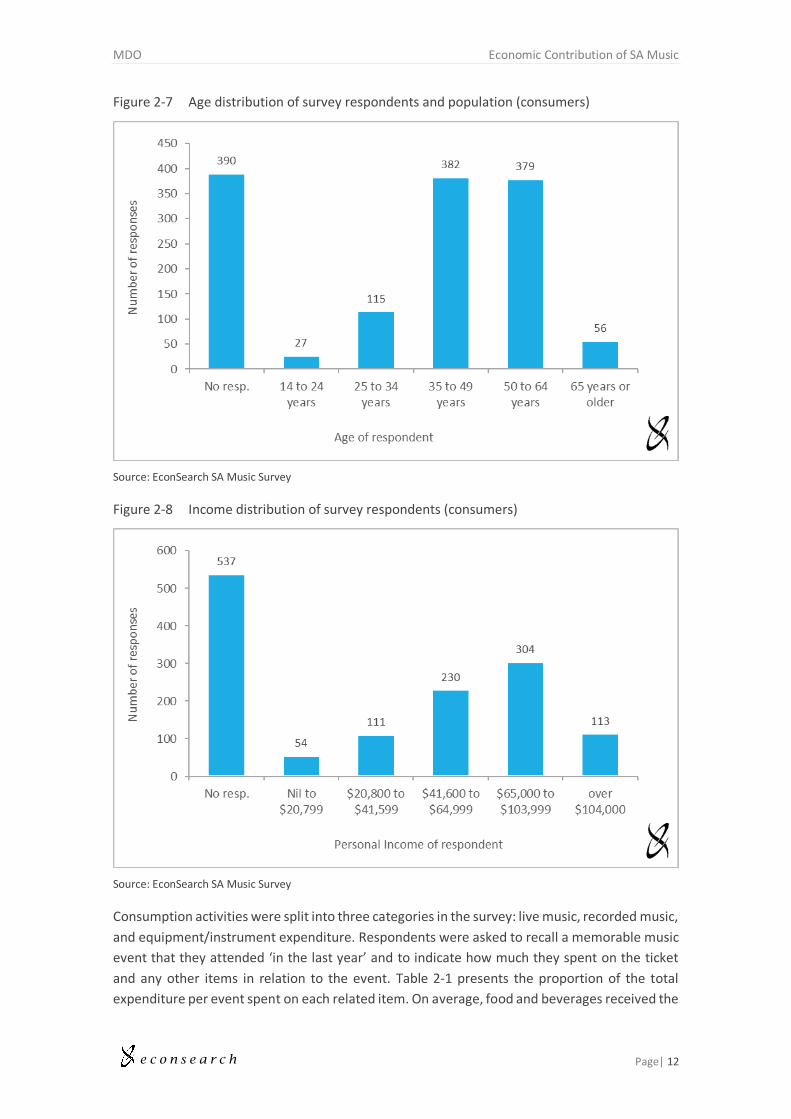
2.4.1 Consumers
Most consumers who responded to the survey were around 35 to 64 years old (Figure 2-7), the
most frequent income range of consumers was $65,000 to $103,999 (Figure 2-8).
e c o n s e a r c h
MDO Economic Contribution of SA Music
Page| 12
Figure 2-7 Age distribution of survey respondents and population (consumers)
Source: EconSearch SA Music Survey
Figure 2-8 Income distribution of survey respondents (consumers)
Source: EconSearch SA Music Survey
Consumption activities were split into three categories in the survey: live music, recorded music,
and equipment/instrument expenditure. Respondents were asked to recall a memorable music
event that they attended ‘in the last year’ and to indicate how much they spent on the ticket
and any other items in relation to the event. Table 2-1 presents the proportion of the total
expenditure per event spent on each related item. On average, food and beverages received the
e c o n s e a r c h
MDO Economic Contribution of SA Music
Page| 13
highest spend (34 per cent), followed by tickets (25 per cent) and clothes (11 per cent). For
ticketed events, tickets were the most expensive item (36 per cent). For free events, expenditure
on food and beverages made up nearly half (45 per cent) of consumption expenditure related
to events.
Table 2-1 Expenditure profile for event attendees in South Australia
Source: EconSearch SA Music Survey
Survey respondents reported total expenditure on music equipment over the last year of just
over $250,000 (almost $190 each) with around 80 per cent of these expenditures occurring at
South Australian businesses. After weighting the responses, the total expenditure on equipment
was estimated at almost $16 million across the state (an average of around $15 per person).
Respondents reported consumption expenditure on instruments over the last year of almost
$420,000 (an average of $310 per person) with 80 per cent of these expenditures also occurring
at South Australian businesses. After weighting, we estimate a total consumption expenditure
on music instruments of almost $47 million across the state (an average of around $33 per
person).
Respondents reported a total annual spend on recorded music over the last year of around
$355,000 (just over $260 per person), including 35 per cent on CDs, 24 per cent on vinyl, 20 per
cent on downloads, 17 per cent on streaming and 5 per cent on ‘other’. After weighting, we
estimate a total expenditure on recorded music of around $35 million (an average of around $25
per person) with around 38 per cent of these occurring at South Australian businesses.
Regarding their ‘memorable event’, consumers were asked whether they would have attended
if it had cost them 10 per cent, 50 per cent or 100 per cent (double) more. This gives an indication
of the contribution to consumer surplus of attending the event for each respondent. Consumer
surplus is the difference between the price paid by a consumer and their willingness to pay,
summed across all consumers who purchased the item. This is a key input into cost-benefit
analysis. On average respondents indicated that they wouldn’t have attended their memorable
event if it had cost them more than 30 per cent more than it did. Broadly speaking, this suggests
that the consumer surplus from the various consumption activities occurring due to music
events in South Australia is around 30 per cent of its total cost. Detailed analysis of consumer
surplus is outside the scope of this report.
Item All events
Ticketed or events
with paid entry Free events
Food & Beverage 34.0% 28.9% 45.4%
Ticket 25.1% 36.3% 0.0%
Clothes 11.3% 9.6% 15.1%
Transport 9.4% 8.0% 12.5%
Merchandise 9.0% 7.6% 12.0%
Accommodation 8.4% 7.1% 11.2%
Childcare 1.6% 1.4% 2.2%
Other 1.2% 1.1% 1.7%
Total 100.0% 100.0% 100.0%
Proportion of total expenditure on event

e c o n s e a r c h
MDO Economic Contribution of SA Music
Page| 14
Of particular interest to several key stakeholders were visitors from interstate or overseas who
attend music events in South Australia. The questionnaire asked respondents to indicate how
many friends or family from outside of South Australia attended the event with them. This
question resolves the problem that analysis of ticket sales data fails to capture the visitors for
which South Australians purchased tickets. Table 2-2 shows the proportion of respondents who
were accompanied to their ‘memorable event’ by friends or relatives from interstate or overseas
and the average number accompanying all respondents, by venue type and by genre mix. The
results suggest that outdoor mixed-genre and contemporary events tend to attract a higher
proportion of attendees from interstate or overseas. On average, 43 per cent of respondents
indicated that they were accompanied by friends or relatives from interstate or overseas and
the average number of them accompanying respondents was 1.7.
Table 2-2 Interstate and overseas visitors to music events in South Australia
Source: EconSearch SA Music Survey
Respondents indicated the number of free and paid events they attended over the last year.
Around 56 per cent of reported attendances at contemporary live music events were ticketed
and 75 per cent for classical/musical theatre/opera events.
2.4.2 Musicians
Figure 2-9 shows the distribution of time spent by respondents on musician activities expressed
in full-time equivalent jobs. Around 78 per cent of musician respondents reported working on
musician activities part-time, the rest working full-time or longer hours.
Count of
responses
Proportion
accompanied
(%)
Average
accompanying
(persons)
Venue type
Outdoor street party / vineyard / temporary venue 91 42% 2.7
Other 55 56% 2.3
Major outdoor festival 192 46% 2.0
Hotel / pub / nightclub 213 42% 1.6
Concert hall / theatre 204 45% 1.3
Stadium 89 33% 1.1
House of worship 17 35% 0.8
Genre
Contemporary + DJ 36 47% 2.5
Contemporary + Classical/Musical Theatre/Opera + DJ 8 63% 2.3
Contemporary 554 41% 1.8
Contemporary + Classical/Musical Theatre/Opera 43 47% 1.5
Classical/Musical Theatre/Opera 116 47% 1.1
DJ 19 37% 1.0
Average for all events 43% 1.7
e c o n s e a r c h
MDO Economic Contribution of SA Music
Page| 15
Figure 2-9 Distribution of hours worked by musician respondents (fte jobs)
Source: EconSearch SA Music Survey
Table 2-3 shows the musician activities reported by musician respondents and the average fte
jobs worked within each activity group. The most common response was from musicians who
write music and perform live, followed by musicians who perform but don’t write and musicians
who write but don’t perform. Musicians who write music tend to spend around 50 per cent more
time on musician activities in a typical week compared to those who don’t.
Table 2-3 Musician activities and average fte jobs of respondents
Source: EconSearch SA Music Survey
The musicians who responded to the survey earned, on average, around 5 per cent of their
income from writing music, around 26 per cent from live performance, 6 per cent from DJ
performances and about 63 per cent from other sources. Around 96 per cent of this income was
earned within South Australia. Table 2-4 presents the average expenditure profile reported by
musicians who responded to the survey.
Activities Count of responses Average fte jobs for group
Writing and live 97 0.7
Live only 79 0.4
Writing only 14 0.6
DJ only 11 0.4
Writing, l ive and DJ 7 0.7
Other / unknown 18 0.6
Total 226 0.6
e c o n s e a r c h
MDO Economic Contribution of SA Music
Page| 16
Table 2-4 Expenditure profile for musicians in South Australia
Source: EconSearch SA Music Survey
a Imports are all goods and services purchased outside of South Australia
b Capital expenditure includes equipment, hardware, vehicles and buildings used to carry out business activities
c Cost of goods sold includes merchandise, CDs and other stock sold
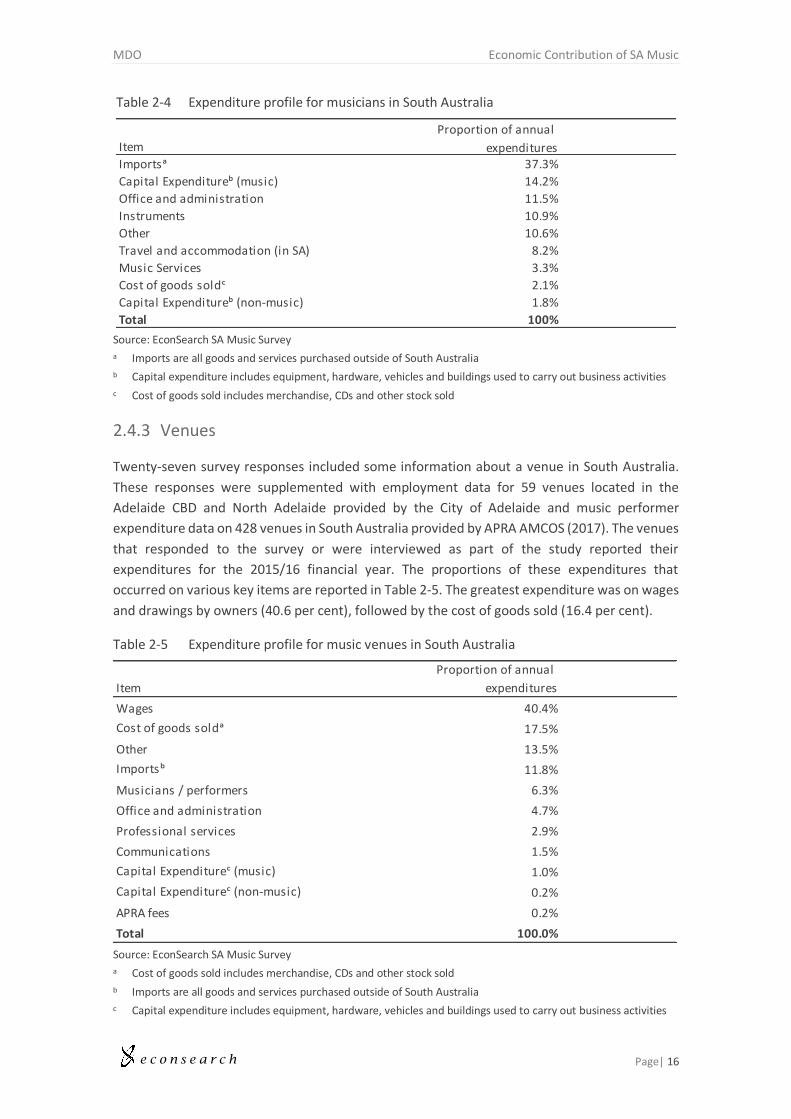
2.4.3 Venues
Twenty-seven survey responses included some information about a venue in South Australia.
These responses were supplemented with employment data for 59 venues located in the
Adelaide CBD and North Adelaide provided by the City of Adelaide and music performer
expenditure data on 428 venues in South Australia provided by APRA AMCOS (2017). The venues
that responded to the survey or were interviewed as part of the study reported their
expenditures for the 2015/16 financial year. The proportions of these expenditures that
occurred on various key items are reported in Table 2-5. The greatest expenditure was on wages
and drawings by owners (40.6 per cent), followed by the cost of goods sold (16.4 per cent).
Table 2-5 Expenditure profile for music venues in South Australia
Source: EconSearch SA Music Survey
a Cost of goods sold includes merchandise, CDs and other stock sold
b Imports are all goods and services purchased outside of South Australia
c Capital expenditure includes equipment, hardware, vehicles and buildings used to carry out business activities
Item
Proportion of annual
expendituresImportsᵃ 37.3%
Capital Expenditureᵇ (music) 14.2%
Office and administration 11.5%
Instruments 10.9%
Other 10.6%
Travel and accommodation (in SA) 8.2%
Music Services 3.3%
Cost of goods soldᶜ 2.1%
Capital Expenditureᵇ (non-music) 1.8%
Total 100%
Item
Proportion of annual
expenditures
Wages 40.4%
Cost of goods soldᵃ 17.5%
Other 13.5%
Importsᵇ 11.8%
Musicians / performers 6.3%
Office and administration 4.7%
Professional services 2.9%
Communications 1.5%
Capital Expenditureᶜ (music) 1.0%
Capital Expenditureᶜ (non-music) 0.2%
APRA fees 0.2%
Total 100.0%
e c o n s e a r c h
MDO Economic Contribution of SA Music
Page| 17
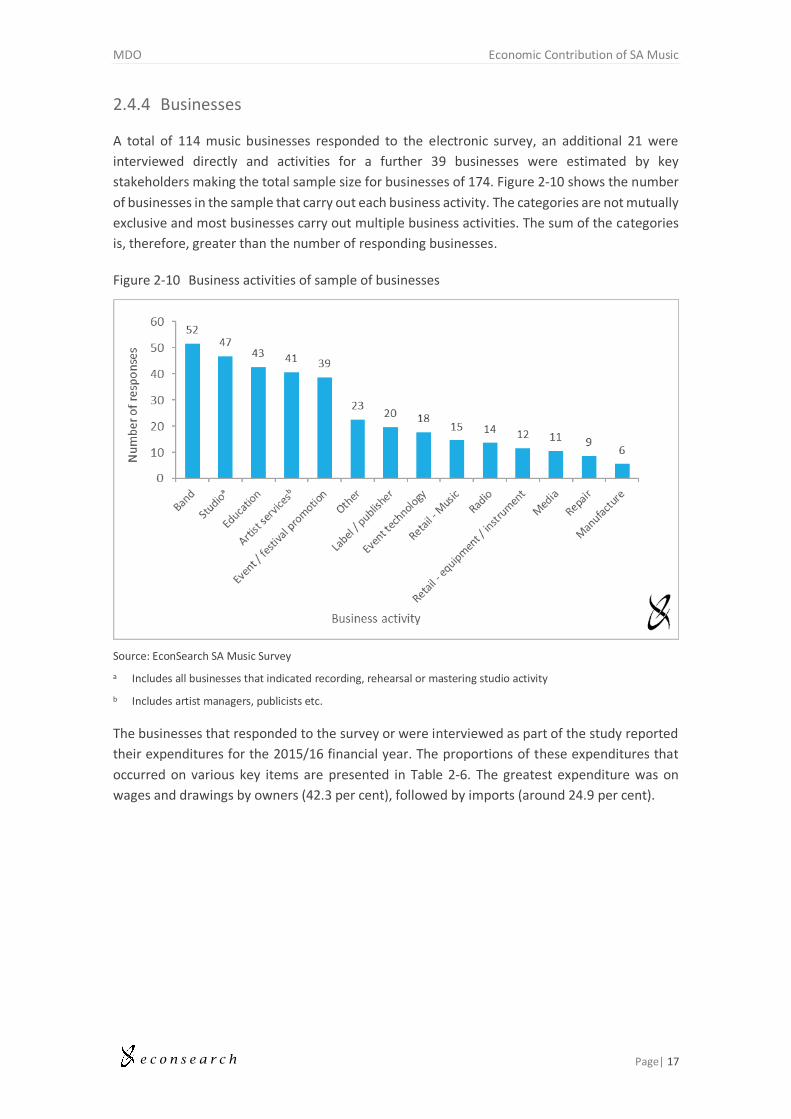
2.4.4 Businesses
A total of 114 music businesses responded to the electronic survey, an additional 21 were
interviewed directly and activities for a further 39 businesses were estimated by key
stakeholders making the total sample size for businesses of 174. Figure 2-10 shows the number
of businesses in the sample that carry out each business activity. The categories are not mutually
exclusive and most businesses carry out multiple business activities. The sum of the categories
is, therefore, greater than the number of responding businesses.
Figure 2-10 Business activities of sample of businesses
Source: EconSearch SA Music Survey
a Includes all businesses that indicated recording, rehearsal or mastering studio activity
b Includes artist managers, publicists etc.
The businesses that responded to the survey or were interviewed as part of the study reported
their expenditures for the 2015/16 financial year. The proportions of these expenditures that
occurred on various key items are presented in Table 2-6. The greatest expenditure was on
wages and drawings by owners (42.3 per cent), followed by imports (around 24.9 per cent).
e c o n s e a r c h
MDO Economic Contribution of SA Music
Page| 18
Table 2-6 Expenditure profile for music businesses (excluding venues) in South Australia
Source: EconSearch SA Music Survey
a Imports are all goods and services purchased outside of South Australia
b Cost of goods sold includes merchandise, CDs and other stock sold
c Capital expenditure includes equipment, hardware, vehicles and buildings used to carry out business activities
2.5 Survey Analysis
2.5.1 Survey Weighting
Sufficient aggregate data were available (see Sections 2.3.1 and 2.3.2) to weight the survey
sample of consumers and musicians to be representative of the population. The GREGWT
method, developed by the Australian Bureau of Statistics (Bell 2000), was used to weight each
dataset as described below. This method determines which characteristics are under or
overrepresented in the sample (compared to the population) and weights each record in order
to compensate for all characteristics simultaneously. The result is a survey sample that
represents the population in each relevant characteristic.
2.5.1.1 Consumers
Figure 2-11 shows the sample age distribution compared to the population. Ages 35 to 64 were
overrepresented in the sample and the other age groups were underrepresented. The sample
size was sufficient for the GREGWT procedure to weight the sample to match the population
exactly.
Item
Proportion of annual
expenditures
Wages 42.3%
Importsᵃ 24.9%
Other 12.7%
Professional services 6.0%
Performers (non-music) 4.2%
Office 3.6%
Cost of goods soldᵇ 1.6%
Musicians 1.6%
Music services 0.9%
Capital expenditureᶜ (non-music) 0.7%
Capital expenditureᶜ (music) 0.5%
Road transport 0.5%
Communications 0.5%
Total 100.0%
e c o n s e a r c h
MDO Economic Contribution of SA Music
Page| 19
Figure 2-11 Sample, population and weighted sample age range
Source: EconSearch SA Music Survey and Figure 2-4
Figure 2-12 shows that higher income groups were overrepresented in the sample but that
sufficient responses were collected to allow a complete weighting, as with age groups.
Figure 2-12 Sample, population and weighted sample personal income range
Source: EconSearch SA Music Survey and Figure 2-3

e c o n s e a r c h
MDO Economic Contribution of SA Music
Page| 20
Figure 2-13 shows that a higher proportion of respondents to the survey attended a music event
in the last year compared to the population of interest, this was also controlled for successfully
by the weighting method.
Figure 2-13 Sample, population and weighted sample live music activity level
Source: EconSearch SA Music Survey and Figure 2-2
2.5.1.2 Musicians
As with consumers, musician responses were weighted to match aggregate data. The survey and
aggregate distributions used for the weighting process are not published here to preserve the
privacy of APRA members. The distributions used were royalty income quintiles and quintiles for
the number of new works registered in 2015/16. Using APRA data as an indicator of aggregate
activity is a conservative approach as any working non-APRA member musicians are excluded
from this analysis. The analysis likely underestimates the economic contribution of musicians by
an amount dependent on the number of non-APRA member musicians working in South
Australia. Comments from key stokeholds suggest that the number of working musicians may
be double the number of APRA members as there is little incentive to register as an APRA
member for musicians who do little or no writing.
2.5.2 Benchmarking
2.5.2.1 Consumers
Weighting the consumer sample to age, income, live music attendance and population count
data corrects for these variables and any other variables that are correlated with them. It does
not correct for how active each individual is in live music. Further, consumers were asked to
describe a ‘memorable event’ in the survey and this was multiplied by the consumers’ total
number of attendances in order to estimate their annual expenditure at music events. Each of
e c o n s e a r c h
MDO Economic Contribution of SA Music
Page| 21
these factors were expected to cause an overestimation of expenditure due to a self-selection
bias where respondents are more active than the average South Australian and the event they
recall is likely more expensive. These biases were each observed in the sample. To correct for
this, the weighted total attendances at paid events and the weighted total expenditure from the
sample were scaled down to match reliable aggregate attendance and ticket revenue data from
2015 published by Live Performance Australia (2016). This means that data for each respondent
were used to described the relative amounts that they spent on different items and the types of
events they attended while the overall spend was described by reliable aggregate data.
The same scale factor as for expenditure at live music events was adopted as a proxy for music
activity in general and applied to scale down the weighted total expenditure by consumers on
recorded music, music equipment and instruments. No aggregate level data were available for
this kind of consumption expenditure so this was adopted as a solution to correct for self-
selection bias.
2.5.2.2 Musicians
As with consumers, the weighted survey responses from musicians were scaled together to
match aggregate data from APRA (2017) on total royalties paid and live performances reported
in 2015/16. These aggregates are left unpublished for privacy reasons.
3. RESULTS
3.1 Overall Music Industry
The overall economic contribution of the music industry to South Australia in 2015/16 is
reported in Table 3-1. This includes the activities of musicians, venues, music businesses and
related spending by consumers. The total employment contribution was around 6,300 jobs (or
4,500 fte jobs3), including almost 1,800 (or 1,600 fte jobs) from flow-on effects4. Gross state
product (GSP) contributed by the music industry was around $375 million, including $221 million
from flow-on effects. Household income (one component of GSP) contributed from the music
industry was around $249 million, including $126 million from flow-on effects.
3 Adding the total hours worked each week by the 6,300 workers and dividing by the number of hours in a full-time week (assumed to be 37.5 here) calculates the number of fte jobs (around 4,500) (see Section 2.1.1).
4 Flow-on effects are the effects of the broad economic activity that begins with the music industry and spreads out across South Australia as businesses supply one another, pay their employees and sell consumption goods to households (see Section 2.1.2 for an explanation and Appendix 1).
e c o n s e a r c h
MDO Economic Contribution of SA Music
Page| 22
Table 3-1 Economic contribution of the music industry to South Australia, 2015/16
Source: EconSearch analysis
The right hand column of Table 3-1 shows the type II multipliers for the music industry. These
multipliers are calculated by dividing the total contribution by the direct contribution. For
example, for every fte job contributed directly by the music industry, an additional 0.6 fte jobs
are contributed from flow-on effects, making a total contribution of 1.6 fte jobs. For GSP, each
$1 million contributed directly by the music industry leads to an additional $1.4 million
contribution to GSP from flow-on effects.
Table 3-2 focuses more closely on the contribution of the music industry to GSP. The table shows
that around one third of the direct contribution to GSP was due to related expenditures made
when consumers attended music events. The other two thirds were contributed by activity
within the music industry. The table also shows that the consumption induced effects were
almost double the production induced effects. This means that most of the flow-on effects in
the total economic contribution were generated by households spending income earned as a
result of music industry activity. Table 3-3 presents the same detail for employment on an fte
basis and can be interpreted in the same way.
Table 3-2 Economic contribution of the music to South Australia, GSP ($m), 2015/16
Source: EconSearch analysis
Type II
Direct Flow-on Total Multiplier
Employment (total) 4,526 1,792 6,318 1.4
Employment (fte) 2,874 1,608 4,481 1.6
Household Income ($m) 123.6 125.6 249.2 2.0
Gross State Product ($) 153.9 221.4 375.3 2.4
Contribution
Direct
Flow-on
(production
induced)
Flow-on
(consumption
induced) Total
Consumption related to live music 50.1 24.6 43.9 118.6
Venues 46.4 24.9 39.2 110.5
Musicians 6.8 2.1 6.7 15.7
Other businesses 50.6 25.6 54.3 130.5
Combined music industry 103.8 52.7 100.2 256.7
Overall impact of music 153.9 77.3 144.0 375.3
Gross State Product ($m)
e c o n s e a r c h
MDO Economic Contribution of SA Music
Page| 23
Table 3-3 Economic contribution of the music to South Australia, employment (fte), 2015/16
Source: EconSearch analysis
3.2 Live Music
The overall economic contribution of live music to South Australia in 2015/16 is reported in Table
3-4. This includes the activities of venues, performing musicians and supporting music business
activities as well as the related expenditures by consumers. The total employment contribution
was around 4,200 jobs (or 2,900 fte jobs), including over 1,200 (or 1,100 fte jobs) from flow-on
effects. GSP contributed by live music was around $254 million, including around $148 million
from flow-on effects. Household income (one component of GSP) contributed from live music
was around $162 million, including $83 million from flow-on effects. The type II multipliers for
live music are the same as for the overall music industry.
Table 3-4 Economic contribution of live music to South Australia, 2015/16
Source: EconSearch analysis
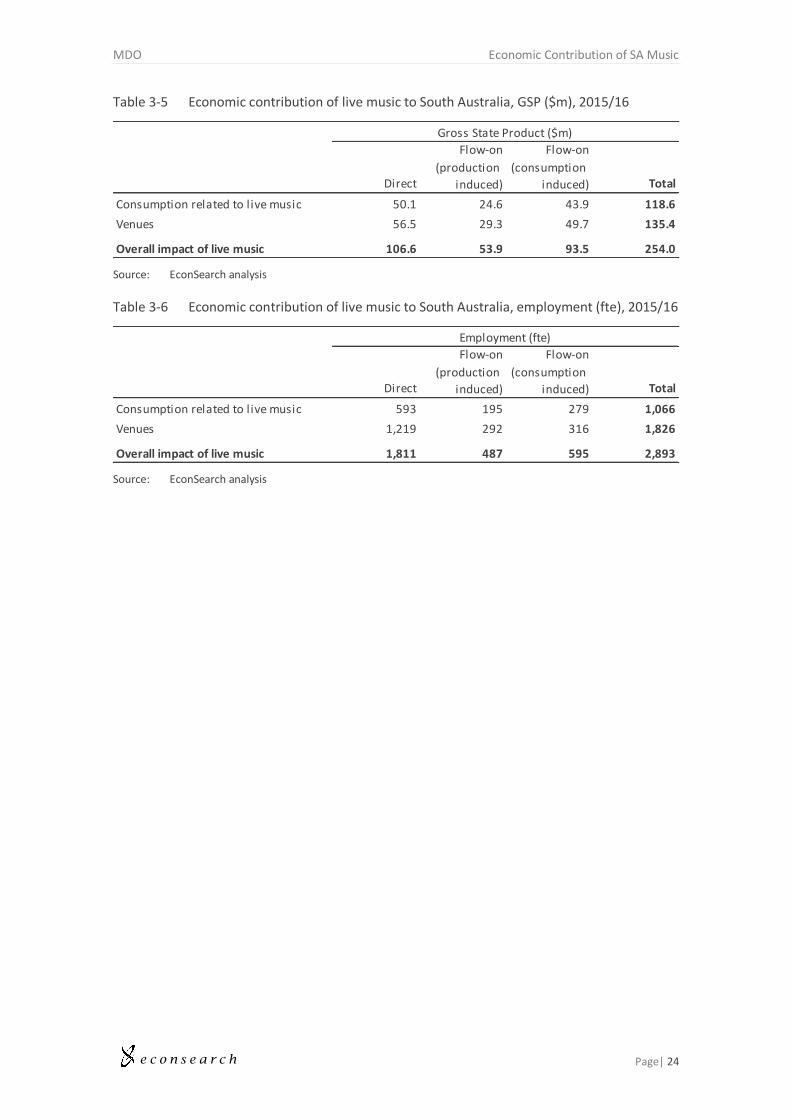
Table 3-5 focuses more closely on the contribution of live music to GSP. The table shows that
almost half of the direct contribution to GSP was due to related expenditures made when
consumers attended music events. The other half was contributed by activity within the music
industry including venues, musicians and other businesses involved in live music. The table also
shows that, like the overall music industry, the consumption induced effects were almost double
the production induced effects. Table 3-6 presents the same detail for employment on an fte
basis and can be interpreted in the same way.
Direct
Flow-on
(production
induced)
Flow-on
(consumption
induced) Total
Consumption related to live music 593 195 279 1,066
Venues 588 253 249 1,090
Musicians 948 19 43 1,010
Other businesses 745 224 345 1,315
Combined music industry 2,281 497 637 3,415
Overall impact of music 2,874 692 916 4,481
Employment (fte)
Type II
Direct Flow-on Total Multiplier
Employment (total) 2,984 1,210 4,194 1.4
Employment (fte) 1,811 1,081 2,893 1.6
Household Income ($m) 79.1 82.7 161.8 2.0
Gross State Product ($) 106.6 147.5 254.0 2.4
Contribution
e c o n s e a r c h
MDO Economic Contribution of SA Music
Page| 24
Table 3-5 Economic contribution of live music to South Australia, GSP ($m), 2015/16
Source: EconSearch analysis
Table 3-6 Economic contribution of live music to South Australia, employment (fte), 2015/16
Source: EconSearch analysis
Direct
Flow-on
(production
induced)
Flow-on
(consumption
induced) Total
Consumption related to live music 50.1 24.6 43.9 118.6
Venues 56.5 29.3 49.7 135.4
Overall impact of live music 106.6 53.9 93.5 254.0
Gross State Product ($m)
Direct
Flow-on
(production
induced)
Flow-on
(consumption
induced) Total
Consumption related to live music 593 195 279 1,066
Venues 1,219 292 316 1,826
Overall impact of live music 1,811 487 595 2,893
Employment (fte)
e c o n s e a r c h
MDO Economic Contribution of SA Music
Page| 25
REFERENCES
Adelaide Fringe 2017, Adelaide Fringe 2017 Annual Review, Adelaide, July.
APRA AMCOS 2017, EconSearch Data Request: Member and Licence Data for South Australia (confidential), Sydney, July.
Australian Bureau of Statistics 2014, 5271.0 - Australian National Accounts: Cultural and Creative Activity Satellite Accounts, Experimental, 2008-09, Canberra, February 2017.
Australian Bureau of Statistics 2015, 4114.0 - Attendance at Selected Cultural Venues and Events, Australia, 2013-14, Canberra, February.
Australian Bureau of Statistics 2016a, 5249.0 - Australian National Accounts: Tourism Satellite Account, 2015-16, Canberra, December.
Australian Bureau of Statistics 2016b, Census of Population and Housing, Canberra, July 2017.
Bell, P. 2000, Weighting and standard error estimation for ABS household surveys, Australian Bureau of Statistics, Canberra, November 2011.
Live Performance Australia 2016, Live Performance Industry in Australia: 2015 Ticket Attendance and Revenue Survey, November.
UNESCO. (2015). Adelaide | Creative Cities Network. Retrieved from http://en.unesco.org/creative-cities/adelaide
Disclaimer
The assignment is a consulting engagement as outlined in the ‘Framework for Assurance
Engagements’, issued by the Auditing and Assurances Standards Board, Section 17. Consulting
engagements employ an assurance practitioner’s technical skills, education, observations,
experiences and knowledge of the consulting process. The consulting process is an analytical
process that typically involves some combination of activities relating to: objective-setting, fact-
finding, definition of problems or opportunities, evaluation of alternatives, development of
recommendations including actions, communication of results, and sometimes implementation
and follow-up.
The nature and scope of work has been determined by agreement between BDO and the Client.
This consulting engagement does not meet the definition of an assurance engagement as
defined in the ‘Framework for Assurance Engagements’, issued by the Auditing and Assurances
Standards Board, Section 10.
Except as otherwise noted in this report, we have not performed any testing on the information
provided to confirm its completeness and accuracy. Accordingly, we do not express such an audit
opinion and readers of the report should draw their own conclusions from the results of the
review, based on the scope, agreed-upon procedures carried out and findings.
e c o n s e a r c h
MDO Economic Contribution of SA Music
Page| 26
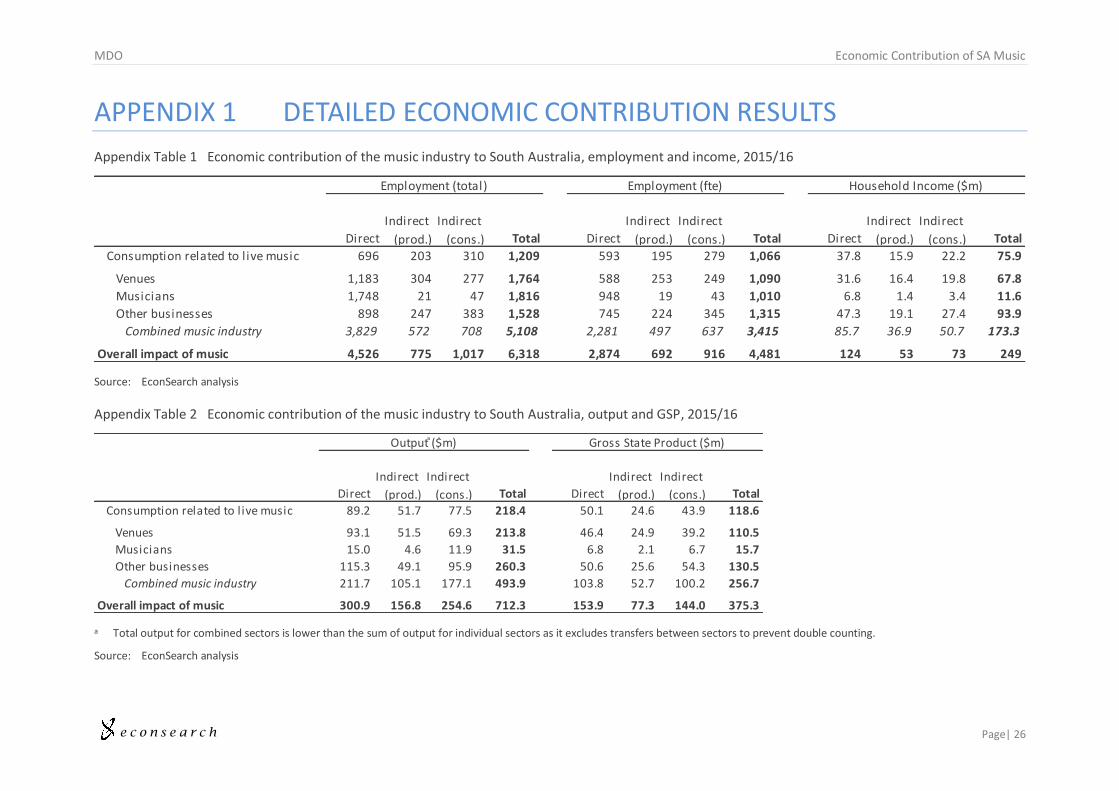
APPENDIX 1 DETAILED ECONOMIC CONTRIBUTION RESULTS
Appendix Table 1 Economic contribution of the music industry to South Australia, employment and income, 2015/16
Source: EconSearch analysis
Appendix Table 2 Economic contribution of the music industry to South Australia, output and GSP, 2015/16
a Total output for combined sectors is lower than the sum of output for individual sectors as it excludes transfers between sectors to prevent double counting.
Source: EconSearch analysis
Direct
Indirect
(prod.)
Indirect
(cons.) Total Direct
Indirect
(prod.)
Indirect
(cons.) Total Direct
Indirect
(prod.)
Indirect
(cons.) Total
Consumption related to live music 696 203 310 1,209 593 195 279 1,066 37.8 15.9 22.2 75.9
Venues 1,183 304 277 1,764 588 253 249 1,090 31.6 16.4 19.8 67.8
Musicians 1,748 21 47 1,816 948 19 43 1,010 6.8 1.4 3.4 11.6
Other businesses 898 247 383 1,528 745 224 345 1,315 47.3 19.1 27.4 93.9
Combined music industry 3,829 572 708 5,108 2,281 497 637 3,415 85.7 36.9 50.7 173.3
Overall impact of music 4,526 775 1,017 6,318 2,874 692 916 4,481 124 53 73 249
Household Income ($m)Employment (total) Employment (fte)
Direct
Indirect
(prod.)
Indirect
(cons.) Total Direct
Indirect
(prod.)
Indirect
(cons.) Total
Consumption related to live music 89.2 51.7 77.5 218.4 50.1 24.6 43.9 118.6
Venues 93.1 51.5 69.3 213.8 46.4 24.9 39.2 110.5
Musicians 15.0 4.6 11.9 31.5 6.8 2.1 6.7 15.7
Other businesses 115.3 49.1 95.9 260.3 50.6 25.6 54.3 130.5
Combined music industry 211.7 105.1 177.1 493.9 103.8 52.7 100.2 256.7
Overall impact of music 300.9 156.8 254.6 712.3 153.9 77.3 144.0 375.3
Output ͣ($m) Gross State Product ($m)
e c o n s e a r c h
MDO Economic Contribution of SA Music
Page| 27
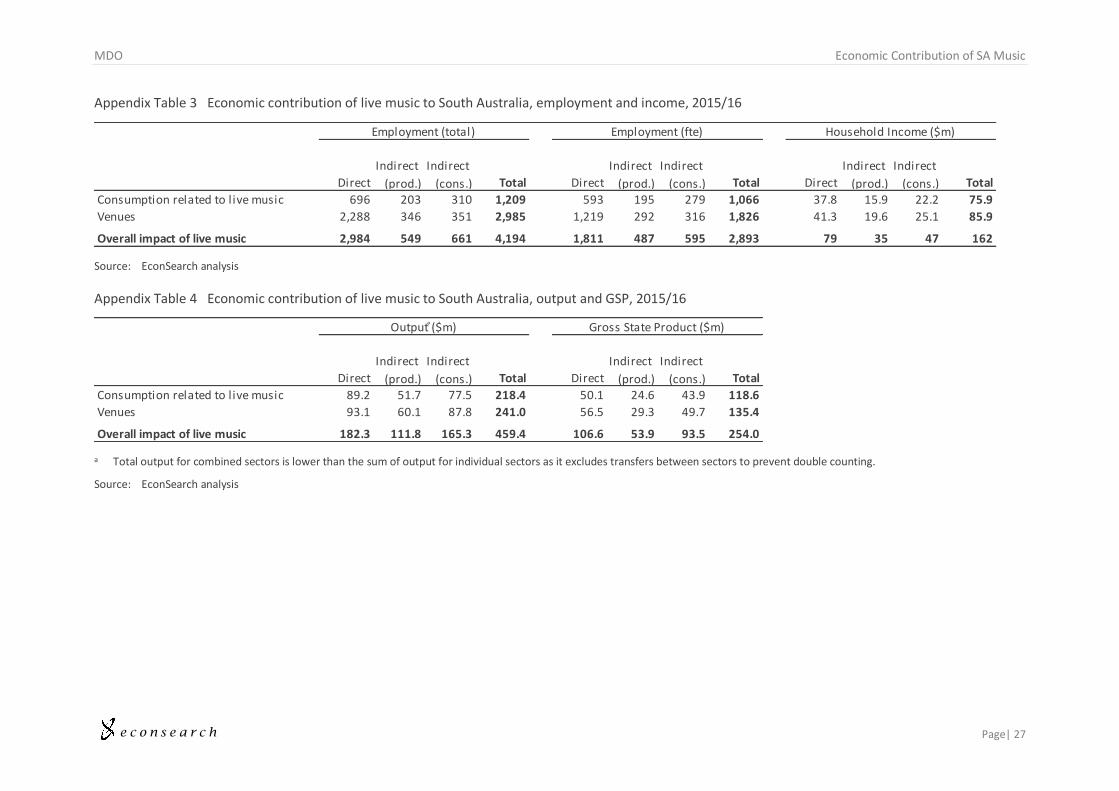
Appendix Table 3 Economic contribution of live music to South Australia, employment and income, 2015/16
Source: EconSearch analysis
Appendix Table 4 Economic contribution of live music to South Australia, output and GSP, 2015/16
a Total output for combined sectors is lower than the sum of output for individual sectors as it excludes transfers between sectors to prevent double counting.
Source: EconSearch analysis
Direct
Indirect
(prod.)
Indirect
(cons.) Total Direct
Indirect
(prod.)
Indirect
(cons.) Total Direct
Indirect
(prod.)
Indirect
(cons.) Total
Consumption related to live music 696 203 310 1,209 593 195 279 1,066 37.8 15.9 22.2 75.9
Venues 2,288 346 351 2,985 1,219 292 316 1,826 41.3 19.6 25.1 85.9
Overall impact of live music 2,984 549 661 4,194 1,811 487 595 2,893 79 35 47 162
Employment (total) Employment (fte) Household Income ($m)
Direct
Indirect
(prod.)
Indirect
(cons.) Total Direct
Indirect
(prod.)
Indirect
(cons.) Total
Consumption related to live music 89.2 51.7 77.5 218.4 50.1 24.6 43.9 118.6
Venues 93.1 60.1 87.8 241.0 56.5 29.3 49.7 135.4
Overall impact of live music 182.3 111.8 165.3 459.4 106.6 53.9 93.5 254.0
Output ͣ($m) Gross State Product ($m)


![New Entrants in Indian Telecom Industry_Final [Compatibility Mode]](https://img.pdfslide.net/doc/110x75/546731a1b4af9f623f8b5695/new-entrants-in-indian-telecom-industryfinal-compatibility-mode.jpg)