Embed Size (px)
Citation preview
Economic Contributions of the Environmental Horticulture
Industry in Florida in 2015
Sponsored Project Report to
Florida Nursery, Growers and Landscape Association, Orlando, Florida
Alan W. Hodges, PhD*
Hayk Khachatryan, PhD**
Mohammad Rahmani, PhD*
Christa D. Court, PhD*
University of Florida-Institute of Food and Agricultural Sciences
Food and Resource Economics Department
*Main Campus, Gainesville, FL
**Mid-Florida Research and Education Center, Apopka, FL
First author contact: tel. 352-294-7674; email [email protected]
November 1, 2016
2
Table of Contents
Executive Summary .....................................................................................................................................................5
Acknowledgments ........................................................................................................................................................6
Introduction ..................................................................................................................................................................7
Table 1. Number of business establishments, employment and wages paid in principal sectors of the
environmental horticulture industry in Florida, 2015 ..........................................................................................8
Table 2. Number of business establishments in principal sectors of the environmental horticulture industry in
Florida counties, 2015 ..........................................................................................................................................8
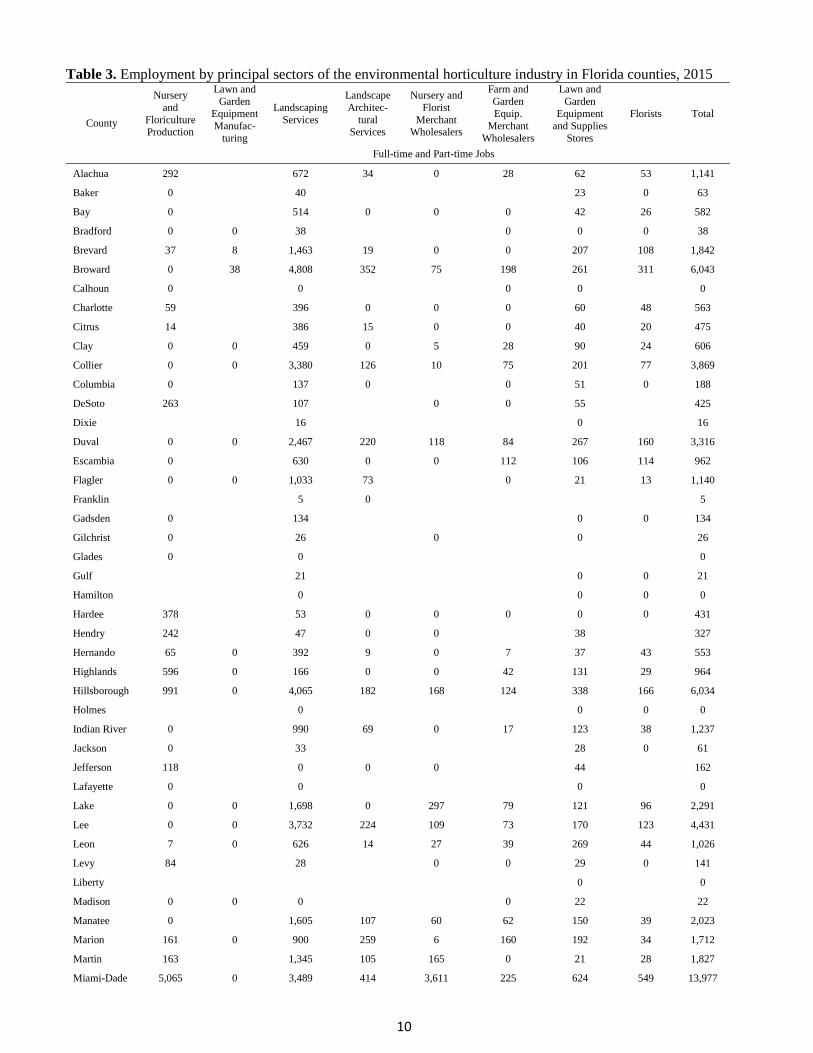
Table 3. Employment by principal sectors of the environmental horticulture industry in Florida counties, 2015
............................................................................................................................................................................10
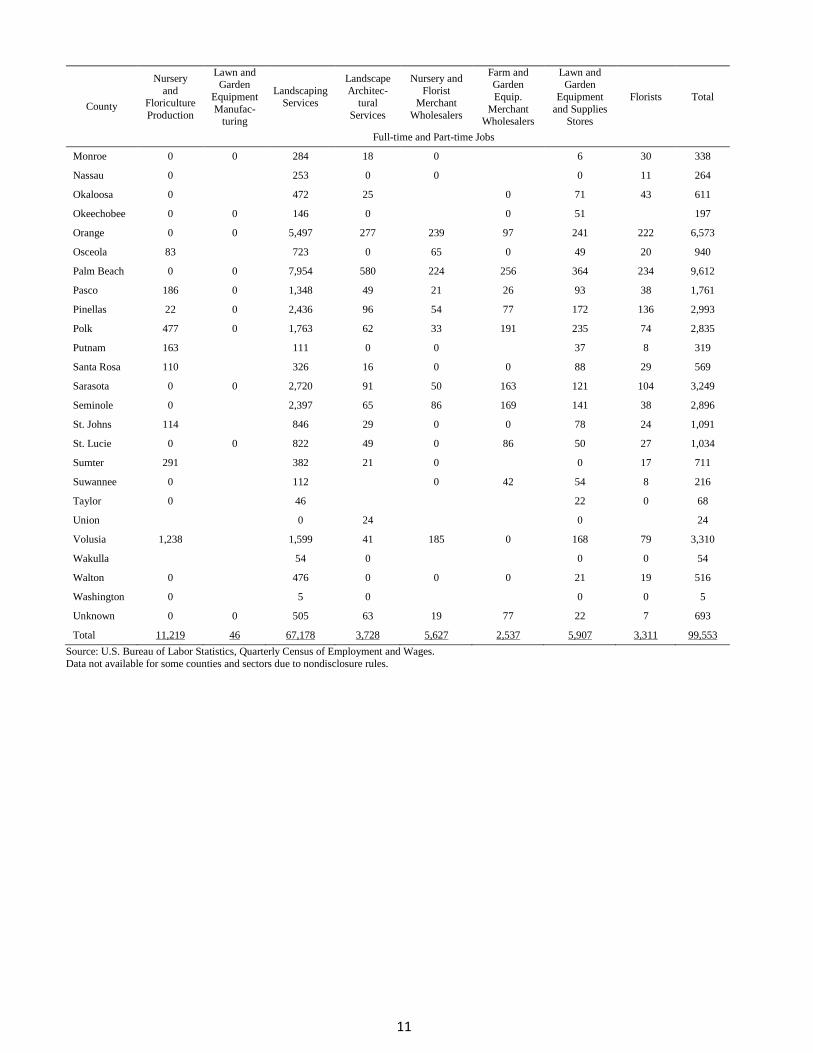
Figure 1. Trend in Florida environmental horticulture industry sector employment, quarterly 2001-15 ..........12
Figure 2. Trend in Florida environmental horticulture industry group employment, quarterly 2001-15 ...........12
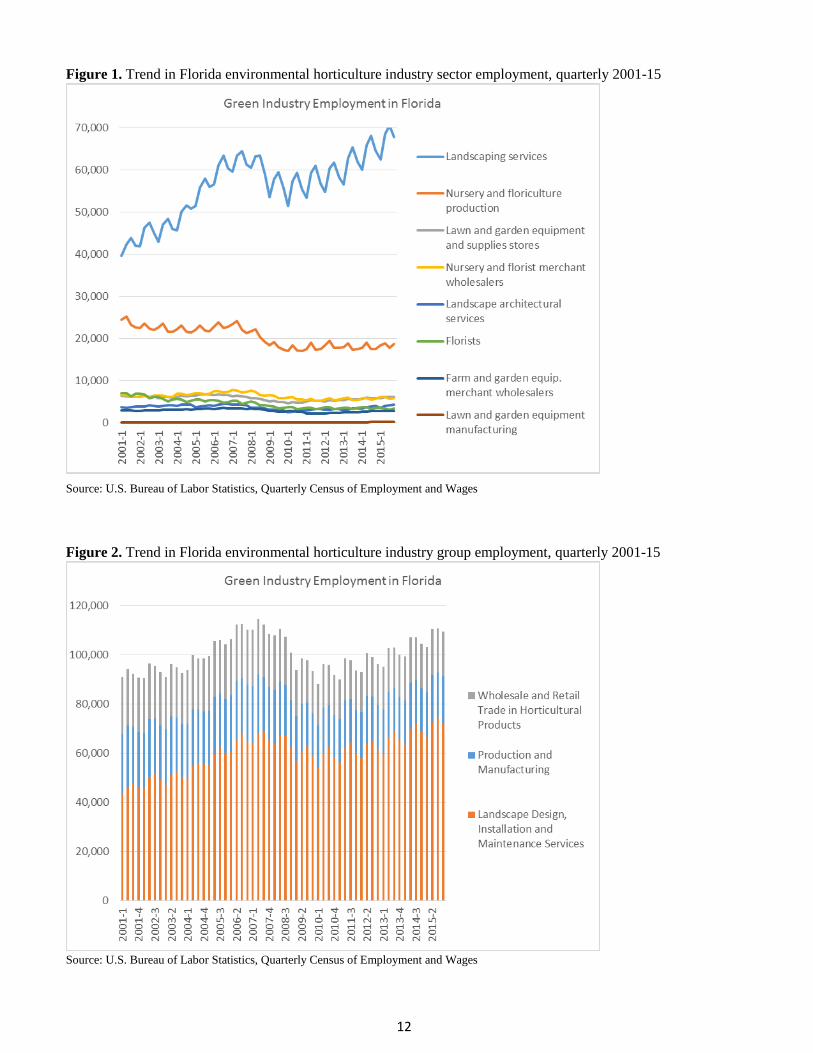
Figure 3. Trend in Florida environmental horticulture industry group employment percentage change,
quarterly 2001-15 ...............................................................................................................................................13
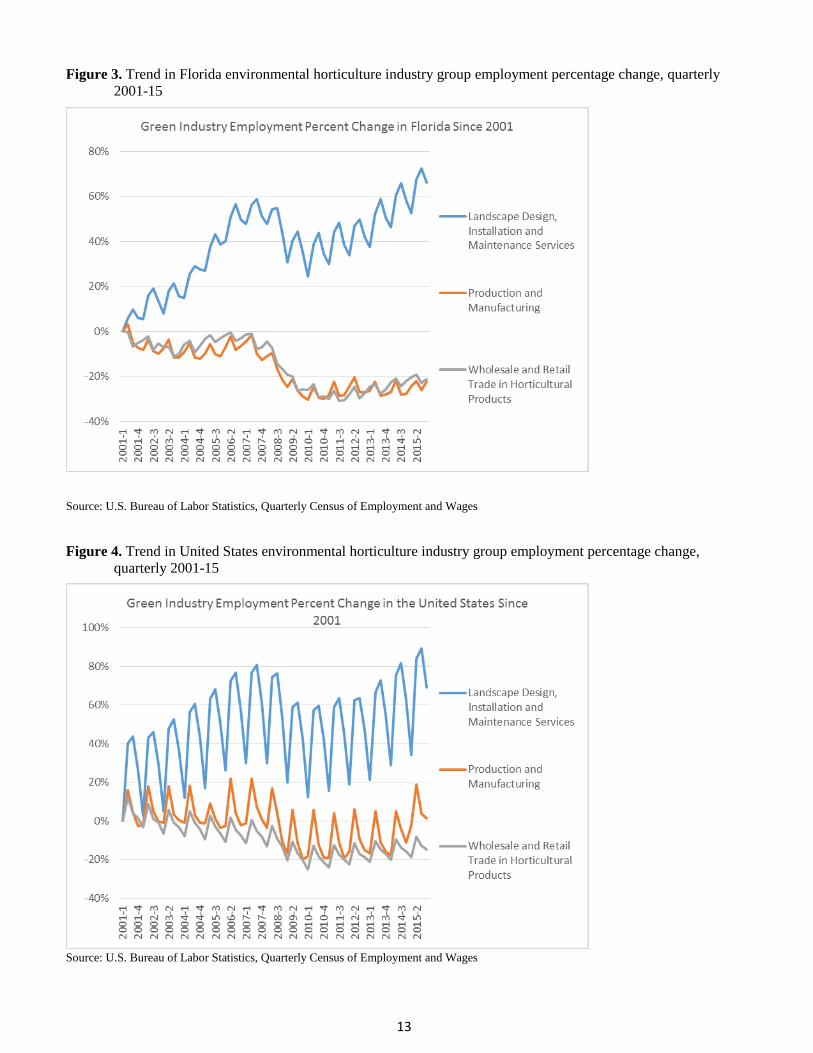
Figure 4. Trend in United States environmental horticulture industry group employment percentage change,
quarterly 2001-15 ...............................................................................................................................................13
Methods ......................................................................................................................................................................14
Table 5. Number of firms contacted for the 2016 environmental horticulture industry in Florida ....................16
Figure 5. Number of survey respondents by industry sector and firm sales size class, 2016 survey of the
Florida environmental horticulture industry ......................................................................................................16
Table 6. Summary of survey respondents by primary business type, survey mode, business size and key
indicators, 2016 survey of the Florida environmental horticulture industry ......................................................17
Table 7. Respondents by company position, 2016 survey of the Florida environmental horticulture industry .17
Table 8. Retail and wholesale sales of lawn and garden products in Florida (2012) .........................................18
Table 9. Industry parent sector and horticulture subsector splits for employment ............................................18
Table 10. Number of business establishments in principal sectors of the environmental horticulture industry in
Florida, by number of employees, 2015 .............................................................................................................19
Table 11. Summary of Florida environmental horticulture industry employment and percent change, 2014-15
............................................................................................................................................................................19
Survey Results............................................................................................................................................................20
Industry Sector Employment and Sales .................................................................................................................20
Table 12. Employment and unfilled positions reported by primary business type, 2016 survey of the Florida
environmental horticulture industry ...................................................................................................................20
Table 13. Employment size distribution by primary business type, 2016 survey of the Florida environmental
horticulture industry ...........................................................................................................................................20
Table 14. Reported and expanded employment by primary business activity, 2016 survey of the Florida
environmental horticulture industry ...................................................................................................................21
Figure 6. Reported full-time and part-time/seasonal employment by primary business activity, 2016 survey of
the Florida environmental horticulture industry .................................................................................................21
Figure 7. Expanded employment by primary business activity, 2016 survey of the Florida environmental
horticulture industry ...........................................................................................................................................21
3
Table 15. Distribution of respondent firms by annual sales class and principal business activity, 2016 survey
of the Florida environmental horticulture industry ............................................................................................22
Figure 8. Expanded sales by primary business activity, 2016 survey of the Florida environmental horticulture
industry ...............................................................................................................................................................23
Table 16. Reported and expanded sales and employment by primary business activity, 2016 survey of the
Florida environmental horticulture industry ......................................................................................................23
Table 17. Expanded sales by market area and primary business activity, 2016 survey of the Florida
environmental horticulture industry ...................................................................................................................23
Figure 9. Sales reported by market area and primary business activity, 2016 survey of the Florida
environmental horticulture industry ...................................................................................................................24
Table 18. Summary of reported employment and sales by Florida County, 2016 survey of the Florida
environmental horticulture industry ...................................................................................................................24
Sales of Horticultural Products and Services .........................................................................................................26
Table 19. Reported and expanded product and service sales, 2016 survey of the Florida environmental
horticulture industry ...........................................................................................................................................26
Figure 10. Expanded nursery product sales, 2016 survey of the Florida environmental horticulture industry .27
Figure 11. Expanded wholesaler/retailer product sales, 2016 survey of the Florida environmental horticulture
industry ...............................................................................................................................................................28
Figure 12. Expanded landscape service sales, 2016 survey of the Florida environmental horticulture industry
............................................................................................................................................................................28
Figure 13. Expanded allied industry sales, 2016 survey of the Florida environmental horticulture industry ....29
Market Channels for Horticultural Products ..........................................................................................................30
Table 20. Percentage of sales by customer type and primary business, 2016 survey of the Florida
environmental horticulture industry ...................................................................................................................30
Figure 14. Expanded sales of horticultural products and services by customer type and primary business, 2016
survey of the Florida environmental horticulture industry .................................................................................31
Product or Service Features Offered ......................................................................................................................32
Table 21. Product and service features offered, 2016 survey of the Florida environmental horticulture industry
............................................................................................................................................................................32
Figure 15. Product and service features offered, 2016 survey of the Florida environmental horticulture
industry ...............................................................................................................................................................33
Capital Investment .................................................................................................................................................34
Table 22. Capital investment reported by primary business type in 2015 and for the next three years, 2016
survey of the Florida environmental horticulture industry .................................................................................34
Figure 16. Capital investment reported by primary business type in 2015 and for the next three years, 2016
survey of the Florida environmental horticulture industry .................................................................................34
Area Managed ........................................................................................................................................................35
Table 23. Nursery/greenhouse production area and wholesale/retail area, 2016 survey of the Florida
environmental horticulture industry ...................................................................................................................35
Issues or Threats to the Environmental Horticulture Industry ...............................................................................36
Table 24. Importance ratings of possible business issues or threats, 2016 survey of the Florida environmental
horticulture industry ...........................................................................................................................................36
Figure 17. Importance ratings of possible business issues or threats, 2016 survey of the Florida environmental
horticulture industry ...........................................................................................................................................37
4
Economic Contribution Results .................................................................................................................................38
Statewide Contributions .........................................................................................................................................38
Table 25. Summary of economic contributions of the environmental horticulture industry in the State of
Florida in 2015 ...................................................................................................................................................39
Figure 18. Summary of employment contributions of environmental horticulture industry groups in Florida,
2015 ....................................................................................................................................................................40
Figure 19. Summary of output contributions of environmental horticulture industry groups in Florida, 2015 .40
Figure 20. Summary of value added (GDP) contributions of environmental horticulture industry groups in
Florida, 2015 ......................................................................................................................................................41
Regional and County Economic Impacts ...............................................................................................................41
Table 26. Summary of economic contributions of the environmental horticulture industry in Florida regions
and counties in 2015...........................................................................................................................................42
Table 27. Economic contributions of environmental horticulture industry groups in Florida regions and
counties in 2015 .................................................................................................................................................44
Figure 21. Employment contributions of environmental horticulture industry groups in Florida economic
regions, 2015 ......................................................................................................................................................46
Figure 22. Output contributions of environmental horticulture industry groups in Florida economic regions,
2015 ....................................................................................................................................................................46
Figure 23. Value added (GDP) contributions of environmental horticulture industry groups in Florida
economic regions, 2015 .....................................................................................................................................47
Figure 24. Employment contributions of environmental horticulture industry groups in the top twenty Florida
counties, 2015 ....................................................................................................................................................47
Comparison to Previous Studies ............................................................................................................................48
Table 28. Comparison of economic impacts of the Florida environmental horticulture industry, 2000, 2005,
2010 and 2015 ....................................................................................................................................................49
Figure 25. Direct employment of environmental horticulture industry groups in 2000, 2005, 2010 and 2015 .50
Figure 26. Employment contributions of environmental horticulture industry groups in 2000, 2005, 2010 and
2015 ....................................................................................................................................................................50
Figure 27. Value added (GDP) contributions of environmental horticulture industry groups in 2000, 2005,
2010 and 2015 ....................................................................................................................................................51
Conclusions ................................................................................................................................................................51
Literature and Information Sources Cited ..................................................................................................................52
Appendix A: Mail Questionnaire for the 2016 Florida Environmental Horticulture Industry Economic Survey .....53
5
Executive Summary
The environmental horticulture industry is comprised of nursery and greenhouse producers, landscape service
firms, horticultural product retailers and wholesalers, and allied horticultural product manufacturers and service
providers. Economic contributions of the industry in Florida in 2015 were evaluated through mail and internet
surveys of industry firms, together with regional economic models of the state and counties.
Survey questionnaires were sent to 10,440 firms, and usable responses were provided by 1,546 firms, representing
a 14.8 percent response rate. Survey respondents reported sales of $1.195 billion in 2015. Total industry sales were
estimated at $10.711 billion, including $2.753 billion for nursery producers, $4.431 billion for landscape service
firms, $1.239 billion for horticultural retailers, $1.041 billion for wholesalers, and $1.247 billion for allied firms.
Approximately 25 to 30 percent of nursery, wholesaler and allied firm sales were to out-of-state (national and
international) markets, while landscape and retailer sales were predominantly to state and local markets.
Respondents reported employment of 14,794 persons, including 11,245 full-time and 3,549 part-time or temporary
employees, and total employment in the industry was estimated at 109,821 jobs, including 64,777 jobs in the
landscape sector and 19,152 jobs for nurseries. In addition, a total of 552 unfilled positions were reported.
Respondents reported capital investment of nearly $50 million in 2015, including $21 million for
buildings/structures, $23 million for equipment and vehicles, and smaller amounts for information technology and
other types of capital. For the next three years (2016-18), respondents expected to invest nearly $90 million.
Sales percentages were reported for major types of products, services and customers. The largest plant product
types for the nursery plant grower sector were palms and tropical foliage plants, representing 21.5 percent of
reported sales, followed by evergreen trees and shrubs (15.9%), propagating material (12.8%), and potted
flowering/bedding plants (12.6%). Florida native plants represented 15.5 percent of nursery sales. For the
landscape services sector, 32.3 percent of sales were for landscape installations and 31.2 percent were for
landscape maintenance, including lawncare. For horticultural retailers and wholesalers, about one-third (34.6%) of
sales were for live plants, followed by nursery containers (15.9%) and soil/growing media (13.1%). Among allied
suppliers, the largest specific categories of product sales were fertilizer (54.0%) and irrigation equipment (13.7%).
Information was collected on various product or service features offered in the industry, such as “Florida Friendly”
plant or landscaping. Among possible business threats to the industry, over half of respondents indicated that water
use restrictions, low prices, increasing costs of production, and government regulations were either “very
important” or “moderately important”.
Total economic contributions of the environmental horticulture industry were estimated using multipliers and
region data from a regional input-output model for Florida constructed with the IMPLAN software (Implan Group,
LLC). Economic multipliers estimate the economic activity that occurs in other sectors of the economy through the
industry supply chain (indirect effects) and respending by employee households and governments (induced
effects). Total economic impacts in Florida in 2015 were estimated at 232,648 full-time and part-time jobs,
$21.080 billion in industry output or revenues, and $13.172 billion in value added, equivalent to Gross Domestic
Product (GDP), comprised of $8.748 billion in labor income (wages, salaries, benefits, proprietor income), $3.427
billion in other property income (rents, interest, royalties, dividends, etc.), and $997 million in indirect business
taxes paid to local, state, and federal governments. Employment and GDP contributions were largest for the
landscape sector (148,215 jobs, $6.119 billion), followed by wholesale and retail trade (47,451 jobs, $4.021
billion), and nursery production and allied manufacturing (36,982 jobs, $3.033 billion). Contributions by allied
suppliers (13,177 jobs, $1.46 billion GDP) were included within the wholesale trade and equipment manufacturing
sectors. Since a previous study for 2010, total industry contributions increased by 19.2 percent for output and 22.5
percent for GDP in inflation-adjusted terms, while employment contributions declined by -4.7 percent.
6
Economic contribution estimates were developed for each of the State’s 67 counties and nine economic regions.
The top ten counties for employment contributions were Miami-Dade (28,598 jobs), Palm Beach (22,974),
Broward (17,758), Orange (17,606), Hillsborough (15,573), Lee (9,851), Duval (9,710), Collier (8,199), Pinellas
(7,486) and Seminole (7,115).
Acknowledgments
This research project was sponsored by the Florida Nursery, Growers and Landscape Association (FNGLA),
Orlando, Florida, through a grant provided by the U.S. Department of Agriculture, Specialty Crop Block Grant
Program. The authors thank the hundreds of business owners and professional managers in Florida who responded
to the surveys and shared their company information.
7
Introduction
The environmental horticulture or “Green” industry encompasses a wide range of businesses: nursery and
greenhouse producers, lawn and garden equipment and supply manufacturing, merchant wholesalers of durable
and nondurable horticultural products, landscape design, installation and maintenance and other support services,
lawn and garden stores and other retailers selling plants and related goods.
Nursery plants are one of the largest agricultural commodity groups in Florida, along with fruits, vegetables and
forest products. According to the Census of Horticulture Specialties for 2014, the state of Florida had over 2,069
commercial nursery and greenhouse farms, with total sales of $1.796 billion, and $3.291 billion in capital assets in
land, buildings, and equipment (USDA-NASS).
For the principal sectors of the environmental horticulture industry in Florida in 2015, there were 14,141 business
establishments reporting employment of 108,336 full-time and part-time jobs, and wages paid of $3.313 billion
(Table 1). Landscaping Services was by far the largest sector, with 9,594 firms, 67,319 employees and nearly $2
billion in wages, followed by nursery and floriculture production with 1,121 firms, 18,461 employees, and $513
million in wages. Note that these numbers do not represent small, nonemployer establishments who may not report
employment to the government, and do not represent ancillary sectors, such as retailers whose principal business is
not in horticultural goods and services. The number of establishments and average annual employment in the
principal horticulture industry sectors are shown for Florida Counties in Tables 2 and 3, respectively. Miami-Dade
County and Palm Beach Counties each had over 1,300 business establishments. Counties with over 5,000
employees in the environmental horticulture industry included Broward (6,043), Hillsborough (6,034), Miami-
Dade (13,977), Orange (6,573), and Palm Beach (9,612).
Employment in the environmental horticulture industry in Florida has fluctuated significantly across years and
quarterly within the year. Overall employment in the primary sectors of the industry in Florida increased by about
20 percent between 2001 and 2015 (Figures 1-3). While employment dropped significantly during the global
economic recession of 2007-10, the data show an upward trend for selected sub-sectors since 2011. In particular,
the landscape services sector of the industry grew substantially, while nursery production/manufacturing and
wholesale/retail trade have been steady or declining. These same industry trends are reflected in national
employment data for the industry, as well as dramatic seasonal fluctuation in landscape services employment
reflecting the seasonal business conditions in more temperate climates (Figure 4).
In the United States in 2013, the environmental horticulture industry contributed an estimated 2.036 million jobs,
$196.07 billion in industry output, and $120.71 billion to Gross Domestic Product (GDP) (Hodges et al., 2015). In
this same study, economic contributions of the industry in the State of Florida ranked second only to California,
with total economic contributions estimated at 142,409 jobs, output of $17.587 billion, and GDP of $10.819
billion. Compared with the earlier report (Hodges et al., 2011), the estimates in this study show increases in both
jobs and output impacts, which were estimated at 147,795 jobs and $10.0 billion in revenue.
The present study was undertaken to update the economic impact estimates for the environmental horticulture
industry in Florida in 2015, and to compare to the results of the earlier national study and previous sponsored
research studies for Florida in 2000, 2005 and 2010 (Hodges and Haydu, 2002; Hodges and Haydu, 2006; Hodges
et al, 2011).
8
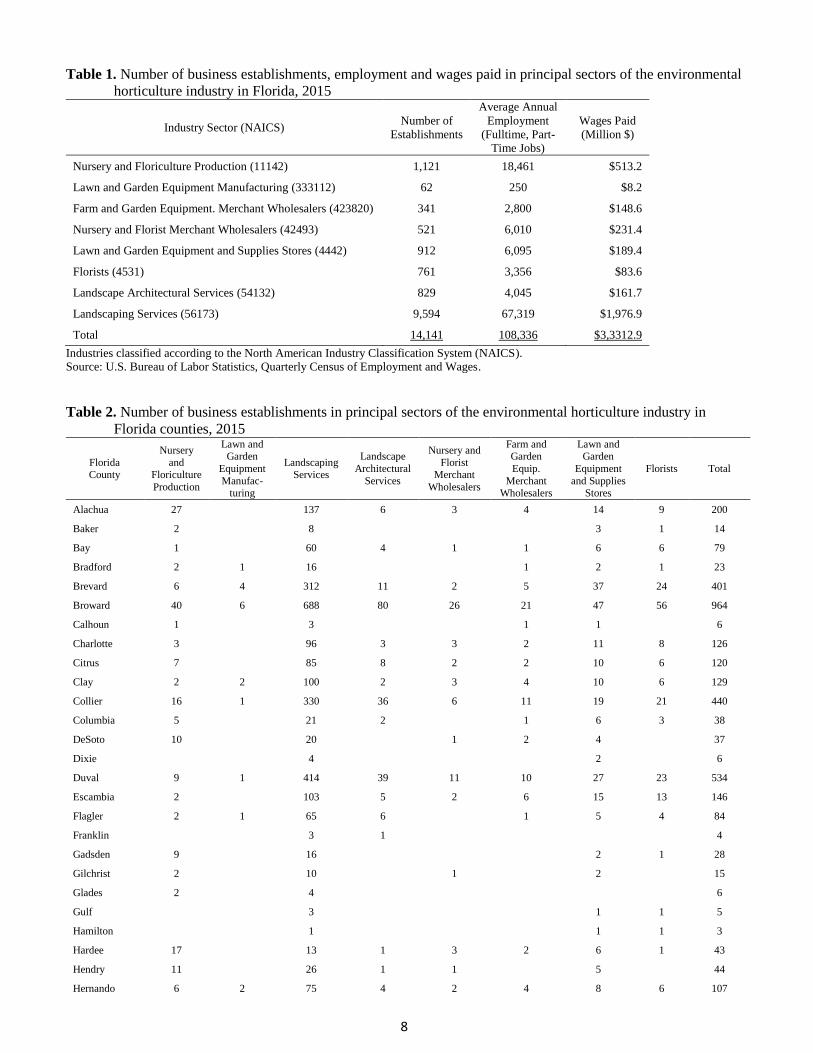
Table 1. Number of business establishments, employment and wages paid in principal sectors of the environmental
horticulture industry in Florida, 2015
Industry Sector (NAICS) Number of
Establishments
Average Annual
Employment
(Fulltime, Part-
Time Jobs)
Wages Paid
(Million $)
Nursery and Floriculture Production (11142) 1,121 18,461 $513.2
Lawn and Garden Equipment Manufacturing (333112) 62 250 $8.2
Farm and Garden Equipment. Merchant Wholesalers (423820) 341 2,800 $148.6
Nursery and Florist Merchant Wholesalers (42493) 521 6,010 $231.4
Lawn and Garden Equipment and Supplies Stores (4442) 912 6,095 $189.4
Florists (4531) 761 3,356 $83.6
Landscape Architectural Services (54132) 829 4,045 $161.7
Landscaping Services (56173) 9,594 67,319 $1,976.9
Total 14,141 108,336 $3,3312.9
Industries classified according to the North American Industry Classification System (NAICS). Source: U.S. Bureau of Labor Statistics, Quarterly Census of Employment and Wages.
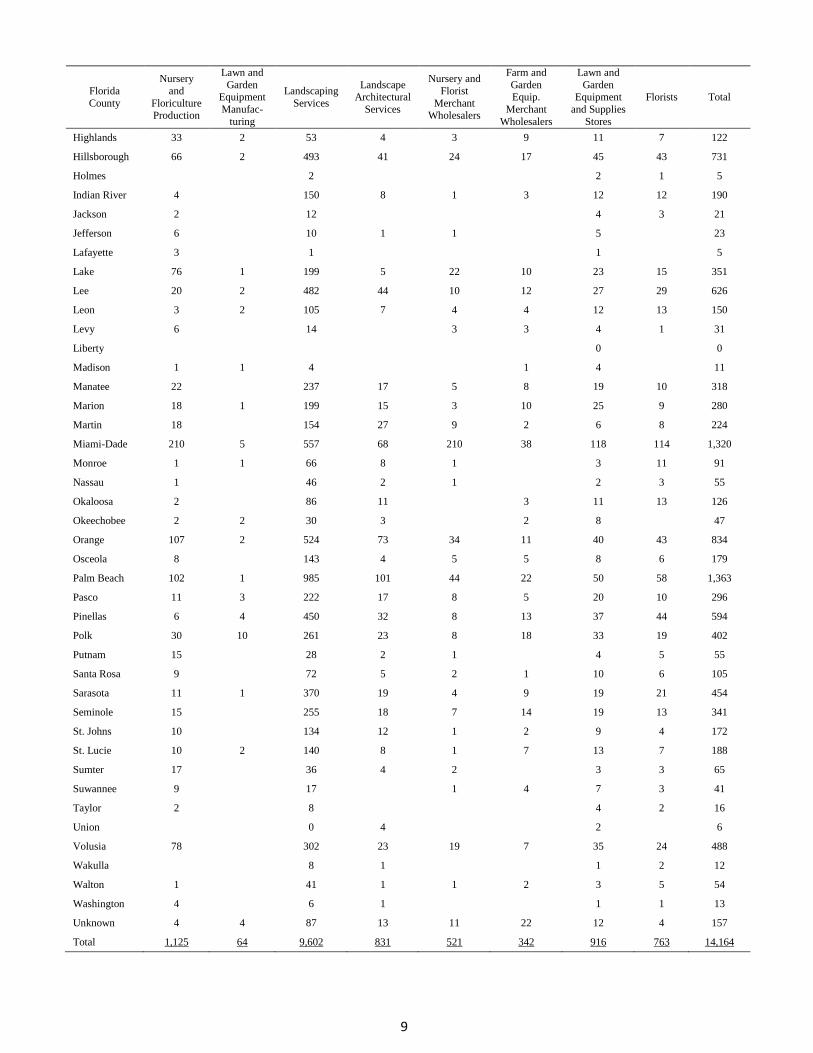
Table 2. Number of business establishments in principal sectors of the environmental horticulture industry in
Florida counties, 2015
Florida County
Nursery
and Floriculture
Production
Lawn and Garden
Equipment
Manufac-turing
Landscaping Services
Landscape
Architectural
Services
Nursery and
Florist Merchant
Wholesalers
Farm and Garden
Equip.
Merchant Wholesalers
Lawn and Garden
Equipment
and Supplies Stores
Florists Total
Alachua 27 137 6 3 4 14 9 200
Baker 2 8 3 1 14
Bay 1 60 4 1 1 6 6 79
Bradford 2 1 16 1 2 1 23
Brevard 6 4 312 11 2 5 37 24 401
Broward 40 6 688 80 26 21 47 56 964
Calhoun 1 3 1 1 6
Charlotte 3 96 3 3 2 11 8 126
Citrus 7 85 8 2 2 10 6 120
Clay 2 2 100 2 3 4 10 6 129
Collier 16 1 330 36 6 11 19 21 440
Columbia 5 21 2 1 6 3 38
DeSoto 10 20 1 2 4 37
Dixie 4 2 6
Duval 9 1 414 39 11 10 27 23 534
Escambia 2 103 5 2 6 15 13 146
Flagler 2 1 65 6 1 5 4 84
Franklin 3 1 4
Gadsden 9 16 2 1 28
Gilchrist 2 10 1 2 15
Glades 2 4 6
Gulf 3 1 1 5
Hamilton 1 1 1 3
Hardee 17 13 1 3 2 6 1 43
Hendry 11 26 1 1 5 44
Hernando 6 2 75 4 2 4 8 6 107
9
Florida
County
Nursery
and
Floriculture
Production
Lawn and
Garden Equipment
Manufac-
turing
Landscaping
Services
Landscape Architectural
Services
Nursery and
Florist
Merchant
Wholesalers
Farm and
Garden Equip.
Merchant
Wholesalers
Lawn and
Garden Equipment
and Supplies
Stores
Florists Total
Highlands 33 2 53 4 3 9 11 7 122
Hillsborough 66 2 493 41 24 17 45 43 731
Holmes 2 2 1 5
Indian River 4 150 8 1 3 12 12 190
Jackson 2 12 4 3 21
Jefferson 6 10 1 1 5 23
Lafayette 3 1 1 5
Lake 76 1 199 5 22 10 23 15 351
Lee 20 2 482 44 10 12 27 29 626
Leon 3 2 105 7 4 4 12 13 150
Levy 6 14 3 3 4 1 31
Liberty 0 0
Madison 1 1 4 1 4 11
Manatee 22 237 17 5 8 19 10 318
Marion 18 1 199 15 3 10 25 9 280
Martin 18 154 27 9 2 6 8 224
Miami-Dade 210 5 557 68 210 38 118 114 1,320
Monroe 1 1 66 8 1 3 11 91
Nassau 1 46 2 1 2 3 55
Okaloosa 2 86 11 3 11 13 126
Okeechobee 2 2 30 3 2 8 47
Orange 107 2 524 73 34 11 40 43 834
Osceola 8 143 4 5 5 8 6 179
Palm Beach 102 1 985 101 44 22 50 58 1,363
Pasco 11 3 222 17 8 5 20 10 296
Pinellas 6 4 450 32 8 13 37 44 594
Polk 30 10 261 23 8 18 33 19 402
Putnam 15 28 2 1 4 5 55
Santa Rosa 9 72 5 2 1 10 6 105
Sarasota 11 1 370 19 4 9 19 21 454
Seminole 15 255 18 7 14 19 13 341
St. Johns 10 134 12 1 2 9 4 172
St. Lucie 10 2 140 8 1 7 13 7 188
Sumter 17 36 4 2 3 3 65
Suwannee 9 17 1 4 7 3 41
Taylor 2 8 4 2 16
Union 0 4 2 6
Volusia 78 302 23 19 7 35 24 488
Wakulla 8 1 1 2 12
Walton 1 41 1 1 2 3 5 54
Washington 4 6 1 1 1 13
Unknown 4 4 87 13 11 22 12 4 157
Total 1,125 64 9,602 831 521 342 916 763 14,164
10
Table 3. Employment by principal sectors of the environmental horticulture industry in Florida counties, 2015
County
Nursery
and
Floriculture Production
Lawn and
Garden
Equipment
Manufac-
turing
Landscaping
Services
Landscape
Architec-
tural Services
Nursery and
Florist
Merchant Wholesalers
Farm and
Garden
Equip.
Merchant
Wholesalers
Lawn and
Garden
Equipment
and Supplies
Stores
Florists Total
Full-time and Part-time Jobs
Alachua 292 672 34 0 28 62 53 1,141
Baker 0 40 23 0 63
Bay 0 514 0 0 0 42 26 582
Bradford 0 0 38 0 0 0 38
Brevard 37 8 1,463 19 0 0 207 108 1,842
Broward 0 38 4,808 352 75 198 261 311 6,043
Calhoun 0 0 0 0 0
Charlotte 59 396 0 0 0 60 48 563
Citrus 14 386 15 0 0 40 20 475
Clay 0 0 459 0 5 28 90 24 606
Collier 0 0 3,380 126 10 75 201 77 3,869
Columbia 0 137 0 0 51 0 188
DeSoto 263 107 0 0 55 425
Dixie 16 0 16
Duval 0 0 2,467 220 118 84 267 160 3,316
Escambia 0 630 0 0 112 106 114 962
Flagler 0 0 1,033 73 0 21 13 1,140
Franklin 5 0 5
Gadsden 0 134 0 0 134
Gilchrist 0 26 0 0 26
Glades 0 0 0
Gulf 21 0 0 21
Hamilton 0 0 0 0
Hardee 378 53 0 0 0 0 0 431
Hendry 242 47 0 0 38 327
Hernando 65 0 392 9 0 7 37 43 553
Highlands 596 0 166 0 0 42 131 29 964
Hillsborough 991 0 4,065 182 168 124 338 166 6,034
Holmes 0 0 0 0
Indian River 0 990 69 0 17 123 38 1,237
Jackson 0 33 28 0 61
Jefferson 118 0 0 0 44 162
Lafayette 0 0 0 0
Lake 0 0 1,698 0 297 79 121 96 2,291
Lee 0 0 3,732 224 109 73 170 123 4,431
Leon 7 0 626 14 27 39 269 44 1,026
Levy 84 28 0 0 29 0 141
Liberty 0 0
Madison 0 0 0 0 22 22
Manatee 0 1,605 107 60 62 150 39 2,023
Marion 161 0 900 259 6 160 192 34 1,712
Martin 163 1,345 105 165 0 21 28 1,827
Miami-Dade 5,065 0 3,489 414 3,611 225 624 549 13,977
11
County
Nursery
and Floriculture
Production
Lawn and Garden
Equipment
Manufac-
turing
Landscaping Services
Landscape
Architec-tural
Services
Nursery and
Florist Merchant
Wholesalers
Farm and Garden
Equip.
Merchant
Wholesalers
Lawn and Garden
Equipment
and Supplies
Stores
Florists Total
Full-time and Part-time Jobs
Monroe 0 0 284 18 0 6 30 338
Nassau 0 253 0 0 0 11 264
Okaloosa 0 472 25 0 71 43 611
Okeechobee 0 0 146 0 0 51 197
Orange 0 0 5,497 277 239 97 241 222 6,573
Osceola 83 723 0 65 0 49 20 940
Palm Beach 0 0 7,954 580 224 256 364 234 9,612
Pasco 186 0 1,348 49 21 26 93 38 1,761
Pinellas 22 0 2,436 96 54 77 172 136 2,993
Polk 477 0 1,763 62 33 191 235 74 2,835
Putnam 163 111 0 0 37 8 319
Santa Rosa 110 326 16 0 0 88 29 569
Sarasota 0 0 2,720 91 50 163 121 104 3,249
Seminole 0 2,397 65 86 169 141 38 2,896
St. Johns 114 846 29 0 0 78 24 1,091
St. Lucie 0 0 822 49 0 86 50 27 1,034
Sumter 291 382 21 0 0 17 711
Suwannee 0 112 0 42 54 8 216
Taylor 0 46 22 0 68
Union 0 24 0 24
Volusia 1,238 1,599 41 185 0 168 79 3,310
Wakulla 54 0 0 0 54
Walton 0 476 0 0 0 21 19 516
Washington 0 5 0 0 0 5
Unknown 0 0 505 63 19 77 22 7 693
Total 11,219 46 67,178 3,728 5,627 2,537 5,907 3,311 99,553
Source: U.S. Bureau of Labor Statistics, Quarterly Census of Employment and Wages.
Data not available for some counties and sectors due to nondisclosure rules.
12
Figure 1. Trend in Florida environmental horticulture industry sector employment, quarterly 2001-15
Source: U.S. Bureau of Labor Statistics, Quarterly Census of Employment and Wages
Figure 2. Trend in Florida environmental horticulture industry group employment, quarterly 2001-15
Source: U.S. Bureau of Labor Statistics, Quarterly Census of Employment and Wages
13
Figure 3. Trend in Florida environmental horticulture industry group employment percentage change, quarterly
2001-15
Source: U.S. Bureau of Labor Statistics, Quarterly Census of Employment and Wages
Figure 4. Trend in United States environmental horticulture industry group employment percentage change,
quarterly 2001-15
Source: U.S. Bureau of Labor Statistics, Quarterly Census of Employment and Wages
14
Methods
Estimation of the economic value of Florida’s environmental horticultural industry was based upon information
obtained from mail and internet surveys of nursery growers, landscape service firms, horticultural wholesale
distributors and retailers, and allied horticultural suppliers conducted during April-June, 2016. Information was
collected on annual sales, capital investment, employment, types of goods or services offered, production or
wholesale/retail area, regional trade, types of customers and threats to the industry. Survey information represented
business results for calendar year 2015 or the most recently completed fiscal year. All respondents were qualified
as having active businesses in 2015. Information on annual sales was collected as either a specific value or a range
of values. In addition, an open-ended question solicited statements by respondents regarding the impacts of their
business and general issues in the industry. The internet and mail survey questionnaires were nearly identical
except for certain qualifying questions in the internet survey. A copy of the questionnaire for the mail survey is
presented in Appendix A. The questionnaire was prepared as a 5.5 by 8.5-inch booklet with full-color cover as
shown on the title page of this report. The survey questionnaire, informed consent statement and survey
administration protocol was approved by the University of Florida Institutional Review Board for compliance with
federal standards for ethical conduct of human subjects research. No compensation was provided to survey
participants.
Lists of firms for the survey were obtained from the certified nursery and stock dealer lists maintained by the
Florida Department of Agriculture, Division of Plant Industry. All firms operating in Florida that produce or sell
live plant products are legally required to register with this agency, so the lists may be considered comprehensive.
The eligible population of nursery firms was considered to be those firms classified as “wholesale” or “wholesale
and retail” operations that had an inventory of at least 1,000 plants. Approximately 3,175 very small firms with
less than 1,000 plants in inventory were assumed to be noncommercial entities, and were excluded from the
survey. The list of stock dealers encompasses landscape service firms. In addition, a list of members of the Florida
Nursery, Growers and Landscape Association (FNGLA) was used to identify allied industry firms and confirm
contact information. All lists were combined and screened for duplicates, and in some cases, information was
filled-in from different sources. All firms with listed email addresses received the internet version of the survey,
while firms without email addresses received the mail version. Every effort was made to avoid duplicate contacts
of firms via both mail and email. The assembled lists contained a total of 10,440 unique firms, including 5,766
firms contacted via email and 4,674 firms contacted via regular USPS mail, as shown in Table 5.
For the mail survey, respondents received a copy of the survey booklet, together with a postage-paid return
envelope and a cover letter from the investigators explaining the purposes of the survey. Two complete mailings of
the survey were made during the first weeks of April and May, 2016, followed one week later by reminder
postcards. In addition, an introductory postcard was sent one week before the first survey mailing, in keeping with
best practices for survey research (Dillman). Firms selected for the internet survey were contacted via email at the
same time as the mail survey, and were provided with an electronic link to the online survey at the SurveyMonkey
website (www.SurveyMonkey.com). Reminder email messages were sent to firms that had not responded to the
survey two, four and eight weeks after the initial contact. As required by law, firms choosing to “opt out” of the
internet survey were removed from the mailing list and not contacted further. Mail survey respondents were
identified by a code number on the survey booklet for quality control purposes. In cases where duplicate responses
were received from the same firm, the survey with more complete information was used.
A total of 1,546 firms provided usable responses to the surveys, including 469 (30%) via mail and 1,077 (70%) via
internet, representing a response rate of 14.8 percent, which is typical for contemporary mail and internet surveys.
Each respondent was classified according to the primary type of business activity and firm size class, based on the
15
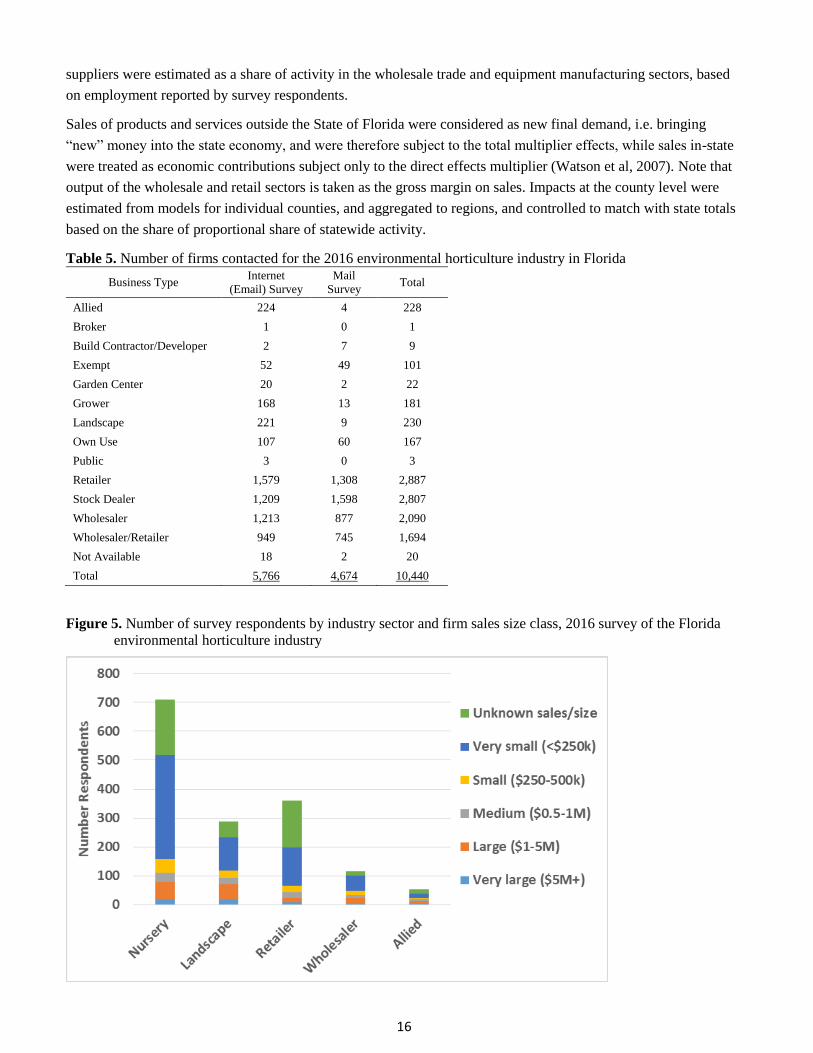
total annual sales reported and the percentage of sales in different business lines, as summarized in Table 6. The
survey sample included 710 nursery producers, 287 landscape service firms, 361 horticultural retailers, 116
wholesalers, and 54 allied suppliers, plus a small number that could not be classified (Figure 5). Over 40 percent of
respondents were considered small or very small businesses, with annual sales less than $500,000, while 10
percent were classified as large, with sales of $1.0 to $4.9 million, and 3.3 percent were very large ($5M+). Over
70 percent of respondents reported key information on annual sales, nearly 80 percent reported employment, and
over 30 percent reported capital investment made in 2015. Three quarters (75%) of respondents were the owners of
the firm, and almost 10 percent were managers, as well as other company positions such as Grower, Chief
Executive Officer, Chief Financial Officer, Chief Operating Officer, and Administrative Assistant (Table 7).
Descriptive statistics were computed for each survey variable, including the number of respondents, mean
(average), and sum of sample values. The annual sales for each firm were taken as the specific value reported or
estimated at the midpoint of the range selected. Sales of specific products or services, to types of customers, and to
different market areas were estimated as a percentage of total sales for each respondent. The total value of sales
and employment in each industry sector were estimated from the mean of the survey sample multiplied by the
population of firms.
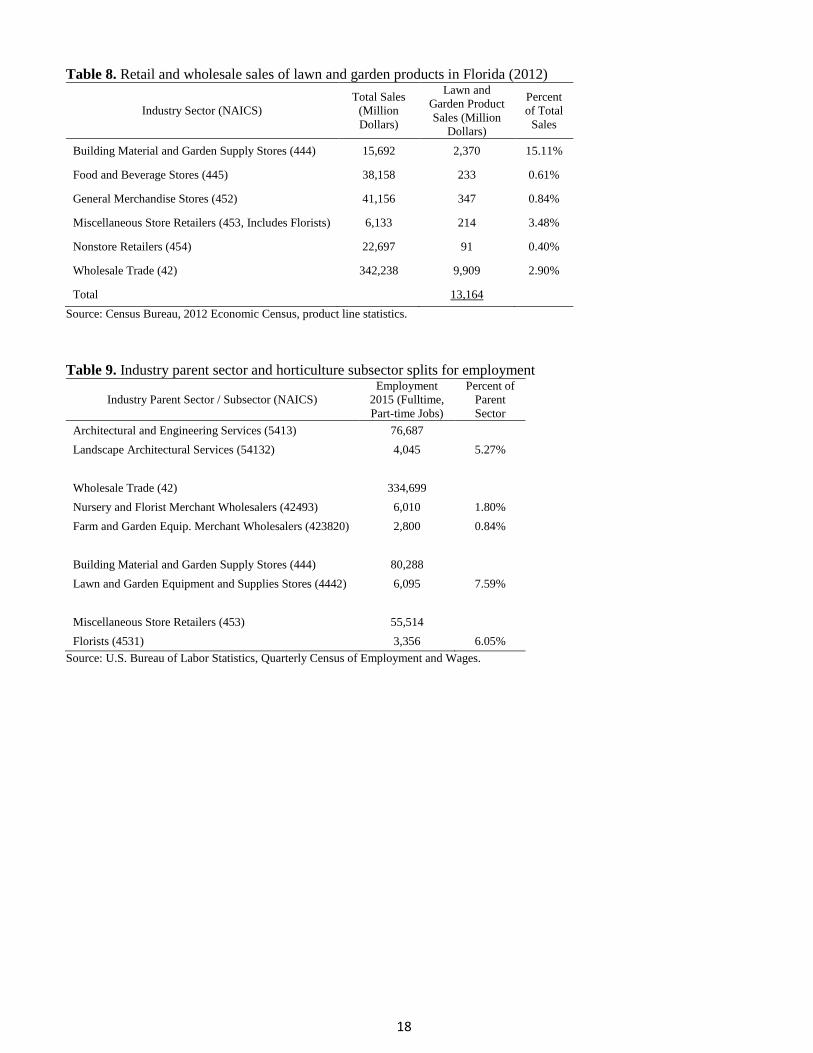
For the horticultural wholesaler and retailer sectors, additional information was compiled on sales of lawn and
garden products from the 2012 Economic Census, Product Line Statistics, as shown in Table 8. Gross sales for five
selected retail sectors and the wholesale trade sector were $13.164 billion. These sales represented .40 to 15.1
percent of the total sales within each sector, and these percentages were used to estimate the share of total
economic activity in these sectors.
Economic impacts of the environmental horticulture industry in 2015 were estimated using regional economic
models for the State of Florida and each county developed with the IMPLAN software and 2014 state/county
database (Implan Group, LLC). The IMPLAN databases consist of a set of socioeconomic accounts that represent
the structure of the national, state and local economy in terms of transactions between households (10 income
groups), government institutions, and 536 industry sectors classified according to the North American Industry
Classification System (NAICS). IMPLAN models were constructed for Florida with all social accounts included
and using the Regional Purchase Coefficient model specification. The IMPLAN models measure the economy in
terms of commodity production and consumption, industry output or revenues, value added (Gross Domestic
Product), employment (full-time and part-time jobs), labor and property income, imports and exports, transfer
payments, and taxes. IMPLAN estimates economic multipliers for each industry sector, which reflect the direct
employment, revenues or spending (direct effects), as well as industry supply chain activity (indirect effects) and
respending of income by households and governments (induced effects), and the total economic impact is the sum
of direct, indirect and induced multiplier effects. The magnitude of the multipliers represents the strength of
linkages in the regional economy to other sectors and institutions, and the share of total inputs provided to industry
firms by other businesses within the region.
Economic impacts were estimated using information in the IMPLAN model for each sector. Values for nursery and
floriculture production, lawn and garden equipment manufacturing, and landscaping services were used as is, while
values for the wholesale and retail sectors were split according to the share of employment within parent industry
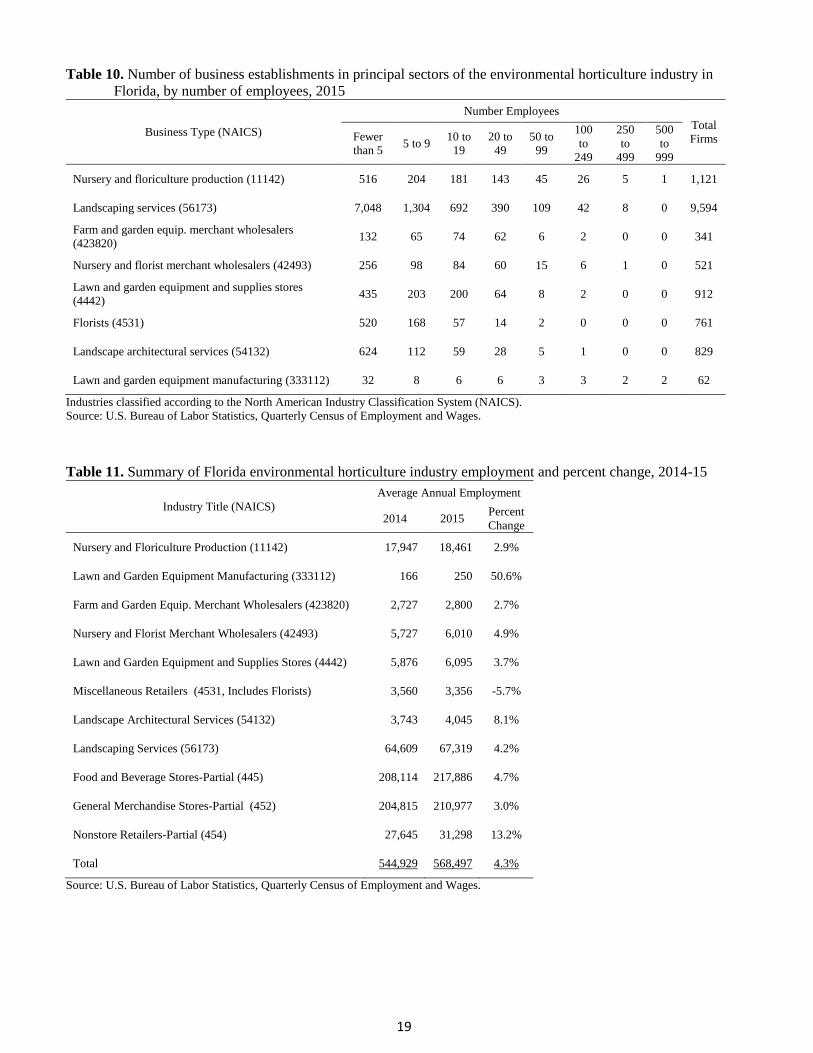
sectors, as shown in Table 9. The distribution of firms by number of employees was used to extrapolate survey
data to represent all firms in the State (Table 10). In addition, model values for 2014 were extrapolated to 2015
based on the change in direct employment within each sector. All sectors showed positive change across these two
years, except Miscellaneous Retailers, which includes Florists (Table 11). Economic impacts of allied industry
16
suppliers were estimated as a share of activity in the wholesale trade and equipment manufacturing sectors, based
on employment reported by survey respondents.
Sales of products and services outside the State of Florida were considered as new final demand, i.e. bringing
“new” money into the state economy, and were therefore subject to the total multiplier effects, while sales in-state
were treated as economic contributions subject only to the direct effects multiplier (Watson et al, 2007). Note that
output of the wholesale and retail sectors is taken as the gross margin on sales. Impacts at the county level were
estimated from models for individual counties, and aggregated to regions, and controlled to match with state totals
based on the share of proportional share of statewide activity.
Table 5. Number of firms contacted for the 2016 environmental horticulture industry in Florida
Business Type Internet
(Email) Survey
Survey Total
Allied 224 4 228
Broker 1 0 1
Build Contractor/Developer 2 7 9
Exempt 52 49 101
Garden Center 20 2 22
Grower 168 13 181
Landscape 221 9 230
Own Use 107 60 167
Public 3 0 3
Retailer 1,579 1,308 2,887
Stock Dealer 1,209 1,598 2,807
Wholesaler 1,213 877 2,090
Wholesaler/Retailer 949 745 1,694
Not Available 18 2 20
Total 5,766 4,674 10,440
Figure 5. Number of survey respondents by industry sector and firm sales size class, 2016 survey of the Florida
environmental horticulture industry
17
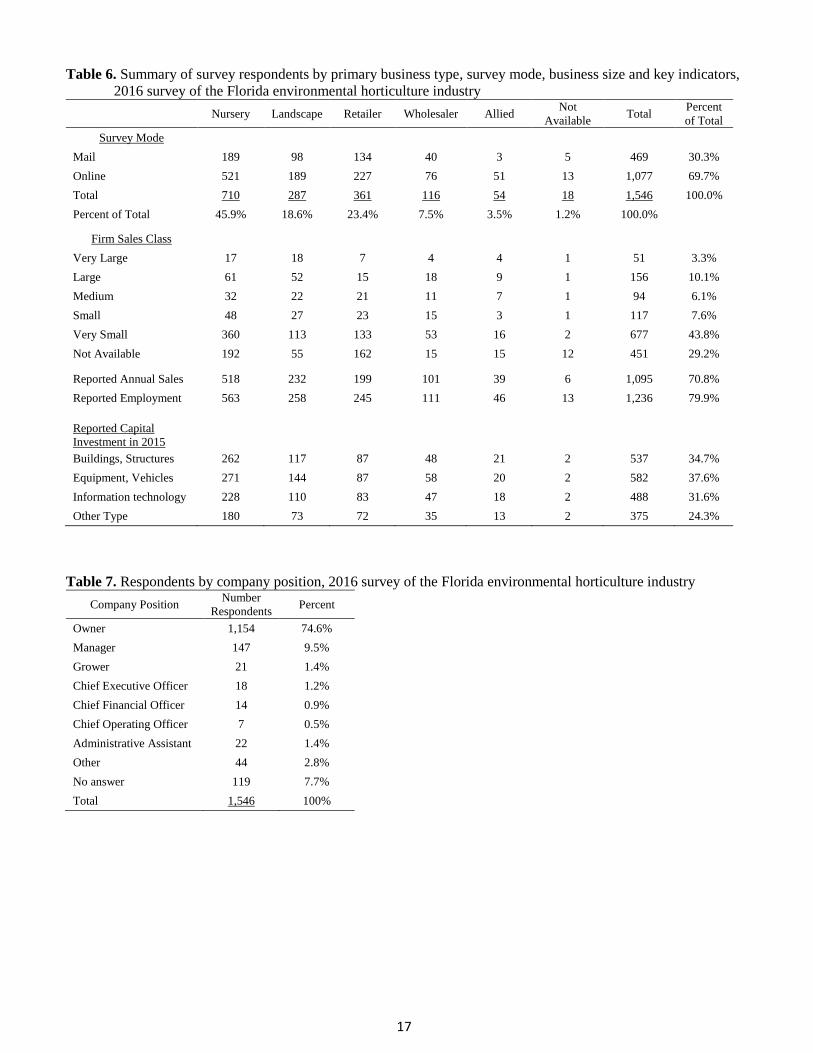
Table 6. Summary of survey respondents by primary business type, survey mode, business size and key indicators,
2016 survey of the Florida environmental horticulture industry
Nursery Landscape Retailer Wholesaler Allied Not
Available Total
Percent
of Total
Survey Mode
Mail 189 98 134 40 3 5 469 30.3%
Online 521 189 227 76 51 13 1,077 69.7%
Total 710 287 361 116 54 18 1,546 100.0%
Percent of Total 45.9% 18.6% 23.4% 7.5% 3.5% 1.2% 100.0%
Firm Sales Class
Very Large 17 18 7 4 4 1 51 3.3%
Large 61 52 15 18 9 1 156 10.1%
Medium 32 22 21 11 7 1 94 6.1%
Small 48 27 23 15 3 1 117 7.6%
Very Small 360 113 133 53 16 2 677 43.8%
Not Available 192 55 162 15 15 12 451 29.2%
Reported Annual Sales 518 232 199 101 39 6 1,095 70.8%
Reported Employment 563 258 245 111 46 13 1,236 79.9%
Reported Capital
Investment in 2015
Buildings, Structures 262 117 87 48 21 2 537 34.7%
Equipment, Vehicles 271 144 87 58 20 2 582 37.6%
Information technology 228 110 83 47 18 2 488 31.6%
Other Type 180 73 72 35 13 2 375 24.3%
Table 7. Respondents by company position, 2016 survey of the Florida environmental horticulture industry Company Position
Number
Respondents Percent
Owner 1,154 74.6%
Manager 147 9.5%
Grower 21 1.4%
Chief Executive Officer 18 1.2%
Chief Financial Officer 14 0.9%
Chief Operating Officer 7 0.5%
Administrative Assistant 22 1.4%
Other 44 2.8%
No answer 119 7.7%
Total 1,546 100%
18
Table 8. Retail and wholesale sales of lawn and garden products in Florida (2012)
Industry Sector (NAICS)
Total Sales
(Million
Dollars)
Lawn and
Garden Product
Sales (Million
Dollars)
Percent
of Total
Sales
Building Material and Garden Supply Stores (444) 15,692 2,370 15.11%
Food and Beverage Stores (445) 38,158 233 0.61%
General Merchandise Stores (452) 41,156 347 0.84%
Miscellaneous Store Retailers (453, Includes Florists) 6,133 214 3.48%
Nonstore Retailers (454) 22,697 91 0.40%
Wholesale Trade (42) 342,238 9,909 2.90%
Total 13,164
Source: Census Bureau, 2012 Economic Census, product line statistics.
Table 9. Industry parent sector and horticulture subsector splits for employment
Industry Parent Sector / Subsector (NAICS)
Employment
2015 (Fulltime,
Part-time Jobs)
Percent of
Parent
Sector
Architectural and Engineering Services (5413) 76,687
Landscape Architectural Services (54132) 4,045 5.27%
Wholesale Trade (42) 334,699
Nursery and Florist Merchant Wholesalers (42493) 6,010 1.80%
Farm and Garden Equip. Merchant Wholesalers (423820) 2,800 0.84%
Building Material and Garden Supply Stores (444) 80,288
Lawn and Garden Equipment and Supplies Stores (4442) 6,095 7.59%
Miscellaneous Store Retailers (453) 55,514
Florists (4531) 3,356 6.05%
Source: U.S. Bureau of Labor Statistics, Quarterly Census of Employment and Wages.
19
Table 10. Number of business establishments in principal sectors of the environmental horticulture industry in
Florida, by number of employees, 2015
Business Type (NAICS)
Number Employees
Total
Firms Fewer
than 5 5 to 9
10 to
19
20 to
49
50 to
99
100
to
249
250
to
499
500
to
999
Nursery and floriculture production (11142) 516 204 181 143 45 26 5 1 1,121
Landscaping services (56173) 7,048 1,304 692 390 109 42 8 0 9,594
Farm and garden equip. merchant wholesalers
(423820) 132 65 74 62 6 2 0 0 341
Nursery and florist merchant wholesalers (42493) 256 98 84 60 15 6 1 0 521
Lawn and garden equipment and supplies stores
(4442) 435 203 200 64 8 2 0 0 912
Florists (4531) 520 168 57 14 2 0 0 0 761
Landscape architectural services (54132) 624 112 59 28 5 1 0 0 829
Lawn and garden equipment manufacturing (333112) 32 8 6 6 3 3 2 2 62
Industries classified according to the North American Industry Classification System (NAICS).
Source: U.S. Bureau of Labor Statistics, Quarterly Census of Employment and Wages.
Table 11. Summary of Florida environmental horticulture industry employment and percent change, 2014-15
Industry Title (NAICS)
Average Annual Employment
2014 2015 Percent
Change
Nursery and Floriculture Production (11142) 17,947 18,461 2.9%
Lawn and Garden Equipment Manufacturing (333112) 166 250 50.6%
Farm and Garden Equip. Merchant Wholesalers (423820) 2,727 2,800 2.7%
Nursery and Florist Merchant Wholesalers (42493) 5,727 6,010 4.9%
Lawn and Garden Equipment and Supplies Stores (4442) 5,876 6,095 3.7%
Miscellaneous Retailers (4531, Includes Florists) 3,560 3,356 -5.7%
Landscape Architectural Services (54132) 3,743 4,045 8.1%
Landscaping Services (56173) 64,609 67,319 4.2%
Food and Beverage Stores-Partial (445) 208,114 217,886 4.7%
General Merchandise Stores-Partial (452) 204,815 210,977 3.0%
Nonstore Retailers-Partial (454) 27,645 31,298 13.2%
Total 544,929 568,497 4.3%
Source: U.S. Bureau of Labor Statistics, Quarterly Census of Employment and Wages.
20
Survey Results
Industry Sector Employment and Sales
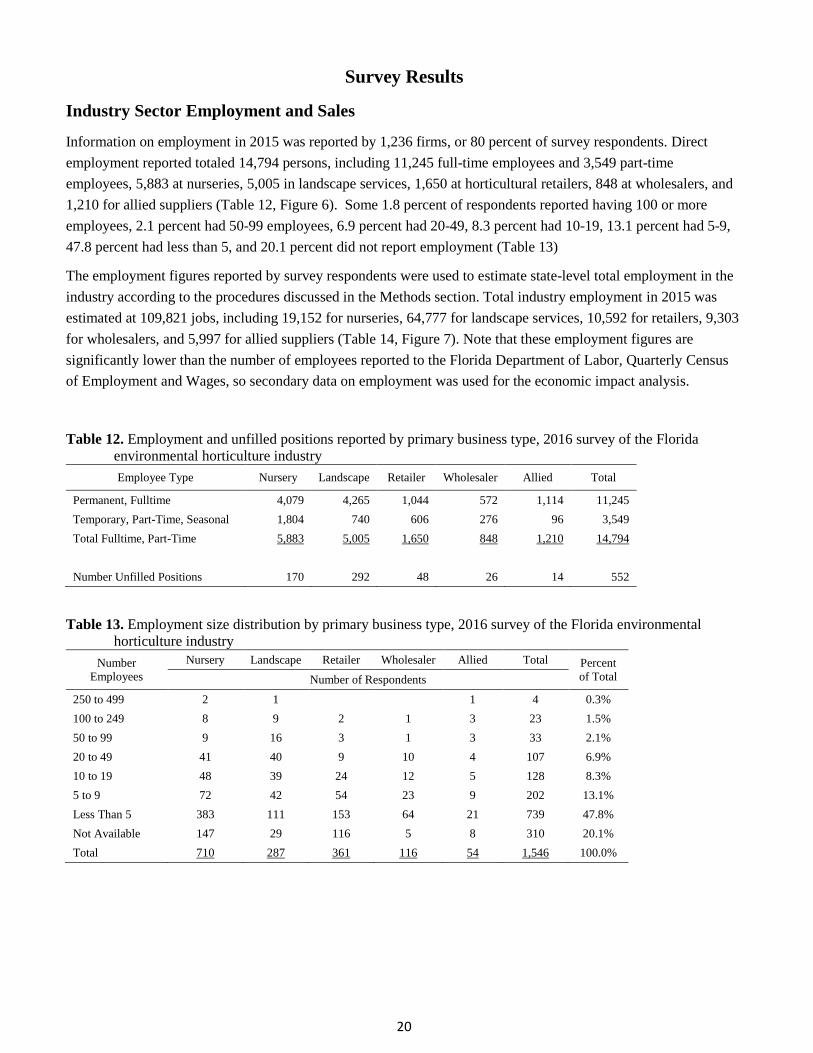
Information on employment in 2015 was reported by 1,236 firms, or 80 percent of survey respondents. Direct
employment reported totaled 14,794 persons, including 11,245 full-time employees and 3,549 part-time
employees, 5,883 at nurseries, 5,005 in landscape services, 1,650 at horticultural retailers, 848 at wholesalers, and
1,210 for allied suppliers (Table 12, Figure 6). Some 1.8 percent of respondents reported having 100 or more
employees, 2.1 percent had 50-99 employees, 6.9 percent had 20-49, 8.3 percent had 10-19, 13.1 percent had 5-9,
47.8 percent had less than 5, and 20.1 percent did not report employment (Table 13)
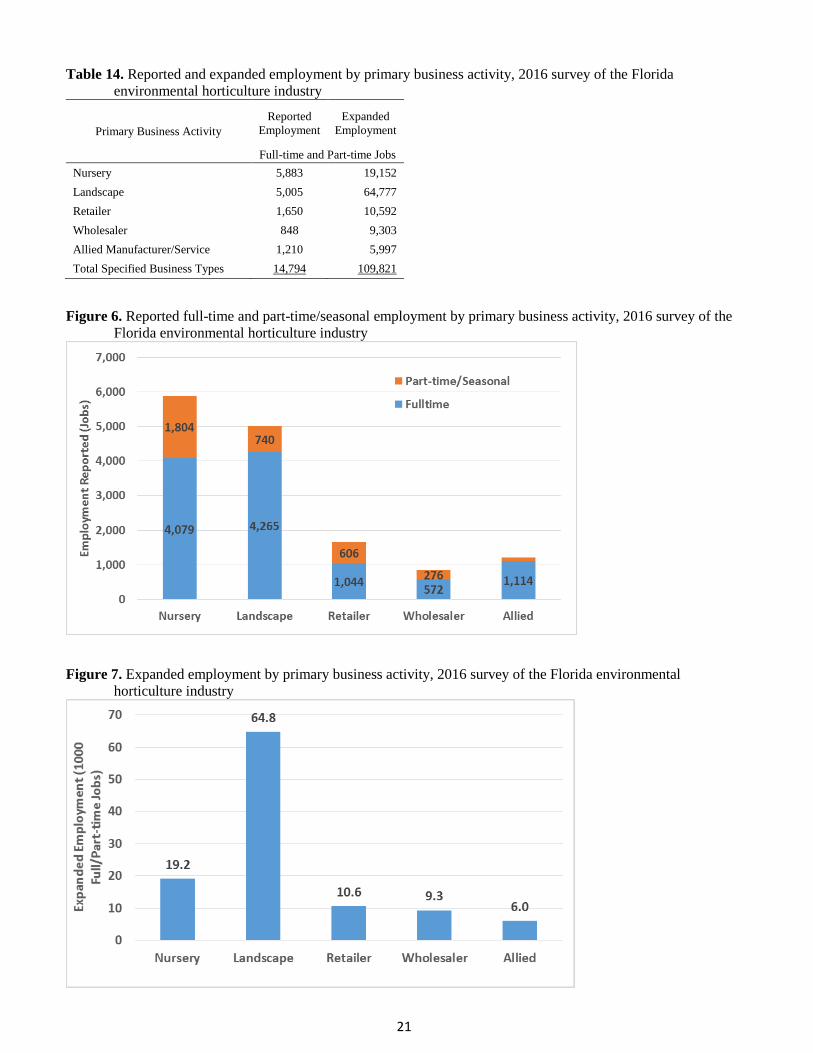
The employment figures reported by survey respondents were used to estimate state-level total employment in the
industry according to the procedures discussed in the Methods section. Total industry employment in 2015 was
estimated at 109,821 jobs, including 19,152 for nurseries, 64,777 for landscape services, 10,592 for retailers, 9,303
for wholesalers, and 5,997 for allied suppliers (Table 14, Figure 7). Note that these employment figures are
significantly lower than the number of employees reported to the Florida Department of Labor, Quarterly Census
of Employment and Wages, so secondary data on employment was used for the economic impact analysis.
Table 12. Employment and unfilled positions reported by primary business type, 2016 survey of the Florida
environmental horticulture industry Employee Type Nursery Landscape Retailer Wholesaler Allied Total
Permanent, Fulltime 4,079 4,265 1,044 572 1,114 11,245
Temporary, Part-Time, Seasonal 1,804 740 606 276 96 3,549
Total Fulltime, Part-Time 5,883 5,005 1,650 848 1,210 14,794
Number Unfilled Positions 170 292 48 26 14 552
Table 13. Employment size distribution by primary business type, 2016 survey of the Florida environmental
horticulture industry Number
Employees
Nursery Landscape Retailer Wholesaler Allied Total Percent
of Total Number of Respondents
250 to 499 2 1 1 4 0.3%
100 to 249 8 9 2 1 3 23 1.5%
50 to 99 9 16 3 1 3 33 2.1%
20 to 49 41 40 9 10 4 107 6.9%
10 to 19 48 39 24 12 5 128 8.3%
5 to 9 72 42 54 23 9 202 13.1%
Less Than 5 383 111 153 64 21 739 47.8%
Not Available 147 29 116 5 8 310 20.1%
Total 710 287 361 116 54 1,546 100.0%
21
Table 14. Reported and expanded employment by primary business activity, 2016 survey of the Florida
environmental horticulture industry
Primary Business Activity
Reported
Employment
Expanded
Employment
Full-time and Part-time Jobs
Nursery 5,883 19,152
Landscape 5,005 64,777
Retailer 1,650 10,592
Wholesaler 848 9,303
Allied Manufacturer/Service 1,210 5,997
Total Specified Business Types 14,794 109,821
Figure 6. Reported full-time and part-time/seasonal employment by primary business activity, 2016 survey of the
Florida environmental horticulture industry
Figure 7. Expanded employment by primary business activity, 2016 survey of the Florida environmental
horticulture industry
22
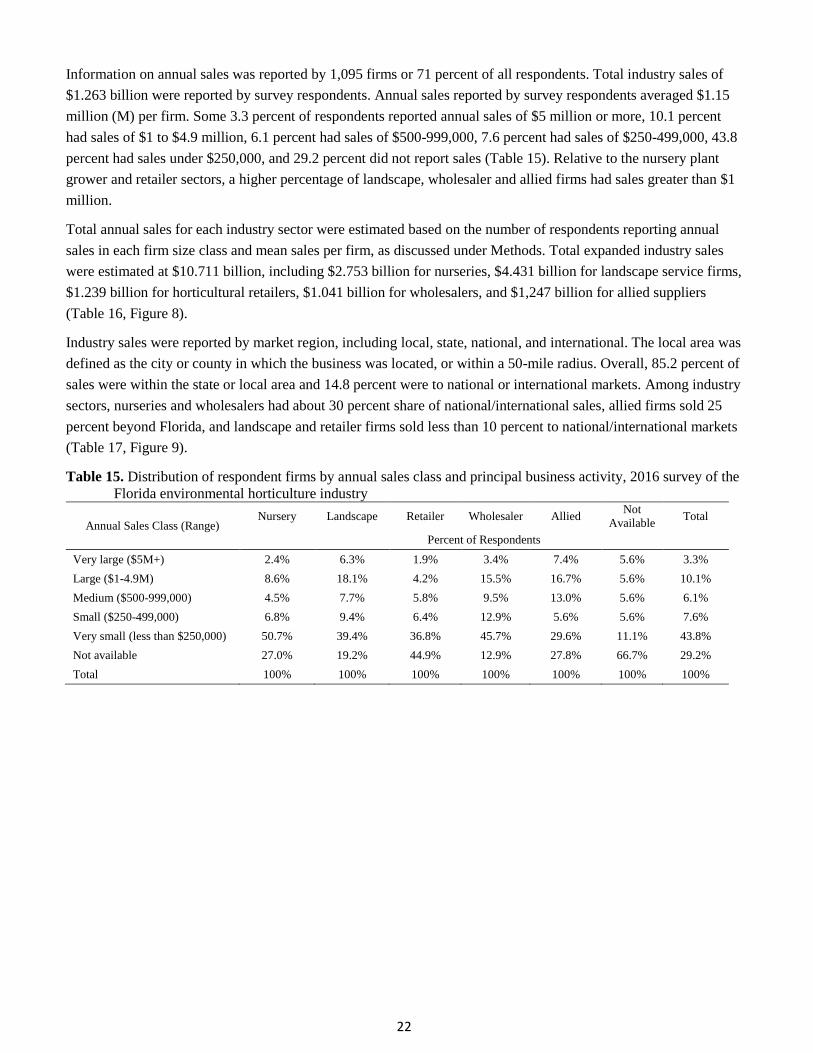
Information on annual sales was reported by 1,095 firms or 71 percent of all respondents. Total industry sales of
$1.263 billion were reported by survey respondents. Annual sales reported by survey respondents averaged $1.15
million (M) per firm. Some 3.3 percent of respondents reported annual sales of $5 million or more, 10.1 percent
had sales of $1 to $4.9 million, 6.1 percent had sales of $500-999,000, 7.6 percent had sales of $250-499,000, 43.8
percent had sales under $250,000, and 29.2 percent did not report sales (Table 15). Relative to the nursery plant
grower and retailer sectors, a higher percentage of landscape, wholesaler and allied firms had sales greater than $1
million.
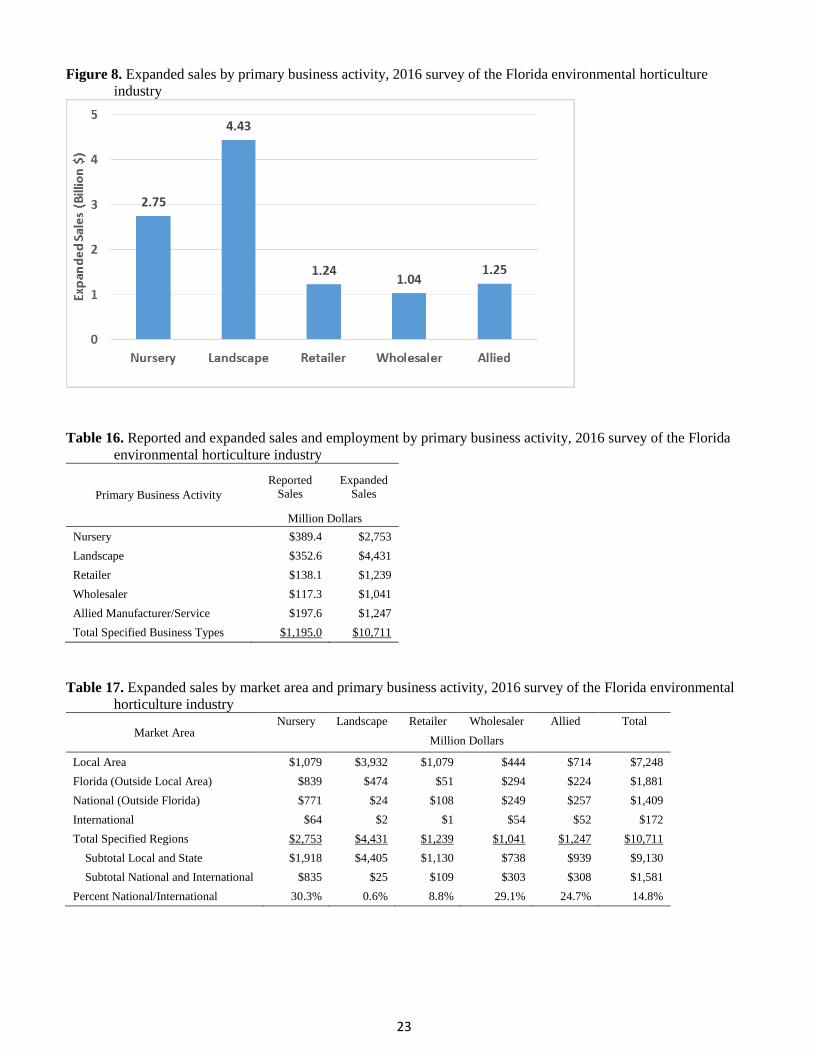
Total annual sales for each industry sector were estimated based on the number of respondents reporting annual
sales in each firm size class and mean sales per firm, as discussed under Methods. Total expanded industry sales
were estimated at $10.711 billion, including $2.753 billion for nurseries, $4.431 billion for landscape service firms,
$1.239 billion for horticultural retailers, $1.041 billion for wholesalers, and $1,247 billion for allied suppliers
(Table 16, Figure 8).
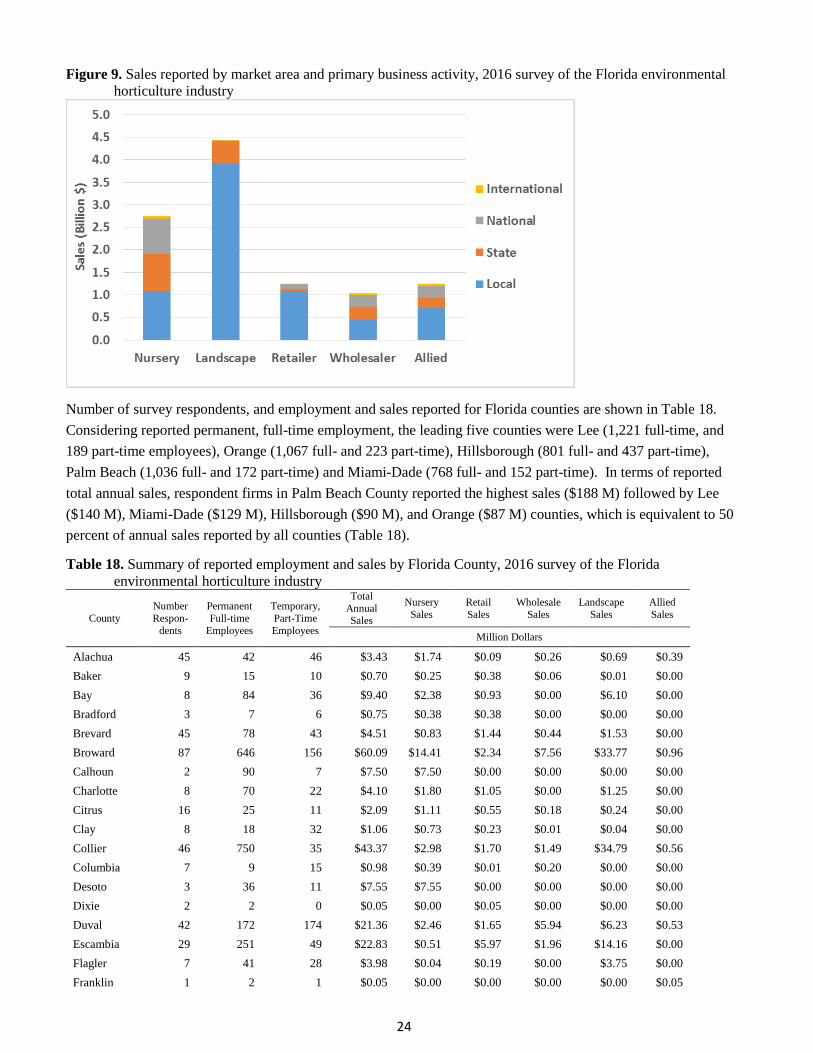
Industry sales were reported by market region, including local, state, national, and international. The local area was
defined as the city or county in which the business was located, or within a 50-mile radius. Overall, 85.2 percent of
sales were within the state or local area and 14.8 percent were to national or international markets. Among industry
sectors, nurseries and wholesalers had about 30 percent share of national/international sales, allied firms sold 25
percent beyond Florida, and landscape and retailer firms sold less than 10 percent to national/international markets
(Table 17, Figure 9).
Table 15. Distribution of respondent firms by annual sales class and principal business activity, 2016 survey of the
Florida environmental horticulture industry
Annual Sales Class (Range) Nursery Landscape Retailer Wholesaler Allied
Not
Available Total
Percent of Respondents
Very large ($5M+) 2.4% 6.3% 1.9% 3.4% 7.4% 5.6% 3.3%
Large ($1-4.9M) 8.6% 18.1% 4.2% 15.5% 16.7% 5.6% 10.1%
Medium ($500-999,000) 4.5% 7.7% 5.8% 9.5% 13.0% 5.6% 6.1%
Small ($250-499,000) 6.8% 9.4% 6.4% 12.9% 5.6% 5.6% 7.6%
Very small (less than $250,000) 50.7% 39.4% 36.8% 45.7% 29.6% 11.1% 43.8%
Not available 27.0% 19.2% 44.9% 12.9% 27.8% 66.7% 29.2%
Total 100% 100% 100% 100% 100% 100% 100%
23
Figure 8. Expanded sales by primary business activity, 2016 survey of the Florida environmental horticulture
industry
Table 16. Reported and expanded sales and employment by primary business activity, 2016 survey of the Florida
environmental horticulture industry
Primary Business Activity
Reported
Sales
Expanded
Sales
Million Dollars
Nursery $389.4 $2,753
Landscape $352.6 $4,431
Retailer $138.1 $1,239
Wholesaler $117.3 $1,041
Allied Manufacturer/Service $197.6 $1,247
Total Specified Business Types $1,195.0 $10,711
Table 17. Expanded sales by market area and primary business activity, 2016 survey of the Florida environmental
horticulture industry
Market Area Nursery Landscape Retailer Wholesaler Allied Total
Million Dollars
Local Area $1,079 $3,932 $1,079 $444 $714 $7,248
Florida (Outside Local Area) $839 $474 $51 $294 $224 $1,881
National (Outside Florida) $771 $24 $108 $249 $257 $1,409
International $64 $2 $1 $54 $52 $172
Total Specified Regions $2,753 $4,431 $1,239 $1,041 $1,247 $10,711
Subtotal Local and State $1,918 $4,405 $1,130 $738 $939 $9,130
Subtotal National and International $835 $25 $109 $303 $308 $1,581
Percent National/International 30.3% 0.6% 8.8% 29.1% 24.7% 14.8%
24
Figure 9. Sales reported by market area and primary business activity, 2016 survey of the Florida environmental
horticulture industry
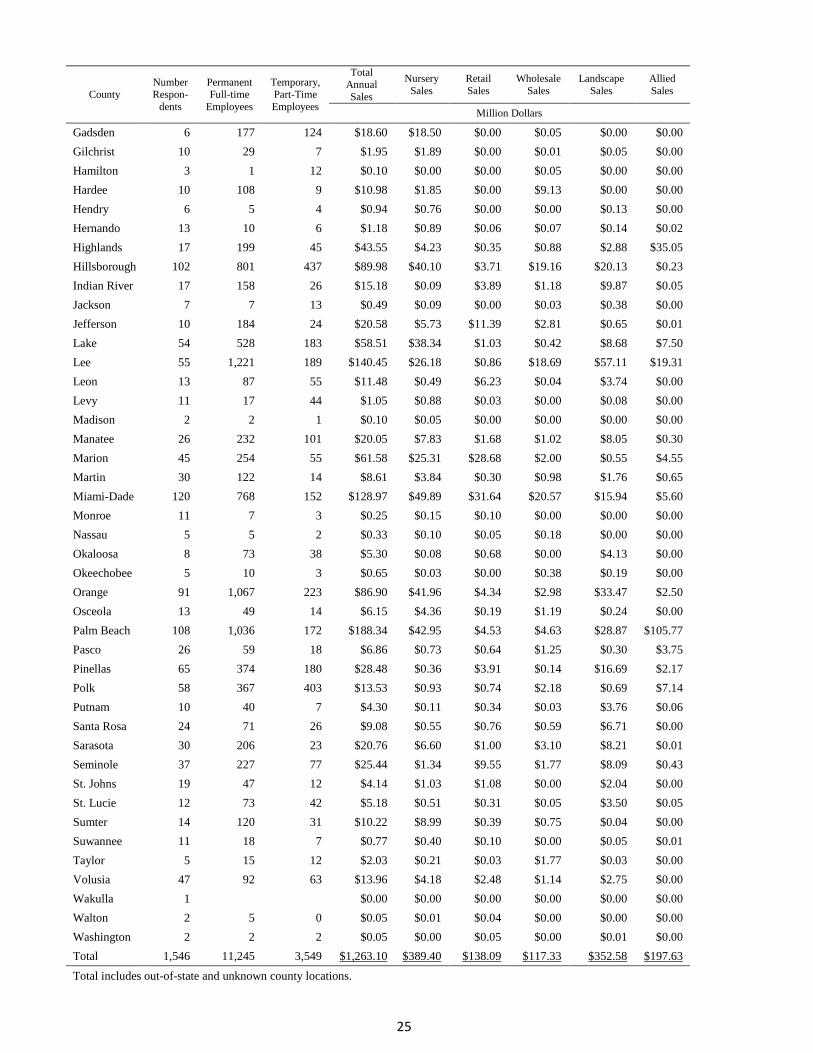
Number of survey respondents, and employment and sales reported for Florida counties are shown in Table 18.
Considering reported permanent, full-time employment, the leading five counties were Lee (1,221 full-time, and
189 part-time employees), Orange (1,067 full- and 223 part-time), Hillsborough (801 full- and 437 part-time),
Palm Beach (1,036 full- and 172 part-time) and Miami-Dade (768 full- and 152 part-time). In terms of reported
total annual sales, respondent firms in Palm Beach County reported the highest sales ($188 M) followed by Lee
($140 M), Miami-Dade ($129 M), Hillsborough ($90 M), and Orange ($87 M) counties, which is equivalent to 50
percent of annual sales reported by all counties (Table 18).
Table 18. Summary of reported employment and sales by Florida County, 2016 survey of the Florida
environmental horticulture industry
County
Number
Respon-
dents
Permanent
Full-time
Employees
Temporary,
Part-Time
Employees
Total
Annual Sales
Nursery
Sales
Retail
Sales
Wholesale
Sales
Landscape
Sales
Allied
Sales
Million Dollars
Alachua 45 42 46 $3.43 $1.74 $0.09 $0.26 $0.69 $0.39
Baker 9 15 10 $0.70 $0.25 $0.38 $0.06 $0.01 $0.00
Bay 8 84 36 $9.40 $2.38 $0.93 $0.00 $6.10 $0.00
Bradford 3 7 6 $0.75 $0.38 $0.38 $0.00 $0.00 $0.00
Brevard 45 78 43 $4.51 $0.83 $1.44 $0.44 $1.53 $0.00
Broward 87 646 156 $60.09 $14.41 $2.34 $7.56 $33.77 $0.96
Calhoun 2 90 7 $7.50 $7.50 $0.00 $0.00 $0.00 $0.00
Charlotte 8 70 22 $4.10 $1.80 $1.05 $0.00 $1.25 $0.00
Citrus 16 25 11 $2.09 $1.11 $0.55 $0.18 $0.24 $0.00
Clay 8 18 32 $1.06 $0.73 $0.23 $0.01 $0.04 $0.00
Collier 46 750 35 $43.37 $2.98 $1.70 $1.49 $34.79 $0.56
Columbia 7 9 15 $0.98 $0.39 $0.01 $0.20 $0.00 $0.00
Desoto 3 36 11 $7.55 $7.55 $0.00 $0.00 $0.00 $0.00
Dixie 2 2 0 $0.05 $0.00 $0.05 $0.00 $0.00 $0.00
Duval 42 172 174 $21.36 $2.46 $1.65 $5.94 $6.23 $0.53
Escambia 29 251 49 $22.83 $0.51 $5.97 $1.96 $14.16 $0.00
Flagler 7 41 28 $3.98 $0.04 $0.19 $0.00 $3.75 $0.00
Franklin 1 2 1 $0.05 $0.00 $0.00 $0.00 $0.00 $0.05
25
County Number Respon-
dents
Permanent Full-time
Employees
Temporary, Part-Time
Employees
Total Annual
Sales
Nursery
Sales
Retail
Sales
Wholesale
Sales
Landscape
Sales
Allied
Sales
Million Dollars
Gadsden 6 177 124 $18.60 $18.50 $0.00 $0.05 $0.00 $0.00
Gilchrist 10 29 7 $1.95 $1.89 $0.00 $0.01 $0.05 $0.00
Hamilton 3 1 12 $0.10 $0.00 $0.00 $0.05 $0.00 $0.00
Hardee 10 108 9 $10.98 $1.85 $0.00 $9.13 $0.00 $0.00
Hendry 6 5 4 $0.94 $0.76 $0.00 $0.00 $0.13 $0.00
Hernando 13 10 6 $1.18 $0.89 $0.06 $0.07 $0.14 $0.02
Highlands 17 199 45 $43.55 $4.23 $0.35 $0.88 $2.88 $35.05
Hillsborough 102 801 437 $89.98 $40.10 $3.71 $19.16 $20.13 $0.23
Indian River 17 158 26 $15.18 $0.09 $3.89 $1.18 $9.87 $0.05
Jackson 7 7 13 $0.49 $0.09 $0.00 $0.03 $0.38 $0.00
Jefferson 10 184 24 $20.58 $5.73 $11.39 $2.81 $0.65 $0.01
Lake 54 528 183 $58.51 $38.34 $1.03 $0.42 $8.68 $7.50
Lee 55 1,221 189 $140.45 $26.18 $0.86 $18.69 $57.11 $19.31
Leon 13 87 55 $11.48 $0.49 $6.23 $0.04 $3.74 $0.00
Levy 11 17 44 $1.05 $0.88 $0.03 $0.00 $0.08 $0.00
Madison 2 2 1 $0.10 $0.05 $0.00 $0.00 $0.00 $0.00
Manatee 26 232 101 $20.05 $7.83 $1.68 $1.02 $8.05 $0.30
Marion 45 254 55 $61.58 $25.31 $28.68 $2.00 $0.55 $4.55
Martin 30 122 14 $8.61 $3.84 $0.30 $0.98 $1.76 $0.65
Miami-Dade 120 768 152 $128.97 $49.89 $31.64 $20.57 $15.94 $5.60
Monroe 11 7 3 $0.25 $0.15 $0.10 $0.00 $0.00 $0.00
Nassau 5 5 2 $0.33 $0.10 $0.05 $0.18 $0.00 $0.00
Okaloosa 8 73 38 $5.30 $0.08 $0.68 $0.00 $4.13 $0.00
Okeechobee 5 10 3 $0.65 $0.03 $0.00 $0.38 $0.19 $0.00
Orange 91 1,067 223 $86.90 $41.96 $4.34 $2.98 $33.47 $2.50
Osceola 13 49 14 $6.15 $4.36 $0.19 $1.19 $0.24 $0.00
Palm Beach 108 1,036 172 $188.34 $42.95 $4.53 $4.63 $28.87 $105.77
Pasco 26 59 18 $6.86 $0.73 $0.64 $1.25 $0.30 $3.75
Pinellas 65 374 180 $28.48 $0.36 $3.91 $0.14 $16.69 $2.17
Polk 58 367 403 $13.53 $0.93 $0.74 $2.18 $0.69 $7.14
Putnam 10 40 7 $4.30 $0.11 $0.34 $0.03 $3.76 $0.06
Santa Rosa 24 71 26 $9.08 $0.55 $0.76 $0.59 $6.71 $0.00
Sarasota 30 206 23 $20.76 $6.60 $1.00 $3.10 $8.21 $0.01
Seminole 37 227 77 $25.44 $1.34 $9.55 $1.77 $8.09 $0.43
St. Johns 19 47 12 $4.14 $1.03 $1.08 $0.00 $2.04 $0.00
St. Lucie 12 73 42 $5.18 $0.51 $0.31 $0.05 $3.50 $0.05
Sumter 14 120 31 $10.22 $8.99 $0.39 $0.75 $0.04 $0.00
Suwannee 11 18 7 $0.77 $0.40 $0.10 $0.00 $0.05 $0.01
Taylor 5 15 12 $2.03 $0.21 $0.03 $1.77 $0.03 $0.00
Volusia 47 92 63 $13.96 $4.18 $2.48 $1.14 $2.75 $0.00
Wakulla 1 $0.00 $0.00 $0.00 $0.00 $0.00 $0.00
Walton 2 5 0 $0.05 $0.01 $0.04 $0.00 $0.00 $0.00
Washington 2 2 2 $0.05 $0.00 $0.05 $0.00 $0.01 $0.00
Total 1,546 11,245 3,549 $1,263.10 $389.40 $138.09 $117.33 $352.58 $197.63
Total includes out-of-state and unknown county locations.

26
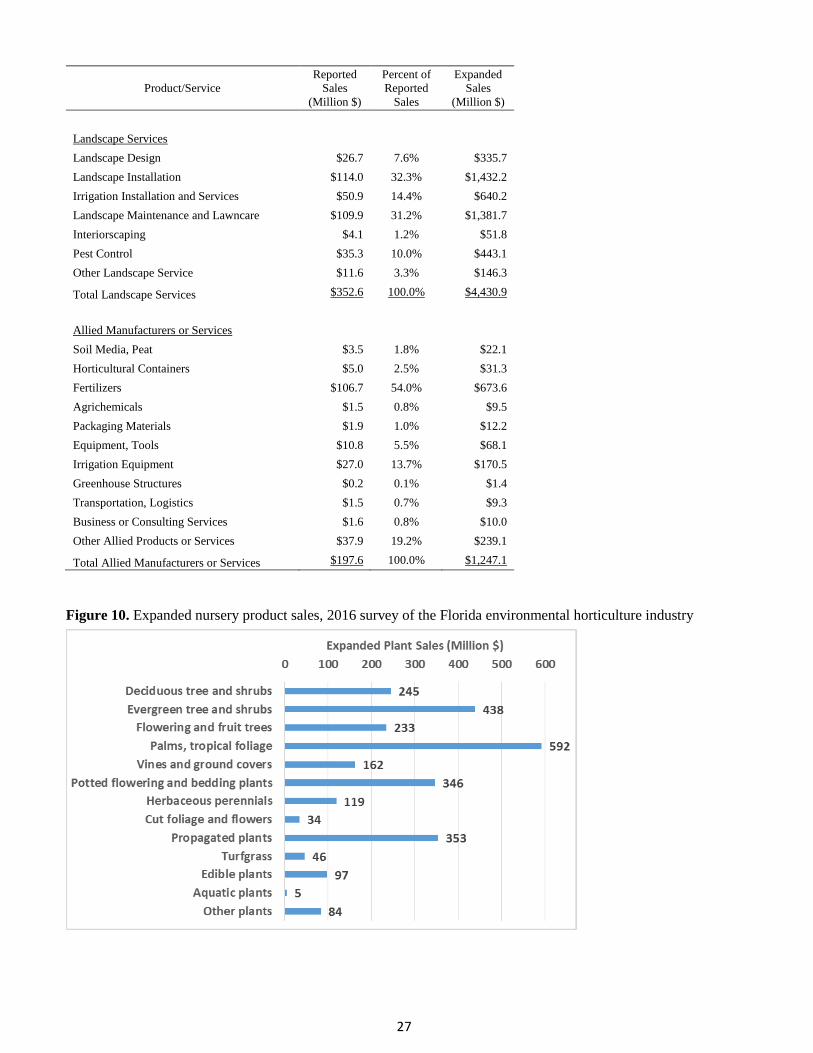
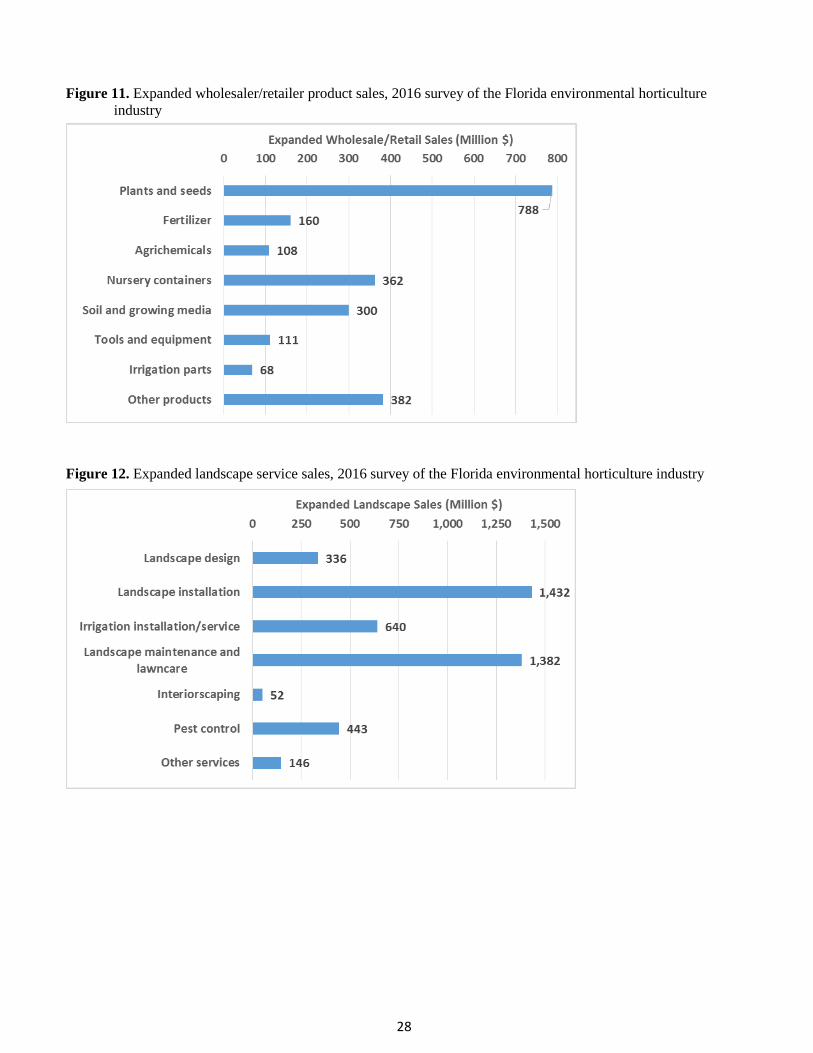
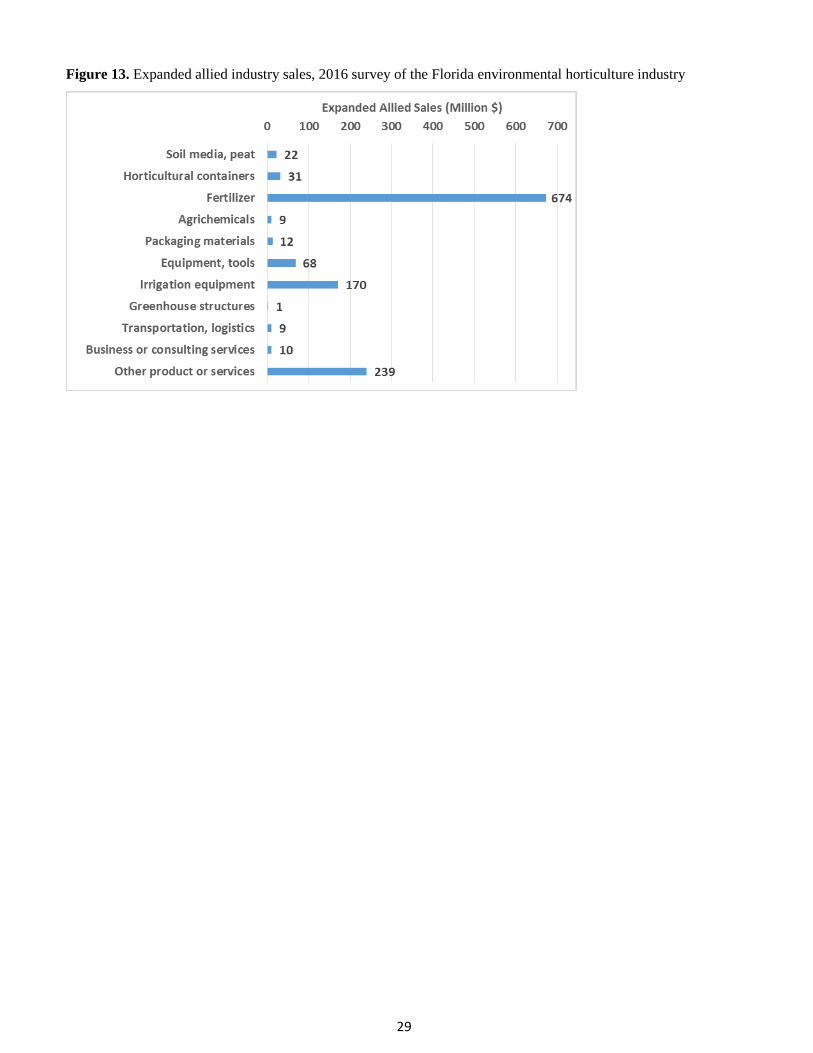
Sales of Horticultural Products and Services
Sales of specific types of horticultural products and services are detailed for each industry sector in Table 19 and
Figures 10-13. For the nursery and greenhouse producers, the largest-selling product type was tropical foliage
plants, representing 21.5 percent of total sales, followed by evergreen trees and shrubs (15.9%), propagating
material (liners, cutting, plugs, microplantlets, 12.8%), potted flowering or bedding plants (12.6%), deciduous trees
and shrubs (8.9%), flowering and fruit trees (8.5%), and vines and ground covers (5.9%). Florida native plants
represented 15.5 percent of nursery sales (includes all plant categories). For the landscape services sector,
landscape installation and landscape maintenance represented 32.2 and 31.2 percent of sales, respectively,
followed by irrigation installation and service (14.4%), pest control (10.0%), landscape design (7.6%),
interiorscaping (1.2%) and miscellaneous other services (3.3%). For horticultural retailers and wholesalers, about
one-third (34.6%) of sales were for live plants, followed by nursery containers (15.9%), soil/growing media
(13.1%), fertilizer (7.0%), tools and equipment (4.9%), agrichemicals (4.7%), irrigation parts (3.0%) and
miscellaneous other products (16.8%). Among allied suppliers, the largest specific categories of product sales were
fertilizer (54.0%) and irrigation equipment (13.7%), and equipment/tools (5.5%), plus 19.2 percent for other
unspecified items.
Table 19. Reported and expanded product and service sales, 2016 survey of the Florida environmental horticulture
industry
Product/Service
Reported
Sales
(Million $)
Percent of
Reported
Sales
Expanded
Sales
(Million $)
Nursery Plants
Deciduous Tree and Shrubs $34.6 8.9% $244.7
Evergreen Tree and Shrubs $62.0 15.9% $438.2
Flowering, Fruit Trees $33.0 8.5% $233.4
Palms, Tropical Foliage $83.7 21.5% $591.6
Vines and Ground Covers $22.9 5.9% $161.7
Potted Flowering and Bedding Plants $48.9 12.6% $346.0
Herbaceous Perennials $16.8 4.3% $118.5
Cut Foliage and Flowers $4.9 1.2% $34.4
Propagules (Liners, Plugs, Microplantlets) $49.9 12.8% $352.6
Turfgrass $6.5 1.7% $45.9
Edible Plants $13.8 3.5% $97.5
Aquatic Plants $0.6 0.2% $4.5
Other Plants $11.8 3.0% $83.8
Total Specific Plant Types $389.4 100.0% $2,752.7
Native Plants (All Plant Categories) $170.1 15.5% $1,2002
Retail/Wholesale Products
Plant and Seeds $88.3 34.6% $787.8
Fertilizers $18.0 7.0% $160.4
Agrichemicals $12.1 4.7% $107.8
Nursery Containers $40.6 15.9% $362.3
Soil and Growing Media $33.6 13.1% $299.7
Tools and Equipment $12.5 4.9% $111.3
Irrigation Parts $7.7 3.0% $68.5
Other Retail/Wholesale Products $42.8 16.8% $382.1
Total Retail/Wholesale Products $255.4 100.0% $2,280.0
27
Product/Service
Reported
Sales
(Million $)
Percent of
Reported
Sales
Expanded
Sales
(Million $)
Landscape Services
Landscape Design $26.7 7.6% $335.7
Landscape Installation $114.0 32.3% $1,432.2
Irrigation Installation and Services $50.9 14.4% $640.2
Landscape Maintenance and Lawncare $109.9 31.2% $1,381.7
Interiorscaping $4.1 1.2% $51.8
Pest Control $35.3 10.0% $443.1
Other Landscape Service $11.6 3.3% $146.3
Total Landscape Services $352.6 100.0% $4,430.9
Allied Manufacturers or Services
Soil Media, Peat $3.5 1.8% $22.1
Horticultural Containers $5.0 2.5% $31.3
Fertilizers $106.7 54.0% $673.6
Agrichemicals $1.5 0.8% $9.5
Packaging Materials $1.9 1.0% $12.2
Equipment, Tools $10.8 5.5% $68.1
Irrigation Equipment $27.0 13.7% $170.5
Greenhouse Structures $0.2 0.1% $1.4
Transportation, Logistics $1.5 0.7% $9.3
Business or Consulting Services $1.6 0.8% $10.0
Other Allied Products or Services $37.9 19.2% $239.1
Total Allied Manufacturers or Services $197.6 100.0% $1,247.1
Figure 10. Expanded nursery product sales, 2016 survey of the Florida environmental horticulture industry
28
Figure 11. Expanded wholesaler/retailer product sales, 2016 survey of the Florida environmental horticulture
industry
Figure 12. Expanded landscape service sales, 2016 survey of the Florida environmental horticulture industry
29
Figure 13. Expanded allied industry sales, 2016 survey of the Florida environmental horticulture industry
30
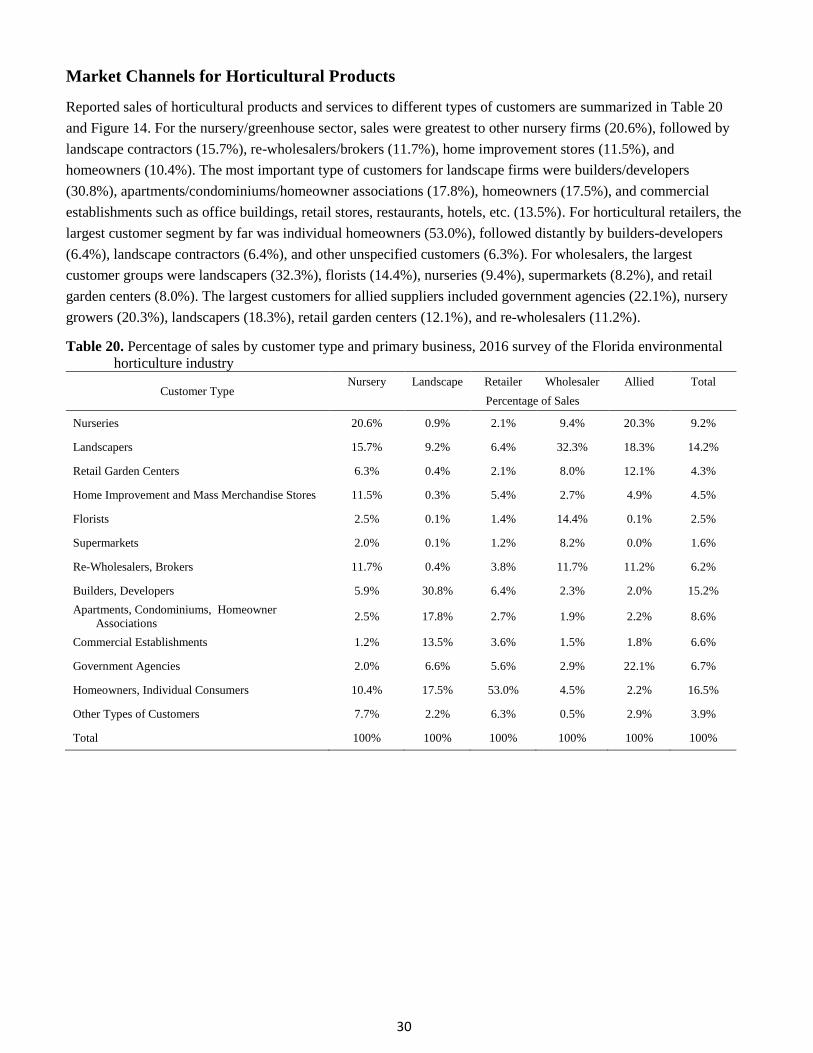
Market Channels for Horticultural Products
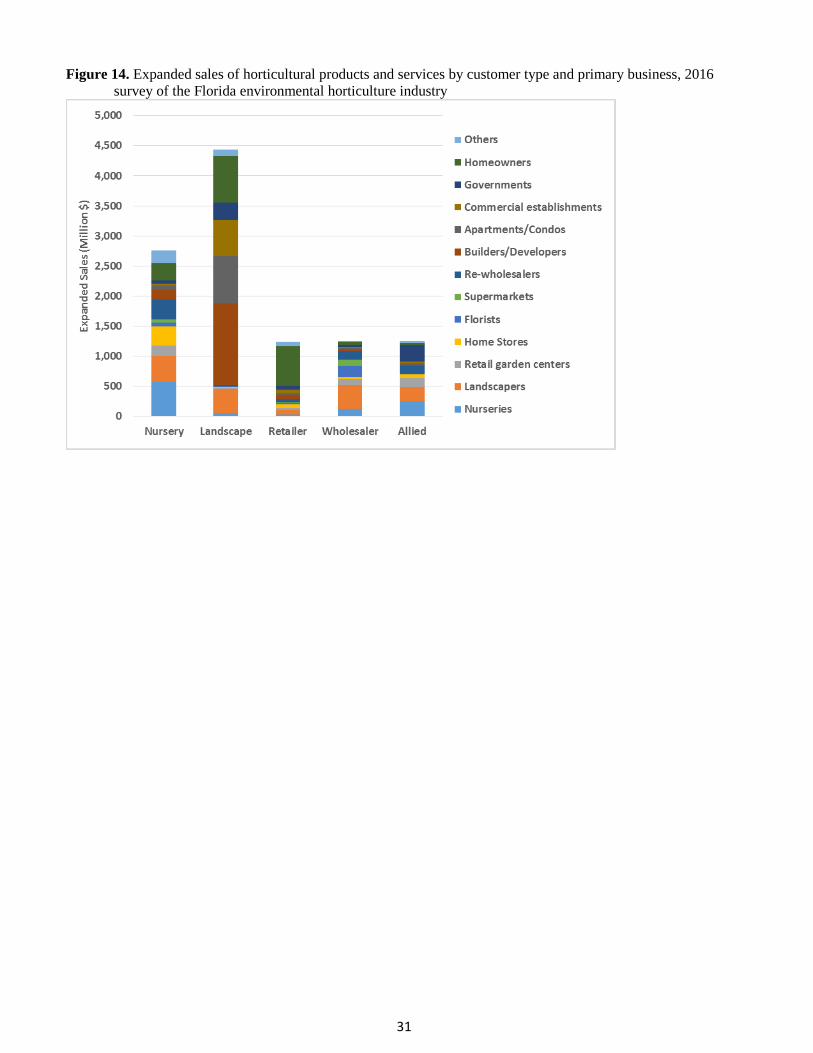
Reported sales of horticultural products and services to different types of customers are summarized in Table 20
and Figure 14. For the nursery/greenhouse sector, sales were greatest to other nursery firms (20.6%), followed by
landscape contractors (15.7%), re-wholesalers/brokers (11.7%), home improvement stores (11.5%), and
homeowners (10.4%). The most important type of customers for landscape firms were builders/developers
(30.8%), apartments/condominiums/homeowner associations (17.8%), homeowners (17.5%), and commercial
establishments such as office buildings, retail stores, restaurants, hotels, etc. (13.5%). For horticultural retailers, the
largest customer segment by far was individual homeowners (53.0%), followed distantly by builders-developers
(6.4%), landscape contractors (6.4%), and other unspecified customers (6.3%). For wholesalers, the largest
customer groups were landscapers (32.3%), florists (14.4%), nurseries (9.4%), supermarkets (8.2%), and retail
garden centers (8.0%). The largest customers for allied suppliers included government agencies (22.1%), nursery
growers (20.3%), landscapers (18.3%), retail garden centers (12.1%), and re-wholesalers (11.2%).
Table 20. Percentage of sales by customer type and primary business, 2016 survey of the Florida environmental
horticulture industry
Customer Type Nursery Landscape Retailer Wholesaler Allied Total
Percentage of Sales
Nurseries 20.6% 0.9% 2.1% 9.4% 20.3% 9.2%
Landscapers 15.7% 9.2% 6.4% 32.3% 18.3% 14.2%
Retail Garden Centers 6.3% 0.4% 2.1% 8.0% 12.1% 4.3%
Home Improvement and Mass Merchandise Stores 11.5% 0.3% 5.4% 2.7% 4.9% 4.5%
Florists 2.5% 0.1% 1.4% 14.4% 0.1% 2.5%
Supermarkets 2.0% 0.1% 1.2% 8.2% 0.0% 1.6%
Re-Wholesalers, Brokers 11.7% 0.4% 3.8% 11.7% 11.2% 6.2%
Builders, Developers 5.9% 30.8% 6.4% 2.3% 2.0% 15.2%
Apartments, Condominiums, Homeowner
Associations 2.5% 17.8% 2.7% 1.9% 2.2% 8.6%
Commercial Establishments 1.2% 13.5% 3.6% 1.5% 1.8% 6.6%
Government Agencies 2.0% 6.6% 5.6% 2.9% 22.1% 6.7%
Homeowners, Individual Consumers 10.4% 17.5% 53.0% 4.5% 2.2% 16.5%
Other Types of Customers 7.7% 2.2% 6.3% 0.5% 2.9% 3.9%
Total 100% 100% 100% 100% 100% 100%
31
Figure 14. Expanded sales of horticultural products and services by customer type and primary business, 2016
survey of the Florida environmental horticulture industry
32
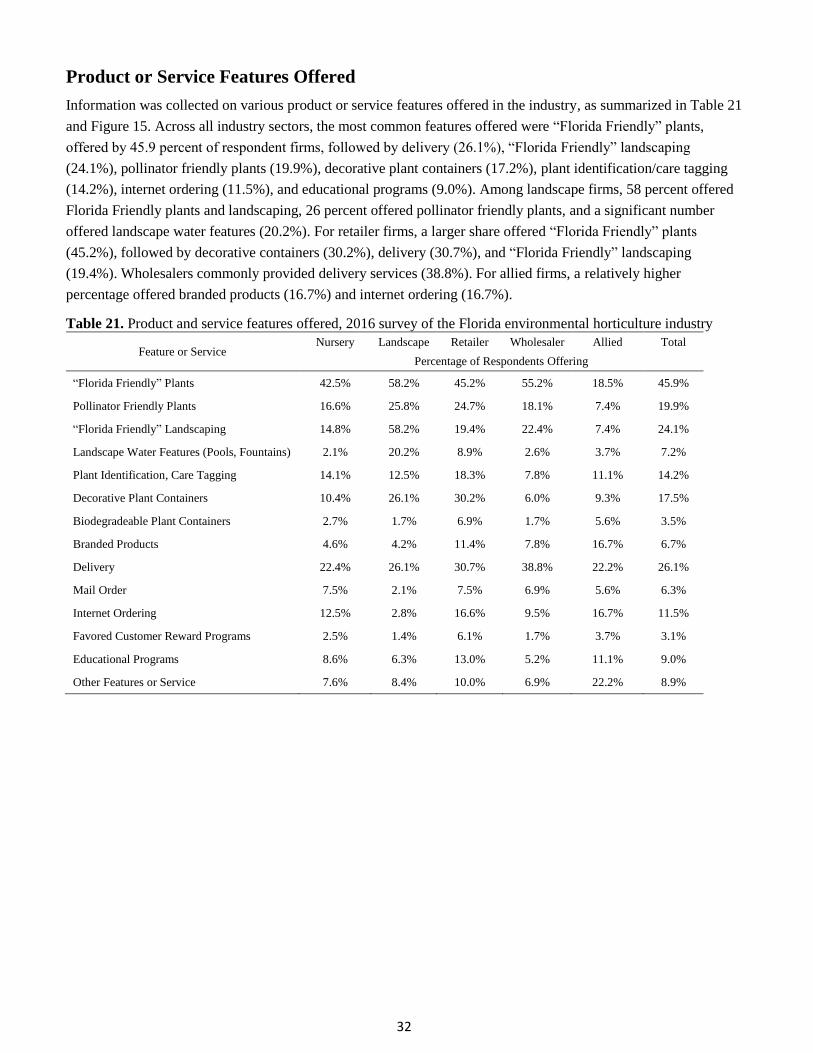
Product or Service Features Offered
Information was collected on various product or service features offered in the industry, as summarized in Table 21
and Figure 15. Across all industry sectors, the most common features offered were “Florida Friendly” plants,
offered by 45.9 percent of respondent firms, followed by delivery (26.1%), “Florida Friendly” landscaping
(24.1%), pollinator friendly plants (19.9%), decorative plant containers (17.2%), plant identification/care tagging
(14.2%), internet ordering (11.5%), and educational programs (9.0%). Among landscape firms, 58 percent offered
Florida Friendly plants and landscaping, 26 percent offered pollinator friendly plants, and a significant number
offered landscape water features (20.2%). For retailer firms, a larger share offered “Florida Friendly” plants
(45.2%), followed by decorative containers (30.2%), delivery (30.7%), and “Florida Friendly” landscaping
(19.4%). Wholesalers commonly provided delivery services (38.8%). For allied firms, a relatively higher
percentage offered branded products (16.7%) and internet ordering (16.7%).
Table 21. Product and service features offered, 2016 survey of the Florida environmental horticulture industry
Feature or Service Nursery Landscape Retailer Wholesaler Allied Total
Percentage of Respondents Offering
“Florida Friendly” Plants 42.5% 58.2% 45.2% 55.2% 18.5% 45.9%
Pollinator Friendly Plants 16.6% 25.8% 24.7% 18.1% 7.4% 19.9%
“Florida Friendly” Landscaping 14.8% 58.2% 19.4% 22.4% 7.4% 24.1%
Landscape Water Features (Pools, Fountains) 2.1% 20.2% 8.9% 2.6% 3.7% 7.2%
Plant Identification, Care Tagging 14.1% 12.5% 18.3% 7.8% 11.1% 14.2%
Decorative Plant Containers 10.4% 26.1% 30.2% 6.0% 9.3% 17.5%
Biodegradeable Plant Containers 2.7% 1.7% 6.9% 1.7% 5.6% 3.5%
Branded Products 4.6% 4.2% 11.4% 7.8% 16.7% 6.7%
Delivery 22.4% 26.1% 30.7% 38.8% 22.2% 26.1%
Mail Order 7.5% 2.1% 7.5% 6.9% 5.6% 6.3%
Internet Ordering 12.5% 2.8% 16.6% 9.5% 16.7% 11.5%
Favored Customer Reward Programs 2.5% 1.4% 6.1% 1.7% 3.7% 3.1%
Educational Programs 8.6% 6.3% 13.0% 5.2% 11.1% 9.0%
Other Features or Service 7.6% 8.4% 10.0% 6.9% 22.2% 8.9%
33
Figure 15. Product and service features offered, 2016 survey of the Florida environmental horticulture industry
34
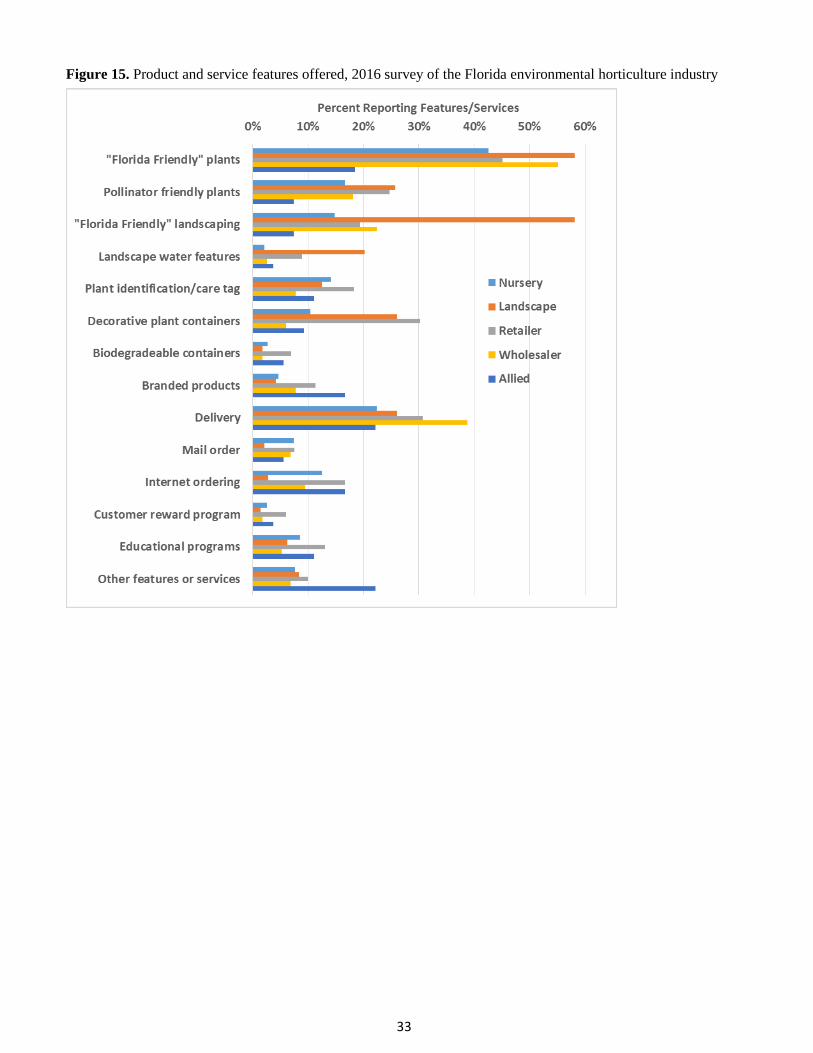
Capital Investment
Survey respondents reported total capital investment in 2015 of nearly $50 million (M), including $21.4 M for
buildings/structures, $23.4 M for equipment and vehicles, $2.9 M for information technology, and $1.7 M for other
types of capital (Table 22, Figure 16). Reported investments were greatest for nurseries ($21.4 M), landscape firms
($10.9 M), and allied firms ($7.3 M). Over the next three years (2016-18), respondents expected to invest nearly
$90 M, including $44.6 M in buildings and $38.2 M in vehicles and equipment, with over half of this ($46.1 M)
being invested by nurseries.
Table 22. Capital investment reported by primary business type in 2015 and for the next three years, 2016 survey
of the Florida environmental horticulture industry
Investment Type, Year(s) Nursery Landscape Retailer Wholesaler Allied Total
Million Dollars
Investment in 2015
Buildings, Structures $12.45 $2.36 $3.52 $0.80 $1.98 $21.40
Vehicles, Equipment $7.33 $8.06 $2.06 $1.94 $4.03 $23.41
Information Technology $0.66 $0.30 $0.77 $0.07 $1.11 $2.92
Other $0.92 $0.13 $0.50 $0.05 $0.13 $1.74
Total $21.36 $10.85 $6.86 $2.86 $7.25 $49.47
Investment Next Three Years
Buildings, Structures $30.35 $4.95 $3.65 $0.65 $4.96 $44.63
Vehicles, Equipment $12.38 $12.43 $1.73 $2.78 $8.87 $38.18
Information Technology $1.47 $0.72 $0.49 $0.21 $1.19 $4.07
Other $1.86 $0.48 $0.33 $0.06 $0.25 $2.98
Total $46.06 $18.57 $6.20 $3.70 $15.27 $89.87
Figure 16. Capital investment reported by primary business type in 2015 and for the next three years, 2016 survey
of the Florida environmental horticulture industry
35
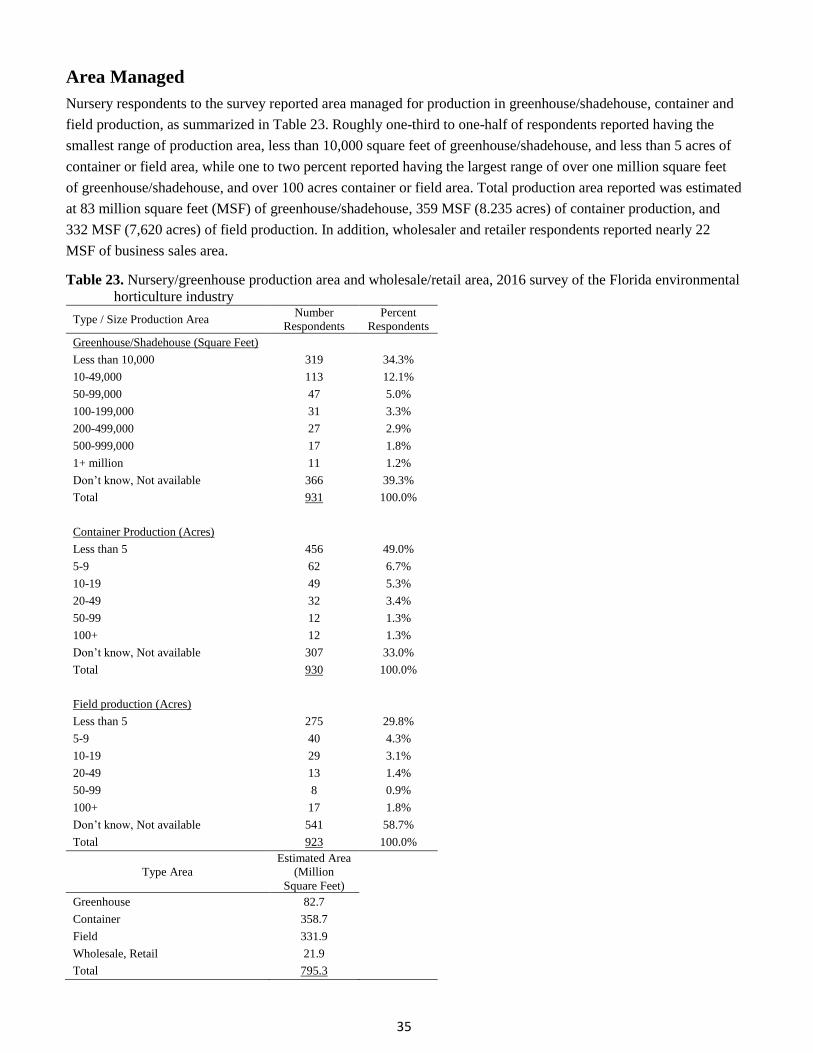
Area Managed
Nursery respondents to the survey reported area managed for production in greenhouse/shadehouse, container and
field production, as summarized in Table 23. Roughly one-third to one-half of respondents reported having the
smallest range of production area, less than 10,000 square feet of greenhouse/shadehouse, and less than 5 acres of
container or field area, while one to two percent reported having the largest range of over one million square feet
of greenhouse/shadehouse, and over 100 acres container or field area. Total production area reported was estimated
at 83 million square feet (MSF) of greenhouse/shadehouse, 359 MSF (8.235 acres) of container production, and
332 MSF (7,620 acres) of field production. In addition, wholesaler and retailer respondents reported nearly 22
MSF of business sales area.
Table 23. Nursery/greenhouse production area and wholesale/retail area, 2016 survey of the Florida environmental
horticulture industry
Type / Size Production Area Number
Respondents
Percent
Respondents
Greenhouse/Shadehouse (Square Feet)
Less than 10,000 319 34.3%
10-49,000 113 12.1%
50-99,000 47 5.0%
100-199,000 31 3.3%
200-499,000 27 2.9%
500-999,000 17 1.8%
1+ million 11 1.2%
Don’t know, Not available 366 39.3%
Total 931 100.0%
Container Production (Acres)
Less than 5 456 49.0%
5-9 62 6.7%
10-19 49 5.3%
20-49 32 3.4%
50-99 12 1.3%
100+ 12 1.3%
Don’t know, Not available 307 33.0%
Total 930 100.0%
Field production (Acres)
Less than 5 275 29.8%
5-9 40 4.3%
10-19 29 3.1%
20-49 13 1.4%
50-99 8 0.9%
100+ 17 1.8%
Don’t know, Not available 541 58.7%
Total 923 100.0%
Type Area
Estimated Area
(Million
Square Feet)
Greenhouse 82.7
Container 358.7
Field 331.9
Wholesale, Retail 21.9
Total 795.3
36
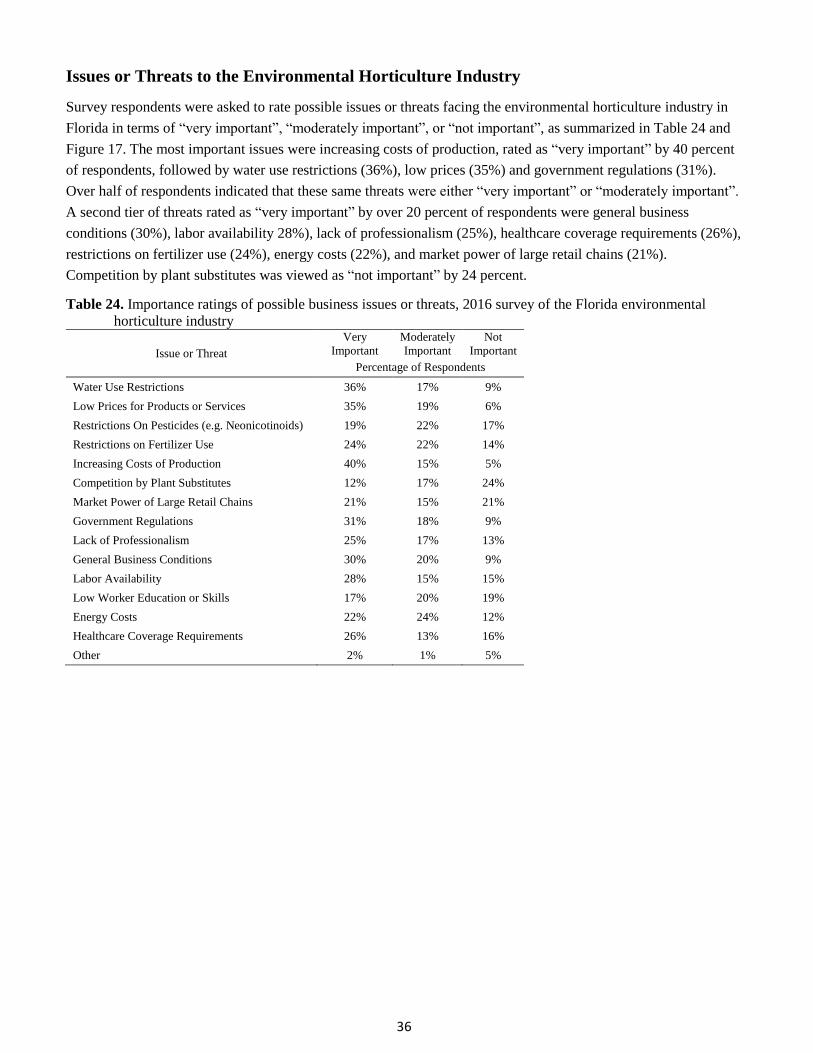
Issues or Threats to the Environmental Horticulture Industry
Survey respondents were asked to rate possible issues or threats facing the environmental horticulture industry in
Florida in terms of “very important”, “moderately important”, or “not important”, as summarized in Table 24 and
Figure 17. The most important issues were increasing costs of production, rated as “very important” by 40 percent
of respondents, followed by water use restrictions (36%), low prices (35%) and government regulations (31%).
Over half of respondents indicated that these same threats were either “very important” or “moderately important”.
A second tier of threats rated as “very important” by over 20 percent of respondents were general business
conditions (30%), labor availability 28%), lack of professionalism (25%), healthcare coverage requirements (26%),
restrictions on fertilizer use (24%), energy costs (22%), and market power of large retail chains (21%).
Competition by plant substitutes was viewed as “not important” by 24 percent.
Table 24. Importance ratings of possible business issues or threats, 2016 survey of the Florida environmental
horticulture industry
Issue or Threat
Very
Important
Moderately
Important
Not
Important
Percentage of Respondents
Water Use Restrictions 36% 17% 9%
Low Prices for Products or Services 35% 19% 6%
Restrictions On Pesticides (e.g. Neonicotinoids) 19% 22% 17%
Restrictions on Fertilizer Use 24% 22% 14%
Increasing Costs of Production 40% 15% 5%
Competition by Plant Substitutes 12% 17% 24%
Market Power of Large Retail Chains 21% 15% 21%
Government Regulations 31% 18% 9%
Lack of Professionalism 25% 17% 13%
General Business Conditions 30% 20% 9%
Labor Availability 28% 15% 15%
Low Worker Education or Skills 17% 20% 19%
Energy Costs 22% 24% 12%
Healthcare Coverage Requirements 26% 13% 16%
Other 2% 1% 5%
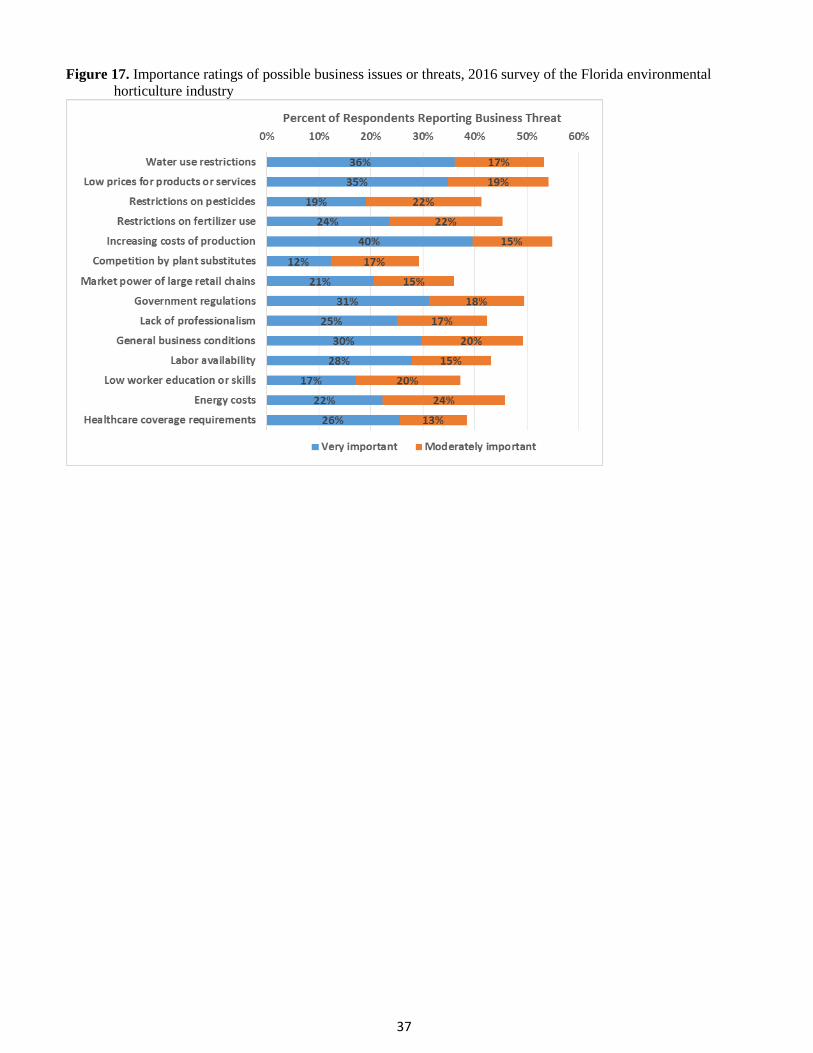
37
Figure 17. Importance ratings of possible business issues or threats, 2016 survey of the Florida environmental
horticulture industry
38
Economic Contribution Results
Statewide Contributions
The economic impacts of the environmental horticulture industry in Florida were estimated using the IMPLAN
input-output regional modeling system to build state and county models (see Methods).
The total output or revenue contribution at the state level in 2015 was estimated at $21.080 billion, including
$12.782 B in direct output or industry sales, and $8.297 billion in indirect and induced multiplier effects from
supply chain activity and income respending by industry employee households and governments, as summarized in
Table 25 and Figures 18-20. For the nursery, landscape and allied sectors, direct output represents sales revenues,
but for the wholesale and retail sectors, output is the gross margin on sales, typically around 25-35 percent of sales.
Multiplier effects of supply chain activity and employee household spending were calculated from nonlocal output
(export sales) estimated by the regional models. Total output contributions were $4.546 billion for nurseries and
manufacturers, $10.111 billion for landscape services, and $6.423 billion for wholesalers and retailers (Figure 18).
Nurseries and allied manufacturers generated the largest share of indirect and induced multiplier impacts due to
their much larger shipments to domestic and international markets. Output contributions by allied industry firms,
estimated at $2.42 billion, were included within the wholesaler and equipment manufacturing segments.
The total employment contribution of the industry was estimated at 232,648 full-time and part-time/seasonal jobs,
including 36,982 jobs generated by nursery production/manufacturing, 148,215 jobs by landscape services, and
47,451 jobs by horticultural wholesalers and retailers (Figure 19). An estimated contribution of 13,177 jobs by
allied industry suppliers within the wholesale and manufacturing sectors was based on direct employment of 5,997
jobs expanded from allied survey respondents.
Value added is an important measure of contribution to a regional economy, representing the difference between
industry output and the cost of purchased industry inputs, and is comparable to Gross Domestic Product (GDP).
The total value added contribution of the Florida environmental horticulture industry in 2015 was estimated at
$13.172 billion, comprised of $3.033 billion by the nursery production and manufacturing sectors, $6.119 billion
by landscape services, and $4.021 billion by wholesalers and retailers (Figure 20). GDP contributions of $1.46
billion were estimated separately for allied suppliers.
Labor income contributions represent employee wages and benefits, proprietor income, and were estimated at
$8.748 billion, including $1.821 billion for nursery production/manufacturing, $4.598 billion for landscape
services and $2.329 billion for wholesale/retail distribution. Other property income contributions, representing
dividends, corporate profits, rents, dividends, royalties, and interest income, were estimated at $3.427 billion.
Contributions to taxes on production and imports paid to state, local and federal governments, such as sales tax,
property tax, fuel taxes, excise taxes, etc., were estimated at $997 million. Note that labor income, property income
and taxes on production and imports are included within value added, so these separate measures should not be
added together.
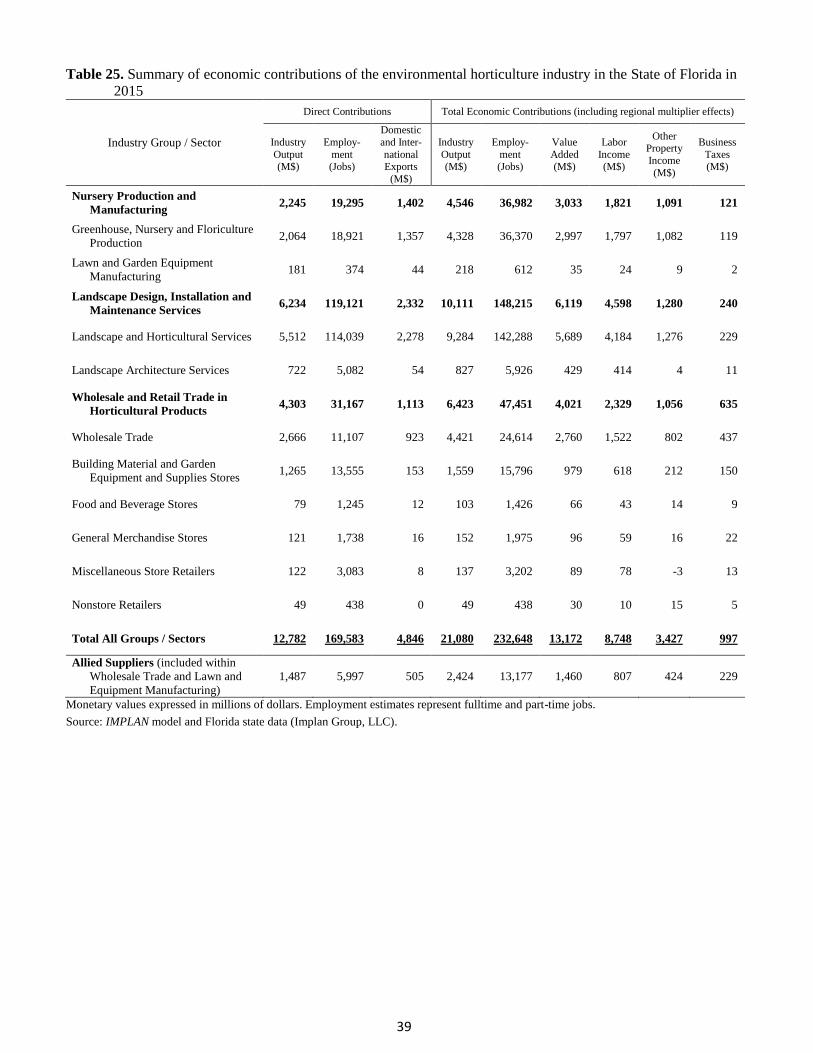
39
Table 25. Summary of economic contributions of the environmental horticulture industry in the State of Florida in
2015
Industry Group / Sector
Direct Contributions Total Economic Contributions (including regional multiplier effects)
Industry
Output (M$)
Employ-
ment (Jobs)
Domestic
and Inter-
national Exports
(M$)
Industry
Output (M$)
Employ-
ment (Jobs)
Value
Added (M$)
Labor
Income (M$)
Other Property
Income
(M$)
Business
Taxes (M$)
Nursery Production and
Manufacturing 2,245 19,295 1,402 4,546 36,982 3,033 1,821 1,091 121
Greenhouse, Nursery and Floriculture
Production 2,064 18,921 1,357 4,328 36,370 2,997 1,797 1,082 119
Lawn and Garden Equipment
Manufacturing 181 374 44 218 612 35 24 9 2
Landscape Design, Installation and
Maintenance Services 6,234 119,121 2,332 10,111 148,215 6,119 4,598 1,280 240
Landscape and Horticultural Services 5,512 114,039 2,278 9,284 142,288 5,689 4,184 1,276 229
Landscape Architecture Services 722 5,082 54 827 5,926 429 414 4 11
Wholesale and Retail Trade in
Horticultural Products 4,303 31,167 1,113 6,423 47,451 4,021 2,329 1,056 635
Wholesale Trade 2,666 11,107 923 4,421 24,614 2,760 1,522 802 437
Building Material and Garden
Equipment and Supplies Stores 1,265 13,555 153 1,559 15,796 979 618 212 150
Food and Beverage Stores 79 1,245 12 103 1,426 66 43 14 9
General Merchandise Stores 121 1,738 16 152 1,975 96 59 16 22
Miscellaneous Store Retailers 122 3,083 8 137 3,202 89 78 -3 13
Nonstore Retailers 49 438 0 49 438 30 10 15 5
Total All Groups / Sectors 12,782 169,583 4,846 21,080 232,648 13,172 8,748 3,427 997
Allied Suppliers (included within
Wholesale Trade and Lawn and
Equipment Manufacturing)
1,487 5,997 505 2,424 13,177 1,460 807 424 229
Monetary values expressed in millions of dollars. Employment estimates represent fulltime and part-time jobs.
Source: IMPLAN model and Florida state data (Implan Group, LLC).
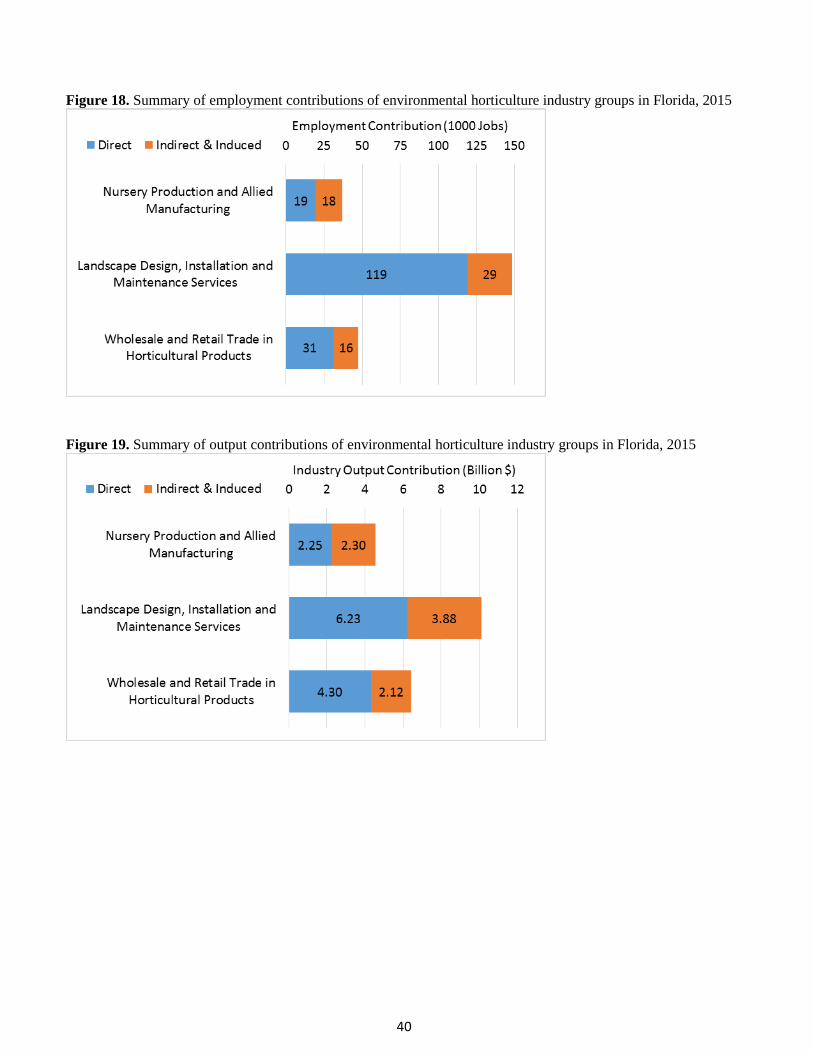
40
Figure 18. Summary of employment contributions of environmental horticulture industry groups in Florida, 2015
Figure 19. Summary of output contributions of environmental horticulture industry groups in Florida, 2015
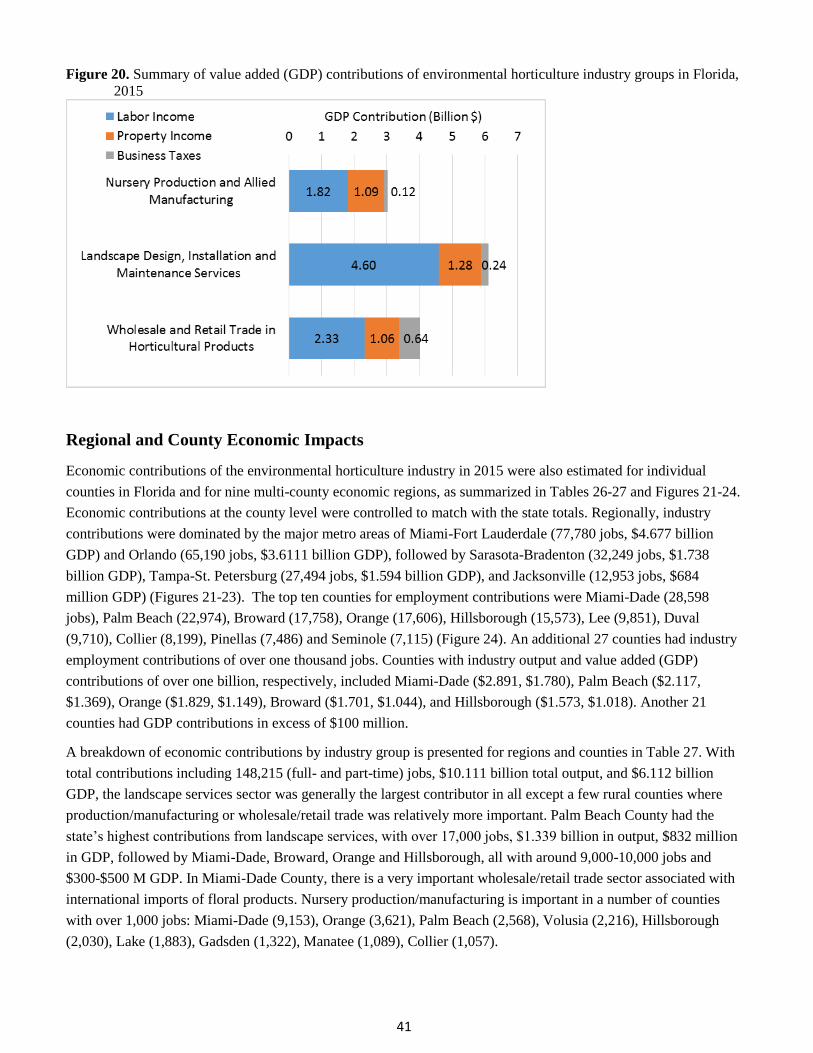
41
Figure 20. Summary of value added (GDP) contributions of environmental horticulture industry groups in Florida,
2015
Regional and County Economic Impacts
Economic contributions of the environmental horticulture industry in 2015 were also estimated for individual
counties in Florida and for nine multi-county economic regions, as summarized in Tables 26-27 and Figures 21-24.
Economic contributions at the county level were controlled to match with the state totals. Regionally, industry
contributions were dominated by the major metro areas of Miami-Fort Lauderdale (77,780 jobs, $4.677 billion
GDP) and Orlando (65,190 jobs, $3.6111 billion GDP), followed by Sarasota-Bradenton (32,249 jobs, $1.738
billion GDP), Tampa-St. Petersburg (27,494 jobs, $1.594 billion GDP), and Jacksonville (12,953 jobs, $684
million GDP) (Figures 21-23). The top ten counties for employment contributions were Miami-Dade (28,598
jobs), Palm Beach (22,974), Broward (17,758), Orange (17,606), Hillsborough (15,573), Lee (9,851), Duval
(9,710), Collier (8,199), Pinellas (7,486) and Seminole (7,115) (Figure 24). An additional 27 counties had industry
employment contributions of over one thousand jobs. Counties with industry output and value added (GDP)
contributions of over one billion, respectively, included Miami-Dade ($2.891, $1.780), Palm Beach ($2.117,
$1.369), Orange ($1.829, $1.149), Broward ($1.701, $1.044), and Hillsborough ($1.573, $1.018). Another 21
counties had GDP contributions in excess of $100 million.
A breakdown of economic contributions by industry group is presented for regions and counties in Table 27. With
total contributions including 148,215 (full- and part-time) jobs, $10.111 billion total output, and $6.112 billion
GDP, the landscape services sector was generally the largest contributor in all except a few rural counties where
production/manufacturing or wholesale/retail trade was relatively more important. Palm Beach County had the
state’s highest contributions from landscape services, with over 17,000 jobs, $1.339 billion in output, $832 million
in GDP, followed by Miami-Dade, Broward, Orange and Hillsborough, all with around 9,000-10,000 jobs and
$300-$500 M GDP. In Miami-Dade County, there is a very important wholesale/retail trade sector associated with
international imports of floral products. Nursery production/manufacturing is important in a number of counties
with over 1,000 jobs: Miami-Dade (9,153), Orange (3,621), Palm Beach (2,568), Volusia (2,216), Hillsborough
(2,030), Lake (1,883), Gadsden (1,322), Manatee (1,089), Collier (1,057).
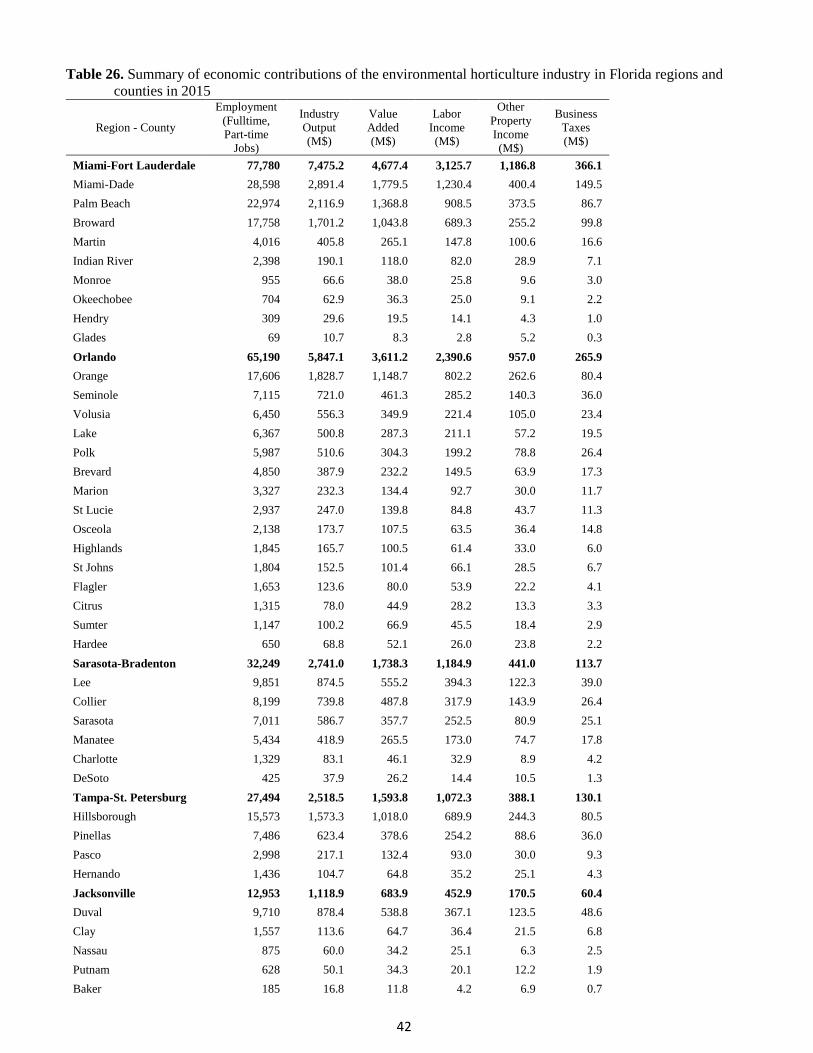
42
Table 26. Summary of economic contributions of the environmental horticulture industry in Florida regions and
counties in 2015
Region - County
Employment
(Fulltime,
Part-time
Jobs)
Industry
Output
(M$)
Value
Added
(M$)
Labor
Income
(M$)
Other
Property
Income
(M$)
Business
Taxes
(M$)
Miami-Fort Lauderdale 77,780 7,475.2 4,677.4 3,125.7 1,186.8 366.1
Miami-Dade 28,598 2,891.4 1,779.5 1,230.4 400.4 149.5
Palm Beach 22,974 2,116.9 1,368.8 908.5 373.5 86.7
Broward 17,758 1,701.2 1,043.8 689.3 255.2 99.8
Martin 4,016 405.8 265.1 147.8 100.6 16.6
Indian River 2,398 190.1 118.0 82.0 28.9 7.1
Monroe 955 66.6 38.0 25.8 9.6 3.0
Okeechobee 704 62.9 36.3 25.0 9.1 2.2
Hendry 309 29.6 19.5 14.1 4.3 1.0
Glades 69 10.7 8.3 2.8 5.2 0.3
Orlando 65,190 5,847.1 3,611.2 2,390.6 957.0 265.9
Orange 17,606 1,828.7 1,148.7 802.2 262.6 80.4
Seminole 7,115 721.0 461.3 285.2 140.3 36.0
Volusia 6,450 556.3 349.9 221.4 105.0 23.4
Lake 6,367 500.8 287.3 211.1 57.2 19.5
Polk 5,987 510.6 304.3 199.2 78.8 26.4
Brevard 4,850 387.9 232.2 149.5 63.9 17.3
Marion 3,327 232.3 134.4 92.7 30.0 11.7
St Lucie 2,937 247.0 139.8 84.8 43.7 11.3
Osceola 2,138 173.7 107.5 63.5 36.4 14.8
Highlands 1,845 165.7 100.5 61.4 33.0 6.0
St Johns 1,804 152.5 101.4 66.1 28.5 6.7
Flagler 1,653 123.6 80.0 53.9 22.2 4.1
Citrus 1,315 78.0 44.9 28.2 13.3 3.3
Sumter 1,147 100.2 66.9 45.5 18.4 2.9
Hardee 650 68.8 52.1 26.0 23.8 2.2
Sarasota-Bradenton 32,249 2,741.0 1,738.3 1,184.9 441.0 113.7
Lee 9,851 874.5 555.2 394.3 122.3 39.0
Collier 8,199 739.8 487.8 317.9 143.9 26.4
Sarasota 7,011 586.7 357.7 252.5 80.9 25.1
Manatee 5,434 418.9 265.5 173.0 74.7 17.8
Charlotte 1,329 83.1 46.1 32.9 8.9 4.2
DeSoto 425 37.9 26.2 14.4 10.5 1.3
Tampa-St. Petersburg 27,494 2,518.5 1,593.8 1,072.3 388.1 130.1
Hillsborough 15,573 1,573.3 1,018.0 689.9 244.3 80.5
Pinellas 7,486 623.4 378.6 254.2 88.6 36.0
Pasco 2,998 217.1 132.4 93.0 30.0 9.3
Hernando 1,436 104.7 64.8 35.2 25.1 4.3
Jacksonville 12,953 1,118.9 683.9 452.9 170.5 60.4
Duval 9,710 878.4 538.8 367.1 123.5 48.6
Clay 1,557 113.6 64.7 36.4 21.5 6.8
Nassau 875 60.0 34.2 25.1 6.3 2.5
Putnam 628 50.1 34.3 20.1 12.2 1.9
Baker 185 16.8 11.8 4.2 6.9 0.7
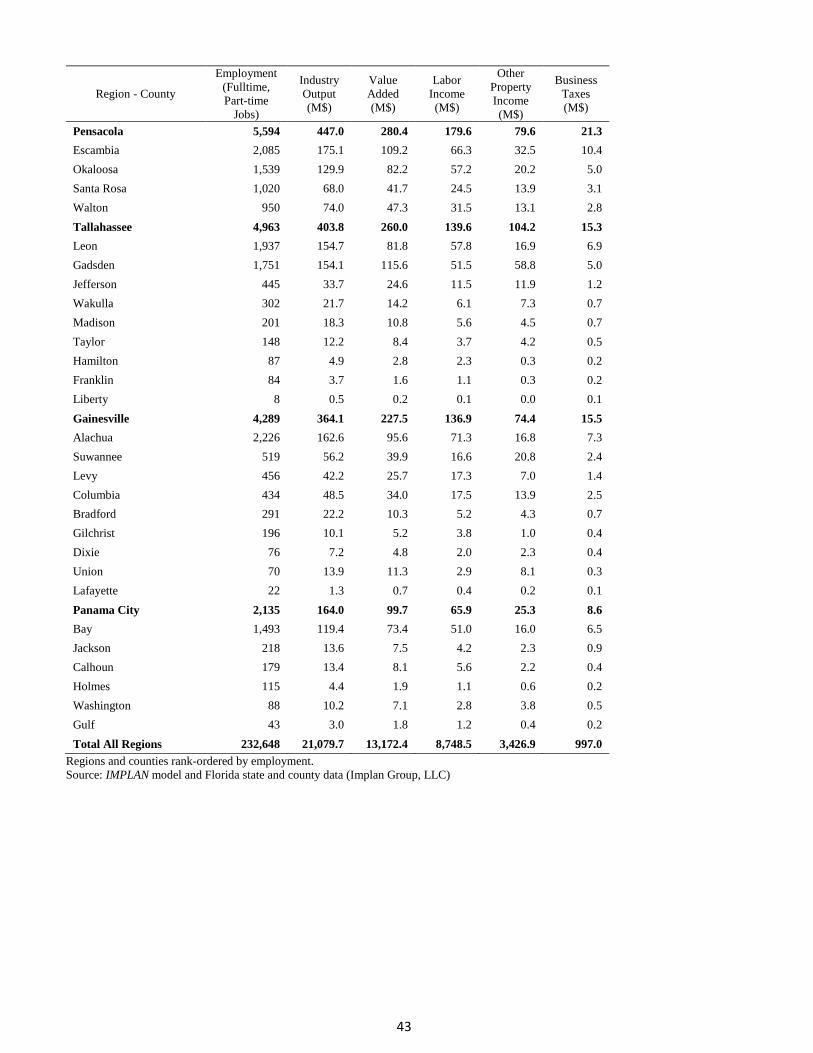
43
Region - County
Employment
(Fulltime,
Part-time
Jobs)
Industry
Output
(M$)
Value
Added
(M$)
Labor
Income
(M$)
Other
Property
Income
(M$)
Business
Taxes
(M$)
Pensacola 5,594 447.0 280.4 179.6 79.6 21.3
Escambia 2,085 175.1 109.2 66.3 32.5 10.4
Okaloosa 1,539 129.9 82.2 57.2 20.2 5.0
Santa Rosa 1,020 68.0 41.7 24.5 13.9 3.1
Walton 950 74.0 47.3 31.5 13.1 2.8
Tallahassee 4,963 403.8 260.0 139.6 104.2 15.3
Leon 1,937 154.7 81.8 57.8 16.9 6.9
Gadsden 1,751 154.1 115.6 51.5 58.8 5.0
Jefferson 445 33.7 24.6 11.5 11.9 1.2
Wakulla 302 21.7 14.2 6.1 7.3 0.7
Madison 201 18.3 10.8 5.6 4.5 0.7
Taylor 148 12.2 8.4 3.7 4.2 0.5
Hamilton 87 4.9 2.8 2.3 0.3 0.2
Franklin 84 3.7 1.6 1.1 0.3 0.2
Liberty 8 0.5 0.2 0.1 0.0 0.1
Gainesville 4,289 364.1 227.5 136.9 74.4 15.5
Alachua 2,226 162.6 95.6 71.3 16.8 7.3
Suwannee 519 56.2 39.9 16.6 20.8 2.4
Levy 456 42.2 25.7 17.3 7.0 1.4
Columbia 434 48.5 34.0 17.5 13.9 2.5
Bradford 291 22.2 10.3 5.2 4.3 0.7
Gilchrist 196 10.1 5.2 3.8 1.0 0.4
Dixie 76 7.2 4.8 2.0 2.3 0.4
Union 70 13.9 11.3 2.9 8.1 0.3
Lafayette 22 1.3 0.7 0.4 0.2 0.1
Panama City 2,135 164.0 99.7 65.9 25.3 8.6
Bay 1,493 119.4 73.4 51.0 16.0 6.5
Jackson 218 13.6 7.5 4.2 2.3 0.9
Calhoun 179 13.4 8.1 5.6 2.2 0.4
Holmes 115 4.4 1.9 1.1 0.6 0.2
Washington 88 10.2 7.1 2.8 3.8 0.5
Gulf 43 3.0 1.8 1.2 0.4 0.2
Total All Regions 232,648 21,079.7 13,172.4 8,748.5 3,426.9 997.0
Regions and counties rank-ordered by employment.
Source: IMPLAN model and Florida state and county data (Implan Group, LLC)
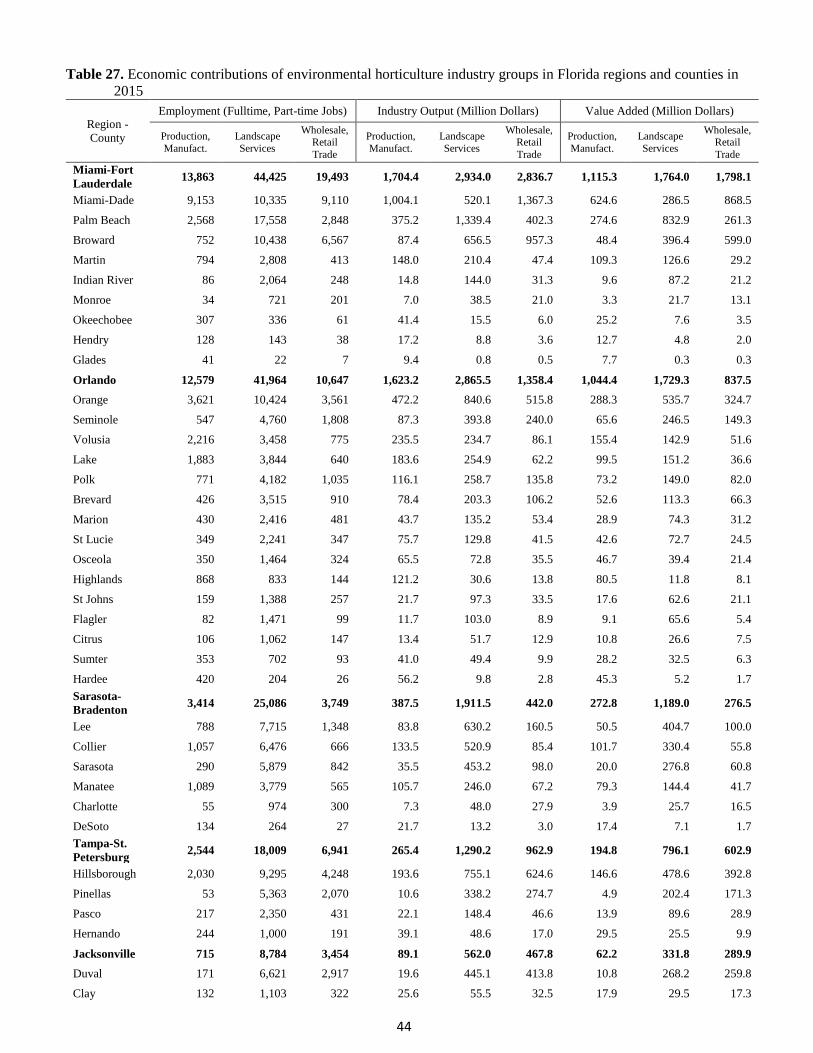
44
Table 27. Economic contributions of environmental horticulture industry groups in Florida regions and counties in
2015
Region -
County
Employment (Fulltime, Part-time Jobs) Industry Output (Million Dollars) Value Added (Million Dollars)
Production,
Manufact.
Landscape
Services
Wholesale, Retail
Trade
Production,
Manufact.
Landscape
Services
Wholesale, Retail
Trade
Production,
Manufact.
Landscape
Services
Wholesale, Retail
Trade
Miami-Fort
Lauderdale 13,863 44,425 19,493 1,704.4 2,934.0 2,836.7 1,115.3 1,764.0 1,798.1
Miami-Dade 9,153 10,335 9,110 1,004.1 520.1 1,367.3 624.6 286.5 868.5
Palm Beach 2,568 17,558 2,848 375.2 1,339.4 402.3 274.6 832.9 261.3
Broward 752 10,438 6,567 87.4 656.5 957.3 48.4 396.4 599.0
Martin 794 2,808 413 148.0 210.4 47.4 109.3 126.6 29.2
Indian River 86 2,064 248 14.8 144.0 31.3 9.6 87.2 21.2
Monroe 34 721 201 7.0 38.5 21.0 3.3 21.7 13.1
Okeechobee 307 336 61 41.4 15.5 6.0 25.2 7.6 3.5
Hendry 128 143 38 17.2 8.8 3.6 12.7 4.8 2.0
Glades 41 22 7 9.4 0.8 0.5 7.7 0.3 0.3
Orlando 12,579 41,964 10,647 1,623.2 2,865.5 1,358.4 1,044.4 1,729.3 837.5
Orange 3,621 10,424 3,561 472.2 840.6 515.8 288.3 535.7 324.7
Seminole 547 4,760 1,808 87.3 393.8 240.0 65.6 246.5 149.3
Volusia 2,216 3,458 775 235.5 234.7 86.1 155.4 142.9 51.6
Lake 1,883 3,844 640 183.6 254.9 62.2 99.5 151.2 36.6
Polk 771 4,182 1,035 116.1 258.7 135.8 73.2 149.0 82.0
Brevard 426 3,515 910 78.4 203.3 106.2 52.6 113.3 66.3
Marion 430 2,416 481 43.7 135.2 53.4 28.9 74.3 31.2
St Lucie 349 2,241 347 75.7 129.8 41.5 42.6 72.7 24.5
Osceola 350 1,464 324 65.5 72.8 35.5 46.7 39.4 21.4
Highlands 868 833 144 121.2 30.6 13.8 80.5 11.8 8.1
St Johns 159 1,388 257 21.7 97.3 33.5 17.6 62.6 21.1
Flagler 82 1,471 99 11.7 103.0 8.9 9.1 65.6 5.4
Citrus 106 1,062 147 13.4 51.7 12.9 10.8 26.6 7.5
Sumter 353 702 93 41.0 49.4 9.9 28.2 32.5 6.3
Hardee 420 204 26 56.2 9.8 2.8 45.3 5.2 1.7
Sarasota-
Bradenton 3,414 25,086 3,749 387.5 1,911.5 442.0 272.8 1,189.0 276.5
Lee 788 7,715 1,348 83.8 630.2 160.5 50.5 404.7 100.0
Collier 1,057 6,476 666 133.5 520.9 85.4 101.7 330.4 55.8
Sarasota 290 5,879 842 35.5 453.2 98.0 20.0 276.8 60.8
Manatee 1,089 3,779 565 105.7 246.0 67.2 79.3 144.4 41.7
Charlotte 55 974 300 7.3 48.0 27.9 3.9 25.7 16.5
DeSoto 134 264 27 21.7 13.2 3.0 17.4 7.1 1.7
Tampa-St.
Petersburg 2,544 18,009 6,941 265.4 1,290.2 962.9 194.8 796.1 602.9
Hillsborough 2,030 9,295 4,248 193.6 755.1 624.6 146.6 478.6 392.8
Pinellas 53 5,363 2,070 10.6 338.2 274.7 4.9 202.4 171.3
Pasco 217 2,350 431 22.1 148.4 46.6 13.9 89.6 28.9
Hernando 244 1,000 191 39.1 48.6 17.0 29.5 25.5 9.9
Jacksonville 715 8,784 3,454 89.1 562.0 467.8 62.2 331.8 289.9
Duval 171 6,621 2,917 19.6 445.1 413.8 10.8 268.2 259.8
Clay 132 1,103 322 25.6 55.5 32.5 17.9 29.5 17.3
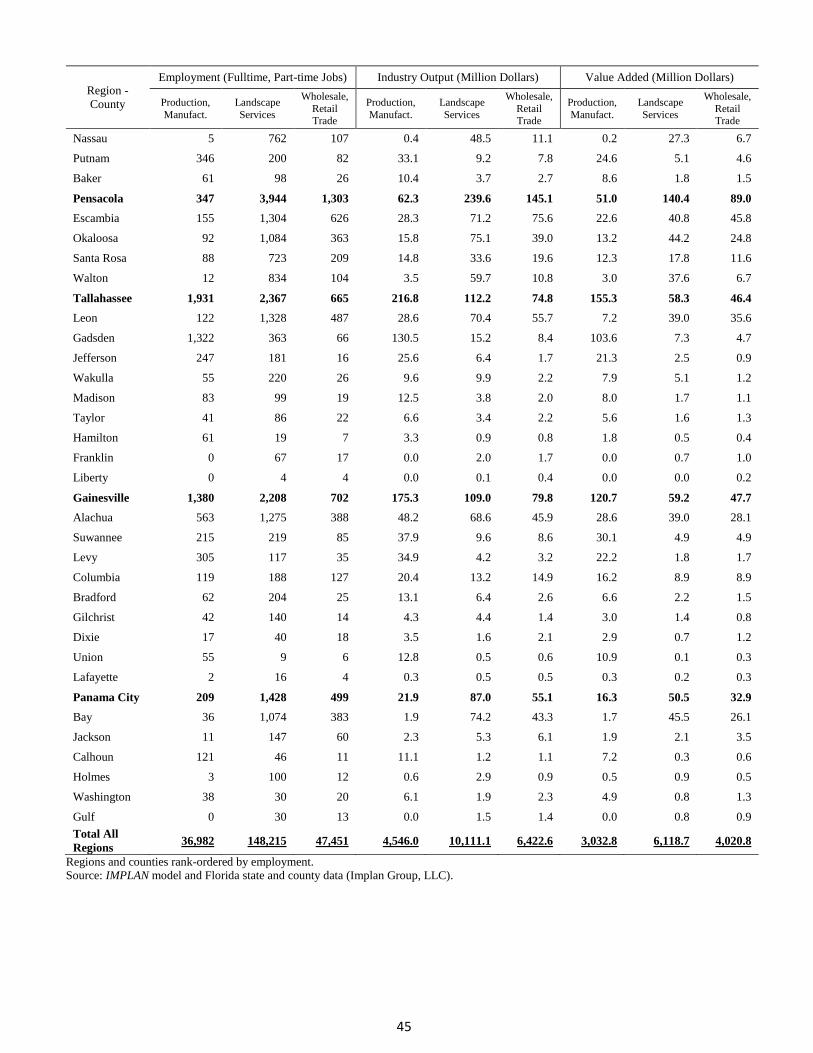
45
Region -
County
Employment (Fulltime, Part-time Jobs) Industry Output (Million Dollars) Value Added (Million Dollars)
Production,
Manufact.
Landscape
Services
Wholesale,
Retail
Trade
Production,
Manufact.
Landscape
Services
Wholesale,
Retail
Trade
Production,
Manufact.
Landscape
Services
Wholesale,
Retail
Trade
Nassau 5 762 107 0.4 48.5 11.1 0.2 27.3 6.7
Putnam 346 200 82 33.1 9.2 7.8 24.6 5.1 4.6
Baker 61 98 26 10.4 3.7 2.7 8.6 1.8 1.5
Pensacola 347 3,944 1,303 62.3 239.6 145.1 51.0 140.4 89.0
Escambia 155 1,304 626 28.3 71.2 75.6 22.6 40.8 45.8
Okaloosa 92 1,084 363 15.8 75.1 39.0 13.2 44.2 24.8
Santa Rosa 88 723 209 14.8 33.6 19.6 12.3 17.8 11.6
Walton 12 834 104 3.5 59.7 10.8 3.0 37.6 6.7
Tallahassee 1,931 2,367 665 216.8 112.2 74.8 155.3 58.3 46.4
Leon 122 1,328 487 28.6 70.4 55.7 7.2 39.0 35.6
Gadsden 1,322 363 66 130.5 15.2 8.4 103.6 7.3 4.7
Jefferson 247 181 16 25.6 6.4 1.7 21.3 2.5 0.9
Wakulla 55 220 26 9.6 9.9 2.2 7.9 5.1 1.2
Madison 83 99 19 12.5 3.8 2.0 8.0 1.7 1.1
Taylor 41 86 22 6.6 3.4 2.2 5.6 1.6 1.3
Hamilton 61 19 7 3.3 0.9 0.8 1.8 0.5 0.4
Franklin 0 67 17 0.0 2.0 1.7 0.0 0.7 1.0
Liberty 0 4 4 0.0 0.1 0.4 0.0 0.0 0.2
Gainesville 1,380 2,208 702 175.3 109.0 79.8 120.7 59.2 47.7
Alachua 563 1,275 388 48.2 68.6 45.9 28.6 39.0 28.1
Suwannee 215 219 85 37.9 9.6 8.6 30.1 4.9 4.9
Levy 305 117 35 34.9 4.2 3.2 22.2 1.8 1.7
Columbia 119 188 127 20.4 13.2 14.9 16.2 8.9 8.9
Bradford 62 204 25 13.1 6.4 2.6 6.6 2.2 1.5
Gilchrist 42 140 14 4.3 4.4 1.4 3.0 1.4 0.8
Dixie 17 40 18 3.5 1.6 2.1 2.9 0.7 1.2
Union 55 9 6 12.8 0.5 0.6 10.9 0.1 0.3
Lafayette 2 16 4 0.3 0.5 0.5 0.3 0.2 0.3
Panama City 209 1,428 499 21.9 87.0 55.1 16.3 50.5 32.9
Bay 36 1,074 383 1.9 74.2 43.3 1.7 45.5 26.1
Jackson 11 147 60 2.3 5.3 6.1 1.9 2.1 3.5
Calhoun 121 46 11 11.1 1.2 1.1 7.2 0.3 0.6
Holmes 3 100 12 0.6 2.9 0.9 0.5 0.9 0.5
Washington 38 30 20 6.1 1.9 2.3 4.9 0.8 1.3
Gulf 0 30 13 0.0 1.5 1.4 0.0 0.8 0.9
Total All
Regions 36,982 148,215 47,451 4,546.0 10,111.1 6,422.6 3,032.8 6,118.7 4,020.8
Regions and counties rank-ordered by employment. Source: IMPLAN model and Florida state and county data (Implan Group, LLC).
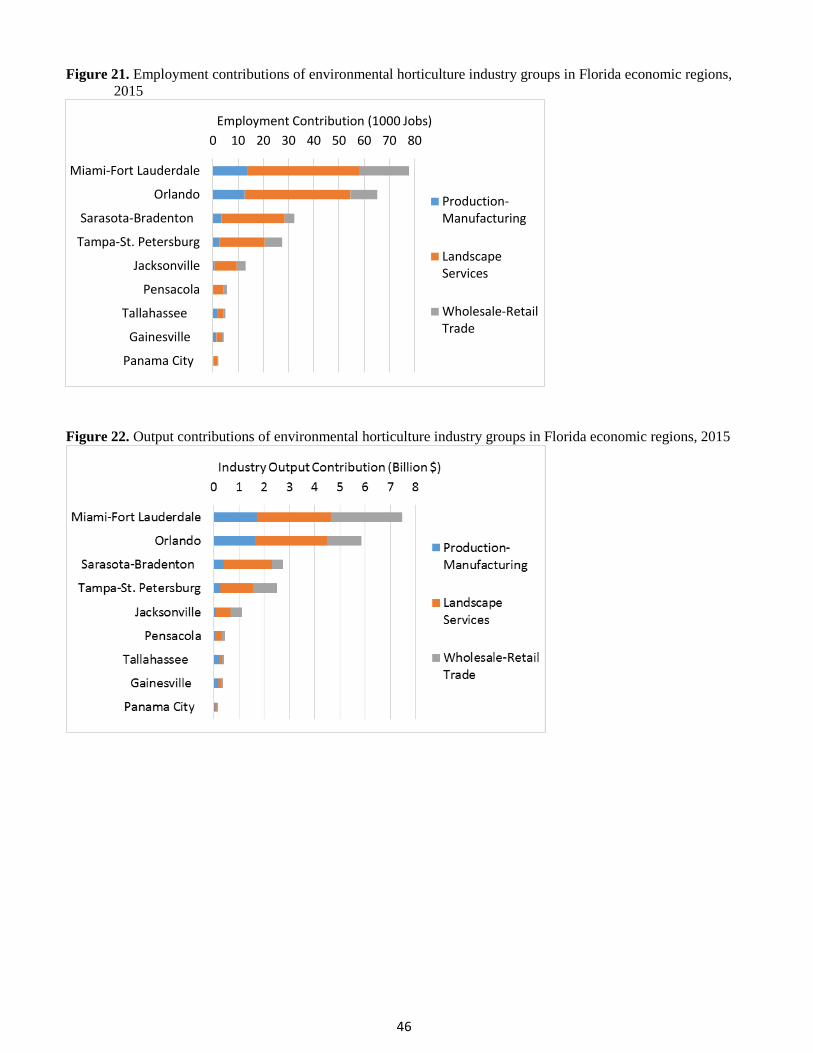
46
Figure 21. Employment contributions of environmental horticulture industry groups in Florida economic regions,
2015
Figure 22. Output contributions of environmental horticulture industry groups in Florida economic regions, 2015
0 10 20 30 40 50 60 70 80
Miami-Fort Lauderdale
Orlando
Sarasota-Bradenton
Tampa-St. Petersburg
Jacksonville
Pensacola
Tallahassee
Gainesville
Panama City
Employment Contribution (1000 Jobs)
Production-Manufacturing
LandscapeServices
Wholesale-RetailTrade
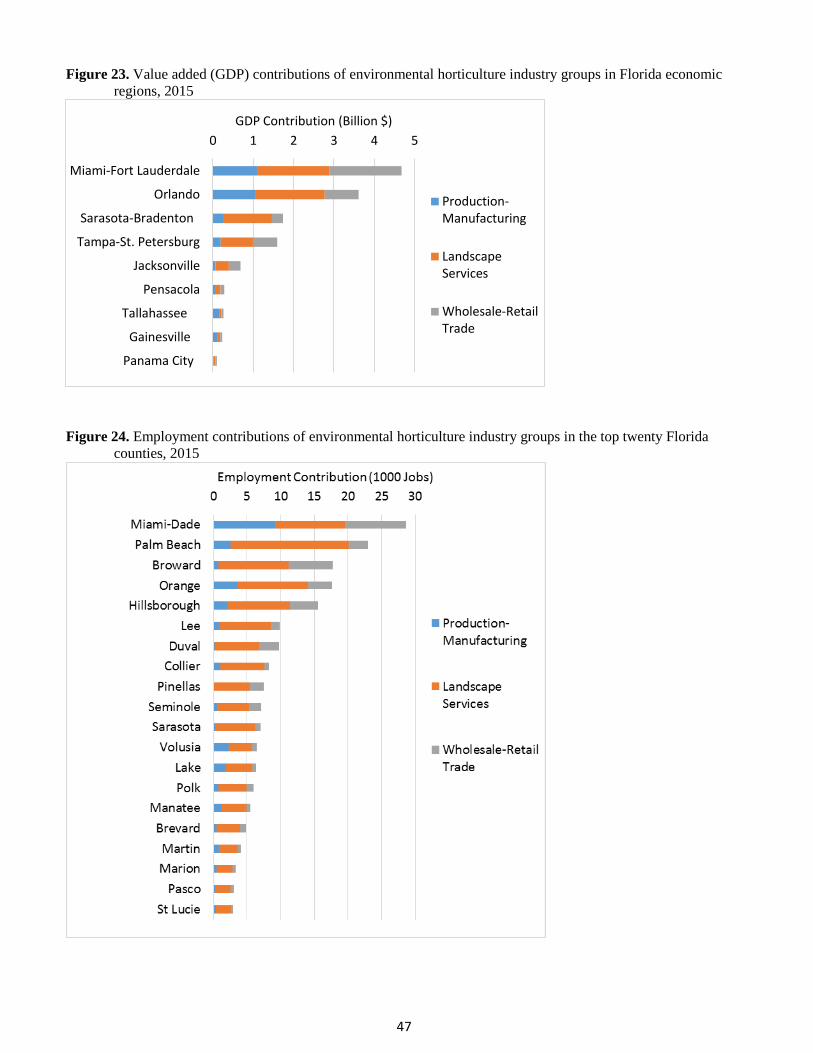
47
Figure 23. Value added (GDP) contributions of environmental horticulture industry groups in Florida economic
regions, 2015
Figure 24. Employment contributions of environmental horticulture industry groups in the top twenty Florida
counties, 2015
0 1 2 3 4 5
Miami-Fort Lauderdale
Orlando
Sarasota-Bradenton
Tampa-St. Petersburg
Jacksonville
Pensacola
Tallahassee
Gainesville
Panama City
GDP Contribution (Billion $)
Production-Manufacturing
LandscapeServices
Wholesale-RetailTrade
48
Comparison to Previous Studies
The economic contribution results of the present study for 2015 were compared with previous studies for 2000,
2005 and 2010, as summarized in Table 28 and Figures 25-27. The previous studies were conducted using similar,
though not identical methods, so the overall results are broadly comparable, but may not be so for some detailed
sectors or measures. All monetary values were adjusted for inflation to express in 2015 dollars. Total industry
output contributions increased from $12.310 billion in 2000 to $21.080 billion in 2015, an increase of 71 percent
over the 15 year period, and 19.2 percent during the most recent period between 2010 and 2015. The increase in
output contributions since 2000 was positive for landscape services (122%) and wholesale/retail distribution
sectors (109%), but was negative for nursery production and allied manufacturing (-3.0%). In terms of
employment, the number of direct jobs increased by 13.5 percent since 2000, but declined by 17.2 percent between
2010 and 2015 (Figure 25). Consistent with the direct employment trends, total employment contributions also
increased since 2000 (23.8%) but decreased -4.7 percent during 2010-15 (Figure 26). The decline in direct
employment since 2005 reflects general economic trends in the broader economy towards workforce reduction to
reduce labor costs, and increasing worker productivity, i.e. greater output per worker. Value added (GDP)
contributions increased by 53.2 percent since 2000, and 22.5 percent during the recent period, including a 138
percent increase for wholesale/retail trade and 70.5 percent increase for landscape services (Figure 27). The large
increase for wholesale/retail trade sectors partly reflects a change in methodology for the present study, which
relied on secondary data sources from the IMPLAN model and employment data from the Quarterly Census of
Employment and Wages rather than survey-based estimates.
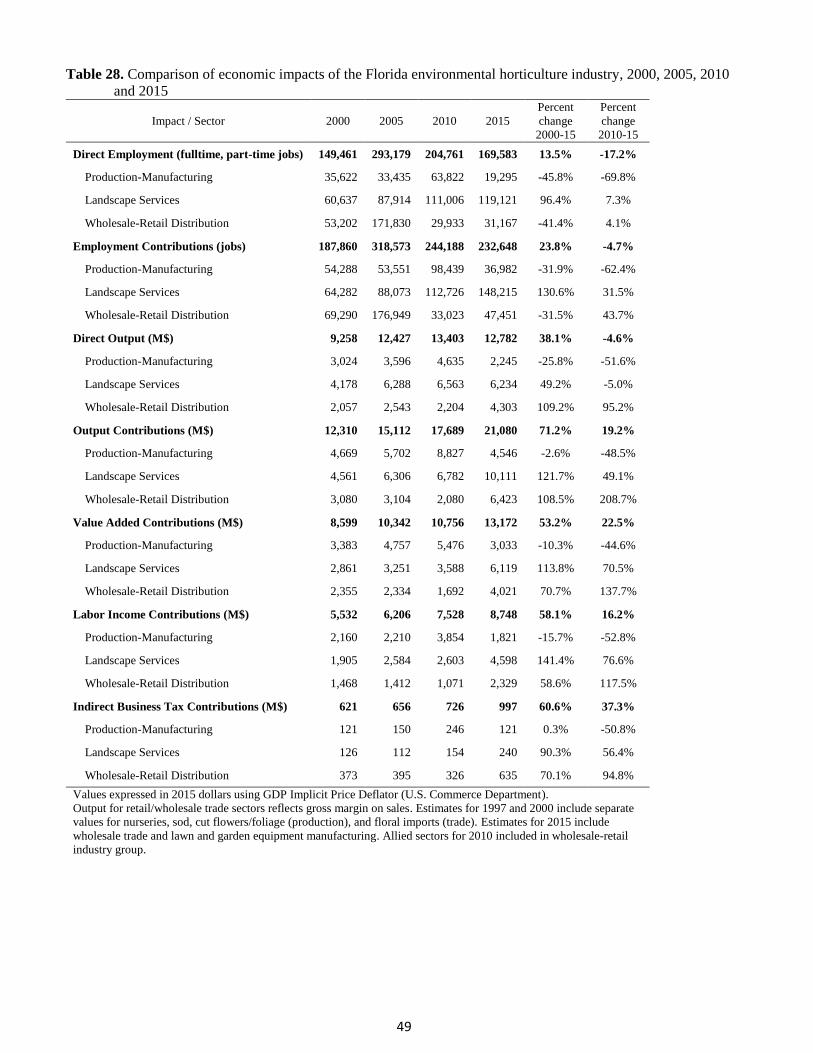
49
Table 28. Comparison of economic impacts of the Florida environmental horticulture industry, 2000, 2005, 2010
and 2015
Impact / Sector 2000 2005 2010 2015
Percent
change
2000-15
Percent
change
2010-15
Direct Employment (fulltime, part-time jobs) 149,461 293,179 204,761 169,583 13.5% -17.2%
Production-Manufacturing 35,622 33,435 63,822 19,295 -45.8% -69.8%
Landscape Services 60,637 87,914 111,006 119,121 96.4% 7.3%
Wholesale-Retail Distribution 53,202 171,830 29,933 31,167 -41.4% 4.1%
Employment Contributions (jobs) 187,860 318,573 244,188 232,648 23.8% -4.7%
Production-Manufacturing 54,288 53,551 98,439 36,982 -31.9% -62.4%
Landscape Services 64,282 88,073 112,726 148,215 130.6% 31.5%
Wholesale-Retail Distribution 69,290 176,949 33,023 47,451 -31.5% 43.7%
Direct Output (M$) 9,258 12,427 13,403 12,782 38.1% -4.6%
Production-Manufacturing 3,024 3,596 4,635 2,245 -25.8% -51.6%
Landscape Services 4,178 6,288 6,563 6,234 49.2% -5.0%
Wholesale-Retail Distribution 2,057 2,543 2,204 4,303 109.2% 95.2%
Output Contributions (M$) 12,310 15,112 17,689 21,080 71.2% 19.2%
Production-Manufacturing 4,669 5,702 8,827 4,546 -2.6% -48.5%
Landscape Services 4,561 6,306 6,782 10,111 121.7% 49.1%
Wholesale-Retail Distribution 3,080 3,104 2,080 6,423 108.5% 208.7%
Value Added Contributions (M$) 8,599 10,342 10,756 13,172 53.2% 22.5%
Production-Manufacturing 3,383 4,757 5,476 3,033 -10.3% -44.6%
Landscape Services 2,861 3,251 3,588 6,119 113.8% 70.5%
Wholesale-Retail Distribution 2,355 2,334 1,692 4,021 70.7% 137.7%
Labor Income Contributions (M$) 5,532 6,206 7,528 8,748 58.1% 16.2%
Production-Manufacturing 2,160 2,210 3,854 1,821 -15.7% -52.8%
Landscape Services 1,905 2,584 2,603 4,598 141.4% 76.6%
Wholesale-Retail Distribution 1,468 1,412 1,071 2,329 58.6% 117.5%
Indirect Business Tax Contributions (M$) 621 656 726 997 60.6% 37.3%
Production-Manufacturing 121 150 246 121 0.3% -50.8%
Landscape Services 126 112 154 240 90.3% 56.4%
Wholesale-Retail Distribution 373 395 326 635 70.1% 94.8%
Values expressed in 2015 dollars using GDP Implicit Price Deflator (U.S. Commerce Department).
Output for retail/wholesale trade sectors reflects gross margin on sales. Estimates for 1997 and 2000 include separate
values for nurseries, sod, cut flowers/foliage (production), and floral imports (trade). Estimates for 2015 include
wholesale trade and lawn and garden equipment manufacturing. Allied sectors for 2010 included in wholesale-retail
industry group.
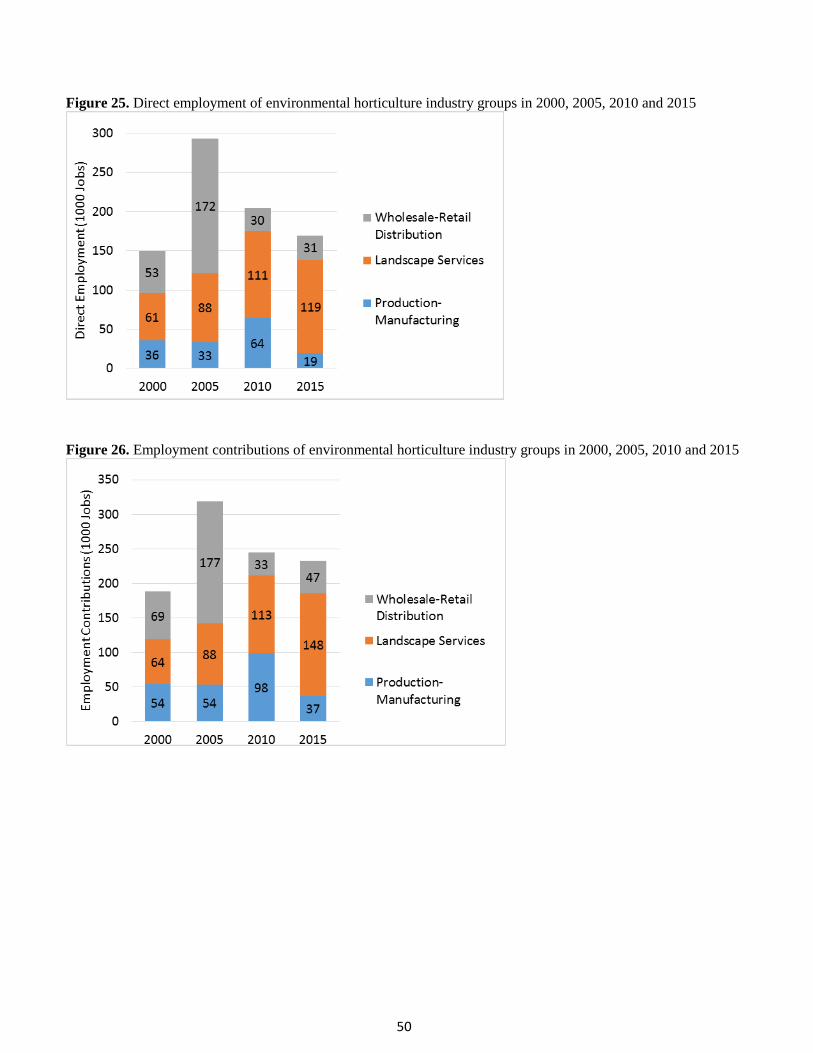
50
Figure 25. Direct employment of environmental horticulture industry groups in 2000, 2005, 2010 and 2015
Figure 26. Employment contributions of environmental horticulture industry groups in 2000, 2005, 2010 and 2015
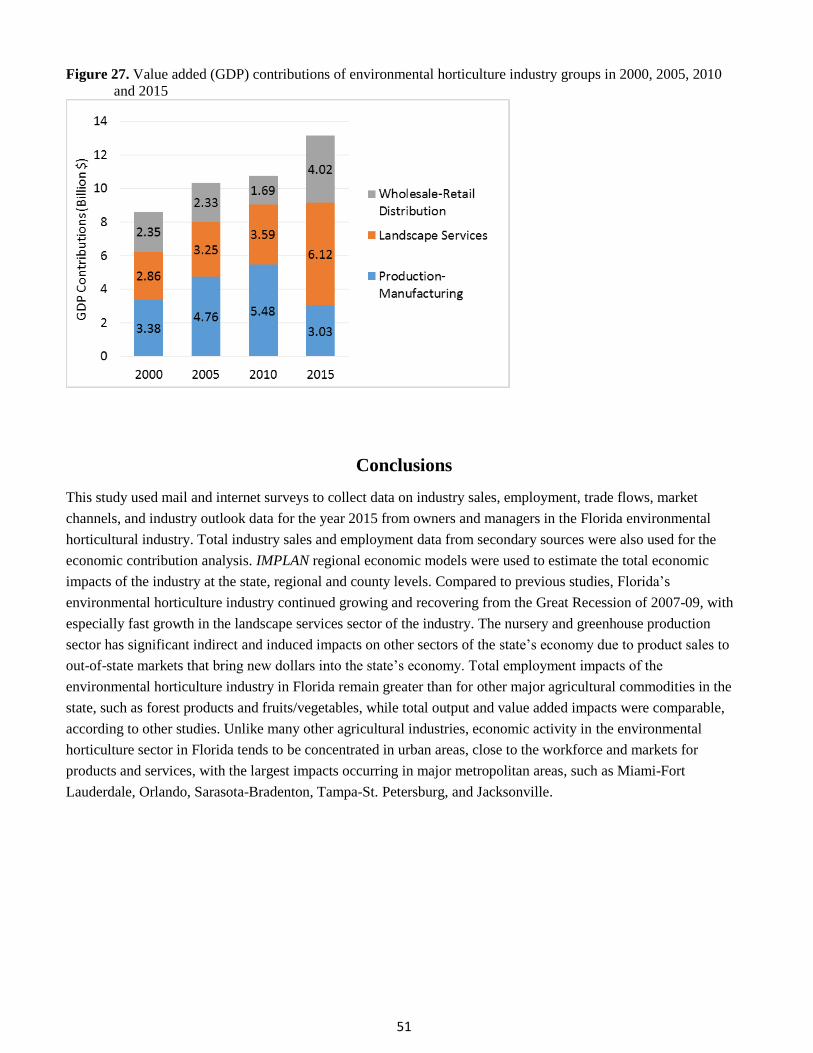
51
Figure 27. Value added (GDP) contributions of environmental horticulture industry groups in 2000, 2005, 2010
and 2015
Conclusions
This study used mail and internet surveys to collect data on industry sales, employment, trade flows, market
channels, and industry outlook data for the year 2015 from owners and managers in the Florida environmental
horticultural industry. Total industry sales and employment data from secondary sources were also used for the
economic contribution analysis. IMPLAN regional economic models were used to estimate the total economic
impacts of the industry at the state, regional and county levels. Compared to previous studies, Florida’s
environmental horticulture industry continued growing and recovering from the Great Recession of 2007-09, with
especially fast growth in the landscape services sector of the industry. The nursery and greenhouse production
sector has significant indirect and induced impacts on other sectors of the state’s economy due to product sales to
out-of-state markets that bring new dollars into the state’s economy. Total employment impacts of the
environmental horticulture industry in Florida remain greater than for other major agricultural commodities in the
state, such as forest products and fruits/vegetables, while total output and value added impacts were comparable,
according to other studies. Unlike many other agricultural industries, economic activity in the environmental
horticulture sector in Florida tends to be concentrated in urban areas, close to the workforce and markets for
products and services, with the largest impacts occurring in major metropolitan areas, such as Miami-Fort
Lauderdale, Orlando, Sarasota-Bradenton, Tampa-St. Petersburg, and Jacksonville.
52
Literature and Information Sources Cited
Dillman, D. Mail and Internet Surveys: The Tailored Design Method, John Wiley & Sons, New York, 2000.
Hodges, A.W., C. R. Hall, M.A. Palma and H. Khachatryan. Economic Contributions of the Green Industry in the
United States in 2013, HortTechnology, vol. 25(6), pp. 805-814, Dec. 2015.
Hodges, A.W., T.J. Stevens, M. Rahmani and H. Khachatryan. Economic Impacts of the Florida Environmental
Horticulture Industry in 2010, sponsored project report to the Florida Nursery, Growers and Landscape
Association, University of Florida-IFAS, Food & Resource Economics Department, Gainesville, 38 pages, Aug.
2011, available at http://www.fred.ifas.ufl.edu/pdf/economic-impact-
analysis/Economic_Contributions_Florida_Environmental_Horticulture_Industry_2010.pdf
Hodges, A.W. and J.J. Haydu. Economic Impacts of the Florida Environmental Horticulture Industry in 2005,
sponsored project report to the FNGLA, University of Florida-IFAS, Food and Resource Economics Department,
Gainesville, 39 pages, Sep. 2006, available at http://www.fred.ifas.ufl.edu/pdf/economic-impact-
analysis/FE67500.pdf.
Hodges, A.W. and J.J. Haydu. Economic Impacts of the Florida Environmental Horticulture Industry, 2000.
Economic Information Report EI 02-3. University of Florida-IFAS, Food and Resource Economics Department,
Gainesville, 87 pages, Apr. 2002.
IMPLAN Group LLC. IMPLAN Economic Impact Analysis and Social Accounting Software and 2014
State/County data for Florida, Huntersville, NC, 2015.
Miller, R. E., and P. D. Blair. Input-Output Analysis: Foundations and Extensions, 2nd ed. Cambridge, UK:
Cambridge University Press, 750 pages, 2009.
Survey Monkey Online Survey System. https://www.surveymonkey.com/.
U.S. Department of Agriculture, National Agricultural Statistics Service (USDA-NASS). Census of Horticultural
Specialties, 2014, vol. 3, Special studies, part 3, AC-12-SS-3, Washington, D.C., Dec. 2015.
U.S. Dept. of Commerce, Bureau of Economic Analysis (USDOC-BEA). Gross Domestic Product Implicit Price
Deflator, 1947-2016, quarterly, Washington, D.C., available at https://fred.stlouisfed.org/series/GDPDEF/.
U.S. Dept. of Commerce. North American Industry Classification System online lookup tool (2012 vintage),
Washington, D.C., available at http://www.census.gov/eos/www/naics/
U.S. Dept. of Commerce. 2012 Economic Census, Product Line Statistics for Wholesale Trade and Retail Trade,
Washington, D.C., available at http://www.census.gov/econ/census/.
U.S. Department of Labor, Bureau of Labor Statistics (USDOL-BLS). Quarterly Census of Employment and
Wages, available at http://www.bls.gov/cew/data.htm.
Watson, P., J. Wilson, D. Thilmany, and S. Winter. Determining Economic Contributions and Impacts: What is the
Difference and Why Do We Care? Journal of Regional Analysis and Policy 37 (2): 140-146, 2007,
http://www.jrap-journal.org/pastvolumes/2000/v37/F37-2-6.pdf.
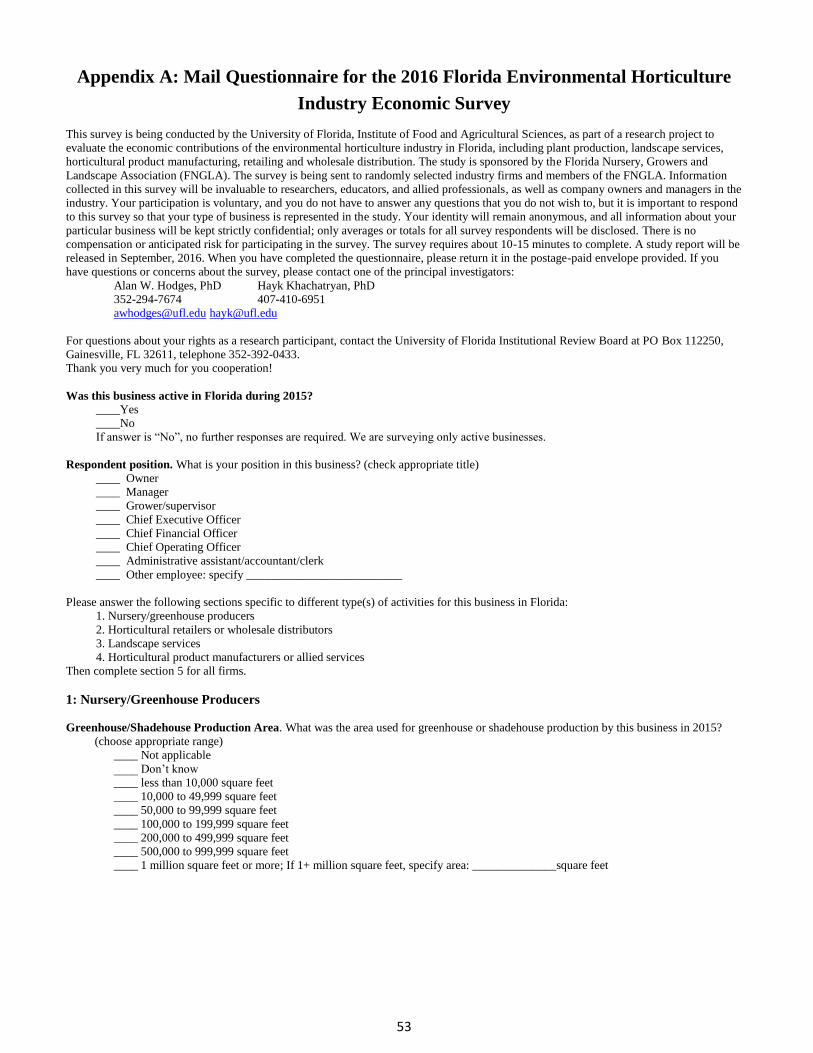
53
Appendix A: Mail Questionnaire for the 2016 Florida Environmental Horticulture
Industry Economic Survey
This survey is being conducted by the University of Florida, Institute of Food and Agricultural Sciences, as part of a research project to
evaluate the economic contributions of the environmental horticulture industry in Florida, including plant production, landscape services,
horticultural product manufacturing, retailing and wholesale distribution. The study is sponsored by the Florida Nursery, Growers and
Landscape Association (FNGLA). The survey is being sent to randomly selected industry firms and members of the FNGLA. Information
collected in this survey will be invaluable to researchers, educators, and allied professionals, as well as company owners and managers in the
industry. Your participation is voluntary, and you do not have to answer any questions that you do not wish to, but it is important to respond
to this survey so that your type of business is represented in the study. Your identity will remain anonymous, and all information about your
particular business will be kept strictly confidential; only averages or totals for all survey respondents will be disclosed. There is no
compensation or anticipated risk for participating in the survey. The survey requires about 10-15 minutes to complete. A study report will be
released in September, 2016. When you have completed the questionnaire, please return it in the postage-paid envelope provided. If you
have questions or concerns about the survey, please contact one of the principal investigators:
Alan W. Hodges, PhD Hayk Khachatryan, PhD
352-294-7674 407-410-6951
[email protected] [email protected]
For questions about your rights as a research participant, contact the University of Florida Institutional Review Board at PO Box 112250,
Gainesville, FL 32611, telephone 352-392-0433.
Thank you very much for you cooperation!
Was this business active in Florida during 2015?
____Yes
____No
If answer is “No”, no further responses are required. We are surveying only active businesses.
Respondent position. What is your position in this business? (check appropriate title)
____ Owner
____ Manager
____ Grower/supervisor
____ Chief Executive Officer
____ Chief Financial Officer
____ Chief Operating Officer
____ Administrative assistant/accountant/clerk
____ Other employee: specify __________________________
Please answer the following sections specific to different type(s) of activities for this business in Florida:
1. Nursery/greenhouse producers
2. Horticultural retailers or wholesale distributors
3. Landscape services
4. Horticultural product manufacturers or allied services
Then complete section 5 for all firms.
1: Nursery/Greenhouse Producers
Greenhouse/Shadehouse Production Area. What was the area used for greenhouse or shadehouse production by this business in 2015?
(choose appropriate range)
____ Not applicable
____ Don’t know
____ less than 10,000 square feet
____ 10,000 to 49,999 square feet
____ 50,000 to 99,999 square feet
____ 100,000 to 199,999 square feet
____ 200,000 to 499,999 square feet
____ 500,000 to 999,999 square feet
____ 1 million square feet or more; If 1+ million square feet, specify area: ______________square feet
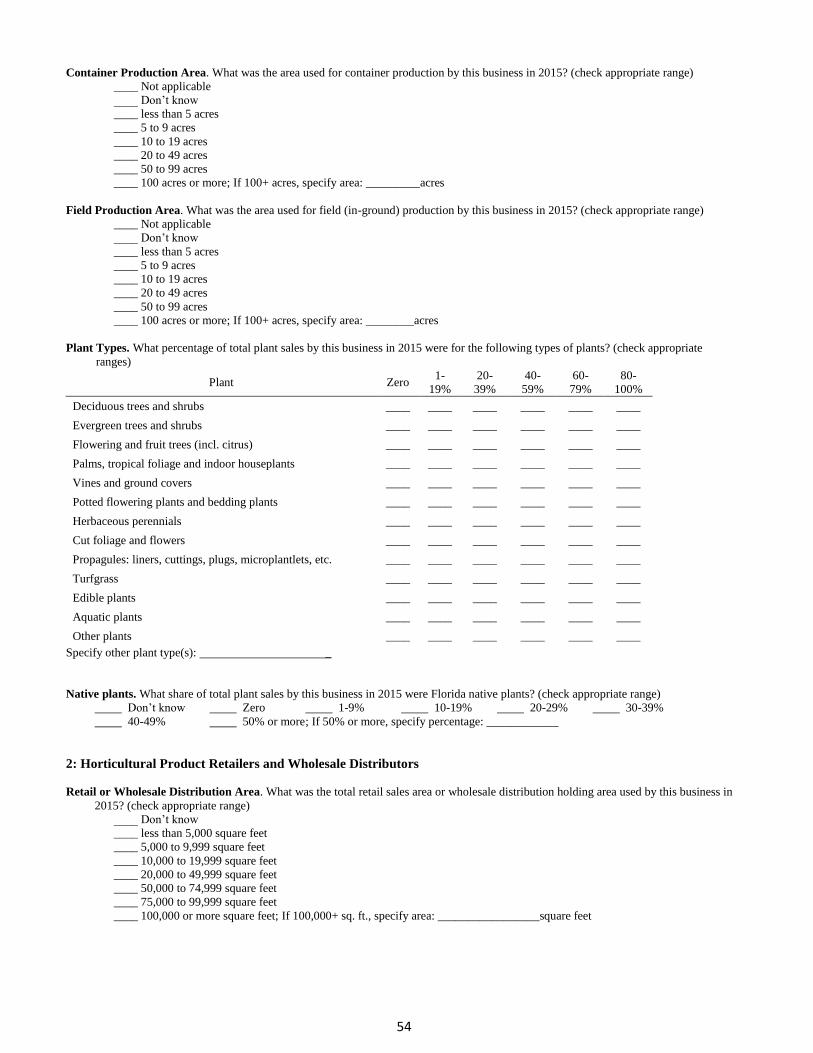
54
Container Production Area. What was the area used for container production by this business in 2015? (check appropriate range)
____ Not applicable
____ Don’t know
____ less than 5 acres
____ 5 to 9 acres
____ 10 to 19 acres
____ 20 to 49 acres
____ 50 to 99 acres
____ 100 acres or more; If 100+ acres, specify area: _________acres
Field Production Area. What was the area used for field (in-ground) production by this business in 2015? (check appropriate range)
____ Not applicable
____ Don’t know
____ less than 5 acres
____ 5 to 9 acres
____ 10 to 19 acres
____ 20 to 49 acres
____ 50 to 99 acres
____ 100 acres or more; If 100+ acres, specify area: ________acres
Plant Types. What percentage of total plant sales by this business in 2015 were for the following types of plants? (check appropriate
ranges)
Plant Zero 1-
19%
20-
39%
40-
59%
60-
79%
80-
100%
Deciduous trees and shrubs ____ ____ ____ ____ ____ ____
Evergreen trees and shrubs ____ ____ ____ ____ ____ ____
Flowering and fruit trees (incl. citrus) ____ ____ ____ ____ ____ ____
Palms, tropical foliage and indoor houseplants ____ ____ ____ ____ ____ ____
Vines and ground covers ____ ____ ____ ____ ____ ____
Potted flowering plants and bedding plants ____ ____ ____ ____ ____ ____
Herbaceous perennials ____ ____ ____ ____ ____ ____
Cut foliage and flowers ____ ____ ____ ____ ____ ____
Propagules: liners, cuttings, plugs, microplantlets, etc. ____ ____ ____ ____ ____ ____
Turfgrass ____ ____ ____ ____ ____ ____
Edible plants ____ ____ ____ ____ ____ ____
Aquatic plants ____ ____ ____ ____ ____ ____
Other plants ____ ____ ____ ____ ____ ____
Specify other plant type(s): _
Native plants. What share of total plant sales by this business in 2015 were Florida native plants? (check appropriate range)
Don’t know Zero 1-9% 10-19% 20-29% 30-39%
40-49% 50% or more ; If 50% or more, specify percentage: ____________
2: Horticultural Product Retailers and Wholesale Distributors
Retail or Wholesale Distribution Area. What was the total retail sales area or wholesale distribution holding area used by this business in
2015? (check appropriate range)
____ Don’t know
____ less than 5,000 square feet
____ 5,000 to 9,999 square feet
____ 10,000 to 19,999 square feet
____ 20,000 to 49,999 square feet
____ 50,000 to 74,999 square feet
____ 75,000 to 99,999 square feet
____ 100,000 or more square feet; If 100,000+ sq. ft., specify area: _________________square feet
55
Products. What percentage of total retail or wholesale distributor sales by this business in 2015 were for the following types of products?
(check appropriate ranges)
Product Zero 1-
19%
20-
39%
40-
59%
60-
79%
80-
100%
Plants and seeds ____ ____ ____ ____ ____ ____
Fertilizer ____ ____ ____ ____ ____ ____
Agrichemicals ____ ____ ____ ____ ____ ____
Nursery containers ____ ____ ____ ____ ____ ____
Soil and growing media ____ ____ ____ ____ ____ ____
Tools and equipment ____ ____ ____ ____ ____ ____
Irrigation parts ____ ____ ____ ____ ____ ____
Other products ____ ____ ____ ____ ____ ____
Specify other product type(s): _
3: Landscape Service Firms
What percentage of total landscape service sales by this business in 2015 were for the following types of services? (check appropriate
ranges)
Service Zero 1-
19%
20-
39%
40-
59%
60-
79%
80-
100%
Landscape design ____ ____ ____ ____ ____ ____
Landscape installation ____ ____ ____ ____ ____ ____
Irrigation installation and service ____ ____ ____ ____ ____ ____
Landscape maintenance and lawncare ____ ____ ____ ____ ____ ____
Interiorscaping ____ ____ ____ ____ ____ ____
Pest control ____ ____ ____ ____ ____ ____
Other services ____ ____ ____ ____ ____ ____
Specify other service type(s): _
4: Horticultural Product Manufacturers and Allied Services
What percentage of total sales by this business in 2015 were for the following types of products and services? (check appropriate ranges)
Product/Service Zero 1-
19%
20-
39%
40-
59%
60-
79%
80-
100%
Soil media, peat ____ ____ ____ ____ ____ ____
Horticultural containers ____ ____ ____ ____ ____ ____
Fertilizer ____ ____ ____ ____ ____ ____
Agrichemicals ____ ____ ____ ____ ____ ____
Packaging materials ____ ____ ____ ____ ____ ____
Equipment, tools ____ ____ ____ ____ ____ ____
Irrigation equipment ____ ____ ____ ____ ____ ____
Greenhouse structures ____ ____ ____ ____ ____ ____
Transportation, logistics ____ ____ ____ ____ ____ ____
Business or technical consulting services ____ ____ ____ ____ ____ ____
Other products or services ____ ____ ____ ____ ____ ____
Specify other type(s): _
56
5: All Firms
Employment. How many permanent full-time and part-time, temporary or seasonal employees worked for Florida operations of this
business in 2015, including management and unpaid family members? (enter numbers)
Permanent, full-time employees
Temporary, part-time or seasonal employees (during peak season)
How many employee positions were unfilled in this business last year? _______
Product Features and Services Offered. Which of the following product features or services are offered by this business? (check any that
apply).
____ Florida Friendly plants
____ Pollinator friendly plants
____ Florida Friendly landscaping
____ Landscape water features (pools, fountains)
____ Plant identification/care tagging
____ Decorative plant containers
____ Biodegradeable plant containers
____ Branded products
____ Delivery
____ Mail order
____ Internet ordering
____ Favored customer reward programs
____ Educational programs
____ Other: specify ___________________________________
Business Line Sales. What percentage of the total sales by Florida operations of this business in 2015 were for the following types of
activities? (enter number for each type applicable; answers should sum to 100%)
______% Nursery/greenhouse plant production
______% Retail garden center
______% Wholesale distribution of horticultural products
______% Landscape services
______% Manufacturing of horticultural products or allied services
Market Area. What percentage of total sales by Florida operations of this business in 2015 were to the following geographic areas (enter
number for each area; answers should sum to 100%).
______% Local city or county, or within a 50 mile radius
______% State of Florida outside local area
______% National (states outside Florida)
______% International
Customers. What percentage of total sales by this business in 2015 were to the following types of customers? (check appropriate ranges)
Customer Type Zero 1-
19%
20-
39%
40-
59%
60-
79%
80-
100%
Nursery and greenhouse growers ____ ____ ____ ____ ____ ____
Landscape contractors, lawncare and interiorscape firms ____ ____ ____ ____ ____ ____
Independent retail garden centers ____ ____ ____ ____ ____ ____
Home improvement stores and mass merchandise stores ____ ____ ____ ____ ____ ____
Florists ____ ____ ____ ____ ____ ____
Supermarkets ____ ____ ____ ____ ____ ____
Re-wholesalers and brokers ____ ____ ____ ____ ____ ____
Builders or developers ____ ____ ____ ____ ____ ____
Apartments, condominiums and homeowner associations ____ ____ ____ ____ ____ ____
Commercial establishments: restaurants, hotels, offices, retail stores, etc. ____ ____ ____ ____ ____ ____
Government agencies ____ ____ ____ ____ ____ ____
Homeowners and individual consumers ____ ____ ____ ____ ____ ____
Other types of customers ____ ____ ____ ____ ____ ____
Specify other type(s): _
57
Annual Sales Revenue. What was the total gross sales for Florida operations of this business in 2015 or the most recent completed fiscal
year completed? (enter specific value or check the appropriate range below)
Specific value: $ _
Or select range
Less than $100,000 ____ $100,000 to $249,999
$250,000 to $499,999 $500,000 to $999,999
$1 to $2.49 million $2.5 to $4.99 million
$5 to $9.99 million $10 to $14.99 million
$15 to $19.99 million $20 to $29.99 million
$30 to $39.99 million $40 to $49.99 million
$50 million or more;
If sales were $50 million or more, please indicate the specific value (may round to the nearest million): $_______
Capital investment. What was the amount of capital investment by Florida operations of this business in 2015, and the amount anticipated
over the next three years (2016-18) in each of the following categories.
2015 Next 3 years
Buildings/Structures $__________ $__________
Equipment /Vehicles $__________ $__________
Information technology $__________ $__________
Other $__________ $__________
Specify other: _________________________________________
Business Threats. How would you rate the importance of the following potential threats to this business? (check appropriate ratings)
No
t
Imp
ort
ant
Mo
der
atel
y
Imp
ort
ant
Ver
y
Imp
ort
ant
Do
nt
kno
w
Water use restrictions ____ ____ ____ ____
Low prices for product or services ____ ____ ____ ____
Restrictions on pesticides (e.g. neonicotinoids) ____ ____ ____ ____
Restrictions on fertilizer use ____ ____ ____ ____
Increasing costs of production ____ ____ ____ ____
Competition by plant substitutes ____ ____ ____ ____
Market power of large retail chains ____ ____ ____ ____
Government regulations ____ ____ ____ ____
Lack of professionalism ____ ____ ____ ____
General business conditions ____ ____ ____ ____
Labor availability ____ ____ ____ ____
Low worker education or skills ____ ____ ____ ____
Energy costs ____ ____ ____ ____
Healthcare coverage requirements ____ ____ ____ ____
Other ____ ____ ____ ____
Specify other: __________________________________________
6: Comments
Please provide any comments you may have about the economic contributions of this business or the horticulture industry in general.
______________________________________________________________
______________________________________________________________
______________________________________________________________
______________________________________________________________
______________________________________________________________
______________________________________________________________
______________________________________________________________
Please return the completed questionnaire in the postage-paid envelope provided. Thank you very much for you cooperation!