Embed Size (px)
Citation preview

José Miguel Caldas de Almeida
Ana Antunes
Manuela Silva
Economic crisis and mental health in Portugal:
Preliminary results of the national mental health survey follow-up
GulbenkianForumonMentalHealth,24-25November,2016
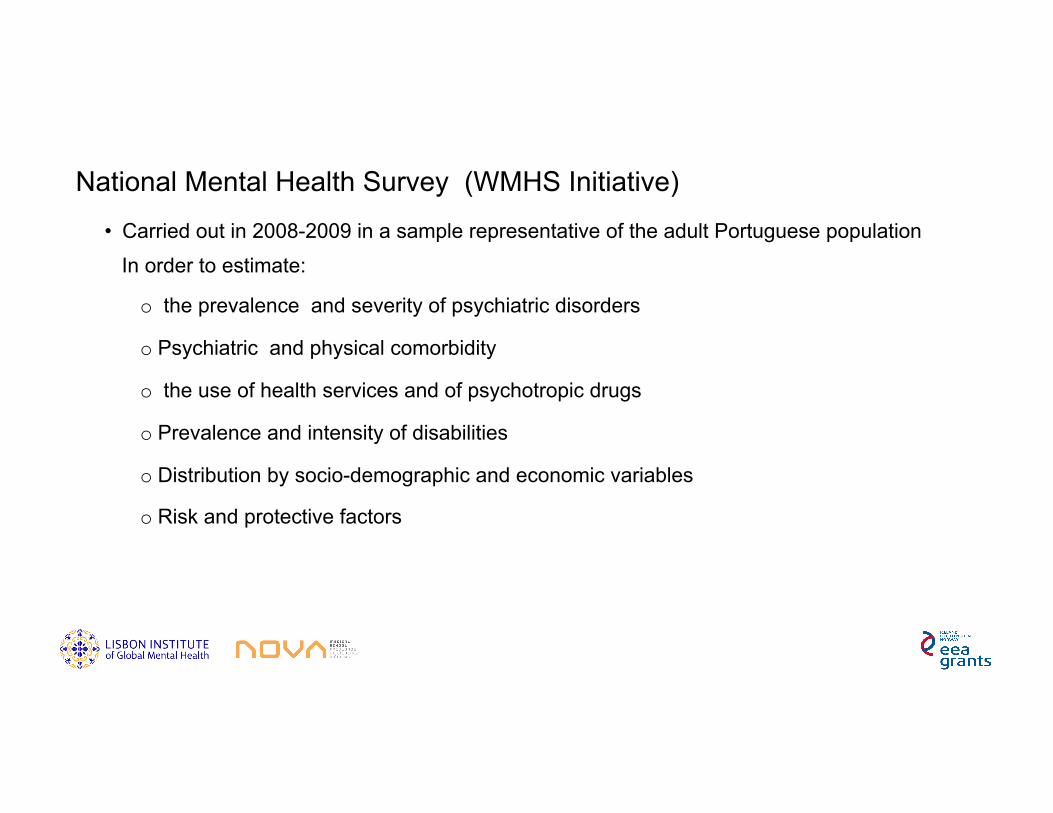
• Carried out in 2008-2009 in a sample representative of the adult Portuguese population
In order to estimate:
o the prevalence and severity of psychiatric disorders
o Psychiatric and physical comorbidity
o the use of health services and of psychotropic drugs
o Prevalence and intensity of disabilities
o Distribution by socio-demographic and economic variables
o Risk and protective factors
National Mental Health Survey (WMHS Initiative)

Prevalence of any mental disorder in the last 12 months in European countries (WMHS Initiative)
23.1 22.9
18.4
14.9
1211.2
9.28.2 8.2
0
5
10
15
20
25
NorthernIreland
Portugal France Netherlands Belgium Bulgaria Spain Italy Romania
AdaptedfromWangetal,2011

Countries Propor;onaltreatmentofserious12-monthdisorders(%)
Belgium 60.9
Bulgaria 31.0
France 48.0
Germany 40.0
Italy 51.0
Netherlands 50.4
Northernireland 72.8
Portugal 66.4
Spain 58.7
Treatment gap in serious mental disorders (WMHS Initiative)
AdaptedfromWangetal,2010

• Funded by the EEA Grants;
• To obtain a new understanding of the effects of the economic crisis in Portugal
on mental-ill health of the populations, determinants of mental disorders, and
use of mental health services;
• To propose new policies, programmes and interventions aimed at the reduction
of health inequalities and mental health problems linked with the crisis.
MH Crisis impact study
• Part I – Follow-up study in 2015 of the national mental health survey:
o In a probability sub-sample of respondents, over-sampling those with a history of mental disorder
o Including modules of the CIDI-SC, 30 days symptoms, use of services and psychotropic drugs, work/employment, social support, finances and community involvement
• Part II - In-depth local case-studies, based on focus groups and semi-structured interviews with key actors in primary care services located in regional contexts specially affected by the crisis.
MH Crisis impact study Methods

Crisis impact on mental health study Sample
n=2059
n=911
29%Notfound/Moved/Migrated(n=595)
21%Refused/notcompleted(n=432)
6%Deceased/Severelydisabled(n=121)
2008
2015
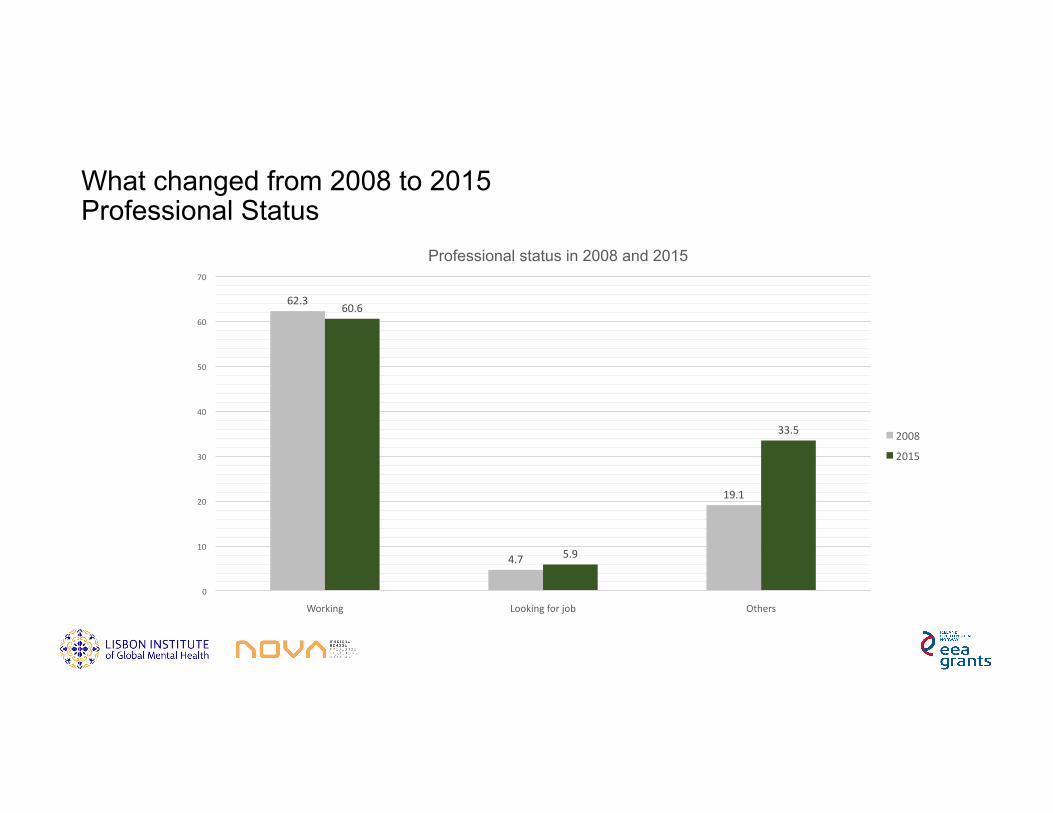
What changed from 2008 to 2015 Professional Status
62.3
4.7
19.1
60.6
5.9
33.5
0
10
20
30
40
50
60
70
Working Lookingforjob Others
Professional status in 2008 and 2015
2008
2015

14.4
41.943.7
Increased Equal Decreased
0
5
10
15
20
25
30
35
40
45
50
Self-reported change in income (last 5 years)
54.1
14.1
6.3 5.7
19.8
0
10
20
30
40
50
60
Cutsinsalaryorpension
Unemployment Changedjob Re;rement Other
%
Reported reasons for change in income
What changed from 2008 to 2015 Economic situation

33.2
39
0
5
10
15
20
25
30
35
40
2008 2015
%
Perceived financial deprivation
What changed from 2008 to 2015 Financial Deprivation
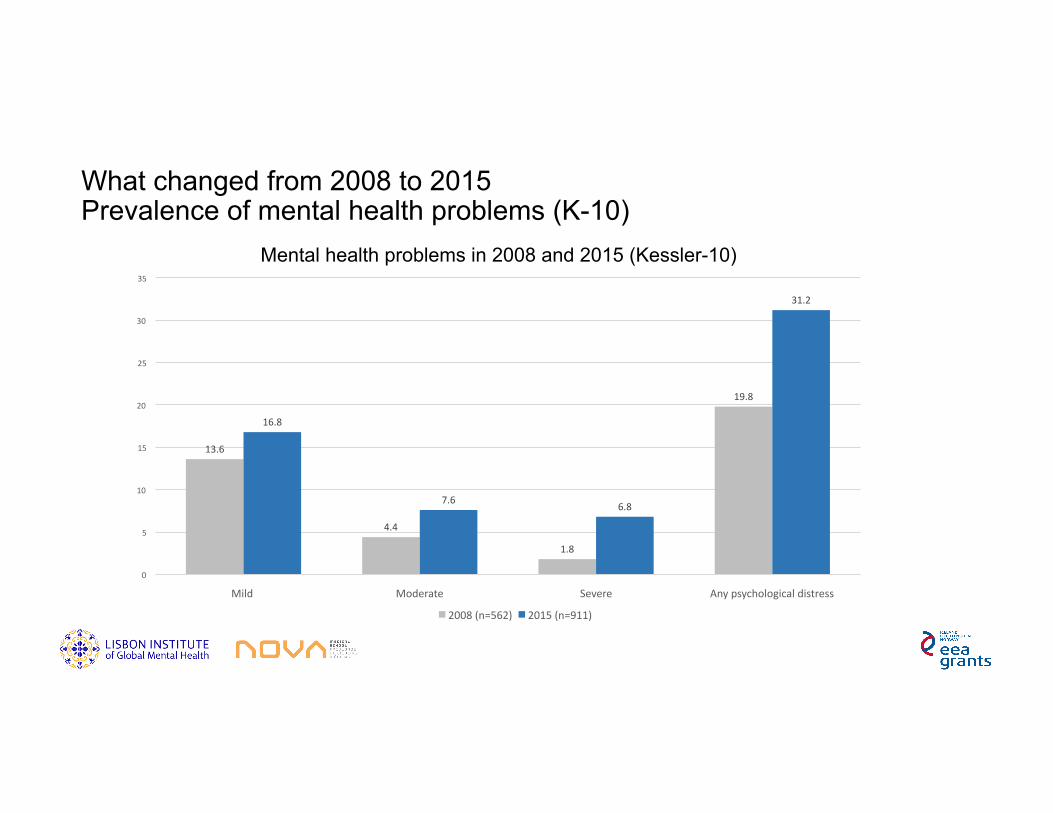
13.6
4.4
1.8
19.8
16.8
7.66.8
31.2
0
5
10
15
20
25
30
35
Mild Moderate Severe Anypsychologicaldistress
Mental health problems in 2008 and 2015 (Kessler-10)
2008(n=562) 2015(n=911)
What changed from 2008 to 2015 Prevalence of mental health problems (K-10)

What changed from 2008 to 2015 Increase of mental health problems (K-10) according to gender
2.6
10.29.9
18.5
0
2
4
6
8
10
12
14
16
18
20
Men Women
Increase of mental health problems (k-10) from 2008 to 2015
2008 2015
3.8
1.8
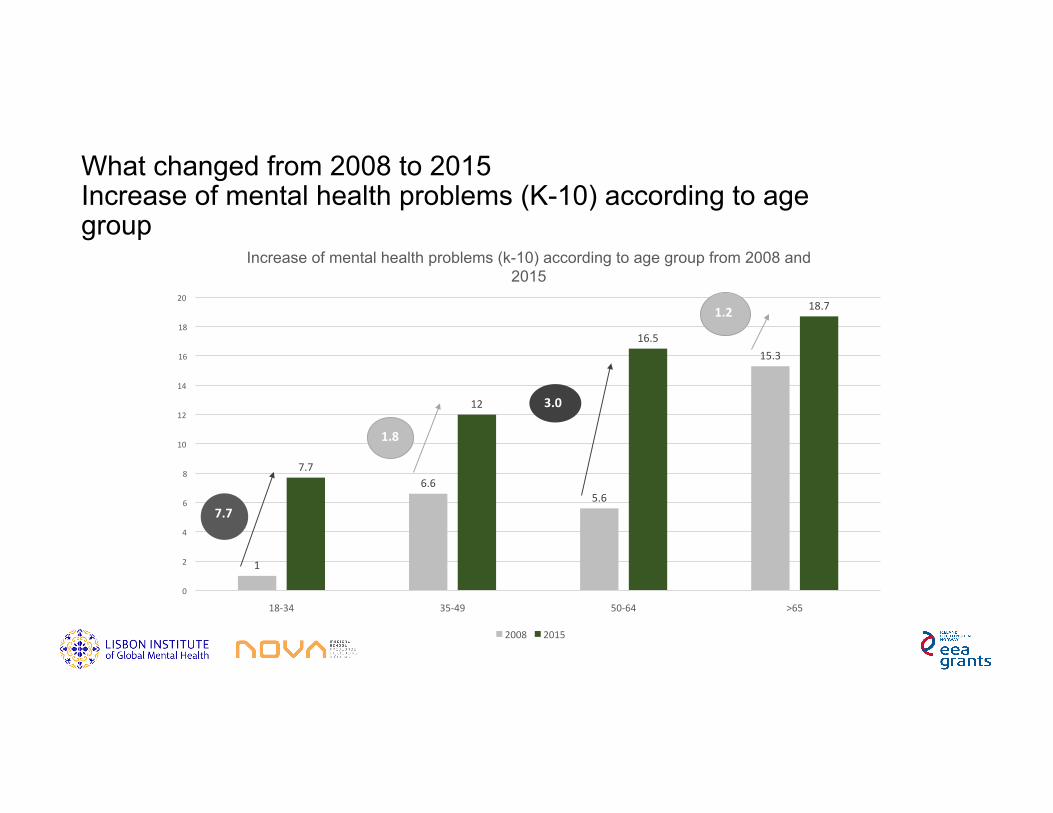
What changed from 2008 to 2015 Increase of mental health problems (K-10) according to age group
1
6.65.6
15.3
7.7
12
16.5
18.7
0
2
4
6
8
10
12
14
16
18
20
18-34 35-49 50-64 >65
Increase of mental health problems (k-10) according to age group from 2008 and 2015
2008 2015
7.7
3.0
1.2
1.8

2008 2015
Idea[on 2.1% 1.9%
Plan 0.5% 0.7%
A]empt 0.3% 0.4%
What changed from 2008 to 2015 Suicidal behaviour

OR p-value
Gender
Men 1
Women 1.74 0.03
Educa;on(years) 0.91 <0.01
Severity
Severe 1
Moderate 0.54 0.13
Mild 0.23 <0.01
None 0.24 <0.01
Suicidalidea;on 3.55 <0.01
Disability(WHODAS) 1.03 0.03
Variablesconsideredinthemul[variatemodel:age;gender;educa[on;presenceofanymentaldisorderoranyphysicaldisorder; severity; suicidal idea[on;suicidalplanning;household income;occupa[on;marital status;professionalstatus;self-perceivedsocioeconomicstatus;financialdepriva[on;disability
Factors in 2008 associated with mental health problems (K-10) in 2015 Multivariate analysis

Sociodemographic characteristics and mental health problems Age
7.7
12
16.5
18.7
0
2
4
6
8
10
12
14
16
18
20
18-34 45-49 50-64 ≥65
Age groups and mental health problems(K-10)
K-10:p<0.05*

Sociodemographic characteristics and mental disorders Age
2
4.1
6.7
10.9
2.8
4.25
3
0
5
10
15
18-34 45-49 50-64 ≥65
%
Age groups and mental health problems (MDE and GAD)
MDE
GAD
MDE:p<0.05*GAD:p>0.05
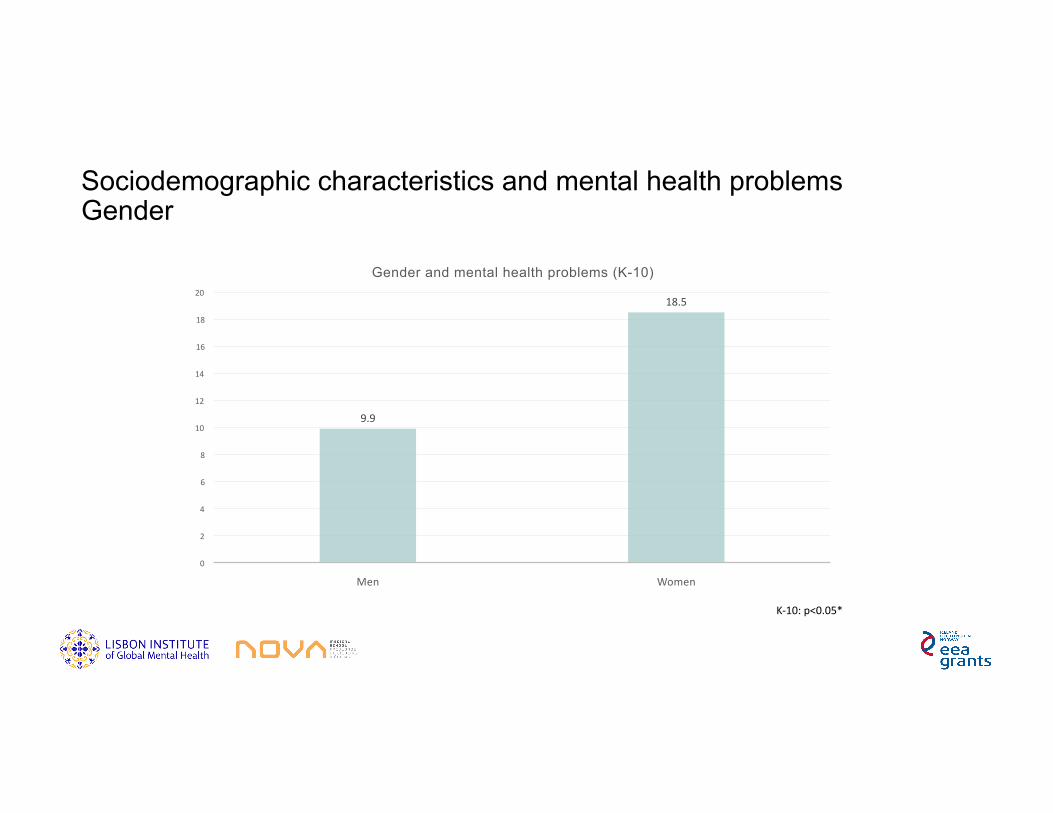
Sociodemographic characteristics and mental health problems Gender
9.9
18.5
0
2
4
6
8
10
12
14
16
18
20
Men Women
Gender and mental health problems (K-10)
K-10:p<0.05*
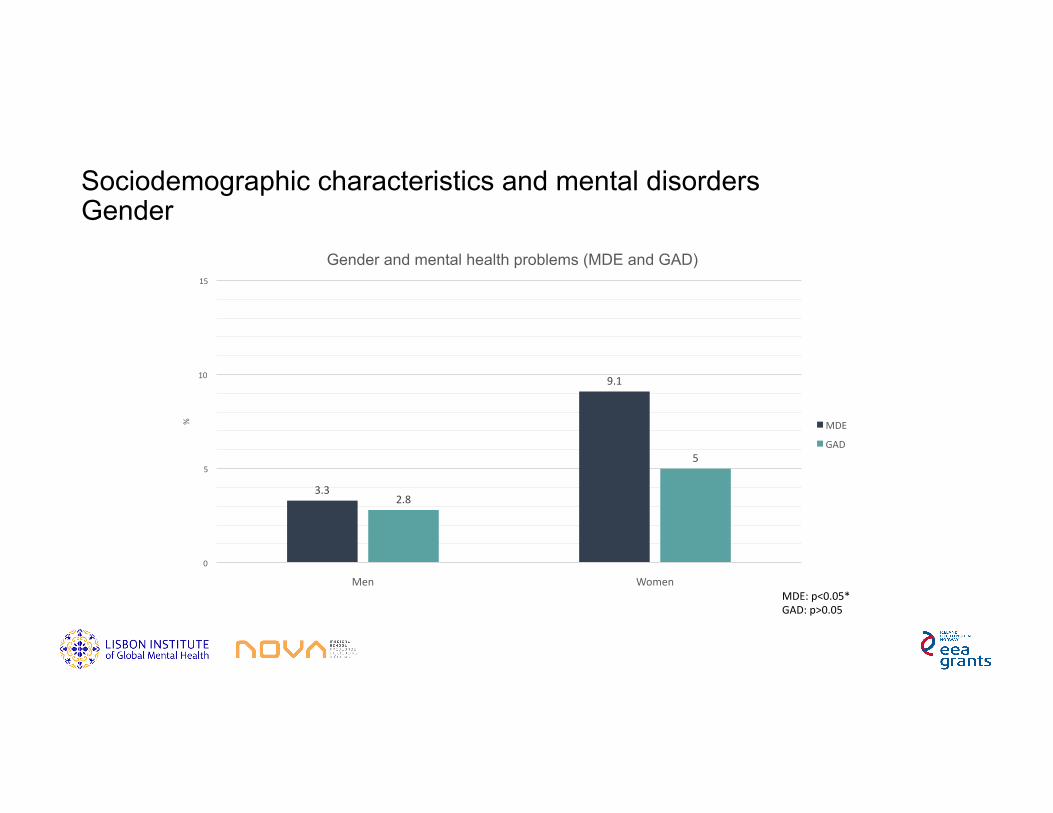
Sociodemographic characteristics and mental disorders Gender
3.3
9.1
2.8
5
0
5
10
15
Men Women
%
Gender and mental health problems (MDE and GAD)
MDE
GAD
MDE:p<0.05*GAD:p>0.05
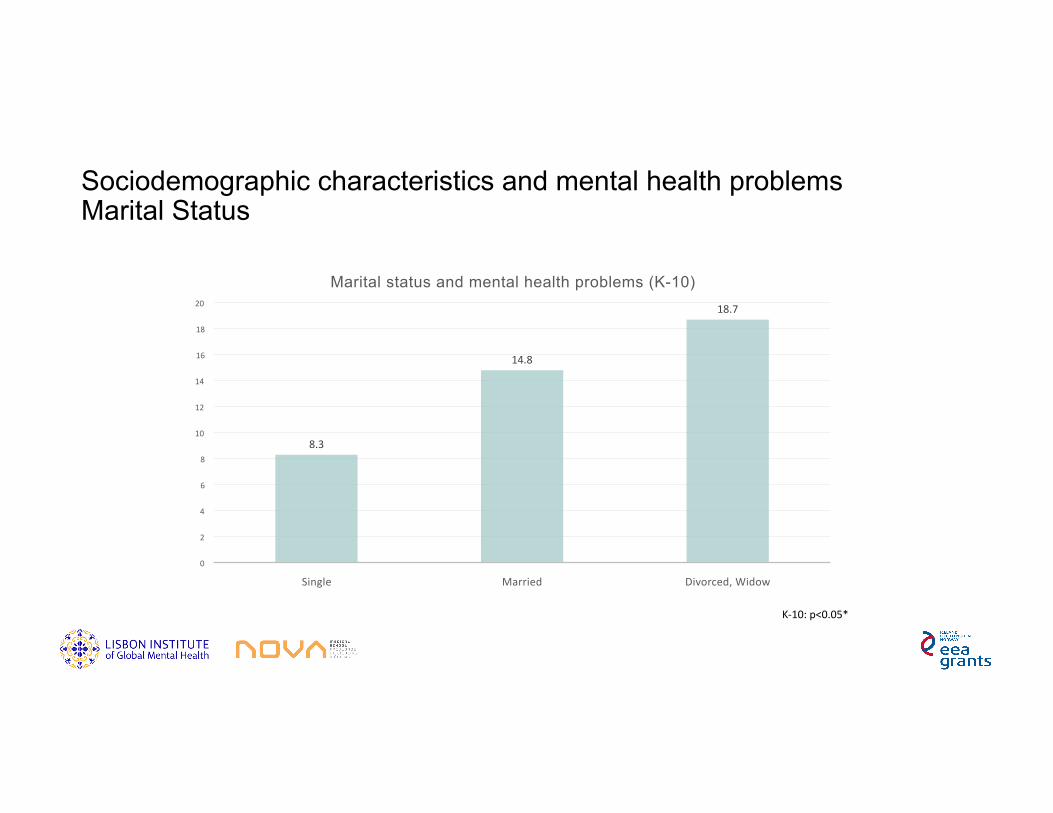
Sociodemographic characteristics and mental health problems Marital Status
8.3
14.8
18.7
0
2
4
6
8
10
12
14
16
18
20
Single Married Divorced,Widow
Marital status and mental health problems (K-10)
K-10:p<0.05*
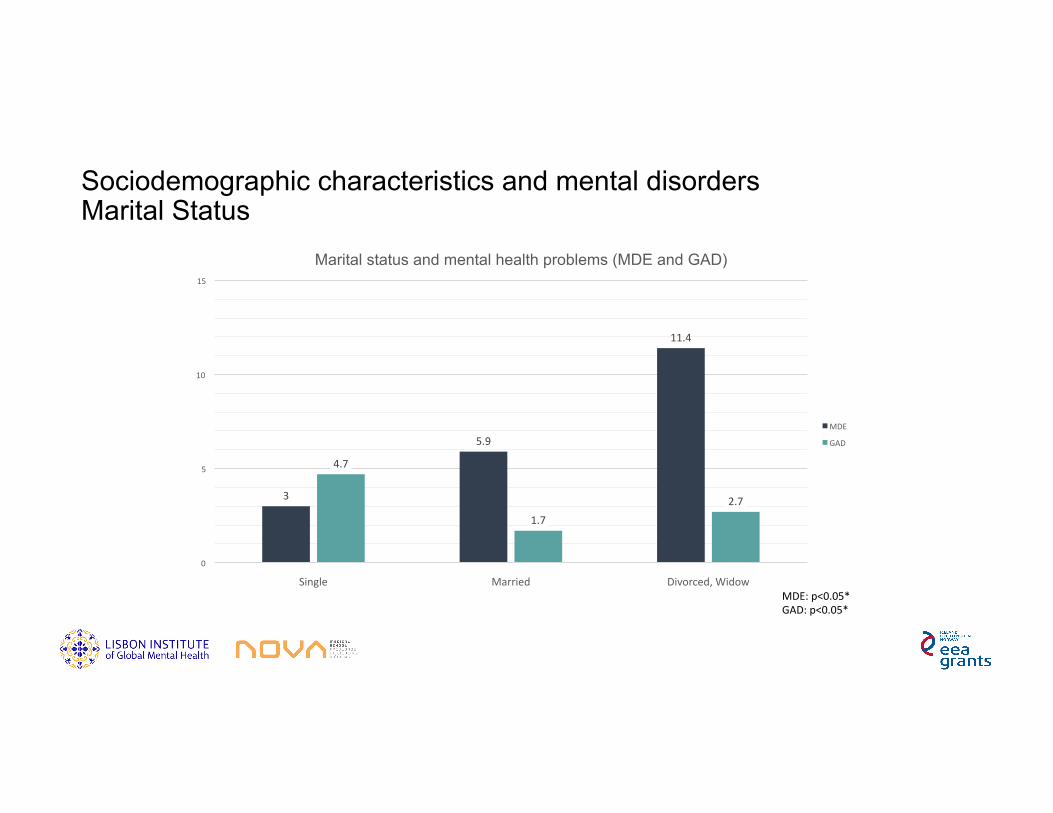
Sociodemographic characteristics and mental disorders Marital Status
3
5.9
11.4
4.7
1.7
2.7
0
5
10
15
Single Married Divorced,Widow
Marital status and mental health problems (MDE and GAD)
MDE
GAD
MDE:p<0.05*GAD:p<0.05*

Sociodemographic characteristics and mental health problems Education
23
12.8
9.9 10
0
5
10
15
20
25
Noeduca[onandprimary Basic Secundary University
Education and mental health problems (K-10)
K-10:p<0.05*
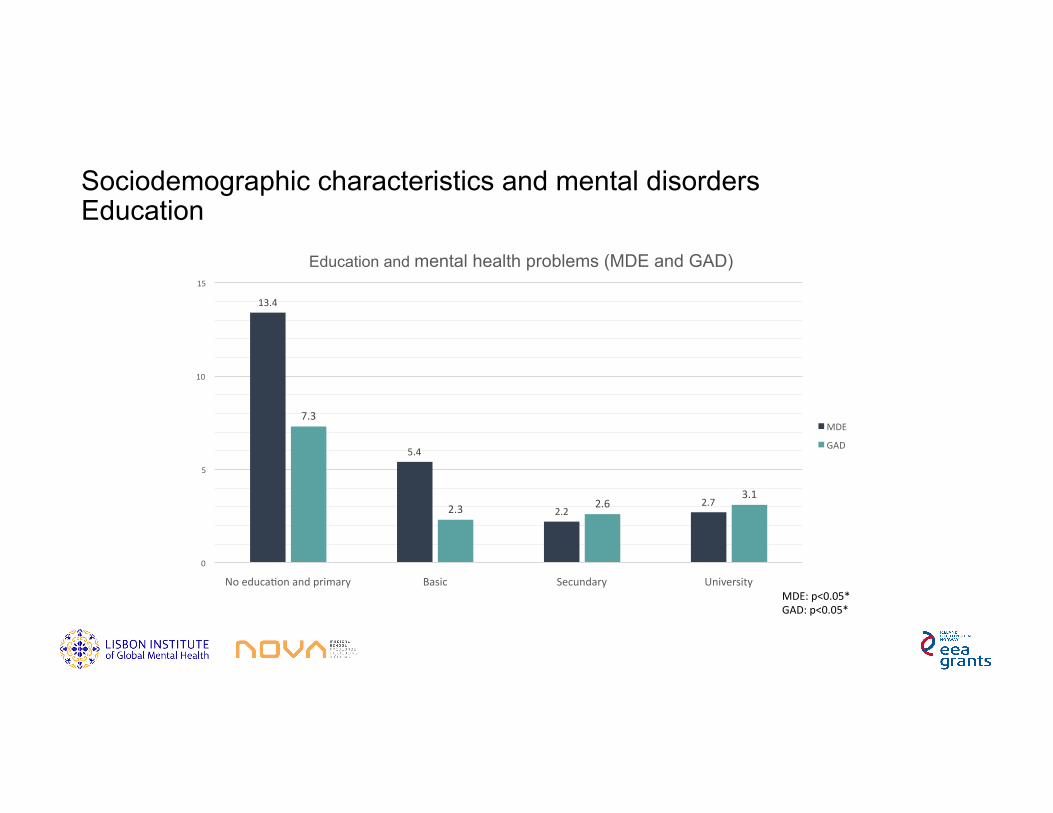
Sociodemographic characteristics and mental disorders Education
13.4
5.4
2.22.7
7.3
2.3 2.63.1
0
5
10
15
Noeduca[onandprimary Basic Secundary University
Education and mental health problems (MDE and GAD)
MDE
GAD
MDE:p<0.05*GAD:p<0.05*
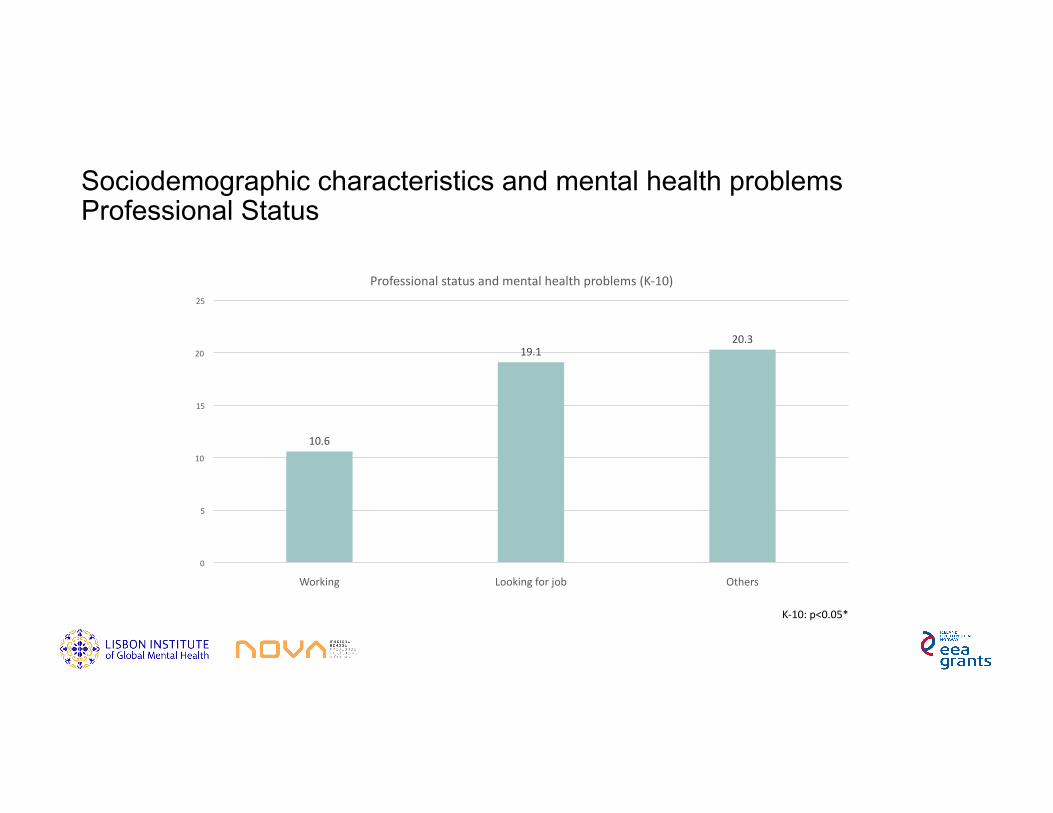
Sociodemographic characteristics and mental health problems Professional Status
10.6
19.120.3
0
5
10
15
20
25
Working Lookingforjob Others
Professionalstatusandmentalhealthproblems(K-10)
K-10:p<0.05*

Sociodemographic characteristics and mental disorders Professional Status
3.5
12.6
10.4
3
7.4
5
0
2
4
6
8
10
12
14
Working Lookingforjob Others
Professionalstatusandmentalhealthproblems(MDEandGAD)
MDE
GAD
MDE:p<0.05*GAD:p>0.05
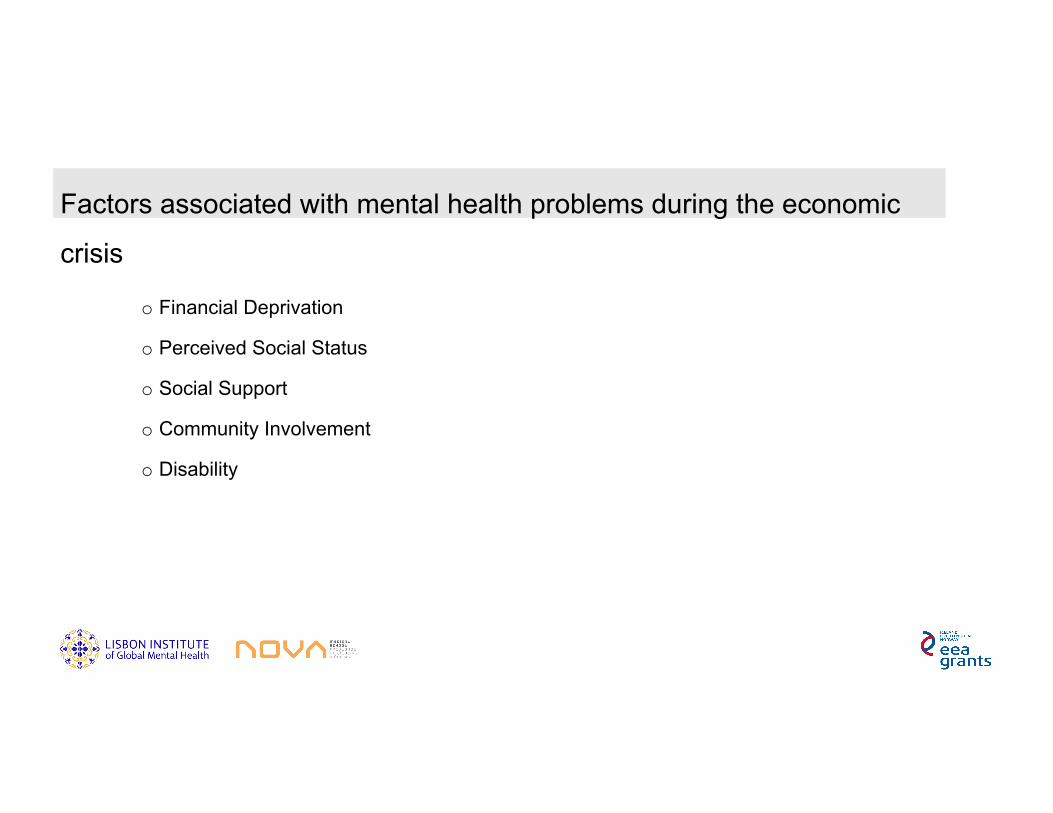
o Financial Deprivation
o Perceived Social Status
o Social Support
o Community Involvement
o Disability
Factors associated with mental health problems during the economic
crisis

Factors associated with mental health problems in 2015 Financial deprivation
9.4
22
0
5
10
15
20
25
Moreorenough€ Notenough€
Financial deprivation and mental health problems (K-10)
K-10:p<0.05*
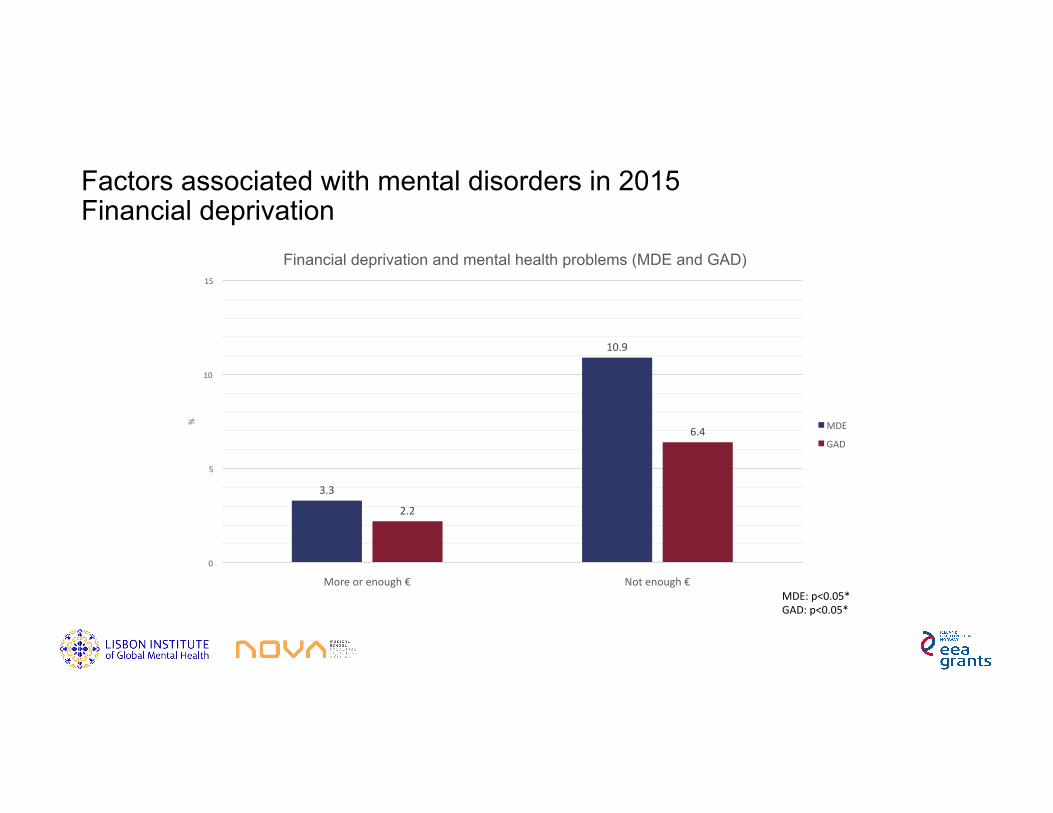
3.3
10.9
2.2
6.4
0
5
10
15
Moreorenough€ Notenough€
%
Financial deprivation and mental health problems (MDE and GAD)
MDE
GAD
Factors associated with mental disorders in 2015 Financial deprivation
MDE:p<0.05*GAD:p<0.05*
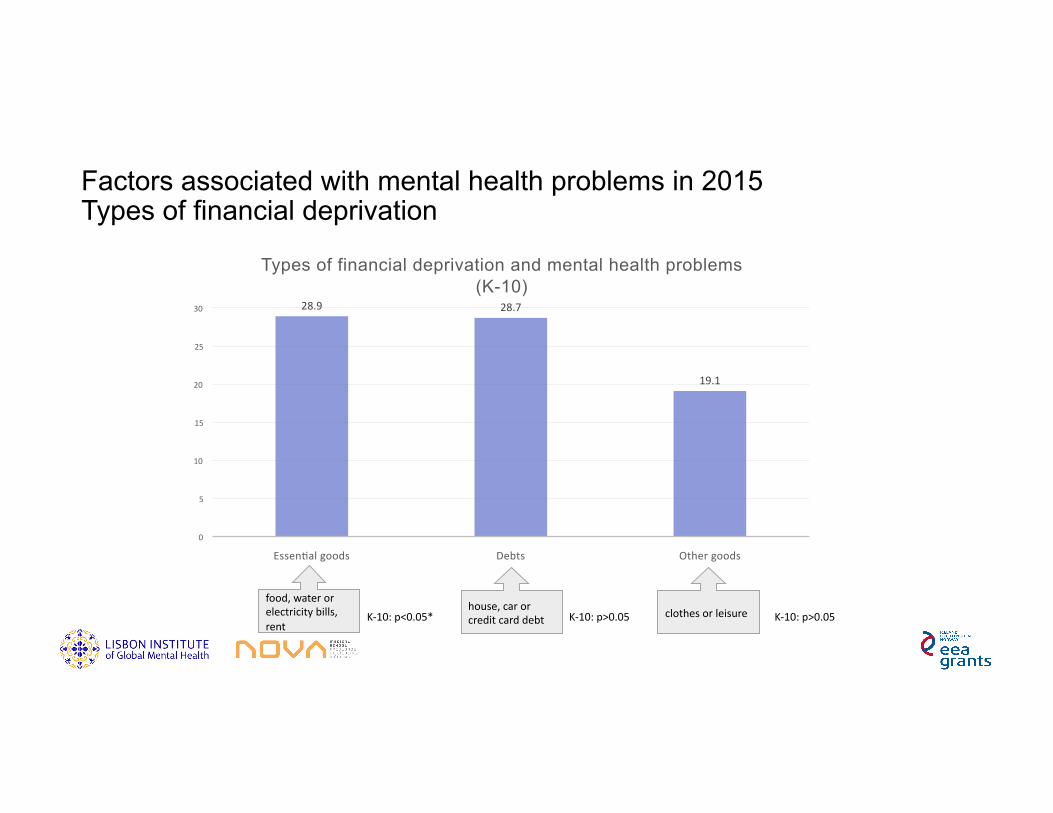
Factors associated with mental health problems in 2015 Types of financial deprivation
28.9 28.7
19.1
0
5
10
15
20
25
30
Essen[algoods Debts Othergoods
Types of financial deprivation and mental health problems (K-10)
food,waterorelectricitybills,rent
house,carorcreditcarddebt clothesorleisureK-10:p<0.05* K-10:p>0.05 K-10:p>0.05

food,waterorelectricitybills,rent
house,carorcreditcarddebt clothesorleisure
Factors associated with mental disorders in 2015 Types of financial deprivation
9.2
7.47
9.3 9.2
5.2
0
5
10
Essen[algoods Debts Othergoods
%
Types of financial deprivation and mental health problems (MDE and GAD)
MDE
GAD
MDE:p<0.05*GAD:p<0.05*
MDE:p>0.05GAD:p>0.05
MDE:p>0.05GAD:p>0.05
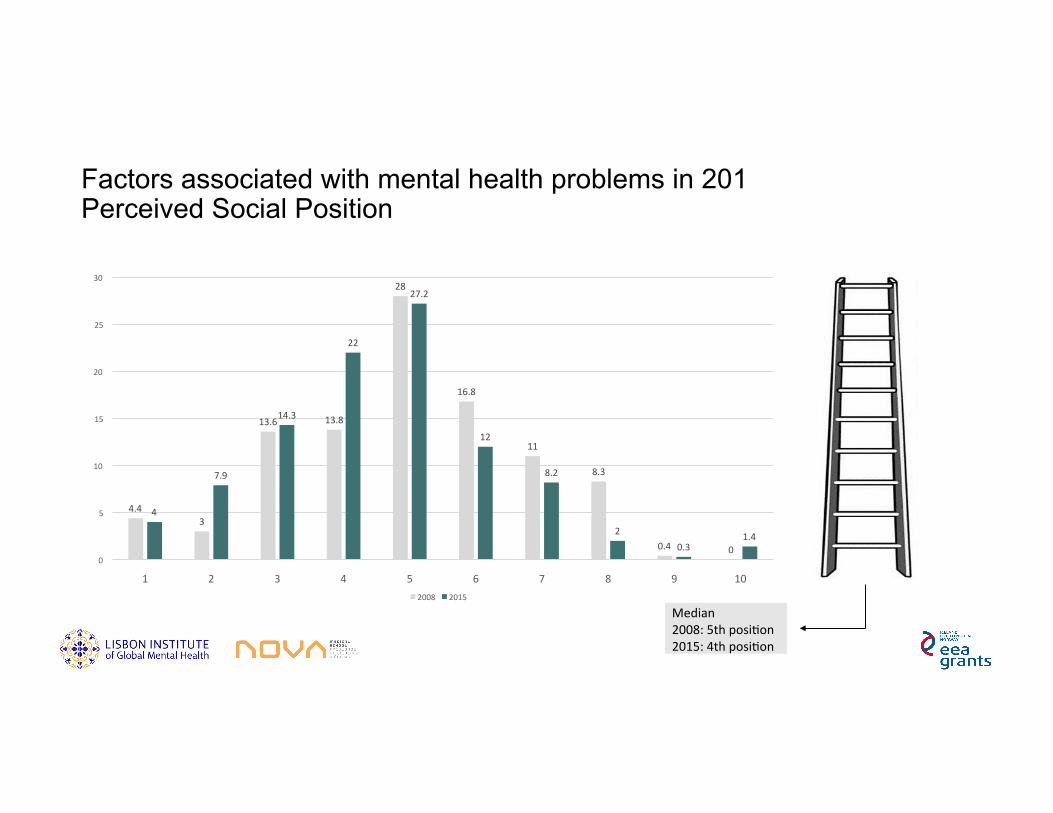
4.43
13.6 13.8
28
16.8
11
8.3
0.4 0
4
7.9
14.3
22
27.2
12
8.2
2
0.31.4
0
5
10
15
20
25
30
1 2 3 4 5 6 7 8 9 10
2008 2015
Factors associated with mental health problems in 201 Perceived Social Position
Median2008:5thposi[on2015:4thposi[on
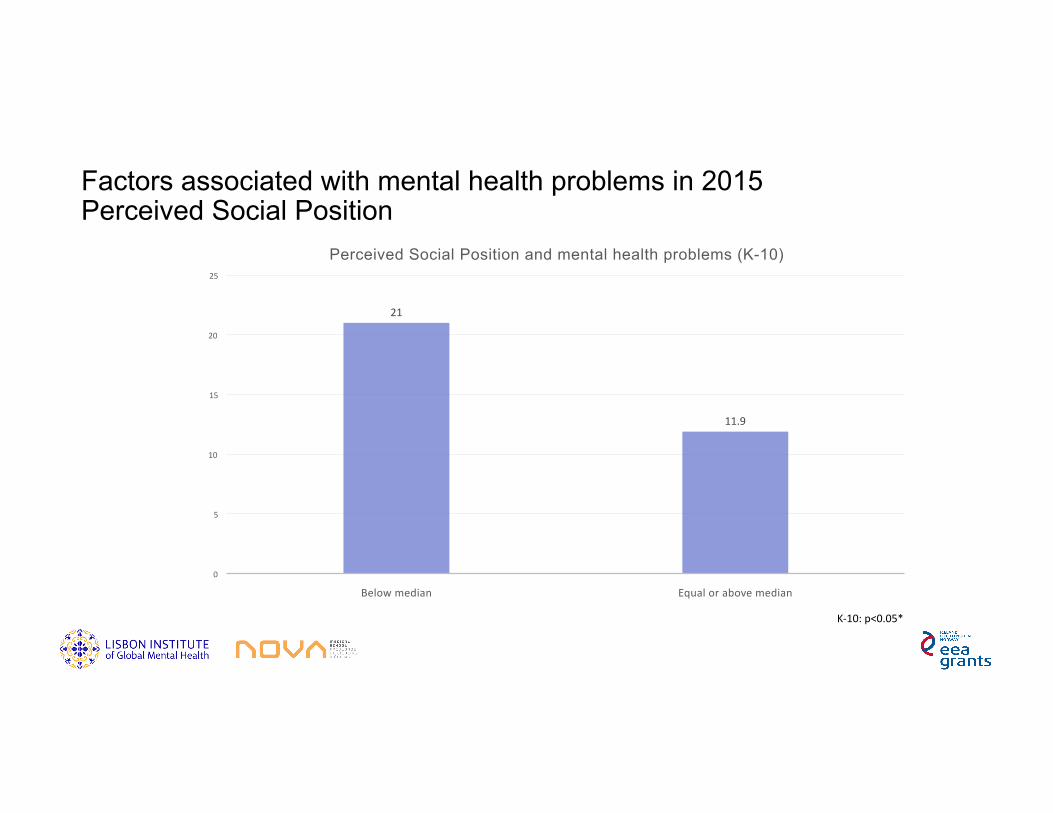
Factors associated with mental health problems in 2015 Perceived Social Position
21
11.9
0
5
10
15
20
25
Belowmedian Equalorabovemedian
Perceived Social Position and mental health problems (K-10)
K-10:p<0.05*

Factors associated with mental disorders in 2015 Perceived Social Position
9.1
5.35.1
3.6
0
2
4
6
8
10
Belowmedian Equalorabovemedian
Perceived social position and mental health problems (MDE and GAD)
MDE
GAD
MDE:p<0.05*GAD:p>0.05
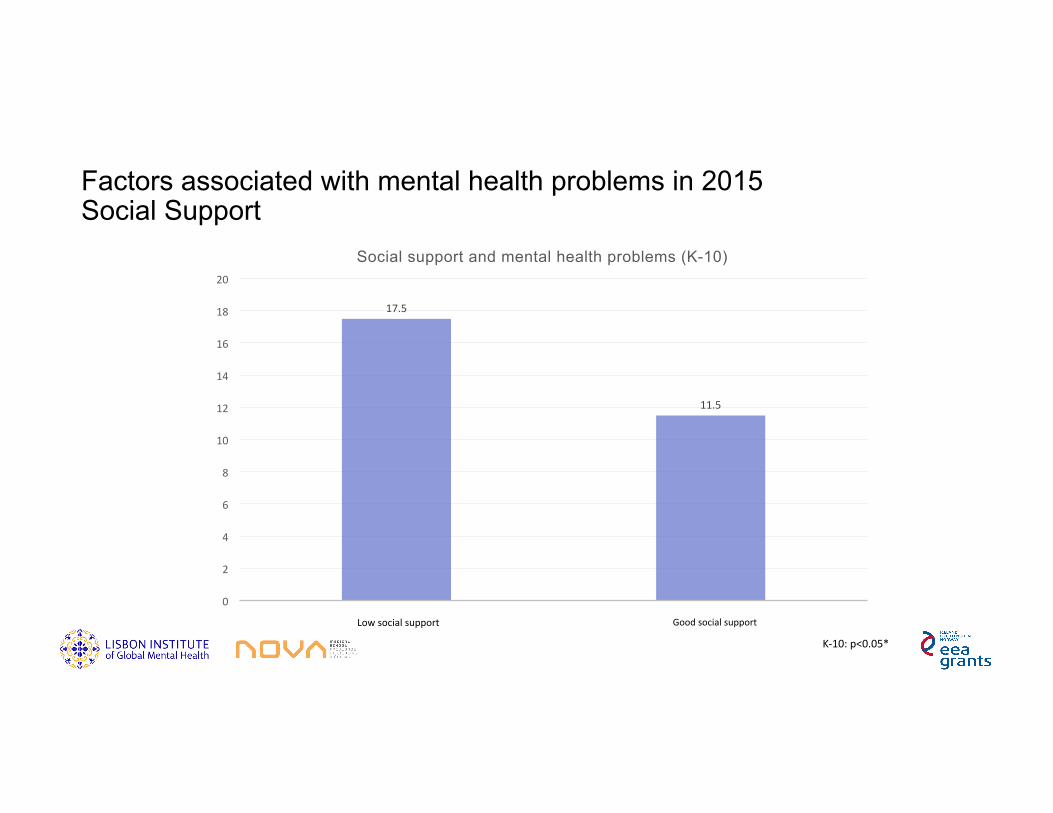
Factors associated with mental health problems in 2015 Social Support
K-10:p<0.05*
17.5
11.5
0
2
4
6
8
10
12
14
16
18
20
Bellowmedian Equalorabovemedian
Social support and mental health problems (K-10)
Lowsocialsupport Goodsocialsupport

Factors associated with mental disorders in 2015 Social Support
MDE:p<0.05*GAD:p>0.05
8.6
4.34.7
3.2
0
2
4
6
8
10
Bellowmedian Equalorabovemedian
Social support and mental health problems (MDE and GAD)
MDE
GAD
GoodsocialsupportLowsocialsupport
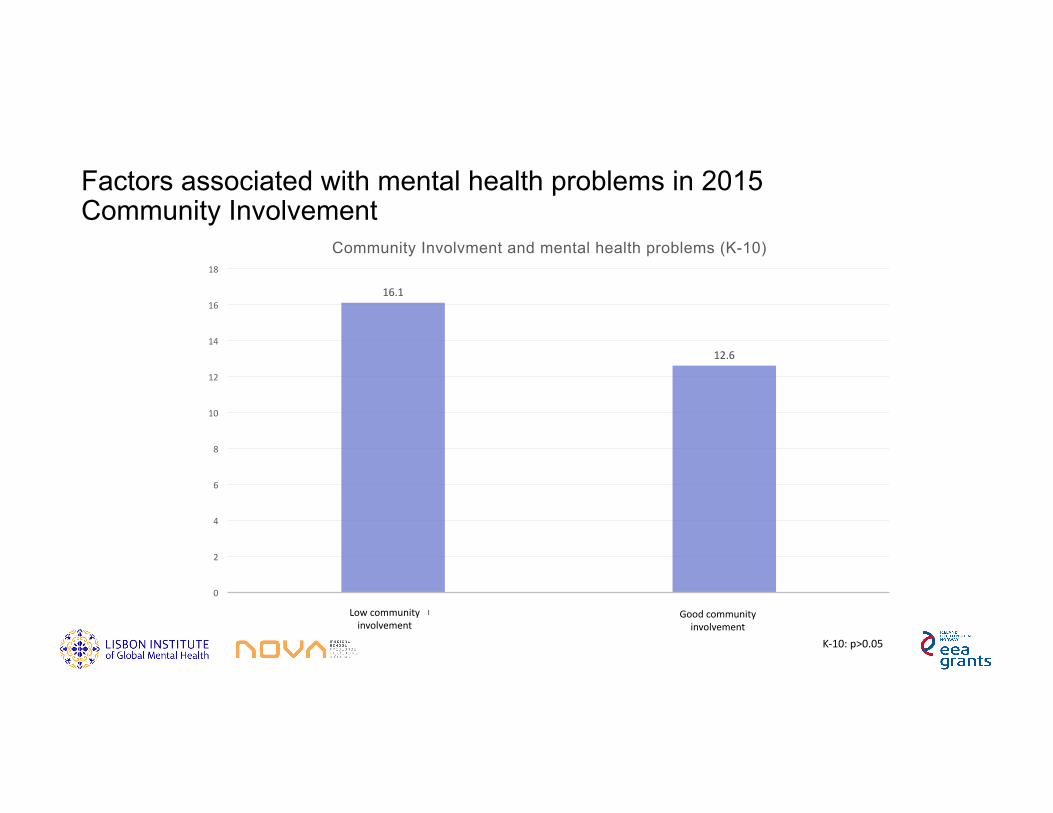
Factors associated with mental health problems in 2015 Community Involvement
16.1
12.6
0
2
4
6
8
10
12
14
16
18
Bellowmedian Equalorabovemedian
Community Involvment and mental health problems (K-10)
K-10:p>0.05
Lowcommunityinvolvement
Goodcommunityinvolvement
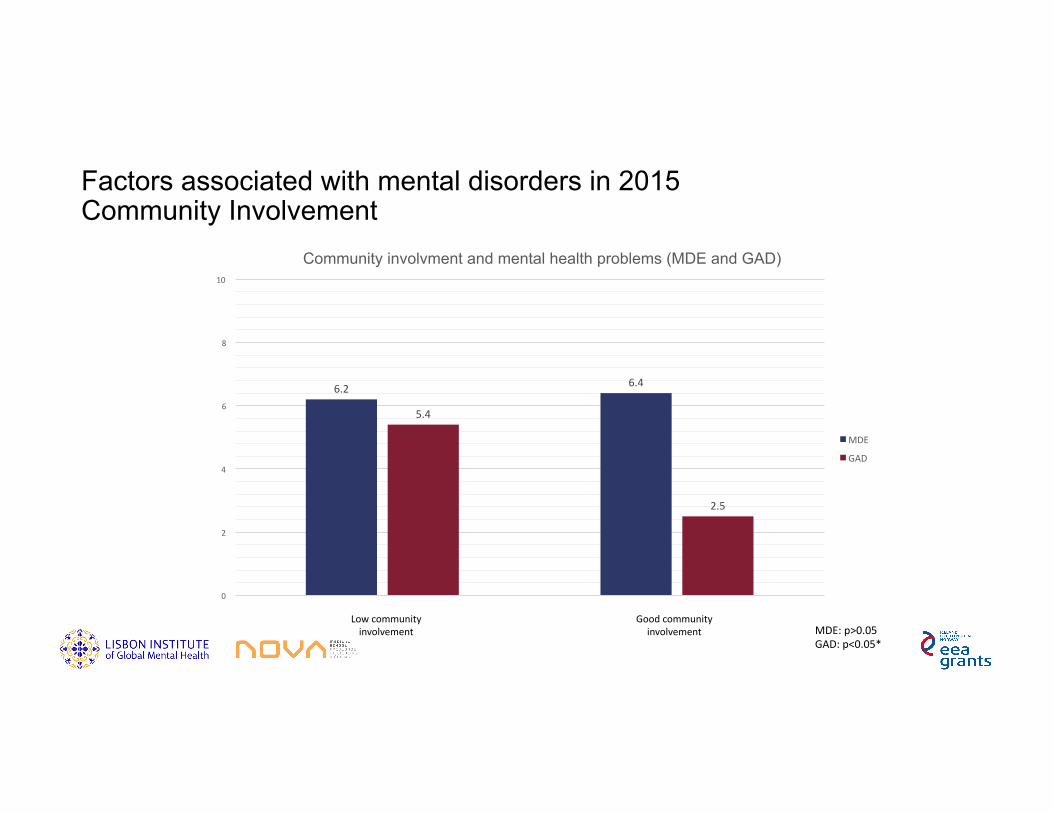
Factors associated with mental disorders in 2015 Community Involvement
MDE:p>0.05GAD:p<0.05*
6.2 6.4
5.4
2.5
0
2
4
6
8
10
Bellowmedian Equalorabovemedian
Community involvment and mental health problems (MDE and GAD)
MDE
GAD
Lowcommunityinvolvement
Goodcommunityinvolvement
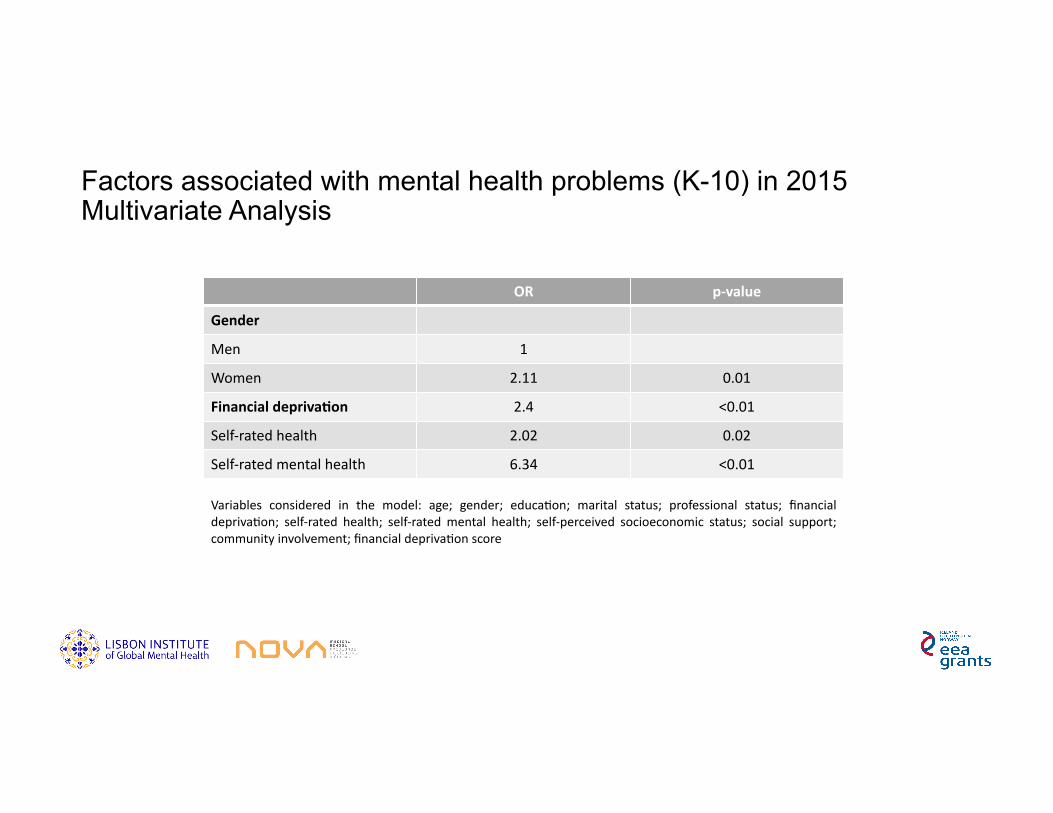
OR p-value
Gender
Men 1
Women 2.11 0.01
Financialdepriva;on 2.4 <0.01
Self-ratedhealth 2.02 0.02
Self-ratedmentalhealth 6.34 <0.01
Variables considered in the model: age; gender; educa[on; marital status; professional status; financialdepriva[on; self-rated health; self-ratedmental health; self-perceived socioeconomic status; social support;communityinvolvement;financialdepriva[onscore
Factors associated with mental health problems (K-10) in 2015 Multivariate Analysis
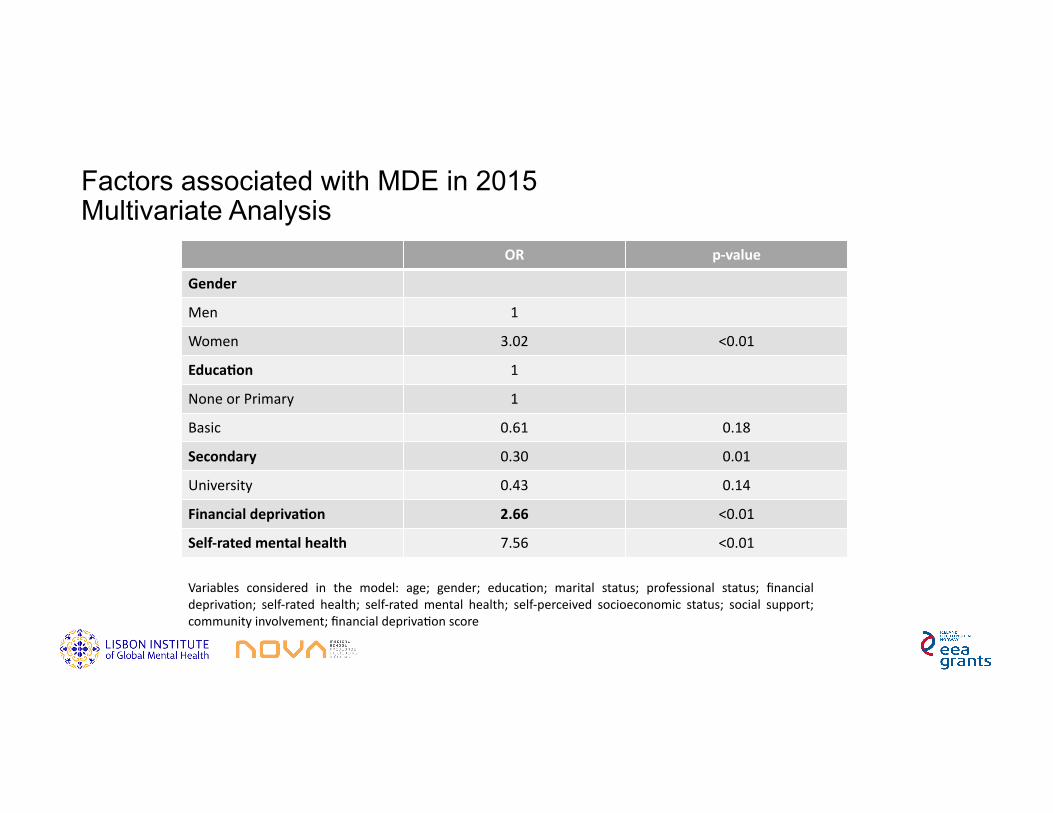
OR p-value
Gender
Men 1
Women 3.02 <0.01
Educa;on 1
NoneorPrimary 1
Basic 0.61 0.18
Secondary 0.30 0.01
University 0.43 0.14
Financialdepriva;on 2.66 <0.01
Self-ratedmentalhealth 7.56 <0.01
Variables considered in the model: age; gender; educa[on; marital status; professional status; financialdepriva[on; self-rated health; self-ratedmental health; self-perceived socioeconomic status; social support;communityinvolvement;financialdepriva[onscore
Factors associated with MDE in 2015 Multivariate Analysis
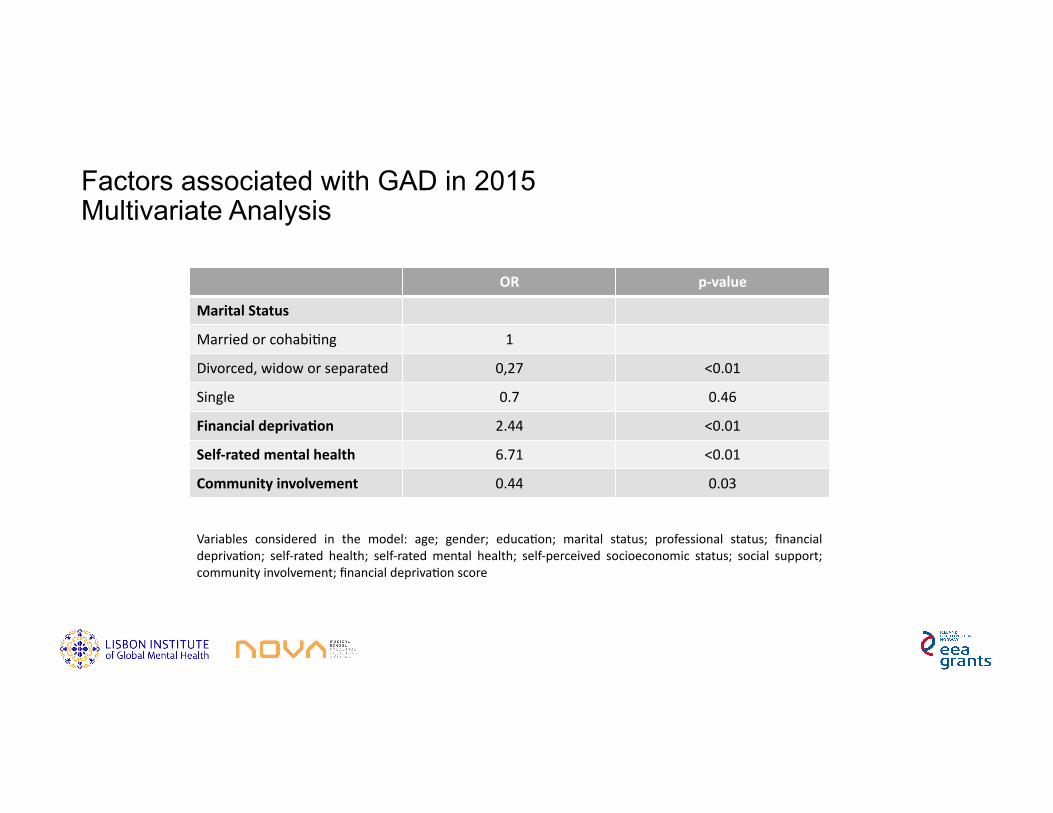
OR p-value
MaritalStatus
Marriedorcohabi[ng 1
Divorced,widoworseparated 0,27 <0.01
Single 0.7 0.46
Financialdepriva;on 2.44 <0.01
Self-ratedmentalhealth 6.71 <0.01
Communityinvolvement 0.44 0.03
Variables considered in the model: age; gender; educa[on; marital status; professional status; financialdepriva[on; self-rated health; self-ratedmental health; self-perceived socioeconomic status; social support;communityinvolvement;financialdepriva[onscore
Factors associated with GAD in 2015 Multivariate Analysis
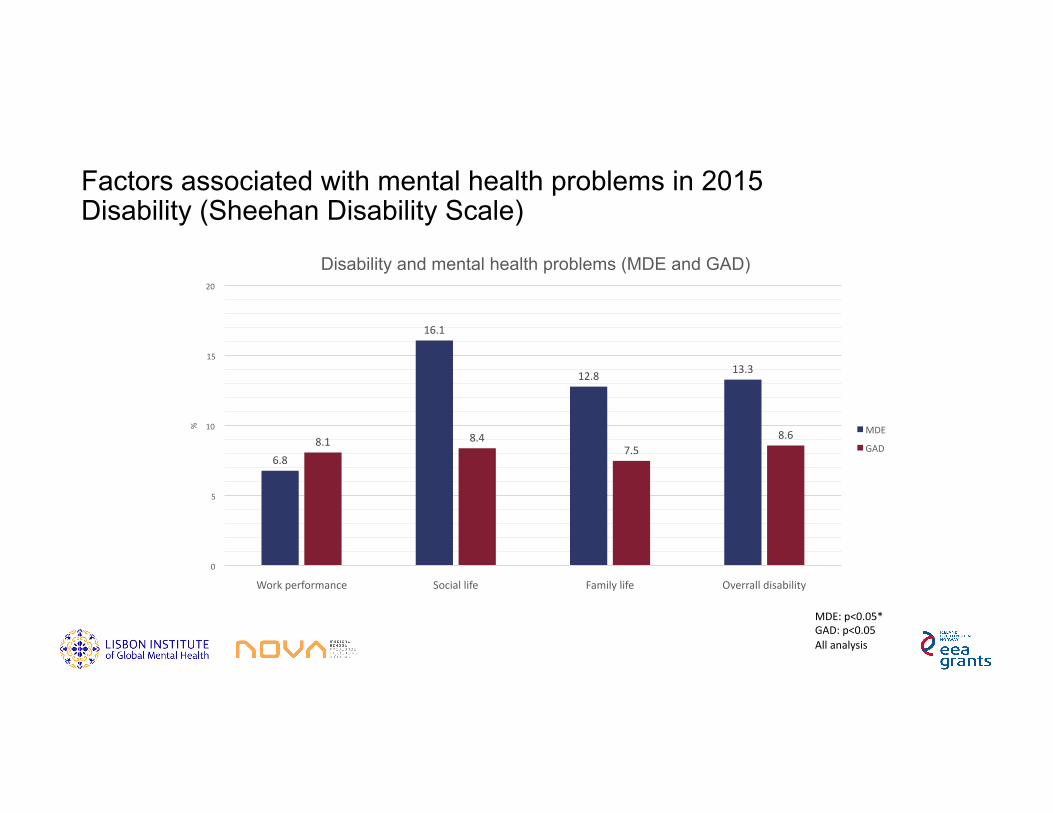
6.8
16.1
12.813.3
8.1 8.47.5
8.6
0
5
10
15
20
Workperformance Sociallife Familylife Overralldisability
%
Disability and mental health problems (MDE and GAD)
MDE
GAD
Factors associated with mental health problems in 2015 Disability (Sheehan Disability Scale)
MDE:p<0.05*GAD:p<0.05Allanalysis

28
12.313
14.1
0
10
20
30
≥1dayoutofrole ≥1lossofproduc[vity
%
Days out of role and productivity loss in the previous week
MDE
GAD
Factors associated with mental health problems in 2015 Disability (Sheehan Disability Scale)
MDE:p<0.05*GAD:p<0.05Allanalysis

Services Utilization
• Characterization of services use
• Use of psychotropic medication
• Under-treatment
• Barriers to treatment
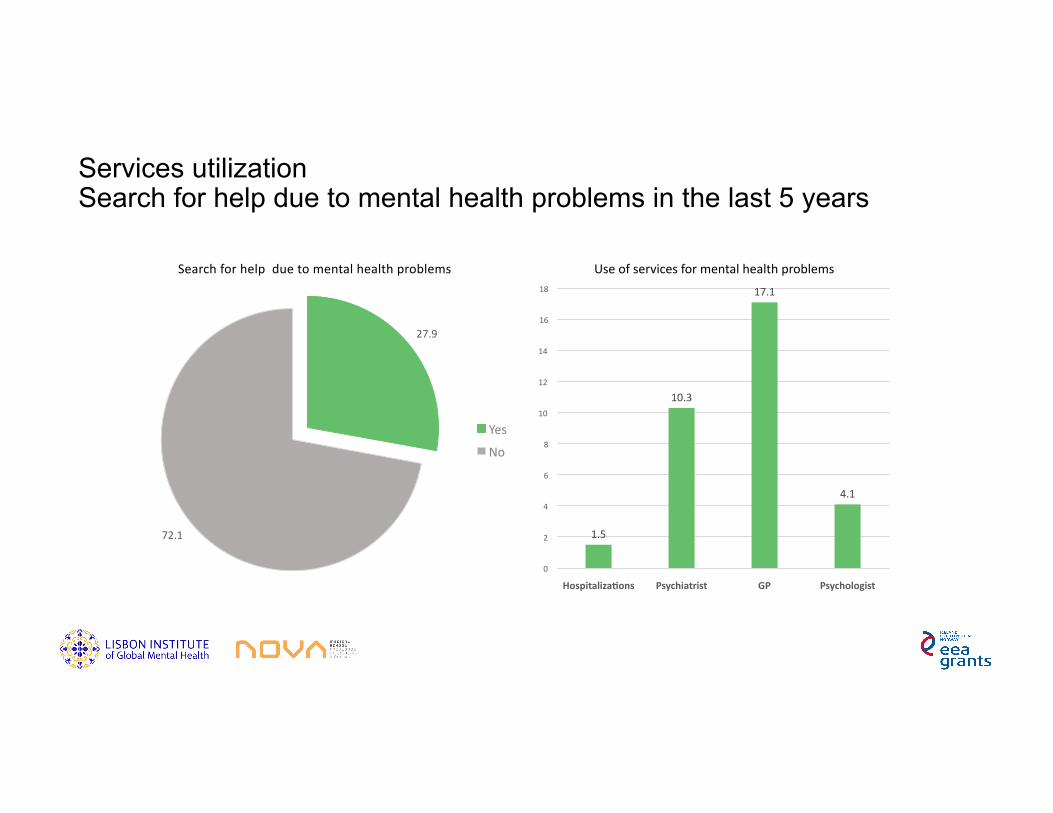
1.5
10.3
17.1
4.1
0
2
4
6
8
10
12
14
16
18
Hospitaliza;ons Psychiatrist GP Psychologist
Useofservicesformentalhealthproblems
27.9
72.1
Searchforhelpduetomentalhealthproblems
Yes
No
Services utilization Search for help due to mental health problems in the last 5 years

24.6
27
18.8
3.8
33.2 33.732.8
11.2
8.5
5.84.2
1.6
0
5
10
15
20
25
30
35
40
MDE GAD K-10≥25 K-10<20
Psychiatrist
GP
Psychologist
Services utilization Use of provider by type of mental health problem in the last 12 months

Provider MDE GAD K-10>25
Psychiatrist 4,8 5,4 4,8
Psychologist 10,9 13,6 9,1
GP 2,9 3,2 3,1
Services utilization Visits in the last 12 months (mean)
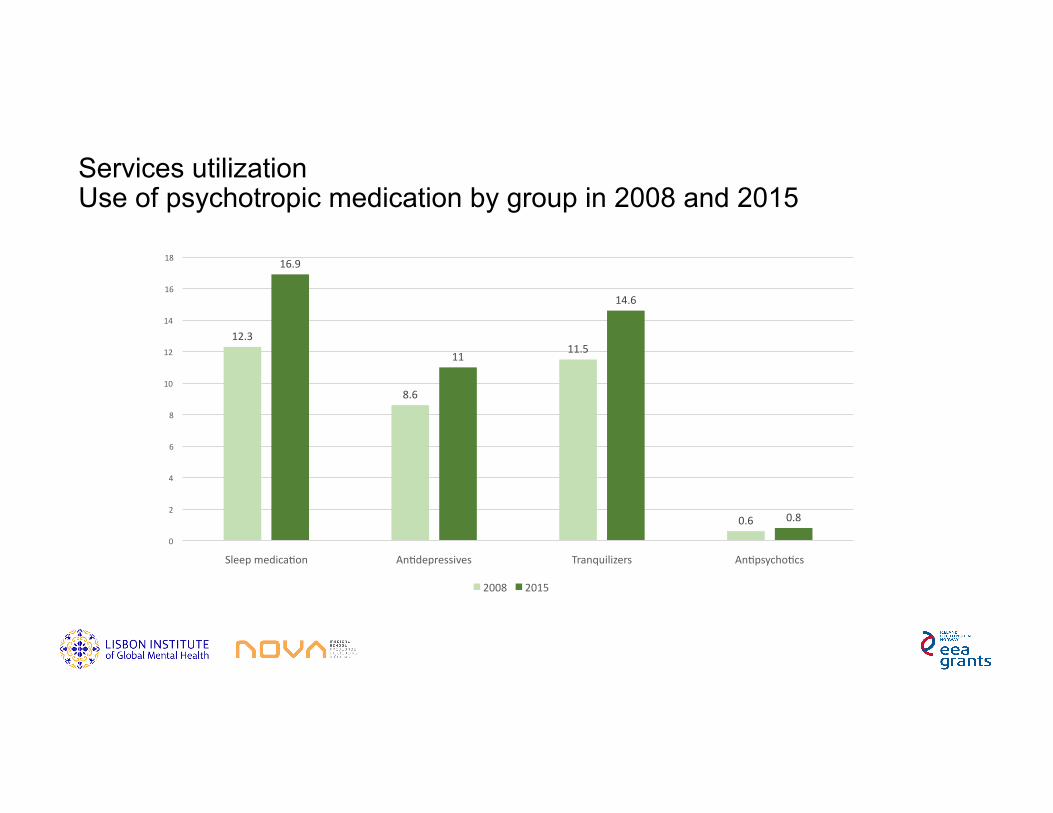
Services utilization Use of psychotropic medication by group in 2008 and 2015
12.3
8.6
11.5
0.6
16.9
11
14.6
0.8
0
2
4
6
8
10
12
14
16
18
Sleepmedica[on An[depressives Tranquilizers An[psycho[cs
2008 2015

22.5
28.6
0
5
10
15
20
25
30
2008 2015
Services utilization Use of any psychotropic medication in 2008 and 2015
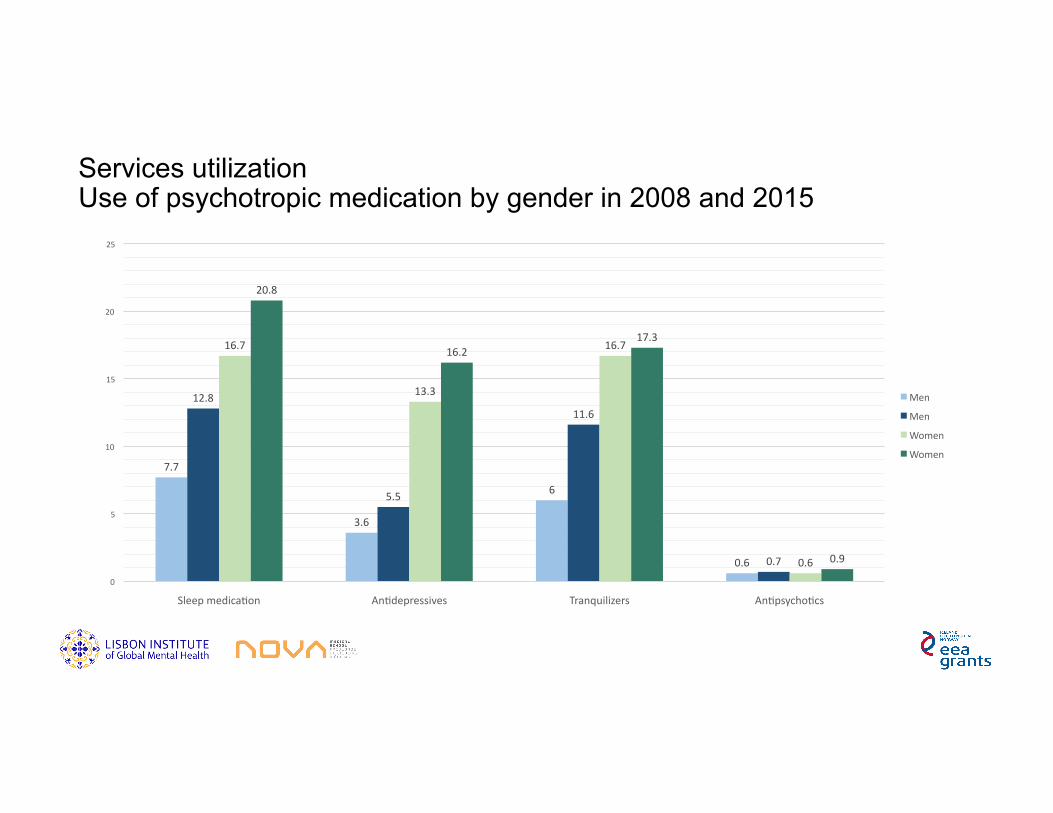
Services utilization Use of psychotropic medication by gender in 2008 and 2015
7.7
3.6
6
0.6
12.8
5.5
11.6
0.7
16.7
13.3
16.7
0.6
20.8
16.217.3
0.9
0
5
10
15
20
25
Sleepmedica[on An[depressives Tranquilizers An[psycho[cs
Men
Men
Women
Women
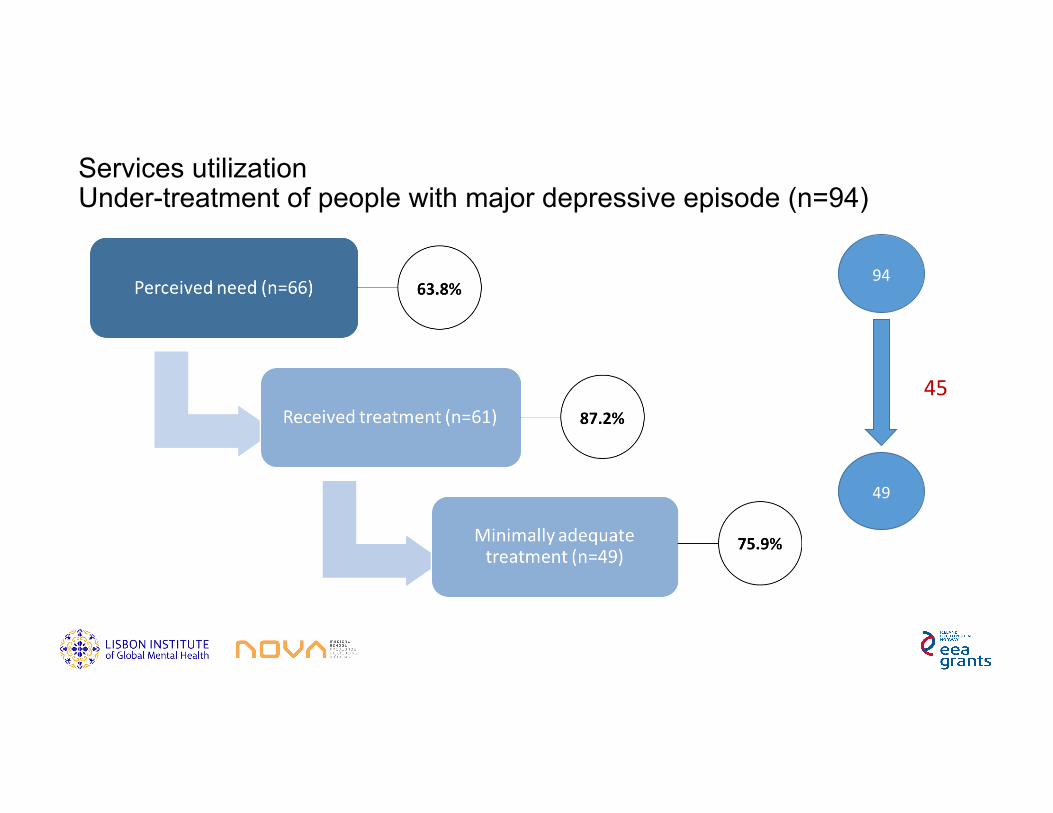
Services utilization Under-treatment of people with major depressive episode (n=94)
94
49
45
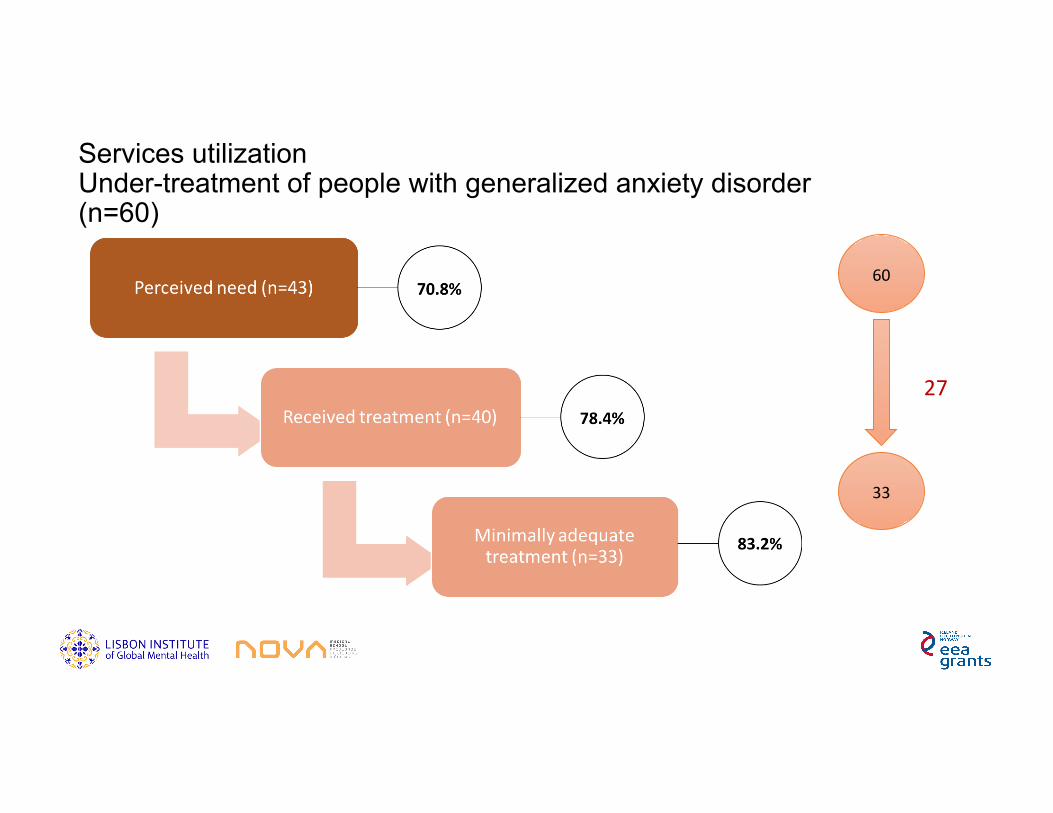
Services utilization Under-treatment of people with generalized anxiety disorder (n=60)
60
33
27
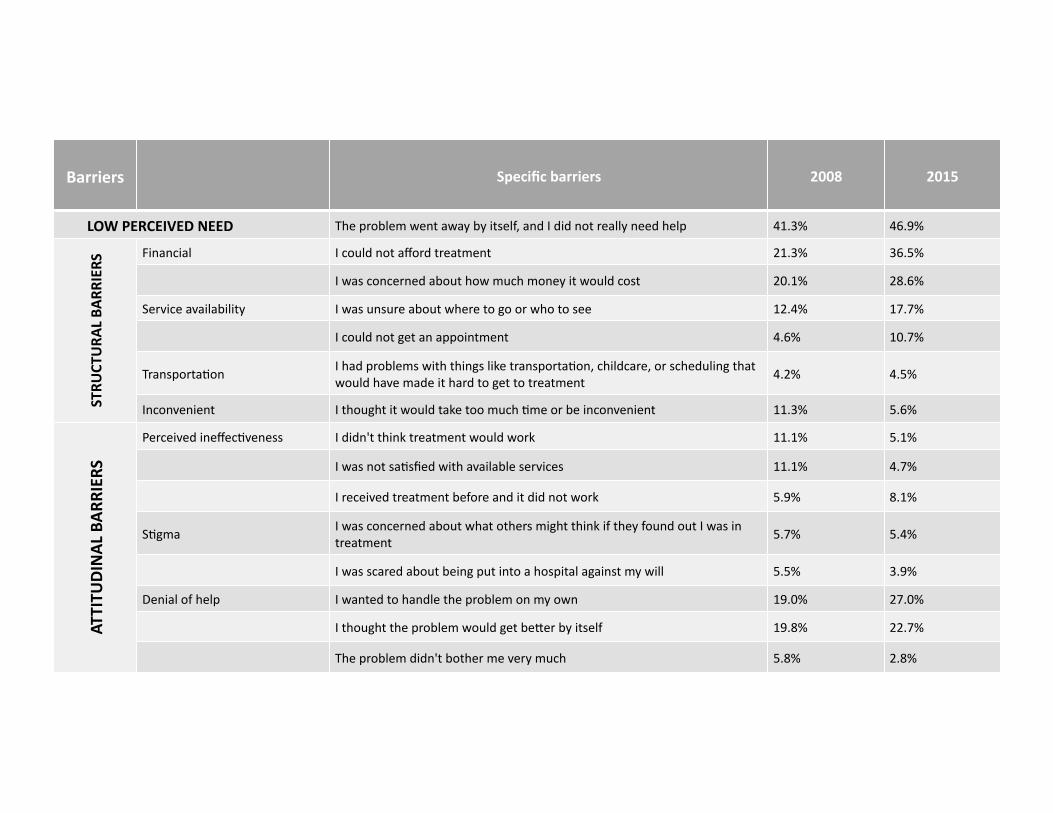
Barriers Specificbarriers 2008 2015
LOWPERCEIVEDNEED Theproblemwentawaybyitself,andIdidnotreallyneedhelp 41.3% 46.9%
STRU
CTURA
LBA
RRIERS
Financial Icouldnotaffordtreatment 21.3% 36.5%
Iwasconcernedabouthowmuchmoneyitwouldcost 20.1% 28.6%
Serviceavailability Iwasunsureaboutwheretogoorwhotosee 12.4% 17.7%
Icouldnotgetanappointment 4.6% 10.7%
Transporta[onIhadproblemswiththingsliketransporta[on,childcare,orschedulingthatwouldhavemadeithardtogettotreatment
4.2% 4.5%
Inconvenient Ithoughtitwouldtaketoomuch[meorbeinconvenient 11.3% 5.6%
ATTITU
DINALBA
RRIERS
Perceivedineffec[veness Ididn'tthinktreatmentwouldwork 11.1% 5.1%
Iwasnotsa[sfiedwithavailableservices 11.1% 4.7%
Ireceivedtreatmentbeforeanditdidnotwork 5.9% 8.1%
S[gmaIwasconcernedaboutwhatothersmightthinkiftheyfoundoutIwasintreatment
5.7% 5.4%
Iwasscaredaboutbeingputintoahospitalagainstmywill 5.5% 3.9%
Denialofhelp Iwantedtohandletheproblemonmyown 19.0% 27.0%
Ithoughttheproblemwouldgetbe]erbyitself 19.8% 22.7%
Theproblemdidn'tbothermeverymuch 5.8% 2.8%
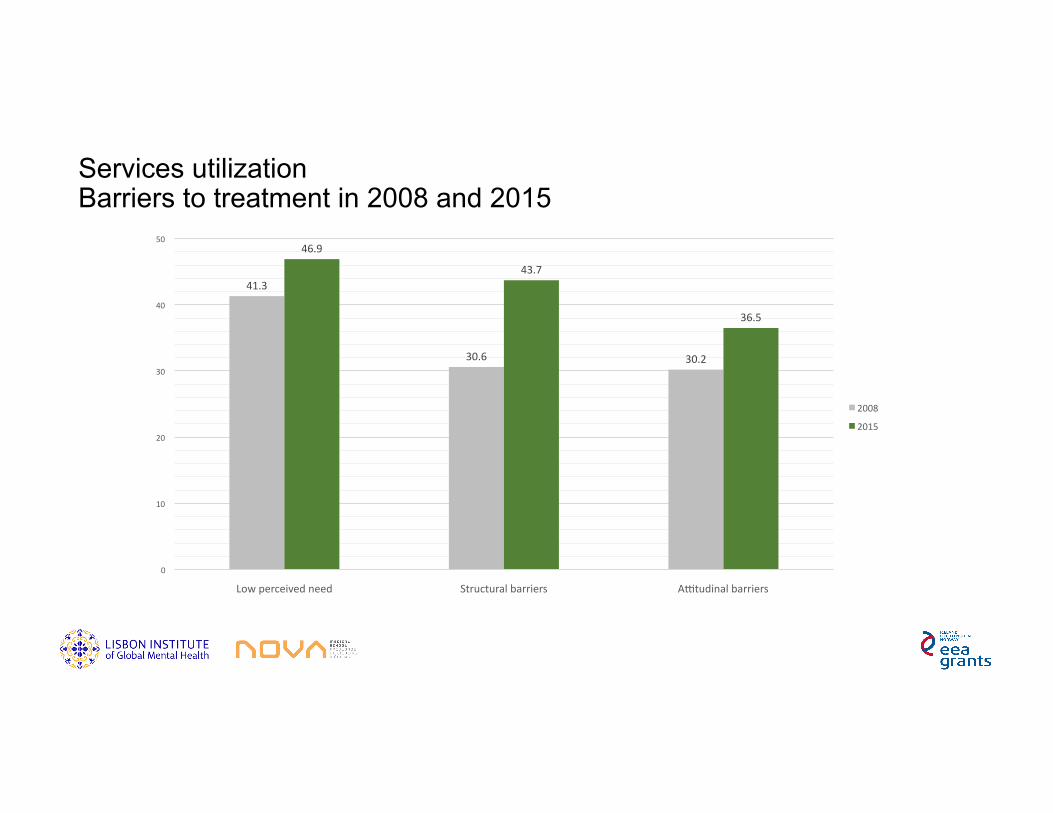
Services utilization Barriers to treatment in 2008 and 2015
41.3
30.6 30.2
46.9
43.7
36.5
0
10
20
30
40
50
Lowperceivedneed Structuralbarriers Antudinalbarriers
2008
2015
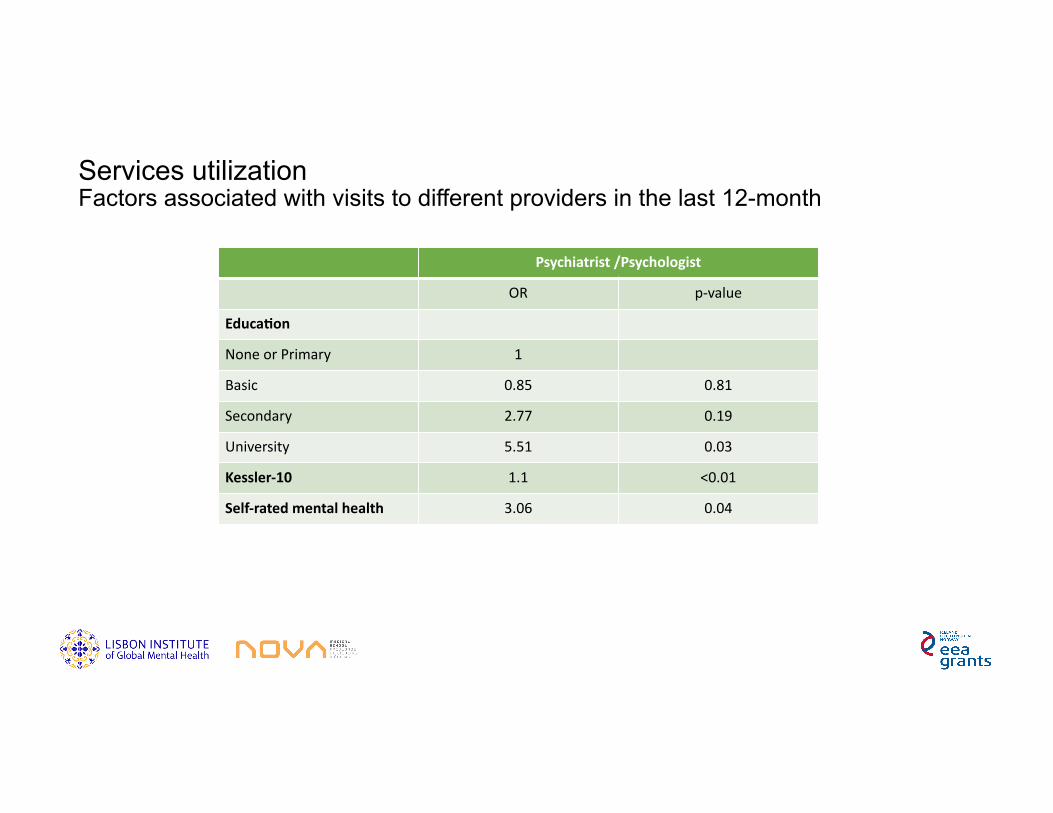
Psychiatrist/Psychologist
OR p-value
Educa;on
NoneorPrimary 1
Basic 0.85 0.81
Secondary 2.77 0.19
University 5.51 0.03
Kessler-10 1.1 <0.01
Self-ratedmentalhealth 3.06 0.04
Services utilization Factors associated with visits to different providers in the last 12-month

GP
OR p-value
Gender
Men 1
Women 1.96 0.01
Financialdepriva;on 0.45 0.03
Self-ratedmentalhealth 6.12 <0.01
Financialsecurity 0.46 <0.01
Services utilization Factors associated with visits to different providers in the last 12-month
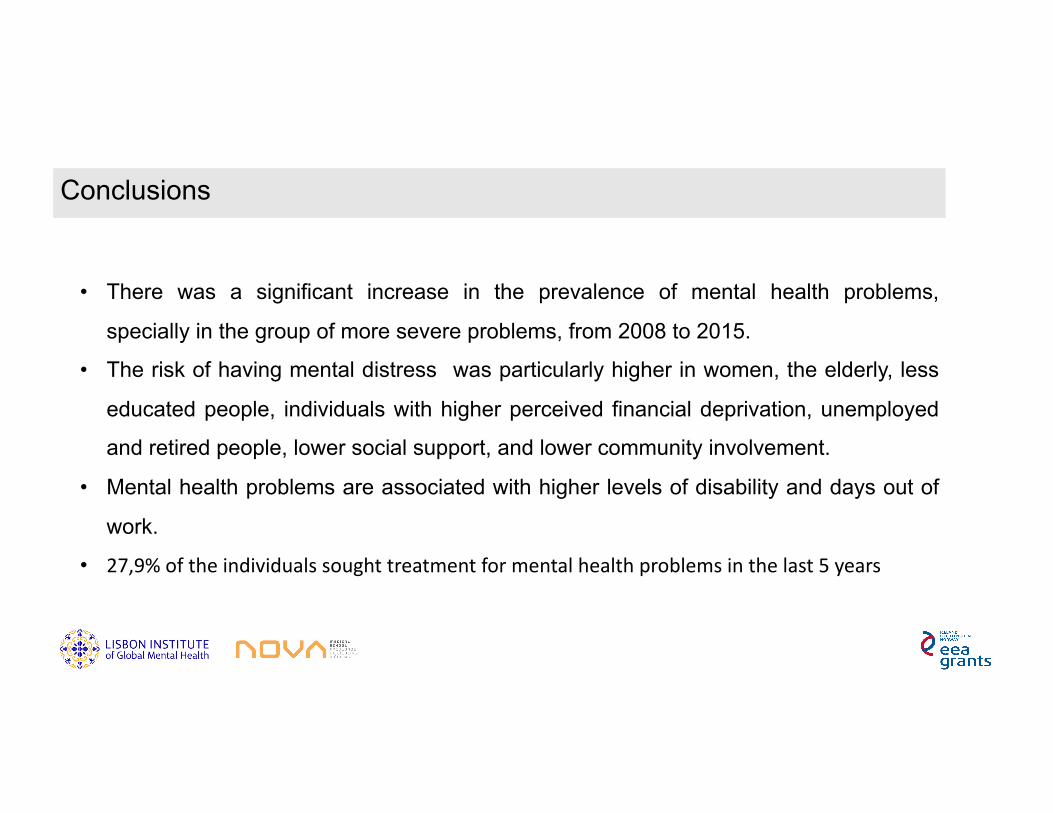
Conclusions
• There was a significant increase in the prevalence of mental health problems,
specially in the group of more severe problems, from 2008 to 2015.
• The risk of having mental distress was particularly higher in women, the elderly, less
educated people, individuals with higher perceived financial deprivation, unemployed
and retired people, lower social support, and lower community involvement.
• Mental health problems are associated with higher levels of disability and days out of
work.
• 27,9%oftheindividualssoughttreatmentformentalhealthproblemsinthelast5years
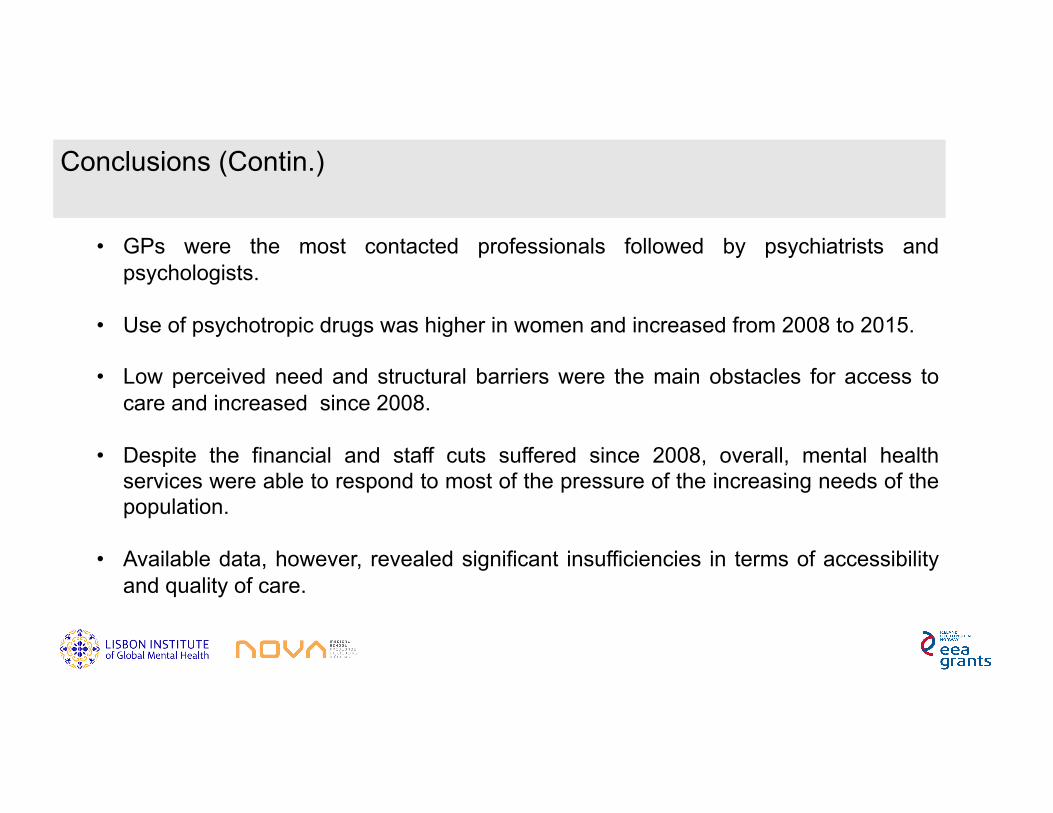
Conclusions (Contin.)
• GPs were the most contacted professionals followed by psychiatrists and psychologists.
• Use of psychotropic drugs was higher in women and increased from 2008 to 2015.
• Low perceived need and structural barriers were the main obstacles for access to care and increased since 2008.
• Despite the financial and staff cuts suffered since 2008, overall, mental health services were able to respond to most of the pressure of the increasing needs of the population.
• Available data, however, revealed significant insufficiencies in terms of accessibility and quality of care.
NOVAMedicalSchoolProjectTeam
JMCaldasdeAlmeida,GraçaCardoso,ManuelaSilva,AnaAntunes,DianaFrasquilho,Daniel
Neto,Benede]oSaraceno
Partners
FacultyofSocialSciences,UniversityofOslo
Ins[tutodeCiênciasSociais,UniversidadedeLisboa(JoãoFerrão)
UniversidadedeCoimbra,CEGOT(PaulaSantana&AdrianaLoureiro)
UniversidadeCatólica,CESOP(JorgeCerol)
NOVAInforma[onManagementSchool(JorgeMendes&HelenaBap[sta)
EscolaNacionaldeSaúdePública,UniversidadeNovadeLisboa(JulianPerelman)
ARSLisboaeValedoTejo(LuísPisco)
LisbonHospitalPsychiatricCentre,CHPL(JoséSalgado)
HospitalMagalhãesLemos(AntónioLeuschner)

Interna;onalconsultantsRonKessler,HarvardMedicalSchool,USA
JordiAlonsoandGemmaVilagut(IMIM,Barcelona)
Kris[anWahlbeck,FinnishAssocia[onforMentalHealth,Finland
ArneHolt,NorwegianIns[tuteofPublicHealth
NOVAMedicalSchoolSurveyTeam
JMCaldasdeAlmeida,MiguelXavier,GraçaCardoso,ManuelGonçalvesPereira,RicardoGusmão,Joaquim
Gago,MiguelTalina,BernardoCorrêa,JoaquimSilva.