Embed Size (px)
Citation preview
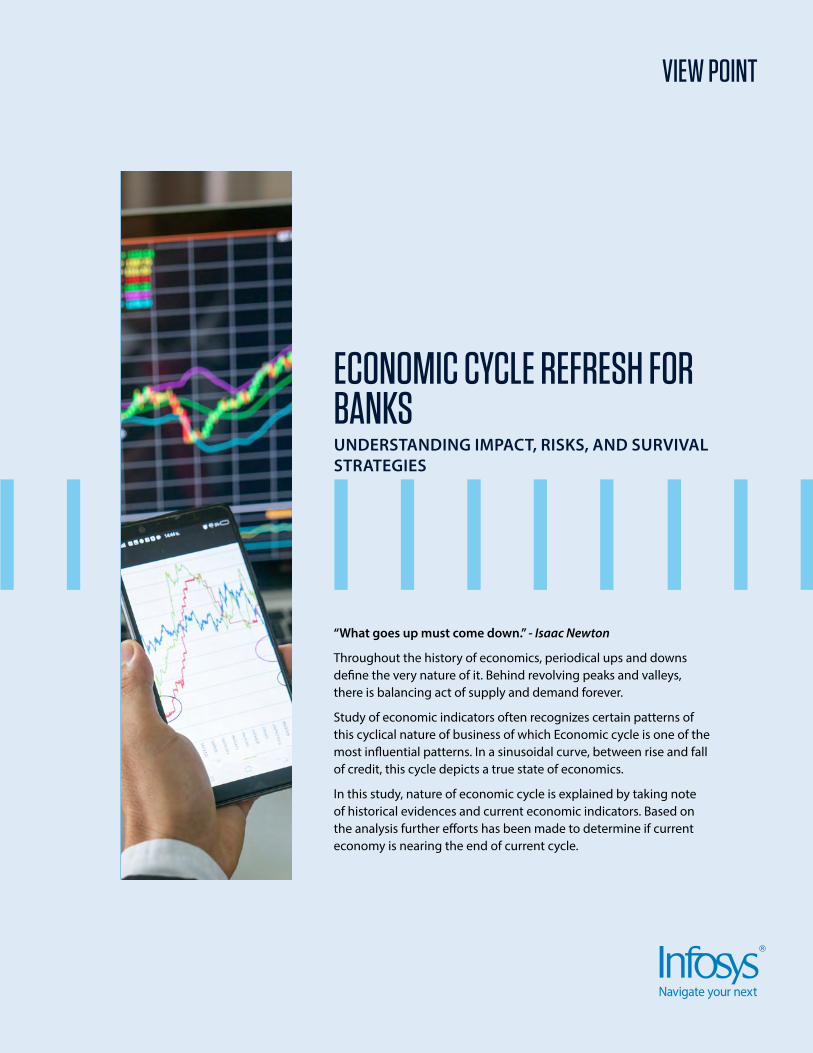
VIEW POINT
“What goes up must come down.” - Isaac Newton
Throughout the history of economics, periodical ups and downs define the very nature of it. Behind revolving peaks and valleys, there is balancing act of supply and demand forever.
Study of economic indicators often recognizes certain patterns of this cyclical nature of business of which Economic cycle is one of the most influential patterns. In a sinusoidal curve, between rise and fall of credit, this cycle depicts a true state of economics.
In this study, nature of economic cycle is explained by taking note of historical evidences and current economic indicators. Based on the analysis further efforts has been made to determine if current economy is nearing the end of current cycle.
ECONOMIC CYCLE REFRESH FOR BANKSUNDERSTANDING IMPACT, RISKS, AND SURVIVAL STRATEGIES
External Document © 2018 Infosys Limited
Acknowledgements
We would like to thank all the reviewers,
approvers and technical writers for their
participation and contribution to the
development of this document.
Special thanks to all the awesome people
who had contributed their valuable tools,
knowledge, experiences, and insights to
the public using World Wide Web.
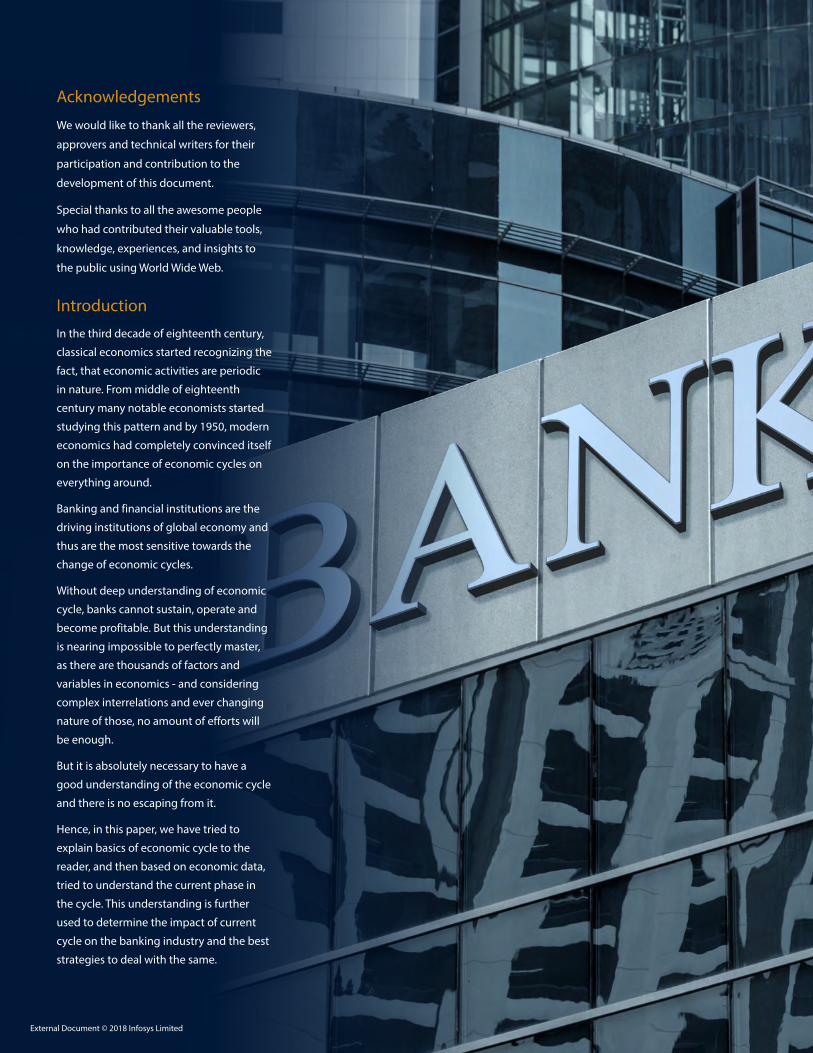
Introduction
In the third decade of eighteenth century,
classical economics started recognizing the
fact, that economic activities are periodic
in nature. From middle of eighteenth
century many notable economists started
studying this pattern and by 1950, modern
economics had completely convinced itself
on the importance of economic cycles on
everything around.
Banking and financial institutions are the
driving institutions of global economy and
thus are the most sensitive towards the
change of economic cycles.
Without deep understanding of economic
cycle, banks cannot sustain, operate and
become profitable. But this understanding
is nearing impossible to perfectly master,
as there are thousands of factors and
variables in economics - and considering
complex interrelations and ever changing
nature of those, no amount of efforts will
be enough.
But it is absolutely necessary to have a
good understanding of the economic cycle
and there is no escaping from it.
Hence, in this paper, we have tried to
explain basics of economic cycle to the
reader, and then based on economic data,
tried to understand the current phase in
the cycle. This understanding is further
used to determine the impact of current
cycle on the banking industry and the best
strategies to deal with the same.
External Document © 2018 Infosys Limited
External Document © 2018 Infosys Limited
What Is an Economic Cycle?
Economic cycle means expansion and
contraction of borrowing and lending
between companies and investors.
Significant swings in economic parameters
are observed naturally in The United
States and all other modern industrial
economies, though their duration may
vary. During peak, industries are growing
and unemployment is lower; but in few
years during phase of contraction, most
industries are not operating well with high
levels of unemployment.
Phases of economic prosperity are known
as expansions and phases of economic
downtrend are called recessions/
Leading indicators which will explain economic cycle?
There are numerous factors across the
globe, which are used quantatively and
methodically in different studies for
determining the economical state. In the
below section we are explaining few of the
most important factors in the context of this
paper.
Leading Indicators:
1. Hours of production workers in manufacturing: Increase in hours indicates more work and more
depressions. The combination of these two
phases of expansions and recessions is
called the business cycle.
Three phases of economic cycle are:
1. Recovery Phase: This phase comes
after a recession where evaluation is at
the cheapest level where most of the
companies are involved in proving their
credit profile.
2. Expansion Phase: Where we see
increased borrowing and lending, with
increment in underlying asset value.
3. Deterioration Phase: Today we are in
this phase. It is seen that we are through
the best of the cycles and proceeding
with caution. Deterioration phase can
actually last for years and end of the
phase depends on the combination of
factors like weakening economy and
recession, steps taken by central banks,
etc.
Also the question arises as to how investors
should be positioning their portfolios
in this environment. It is better suited
for focusing on capital preservation and
generating a reasonable return rather than
trying to maximize earnings.
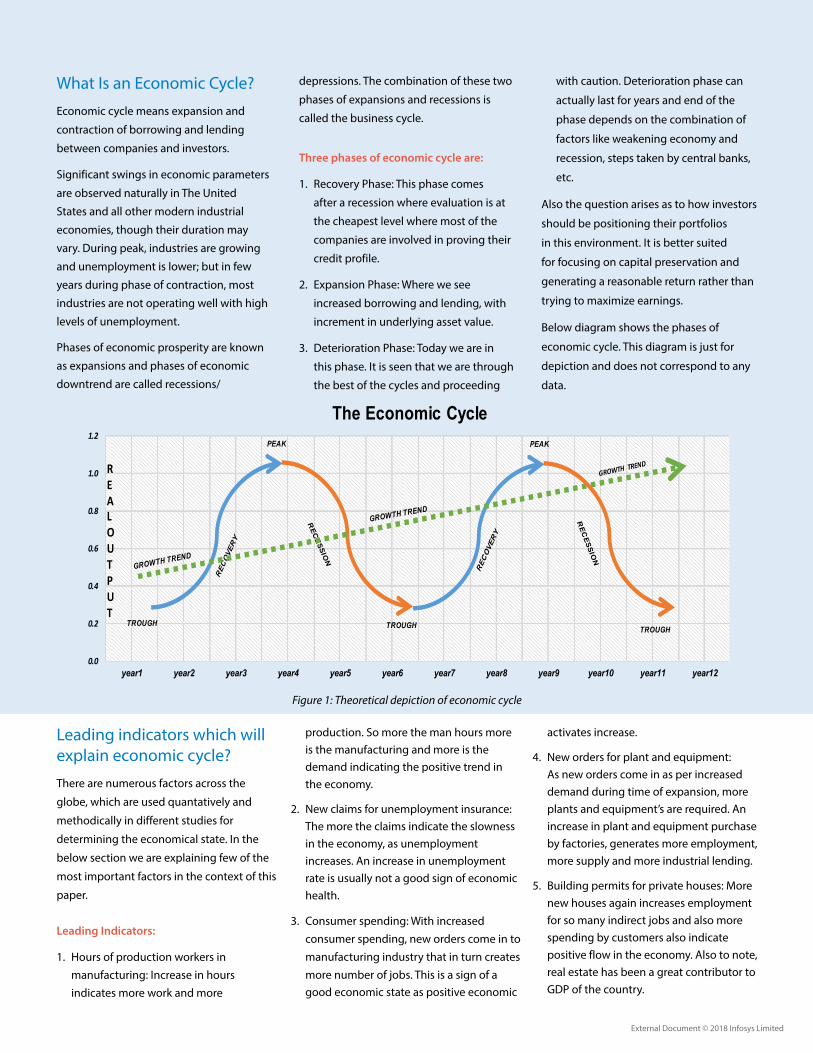
Below diagram shows the phases of
economic cycle. This diagram is just for
depiction and does not correspond to any
data.
Figure 1: Theoretical depiction of economic cycle
5
Phases of economic prosperity are known as expansions and phases of economic downtrend are called recessions/depressions. The combination of these two phases of expansions and recessions is called the business cycle.
Three phases of economic cycle are:
A. Recovery Phase: This phase comes after a recession where evaluation is at the cheapest level where most of the companies are involved in proving their credit profile.
B. Expansion Phase: Where we see increased borrowing and lending, with increment in underlying asset value.
C. Deterioration Phase: Today we are in this phase. It is seen that we are through the best of the cycles and proceeding with caution. Deterioration phase can actually last for years and end of the phase depends on the combination of factors like weakening economy and recession, steps taken by central banks, etc.
Also the question arises as to how investors should be positioning their portfolios in this environment. It is better suited for focusing on capital preservation and generating a reasonable return rather than trying to maximize earnings.
Below diagram shows the phases of economic cycle. This diagram is just for depiction and does not correspond to any data.
0.0
0.2
0.4
0.6
0.8
1.0
1.2
year1 year2 year3 year4 year5 year6 year7 year8 year9 year10 year11 year12
The Economic CyclePEAK
TROUGH TROUGH TROUGH
PEAK
REALOUTPUT
Figure 1: Theoretical depiction of economic cycle production. So more the man hours more is the manufacturing and more is the demand indicating the positive trend in the economy.
2. New claims for unemployment insurance: The more the claims indicate the slowness in the economy, as unemployment increases. An increase in unemployment rate is usually not a good sign of economic health.
3. Consumer spending: With increased consumer spending, new orders come in to manufacturing industry that in turn creates more number of jobs. This is a sign of a good economic state as positive economic
activates increase.
4. New orders for plant and equipment: As new orders come in as per increased demand during time of expansion, more plants and equipment’s are required. An increase in plant and equipment purchase by factories, generates more employment, more supply and more industrial lending.
5. Building permits for private houses: More new houses again increases employment for so many indirect jobs and also more spending by customers also indicate positive flow in the economy. Also to note, real estate has been a great contributor to GDP of the country.
External Document © 2018 Infosys Limited
6. Fraction of companies reporting slower deliveries: When a sector or industry reports slower deliveries for few consecutive quarters, that leaves a grim outlook on the economic growth prospect. Eventually if this trend continues, slowness in the economy may lead to a breakdown and recession period starts.
7. Index of consumer confidence: This is a very important point indicating the investing power of consumer into the market. When consumer confidence is
increasing, that generates opportunity
for business to greater revenue and
profit margin, along with increases risk
appetite for fresh investments.
8. Change in commodity prices: This
indicates the inflation in the market
and thus plays its part in deciding the
spending power of consumers in the
economy. For example, price of oil and
gas sector has direct impact in profit
margins of any large industry, rise in
edible commodities points towards
increasing inflation and lower
purchasing power.
9. Money growth rate: It indicates the
inflation in the economy. Inflation
is zero if money supply is equal to
money demand. Positive inflation is a
good sign for economies, but only up
to a threshold. Less inflation denotes
poor return on capital investments,
and very high inflation denotes
weakness in supply demand system
underlying.
Co - Incident indicators:
1. Nonagricultural employment: This indicates the increase of jobs in the market depending on the demand and thus one of the
indicators.
2. Index of industrial production: Its increase shows the positive trend in the economy and decrease marks towards the slowing of the
economy.
3. Personal income: This greatly varies depending on the market and plays a vital role in spending trend in the economy.
4. Manufacturing and trade sales: More sales in the manufacturing and increase in supply is the positive hint of a good economy.
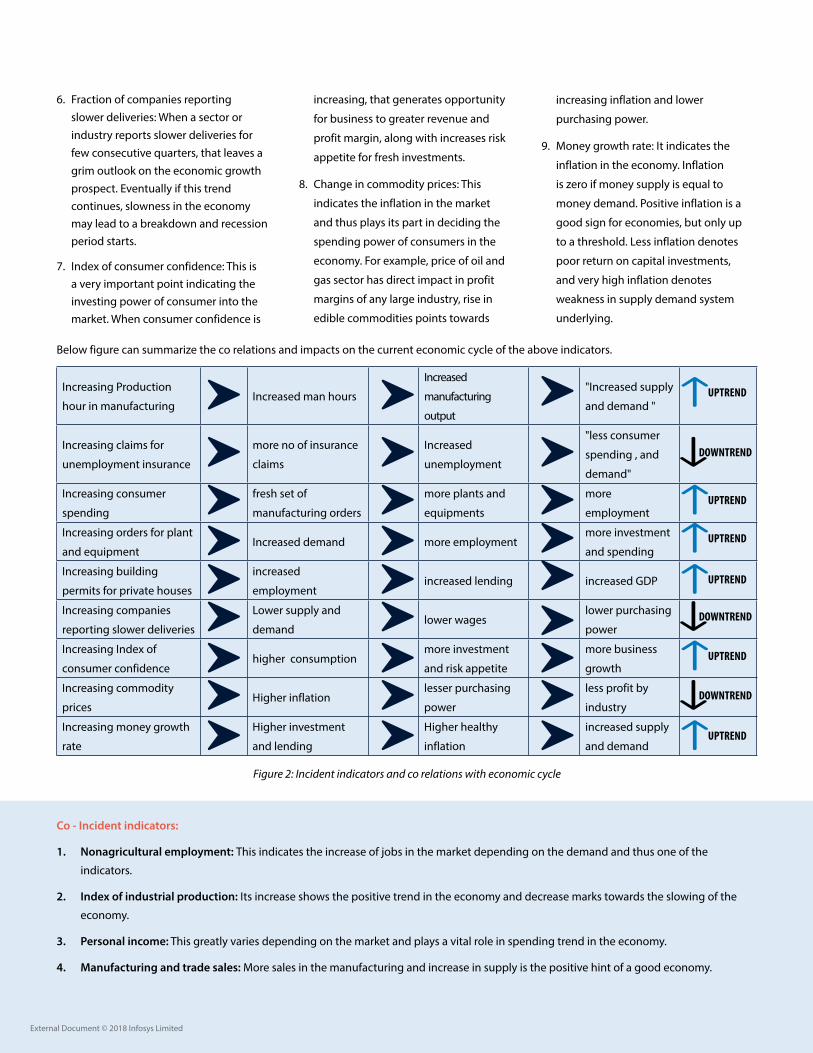
Below figure can summarize the co relations and impacts on the current economic cycle of the above indicators.
Increasing Production
hour in manufacturingIncreased man hours
Increased
manufacturing
output
"Increased supply
and demand "
Increasing claims for
unemployment insurance
more no of insurance
claims
Increased
unemployment
"less consumer
spending , and
demand"
Increasing consumer
spending
fresh set of
manufacturing orders
more plants and
equipments
more
employment
Increasing orders for plant
and equipmentIncreased demand more employment
more investment
and spending
Increasing building
permits for private houses
increased
employmentincreased lending increased GDP
Increasing companies
reporting slower deliveries
Lower supply and
demandlower wages
lower purchasing
power
Increasing Index of
consumer confidencehigher consumption
more investment
and risk appetite
more business
growth
Increasing commodity
pricesHigher inflation
lesser purchasing
power
less profit by
industry
Increasing money growth
rate
Higher investment
and lending
Higher healthy
inflation
increased supply
and demand
Figure 2: Incident indicators and co relations with economic cycle
External Document © 2018 Infosys Limited
UPTREND
DOWNTREND
DOWNTREND
DOWNTREND
UPTREND
UPTREND
UPTREND
UPTREND
UPTREND
External Document © 2018 Infosys Limited
When did economic cycle refresh happen last time?
Lets have a look at below data and then the graph, which can show the history of economic cycle refresh.
Why we believe economic cycle refresh could happen anytime soon?
Loan performance or flow of credit greatly
denotes the range for phases of economic
expansion and recession. In positive
scenarios, lenders provide more loans
to wider spread of marginal borrowers
but when loan quality starts to degrade,
lenders become more protective, which
often accelerates an economic recession.
Therefore, an understanding of the
economic cycle is paramount for banks.
As the global economy is already in its 7th
year of expansion following the traumatic
great recession episode in 2008-2009 and
as default rates have already started to
climb, it is worth examining whether now
is the appropriate time for a fresh cycle.
Let’s collaborate some views regarding this
So if below table data are averaged, we get into below numbers.
So this tells us, average recession period is of 11 months or 1 year roughly . but recovery is a longer period of around 5 years.
Source: U.S. Bureau of Economic Analysis (BEA)
boom month bust month Duration, boom to bust Duration, bust to boom
Duration, boom to boom
Duration, bust to bust
Feb-45 Oct-45 8M 80M 88M 93M
Nov-48 Oct-49 11M 37M 45M 48M
Jul-53 May-54 10M 45M 56M 55M
Aug-57 Apr-58 8M 39M 49M 47M
Apr-60 Feb-61 10M 24M 32M 34M
Dec-69 Nov-70 11M 106M 116M 117M
Nov-73 Mar-75 16M 36M 47M 52M
Jan-80 Jul-80 6M 58M 74M 64M
Jul-81 Nov-82 16M 12M 18M 28M
Jul-90 Mar-91 8M 92M 108M 100M
Mar-01 Nov-01 8M 120M 128M 128M
Dec-07 Jun-09 18M 73M 81M 91M
Duration, boom to bust Duration, bust to boom Duration, boom to boom Duration, bust to bust
From Year 1945 till year 2009 (11 cycles) 11.1M 58.4M 68.5M 69.5M
from some leading sources below.
1. As per CNBC, at present, after recovering
from recession of 2008-2009, the
current economic uptrend will age
around on its eighth year and will be
on its 96 months’ age. As the historical
probability suggests, in any particular
year, probability of recession is around
15 percent. So based on the maturity and
historical average, it can be predicted a
50 % chance of recession for the coming
1 year and 100 % in the coming two
years.
Reference:https://www.cnbc.
com/2017/06/27/op-ed-a-history-of-
economic-cycles-suggests-a-recession-
is-near.html
2. As per Huffington post, National Bureau
of Economic Research data suggests,
which tracks recessions on a monthly
basis since 1854, current phase is already
overdue for another recession.
Between 1854 to 1919, there were total
16 completed economic cycles, and
the average recession period is about
22 months, and the average economic
expansion is about 27 months.
Between 1919 to 1945, there were total 6
cycles, recessions period averaged of 18
months and expansions averaged for 35
months. And the period between 1945
to 2001 we saw 10 cycles, recessions
lasted an average of 10 months, and
expansions an average of 57 months.
So recessions are getting shorter and
expansion periods longer over time.
The level of total debt is higher in
aggregate and relative to output,
reflecting higher leverage ratios. World
External Document © 2018 Infosys Limited
debt to GDP has swollen from an
already record high of 269% in 2007
to nearly 300% according to McKinsey,
with average world GDP also lower by
nearly 1% compared to the last decade,
therefore reducing debt repayment
capacity. Also past due debts were not
resolved completely during the last
cycle, leaving many organizations with
an unsustainably high level of debt.
Reference:https: //www.huffingtonpost.
com/daniel-wagner/history-tells-us-that-
201_b_7763774.html
3. As per Qrius website and econominshelp
website, this would further lead to
slower investments and higher interest
rates raise, thus increasing the inflation
expectation. The inflation expectation
comprises of parameters like household
expectation, consumption etc. When
an economy experiences inflation, the
Central Bank will raise interest rates.
Higher interest rates will reduce consumer
spending and investment leading to
lower aggregate demand which slows
down the growth percentage and impacts
the GDP of the economy significantly.
However, if there is a decline in Real GDP,
firms will employ fewer workers leading
to a rise in unemployment. This concerns
the general economy as it fears another
credit crunch rise; with the banks at mercy
of higher borrowing rates and reticent to
lend.
Reference:https: //www.economicshelp.
org/blog/571/unemployment/trade-off-
between-unemployment-and-inflation/
https://qrius.com/interest-rates-and-
gdp-growth-rate/
Based on the historical data, and current
state of affairs, we are predicting US
economy may start to show sign of
recession period in coming 12 to 20
months.
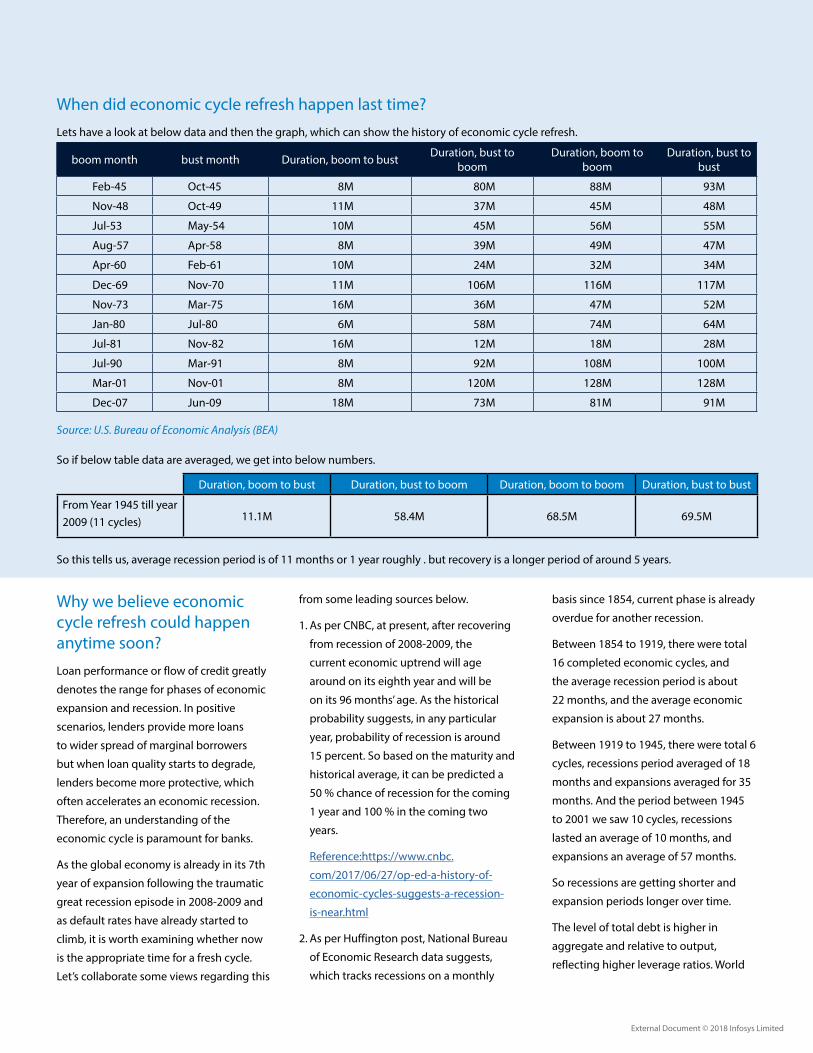
As an illustration, below figure depicts
unemployment rate of US economy in past
years. Trough phases are indicated by blue
downward arrow.
Figure 3: US annual employment rate from 1948 till 2017
6 56
78
10 10
87
65 5 5
66 6 6 5 5
4 4 4 4 4
6 65 5
4
8
6
8
10 10
0
2
4
6
8
10
12
Perc
ent
Year
US Unemployment - Inflation
External Document © 2018 Infosys Limited
External Document © 2018 Infosys Limited
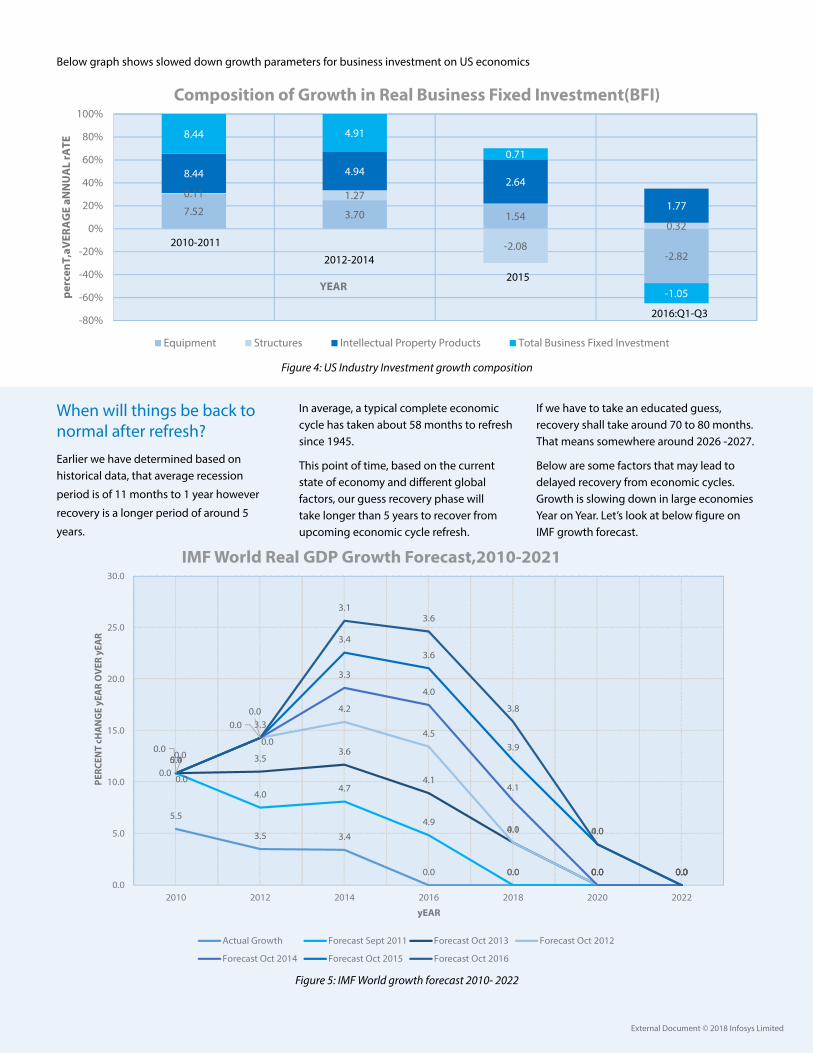
Below graph shows slowed down growth parameters for business investment on US economics
Figure 4: US Industry Investment growth composition
7.52 3.70 1.54
-2.82
0.11 1.27
-2.08
0.32
8.44 4.942.64
1.77
8.44 4.91
0.71
-1.05
-80%
-60%
-40%
-20%
0%
20%
40%
60%
80%
100%
perc
enT,
aVER
AG
E aN
NU
AL
rATE
YEAR
Composition of Growth in Real Business Fixed Investment(BFI)
Equipment Structures Intellectual Property Products Total Business Fixed Investment
2010-2011
2012-2014
2015
2016:Q1-Q3
When will things be back to normal after refresh?
Earlier we have determined based on historical data, that average recession
period is of 11 months to 1 year however
recovery is a longer period of around 5
years.
In average, a typical complete economic cycle has taken about 58 months to refresh since 1945.
This point of time, based on the current state of economy and different global factors, our guess recovery phase will take longer than 5 years to recover from upcoming economic cycle refresh.
If we have to take an educated guess, recovery shall take around 70 to 80 months. That means somewhere around 2026 -2027.
Below are some factors that may lead to delayed recovery from economic cycles. Growth is slowing down in large economies Year on Year. Let’s look at below figure on IMF growth forecast.
5.5
3.5 3.4
0.0 0.0 0.0 0.0
5.4
4.04.7
4.9
0.0 0.0 0.0
0.0 3.53.6
4.1
4.1
0.0 0.0
0.0
3.3
4.2
4.5
0.0
0.0 0.0
0.00.0
3.3
4.0
4.1
0.0 0.0
0.0
0.0
3.4
3.6
3.9
4.0
0.0
0.0
0.0
3.13.6
3.8
0.0
0.00.0
5.0
10.0
15.0
20.0
25.0
30.0
2010 2012 2014 2016 2018 2020 2022
PERC
ENT
cHA
NG
E yE
AR
OV
ER y
EAR
yEAR
IMF World Real GDP Growth Forecast,2010-2021
Actual Growth Forecast Sept 2011 Forecast Oct 2013 Forecast Oct 2012
Forecast Oct 2014 Forecast Oct 2015 Forecast Oct 2016
Figure 5: IMF World growth forecast 2010- 2022
External Document © 2018 Infosys Limited
External Document © 2018 Infosys Limited
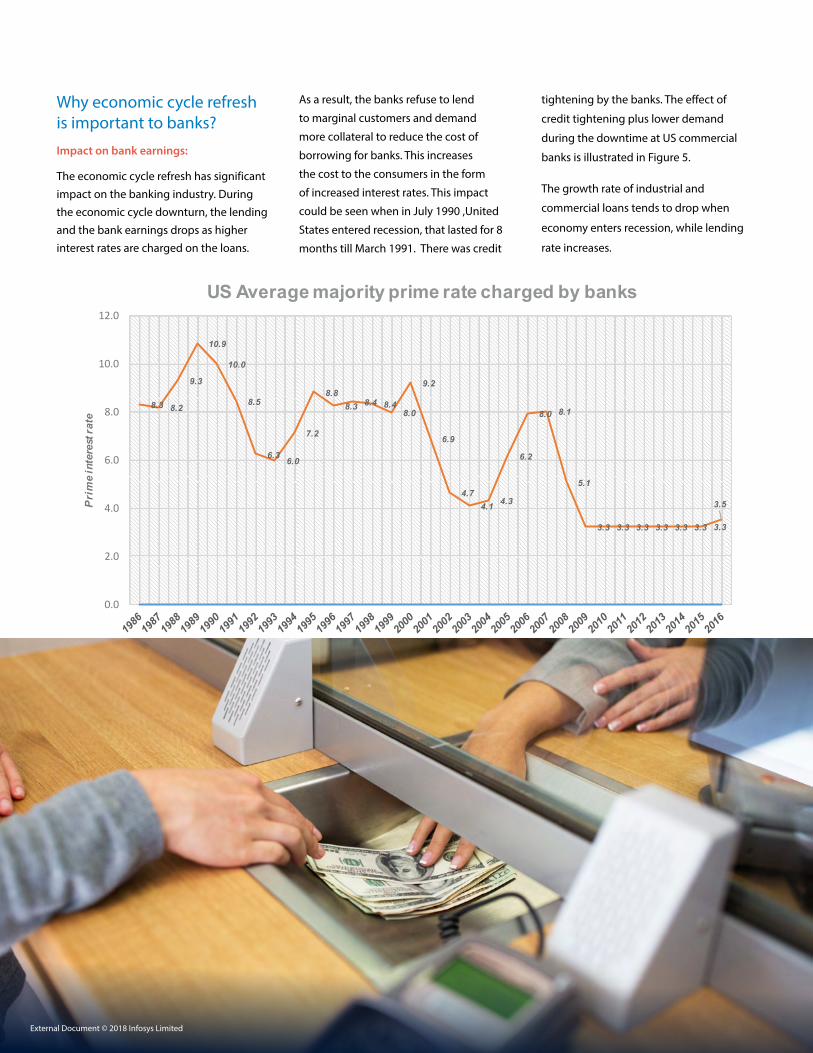
Why economic cycle refresh is important to banks?
Impact on bank earnings:
The economic cycle refresh has significant impact on the banking industry. During the economic cycle downturn, the lending and the bank earnings drops as higher interest rates are charged on the loans.
As a result, the banks refuse to lend
to marginal customers and demand
more collateral to reduce the cost of
borrowing for banks. This increases
the cost to the consumers in the form
of increased interest rates. This impact
could be seen when in July 1990 ,United
States entered recession, that lasted for 8
months till March 1991. There was credit
tightening by the banks. The effect of
credit tightening plus lower demand
during the downtime at US commercial
banks is illustrated in Figure 5.
The growth rate of industrial and
commercial loans tends to drop when
economy enters recession, while lending
rate increases.
13
8.3 8.2
9.3
10.9
10.0
8.5
6.3 6.0
7.2
8.88.3 8.4 8.4
8.0
9.2
6.9
4.74.1 4.3
6.2
8.0 8.1
5.1
3.3 3.3 3.3 3.3 3.3 3.3 3.3
3.5
0.0
2.0
4.0
6.0
8.0
10.0
12.0
Pri
me
inte
rest
rate
Year
US Average majority prime rate charged by banks
Figure 6: US bank prime lending rate 1986 to 2016
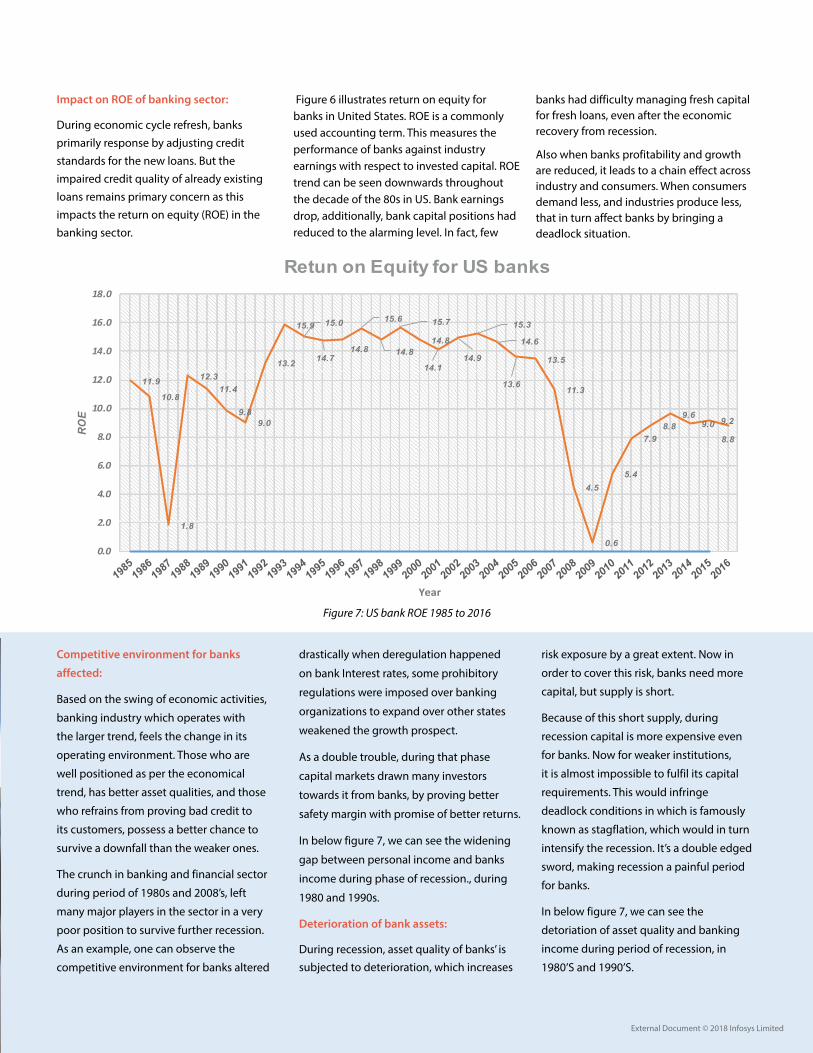
Impact on ROE of Banking sector:
During economic cycle refresh, banks primarily response by adjusting credit standards for the new loans. But the impaired credit quality of already existing loans remains primary concern as this impacts the return on equity (ROE) in the banking sector.
Figure 6 illustrates return on equity for banks in United States. ROE is a commonly used accounting term. This measures the performance of banks against industry earnings with respect to invested capital. ROE trend can be seen downwards throughout the decade of the 80s in US. Bank earnings drop, additionally, bank capital positions had reduced to the alarming level. In fact, few banks had difficulty managing fresh capital for fresh loans, even after the economic recovery from recession.
Also when banks profitability and growth are reduced, it leads to a chain effect across industry and consumers. When consumers demand less, and industries produce less, that in turn affect banks by bringing a deadlock situation.
Figure 6: US bank prime lending rate 1986 to 2016
External Document © 2018 Infosys Limited
External Document © 2018 Infosys Limited
Impact on ROE of banking sector:
During economic cycle refresh, banks primarily response by adjusting credit standards for the new loans. But the impaired credit quality of already existing loans remains primary concern as this impacts the return on equity (ROE) in the banking sector.
Competitive environment for banks
affected:
Based on the swing of economic activities,
banking industry which operates with
the larger trend, feels the change in its
operating environment. Those who are
well positioned as per the economical
trend, has better asset qualities, and those
who refrains from proving bad credit to
its customers, possess a better chance to
survive a downfall than the weaker ones.
The crunch in banking and financial sector
during period of 1980s and 2008’s, left
many major players in the sector in a very
poor position to survive further recession.
As an example, one can observe the
competitive environment for banks altered
Figure 7: US bank ROE 1985 to 2016
Figure 6 illustrates return on equity for banks in United States. ROE is a commonly used accounting term. This measures the performance of banks against industry earnings with respect to invested capital. ROE trend can be seen downwards throughout the decade of the 80s in US. Bank earnings drop, additionally, bank capital positions had reduced to the alarming level. In fact, few
banks had difficulty managing fresh capital for fresh loans, even after the economic recovery from recession.
Also when banks profitability and growth are reduced, it leads to a chain effect across industry and consumers. When consumers demand less, and industries produce less, that in turn affect banks by bringing a deadlock situation.
14
11.9
10.8
1.8
12.311.4
9.89.0
13.2
15.9 15.0
14.714.8
15.6
14.8
15.7
14.8
14.114.9
15.3
14.6
13.6
13.5
11.3
4.5
0.6
5.4
7.98.8
9.69.0 9.2
8.8
0.0
2.0
4.0
6.0
8.0
10.0
12.0
14.0
16.0
18.0
ROE
Year
Retun on Equity for US banks
Figure 7: US bank ROE 1985 to 2016
Competitive environment for banks affected: Based on the swing of economic activities, banking industry which operates with the larger trend, feels the change in its operating environment. Those who are well positioned as per the economical trend, has better asset qualities, and those who refrains from proving bad credit to its customers, possess a better chance to survive a downfall than the weaker ones.
The crunch in banking and financial sector during period of 1980s and 2008’s, left many major players in the sector in a very poor position to survive further recession. As an example, one can observe the competitive environment for banks altered drastically when deregulation happened on bank Interest rates, some prohibitory regulations were imposed over banking organizations to expand over other states weakened the growth prospect.
As a double trouble, during that phase capital markets drawn many investors towards it from banks, by proving better safety margin with promise of better returns.
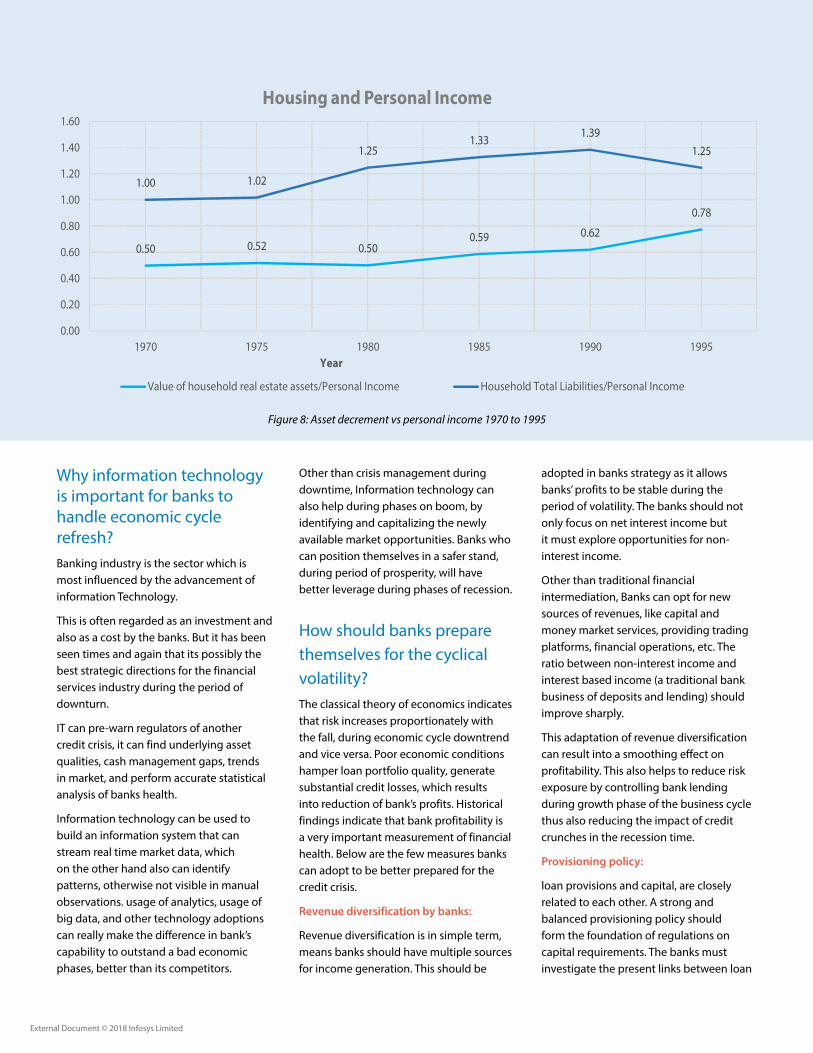
In below figure 7, we can see the widening gap between personal income and banks income during phase of recession., during 1980 and 1990s.
drastically when deregulation happened
on bank Interest rates, some prohibitory
regulations were imposed over banking
organizations to expand over other states
weakened the growth prospect.
As a double trouble, during that phase
capital markets drawn many investors
towards it from banks, by proving better
safety margin with promise of better returns.
In below figure 7, we can see the widening
gap between personal income and banks
income during phase of recession., during
1980 and 1990s.
Deterioration of bank assets:
During recession, asset quality of banks’ is subjected to deterioration, which increases
risk exposure by a great extent. Now in
order to cover this risk, banks need more
capital, but supply is short.
Because of this short supply, during
recession capital is more expensive even
for banks. Now for weaker institutions,
it is almost impossible to fulfil its capital
requirements. This would infringe
deadlock conditions in which is famously
known as stagflation, which would in turn
intensify the recession. It’s a double edged
sword, making recession a painful period
for banks.
In below figure 7, we can see the
detoriation of asset quality and banking
income during period of recession, in
1980’S and 1990’S.
External Document © 2018 Infosys Limited
External Document © 2018 Infosys Limited
0.50 0.52 0.500.59 0.62
0.78
1.00 1.02
1.251.33
1.391.25
0.00
0.20
0.40
0.60
0.80
1.00
1.20
1.40
1.60
1970 1975 1980 1985 1990 1995Year
Housing and Personal Income
Value of household real estate assets/Personal Income Household Total Liabilities/Personal Income
Figure 8: Asset decrement vs personal income 1970 to 1995
Why information technology is important for banks to handle economic cycle refresh?Banking industry is the sector which is most influenced by the advancement of information Technology.
This is often regarded as an investment and also as a cost by the banks. But it has been seen times and again that its possibly the best strategic directions for the financial services industry during the period of downturn.
IT can pre-warn regulators of another credit crisis, it can find underlying asset qualities, cash management gaps, trends in market, and perform accurate statistical analysis of banks health.
Information technology can be used to build an information system that can stream real time market data, which on the other hand also can identify patterns, otherwise not visible in manual observations. usage of analytics, usage of big data, and other technology adoptions can really make the difference in bank’s capability to outstand a bad economic phases, better than its competitors.
Other than crisis management during downtime, Information technology can also help during phases on boom, by identifying and capitalizing the newly available market opportunities. Banks who can position themselves in a safer stand, during period of prosperity, will have better leverage during phases of recession.
How should banks prepare themselves for the cyclical volatility?The classical theory of economics indicates that risk increases proportionately with the fall, during economic cycle downtrend and vice versa. Poor economic conditions hamper loan portfolio quality, generate substantial credit losses, which results into reduction of bank’s profits. Historical findings indicate that bank profitability is a very important measurement of financial health. Below are the few measures banks can adopt to be better prepared for the credit crisis.
Revenue diversification by banks:
Revenue diversification is in simple term, means banks should have multiple sources for income generation. This should be
adopted in banks strategy as it allows banks’ profits to be stable during the period of volatility. The banks should not only focus on net interest income but it must explore opportunities for non-interest income.
Other than traditional financial intermediation, Banks can opt for new sources of revenues, like capital and money market services, providing trading platforms, financial operations, etc. The ratio between non-interest income and interest based income (a traditional bank business of deposits and lending) should improve sharply.
This adaptation of revenue diversification can result into a smoothing effect on profitability. This also helps to reduce risk exposure by controlling bank lending during growth phase of the business cycle thus also reducing the impact of credit crunches in the recession time.
Provisioning policy:
loan provisions and capital, are closely related to each other. A strong and balanced provisioning policy should form the foundation of regulations on capital requirements. The banks must investigate the present links between loan

External Document © 2018 Infosys Limited
provisioning methods and the business
cycle. Also the link between capital
requirements and the current state of
economic cycle to be studied carefully.
The favorable conditions during
economic expansion often results into
an unpleasant increase in credit lending
as creditworthiness of a loan seeker is
done less diligently. On the contrary this
reverses during the economic fall, thus
generating less credit opportunities when
the banks need them most. Hence an
alternate approach is required to treat
this practice as a risk and measures to be
taken to manage the financial imbalances
that increase the impact of a recession.
According to counter cyclical view,
provisions should be positively synced with
the business cycle, and banks should asses
and act on the cyclical pattern of credit
risk. They must build up loan loss reserves
in good times to balance against the credit
crunch in bad times.
Though it’s been enforced by regulatory
and governing bodies that the banks should
maintain minimum loan loss reserves and
some capital stock which act as buffers to
ensure bank’s sustainable solvency. This
reserve shields banks against, expected and
unexpected losses during credit crunch.
ConclusionBanking industry is the sector which is most influenced by the advancement of information Technology.
This is often regarded as an investment and also as a cost by the banks. But it has been seen times and again that its possibly the best strategic directions for the financial services industry during the period of downturn.
IT can pre-warn regulators of another credit crisis, it can find underlying asset qualities, cash management gaps, trends in market, and perform accurate statistical analysis of banks health.
Information technology can be used to build an information system that can stream real time market data, which on the other hand also can identify patterns, otherwise not visible in manual observations. usage of analytics, usage of big data, and other technology adoptions can really make the difference in bank’s capability to outstand a bad economic phases, better than its competitors.
External Document © 2018 Infosys Limited

© 2018 Infosys Limited, Bengaluru, India. All Rights Reserved. Infosys believes the information in this document is accurate as of its publication date; such information is subject to change without notice. Infosys acknowledges the proprietary rights of other companies to the trademarks, product names and such other intellectual property rights mentioned in this document. Except as expressly permitted, neither this documentation nor any part of it may be reproduced, stored in a retrieval system, or transmitted in any form or by any means, electronic, mechanical, printing, photocopying, recording or otherwise, without the prior permission of Infosys Limited and/ or any named intellectual property rights holders under this document.
For more information, contact [email protected]
Infosys.com | NYSE: INFY Stay Connected
About the Authors
References
Karunesh Mohan nce Practice, Financial Services Domain Consulting Group, InfosysPrincipal Consultant, SAP Practice, Infosys
Karunesh Mohan holds a full time PGDBM in Finance from Birla Institute of Management and Executive education program in Strategic Management from IIM, Kozhikode. Karunesh is part of DCG group in Infosys with 19 years of experience working with banks as a banker and IT process and domain expert, consulting for Top global banking clients in US, UK, Australia, Singapore and Japan geographies. Karunesh is also a certified trainer on banking domain and has trained 2000+ IT resources across the globe.
Deepshikha Sharma nce Practice, Financial Services Domain Consulting Group, InfosysPrincipal Consultant, SAP Practice, Infosys
Deepshikha Sharma has done a fulltime PGPM from The Great Lakes Institute of Management, Chennai and B.E from Punjab University with 3.5 years of experience in the areas of banking, business analytics, business intelligence, business analysis and data management.
Chaitanya Tallam nce Practice, Financial Services Domain Consulting Group, InfosysPrincipal Consultant, SAP Practice, Infosys
Chaitanya Tallam holds a bachelor degree in computer science, and has over 7+ years of experience in IT industry. He is part of DCG banking group in Infosys. He has BA and testing experience in BFSI domain. He is part of FSDCG group and has interest in payments and cash management areas.
Debmalya Das Barman nce Practice, Financial Services Domain Consulting Group, InfosysPrincipal Consultant, SAP Practice, Infosys
Debmalya Das Barman holds a bachelor degree in computer engineering and masters in Service excellence. He is part of DCG banking group in Infosys. He has spent over 8+ years in IT industry working with major international Banks. Debmalya is passionate about computing, economics, and stock market investing.
http://www.etf.com/sections/features-and-news/10203-5-signs-the-credit-cycle-is-coming-to-an-endhttp://www.investopedia.com/terms/c/credit-cycle.asphttps://www.bea.gov/papers/pdf/US_Cyclical_Indicators_Moscow.pdfhttps://www.bea.gov/national/index.htmhttps://fraser.stlouisfed.org/https://fraser.stlouisfed.org/scribd/?item_id=535300&filepath=/files/docs/publications/ERP/2017_erp.pdfhttps://tradingeconomics.com/united-states/gdp-growthhttps://www.cnbc.com/2017/06/27/op-ed-a-history-of-economic-cycles-suggests-a-recession-is-near.htmlhttp://www.huffingtonpost.com/daniel-wagner/history-tells-us-that-201_b_7763774.htmlhttp://www.nber.org/cycles.htmlhttp://www.econlib.org/library/Enc/BusinessCycles.html