Embed Size (px)
Citation preview
Economic Decisions in Farm Animal HealthInternational workshop held at Research Centre Foulum9-10 November 2006
Jehan Ettema, Anne Kudahl, Jan Tind Sørensen (eds.)
DJF Anim Al Sc ience nO. 77 • m A J 2007
AA
RH
US
U
NI
VE
RS
IT
ET
Faculty of Agricultural Sciences
The reports primarily contain re-search results and trial statements aimed at Danish Conditions. Also, the reports describe larger completed research projects or act as an appen-dix at meetings and conferences. The reports are published in the series:Plant Science, Animal Science and Horticulture.
Subscribers obtain 25% discount. Subscription can be taken out by con-tacting:Faculty of Agricultural SciencesP.O. Box 50DK-8830 TjeleTel. +45 8999 1028
All the publications can be ordered on the internet: www.agrsci.dk
Print: www.digisource.dkISSN 1397-9892ISBN 87-91949-13-0
Jehan Ettema, Anne Kudahl, Jan Tind Sørensen (eds.)
Faculty of Agricultural SciencesDepartment of Animal Health, Welfare and NutritionP.O. Box 50DK-8830 Tjele
Economic Decisions in Farm Animal HealthInternational workshop held at Research Centre Foulum9-10 November 2006
DJF ANIm Al SC IENCE NO. 77 • m A J 2007
Foulum, 9-10 November 2006: Economic decisions in Farm Animal Health
Table of contents Preface ....................................................................................................................................... 5 Stochastic modelling to evaluate the economic efficiency of treatment of chronic subclinical mastitis ................................................................................................................... 7 Wilma Steeneveld, UU Epidemiology and herd health economics as components of veterinary business intelligence............................................................................................................................... 13 Erling Kristensen, DIAS Detection of abnormal milk and mastitis using sensor measurements of automatic milking machines.................................................................................................................... 19 Claudia Kamphuis, UU Modelling costs of lameness in dairy herds with representation of uncertainty in the state of nature ......................................................................................................................... 23 Jehan Ettema, DIAS The costs of mastitis and valuation of different cost factors by farmers .......................... 29 Kirsten Huijps, UU Decision support for managing leg disorders in finisher herds ......................................... 33 Tina Birk Jensen, KVL Yield losses associated with clinical mastitis occurring in different weeks of lactation .. 37 Christel Hagnestam, SLU A conceptual framework to explore tradeoffs between prevention, monitoring and control of avian influenza ...................................................................................................... 41 Natasha Longworth, WUR A method for evaluation of the effects of clinical interventions in dairy herds................ 47 Mogens Krogh, KVL Discovering real options in the optimal control of foot-and-mouth disease ..................... 51 Lan Ge, WUR Production effects of subclinical mastitis ............................................................................. 57 Tariq Halasa, UU Optimizing control measures against E.coli O157:H7 (VTEC) along the beef chain ...... 63 Bouda Vosough Ahmadi, WUR
3
Foulum, 9-10 November 2006: Economic decisions in Farm Animal Health
Measurement of economic risk caused by disease: The case of mycoplasma in swine herds ........................................................................................................................................ 67 Niels Peter Baadsgaard, DMA and Lars Otto, KVL The value of economics as motivation factor for dairy farmers ........................................ 87 Henk Hogeveen, WUR General discussion.................................................................................................................. 97 Participants and contact information................................................................................. 101 Group photo.......................................................................................................................... 103 Abbreviations of participating institutes and universities UU: Utrecht University, Utrecht, the Netherlands. www.uu.nl DIAS: Danish Institute of Agricultural Sciences, Foulum, Denmark. www.agrsci.dk KVL: Royal Veterinary and Agricultural University, Copenhagen, Denmark,
www.iph.kvl.dk WUR: Wageningen University and Research Centre, Wageningen, the Netherlands, www.wur.nl SLU: Swedish University of Agricultural Sciences, Uppsala, Sweden, www.slu.se DMA: Danish Meat Association, Danish Pig Production, Copenhagen, Denmark, www.dansksvineproduktion.dk INRA: French National Institute for Agricultural Research-National Veterinary School
of Nantes, Nantes, France, www.vet-nantes.fr
4

Foulum, 9-10 November 2006: Economic decisions in Farm Animal Health
Preface
In 1988 Dr. Aalt Dijkhuizen from the Department of Farm Management at Wageningen University took the initiative to organise a workshop for researchers in Animal Health Economics and Animal Health Decision Support at the Department for Farm Management and at a similar research group at the National Institute of Animal Science in Foulum, Denmark. I met Aalt for the first time in April 1987 at an invited seminar on Modelling of Livestock Production Systems held by the Commission of European Communities for Agricultural Research Programme. It was clear to both of us that there were many similarities between objectives and methods used in the Danish and in the Dutch groups. This initiated a long tradition of organising workshops on the topic. Workshops were organised in 1990 in Foulum, 1993 in Utrecht, 1997 at The Royal Veterinary and Agricultural University in Copenhagen, 2000 in Wageningen, and 2006 in Foulum.
The focus of the workshops has been maintained through the years, but subsequently more players were invited. In 2000 we included the Veterinary School of Nantes in the ‘club’ and moved from a Dutch /Danish framework to an international framework. This was further enhanced by inviting researchers from the Swedish Agricultural University to the workshop in Foulum in 2006. During the years it also became a part of the objective to focus on PhD-projects at the workshops. It is not the ambition to increase the workshop to a large symposium on the topic, but to keep the group small enough for workshop conditions.
The activity has certainly been very valuable for exchanging ideas on Animal Health Economics, but also for developing networks between researchers in the field.
The international workshop Economic Decisions in farm Animal Health held at the Research Centre Foulum from 9-10 November 2006 focussed, in the spirit of the workshop series, on PhD-projects. In total 12 PhD-students and two young scientists planning a PhD, participated along with more than 20 senior scientists in the field. A short introduction to the presentations given at the workshop is collected in the Proceedings. We have also made a summary of the general discussion of the meeting. Besides, a complete list of participants is included encouraging participants to keep contact.
The workshop was organised by Jehan Ettema – A Dutch MSc from Wageningen doing a PhD at the Danish Institute of Agricultural Sciences and the Royal Veterinary and Agricultural University in Copenhagen. Jan Tind Sørensen December 2006
5

Foulum, 9-10 November 2006: Economic decisions in Farm Animal Health
6
Foulum, 9-10 November 2006: Economic decisions in Farm Animal Health
Stochastic modelling to evaluate the economic efficiency of treatment of chronic subclinical mastitis W. Steeneveld2, H. Hogeveen1,2, B.H.P. Van den Borne2 and J.M. Swinkels3
1Business Economics, Wageningen University, Wageningen, the Netherlands 2Department of Farm Animal Health, Faculty of Veterinary Medicine, Utrecht University, Utrecht, the Netherlands 3Innovet Bovine Herd Health Consultancy, Noordbeemster, the Netherlands Abstract
Treatment of subclinical mastitis is traditionally no common practice. However, some veterinarians regard treatment of some types of subclinical mastitis to be effective. The goal of this research was to develop a stochastic Monte Carlo simulation model to support decisions around treatment of chronic subclinical mastitis caused by Streptococcus uberis. Factors in the model include, amongst others, the probability of spontaneous cure, probability of the cow becoming clinically diseased, transmission of infection to other cows, cure rate under treatment and physiological effects of the infection. The average economic damage (with basic input parameters for the Dutch circumstances) of an untreated chronic subclinical mastitis case caused by S. uberis is € 88. With a short (3 day) treatment, the average damage was higher. For the average cow, treatment is not economical efficient. Sensitivity analysis showed that this might depend on some specific cow and farm factors. Moreover, the spread of economic damage indicates that the risk of a high damage is much higher when a cow with chronic subclinical mastitis is not treated. Introduction
In many countries, mastitis is regarded as the most costly disease in dairy cattle. Costs are mainly due to milk production losses, culling, treatment and discarded milk due to antibiotic residues. Additional costs include decreased fertility, changed composition of milk and risk of violation of bulk tank quality regulations or loss of premium for low bulk milk somatic cell count. In cases of clinical mastitis, farmers are usually willing to treat animals because the animals are diseased, milk is visibly abnormal, and/or milk production has decreased dramatically. In cases of subclinical mastitis, animals are not clinically diseased and milk is not visibly abnormal. Therefore, inflammation is not recognizable without additional testing and treatment may not seem necessary. Treatment of subclinical mastitis is often deferred until the dry period. However, subclinical mastitis, like clinical mastitis, affects milk quality and quantity, and is associated with economic losses as described above. Furthermore, cows with subclinical infections may act as a source of infection for other animals, resulting in spread of a mastitis problem in the herd (Zadoks et al., 2003). Recent studies have shown that treatment of subclinical infections with non-agalactiae streptococci may contribute to
7
Foulum, 9-10 November 2006: Economic decisions in Farm Animal Health
prevention of clinical mastitis (Deluyker et al., 2005; St. Rose et al., 2003,) and to prevention of streptococcal transmission. The cost-benefit ratio of antibiotic treatment of subclinical Streptococcus uberis infections during lactation has been determined using a deterministic model (Swinkels et al., 2005b). In this study it was concluded that, on average, a 3-day treatment for chronic subclinical mastitis caused by S. uberis or Streptococcus dysgalactiae gave a net profit of a little more than € 11,- per treated cow. However, since the decision to treat a cow with subclinical mastitis is taken in a situation with much variation and uncertainty, stochastic modelling will be needed to perform more accurate calculations of the range and probabilities of potential economic outcomes. The goal of this research therefore to develop a stochastic simulation model to support decisions around treatment of chronic subclinical mastitis with S. uberis. The simulation model
The developed model was a stochastic Monte Carlo model. This model simulates the dynamics of an infection for a cow known to have subclinical mastitis (defined as an increased cow somatic cell count for two consecutive test day milkings) caused by S. uberis. In the model cow factors such as lactation stage, day of treatment (the day that a chronic subclinical mastitis case is recognized as such), length of mastitis, milk production level and somatic cell count are modelled stochastically. For treatment, a 3-day treatment has been assumed. The dynamics of the S. uberis infection are modelled using stochastic variables such as the probability of spontaneous cure, probability of the cow becoming clinically diseased, transmission of infection to other cows, cure rate under treatment and physiological effects of the infection. The consequences of no cure after antibiotic treatment are assumed to be the same (also in probabilities) as no treatment at all. When not treated or not cured after treatment, a cow may cure spontaneously, may get a so-called clinical flare-up or may maintain being subclinical. When a cow is not cured, she remains infectious and thus may infect other cows. The number of cows infected by a non-cured cow depends on the transmission rate (R) of that specific strain of S. uberis and the remaining length of the infection. Also, a cow that is not cured may be culled. A newly infected cow may cure spontaneously, become clinical or become a chronic subclinical mastitis case. Certain effects are dependent on specific cow situations. For instance, the probability of a cow becoming clinical is larger when the subclinical mastitis case is early in lactation than if the cow is in late lactation. The basic values of input variables have been based on scientific literature. If no data were available, the values have been based on the expertise of the authors.
Each iteration during the simulation process gives a specific cow situation following the diagnosis of chronic subclinical mastitis caused by S uberis. Based upon this specific outcome, the economic consequences of this specific case of chronic subclinical mastitis are calculated. Economic consequences include costs of treatment of subclinical mastitis (including discarding of milk), costs of decreased milk production, costs of clinical mastitis and costs of culling. Some of these costs might also differ on specific cow factors such as stage of lactation.
8
Foulum, 9-10 November 2006: Economic decisions in Farm Animal Health
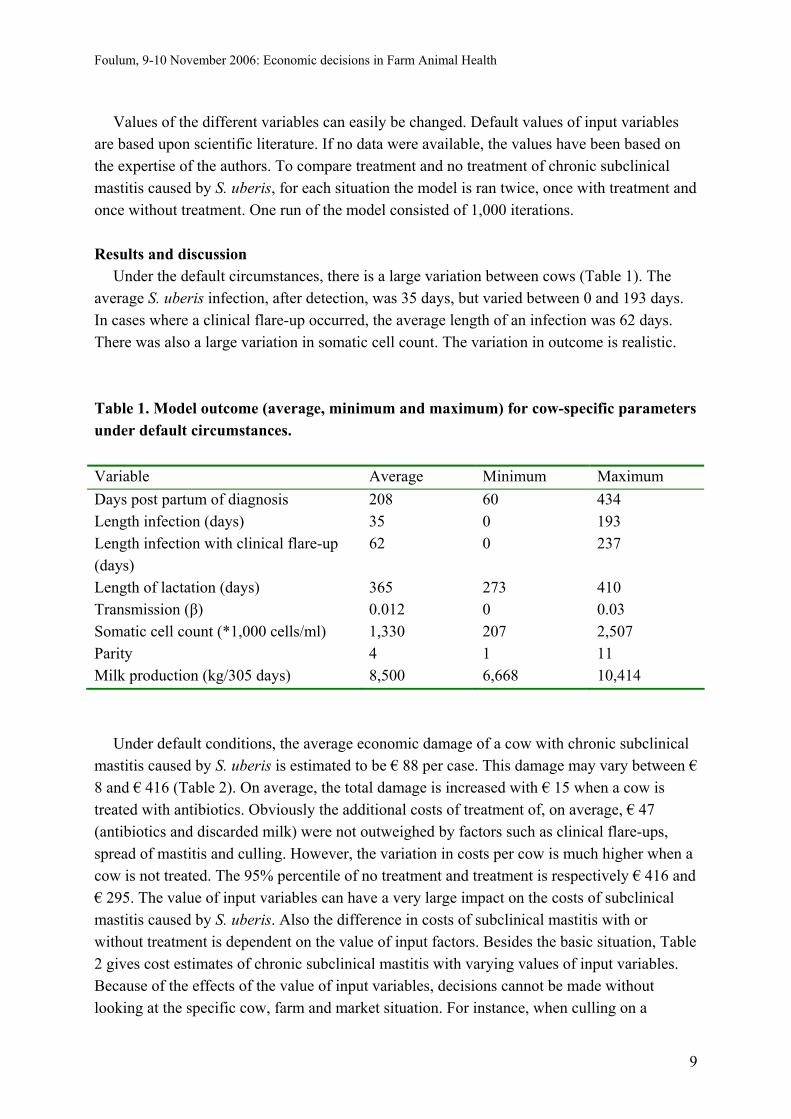
Values of the different variables can easily be changed. Default values of input variables are based upon scientific literature. If no data were available, the values have been based on the expertise of the authors. To compare treatment and no treatment of chronic subclinical mastitis caused by S. uberis, for each situation the model is ran twice, once with treatment and once without treatment. One run of the model consisted of 1,000 iterations. Results and discussion
Under the default circumstances, there is a large variation between cows (Table 1). The average S. uberis infection, after detection, was 35 days, but varied between 0 and 193 days. In cases where a clinical flare-up occurred, the average length of an infection was 62 days. There was also a large variation in somatic cell count. The variation in outcome is realistic. Table 1. Model outcome (average, minimum and maximum) for cow-specific parameters under default circumstances. Variable Average Minimum Maximum Days post partum of diagnosis 208 60 434 Length infection (days) 35 0 193 Length infection with clinical flare-up (days)
62 0 237
Length of lactation (days) 365 273 410 Transmission (β) 0.012 0 0.03 Somatic cell count (*1,000 cells/ml) 1,330 207 2,507 Parity 4 1 11 Milk production (kg/305 days) 8,500 6,668 10,414
Under default conditions, the average economic damage of a cow with chronic subclinical mastitis caused by S. uberis is estimated to be € 88 per case. This damage may vary between € 8 and € 416 (Table 2). On average, the total damage is increased with € 15 when a cow is treated with antibiotics. Obviously the additional costs of treatment of, on average, € 47 (antibiotics and discarded milk) were not outweighed by factors such as clinical flare-ups, spread of mastitis and culling. However, the variation in costs per cow is much higher when a cow is not treated. The 95% percentile of no treatment and treatment is respectively € 416 and € 295. The value of input variables can have a very large impact on the costs of subclinical mastitis caused by S. uberis. Also the difference in costs of subclinical mastitis with or without treatment is dependent on the value of input factors. Besides the basic situation, Table 2 gives cost estimates of chronic subclinical mastitis with varying values of input variables. Because of the effects of the value of input variables, decisions cannot be made without looking at the specific cow, farm and market situation. For instance, when culling on a
9

Foulum, 9-10 November 2006: Economic decisions in Farm Animal Health
specific farm is relatively expensive because of a shortage of young animals, treatment of a cow is more attractive. Also the cure rate after treatment plays an important role. It is known that the cure after treatment is dependent on specific cow factors such as parity and lactation stage (Deluyker et al., 2005). The effects on economics of treatment of subclinical mastitis have also been demonstrated (Swinkels et al., 2005a). The effect of stage of lactation on costs of subclinical mastitis with or without treatment can also be seen in Table 2. When subclinical mastitis caused by S. uberis occurs later in lactation, the costs decrease. Also the difference in costs caused by treatment is dependent on the stage of lactation. Two aspects are important in that respect. The costs of discarded milk are larger when cows produce more milk and the advantages of prevention of clinical mastitis are larger when it is prevented early in lactation. It has to be noted that the effect of stage of lactation on the probability of cure when treated has not been taken into account in this simulation model. Table 2. Economic consequences (€ per cow, average and 5 and 95% percentiles are given) of treatment or no treatment of a case of chronic subclinical mastitis caused by S. uberis under the basic situation (default) and with varying input variables. Variable whose value is changed Value Basic No treatment Treatment Basic situation - - 88 (8 – 416) 103 (9 – 295) Probability culling of cow remaining subclinical
7% 12% 76 (8 – 310) 99 (7 – 217)
17% 12% 101 (7 – 460) 108 (9 – 344) Day (pp) of diagnosis and treatment 60 Lactation1 149 (46 – 564) 167 (104 – 463) 100 Lactation 136 (39 – 508) 152 (92 – 446) 200 Lactation 88 (21 – 303) 102 (66 – 457) 300 Lactation 52 (7 – 329) 73 (42 – 451) Transmission of pathogens (β) 0 0.01 71 (8 – 369) 85 (5 – 198) 0.033 0.01 118 (0 – 500) 119 (3 – 438) Spontaneous cure 5% 15% 92 (7 – 400) 108 (14 – 509) 25% 15% 87 (7 – 428) 102 (11 – 419) Cure after treatment 25% 50% 88 (8 – 416) 118 (7 – 414) 75% 50% 88 (8 – 416) 93 (8 – 188) 1Distributed over the lactation
The developed simulation model still has a number of discrepancies. The aforementioned
relation between cow factors and cure rate has not been modelled. Moreover, the effects of a lower somatic cell count on the probability of milk payment reduction (prevention of penalties or securing of bonuses) have not been taken into account. Especially in the latter case, economic effects can be large. In this model, we assumed that there was no increase in
10

Foulum, 9-10 November 2006: Economic decisions in Farm Animal Health
milk production after cure of subclinical mastitis. This is subject to debate and research is necessary to clarify in more detail the relation between somatic cell count and milk production. The model is only suitable for S. uberis infections and should be extended towards other pathogens as well. However, the possibility to see the variation of effects enables the farmer to take a decision, knowing about the risks of that decision. Depending on the farmers risk attitude the decision can be in favour of treatment or not. Conclusions
The average economic damage (with basic input parameters for the Dutch circumstances) of an untreated chronic subclinical mastitis case caused by S. uberis is € 88. This economic damage is dependent on specific cow, farm and market factors. With a short (3 day) treatment, the average damage increased with € 15. The additional costs for treatment (antibiotics and discarded milk) did not outweigh the benefits of cure of subclinical mastitis and prevention of clinical mastitis. Sensitivity analysis showed that the costs of subclinical mastitis and the economic effects of treatment depend on a large number of specific cow, farm and market factors. Moreover, the spread of economic damage indicates that the risk of a high damage is much higher when a cow with chronic subclinical mastitis is not treated than when treated. References Deluyker, H.A., Van Oye, S.N., Boucher, J.F., 2005. Factors affecting cure and somatic cell
count after Pirlimycin treatment of subclinical mastitis in lactating cows. Journal of Dairy Science 88(2), 604-614.
St. Rose, S.G., Swinkels, J.M., Kremer, W.D.J., Kruitwagen, C.L.J.J., Zadoks, R.N., 2003. The effect of penethamate hydriodide treatment on bacteriological cure, somatic cell count and milk production of quarters with Streptococcus uberis or Streptococcus dysgalactiae chronic subclinical infection. Journal of Dairy Research 70(4), 387-394.
Swinkels, J.M., Hogeveen, H., Zadoks, R.N., 2005a. A partial budget model to estimate economic benefits of lactational treatment of subclinical Staphylococcus aureus mastitis. Journal of Dairy Science 88(12), 4273-4287.
Swinkels, J.M., Rooijendijk, J., Zadoks, R.N., Hogeveen, H., 2005b. Economic consequences of antibiotic treatment during lactation on chronic subclinical mastitis caused by Streptococcus uberis or Streptococcus dysgalactiae. Journal of Dairy Research, 72(1), 75-85.
Zadoks, R.N., Gillespie, B.E., Barkema, H.W., Sampimon, O.C., Oliver, S.P., Schukken, Y.H., 2003. Clinical, epidemiological and molecular characteristics of Streptococcus uberis infections in dairy herds. Epidemiology and Infection 130(2), 335-349.
11

Foulum, 9-10 November 2006: Economic decisions in Farm Animal Health
12

Foulum, 9-10 November 2006: Economic decisions in Farm Animal Health
Epidemiology and herd health economics as components of veterinary business intelligence E. Kristensen Dept. of Animal Health, Welfare and Nutrition, Danish Institute of Agricultural Sciences, Research Centre Foulum, Denmark The problems of dealing with herd dynamics often lead us to choose a static view, simply because it’s more convenient! Objective
The overall objective of my PhD-project is to estimate the farmers´ potential financial profits associated with a series of relevant herd health management options. In plain language I want to address and answer the farmers’ inevitable question concerning herd health programs: Is it worth the trouble?
The ambition is to develop and apply a conceptual framework within the context of private veterinary practice which we will call ”Veterinary Business Intelligence”. This concept will combine theories from Business Management and Economics, Business Scenario Forecasting, Herd Health Management and Epidemiology and will include epidemiological studies of field data, qualitative studies of socioeconomic nature and simulation studies/scenario forecasting. The intention is that the new knowledge produced on herd health economics will make it possible to develop and implement a new practical model for evaluating herd health economics in practices. Introduction
Animal Health Economics was suggested as an independent discipline by Ellis and Morris about 35 yrs. ago. They implemented the simple but essential economic principle in making veterinary decisions: “Disease control input should be increased to the level where the cost of an additional input equals the return from the additional output”.
In economic terms this corresponds to the “equi-marginal principle”. The necessity of linking economics to epidemiology has been stressed by many
practitioners and researchers. Different models or concepts have been proposed but with little impact in practice. The need for herd health economic analysis is nonetheless more and more obvious. Dijkhuizen et al. (1995) stressed the importance of a close link between economics and epidemiology in future research. However, they also identified a lot of problems, especially related to data-management and collection.
In many aspects the disciplines of epidemiology and economics are the same. Both seek to identify correlations that provide understanding of the cause of events and both consists primarily of a set of theories and tools, as opposed to concrete knowledge. There are only
13
Foulum, 9-10 November 2006: Economic decisions in Farm Animal Health
reported few field trials at herd level in literature with the aim to investigate the economic attractiveness of what are called herd health and management programs. Data that have become available from these trials were often not very detailed with respect to disease incidence and economic performance, making it impossible to do more than simply calculating the financial gains and losses.
Current veterinary services are evolving to meet the need for service targeted tightly to the needs of farmers through planned disease control or eradication programs. The application of these services is rarely an all-or-nothing affair. Usually several measures or programs are available, each of them offering a different degree of certainty and requiring a different level of investment. Determining the optimal input level, therefore, is to a large extent a matter of economic decision making (some may claim that it is all about economy because they value non-economic parameters like welfare and quality of life equal to “real money”). The veterinary services has been undergoing a tremendous change in recent years moving from norm-based recommendations into an analytical approach using both quantitative and qualitative methods This is close to the views on herd health presented by Schwabe et al. (1977): “In a herd health type situation, field research should be virtually indistinguishable from practice”. In reality this principle is integrated in “The Dane Concept” used by an increasing number of Danish bovine practitioners (KoNet-Praksis, 2006).
Epidemiological principles and tools have been widely used to describe the nature and occurrence of health related problems in dairy herds. The necessity of linking economics to epidemiology has been stressed by many bovine practitioners and researchers (e.g. Dijkhuisen et al., 1995). Apparently it has been difficult to develop an analytical model that provides estimates, which are acceptable to or understandable for farmers and consultants, including practicing veterinarians.
An explanation may be that research methods on how to document improved herd health are quite advanced (Enevoldsen et al., 1995). Consequently, there is a need to identify or develop some “Key Performance Indicators” (KPI) that are based on coherent relations between major technical-biological and economic parameters. Dynamics
“The herd shall be seen as an organism like the individual cow. The animals, the housing system, the management, the farmer, and the interactions between these components together form a production system. This system is also dynamic. Changes in the input to the system (e.g. the feed ration or management routine) may cause responses very quickly but changes may also take months or even years to take full effects because of the long calving intervals, climatic effects etc. Such long term changes are very difficult to detect without access to correct (systematic), valid and precise data records that are transformed to appropriate information. If the relations between changes in input and responses are not revealed (e.g. the effect of a new drug for mastitis treatment or a management change are not assessed correctly), the decision maker may use the available (scarce) resources inefficiently. Consequently, the veterinarian working with herd health needs a set of tools to describe this
14
Foulum, 9-10 November 2006: Economic decisions in Farm Animal Health
dynamic system efficiently and to estimate the relations between input and output with sufficiently validity and precision” (Enevoldsen, 20061). Simulation model
“In the most advanced version of monitoring, actual results are compared with results predicted by means of some prognostic (simulation) model. (Enevoldsen et al., 1995; Østergaard et al., 2005). Apparently, very few such prognostic models are used in practice. However, simulation models may have a considerable potential for promoting the use of efficient epidemiological tools because simulation demonstrates the need for estimation of herd specific parameters and provides an efficient tool to combine these estimates into whole herd evaluations” (Enevoldsen, 20062).
If there are complex feedback loops whereby the effect of one decision about the control of a disease flows through to influence some aspect of animal production, which in turn flows back to influence a variable further back in the production system, and there is substantial uncertainty about the precise effects then the problem is becoming sufficiently complex that systems simulation will be the method of choice.
One of the most powerful techniques in using systems simulation is sensitivity analysis, in which the values of relevant parameters are systematically varied over some range of interest to determine their impact on the results. Sensitivity analysis can help set priorities for further (empirical) research. In this way a valuable interaction between systems simulation and field data analysis is possible. These systems approaches in general and the economic models in particular should be flexible in their structure, and suitable to be tailored to individual farms and price conditions.
This suggests that a normative or mechanistic simulation model should be the “diagnostic tool of choice”, rather than analytical or empirical models to gain insight into the dynamics of the herd health-production complex (Østergaard et al., 2000). The use of linear regression itself is too simple a choice to describe such complex biology as the dynamics within a dairy herd and as mentioned by Østergaard (2000) only a simulation model can i.e. prevent double-counting the indirect effects from disease.
Numerous studies have already addressed issues related to animal health economics from a general or “average” perspective (e.g. economic effects at the national level). However, there has been no national research on the subject on the herd-level within the context of commercial veterinary practice. This may be a major reason why the economic principles apparently have not been addressed properly in decision making in veterinary practice. The reason may also be that the dynamic relationship between technical-biological and economic indicators to gross margins basically are unknown and the fact that farmers´ decision making process often includes non-economic parameters (Andersen and Enevoldsen, 2006).
To optimize this type of veterinary input on farms according to the equi-marginal principle mentioned above, much more detailed information is required than is presently available. Field trials alone can not provide this kind of information because it will be very costly and
15

Foulum, 9-10 November 2006: Economic decisions in Farm Animal Health
time-consuming. Systems simulation with a computer model of the population in question is the only appropriate alternative. Approach
This Ph.D. project will: • Only accept input-parameters where the veterinarian has the possibility to change the
input by providing sound advice (e.g. reproduction, dynamics of body condition) • Identify the key technical and biological drivers of economical importance in the dairy
herd by means of simulation • Implement scenario forecasting as an epidemiological and economical tool in
veterinary practice • Estimate the possible value-added (or cost of) “The Dane Concept” to the farmer • Identify barriers to the involvement of the veterinary practitioner in economic decision
making Studies to be conducted
Study #1: We will use a well-documented dynamic, mechanistic and stochastic (Monte Carlo) simulation model (Østergaard et al., 2005) to identify the most important technical and biological drivers (KPI) of economical performance (measured at the Gross Margin, GM) in the dairy herd.
A limited number of KPIs will be identified (currently we work with 8 with either 2- or 3-levels) based on theoretical considerations and evaluations of currently applied indicators. The potential effects of these KPIs on GM will be estimated in a factorial design. By means of a traditional analysis of variance (ANOVA) we will compare GM at high, average and low levels of each KPI. Relevant levels (high, mean and low) of the KPIs will primarily be chosen from a broad spectrum of Danish Holstein dairy herds involved in “The Dane Concept”. The effects of a feasible number of relevant combinations of different KPIs (interactions) will be explored. This study is comparable to a sensitivity analysis of model behaviour.
Study #2: Study #1 outlined above is based on simulated results from herds in a steady
state. However, it is of major interest to describe the dynamics of GM after introduction of changes to the KPIs. A repeated measurement ANOVA (mixed model) will be used to describe the GM profiles after introduction of changes in KPIs, including estimation of time to steady state. We will only include the most important KPIs from study #1 in study #2 (currently we expect around 3 to 5).
This model will allow us to estimate the magnitude of the changes in KPI that is needed to detect statistically significant effects on GM given all other conditions are held constant. In most cases, we probably must add more simulations to the data from study #1 to provide “dose-response” relations between a considerable number of values of each KPI and the associated GM.
16
Foulum, 9-10 November 2006: Economic decisions in Farm Animal Health
Study #3: We have access to comprehensive data concerning production, fertility and health in herds where “The Dane Concept” was introduced in the period 2001 to 2005 (more than 300 herds). In collaboration with another Ph.D.-student (M. Krogh) we will explore these data to identify the magnitude of changes, if any, in the KPIs described in study #2 associated with the introduction of the herd health program. We will primarily use multilevel random regression coefficient models (levels: veterinary practice, herd within practice, and cow within herd). Selected results of these analyses of empirical data will be used as input to further simulation studies. This will allow us to show possible effects on GM of correlations between the KPIs (scenario forecasting).
Study #4: First, we will review manuals and scientific foundations for currently applied
(by production and financial consultants) tools to support economically oriented decision making in Danish dairy herds. Second, we will conduct qualitative interviews of farmers, veterinary practitioners and other advisors in the dairy field to get deep insight into the way these tools are used or if other non-formalized approaches are used. Finally, we will use information from the first two steps to design a quantitative interview (questionnaire) with focus on identifying organizational or educational barriers to the involvement of the veterinary practitioner in economically oriented decision making in the dairy herd.
If possible within the time constraints of the PhD project, we will combine the second step with an action research approach to study the human reactions to the introduction of veterinary advice concerning economically related issues in herds without such services. References Andersen, H.J., Enevoldsen, C., 2006. Towards a Better Understanding of the Farmer´s
Caretaking Routines through a Combination of Qualitative and Quantitative Research and Development Approaches (submitted).
Dijkhuizen, A.A., Huirne, R.B.M., Jalvingh, A.W., 1995. Economic analysis of animal diseases and their control. Prev. Vet. Med. 25: 135-149.
Enevoldsen, C., 20061. Proceeding: World Buiatrics Congress XXIV, Nice, France. “Epidemiological Tools For Herd Diagnosis”, p. 376.
Enevoldsen, C., 20062. Proceeding: World Buiatrics Congress XXIV, Nice, France. “Epidemiological Tools For Herd Diagnosis”, p. 381.
Enevoldsen, C., Sørensen, J.T., Thysen, I., Guard, C., Gröhn,Y.T., 1995. A Diagnostic and Prognostic Tool for Epidemiologic and Economic Analyses of Dairy Herd Health Management. J. Dairy Sci. 78, 947-961.
KoNet-Praksis. 2006. Proceeding: World Buiatrics Congress XXIV, Nice, France. “Epidemiology in Practice”. Not yet published, but available at: http://www.nice-acropolis.com/wbc2006/EN/ProgScient.php).
Schwabe, C.W., Riemann, H.P., Franti, C.E., 1977. Epidemiology in Veterinary Practice. Lea & Febiger, Philadelphia, p. 247.
17

Foulum, 9-10 November 2006: Economic decisions in Farm Animal Health
Østergaard, S., Chagunda, M.G.G., Friggens, N.C., Bennedsgaard, T.W., Klaas, I.C., 2005. A stochastic model simulating pathogen-specific mastitis control in a dairy herd. J. Dairy Sci. 88, 4243-4257.
Østergaard, S., Sørensen, J.T., Kristensen, A.R., 2000. A Stochastic Model Simulating the Feeding-Health-Production Complex in a Dairy Herd. J. Dairy Sci. 83: 721-733.
18
Foulum, 9-10 November 2006: Economic decisions in Farm Animal Health
Detection of abnormal milk and mastitis using sensor measurements of automatic milking machines C. Kamphuis, D. Pietersma and H. Hogeveen Epidemiology and Economics group, Department of Farm Animal Health, Utrecht University, the Netherlands Introduction
Since the introduction of AM systems in 1992, an approximate 4% of the Dutch dairy farmers have implemented such a system. Van der Vorst (2002) showed that the bulk tank SCC (BTSCC) of dairy producers using such a system, reached a level comparable to that of dairy producers milking conventionally at 1.5 years after implementation. This indicates that dairy producers using AM systems are able to manage mastitis successfully.
However, improvements are still possible regarding some udder health and milk quality issues. Firstly, increasing the sensitivity of mastitis detection would improve the timely detection of mastitis cases that require treatment, prevent production losses and prevent the spread of infection. Secondly, reducing the number of false positives on the mastitis attention lists would decrease the work-load of the farmer and improve the farmers’ trust in those lists. In addition, improvement of the sensitivity of abnormal milk detection, given an acceptable specificity level, is required. Currently, abnormal milk is not always separated causing a decrease in bulk tank milk quality. Finally, pathogen detection using sensor measurements has not been implemented yet. A proper prediction of the most likely mastitis causing pathogen might improve treatment plans and will reduce costs of antibiotics.
Mastitis detection models have often been based on measurements with electrical conductivity (EC) sensors, which are relatively easy to implement (Pyorala, 2003). Models included only make use of EC based variables as the only predictive variables (Biggadike et al., 2002; Milner et al., 1996; Nielen et al., 1995b; Norberg et al., 2004), or were a combination of EC with other variables (de Mol, 2001; Lansbergen et al., 1994; Maatje et al., 1992; Nielen et al., 1995). These studies were generally based on data from one or a few (experimental) herds and included only a limited number of mastitis cases. Pre-processing of EC measurements with a quarter milking were mostly limited to calculating maximum values or averages. This may however exclude additional valuable information from the EC patterns (Norberg et al., 2004) Similar considerations apply to other sensor measurements such as milk colour and milk flow. PhD research proposal
The objectives of this PhD research project are to improve the detection of mastitis, abnormal milk, and mastitis causing pathogens. This will be achieved by improving the use of data of existing sensors. Data will be collected for a period of 2 years, from 10 commercially
19
Foulum, 9-10 November 2006: Economic decisions in Farm Animal Health
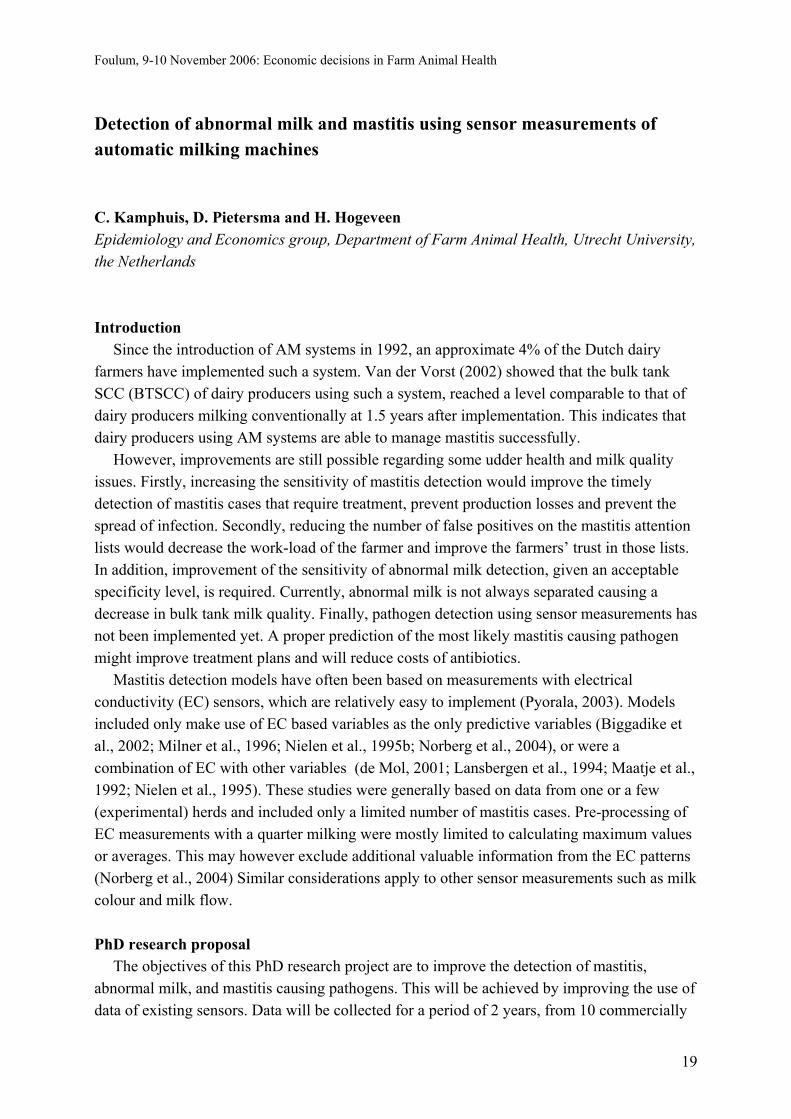
dairy herds with an AM system. The collected data is expected to include more than three million quarter milkings, and approximately one billion sensor measurement records. This huge data set will contain missing values, outlier values, and mislabelled records. Data mining techniques will be used to deal with these constraints as well as to develop classification models. Data mining can be defined as an iterative process to analyze large data sets to discover new patterns that are useful and understandable. The process of data mining is depicted in Figure 1. An important step in data mining is data pre-processing, with the development of potentially predictive variables as one aspect of this pre-processing. These developed variables can be used in a later stage of the data mining process to develop classification models.
Data Preparation Data Exploration
Classification Model Development Model Implementation and Evaluation
Data Acquisition
Figure 1. The process of data mining.
An existing data set was used in order to start with creating potentially predictive variables. The data involved a single farm using automatic milking and covered a 2-week period. This period included 8000 quarter milkings from 65 cows. Sensor data consisted of EC, colour (red, green, and blue), and milk flow. Quarter milkings had been scored for homogeneity using 6 levels (increasing from normal milk to milk with a complete loss of its normal character).
Sensor data patterns of series of quarter milking were visualized in S-PLUS, to explore how changes in the measurement patterns relate to changes in homogeneity score. Variables were created to represent different characteristics of the sensor data patterns, such as the pattern level, variability or shape. References Biggadike, H.J., Ohnstad, I., Laven, R.A., Hillerton, J.E., 2002. Evaluation of measurements
of the conductivity of quarter milk samples for the early diagnosis of mastitis. Vet. Rec. 150, 655-658.
de Mol, R.M., Ouweltjes, W., 2001. Detection model for mastitis in cows milked in an automatic milking system. Prev. Vet. Med. 49, 71-82.
20
Foulum, 9-10 November 2006: Economic decisions in Farm Animal Health
Lansbergen, L.M.T.E., Nielen, M., Lam, T.J.G.M., Pengov, A., Schukken, Y.H., Maatje, K., 1994. Evaluation of A Prototype Online Electrical-Conductivity System for Detection of Subclinical Mastitis. J. Dairy Sci. 77, 1132-1140.
Maatje, K., Huijsmans, P.J.M., Rossing, W., Hogewerf, P.H., 1992. The Efficacy of In-Line Measurement of Quarter Milk Electrical-Conductivity, Milk-Yield and Milk Temperature for the Detection of Clinical and Subclinical Mastitis. Livest. Prod. Sci. 30, 239-249.
Milner, P., Page, K.L., Walton, A.W., Hillerton, J.E., 1996. Detection of clinical mastitis by changes in electrical conductivity of foremilk before visible changes in milk. J. Dairy Sci. 79, 83-86.
Nielen, M., Schukken, Y.H., Brand, A., Haring, S., Ferwerdavanzonneveld, R.T., 1995. Comparison of Analysis Techniques for Online Detection of Clinical Mastitis. J. Dairy Sci. 78, 1050-1061.
Nielen, M., Spigt, M.H., Schukken, Y.H., Deluyker, H.A., Maatje, K., Brand, A., 1995b. Application of A Neural-Network to Analyze Online Milking Parlor Data for the Detection of Clinical Mastitis in Dairy-Cows. Prev. Vet. Med. 22, 15-28.
Norberg, E., Hogeveen, H., Korsgaard, I.R., Friggens, N.C., Sloth, K.H.M.N., Lovendahl, P., 2004. Electrical conductivity of milk: Ability to predict mastitis status. J. Dairy Sci. 87, 1099-1107.
Pyorala, S. 2003. Indicators of inflammation in the diagnosis of mastitis. Vet. Res. 34, 565-578.
Van der Vorst, Y., Knappstein, K., Rasmussen, M. D., 2002. Milk quality on farms with an automatic milking system: effects of automatic milking on the quality of produced milk. Deliverable 8. EU project QLK5 -2000-31006: Implications of the introduction of automatic milking on dairy farms.
21

Foulum, 9-10 November 2006: Economic decisions in Farm Animal Health
22

Foulum, 9-10 November 2006: Economic decisions in Farm Animal Health
Modelling costs of lameness in dairy herds with representation of uncertainty in the state of nature J.F. Ettema1,2 and S. Østergaard1 1 Dept. of Animal Health, Welfare and Nutrition, Danish Institute of Agricultural Sciences, Research Centre Foulum, Denmark 2 The Royal Veterinary and Agricultural University, Copenhagen, Denmark Introduction
Simulation models of livestock production systems are widely used to obtain a better understanding of the consequences of different mechanisms in the system of concern. Besides, they have found their application in evaluating production strategies for on-farm decision support. The specification of input parameters for simulation models is of great importance. The complete set of these parameters, i.e. the state of nature, of a livestock model is never known with certainty. The simulation model used in this study is Simherd (Østergaard et al., 2004). Cow specific probabilities for becoming lame are calculated in this model with a logistic regression model and the occurrence of the lameness event is triggered stochastically. The parameters in the logistic regression model, however, are point estimates and therefore do not represent uncertainty and variation between herds. Describing input parameters with probability distributions is a way to include uncertainty. Parameters are described by these hyper-distributions in e.g. the model Simflock (McAinsh and Kristensen, 2004). Bayesian statistics offer a systemic way of creating and updating probability distributions in a Bayesian network (BN). The prior estimates, based on e.g. literature, represent the best knowledge about a parameter before incorporation of evidence (data) from the local population under study. By using Markov Chain Monte Carlo (MCMC) techniques, the posterior distributions in the BN become conditioned on the data. The objective of this study is to analyze the costs of lameness in specific herds by representing the uncertainty of input parameters and by using herd specific information. Material and methods
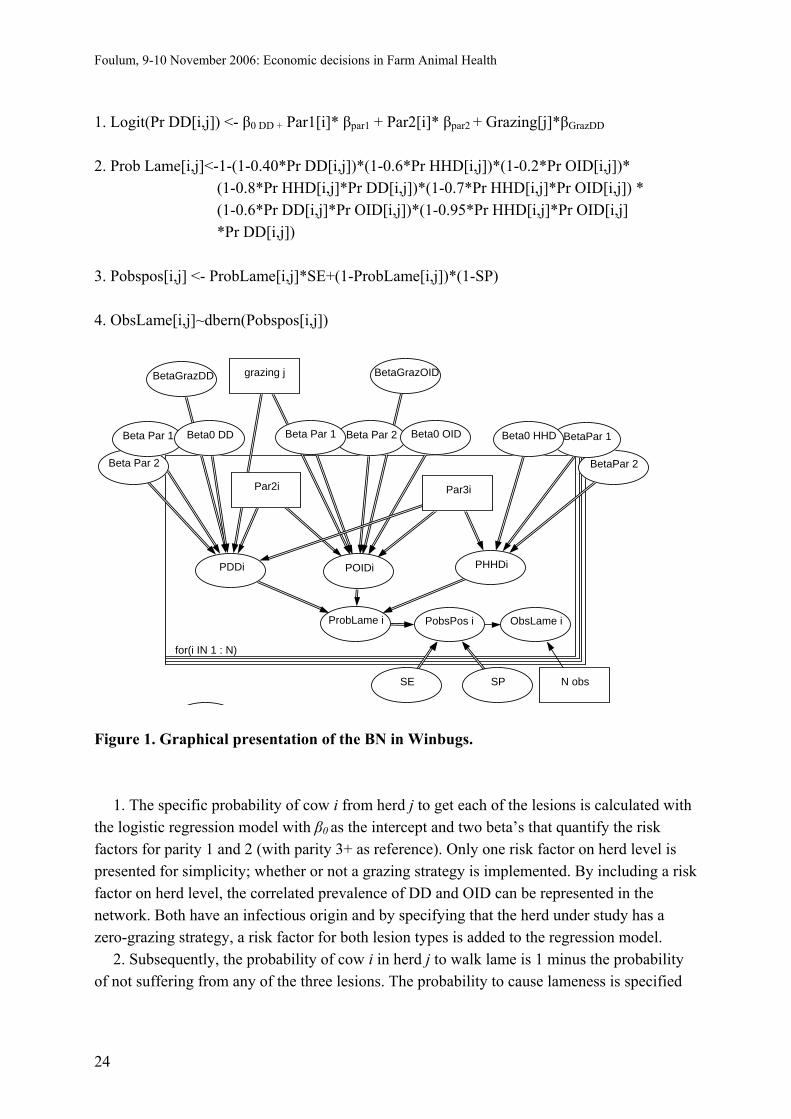
Dairy cattle lameness is a disorder caused by many different hoof and claw lesions. In this study the lesions are aggregated into three categories; Digital Dermatitis (DD), Other Interdigital Diseases (OID) and Hoof Horn Diseases (HHD). The aggregation is based on agreement in risk factors and etiology. A simplified, graphical presentation of the BN modelled in Winbugs (the Bayesian-MCMC software used in this study) is presented in Figure 1.
The Winbugs model of the BN consists of three logistic regression models (showed for DD only), two deterministic formulas and a Bernoulli distribution:
23
Foulum, 9-10 November 2006: Economic decisions in Farm Animal Health
1. Logit(Pr DD[i,j]) <- β0 DD + Par1[i]* βpar1 + Par2[i]* βpar2 + Grazing[j]*βGrazDD 2. Prob Lame[i,j]<-1-(1-0.40*Pr DD[i,j])*(1-0.6*Pr HHD[i,j])*(1-0.2*Pr OID[i,j])* (1-0.8*Pr HHD[i,j]*Pr DD[i,j])*(1-0.7*Pr HHD[i,j]*Pr OID[i,j]) * (1-0.6*Pr DD[i,j]*Pr OID[i,j])*(1-0.95*Pr HHD[i,j]*Pr OID[i,j]
*Pr DD[i,j]) 3. Pobspos[i,j] <- ProbLame[i,j]*SE+(1-ProbLame[i,j])*(1-SP) 4. ObsLame[i,j]~dbern(Pobspos[i,j])
for(i IN 1 : N)
PHHDi
BetaPar 2
BetaGrazDD BetaGrazOIDgrazing j
ProbLame i
Par3iPar2i
SPSE
PobsPos i
N obs
ObsLame i
Beta Par 2
Beta Par 2 BetaPar 1Beta0 HHDBeta Par 1Beta Par 1
POIDi
Beta0 OIDBeta0 DD
PDDi
Figure 1. Graphical presentation of the BN in Winbugs.
1. The specific probability of cow i from herd j to get each of the lesions is calculated with the logistic regression model with β0 as the intercept and two beta’s that quantify the risk factors for parity 1 and 2 (with parity 3+ as reference). Only one risk factor on herd level is presented for simplicity; whether or not a grazing strategy is implemented. By including a risk factor on herd level, the correlated prevalence of DD and OID can be represented in the network. Both have an infectious origin and by specifying that the herd under study has a zero-grazing strategy, a risk factor for both lesion types is added to the regression model.
2. Subsequently, the probability of cow i in herd j to walk lame is 1 minus the probability of not suffering from any of the three lesions. The probability to cause lameness is specified
24
Foulum, 9-10 November 2006: Economic decisions in Farm Animal Health
for all three lesions (0.4, 0.6 and 0.2, for DD, HHD and OID respectively). Besides, the probability to cause lameness is specified for the lesions in case they occur together.
3. The probability of a cow being observed as positive is a function of the probability of the cow being lame and the sensitivity (SE) and specificity (SP) of the observation.
4. The test-outcome, i.e. observed lame (1) or non-lame (0), is Bernoulli distributed with Pobsposij as probability parameter. N obs is the number of cows observed for lameness in a herd.
The prior estimates for β0, βpar1 βpar2 and βgraz (for all three lesions) are derived from a
dataset on periodic claw trimming on 55 Danish dairy herds (Capion et al., 2004). Estimates for SE and SP are derived from a recent Danish study (Thomsen and Baadsgaard, 2006). The estimates in function 2 for the different lesions’ probability to cause lameness are not based on data or literature; fairly extreme figures are used here for illustration purposes. Proper estimates for these values are required. Data on lameness observations in a fictitious herd under study is used to update the Bayesian network.
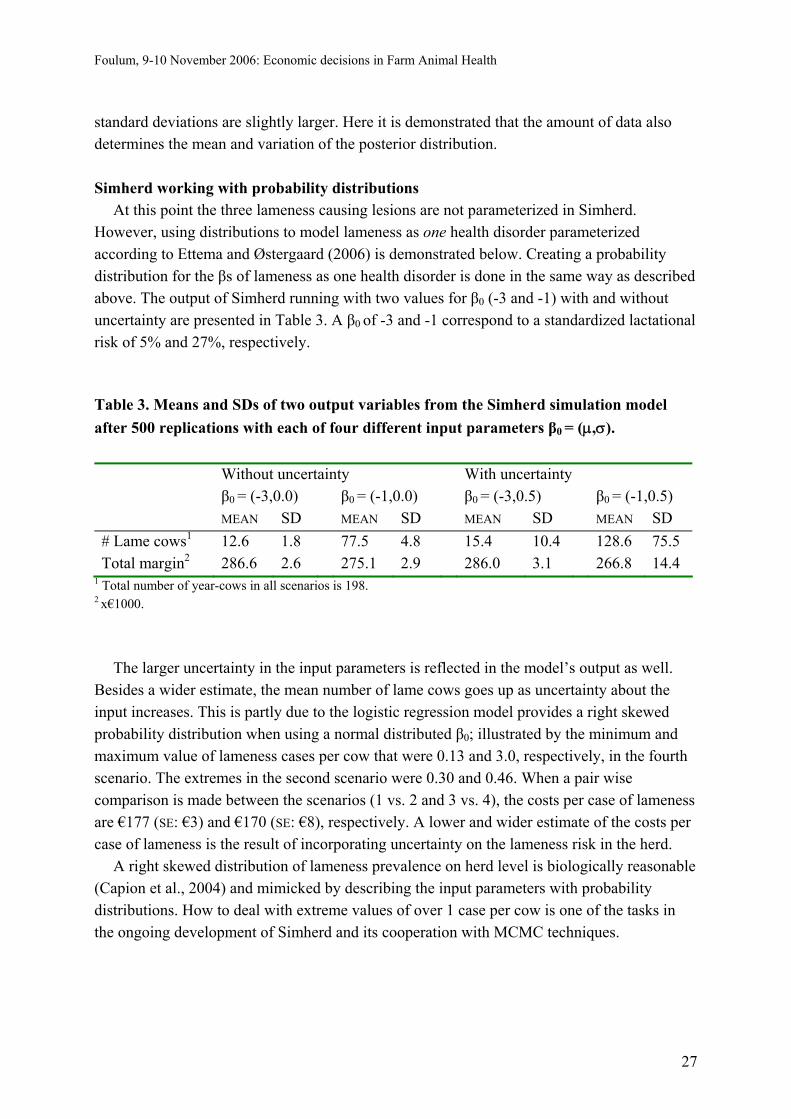
In the future Simherd model, the three lameness causing lesions are incorporated and the MCMC technique of Winbugs is used to draw (e.g. 500) independent samples (thinning factor 20) from the posterior distribution. Simherd uses a different draw as state of nature for each of the 500 replications. To demonstrate the differences of Simherd working with distributions instead of fixed values, a comparison will only be made with respect to modelling lameness as one health disorder. For the setting of all risk factors and effects parameters of lameness we refer to Ettema and Østergaard (2006). Results and discussion
First the behaviour of the network around the three lesions will be presented and then the behaviour of Simherd working with a hyper distribution will be presented. Bayesian network
On the (fictitious) zero-grazing herd under study 300 cows were locomotion scored and 20% of the observed cows were diagnosed as lame. The prevalence among cows of parity 1, 2 and 3+ was 10, 20 and 30%, respectively. Table 1 shows the prior estimates and the posterior estimates in the BN, conditioned on the lameness prevalence observed in the herd under study.
25

Foulum, 9-10 November 2006: Economic decisions in Farm Animal Health
Table 1. Prior and posterior estimates of intercept and parity coefficients in the Bayesian network. DD OID HHD PRIOR SD POST. SD PRIOR SD POST. SD PRIOR SD POST. SD β0 -1.43 0.25 -1.68 0.22 -1.45 0.23 -1.57 0.21 -1.13 0.24 -1.31 0.20 βpar1 0.16 0.15 0.08 0.14 -0.26 0.09 -0.28 0.09 -0.96 0.15 -1.04 0.15 βpar2 0.19 0.10 0.18 0.10 -0.01 0.09 -0.01 0.09 -0.84 0.10 -0.85 0.10
All parameter estimates got adjusted when conditioned on the observations in the herd. The posterior β0’s are all lower than the prior ones because the observed lameness prevalence (20%) was lower than expected on beforehand (~33%). Besides an adjustment of the mean estimates the SDs got smaller too; indicating more certainty about the value of the estimate. In Table 2 only the prior and posterior estimates of the intercepts are shown for alternative inputs to the Bayesian network.
Table 2. Prior and posterior estimates of intercepts in the Bayesian network. DD OID HHD PRIOR SD POST. SD PRIOR SD POST. SD PRIOR SD POST. SD β0 -1.43 0.25 -1.68 0.22 -1.45 0.23 -1.57 0.21 -1.13 0.24 -1.31 0.20 β0 -1.43 0.25 -1.46 0.24 -1.45 0.23 -1.45 0.22 -1.13 0.24 -1.09 0.21 β0 -1.43 0.25 -1.59 0.22 -1.45 0.23 -1.54 0.22 -1.13 0.24 -1.26 0.22
The first row corresponds with Table 1. In the second row the posterior estimates are conditioned on the same data (300 cows, 20% lame) but the herd under study applies a grazing strategy during spring and summer. In the logistic regression models (1) of DD, OID and HHD, Grazing[j] is changed from 0 to 1. This factor on herd level lowers the probability of finding lesions according to the values of βGraz of -0.6, -0.8 and -0.1 for DD, OID and HHD, respectively. However, the same number of cows is observed lame. Despite of the preventive factor on herd level, the prevalence of lameness is the same as in the zero-grazing herd (row 1). The cows in the grazing herd must therefore have a higher base probability to have lesions; illustrated by the higher posterior estimates for the intercept compared to row 1.
The data on which the posterior estimates are conditioned in row 3 also contains evidence of 20% of the cows in a zero-grazing herd being lame. However, the total number of cows observed is 120 instead of 300 (row 1). Consequently, the posterior estimates are not as low as was the case in row 1 (corresponding to a higher probability compared to row 1) and the
26
Foulum, 9-10 November 2006: Economic decisions in Farm Animal Health
standard deviations are slightly larger. Here it is demonstrated that the amount of data also determines the mean and variation of the posterior distribution. Simherd working with probability distributions
At this point the three lameness causing lesions are not parameterized in Simherd. However, using distributions to model lameness as one health disorder parameterized according to Ettema and Østergaard (2006) is demonstrated below. Creating a probability distribution for the βs of lameness as one health disorder is done in the same way as described above. The output of Simherd running with two values for β0 (-3 and -1) with and without uncertainty are presented in Table 3. A β0 of -3 and -1 correspond to a standardized lactational risk of 5% and 27%, respectively. Table 3. Means and SDs of two output variables from the Simherd simulation model after 500 replications with each of four different input parameters β0 = (μ,σ). Without uncertainty With uncertainty β0 = (-3,0.0) β0 = (-1,0.0) β0 = (-3,0.5) β0 = (-1,0.5) MEAN SD MEAN SD MEAN SD MEAN SD # Lame cows1 12.6 1.8 77.5 4.8 15.4 10.4 128.6 75.5 Total margin2 286.6 2.6 275.1 2.9 286.0 3.1 266.8 14.4
1 Total number of year-cows in all scenarios is 198. 2 x€1000.
The larger uncertainty in the input parameters is reflected in the model’s output as well. Besides a wider estimate, the mean number of lame cows goes up as uncertainty about the input increases. This is partly due to the logistic regression model provides a right skewed probability distribution when using a normal distributed β0; illustrated by the minimum and maximum value of lameness cases per cow that were 0.13 and 3.0, respectively, in the fourth scenario. The extremes in the second scenario were 0.30 and 0.46. When a pair wise comparison is made between the scenarios (1 vs. 2 and 3 vs. 4), the costs per case of lameness are €177 (SE: €3) and €170 (SE: €8), respectively. A lower and wider estimate of the costs per case of lameness is the result of incorporating uncertainty on the lameness risk in the herd.
A right skewed distribution of lameness prevalence on herd level is biologically reasonable (Capion et al., 2004) and mimicked by describing the input parameters with probability distributions. How to deal with extreme values of over 1 case per cow is one of the tasks in the ongoing development of Simherd and its cooperation with MCMC techniques.
27

Foulum, 9-10 November 2006: Economic decisions in Farm Animal Health
References Capion, N., Enevoldsen, C., 2004. A cross-sectional study of claw lesions and risk factors in
Danish Holstein. I: Proceeding for the 13th International Symposium on Ruminant Lameness in Maribor, Slovenia. P 24-25.
Ettema, J.F., Østergaard, S., 2006. Economic decision making on prevention and control of clinical lameness in Danish dairy herds. Livest. Sci. 102, 92-106.
McAinsh, C.V., Kristensen, A.R., 2004. Dynamic modelling of a traditional African chicken production system. Trop. Anim. Health Prod. 36, 609-626.
Thomsen, P.T., Baadsgaard, N.P., 2006. Validation of a protocol for clinical examination of dairy cows. Prev. Vet. Med. 75, 133-139.
Østergaard, S., Sørensen, J.T., Enevoldsen, C., 2004. SimHerd III: User’s Manual. PC-programmes for simulation and analysis of production and health in the dairy herd. DJF Internal Report No. 209, 95 pp.
28
Foulum, 9-10 November 2006: Economic decisions in Farm Animal Health
The costs of mastitis and valuation of different cost factors by farmers
K. Huijps and H. Hogeveen Epidemiology and Economics group, Department of Farm Animal Health, Utrecht University, the Netherlands Introduction
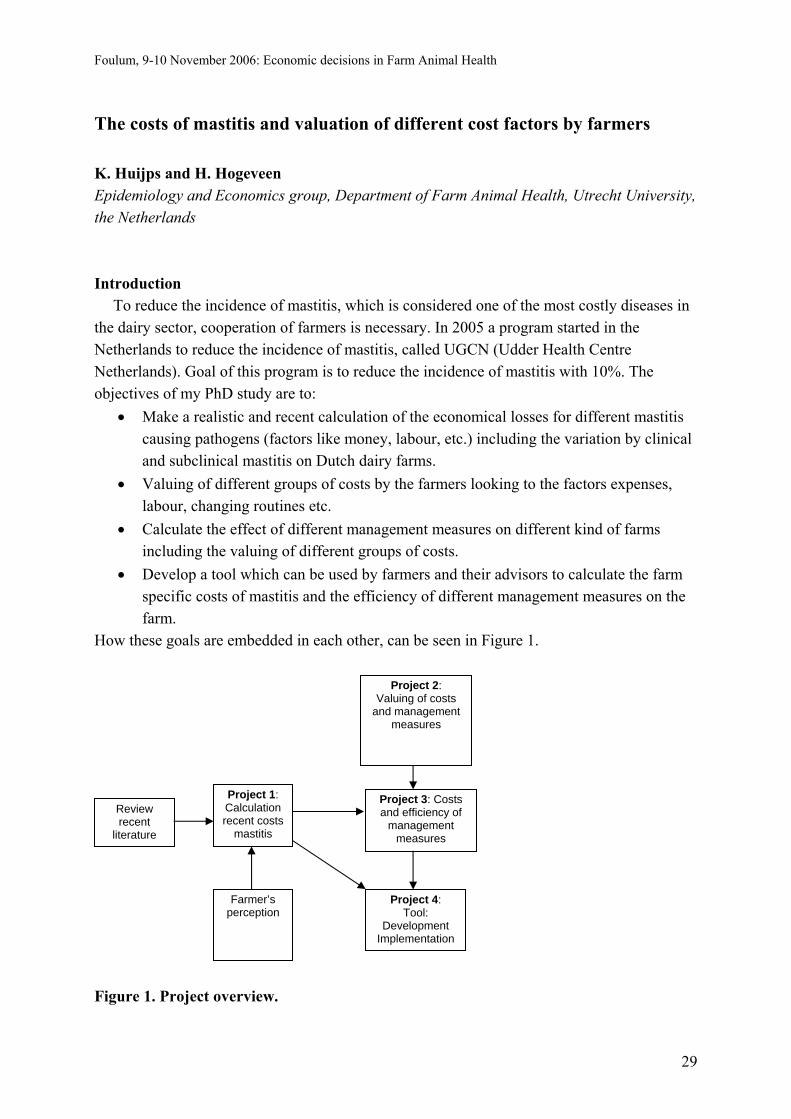
To reduce the incidence of mastitis, which is considered one of the most costly diseases in the dairy sector, cooperation of farmers is necessary. In 2005 a program started in the Netherlands to reduce the incidence of mastitis, called UGCN (Udder Health Centre Netherlands). Goal of this program is to reduce the incidence of mastitis with 10%. The objectives of my PhD study are to:
• Make a realistic and recent calculation of the economical losses for different mastitis causing pathogens (factors like money, labour, etc.) including the variation by clinical and subclinical mastitis on Dutch dairy farms.
• Valuing of different groups of costs by the farmers looking to the factors expenses, labour, changing routines etc.
• Calculate the effect of different management measures on different kind of farms including the valuing of different groups of costs.
• Develop a tool which can be used by farmers and their advisors to calculate the farm specific costs of mastitis and the efficiency of different management measures on the farm.
How these goals are embedded in each other, can be seen in Figure 1.
Review recent
literature
Project 1: Calculation recent costs
mastitis
Farmer’s perception
Project 3: Costs and efficiency of
management measures
Project 2: Valuing of costs
and management measures
Project 4: Tool:
Development Implementation
Figure 1. Project overview.
29
Foulum, 9-10 November 2006: Economic decisions in Farm Animal Health
For this meeting we will focus on the calculation of the economical losses (Project 1) and the valuing of different groups of costs (Project 2). Costs of mastitis and the perception of farmers
The economic damage of mastitis consists of a couple of categories: milk production losses, discarded milk, milk quality, and drugs, veterinarian, labour, and culling costs, and the occurrence of other diseases (Hogeveen and Østeras, 2005; Hortet and Seegers, 1998). Only a few recent papers are describing and calculating all costs of mastitis involved.
In 1990, Schepers and Dijkhuizen, analyzed calculations of the losses from mastitis and the profitability of mastitis control programs. They found 4 papers (since 1970) setting out the total economic impact of mastitis, but with great variance between the total losses calculated. They didn’t take into account the differences between pathogens and different farm styles. The variation between the different calculations is large and most studies did not include all factors affecting economic losses due to mastitis. Next to this, the calculations are to general and thus not useful to make farm specific calculations (Halasa et al., submitted). Because the large variation it is important to have a farm specific calculation, which will improve the adoption rate of given advices because of the feeling of their own values. The use of farm-specific calculations can help to improve the communication and understanding of farmer, veterinarian, and other advisors.
An update of the costs of mastitis has been carried out and split up per pathogen and per month of lactation. This showed differences in the total costs of mastitis depending on the pathogen involved and the month of lactation. For advising farmers about mastitis it is important to know the costs of mastitis for that farm and the perception of these costs by the farmer. When a farmer has the feeling that they are talking about his costs of mastitis, he is more willing to do something about it, then when talking about averages. After calculating the costs of mastitis, a tool was developed to measure the perception of farmers. Farmers were asked to use this tool and data was saved to be able to compare it with the “normal” calculation of the costs. The variation between farmers was very large for all cost factors. In most cases the expected costs by farmers was lower then the calculated costs. An underestimation of the costs can be a reason for not adapting advice in the field. Valuing different cost factors
Economic analysis requires propositions about human behaviour. Traditional utility theory assumes that people make individual decisions in the context of the big picture. But psychologists have found that they generally compartmentalize, often on superficial grounds. They then make choices about things in one particular mental compartment without taking account of the implications for things in other compartments. There is a lot of evidence that people are persistently and irrationally overconfident. They are also vulnerable to hindsight bias: once something happens they overestimate the extent to which they could have predicted it. Many of these traits are captured in Prospect theory, which is at the heart of much of behavioural economics.
30

Foulum, 9-10 November 2006: Economic decisions in Farm Animal Health
Behaviour of the farmer is often not consequent with the (economical) advice. The way the advice is given can play a role in this matter. The valuing of money is not in every situation the same. When a farmer has a problem he wants to get rid off, most of the times he want to spend more money then when he can prevent the problem (stable vs. unstable situation). For example, culling decisions have an important influence on the economic performance of the dairy but are often made in a non-programmed fashion and based partly on the intuition of the decision maker (Lebenhauer et al., 1998).
Workshops with farmers will be organized. During these workshops we will apply adaptive conjoint analysis to get insight in the valuing of different kind of costs/investments by farmers. Different kind of investments can have different values. We are going to look at the money investment (long term and short term), labour, and (changing) routine at different places and activities on the farm (milking parlour, stable, treatment). The different attributes will be placed against each other and the farmer can give his preference. For placing the attributes together we will use normative values to calculate them in a way, that from an economical point of view, they have the same value. By doing so, we hope to make clear the valuation of the different investments by farmers. References Hogeveen, H., Østeras, O, 2005. Mastitis management in an economic framework. 4th IDF
International Mastitis Conference: Mastitis in dairy production, Current knowledge and future solutions. Maastricht. The Netherlands
Hortet, P., Seegers, H., 1998. Calculated milk production losses associated with elevated somatic cell counts in dairy cows: review and critical discussion. Vet. Res. 29(6), 497-510.
Lehenbauer T.W., Oltjen J.W., 1998. Dairy cow culling strategies: making economical culling decisions. J. Dairy Sci. 81, 264-271.
Schepers, J.A., Dijkhuizen, A.A., 1991. The economics of mastitis and mastitis control in dairy cattle. A critical analysis of estimates published since 1970. Prev. Vet. Med. 10, 213-224
Halasa, T., Huijps, K., Hogeveen, H., Østeras, O., Submitted. Mastitis management in an economic framework: A review paper.
31

Foulum, 9-10 November 2006: Economic decisions in Farm Animal Health
32
Foulum, 9-10 November 2006: Economic decisions in Farm Animal Health
Decision support for managing leg disorders in finisher herds
T.B. Jensen Department of Large Animal Sciences, The Royal Veterinary and Agricultural University, Copenhagen, Denmark Introduction
Leg disorders in finishers result in economic losses. The losses are caused by increased workload, due to the physical handling of pigs, medical treatment costs and reduced productivity, e.g., culling, reduced growth and adverse feed conversion in pigs. Furthermore, leg disorders are an important measure when evaluating the animal welfare on farms (Wray et al., 2003). Today, there is an increasing demand from society on animal products with assurance of “good animal welfare”.
Leg disorders in finishers are here defined as any changes in the locomotor system characterised as 1) injuries to the limb or claw or, 2) deviation in the normal gait and posture.
Leg disorders in finishers can be divided into three major categories: Infectious, Nutritional and Environmental. Infectious leg disorders represent arthritis caused by bacterial infections. Previous studies have shown that Mycoplasma hyosynoviae, Erysipelotrix rhusiopatiae and Streptococcus spp are most frequently isolated in affected pigs (Friis et al., 1992; Hariharan et al., 1992; Buttenschon et al., 1995; Smith and Morgan, 1997; Nielsen et al., 2001). Nutritional leg disorders represent leg weakness due to osteochondrosis. This disorder is a non-infectious degenerative condition of the cartilage and the bone. Growth rate and feeding strategies are known to be important factors in the development of osteochondrosis in finishers (Grøndalen, 1974; Nakano et al., 1987). Finally, environmental leg disorders represent any injuries of the limb and claw (e.g. fractures, claw lesions and bursitis) caused by the housing system (Gjein and Larssen, 1995; Mouttotou and Green, 1999).
This project will develop a decision support system that can estimate the risk of different categories of leg disorders in finisher herds. The purpose of the decision support system is to identify the most likely cause of leg disorder in a herd. Knowing the cause of leg disorder is necessary for the decision taker to select the optimal control strategy against leg disorders. This is the first step in developing a model that can estimate the economic consequences of leg disorders in finisher herds. In order to gain additional knowledge about the effect of leg disorders on productivity, epidemiological analyses are performed based on data from a Danish boar test station.
Decision support system for leg disorders
The decision support system for leg disorders is constructed using Bayesian Networks. The model is a static and probabilistic model for a single herd and all interdependences are described using conditional probability distributions. The parameters in the model are based
33
Foulum, 9-10 November 2006: Economic decisions in Farm Animal Health
on published literature and expert opinions. A decision support system using Bayesian Network has previously been developed for Mycoplasma hyopneumonia (Otto and Kristensen, 2004).
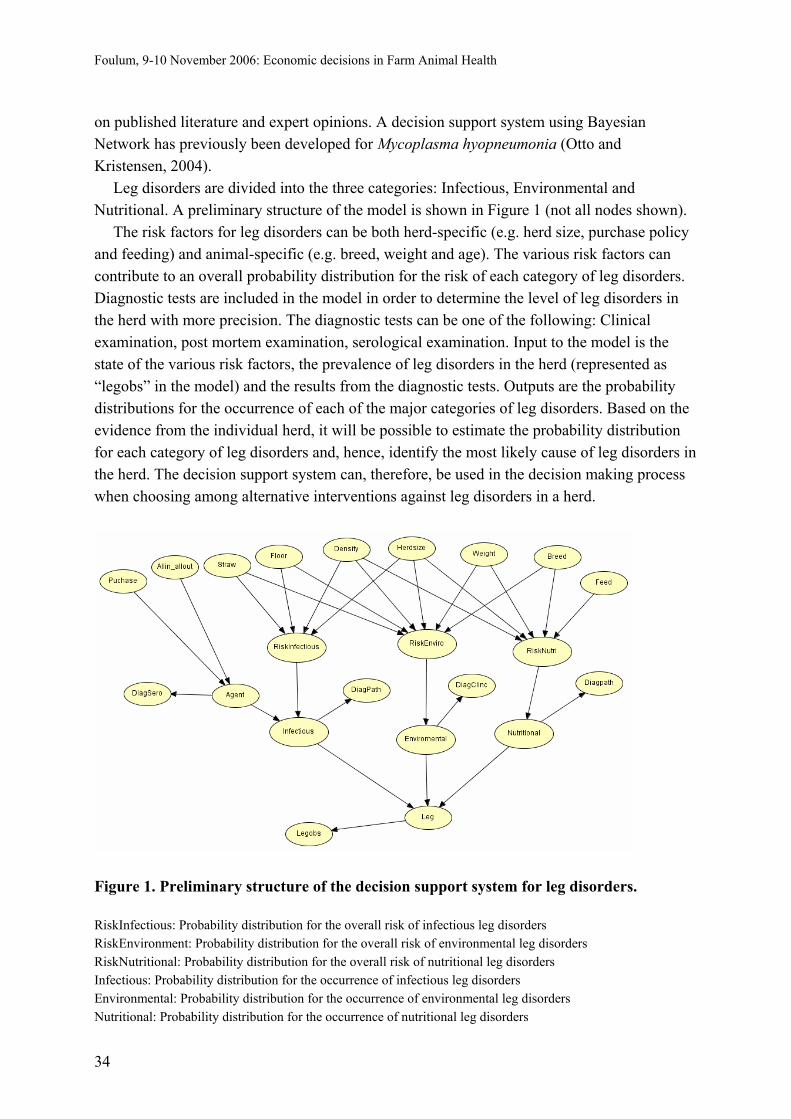
Leg disorders are divided into the three categories: Infectious, Environmental and Nutritional. A preliminary structure of the model is shown in Figure 1 (not all nodes shown).
The risk factors for leg disorders can be both herd-specific (e.g. herd size, purchase policy and feeding) and animal-specific (e.g. breed, weight and age). The various risk factors can contribute to an overall probability distribution for the risk of each category of leg disorders. Diagnostic tests are included in the model in order to determine the level of leg disorders in the herd with more precision. The diagnostic tests can be one of the following: Clinical examination, post mortem examination, serological examination. Input to the model is the state of the various risk factors, the prevalence of leg disorders in the herd (represented as “legobs” in the model) and the results from the diagnostic tests. Outputs are the probability distributions for the occurrence of each of the major categories of leg disorders. Based on the evidence from the individual herd, it will be possible to estimate the probability distribution for each category of leg disorders and, hence, identify the most likely cause of leg disorders in the herd. The decision support system can, therefore, be used in the decision making process when choosing among alternative interventions against leg disorders in a herd.
Figure 1. Preliminary structure of the decision support system for leg disorders. RiskInfectious: Probability distribution for the overall risk of infectious leg disorders RiskEnvironment: Probability distribution for the overall risk of environmental leg disorders RiskNutritional: Probability distribution for the overall risk of nutritional leg disorders Infectious: Probability distribution for the occurrence of infectious leg disorders Environmental: Probability distribution for the occurrence of environmental leg disorders Nutritional: Probability distribution for the occurrence of nutritional leg disorders
34
Foulum, 9-10 November 2006: Economic decisions in Farm Animal Health
Agent: Agent causing infectious arthritis (Mycoplasma hyosynoviae, Erysipelotrix rhusiopatiae and Streptococcus spp) DiagClinic: Result from the clinical examination DiagPath: Result from the post mortem examination DiagSero: Result from the serological examination LegObs: Observed prevalence of leg disorders in the herd Leg: True prevalence of leg disorders in the herd
Before the decision support system can be further developed to estimate the production -and economic consequences of leg disorders in finisher herds, it is necessary to know how leg disorders affect productivity. However, in general, there is little information regarding the effect of leg disorders on productivity (e.g. daily weight gain and feed conversion rate). Therefore, the effect of lameness on the mean daily weight gain (MDWG) and feed conversion rate (FCR) in boars at a Danish test station has been examined. The effect of lameness on productivity
The purpose of the epidemiological study is to investigate the effect and importance of lameness on productivity in finishers. Data is collected from a Danish boar test station during February 2002 and December 2004. A total of 10,343 boars are included in the study. The number of lameness treatments of the individual animal is used to adapt a quantitative interpretation of lameness. Hence, the new variable “lameness group” is generated. All diseases other than lameness (e.g. pneumonia, diarrhoea, lethargic, unspecified treatment, abscesses, eczema, tail bite, hernia) are recoded as “non-lameness diseases”. Multivariable hierarchical analyses are performed to assess the association between the risk factors: lameness groups, records of non-lameness diseases (yes/no), breed (Duroc, Hampshire, Landrace, Yorkshire) and weight at four weeks with each of the outcome variables: MDWG and FCR. In order to improve the assumption of normality, a quadratic transformed MDWG and an inverse transformed FCR are used in the analyses. The result shows that lameness group has a significant effect on the transformed MDWG (P < 0.0001). Boars with one to three lameness treatments have a significant reduction in the MDWG, which correspond to a reduction of 47 gram per day. Boars with four and five lameness treatments do not have a significant reduction in the MDWG. More than five lameness treatments cause the largest reduction in the MDWG corresponding to 62 gram per day. There is no significant association between lameness group and the transformed FCR (P = 0.16). Records of non-lameness diseases, breed and weight at four weeks are all significantly associated with the transformed MDWG and -FCR. Boars with records of non-lameness diseases has a reduction in the MDWG of 46 gram per day and an increase in the FCR of 0.04 feed units per kilogram live weight. At the test station, the prevalence of boars with lameness is four percent whereas the prevalence of records of non-lameness diseases is 65 percent. It is concluded that the economic effect of lameness depends on the prevalence of lameness in the herd.
35
Foulum, 9-10 November 2006: Economic decisions in Farm Animal Health
Perspectives The decision support system, described in this paper, will estimate the most likely cause of
leg disorders in a herd. This is the first step in constructing a model that can evaluate the economic consequences of leg disorders in finisher herds. However, more information regarding the effect of leg disorders on productivity is needed. As leg disorders can be used as a measure of animal welfare, the decision support system can help select the optimal control strategy that will reduce the prevalence of leg disorders and hence improve animal welfare in individual herds. References Buttenschon, J., Svensmark, B., Kyrval, J., 1995. Non-purulent arthritis in Danish slaughter
pigs. I. A study of field cases. J. Vet. Med. A 42, 633-641. Friis, N.F., Hansen, K.K., Schirmer, A.L., Aabo, S., 1992. Mycoplasma hyosynoviae in joints
with arthritis in abattoir baconers. Acta Vet. Scand. 33, 205-210. Gjein, H., Larssen, R.B., 1995. The effect of claw lesions and claw infections on lameness in
loose housing of pregnant sows. Acta Vet. Scand. 36, 451-459. Grøndalen, T., 1974. Osteochondrosis, arthrosis and leg weakness in pigs. Nord. Vet. Med.
26, 534-537. Hariharan, H., MacDonald, J., Carnat, B., Bryenton, J., Heaney, S., 1992. An investigation of
bacterial causes of arthritis in slaughter hogs. J. Vet. Diagn. Investig. 4, 28-30. Mouttotou, N., Green, L.E., 1999. Foot and limb lesions in growing pigs. Pig Journal 43, 54-
71 Nakano, T., Brennan, J.J., Aherne, F.X., 1987. Leg weakness and osteochondrosis in swine: A
review. Can. J. Anim. Sci. 67, 883-901. Nielsen, E.O., Nielsen, N.C., Friis, N.F., 2001. Mycoplasma hyosynoviae arthritis in grower-
finisher pigs. J. Vet. Med. A 48, 475-486. Otto, L., Kristensen, C.S., 2004: A biological network describing infection with Mycoplasma
hyopneumonia in swine herds. Prev. Vet. Med. 66, 141-161. Smith, W.J., Morgan, M., 1997. Lameness and arthritis in the growing and finishing pig. Pig
Journal 40, 9-27. Wray, H.R., Main, D.C.J., Green, L.E., Webster, A.J.F., 2003. Animal-based measures for the
assessment of welfare state of dairy cattle, pigs and laying hens: Consensus of expert opinion. Anim. Welfare 12, 205-217.
36
Foulum, 9-10 November 2006: Economic decisions in Farm Animal Health
Yield losses associated with clinical mastitis occurring in different weeks of lactation C. Hagnestam Dept. of Animal Breeding and Genetics, Swedish University of Agricultural Sciences (SLU), Uppsala, Sweden Background
Information about the total cost of a case of clinical mastitis is crucial for evaluating the economic viability of different preventative measures and for supporting decision-making regarding their implementation. Costs due to mastitis arise from treatment, reduced milk production, increased risk of culling and increased risk of subsequent diseases. The main component of the financial loss is reduced production levels in affected cows. Thus, the cost of a case of mastitis will largely depend on the extent of the yield losses.
The magnitude of the yield losses has been shown to vary according to when in lactation the cow develops mastitis. To achieve accurate estimates of the losses, the timing of the disease event must therefore be taken into account. Furthermore, daily yields need to be related to the day of testing with respect to calving as well as to diagnosis. The aim of the presented study was to estimate the production losses associated with mastitis, taking the interaction between day in milk and day relative to diagnosis for test days into consideration. Materials and methods
Weekly production records from 1 192 lactations were analyzed to estimate the milk, fat and protein losses associated with mastitis. Data were collected at the Jälla research farm (Swedish University of Agricultural Sciences) between 1987 and 2004 and consisted of almost 40 000 test-day records. We also had access to detailed information on disease occurrences, calvings, reproductive status and culling. Records from 307 Swedish Red and 199 Swedish Holstein cows of parity 1 to 10 were used in the study. In 2004, the average production of the Swedish Red and Swedish Holstein cows was 8 921 kg and 10 626 kg, respectively.
Cases of mastitis were detected by the milkers by presence of abnormal milk in the first milk streams or by signs of inflammation in one or more quarters. All cases were diagnosed by a veterinarian, however not all cases were treated (depending on the stage in lactation at which the cow developed the disease as well as possible designation for culling). The lactational incidence risk of mastitis was 19.8% in primiparous cows and 28.7% in multiparous cows.
To relate the test-day yields to the time of clinical diagnosis, a mastitis index was created (Table 1). The index was a categorical variable for time intervals before and after the diagnosis, modelling the time of every test milking relative to the day of mastitis. Separate
37
Foulum, 9-10 November 2006: Economic decisions in Farm Animal Health
index categories were created for 4 weeks preceding diagnosis and 10 weeks following diagnosis. All test days occurring earlier than 4 weeks prior to diagnosis were summarized into one category and all test days occurring later than 10 weeks after diagnosis were grouped into another category. Non-mastitic cows constituted a separate index category and were used as a reference for the yield level of healthy cows.
Table 1. Description of the mastitis index. Test day relative to day of diagnosis Mastitis Index Weeks Days 1 < -4 < -28 2 -4 -28 – -22 3 -3 -21 – -15 4 -2 -14 – -8 5 -1 -7 – -1 6* +1 0 – 7 7 +2 8 – 14 8 +3 15 – 21 9 +4 22 – 28 10 +5 29 – 35 11 +6 36 – 42 12 +7 43 – 49 13 +8 50 – 56 14 +9 57 - 63 15 +10 64 – 70 16 > +10 > 70 17 non-mastitic non-mastitic *Index 6 includes the day of clinical diagnosis
Some other clinical diseases, which were expected to influence milk yield and predispose
to mastitis, were included in the analyses to adjust for their effects as confounders. Due to the relatively low frequencies involved they were grouped into four disease complexes: calving disorders, reproductive disorders, metabolic diseases and claw disorders. Disease-complex indices were created for the four disease complexes. Due to limitations of the data, these indices were not as detailed as the mastitis index.
We analyzed the first lactational incidence of mastitis, regardless of etiology (n = 298). The effects on daily production were estimated using a mixed linear model in the SAS procedure proc mixed. The data contained repeated measurements of test-day yields within
38
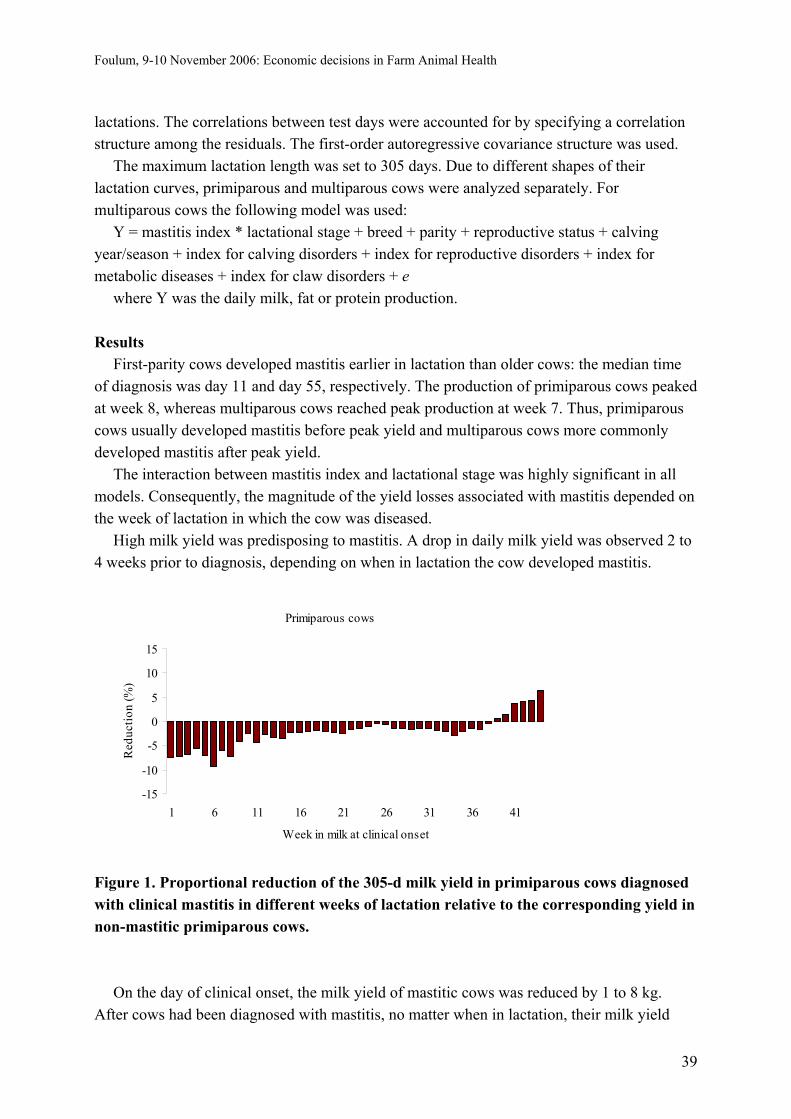
Foulum, 9-10 November 2006: Economic decisions in Farm Animal Health
lactations. The correlations between test days were accounted for by specifying a correlation structure among the residuals. The first-order autoregressive covariance structure was used.
The maximum lactation length was set to 305 days. Due to different shapes of their lactation curves, primiparous and multiparous cows were analyzed separately. For multiparous cows the following model was used:
Y = mastitis index * lactational stage + breed + parity + reproductive status + calving year/season + index for calving disorders + index for reproductive disorders + index for metabolic diseases + index for claw disorders + e
where Y was the daily milk, fat or protein production. Results
First-parity cows developed mastitis earlier in lactation than older cows: the median time of diagnosis was day 11 and day 55, respectively. The production of primiparous cows peaked at week 8, whereas multiparous cows reached peak production at week 7. Thus, primiparous cows usually developed mastitis before peak yield and multiparous cows more commonly developed mastitis after peak yield.
The interaction between mastitis index and lactational stage was highly significant in all models. Consequently, the magnitude of the yield losses associated with mastitis depended on the week of lactation in which the cow was diseased.
High milk yield was predisposing to mastitis. A drop in daily milk yield was observed 2 to 4 weeks prior to diagnosis, depending on when in lactation the cow developed mastitis.
Primiparous cows
-15
-10
-5
0
5
10
15
1 6 11 16 21 26 31 36 41
Week in milk at clinical onset
Red
uctio
n (%
)
Figure 1. Proportional reduction of the 305-d milk yield in primiparous cows diagnosed with clinical mastitis in different weeks of lactation relative to the corresponding yield in non-mastitic primiparous cows.
On the day of clinical onset, the milk yield of mastitic cows was reduced by 1 to 8 kg. After cows had been diagnosed with mastitis, no matter when in lactation, their milk yield
39
Foulum, 9-10 November 2006: Economic decisions in Farm Animal Health
was suppressed throughout the rest of lactation. The magnitude of the yield losses was determined by the week of lactation at clinical onset. The greatest losses occurred when primiparous cows developed mastitis in week 6 (Figure 1), whereas multiparous cows experienced the greatest losses when diseased in week 3 (Figure 2). The 305-d milk, fat and protein production in mastitic primiparous cows were reduced by 0 to 9, 0 to 8 and 0 to 7%, respectively. The corresponding reductions in mastitic multiparous cows were 0 to 11, 0 to 12 and 0 to 11%, respectively.
Multiparous cows
-15
-10
-5
0
5
10
15
1 6 11 16 21 26 31 36 41
WIM at clinical onset
Red
uctio
n (%
)
Figure 2. Proportional reduction of the 305-d milk yield in multiparous cows diagnosed with clinical mastitis in different weeks of lactation relative to the corresponding yield in non-mastitic multiparous cows. Conclusion
The results show that preventative measures should be focused on reducing the frequency of mastitis between calving and peak yield, since this is the period when the majority of cases occur and when yield losses are the most extensive.
40
Foulum, 9-10 November 2006: Economic decisions in Farm Animal Health
A conceptual framework to explore tradeoffs between prevention, monitoring and control of avian influenza N. Longworth and H.W. Saatkamp Business Economics Group, Wageningen University, the Netherlands Introduction
The last two decades have seen an unprecedented number of outbreaks of avian influenza (AI) in domestic poultry. It appears that AI will present a continuing threat to societies in the future. Decision-makers aim to minimize the impact of these outbreaks on society. Three major actions are available to achieve this goal; prevention, monitoring and control. An overall management strategy aimed at minimising the impacts of AI will contain elements of all three of these actions. In selecting an overall strategy two questions can be considered: (1) what is the optimal combination of prevention, monitoring and control and (2) which measures should be chosen to achieve this combination? To date, most analyses of management strategies for contagious animal diseases have focused on the second question. In this paper we present an initial conceptual framework appropriate for considering the first question. This framework explicitly includes the zoonotic aspect of AI. The decision problem
Choosing an appropriate overall strategy for prevention, monitoring and control of AI is a complex problem. A schematic outline of this decision problem for countries within the European Union (EU) is provided in Figure 1. The schema clearly highlights the interrelatedness of prevention, monitoring and control actions and places the epidemiological system within a wider socio-economic perspective.
The key elements of this schema are indicated on the left side: states, events, influencing factors and actions. The domestic, commercial poultry population of a region or country can be in one of three mutually exclusive states at any one time: AI-free, the high risk period (HRP) or the post-HRP. Transitions between states take place following the occurrence of a particular event. The normal situation is AI-free where the virus is not present in the domestic population. Following virus introduction, the population enters the HRP. The HRP is defined as the period following introduction of the virus until detection and notification. During the HRP the virus is present but undetected in the population and virus spread occurs largely unhindered. The length of the HRP is an important determinant for the development of an epidemic. Following detection and notification of the virus the population enters the post-HRP state and control measures are implemented. This period continues until the virus is eradicated and the population re-enters the AI-free state.
41

Foulum, 9-10 November 2006: Economic decisions in Farm Animal Health
Figure 1. Schematic overview of the decision problem for management of avian influenza.
The timing of events and therefore the length of time that a population spends in each state is affected by a number of influencing factors, as shown in Figure 1. These factors differ according to the event and population state. By addressing these factors, actions can influence the timing of events. Three types of actions are considered: prevention, monitoring and control. Prevention is defined as all measures aimed at reducing the likelihood of disease introduction into the domestic population; monitoring includes all measures related to the surveillance of the domestic population and aimed at reducing the HRP, and control includes all measures aimed at controlling disease spread and eradicating the disease as quickly as possible. An overall strategy is a combination of specific measures for each of these three actions.
Within this scheme the key elements depict the epidemiological system. Decision-makers consider the epidemiological system in the context of the socio-economic system. The total annual impact of AI is a combination of the impacts of a disease outbreak and the management measures implemented. Impacts are classified into five categories: epidemiological, economic, social-ethical, human health and environmental. From a decision-making perspective, not all categories of impact will be important and importance will differ across time and space. Importance is determined by two aspects, the size of the impact and the value given to the impact by individual and societal preferences.
42

Foulum, 9-10 November 2006: Economic decisions in Farm Animal Health
Frameworks for decision support in epizootic animal diseases Recent decision support or assessment frameworks for contagious animal disease focus on
epidemiological and economic perspectives, often in the form of an epidemiological model of disease introduction or spread in combination with an economic model assessing the direct costs of prevention, monitoring or control measures, or a more comprehensive welfare analysis including both direct and indirect economic impacts. This approach is particularly well developed for the OIE listed diseases of foot and mouth disease (FMD) and classical swine fever (CSF). An alternative approach consistent with a wider range of objectives and perspectives are frameworks within the multiple criteria decision analysis (MCDA) paradigm; such as the assessment of control strategies for FMD in the Netherlands (Huirne et al, 2002).
Almost all frameworks focus either on prevention, monitoring or control and do not integrate these actions. An exception is the recent work of Elkabidze and McCarl (2006) who use a cost minimisation approach to explore the tradeoffs between pre- and post-outbreak actions.
Brief overview of the welfare-economic framework
Similar to Elkabidze and McCarl (2006) this framework integrates prevention, monitoring and control but uses a welfare maximisation approach in contrast to cost minimisation. A very brief overview of the conceptual framework is presented here.
Consider a situation where society consists of two groups, sij ,,1K= utility-maximising producers and utility-maximising consumers. As a restricted example of the range of utility-influencing impacts in Figure 1, we assume here that only economic and human health effects of AI affect individual utilities. Producers have a utility function,
nk ,,1K=
( )ijijP HU ,π ,
defined over annual profits, , and expected individual health state, ijπ ijH , with positive marginal utility for both attributes. Consumers have a utility function, ( )kkC HMpU ,, ,
defined over the price of an aggregate poultry product, , annual individual income, p kM ,
and expected individual health state, kH ; with positive marginal utility for income and health state and negative marginal utility for prices. There exists a Social Welfare Function which aggregates individual utilities into social welfare, ( ) ( )kkCijijP HMpUnHUsW ,,, ⋅+⋅= π .
There are two states of the world: virus-absent and virus-present. The virus-absent state of the world can be considered the normal situation, when no virus is present in the domestic poultry population. The virus-present state occurs with probability equal to the likelihood of virus introduction. The virus-present state is entered upon introduction of the virus, not upon detection or notification of the virus. In the virus-present state of the world, producers are broken into two groups; producers in the quarantine zone (denoted with superscript i) and producers outside the quarantine zone (denoted with superscript j). The quarantine zone is defined for the purposes of this model as the area within which premises are culled. The decision problem is to choose the levels of prevention, monitoring, and control, which maximise the expected welfare of society. The model can be broken into three layers: functions describing the epidemiological system in relation to the management actions;
43
Foulum, 9-10 November 2006: Economic decisions in Farm Animal Health
functions describing the impact of the epidemiological system on the attributes in the utility functions (economic and human health impacts); and the specifications of the utility and social welfare functions. The epidemiological characteristics and their impact on the attributes in the utility function are briefly described below. Epidemiological system
Three functions describe the epidemiological characteristics of virus introduction and disease spread as a function of the three management variables prevention, , monitoring,
, and control, . In this model we only consider the control measure of culling. An
increase in control can be seen as an increase in the intensity of preventive culling. In reality all three epidemiological functions are stochastic functions represented by probability density functions. For simplification purposes, this model uses the expected value of these distributions. The annual probability of virus introduction, , is a decreasing function of the level of prevention, with . The subsequent development of an outbreak of avian influenza is described by two functions; the length of the epidemic (the expected number of days), , and the size of the epidemic (represented by the expected number of
producers in the quarantine zone i.e. number of culled premises), . Both the length
and size of the epidemic are decreasing functions of the level of monitoring and the level of control.
1x
2x 3x
)( 1xi10 ≤≤ i
),( 32 xxepl
),( 32 xxeps
Attributes in the utility functions
For the purposes of this model prices are exogenous (not determined by the model). It is assumed that the costs of prevention and monitoring are paid by producers and that the costs of controlling an outbreak are shared between producers and consumers, with producers paying a share equal to α. In the virus-present situation, it is assumed that the profit of producers in the quarantine zone is affected by a decrease in annual output (as a function of epidemic length), the annual costs associated with the level of prevention and monitoring, and the shared costs of control (as a function of epidemic length and size and the level of control). The profit of producers outside the quarantine zone is affected by the annual costs of prevention and monitoring and the shared costs arising from control. In the virus-absent state, the profit of producers is only influenced by the annual costs associated with the level of prevention and monitoring.
Individual expected health state is a decreasing function of the expected length and size of an epidemic. Only health effects related to AI are considered in the expected health state; all other health state-influencing factors are exogenous. We assume that the effects of epidemic size and length on health state are higher for producers in the quarantine zone, followed by producers outside the quarantine zone and that these effects are small for consumers. There is no impact of AI on individual health state in the virus-absent situation.
44

Foulum, 9-10 November 2006: Economic decisions in Farm Animal Health
The decision problem The decision problem is presented in equation (1) below. The decision-maker chooses the
levels of and so as to maximise expected welfare. The first order conditions of this
problem provide the optimal levels of each action, where the marginal cost is equal to the marginal benefit for each action. Further analysis of the first order conditions can provide insight into the key factors which influence the tradeoffs between prevention, monitoring and control.
21 , xx 3x
( ) ( ) ( ) ( )( ) ( ) ([ ]
( )( ) ( ) ( )[ ]kkCijijP
kkCiiPjj
xxx
HMpUnHUsxi
HMpUnHUxxepssHUxxepsxiMax
,,,1
,,,,,,
1
32321
,, 321
⋅+⋅−+
⋅+⋅−+⋅⋅
π
ππ ) (1)
Conclusion
Existing frameworks for decision support regarding epizootic diseases tend to focus either on prevention, monitoring or control. In order to achieve a balanced approach to managing epizootic animal diseases, these three actions should be considered in an integrated manner. The conceptual framework developed here uses an expected welfare maximisation approach to achieve this integration. The framework is still in development; subsequent analysis will focus on highlighting factors which influence the tradeoffs between prevention, monitoring and control; particularly in relation to human health aspects. References Elbakidze, L., McCarl, B.A., 2006. Animal disease pre-event preparedness versus post-event
response: when is it economic to protect? J. Agric. Appl. Econ. 38(2), 327-336. Huirne, R.B.M., Mourits, M., Tomassen, F., de Vlieger, J.J., Vogelzang, T.A., 2002. MKZ:
Verleden, Heden en Toekomst; Over de preventie en bestrijding van MKZ. LEI, Den Haag, 183 p.
45

Foulum, 9-10 November 2006: Economic decisions in Farm Animal Health
46
Foulum, 9-10 November 2006: Economic decisions in Farm Animal Health
A method for evaluation of the effects of clinical interventions in dairy herds M.A. Krogh and C. Enevoldsen Department of Large Animal Sciences, The Royal Veterinary and Agricultural University, Copenhagen, Denmark Well-designed, appropriately analyzed, large-scale field studies of the diagnosis of endometritis with both an objective case definition and economically meaningful outcomes are lacking (Gilbert and Schwark, 1992). Background
Due to the constantly decreasing profit margin in dairy production there is an urgent need to document the effect of services offered to the producer. Surprisingly, the effects of clinical interventions in livestock production, including very commonly applied treatment regimes, are rarely assessed with scientifically acceptable method.
A clinical intervention is (in this case) related to taking part of a herd health programme based on clinical examination of a group of risk cows. The clinical examination is preformed by a local veterinarian on weekly basis. The herd health programme is a service offered to the dairy producer by the veterinarian. Effects of the clinical intervention are not only of interest to the dairy producer but also for the veterinarian because the veterinarian needs documented effects in order to make other dairy producers go into the health programme. It is also professionally questionable for the veterinarian to supply a service with questionable effect(s). Clinical interventions
Clinical interventions can be directed to the cow and/or the herd level. A cow-level intervention is an intervention where the primary goal is to make a decision affecting a particular cow. This could be treatment of clinical mastitis (specific disease) or Elisa testing for paratuberculosis. Another example could be antibiotic treatment at dry off based on culture and somatic cell count in the particular cow. Most of the interventions on cow-level are based on events that already have happened and aim at reducing the negative effects of that particular event.
Herd-level interventions are interventions that are focused on all the cows in the herd (or risk groups of cows). The intervention often aims at limiting the prevalence of negative events, i.e. mastitis. Often the potentially negative events have not yet happened. Systematic antibiotic treatment at dry off could be an example, even though this is basically illegal in Denmark. Changes in management procedures are typical herd level interventions.
47
Foulum, 9-10 November 2006: Economic decisions in Farm Animal Health
However, in a typical dairy producer setting this separation of interventions into cow or herd level interventions often are not clear. In the case of the mastic cow a milk sample is often bacteriological cultured. The results from this culture, can be used to assure that the individual cow receives the proper treatment (reduces maltreatment) but also serves as herd level information, telling that all the cows in the herd have a risk of becoming infected with that particular bacteria. Obstacles to measure effects of clinical interventions
Effects of a clinical intervention or herd health programme are rather difficult to investigate in dairy production. This is based on a number of issues related to the production (herd) and the individual production unit (cow).
Often a clinical intervention will affect all the animals within a herd or a well defined group of animals. This leads to the obvious problem, that there are no naturally occurring control groups of animals. Comparing the results with animals in another herd raises issues whether these herds are comparable. Whereas herd size and production facilities are rather easy to account for, differences in management or threshold of detection of disease are virtually impossible to address. A rather simplistic approach of comparing animals before and after intervention also yields serious obstacles. It will not be the same animals that are compared and issues related to time become a serious problem; what time period before and after should be chosen? –And what if there is a general increasing trend over time as there are with milk production? We also have to account for other systematic fluctuations over time. These can be systematic for all herd (seasonal) or random within herd fluctuations. However, one of the most important issues to address is the fact that some of the predictor variables of interest can change because of the intervention (e.g. number of treated cases of mastitis because of change in detection threshold).
Milk production is unique compared with other kinds of production (meat from swine and chickens) where the outcome can be divided into meaningful batches in relation to time. A possible hypothesis could also be that the lack of natural occurring batches in milk production to compare at different times reduces the effect of motivated changes within the herd, because of difficulties to see any effects. Based on results from Israel concerning changes in the recommendation of dry period length in intensively consulted herds it took 4 years to change the 25th quartile of dry period length 5 days (Markusfeld et al., 1999). So this may be the time span to consider when evaluating changes within dairy herds. This study setting
The specific aim of this study is to evaluate the effect of early gynaecological examinations and treatments. Every cow is examined gynaecologically between day 5 post partum to day 21 post partum. The examination is preformed in order to estimate the degree of metritis based on at examination of the vaginal discharge. The results are given on an ordinal scale from 0 (no metritis) to 9 (severe metritis).
48

Foulum, 9-10 November 2006: Economic decisions in Farm Animal Health
By November 2006 more than 500 dairy herds are using the services where a veterinarian makes these examinations on a weekly basis (or with 2 week intervals). From this population of herds, 59 herds were selected based on recordings for more than a 2 year period and that the veterinary practices have more than one herd selected. This criterion was used to increase the likelihood that the veterinarian has some experience in these examinations. 23 veterinary practices met these criteria.
There are differences in the specific observation method and also in the applied treatment protocols between practices. However, in this study the ordinal scale of the metritis score is not used and the specific threshold for treatment is not used. Instead, this study is based on the following hypothesis: We assume that the clinical examination and possibly treatment will reduce some of the negative impacts of metritis. We specifically focus on an important production parameter like milk yield. However it is not possible just to compare the differences in effects of treatments of metritis before and after start of the intervention program because the threshold for detections will inevitably change at that time. The amount of metritis can be estimated based on the expected strong relations between metritis/ endometritis and stillbirth, dystocia, twins, retained placenta, milk fever. It is also widely accepted that all of the factors mentioned above are related to reproductive failure and decreased milk yield. In order to make the hypothesis acceptable the negative effect must act though clinical metritis. We also assume that the recordings of the risk factors for metritis do not change when the examinations begin. This does seem reasonable. The prevalence of the risk factors is, however, likely to change with the beginning of examinations because the dairy producer will take action (hopefully) in order to prevent metritis or determinants of metritis. Analytical Aspects
This initial analysis was restricted to 1st lactation Danish Holstein cow with peak milk yield as outcome. The basic model specification was an unconditional growth model where the peak milk yield can be described as a herd specific straight, line function of time. Both a herd specific intercept and a herd specific slope of the line were included.
The outcome of the model, peak milk yield, is calculated as at simple average between 9 and 91 days post partum. Number of gestations days, quarter of the year and age at first calving were included as simple covariates.
Time at beginning of examination was also specific for the herd (they joined the program in from 2001 to 2004). Time of examination was specified in two separate models:
1. We defined a variable named “Time post examination” that counts calving time post
the beginning of the examination within each herd. All calving times prior to start of examinations have the value of 0. As an example, a calving at February 1, 2005 will have the value of 1 (counting in months) if the examinations started the January 1, 2005. The peak milk yield will then be the additive effects of this variable and the time-variable to describe the unconditional milk yield increase. A significant
49
Foulum, 9-10 November 2006: Economic decisions in Farm Animal Health
interaction between the time post examination and the determinants of metritis would give an indication that something is happening to the cows that receives the examination. Time post examination was included in the model as a random coefficient.
2. We defined a variable named “Examination” that takes the value of 0 at calving times prior to examinations and the value of 1 after examination. The combinations of the time variable (se above) and the examination variable will then give a rather abrupt change in the herd specific peak milk yield. The effect of the examinations should reveal itself as a significant interaction between the examination variable and the determinants of metritis. The examination variable was included as a random coefficient.
In this initial study the risk factors of metritis were aggregated into a variable describing
dystocia. The dystocia variable have three levels ranging from ‘normal calving’ to ‘difficult calving with dead calf’ based on the dairy producers’ registrations of the course of calving and the condition of the calf. Results/perspectives
None of the interactions of interest came out significant in the models (P > 0.5). However, the main effect of examination in model came out highly significant (P < 0.001). On average there was a 0.8 kg increase in milk yield but with huge variance between herds.
Further work is needed with these models to quantify the relations between metritis and the determinant. Also we need to quantify the risk factors of metritis in this study setup. Initial analyses show an ICCC of only 0.1 between cow and herd level. This indicates that the risk factors for metritis should be found as risk factors of the individual cow and not on herd level. Further work is needed on the dystocia-variable, where size and sex of calf should be included. As to the outcome variable, the average milk yield between 9-91 days post partum is a very crude way of describing milk production. This could be replaced with a point estimate of milk yield at day 60 or some persistency indicator. References Gilbert, R.O., Schwark, W.S., 1992. Pharmacological considerations in the management of
peripartum conditions in the cow. Vet. Clin. N. Am.-Food Anim. Pract. 8 (1), 29-56. Markusfeld, O.N., Enevoldsen, C. Kroll, O., 1999. Herd Health – I. Aug (course material).
50
Foulum, 9-10 November 2006: Economic decisions in Farm Animal Health
Discovering real options in the optimal control of foot-and-mouth disease
L. Ge1, R.B.M. Huirne 1, M.C.M. Mourits1, Ó. Gutiérrez2 and A. Kristensen3 1 Business Economics Group Wageningen University, the Netherlands 2 Department of Business Economics, Edifici B-Campus de la UAB,Barcelona, Spain 3 Department of Large Animal Sciences, The Royal Veterinary and Agricultural University, Copenhagen, Denmark Funding
This project is financed by the Netherlands Organization for Scientific Research (NWO) under the Mosaic Scheme. Introduction
As one of the most contagious animal diseases, epidemics of foot-and-mouth disease (FMD) pose recurrent threat to farm animal health and trade in livestock production of exporting countries (Tomassen et al., 2002). The last experience of FMD in the UK and the Netherlands rendered enormous financial loss in the economy as well as emotional uneasiness in the public (Woolhouse and Donaldson, 2001; Bouma et al., 2003).
Due to the common interest of FMD-free status, the EU has stipulated a minimal set of control measures, while leaving the option open for the member states to decide on taking additional control measures like pre-emptive culling or emergency vaccination (European Union, 2003). These additional measures, often of pre-emptive nature, are costly and controversial since their benefits are difficult, if possible, to ascertain. Among the lessons learned from last epidemics, the key issue is improving the quality of decision-making on these measures, particularly pre-outbreak and in the early stage of the epidemic (Anderson, 2002).
Risk and uncertainty are defining features of FMD epidemics (Keeling et al., 2001). The introduction and spread of FMD is a random process subject to biological and social variations. The uncertain situation is further compounded by the intervention of control measures and the responses of consumers, producers and trade partners in foreign countries. As a result, decisions have to be made under uncertainty. As an FMD epidemic develops over time, the management of FMD epidemic covers many periods as well. Consequently, a series of decisions have to be made corresponding to the specific phases of the epidemic. The consequences of control methods or strategies have been extensively modelled, simulated and evaluated (see for example, Berentsen et al., 1992; Jalvingh et al., 1998; Tomassen et al., 2002). However, an optimisation framework to support the dynamic and multi-stage decision making is still missing.
In the mean time, the development of real options theory offers new concepts and insights to the old problem of FMD control. The real options approach finds its root in financial option literature. In derivative markets, an option acquired at some cost gives the right but not the
51
Foulum, 9-10 November 2006: Economic decisions in Farm Animal Health
obligation for the holder to buy or sell an asset (exercise the option) at certain price before certain time (maturity). Holding an option instead of holding the asset prevents the holder from downside risk in future but enables them to capitalise in future favourable situation. In their path-breaking book “investment under uncertainty”, Dixit and Pindyck (1994) illustrate how this option concept could change investment decision rules in real investment projects (instead of stocks, hence the name “real options”). The real options approach addresses the option-like nature of many real investment opportunities which allows for the postponement and revision of decisions. The value of option comes from the flexibility it creates for the investor in choosing the timing and scale of the investment. In strategic planning, this gain from being able to wait or adjust plans according to new situation is called the value of flexibility, as further elucidated by Trigeorgis (1996). Being more flexible and realistic, real options approach has had successful applications in areas like natural resource management, R&D project evaluation (for example, Alvarez and Stenbacka, 2001) and shows great potential in evaluation and optimisation of multi-stage projects with uncertainty.
Given the insights from real options theory on sequential decision-making under uncertainty, the goal of this project is two-fold:
• To provide decision support for FMD control from real options point of view • To explore a new area of application for real options theory, especially the possibility
of generalizing it to the management of similar crisis events. Road to Discovery
To “discover real options” in FMD control, the project relies on qualitative inputs from real options theory and computational support from Markov Decision Processes as well as FMD simulation models. The road map is as following:
• Starting: Theoretical analysis of the decision problem in FMD control • Step 1: Defining and Indicating Value of Flexibility (With simple MDP model) • Step 2: Modelling learning and multi-level decision process in FMD control with a
Multi-level Hierarchic Markov Programming (MLHMP) • Step 3: Fitting to reality: Parameter estimation from data or simulation outputs • Finishing: Real Options Analysis
Results So Far
At the starting point, a systematic decision analysis is carried out on the decision problem of FMD control (Ge et al., 2006). To provide a frame of reference, we have adopted a ProACT framework which, besides addressing conventional elements like objective, alternative, consequences, trade-offs, particularly stresses the importance of uncertainty and linked decisions (Hammond et al., 1999). It is concluded that a flexible decision support is needed in which decision flexibility is taken into account.
In the next step, we try to answer the question whether flexibility, or the option to wait to decide on additional control measures, has value in the control of FMD epidemics. To this end, we have relied on decision models based on Markov Decision Processes to define and
52
Foulum, 9-10 November 2006: Economic decisions in Farm Animal Health
indicate the value of flexibility (Ge et al., 2005). Results show that flexibility can greatly influence the optimal control actions to taken and the control costs. Even though MDPs, combined with dynamic programming as a solution technique, had been successfully applied to optimise decisions for animal health management on farm level (e.g. Mourits, 2000), it is the first time that MDP is applied to animal health management on a national level.
The sequential approach and the stochastic nature of dynamic programming in the form of Markov decision processes make the method well suited for the quantitative support of decision-making in FMD control. Taking into account the fact that at a later stage, it is possible to observe the outcome from previous stages and get more information, expectations about the development of the epidemic might change. As a result, some previous assumptions might have to be modified, which might invalidate the previously simulated results. Specifically, the observation of the outcome from previous intervention will enable a Bayesian updating of the probability distribution about future. To fully describe the decision process and the learning process, the state space of MDP can easily explode and run into the famous curse of dimensionality. To circumvent this notorious dimensionality problem, various degrees of aggregation or decomposition are necessary. In herd management, a successful technique is coined Multi-level hierarchic Markov Decision Processes (MLHMP)(Kristensen and Jørgensen, 2000). In our Step.2, we applied this technique to model the various level of decisions in FMD control and the learning process (Ge et al., 2006).
Figure 1 shows the corresponding structure, in which the founder level of the MLHMP is a cycle of an FMD epidemic.
The outputs of such optimisation models indicate the optimal timing of the control measures as well as their performance with regard to the chosen objective. Again, it is shown that waiting is the optimal action when the level of uncertainty is relatively high and learning effect is significant.
Step.3 is a natural follow-up of previous steps. To estimate the parameters needed for real-life application, both real data and simulation outputs can be used. At this moment, research is going on to exploit the possibility of using Markov Chain Monte Carlo (MCMC).
As a finishing step, we will try to connect the previous findings with the theory of real options and analytically derive insights for the choice of timing for some control actions. The available control actions resemble investment projects that have future rewards in the form of avoided loss in the economy and society. Whether and when to take on these actions depend on the comparison of their option value and their immediate return. The option value of a project (action) depends on its exercise price-(the up front costs associated with the implementation of the measure) and the value of the underlying asset (the value of the loss avoided by the prevention or control measures). By calculating these option values, it can be determined whether the option is in the money or out of the money. If an option is deep in the money, it should be exercised, i.e. the control measures should be taken; if an option is out of the money, the action should be postponed so long as the option is not expired.
53

Foulum, 9-10 November 2006: Economic decisions in Farm Animal Health
Time (Month)
Time (Day) 0
Time (Week) 0
1
1 2
0
76…
Founder States (War time/ Peace time)
States on strategic level
States on tactical
States on operational level
Decision point
Child 1 States
Child 2 States
Child 2 Level Operational level
Child 1 Level (Tactic level)
Founder Level (Strategic level)
Figure 1. An overview of the decision space and state space in the MLHMP model. Conclusion and Discussions
This project challenges traditional evaluation methods of FMD control measures. Three salient innovative aspects of this project are:
• The recognition of decision flexibility and strategic options in FMD control • A novel application of real options approach from corporate investment decisions to
the control of contagious animal disease at national level • An integrated treatment of risk and uncertainty in an optimisation framework
Using MDP as a decision model, the value of flexibility under various circumstances can
be assessed by incorporating the option of waiting to take on more control measures. With a hierarchic structure of MDP, decisions of different time-horizon can be simultaneously optimized and generate a contingency plan on strategic, tactic and operational level. This project confirms the great potential of MLHMP in providing decision support to complex real-life decision problems.
The project develops and applies the theory of real options to a new genre of real-life problem: the control of contagious animal diseases. The results of this project will be of great fundamental value as it will provide a coherent analytical and computational framework for decision-making in the case of contagious animal disease control like FMD or management of similar crisis events.
54

Foulum, 9-10 November 2006: Economic decisions in Farm Animal Health
References Alvarez, L.H.R., Stenbacka, R., 2001. Adoption of uncertain multi-stage technology projects:
a real options approach. J. Math. Econ. 35, 71-97. Anderson, I., 2002. Foot and Mouth Disease 2001: Lessons to be learned inquiry report.
London, The Stationery Office. Dixit, A.K., Pindyck, R.S., 1994. Investment under Uncertainty. Princeton, New Jersey,
Princeton University Press. European Union, 2003. Council Directive 2003/85/EC of 29 september 2003 on Community
measures for the control of foot-and-mouth disease repealing Directive 85/511/EEC and Decisions 89/531/EEC and 91/665/EEC and amending Directive 92/46/EEC. Official Journal of the European Union L306.
Ge, L., Kristensen, A.R., Mourits, M., Huirne, R.B.M., 2006. The "Curse of Animal Disease" and the "Curse of Dimensionality": A New Decision Support Framework for the Control of Foot-and-mouth Disease Epidemics. XXI EURO Conference, Reykjavik
Ge, L., Mourits, M.C.M., Huine, R.B.M., 2006. Towards flexible decision support in the control of animal epidemics. Rev. Sci. Tech. Off. int. Epiz. Revision Submitted.
Ge, L., Mourits, M.C.M., Huirne, R.B.M., 2005. Valuing Flexibility in the Control of Contagious Animal Diseases. The 9th Annual International Conference on Real Options, Paris.
Hammond, J.S., Keeney, R.L., Raiffa, H., 1999. Smart Choices: A Practical Guide to Making Better Life Choices. Boston, Harvard Business School Press.
Keeling, M.J., Woolhouse, M.E.J., Shaw, D.J., Matthews, L., Chase-Topping, M., Haydon, D.T., Cornell, S.J., Kappey, J., Wilesmith, J., Grenfell, B.T., 2001. Dynamics of the 2001 UK Foot and Mouth Epidemic: Stochastic Dispersal in a Heterogeneous Landscape. Science 294, 813-817.
Kristensen, A.R., Jørgensen, E., 2000. Multi-level hierarchic Markov processes as a framework for herd management support. Ann. Operat. Res. 94, 69-89.
Mourits, M., 2000. Economic Modelling to Optimize Dairy Heifer Management. Farm Management. Wageningen, WUR.
Toft, N., 2000. Elements of decision support systems in pig production. Dina KVL. Copenhagen, The Royal Veterinary and Agricultural University Copenhagen: 92.
Tomassen, F.H.M., de Koeijer, A., Mourits, M.C.M., Dekker, A., Bouma, A., Huirne, R.B.M., 2002. A decision-tree to optimise control measures during the early stage of a foot-and-mouth disease epidemic. Prev. Vet. Med. 54, 301-324.
Trigeorgis, L., 1996. Real options: managerial flexibility and strategy in resource allocation. London, The MIT Press.
Woolhouse, M., Donaldson, A., 2001. Managing foot-and-mouth. Nature 410(6), 515-516.
55

Foulum, 9-10 November 2006: Economic decisions in Farm Animal Health
56

Foulum, 9-10 November 2006: Economic decisions in Farm Animal Health
Production effects of subclinical mastitis
T. Halasa, M. Nielen and H. Hogeveen Department of Farm Animal Health, Faculty of Veterinary Medicine, Utrecht University, the Netherlands Introduction
Subclinical mastitis is the inflammation of the mammary gland with invisible milk abnormalities and without clinical symptoms (Swinkels et al., 2005). Subclinical mastitis affects milk quality and quantity causing major economic losses for producers as clinical mastitis does (Hortet et al., 1998; Hogeveen et al., 2003; St. Rose et al., 2003; Swinkels et al., 2005). Subclinical mastitis is usually monitored by the number of quarter; individual and/or bulk milk somatic cell count (SCC), (Hogeveen et al., 2003; St. Rose et al., 2003). One of the main goals of management programs is to reduce the bulk milk SCC (Rosenberg et al., 2002; Halasa et al., 2006, submitted) to prevent the penalties that are enforced on high bulk tank SCC.
The published literature about the production effects of subclinical mastitis is quite abundant (Hortet et al., 1999). Several studies investigated the relationship between SCC (as indicator of subclinical mastitis) and milk production (Hortet et al., 1999). They found a linear decrease of milk production with the increase of SCC. Assuming that this relationship is solely correct, it assumes a full recovery of the production after SCC is back to the normal levels. However, St. Rose el al. (2003) found in a clinical trail, evidence that the milk production does not improve after successful treatment of subclinical mastitis (complete recovery). Proper investigating this phenomenon is very important, because a proof of the findings of St. Rose et al. (2003) using proper study design would mean that all previous subclinical mastitis economic calculations were under-estimated.
Several approaches are proposed in the literature to estimate milk production losses. One way is to compare the performance of an infected quarter with the performance of the uninfected opposite one, or the present lactation with the previous one for the same cow. Alternatively, comparing identical twins could be helpful (De Graaf and Dwinger, 1996). Predictive modelling based on lactation curves (Wood, 1967; Deluyker et al., 1993) proofed to be a precise and efficient method (De Ross et al., 2004). This methodology compares the cow to itself taking into account all possible known external factors. Therefore it decreases the random error considerably compared to the other methodologies (De Ross et al., 2004). The goal of this research is to estimate the carry-over effects of subclinical mastitis on milk yield and milk fat and protein contents post-recovery, for cows within the same lactation.
57
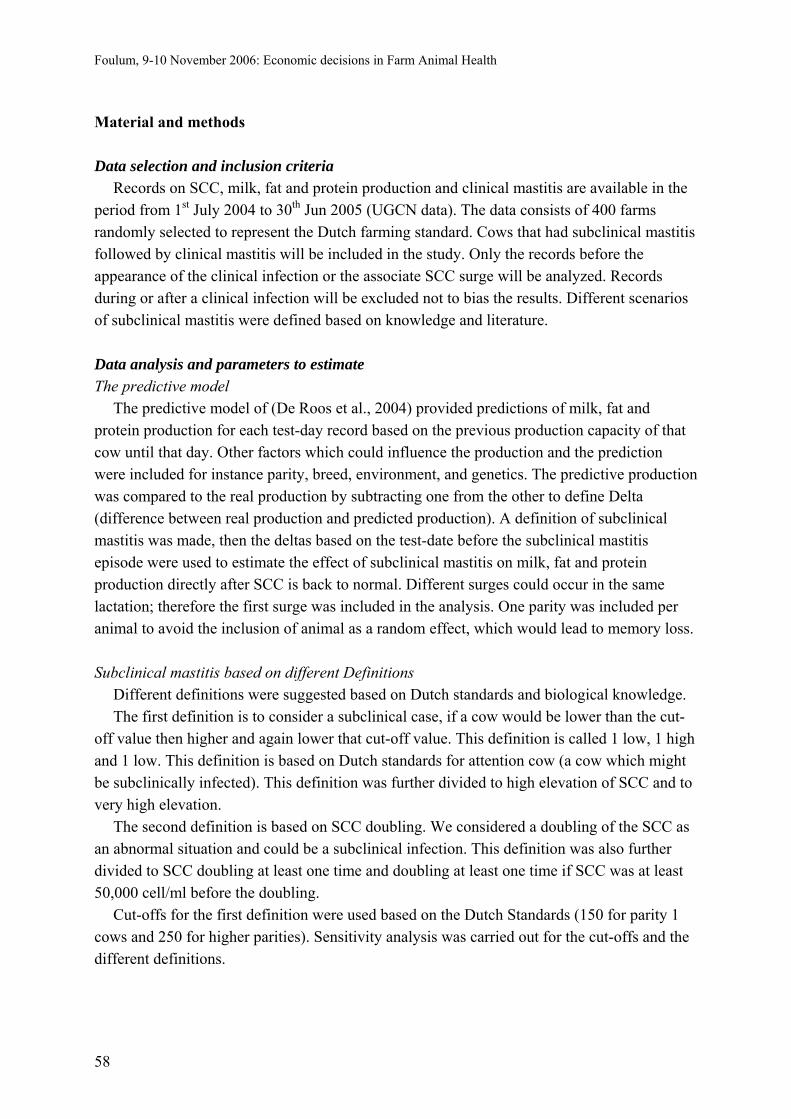
Foulum, 9-10 November 2006: Economic decisions in Farm Animal Health
Material and methods Data selection and inclusion criteria
Records on SCC, milk, fat and protein production and clinical mastitis are available in the period from 1st July 2004 to 30th Jun 2005 (UGCN data). The data consists of 400 farms randomly selected to represent the Dutch farming standard. Cows that had subclinical mastitis followed by clinical mastitis will be included in the study. Only the records before the appearance of the clinical infection or the associate SCC surge will be analyzed. Records during or after a clinical infection will be excluded not to bias the results. Different scenarios of subclinical mastitis were defined based on knowledge and literature. Data analysis and parameters to estimate The predictive model
The predictive model of (De Roos et al., 2004) provided predictions of milk, fat and protein production for each test-day record based on the previous production capacity of that cow until that day. Other factors which could influence the production and the prediction were included for instance parity, breed, environment, and genetics. The predictive production was compared to the real production by subtracting one from the other to define Delta (difference between real production and predicted production). A definition of subclinical mastitis was made, then the deltas based on the test-date before the subclinical mastitis episode were used to estimate the effect of subclinical mastitis on milk, fat and protein production directly after SCC is back to normal. Different surges could occur in the same lactation; therefore the first surge was included in the analysis. One parity was included per animal to avoid the inclusion of animal as a random effect, which would lead to memory loss. Subclinical mastitis based on different Definitions
Different definitions were suggested based on Dutch standards and biological knowledge. The first definition is to consider a subclinical case, if a cow would be lower than the cut-
off value then higher and again lower that cut-off value. This definition is called 1 low, 1 high and 1 low. This definition is based on Dutch standards for attention cow (a cow which might be subclinically infected). This definition was further divided to high elevation of SCC and to very high elevation.
The second definition is based on SCC doubling. We considered a doubling of the SCC as an abnormal situation and could be a subclinical infection. This definition was also further divided to SCC doubling at least one time and doubling at least one time if SCC was at least 50,000 cell/ml before the doubling.
Cut-offs for the first definition were used based on the Dutch Standards (150 for parity 1 cows and 250 for higher parities). Sensitivity analysis was carried out for the cut-offs and the different definitions.
58
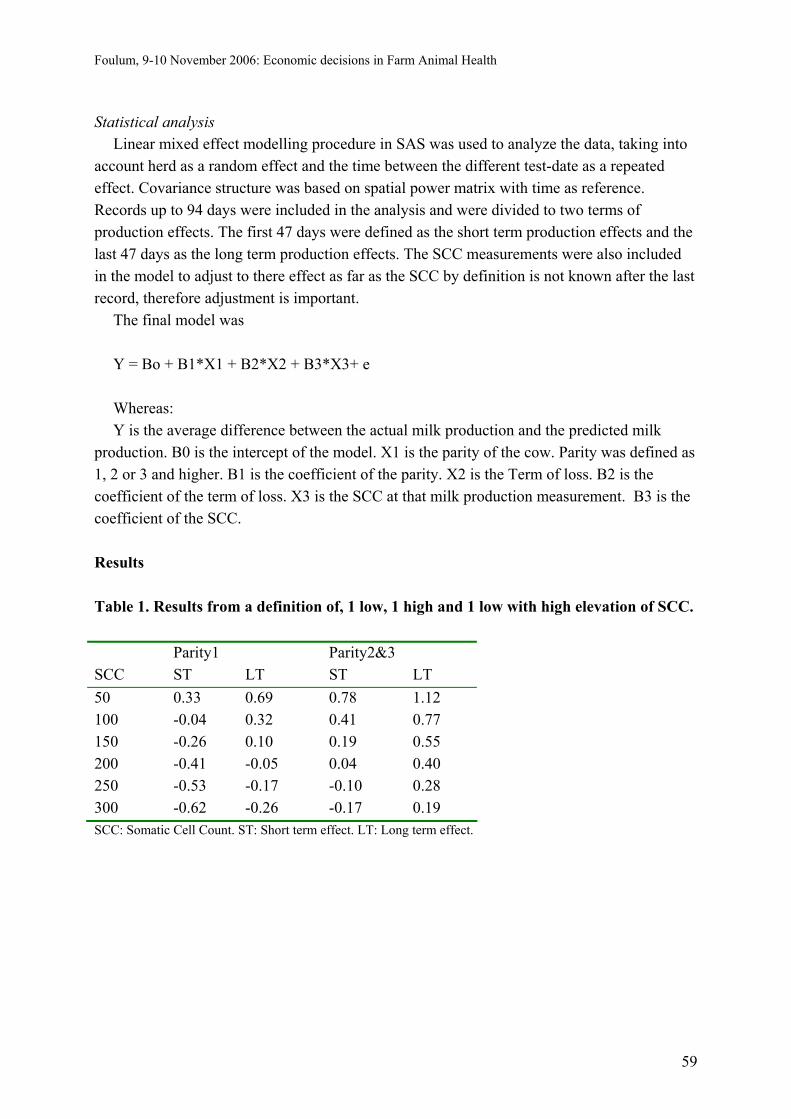
Foulum, 9-10 November 2006: Economic decisions in Farm Animal Health
Statistical analysis Linear mixed effect modelling procedure in SAS was used to analyze the data, taking into
account herd as a random effect and the time between the different test-date as a repeated effect. Covariance structure was based on spatial power matrix with time as reference. Records up to 94 days were included in the analysis and were divided to two terms of production effects. The first 47 days were defined as the short term production effects and the last 47 days as the long term production effects. The SCC measurements were also included in the model to adjust to there effect as far as the SCC by definition is not known after the last record, therefore adjustment is important.
The final model was Y = Bo + B1*X1 + B2*X2 + B3*X3+ e Whereas: Y is the average difference between the actual milk production and the predicted milk
production. B0 is the intercept of the model. X1 is the parity of the cow. Parity was defined as 1, 2 or 3 and higher. B1 is the coefficient of the parity. X2 is the Term of loss. B2 is the coefficient of the term of loss. X3 is the SCC at that milk production measurement. B3 is the coefficient of the SCC. Results Table 1. Results from a definition of, 1 low, 1 high and 1 low with high elevation of SCC. Parity1 Parity2&3 SCC ST LT ST LT 50 100 150 200 250 300
0.33 -0.04 -0.26 -0.41 -0.53 -0.62
0.69 0.32 0.10 -0.05 -0.17 -0.26
0.78 0.41 0.19 0.04 -0.10 -0.17
1.12 0.77 0.55 0.40 0.28 0.19
SCC: Somatic Cell Count. ST: Short term effect. LT: Long term effect.
59
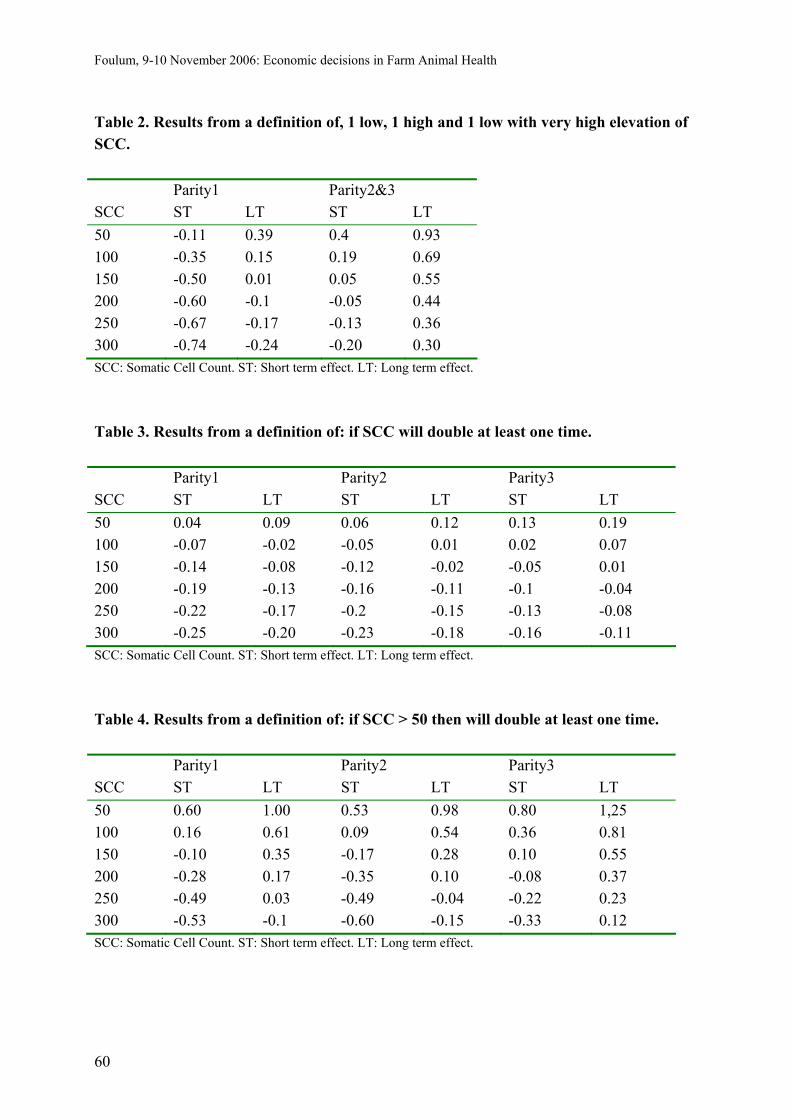
Foulum, 9-10 November 2006: Economic decisions in Farm Animal Health
Table 2. Results from a definition of, 1 low, 1 high and 1 low with very high elevation of SCC. Parity1 Parity2&3 SCC ST LT ST LT 50 100 150 200 250 300
-0.11 -0.35 -0.50 -0.60 -0.67 -0.74
0.39 0.15 0.01 -0.1 -0.17 -0.24
0.4 0.19 0.05 -0.05 -0.13 -0.20
0.93 0.69 0.55 0.44 0.36 0.30
SCC: Somatic Cell Count. ST: Short term effect. LT: Long term effect. Table 3. Results from a definition of: if SCC will double at least one time. Parity1 Parity2 Parity3 SCC ST LT ST LT ST LT 50 100 150 200 250 300
0.04 -0.07 -0.14 -0.19 -0.22 -0.25
0.09 -0.02 -0.08 -0.13 -0.17 -0.20
0.06 -0.05 -0.12 -0.16 -0.2 -0.23
0.12 0.01 -0.02 -0.11 -0.15 -0.18
0.13 0.02 -0.05 -0.1 -0.13 -0.16
0.19 0.07 0.01 -0.04 -0.08 -0.11
SCC: Somatic Cell Count. ST: Short term effect. LT: Long term effect. Table 4. Results from a definition of: if SCC > 50 then will double at least one time. Parity1 Parity2 Parity3 SCC ST LT ST LT ST LT 50 100 150 200 250 300
0.60 0.16 -0.10 -0.28 -0.49 -0.53
1.00 0.61 0.35 0.17 0.03 -0.1
0.53 0.09 -0.17 -0.35 -0.49 -0.60
0.98 0.54 0.28 0.10 -0.04 -0.15
0.80 0.36 0.10 -0.08 -0.22 -0.33
1,25 0.81 0.55 0.37 0.23 0.12
SCC: Somatic Cell Count. ST: Short term effect. LT: Long term effect.
60

Foulum, 9-10 November 2006: Economic decisions in Farm Animal Health
Discussion Results proof that subclinical mastitis has carry over effects after recovery, even if the SCC
is lower than the traditional Dutch standard levels. Losses could reach up to 0.50 Kg/Day based on the definition of subclinical mastitis. Moreover, parity 1 cows are the most to acquire losses and economic damage from subclinical mastitis. Parities ≥ 2 contract losses even if SCC < 250,000 cell/ml. Results show how important is it to decrease SCC to a specific level after recovery from infection, to avoid further losses.
Tables 1 to 4 show a compensatory milk production after recovery. This compensation depends solely on the SCC level and the period after recovery. Most of the compensation is in the long run and if it is possible to decrease SCC < 50,000 cell/ml after recovery from infection.
It could be important to adjust for the effect of the level of the initial SCC in the definition to those after recovery.
This research has led to many interesting questions, for instance what is the level of SCC that should be used to describe a healthy cow, considering its parity? Which quarter(s) is/are responsible about this milk compensation, is it the one which was infected then recovered or the healthy one(s)? However, to answer such questions, daily quarter records should be analyzed to obtain precise estimates. Conclusion
Further than milk production loss during subclinical infection, subclinical mastitis is responsible about a carry over milk production loss up to 0.49 kg/day for 47 days for parity 1 cows. Parity ≥ 2 cows could acquire losses up to 0.2 kg/day for the same period. References Bartlett, P.C., Miler, G.Y., Anderson, C.R., Kirk, J.H., 1990. Milk production and somatic
cell count in Michigan dairy herds. J. Dairy Sci. 73, 2794-2800. Cameron, A.R., Anderson, G.A., 1993. Relationship between milk production and somatic
cell count in dairy cows in east Gippsland. Aust. Vet. J. 70, 13-17. De Graaf, T., Dwinger, R.H., 1996. Estimation of milk production losses due to sub-clinical
mastitis in dairy cattle in Costa Rica. Prev. Vet. Med. 26, 215-222. Deluyker, H.A., Gay, J.M., Weaver, L.D., 1993. Interrelationships between somatic cell
count, mastitis, and milk yield in low somatic cell count herd. J. Dairy Sci. 76, 3445-3452. De Roos, A.P.W., Harbers, A.G.F., De Jong, G., 2004. Random Heard curves in a test-day for
milk fat and protein production of dairy cattle in the Netherlands. J. Dairy Sci. 87, 2693-2701.
Halasa, T., Huijps, K., Østerås, O., Hogeveen, H. Economic effects of mastitis and mastitis management: A review. Vet Q. Submitted.
Hortet, P., Seegers,H., 1998. Loss in milk yield and related composition changes resulting from clinical mastitis in dairy cows. Prev. Vet. Med. 37, 1-20.
61
Foulum, 9-10 November 2006: Economic decisions in Farm Animal Health
Hortet, P., Beaudeau, F., Seegers, H., Fourichon, C., 1999. Reduction in milk yield Associated with somatic cell counts up to 600 000 cell/mL in French Holiein cows without clinical mastitis. Livest. Prod. Sci. 61, 33-42.
Rosenberg, J.B., Love, B., Patterson, L.D., 2002. Bacterial cure and somatic cell count response of dairy cows with a positive California mastitis test at calving to therapy with cephapirin sodium. Vet. Therap. 3, 381-386.
St. Rose, S.G., Swinkels, J.M., Kremer, W.D.J., Kruitwagen, C.L.J.J., Zadoks, R.N., 2003. Effect of penethamate hydriodide treatment on bacteriological cure, somatic cell count and milk production of cows and quarters with chronic sub clinical streptococcus uberis or streptococcus dysagalactiae infections. J. Dairy Res. 70, 387-394.
Swinkels, J.M., Rooijendijk, J.G.A., Zadoks, R.N., Hogeveen, H., 2005. Use of partial budgeting to determine the economic benefits of antibiotic treatment of chronic sub clinical mastitis caused by streptococcus uberis or streptococcus dysagalactiae. J. Dairy Res. 72, 75-85.
Wood, P.D.P., 1967. Algebraic model of lactation curves in cattle. Nature 216, 164.
62
Foulum, 9-10 November 2006: Economic decisions in Farm Animal Health
Optimizing control measures against E.coli O157:H7 (VTEC) along the beef chain B.V. Ahmadi1, R.B.M. Huirne1, A. Velthuis1, H. Hogeveen1,2 and K. Frankena3 1 Business Economics Group, Wageningen University, the Netherlands 2 Department of Farm Animal Health, Utrecht University, the Netherlands 3 Quantitative Veterinary Epidemiology Group, Department of Animal Sciences, Wageningen University, the Netherlands Sponsor: Mansholt Graduate School of Wageningen University Summary of the project
Beef may be contaminated by bacteria causing disease in humans (e.g. E.coli O57:H7). The risk of contamination can be decreased by preventive measures throughout the beef supply chain, from the farm to table. However, it is not known in which part of the chain preventive are the most (cost) effective. Given the fact that a zero risk is not possible, an optimal equilibrium between costs made by the supply chain and benefits taken by society is important. More insight is thus needed in the benefits of decreased risk in the beef supply chain.
The objectives of this research are: 1. to develop a generic epidemiological-economic framework to quantify the costs and the effects of preventive measures on the risk of VTEC contamination throughout the supply chain of beef, and 2. To carry out a sensitivity analyses using the framework to see where promising economic fields to reduce the risk of human infection and the associated costs throughout the supply chain. These objectives will be carried out in this PhD project, dedicated to the quantification of epidemiological and economic effects of preventive measures in the supply chain on the risk of human. Summary of the presentation
Escherichia coli O157:H7 (VTEC) is one of hundreds of strains of the bacterium Escherichia coli that is found regularly in the faeces of healthy cattle. It can be transmitted to humans through consumption of contaminated beef and dairy products. A human infection is associated with a wide range of symptoms including asymptomatic shedding, non-bloody diarrhoea and hemorrhagic colitis, up to life-threatening complications such as hemolytic-uremic syndrome (HUS) particularly in children under five years, thrombotic thrombocytopenic purpura (TTP) in elderly people, and death.
In the Netherlands, an overall prevalence of 1.1% (6 of 571 samples) of VTEC-contaminated minced-beef products has been reported. Furthermore, the result of a VTEC risk-assessment study suggests that 0.3% of raw Dutch steak-tartar patties are contaminated with the bacteria. The result of a recent study at the herd level suggests that 7.2% of Dutch
63

Foulum, 9-10 November 2006: Economic decisions in Farm Animal Health
dairy herds are infected with VTEC. In a study by Heuvelink et al. (2001) no VTEC was isolated in the slaughterhouses, while >10% of carcasses were visibly contaminated with manure in 11 of the 27 slaughterhouses and >50% of the inspected carcasses were visibly contaminated with manure in six slaughterhouses. A recent national outbreak (September 2005) due to consuming contaminated steak tartar caused more then 21 people seriously infected. These facts imply that beef carcasses might become contaminated with VTEC during the slaughter process in Dutch slaughterhouses. Interventions to reduce the risk of beef to be contaminated with VTEC can be applied at farm and transport level (i.e. pre-harvest interventions) and/or at slaughter and processing levels (i.e., post-harvest interventions).
To determine the cost-effectiveness of seven carcass-decontamination measures namely: hot-water wash, lactic-acid rinse, trim, steam-vacuum, steam-pasteurization, hide-wash with ethanol and gamma irradiation in an industrial slaughterhouse, two models were used: an epidemiological and an economic model. The epidemiological model was used to estimate the level of expected effectiveness by each decontamination measure. The economic model was developed in connection to the epidemiological model to calculate the costs of each measure per carcass quarter.
Reducing the number of infected lactating cows is a good approach to reduce the level of beef-born human VTEC infections because approximately 30% of the consumed beef in The Netherlands originates from domestic slaughtered culled dairy cows. Some farm attributes (e.g. water and sediments in water troughs) have been frequently reported as main on-farm risk factors for VTEC transmission and based on that, appropriate biosecurity interventions have been suggested. Also interventions that successfully reduce the concentration of VTEC shed in the faeces of infected cattle were identified as effective interventions. A VTEC transmission model developed to investigate the population dynamics of E. coli O157 in a typical UK dairy herd was adjusted and used to assess the effectiveness of four on-farm interventions in the Netherlands. Studied interventions were: vaccination, modified diet to reduce the concentration of bacteria in the gastrointestinal tract, adding probiotics (colicin) to the diet, and application of better hygienic measures which consists of more frequent cleaning of water troughs and replacement of bedding material.
Results of the cost-effectiveness analysis for the interventions at slaughterhouse level showed that a reduction in the prevalence of VTEC-contaminated beef-carcass quarters to 2% can be achieved at costs of €0.20 to €0.50 per quarter which is 16% to 40% of the estimated margin of the slaughter net profit per carcass. A reduction to 1% will cost at least €0.50 to €1.00 per quarter. Results also showed that carcass steam-pasteurization can be considered to be the most cost-effective decontamination measures to be applied in a Dutch beef slaughterhouse to reduce the prevalence of E.coli O157:H7-contaminated beef-carcass-quarters and CFU/cm2 of the meat surface. Nevertheless, the highest reduction in prevalence (to less than 1%) will be achieved by implementing a combination set of decontamination measures that cost between €1.00 to €2.00 per quarter or by implementing irradiation which costs €4.65 per quarter.
64

Foulum, 9-10 November 2006: Economic decisions in Farm Animal Health
Results of the effectiveness analysis of the on-farm interventions revealed that the effectiveness of interventions vary from “almost no effect” to “highly effective” degrees. All the four interventions are most effective when they are implemented in all the animal groups in the farm (i.e. under six months, above six month, dry and lactating groups) or only in the young stock (i.e. under six months, above six month). Results also showed that in some cases single interventions are as effective as combined scenarios when the goal is to reduce both lactating group prevalence and herd prevalence.
Further analysis are under progress to compare cost-effectiveness of the studied interventions at farm and slaughterhouse levels when costs and effectiveness are considered for one animal, one farm and one slaughterhouse firm, and group of farms who supply one industrial slaughterhouse.
65

Foulum, 9-10 November 2006: Economic decisions in Farm Animal Health
66
Foulum, 9-10 November 2006: Economic decisions in Farm Animal Health
Measurement of economic risk caused by disease: The case of mycoplasma in swine herds1, 2
L. Otto Institute of Food and Resource Economics, The Royal Veterinary and Agricultural University, Frederiksberg C, Denmark Abstract
We present an economic decision support model, based on a Bayesian network, for Mycoplasma infection in slaughter swine production. The model describes the various risk factors for Mycoplasma infection and their interactions. This leads to a stochastic determination of the consequences of productivity factors, and this again results in stochastic economic consequences when changing the risk factors or engaging in control arrangements. We use the model to calculate how estimated prevalence and level of Mycoplasma change when we gather evidence from various veterinary examinations, and we show how this influences the distribution of the economic results of a change in strategy to fight Mycoplasma.
One result is that the profitability in fighting Mycoplasma alone is questionable, i.e. risky, thus we must consider the loss of all related diseases in a decision context. Keywords: Decision support system; Bayesian network; Pig; Mycoplasma JEL Classification: C11, D8l, Ql2 Introduction
Animal health economics is a relatively new research discipline devoted to create methods and tools for decision support when implementing control strategies for animal diseases. Traditionally the decisions are based on the farmers', advisors' or veterinarians' subjective judgment based on intuition, experience and the assumed or expected economic cost and production benefit of the control strategy. However, there is a strong need for tools providing a more precise evaluation of the economic consequences of different control strategies. This article is an attempt to provide such a tool with emphasis on the economic risk caused by biological variation due to diseases. We have chosen to focus on one disease, Mycoplasma, in the production of swine for slaughter. Mycoplasma (Mycoplasma hyopneumoniae) was chosen be
1 The project is part of "Animal health economics" financed by the Research Centre for the Management of Animal Production and Health (CEPROS), Denmark. 2 This is a revised version of a paper presented at the XIth Congress of the European Association of Agricultural Economists (EAAE) in August 2005.
67

Foulum, 9-10 November 2006: Economic decisions in Farm Animal Health
cause the induced pneumonia causes large economic losses in the pig industry worldwide (Ross, 1999). Mycoplasma is the primary agent responsible for enzotic pneumoniae, but secondary infections such as Actinobacillus pleuropneumoniae, Pasteurella multocidae, and Streptococcus suis can increase the severity of the disease (Christensen et al., 1999).
Miller et al. (2001) presented a static model for estimating the impact of preventive measures for Mycoplasma among other diseases. The model estimates the economic impact of disease control in the production system in an enterprise budgeting approach. Thus, the model does not explicitly take into account the inherent biological uncertainty. The uncertainty follows from sensitivity analysis of changes in the productivity variables, feed conversion, average daily weight gain and mortality rate. These productivity factors are treated independently of each other and not as a result of the inherent biological variability as in our model. Thus the model does not at all focus on the inherent and combined biological variation.
Otto and Kristensen (2004) developed a static biological model based on biological and veterinary knowledge without any economic consideration or calculations. We have used this model as our starting point for calculation of the economic consequences of Mycoplasma. This enables us to calculate how biological variability causes economic risk based on a solid biological and veterinary model. In the terms of economic theory the biological model can be considered as a description of the production technology, the production set.
Our aim in this paper is to give a short description of the biological model, and then use the model to calculate the economic loss due to Mycoplasma. The model includes herd specific information on risk factors, herd productivity, and results from various examinations and tests of the herd to determine the present disease level. The estimated disease level is the basis for a potential strategy for fighting the disease.
From the biological variation described in the biological part of the model, we use the biological productivity variables as the cornerstone of the economic uncertainty and risk. It is the productivity variables that determine the payment from the slaughterhouse to the farmer, and thus it is through the biological variability in the productivity variables that payments from the slaughterhouse are turned into an uncertain economic consequence, i.e. economic risk for the farmer.
The choice of control strategy to control a disease is often based on economic considerations. Most control strategies to deal with one disease have consequences for many diseases however. When only considering one disease, the economic benefits are therefore underestimated while the costs are estimated correctly. For many non-lethal diseases the benefits are often underestimated and when looking at one disease at a time it is seldom profitable to control the disease. On the other hand one cannot just add up the benefits for all diseases that are affected by the control as there are interactions between diseases.
This paper shows that it is almost never profitable to control mycoplasma.
68

Foulum, 9-10 November 2006: Economic decisions in Farm Animal Health
Method The biological model stemming from Otto and Kristensen (2004) is a static Bayesian
network (Jensen, 1996, 2001). It describes the relation between the various risk factors and the level of Mycoplasma that the herd is exposed to as a steady state equilibrium. Thus, the model is not intended for acute outbreak of Mycoplasma. A brief introduction to Bayesian network is given in appendix A.
Input to the model is the state of various risk factors, the available results of veterinary examinations, and the price and cost of changing control strategies. Some of the factors are easily accessible like the size of the herd. Some factors are more difficult to collect information for the state, it might not always be immediately available, or it might be expensive to obtain, i.e. the serological prevalence, results from post mortem examination. If the state of a variable in the model is unknown, then the distribution of the states for that factor is calculated in the model based on the result of the states for the other factors. Thus, missing input is calculated just as if it had been output – the results can therefore be considered as an estimate of what would have been the result if the particular information of the state was to be achieved.
The output of the model is probability distributions for the Mycoplasma level, the various productivity outcomes, and the economic consequences, viewed as conditional probabilities given the evidence of the factors in the model.
The calculation of the conditional simultaneous probability distribution of the productivity nodes given the observed evidence was done using the propagating method in the inference engine of the Hugin system (Hugin Expert A/S, 2004). The probability distribution of the contribution margin was found by simulation of the above mentioned conditional simultaneous distribution in the biological Bayesian network.
The general structure of the decision support model is shown in Figure 1. The risk factors, the herd diagnostics, and the choice of control strategy affect the biological variation and the state of the herd. Changes in the control strategy or in any risk factor will change the biological state of the herd. The biological state, on the other hand, determines the productivity factors like feed conversion, death rate, and average daily weight gain, which again determine the economic consequences of the chosen strategy given the state of the various risk factors and diagnostics.
A control strategy is any action with the aim to change the level of the disease. Examples of a control strategy are medication, vaccination, change of purchase policy of piglets, change of production system etc. Short term strategies are strategies where the whole effect is exhausted in the short term, thus, the cost coincides with the effect. For a long term strategy the cost and the effect are separated in time. Typically the cost is paid in the first period and the effects or benefits take place in the following periods, i.e. we have a typical investment scenarium. We shall not deal with the investment perspective in this article.
69

Foulum, 9-10 November 2006: Economic decisions in Farm Animal Health
Figure 1. The structure of the decision model. Use of diagnostics as a basis for decisions
The diagnostics are used to determine the current state of the herd with more precision, forming the basis for a decision of a control strategy for the disease. After a decision to act is taken, the expected productivity level following a supposed change of control strategy only depends on the expected state of the herd. The expected change in control strategy is to remove the disease in order to get a higher productivity and thereby a higher contribution margin. In this new expected state the levels of the diagnostics are unknown.
If we are almost certain that a disease is present in the herd and that a change in strategy will remove the disease and thereby result in higher productivity, the strategy should be changed. If we are uncertain, we might engage in various examinations to get a more precise diagnosis. If the diagnosis shows that the herd is healthy, the strategy should not be changed since no disease is to be removed. If, on the other hand, a disease is present, a change in control strategy is more certain to remove the disease and thereby increase productivity. Thus, the reason to make a more precise diagnosis is to make sure it actually is a disease that causes the problem of the herd.
Thus, we look for symptoms of a problem in the herd and examine, clinically or by laboratory tests, what could be the problem and then decide a control strategy based on the results. The starting point is what we observe.
To make a diagnosis requires a visit by a veterinarian, and often various examinations and laboratory tests of the herd are conducted – this all involves expenses. We therefore must compare the cost of making a diagnosis with the expected gain from making a diagnosis followed by a matching change in strategy. If we make a diagnosis, we can save the cost of a control if no diseases are present in the herd. Thus, we shall compare the cost of making a more precise diagnosis with the saved cost of not making a control in the situation where no disease is found in the herd.
70
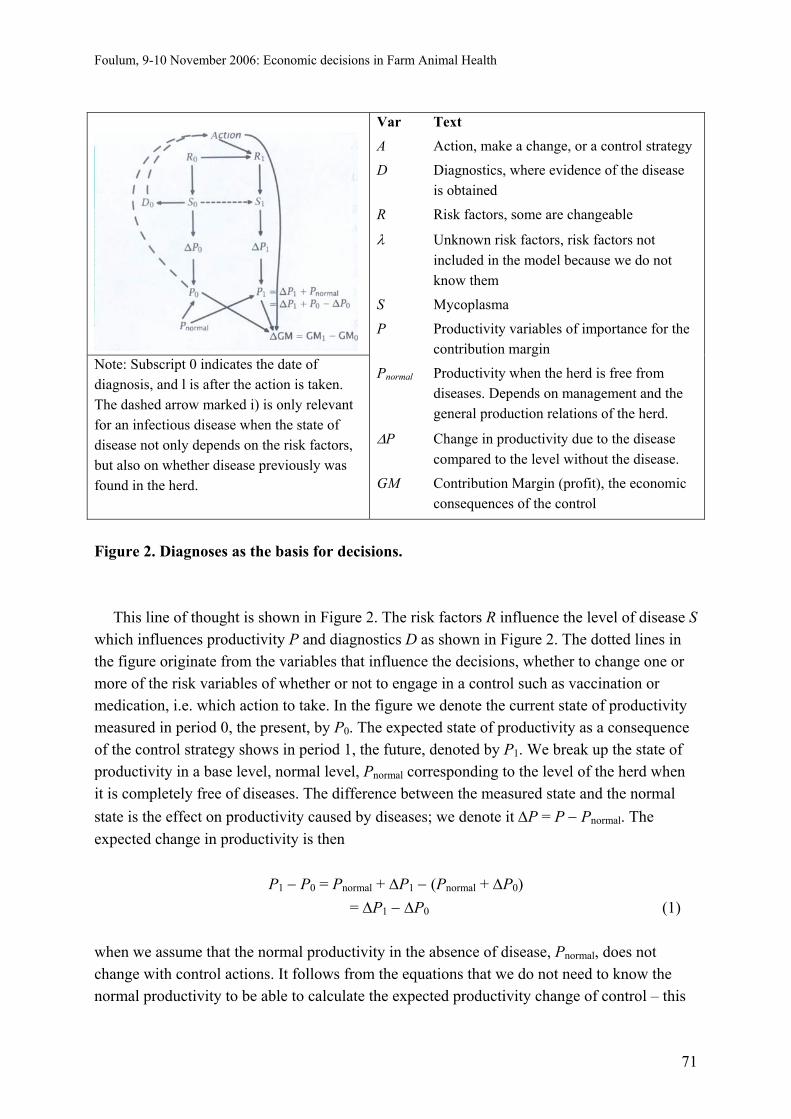
Foulum, 9-10 November 2006: Economic decisions in Farm Animal Health
Note: Subscript 0 indicates the date of diagnosis, and l is after the action is taken. The dashed arrow marked i) is only relevant for an infectious disease when the state of disease not only depends on the risk factors, but also on whether disease previously was found in the herd.
Var Text
A Action, make a change, or a control strategy
D Diagnostics, where evidence of the disease is obtained
R Risk factors, some are changeable
λ Unknown risk factors, risk factors not included in the model because we do not know them
S Mycoplasma
P Productivity variables of importance for the contribution margin
Pnormal Productivity when the herd is free from diseases. Depends on management and the general production relations of the herd.
ΔP Change in productivity due to the disease compared to the level without the disease.
GM Contribution Margin (profit), the economic consequences of the control
Figure 2. Diagnoses as the basis for decisions.
This line of thought is shown in Figure 2. The risk factors R influence the level of disease S which influences productivity P and diagnostics D as shown in Figure 2. The dotted lines in the figure originate from the variables that influence the decisions, whether to change one or more of the risk variables of whether or not to engage in a control such as vaccination or medication, i.e. which action to take. In the figure we denote the current state of productivity measured in period 0, the present, by P0. The expected state of productivity as a consequence of the control strategy shows in period 1, the future, denoted by P1. We break up the state of productivity in a base level, normal level, Pnormal corresponding to the level of the herd when it is completely free of diseases. The difference between the measured state and the normal state is the effect on productivity caused by diseases; we denote it ΔP = P − Pnormal. The expected change in productivity is then
P1 − P0 = Pnormal + ΔP1 − (Pnormal + ΔP0)
= ΔP1 − ΔP0 (1)
when we assume that the normal productivity in the absence of disease, Pnormal, does not change with control actions. It follows from the equations that we do not need to know the normal productivity to be able to calculate the expected productivity change of control – this
71
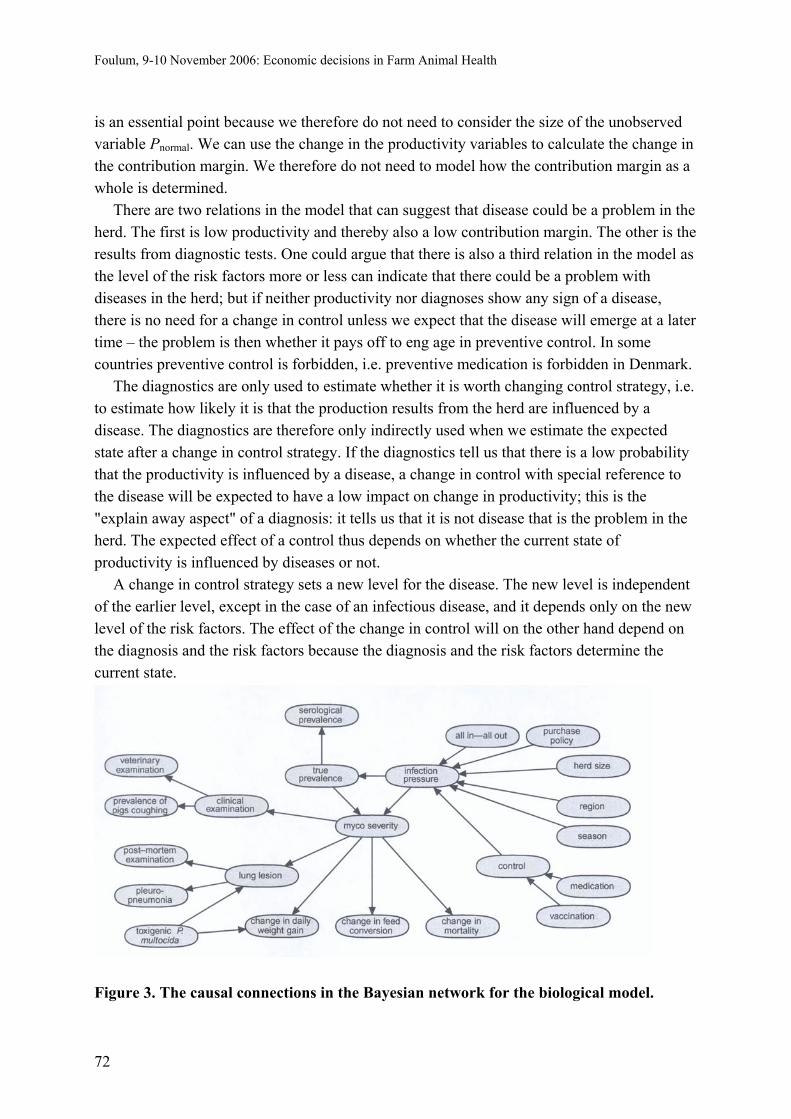
Foulum, 9-10 November 2006: Economic decisions in Farm Animal Health
is an essential point because we therefore do not need to consider the size of the unobserved variable Pnormal. We can use the change in the productivity variables to calculate the change in the contribution margin. We therefore do not need to model how the contribution margin as a whole is determined.
There are two relations in the model that can suggest that disease could be a problem in the herd. The first is low productivity and thereby also a low contribution margin. The other is the results from diagnostic tests. One could argue that there is also a third relation in the model as the level of the risk factors more or less can indicate that there could be a problem with diseases in the herd; but if neither productivity nor diagnoses show any sign of a disease, there is no need for a change in control unless we expect that the disease will emerge at a later time – the problem is then whether it pays off to eng age in preventive control. In some countries preventive control is forbidden, i.e. preventive medication is forbidden in Denmark.
The diagnostics are only used to estimate whether it is worth changing control strategy, i.e. to estimate how likely it is that the production results from the herd are influenced by a disease. The diagnostics are therefore only indirectly used when we estimate the expected state after a change in control strategy. If the diagnostics tell us that there is a low probability that the productivity is influenced by a disease, a change in control with special reference to the disease will be expected to have a low impact on change in productivity; this is the "explain away aspect" of a diagnosis: it tells us that it is not disease that is the problem in the herd. The expected effect of a control thus depends on whether the current state of productivity is influenced by diseases or not.
A change in control strategy sets a new level for the disease. The new level is independent of the earlier level, except in the case of an infectious disease, and it depends only on the new level of the risk factors. The effect of the change in control will on the other hand depend on the diagnosis and the risk factors because the diagnosis and the risk factors determine the current state.
Figure 3. The causal connections in the Bayesian network for the biological model.
72

Foulum, 9-10 November 2006: Economic decisions in Farm Animal Health
The production set: The biologic part of the model A detailed description of the biological part of the model can be found in Otto and
Kristensen (2004). To give the reader an impression of the size and complexity of the model, we have shown the whole causal structure of the biological part of the model in Figure 3 and a detailed description of the nodes is given in Table 4.
In the top right corner of Figure 3 the nodes representing various risk factors and other conditions that influence or are expected to influence the level of Mycoplasma are kept side by side. They all point to the node infection pressure that influences how many animals are infected, the true prevalence, and how severe the herd is affected, myco severity. The node myco severity again affects the productivity nodes, daily weight gain, feed conversion, and mortality.
The farmer can affect the distribution of the productivity and thereby the economic outcome by either changing the risk factors, like taking exceptional measures to prevent the pigs from getting infected at all, or through control strategies like medication or vaccination. To be able to calculate the economic effect of a changed strategy, we need to know the actual state of the herd, i.e. the state of myco severity. The more accurate we know the state of myco severity, the more accurate we can determine how changes in risk factors and control strategies can be expected to change the productivity variables and thereby change the contribution margin. Part of this knowledge for myco severity is only indirectly available through various diagnostics and post mortem examination. Calculating economic loss due to Mycoplasma
Animal health economics is just like any other kind of production economics. We have receipts and expenditure (cost) and the difference is profit and here we focus on the contribution margin. More precisely we focus on change in the contribution margin caused by changes in the level and severity of Mycoplasma in the herd. The changes in contribution margin are connected to the productivity nodes, i.e. changes in feed conversion, changes in daily weight gain, and changes in mortality, and to the prices, i.e. the prices of the various feed components, labour cost for handling the pigs, wage and hours, and the price of the pigs delivered for slaughter.
We do not need the model to calculate the level of all the productivity variables or the contribution margin. We only need to calculate changes due to Mycoplasma from the observed level of the herd as explained in connection with equation (1). Thus, when we calculate the economic consequences of Mycoplasma, we take outset in the actual level observed in the herd, i.e. the actual or observed level of the productivity variables and the actual or observed level of the contribution margin. This was explained in connection with Figure 2.
73
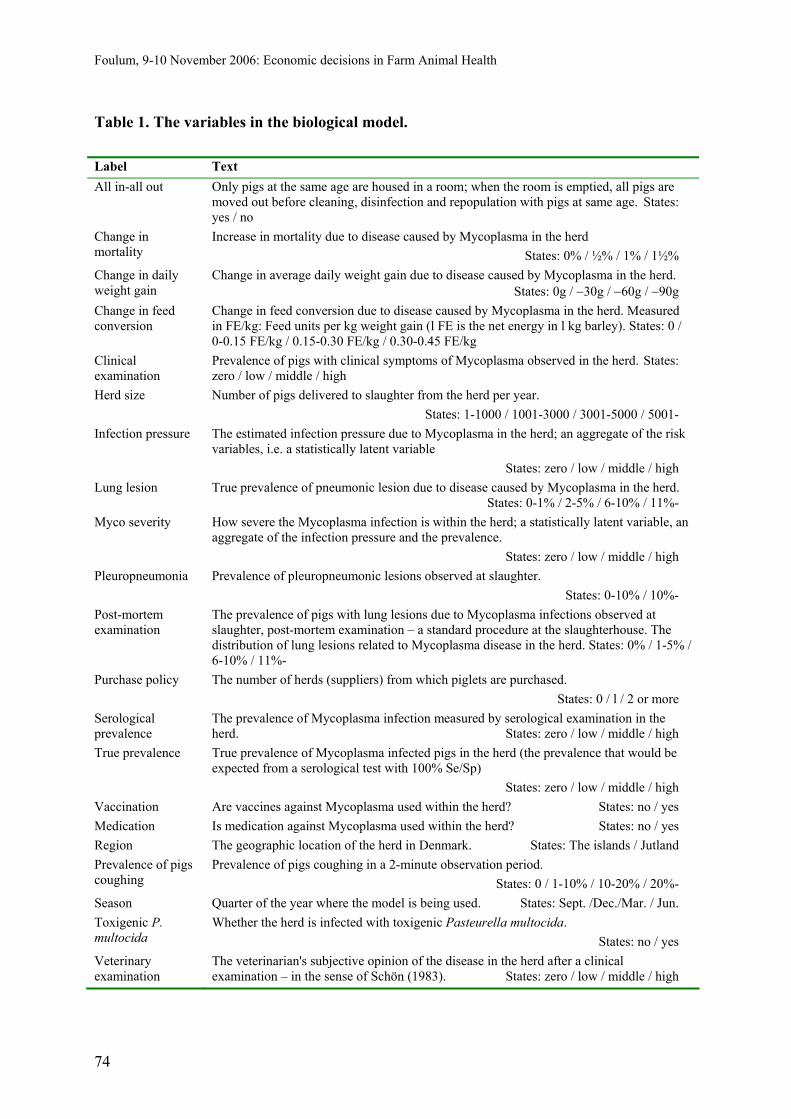
Foulum, 9-10 November 2006: Economic decisions in Farm Animal Health
Table 1. The variables in the biological model. Label Text All in-all out Only pigs at the same age are housed in a room; when the room is emptied, all pigs are
moved out before cleaning, disinfection and repopulation with pigs at same age. States: yes / no
Change in mortality
Increase in mortality due to disease caused by Mycoplasma in the herd States: 0% / ½% / 1% / 1½%
Change in daily weight gain
Change in average daily weight gain due to disease caused by Mycoplasma in the herd. States: 0g / −30g / −60g / −90g
Change in feed conversion
Change in feed conversion due to disease caused by Mycoplasma in the herd. Measured in FE/kg: Feed units per kg weight gain (l FE is the net energy in l kg barley). States: 0 / 0-0.15 FE/kg / 0.15-0.30 FE/kg / 0.30-0.45 FE/kg
Clinical examination
Prevalence of pigs with clinical symptoms of Mycoplasma observed in the herd. States: zero / low / middle / high
Herd size Number of pigs delivered to slaughter from the herd per year. States: 1-1000 / 1001-3000 / 3001-5000 / 5001-
Infection pressure The estimated infection pressure due to Mycoplasma in the herd; an aggregate of the risk variables, i.e. a statistically latent variable States: zero / low / middle / high
Lung lesion True prevalence of pneumonic lesion due to disease caused by Mycoplasma in the herd. States: 0-1% / 2-5% / 6-10% / 11%-
Myco severity How severe the Mycoplasma infection is within the herd; a statistically latent variable, an aggregate of the infection pressure and the prevalence. States: zero / low / middle / high
Pleuropneumonia Prevalence of pleuropneumonic lesions observed at slaughter. States: 0-10% / 10%-
Post-mortem examination
The prevalence of pigs with lung lesions due to Mycoplasma infections observed at slaughter, post-mortem examination – a standard procedure at the slaughterhouse. The distribution of lung lesions related to Mycoplasma disease in the herd. States: 0% / 1-5% / 6-10% / 11%-
Purchase policy The number of herds (suppliers) from which piglets are purchased. States: 0 / l / 2 or more
Serological prevalence
The prevalence of Mycoplasma infection measured by serological examination in the herd. States: zero / low / middle / high
True prevalence True prevalence of Mycoplasma infected pigs in the herd (the prevalence that would be expected from a serological test with 100% Se/Sp) States: zero / low / middle / high
Vaccination Are vaccines against Mycoplasma used within the herd? States: no / yes Medication Is medication against Mycoplasma used within the herd? States: no / yes Region The geographic location of the herd in Denmark. States: The islands / Jutland Prevalence of pigs coughing
Prevalence of pigs coughing in a 2-minute observation period. States: 0 / 1-10% / 10-20% / 20%-
Season Quarter of the year where the model is being used. States: Sept. /Dec./Mar. / Jun. Toxigenic P. multocida
Whether the herd is infected with toxigenic Pasteurella multocida. States: no / yes
Veterinary examination
The veterinarian's subjective opinion of the disease in the herd after a clinical examination – in the sense of Schön (1983). States: zero / low / middle / high
74

Foulum, 9-10 November 2006: Economic decisions in Farm Animal Health
The biological part of the model determines the distribution of the productivity variables and thereby determines the distribution of the contribution margin. The economic consequences of a new control strategy are the change in receipts and cost owing to the change in control strategy. It is not the actual or expected level of receipts and expenditure that are of interest, but the expected changes of the receipts and expenditure when decisions are made.
When we evaluate the economic consequences of different control strategies, our starting point must be the characteristics of the specific herd under examination and not that of an average herd. Therefore it is important to be able to describe the actual state of the specific herd because the expected changes depend on the state of the herd. This is done for nodes relating to
• General risk factors, production system, size of herd, purchase policy etc. • Herd specific characteristics, for example results from veterinary examinations,
serological examinations, post mortem examinations etc. • The starting level for the productivity nodes, i.e. the actual level of daily weight gain,
feed conversion, and death rate.
We calculate the loss due to Mycoplasma as the difference between contribution margin in the herd and the estimated contribution margin if the herd had no Mycoplasma at all, i.e. the herd was healthy. The healthy herd is a theoretical construction that we calculate in the model and use as base level. As we only consider the expected changes in the contribution margin, the base level itself is not part of the calculations.
The contribution margin is calculated as revenue minus variable cost. The revenue, TR, depends on the number of pigs sold to the slaughterhouse, their weight and the price per kg.
TR = size ⋅ weight ⋅ net price.
The variable cost, VC, depends on the number of porkers bought, the cost of feed, price for
transportation of pigs to slaughter and the cost of handling manure. Also included in the variable cost are the cost of various examinations and tests carried out and the cost of a possible implemented control strategy, i.e. for medication the cost of the medicine itself plus cost of manpower distributing it to the pigs.
75

Foulum, 9-10 November 2006: Economic decisions in Farm Animal Health
Figure 4. Distribution function for economic loss due to Mycoplasma.
Size VC = 1 − mortality
⋅ weaner price
1 Feed conversion DKR + size ⋅ ( 1 − mortality
+ 1) ⋅ (weight − 30) ⋅ Weight gain
⋅ Feed conversion
+ size ⋅ other variable cost per pig + size ⋅ labour cost per pig + cost of diagnoses + cost of control strategy.
The three productivity nodes, the daily average weight gain, mortality, and the feed conversion, and the variables together with diagnosing and control in the biological network are the nodes that directly influence the contribution margin. Thus the simultaneous probability distribution of the productivity nodes determines the probability distribution of the contribution margin conditional on the evidence in the biological network and on the various prices in the revenue and cost calculations.
The maximum loss due to Mycoplasma
If we are certain that there is no Mycoplasma in the herd, we have a healthy herd, we then only have a loss due to biological variation compared to the maximum contribution margin for a healthy herd; we use this value as a standard for comparison. The variation for a healthy herd compared to this standard is shown as a distribution function in Figure 4 marked Healthy herd. The biological variation says that there is a positive probability of getting a lower contribution margin than the maximum possible even though the herd is healthy. The probability is nearly 60% of getting a loss less than DKR 0 and almost 100% of getting a loss less than DKR 20.
76
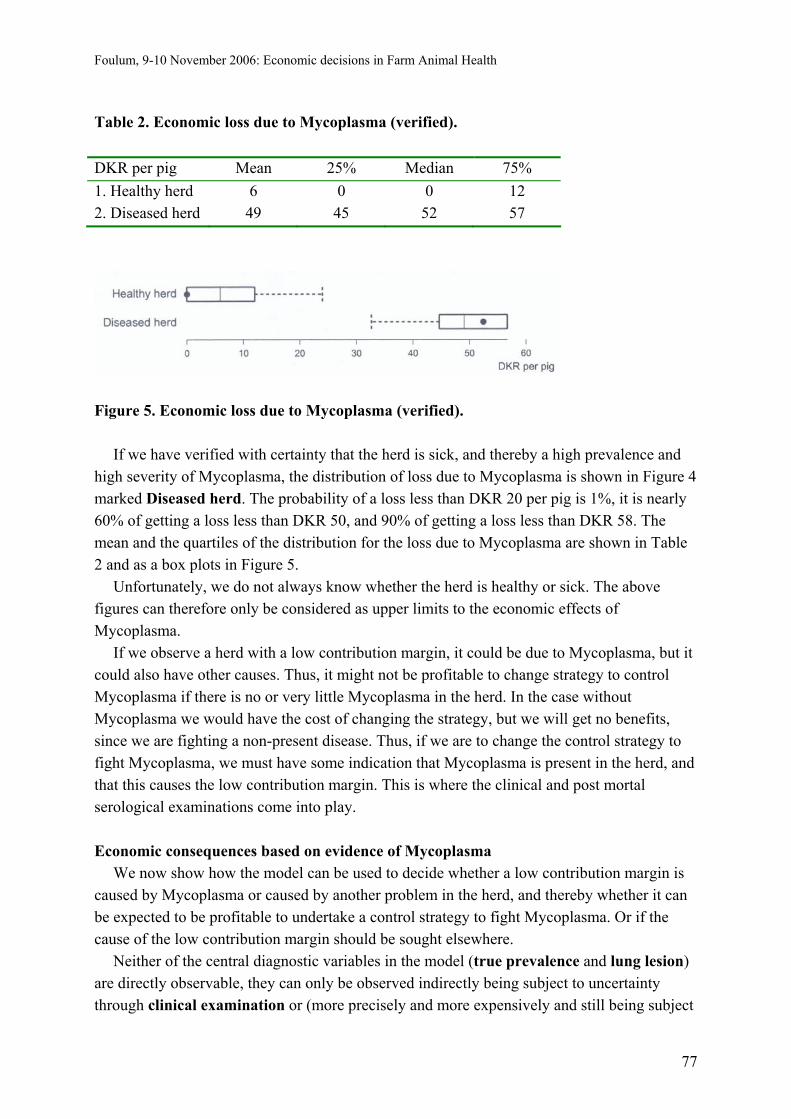
Foulum, 9-10 November 2006: Economic decisions in Farm Animal Health
Table 2. Economic loss due to Mycoplasma (verified). DKR per pig Mean 25% Median 75% 1. Healthy herd 6 0 0 12 2. Diseased herd 49 45 52 57
Figure 5. Economic loss due to Mycoplasma (verified).
If we have verified with certainty that the herd is sick, and thereby a high prevalence and high severity of Mycoplasma, the distribution of loss due to Mycoplasma is shown in Figure 4 marked Diseased herd. The probability of a loss less than DKR 20 per pig is 1%, it is nearly 60% of getting a loss less than DKR 50, and 90% of getting a loss less than DKR 58. The mean and the quartiles of the distribution for the loss due to Mycoplasma are shown in Table 2 and as a box plots in Figure 5.
Unfortunately, we do not always know whether the herd is healthy or sick. The above figures can therefore only be considered as upper limits to the economic effects of Mycoplasma.
If we observe a herd with a low contribution margin, it could be due to Mycoplasma, but it could also have other causes. Thus, it might not be profitable to change strategy to control Mycoplasma if there is no or very little Mycoplasma in the herd. In the case without Mycoplasma we would have the cost of changing the strategy, but we will get no benefits, since we are fighting a non-present disease. Thus, if we are to change the control strategy to fight Mycoplasma, we must have some indication that Mycoplasma is present in the herd, and that this causes the low contribution margin. This is where the clinical and post mortal serological examinations come into play. Economic consequences based on evidence of Mycoplasma
We now show how the model can be used to decide whether a low contribution margin is caused by Mycoplasma or caused by another problem in the herd, and thereby whether it can be expected to be profitable to undertake a control strategy to fight Mycoplasma. Or if the cause of the low contribution margin should be sought elsewhere.
Neither of the central diagnostic variables in the model (true prevalence and lung lesion) are directly observable, they can only be observed indirectly being subject to uncertainty through clinical examination or (more precisely and more expensively and still being subject
77

Foulum, 9-10 November 2006: Economic decisions in Farm Animal Health
to uncertainty) through a serological examination (serological prevalence) and a post-mortem examination. We will therefore analyze how the results from various examinations influence our view on the state of health in the herd, and how again the resulting view influences our economic valuation of the disease.
We consider two herds with different risk profiles: a low-risk herd characterized by all in-all out production, a small herd size and no buying of piglets from other herds, and a high-risk herd characterized by not managing all in-all out production, a large herd size and buying piglets from many other herds.
Before we even enter the pigsty, we have some knowledge of the state of the risk factors, since we know whether it is a high-risk or a low-risk herd – we just have to talk to the farmer or his adviser to know this, we do not have to look at the pigs. This is what we call "No evidence" in Table 3. When we afterwards examine the pigs we gather more evidence as shown in the following rows in the table.
For each herd we find that the loss due to Mycoplasma depends on the probability of existence of the disease in the herd. We consider two examinations: a serological test and a post-mortal examination. The possible combinations of outcome from the tests are shown in Table 3. High-risk herd
For the high-risk herd the mean loss due to Mycoplasma in the herd is shown in Table 4. In the table we also show the median and the 25% and 75% quartiles. The distribution of the losses is presented as box plots in the figure in the right side of the table. The box plots are repeated in Figure 6, but here the evidence cases are sorted by the median of the loss due to Mycoplasma.
In the state without any veterinary evidence, "No evidence" in Table 4, the mean loss due to Mycoplasma is DKR 24 per pig, in the column marked 25% we find the number 15 showing that there is a probability of 25% that the loss is less than DKR 15 per pig, and a probability of 25% (= 1 – 75%) that it is above DKR 34 per pig.
If a veterinary examination in the form of a serological test was done and the result showed a high level of infection, then we would be more certain that Mycoplasma is present in the herd. The mean loss due to Mycoplasma is now DKR 37, row "highSero" in Table 4.
If we also make a post-mortem examination and the result from that shows a high level as well then the evidence of Mycoplasma being present in the herd is high; the mean loss due to Mycoplasma would then be 48, row "highSero, highUsk" in Table 4. Thus, if Mycoplasma could be expelled, we would on average save DKR 48 per pig, meaning that on average it would be profitable to spend up to DKR 48 per pig for a control to get rid of the disease. Note also that if both serological test and post-mortem examination show that the level of Mycoplasma in the herd is high, besides a high mean loss due to the disease, the spread in the distribution is smaller, and more narrow, as can be seen from the box plots in the right part of Table 4 and in Figure 6.
78
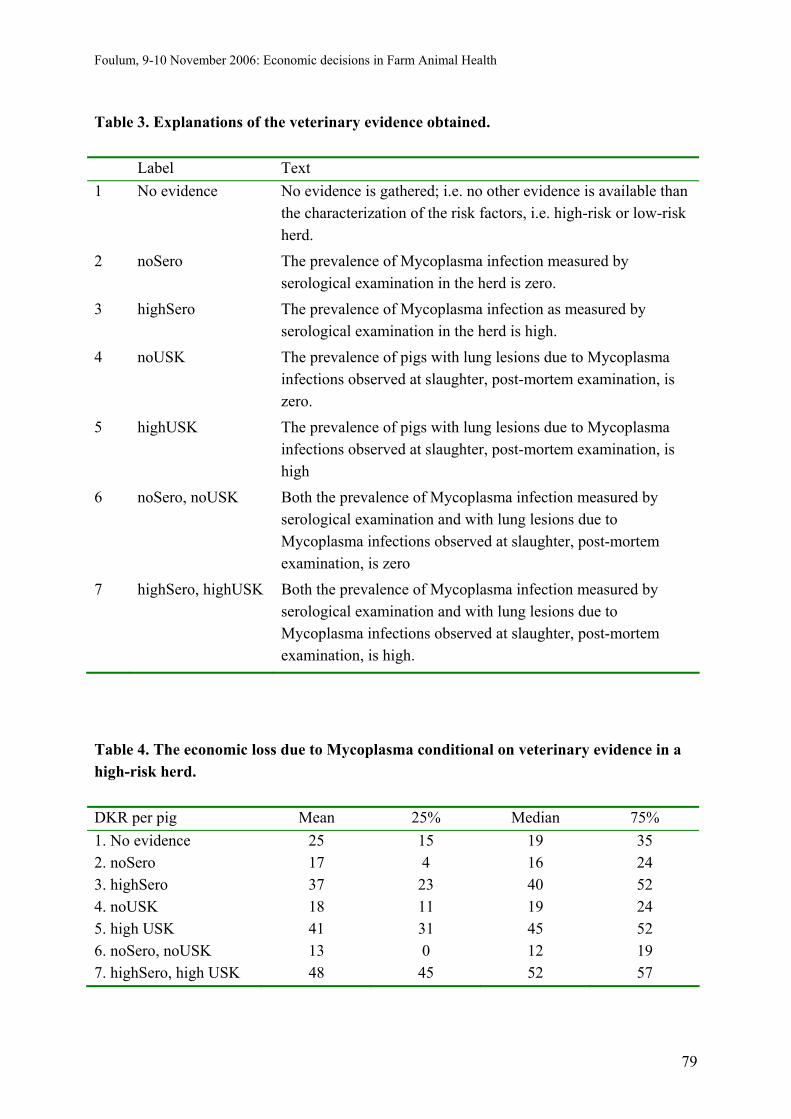
Foulum, 9-10 November 2006: Economic decisions in Farm Animal Health
Table 3. Explanations of the veterinary evidence obtained. Label Text 1 No evidence No evidence is gathered; i.e. no other evidence is available than
the characterization of the risk factors, i.e. high-risk or low-risk herd.
2 noSero The prevalence of Mycoplasma infection measured by serological examination in the herd is zero.
3 highSero The prevalence of Mycoplasma infection as measured by serological examination in the herd is high.
4 noUSK The prevalence of pigs with lung lesions due to Mycoplasma infections observed at slaughter, post-mortem examination, is zero.
5 highUSK The prevalence of pigs with lung lesions due to Mycoplasma infections observed at slaughter, post-mortem examination, is high
6 noSero, noUSK Both the prevalence of Mycoplasma infection measured by serological examination and with lung lesions due to Mycoplasma infections observed at slaughter, post-mortem examination, is zero
7 highSero, highUSK Both the prevalence of Mycoplasma infection measured by serological examination and with lung lesions due to Mycoplasma infections observed at slaughter, post-mortem examination, is high.
Table 4. The economic loss due to Mycoplasma conditional on veterinary evidence in a high-risk herd. DKR per pig Mean 25% Median 75% 1. No evidence 25 15 19 35 2. noSero 17 4 16 24 3. highSero 37 23 40 52 4. noUSK 18 11 19 24 5. high USK 41 31 45 52 6. noSero, noUSK 13 0 12 19 7. highSero, high USK 48 45 52 57
79

Foulum, 9-10 November 2006: Economic decisions in Farm Animal Health
Note: The explanations of the notation in the table can be found in Table 3.
DKR per pig
Note: The explanations of the notation in the table can be found in Table 3. Figure 6. The economic loss due to Mycoplasma conditional on veterinary evidence (sorted by the median) in a high-risk herd. Table 5. The economic loss due to Mycoplasma conditional on veterinary evidence in a low-risk herd. DKR per pig Mean 25% Median 75% 1. No evidence 14 0 12 23 2. noSero 9 0 3 12 3. highSero 26 4 23 46 4. noUSK 8 0 4 13 5. high USK 34 15 38 52 6. noSero, noUSK 7 0 0 12 7. highSero, high USK 46 40 52 57
80

Foulum, 9-10 November 2006: Economic decisions in Farm Animal Health
Figure 7. The economic loss due to Mycoplasma conditional on veterinary evidence (sorted by the median) in a low-risk herd. Low-risk herd
The results for the low-risk herds are shown in Table 5 and as box plots in Figure 7. When we look at a low-risk herd, the mean loss is much less than for the high-risk herd in
the case of no evidence. When we gather veterinary evidence, the difference in loss between the two herds decreases. This is of course as expected. A low-risk herd has a lower expected Mycoplasma than a high-risk herd and therefore has a lower expected loss due to Mycoplasma. Thus, when we observe a low-risk herd, the risk factors are dominating over just one veterinary examination, but not over two examinations. Therefore to diagnose a low-risk herd of Mycoplasma there must be many arguments for Mycoplasma, and correspondingly we must have many arguments to make a strategy for fighting Mycoplasma profitable. Economic consequences of control measures
So far we have calculated the loss due to Mycoplasma conditional on results from various examinations. Now we shall use these numbers to calculate the profitability of control strategies. We shall only consider two short term control strategies: vaccination and medication. The cost of the strategies is composed of the price of vaccine and medicine itself plus labour cost distributing it to the pigs.
The results from the analysis of medication in a high-risk herd are shown in Table 6. The expected average increase in contribution margin due to a medication strategy conditional on no evidence, is shown to be DKR −2, i.e. an expected average loss of 2 DKR per pig, on average medication does not pay off. The last column in the table shows that there is a probability of 56% for a loss if conducting the medication strategy in this situation. Only if both serology test and post-mortem examination show sign of high prevalence of Mycoplasma, medication pays off – the expected increase in contribution margin is DKR 21. Even when we are looking at a high-risk herd, we must thus have high evidence that Mycoplasma is present in the herd for medication to be profitable. But even if we are pretty
81
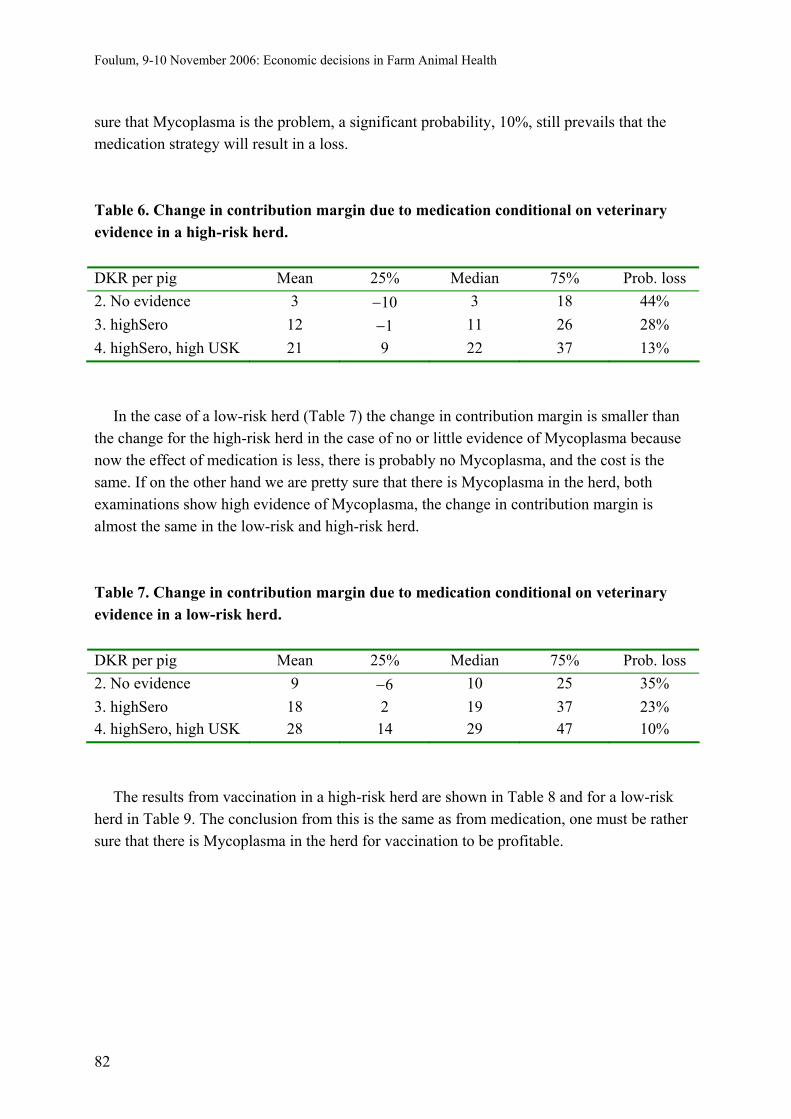
Foulum, 9-10 November 2006: Economic decisions in Farm Animal Health
sure that Mycoplasma is the problem, a significant probability, 10%, still prevails that the medication strategy will result in a loss.
Table 6. Change in contribution margin due to medication conditional on veterinary evidence in a high-risk herd. DKR per pig Mean 25% Median 75% Prob. loss 2. No evidence 3 −10 3 18 44% 3. highSero 12 −1 11 26 28% 4. highSero, high USK 21 9 22 37 13%
In the case of a low-risk herd (Table 7) the change in contribution margin is smaller than the change for the high-risk herd in the case of no or little evidence of Mycoplasma because now the effect of medication is less, there is probably no Mycoplasma, and the cost is the same. If on the other hand we are pretty sure that there is Mycoplasma in the herd, both examinations show high evidence of Mycoplasma, the change in contribution margin is almost the same in the low-risk and high-risk herd.
Table 7. Change in contribution margin due to medication conditional on veterinary evidence in a low-risk herd. DKR per pig Mean 25% Median 75% Prob. loss 2. No evidence 9 −6 10 25 35% 3. highSero 18 2 19 37 23% 4. highSero, high USK 28 14 29 47 10%
The results from vaccination in a high-risk herd are shown in Table 8 and for a low-risk herd in Table 9. The conclusion from this is the same as from medication, one must be rather sure that there is Mycoplasma in the herd for vaccination to be profitable.
82
Foulum, 9-10 November 2006: Economic decisions in Farm Animal Health
Table 8. Change in contribution margin due to vaccination conditional on veterinary evidence in a high-risk herd. DKR per pig Mean 25% Median 75% Prob. loss 2. No evidence 7 −6 7 20 37% 3. highSero 15 2 15 31 23% 4. highSero, high USK 25 12 26 41 9% Table 9. Change in contribution margin due to vaccination conditional on veterinary evidence in a low-risk herd. DKR per pig Mean 25% Median 75% Prob. loss 2. No evidence 12 −3 13 28 30% 3. highSero 21 5 22 40 20% 4. highSero, high USK 32 16 32 50 7% Discussion
We have demonstrated that for a herd with a low contribution margin it is important to estimate the cause. Only if substantial evidence exists that the cause of the low contribution margin, is a disease is it profitable to fight the disease. Even if risk factors are present, it might not be profitable to conduct veterinary examinations to increase the evidence, the cost of the examinations is an essential factor here.
The problem of making a diagnosis is therefore not just a veterinary problem, but also an economic problem. Is it profitable to make a precise diagnosis? The answer is that it is only profitable to make a precise diagnosis if it will make the action more profitable. If all or most risk factors for a disease are present and if the contribution margin is low, then the probability of a disease in the herd is high. As the examinations by veterinarians are also subject to uncertainty, an examination might not change the probability of a disease. But examinations are expensive, and if they are not expected to change the probability of the disease, or only a small change, it might not be profitable to conduct the examination.
If two veterinary examinations show different results, then typically the spread of the cost is very large, the uncertainty as to whether there is or there is not Mycoplasma in the herd increases. In the case where one examination shows zero and another shows high prevalence, we can actually get a two modus distribution, either the prevalence is close to zero or it is high, we cannot say which, but we can say the prevalence is probably not in the middle – the probability that both are wrong is small.
Even though we have shown that it seldom pays off to fight Mycoplasma, this is not the whole truth. Most strategies for controlling Mycoplasma also have an impact on other diseases. When we calculate the profitability of a control strategy, we must therefore take into
83

Foulum, 9-10 November 2006: Economic decisions in Farm Animal Health
consideration the benefits from all the affected diseases and this might make it profitable. For the figures we have shown for loss due to Mycoplasma, it will never pay off to fight Mycoplasma with a more general and long lasting control strategy like changing the production system, but if we take the effects from other diseases into consideration this might change.
Thus, we have to consider several diseases and their interactions when we are about to make decisions on animal health economics. Use and interpretation of a Bayesian network
Bayesian networks are discussed in the books by Jensen (1996, 2001). Note that despite the name, "Bayesian networks" does not imply a commitment to Bayesian methods – but refers instead to the use of Bayes's formula for probabilistic calculus.
A Bayesian network is a graphical model where the variables are connected with arrows corresponding to direct causal relations in the model; in graph theory, the variables are also called "nodes". When variable A is the cause of variable B, we have the graph below. When there is an arrow from A pointing to B, we call A a
"parent" of B and B a "child" of A. The parameter in our model is the conditional probability P(B|A) of B given the state of A. If A is a factor and B is the variable being sick, then pyes corresponds to the conditional probability P(B|A), the probability of being sick dependent on
P(A,B) the factor. The Bayesian network is based on Bayes' formula P(B | A) = P(A)
such that
when we have evidence about B, we can calculate the probability of A conditional on this P(A, B) P(A)evidence as P(A | B) =
P(B) = P(B | A)
P(B) . This implies that knowledge about
B can help us to infer about A. Thus, even though the causal connection is in the direction of the arrow, information can flow in the opposite direction.
When more variables are involved (as in the figures below), then we say that C is
conditionally independent of A given B. When we have evidence about C, then we can make inference about B and then again about A. When we have evidence about B, then we can make inference on both A and C – but if we also have evidence about C, this does not change our evidence on A (because all information from C to A now is blocked by the evidence about B). For the left-hand graph we have P(A, B, C) = P(C|A, B) P(A, B) = P(C|B) P(B|A) P(A);
84
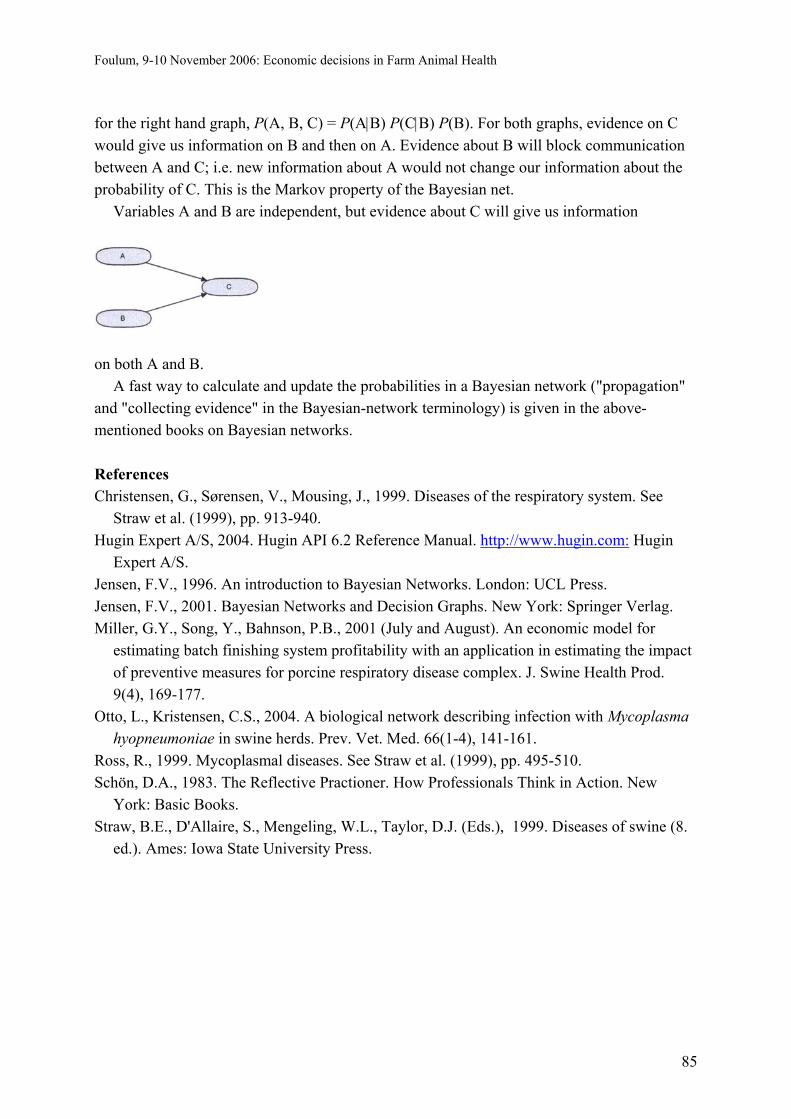
Foulum, 9-10 November 2006: Economic decisions in Farm Animal Health
for the right hand graph, P(A, B, C) = P(A|B) P(C|B) P(B). For both graphs, evidence on C would give us information on B and then on A. Evidence about B will block communication between A and C; i.e. new information about A would not change our information about the probability of C. This is the Markov property of the Bayesian net.
Variables A and B are independent, but evidence about C will give us information
on both A and B.
A fast way to calculate and update the probabilities in a Bayesian network ("propagation" and "collecting evidence" in the Bayesian-network terminology) is given in the above-mentioned books on Bayesian networks.
References Christensen, G., Sørensen, V., Mousing, J., 1999. Diseases of the respiratory system. See
Straw et al. (1999), pp. 913-940. Hugin Expert A/S, 2004. Hugin API 6.2 Reference Manual. http://www.hugin.com: Hugin
Expert A/S. Jensen, F.V., 1996. An introduction to Bayesian Networks. London: UCL Press. Jensen, F.V., 2001. Bayesian Networks and Decision Graphs. New York: Springer Verlag. Miller, G.Y., Song, Y., Bahnson, P.B., 2001 (July and August). An economic model for
estimating batch finishing system profitability with an application in estimating the impact of preventive measures for porcine respiratory disease complex. J. Swine Health Prod. 9(4), 169-177.
Otto, L., Kristensen, C.S., 2004. A biological network describing infection with Mycoplasma hyopneumoniae in swine herds. Prev. Vet. Med. 66(1-4), 141-161.
Ross, R., 1999. Mycoplasmal diseases. See Straw et al. (1999), pp. 495-510. Schön, D.A., 1983. The Reflective Practioner. How Professionals Think in Action. New
York: Basic Books. Straw, B.E., D'Allaire, S., Mengeling, W.L., Taylor, D.J. (Eds.), 1999. Diseases of swine (8.
ed.). Ames: Iowa State University Press.
85

Foulum, 9-10 November 2006: Economic decisions in Farm Animal Health
86
Foulum, 9-10 November 2006: Economic decisions in Farm Animal Health
The value of economics as motivation factor for dairy farmers3
N.I. Valeeva1,2 and H. Hogeveen1,3 1Department of Farm Animal Health, Utrecht University, the Netherlands, 2Agricultural Economics Research Institute, The Hague, the Netherlands, 3Business Economics Group, Wageningen University, the Netherlands Introduction
Many farmers have rather good knowledge of existing management practices to control mastitis on the farm (Kuiper et al., 2005). It may, however, be naïve to assume that all the practices will be automatically implemented, because it involves production costs increase. Ultimately though, there are economic benefits for farmers due to reduction in mastitis (Halasa et al., 2006). Furthermore, individual farmer decisions on implementation of recommended practices are also driven by other factors, e.g. self-esteem, that do not necessary result in monetary returns (Calvazos, 2003; Kuiper et al., 2005). Until now, however, there is hardly any knowledge available of the significance of such factors in keeping farmers motivated to improve mastitis management, whereas there is a number of studies dealing with monetary factors. In particular, several studies have evaluated the positive impacts of existing and changing quality payment structures on reduction in BMSCC by focusing either on quality premiums (Nightingale and Schukken, 2005; Rodrigues and Ruegg, 2005) or quality penalties (Schukken et al., 1992; Sérieys and Blanche, 2005; van Schaik et al., 2005). These studies, however, were observational and carried out after a particular quality payment scheme was introduced or changed in the current ones were made.
The objectives of this study, therefore, were 1) to explore different motivating factors and to quantify their importance for farmers in their decisions regarding improvement of mastitis management, 2) to evaluate different quality payment schemes (quality premiums versus quality penalties) as extra incentive mechanisms for farmers, 3) to link the motivating factors to characteristics of individual farmers. Materials and methods Survey design
The survey consisted of a traditional paper-based and a computerized questionnaire. The paper questionnaire covered information on farm size, milk quota, number of dairy cows, labour used on the farm, BMSCC level, farmer age, education and experience, availability of a potential successor, and farmers’ perceptions of mastitis risk. The computerized
3 This short paper is based upon a full paper by N.I. Valeeva, H. Hogeveen and T.J.G.M. Lam, entitled “Motivation of dairy farmers to improve mastitis management”, submitted for publication. The research underlying this paper is financed by the Dutch Dairy Board.
87
Foulum, 9-10 November 2006: Economic decisions in Farm Animal Health
questionnaire followed the adaptive conjoint analysis (ACA), which is one of the available conjoint techniques. The conjoint approach assumes that preference elicited from one or more individuals can be represented by subjective utility function, which is a monotonic function of interval scale utilities that are simple additive functions of subjective utility values – so-called “part-worths” – associated with different levels of the factors that compose the preference (Lattin et al., 2003). Within the traditional conjoint approach, a set of hypothetical stimuli is constructed, where each stimulus represents some predetermined combinations of factors. Respondents are asked to make judgments about their overall preference by assigning a unique rank for each stimulus. By varying the choices that respondents have to make among stimuli in systematic ways, part-worth coefficients for an implied ranking function that best explains the observed rankings can be estimated. Then, part-worths can be used to determine the relative importance of factors influencing the preference for the stimuli. In this sense, conjoint techniques are often used in marketing and consumer studies to identify the relative importance of different attributes composing a particular product. Also, the use of such techniques has been demonstrated for determining the importance of risk factors concerning animal diseases (Horst et al., 1996), animal welfare attributes (Den Ouden et al., 1997) and food safety improving attributes (Valeeva et al., 2005). For a more comprehensive overview of conjoint analysis, see Churchill (1999).
Motivation of dairy farmers to improve mastitis management is also multifactorial in nature. This study considered farmer motivation as a set of 8 motivating factors: a) job satisfaction, b) overall situation on the farm, c) economic losses, d) animal health and welfare consciousness, e) ease in meeting regulatory requirements, f) dairy product quality and image, g) extra financial incentive based on BMSCC, and h) recognition for a job well done. To examine the farmer behavioural reaction to different quality payment schemes as extra incentive mechanisms, computerized questionnaires were developed for the premium and penalty scenario. The 2 questionnaires were identical, except for the questions dealing with the factor “extra financial incentive based on BMSCC”. This factor was framed in terms of a price premium and price penalty in the premium and penalty scenarios, respectively, given that total amount paid to farmers was the same, which ensured the logical equivalence of the scenarios.
The specific conjoint analysis used in this study was an adapted conjoint analysis including 4 sections: a rating of levels within motivating factors, a series of self-explicated questions, the paired-comparison questions, and motivating intention to improve mastitis for calibration motivation concepts. A detailed description of a typical analytical procedure of the ACA questionnaire, including scales used in each section, can be found in Valeeva et al. (2005). Data collection
The target population for this study was dairy farms that include the entire range of BMSCC. To collect the data 4 workshops, were organized at 4 different locations in the north (penalty scenario), south (penalty scenario), east (premium scenario) and west (premium
88

Foulum, 9-10 November 2006: Economic decisions in Farm Animal Health
scenario) of the Netherlands in February 2006. The locations were selected to cover areas containing a significant share of the total milk supply in the Netherlands.
The two major Dutch dairy co-operatives (Campina and Royal Friesland Foods) approached 400 selected farmers to request participation in the workshop. From the invited farmers, 115 initially agreed to participate, whereas 28 refused or were not able to participate in the workshop and the remaining 257 farmers did not react at all. Ultimately, a total of 100 farmers took part in the workshops.
Results of the paper and computer questionnaire were analysed using the appropriate statistical methodologies. Further details on the survey design, workshop organization and statistical analyses can be fond in Valeeva et al. (2006). Results and discussion Surveyed farmers
Preliminary analysis identified one obvious outlier, which was excluded from the following steps of analysis. This farm has an unrealistically larger milk quota than other surveyed farms. This could be due to a respondent’s mistake while filling the questionnaire. Furthermore, only hired labour is used on this farm. In this sense, the perceptions of the farm manager who is not directly involved in actions to improve mastitis could differ from those of farmers dealing daily with such actions themselves.
Table 1 presents descriptive information on the surveyed farmers (n = 99). Average age of the respondents is about 42 years with 23 years of dairy farming experience. Over one-fifth (23.2%) of all farmers reported having a successor and 13.1% reported not having one. Only 12.1% of the farmers in this study have a relatively low level of education. The respondents farm an average of 43.78 ha, which is not significantly different from average farm size of the Dutch dairy farm population as a whole (Agricultural Economics Research Institute, 2004; Agricultural Economics Research Institute 2005; Research Institute for Animal Husbandry, 2005). However, the finding of the significantly greater number of dairy cows, greater milk quota and smaller amount of used labour corresponding to this farm size suggests that the studied farms are more intensive than an average Dutch farm. At the same time, the bulk milk somatic cell count (BMSCC) on the surveyed farms is almost identical to that of the Dutch dairy farm population. Overall, the results of Table 1 suggest that survey design was fairly successful in contacting and recruiting a rather representative sample of our target population.
89

Foulum, 9-10 November 2006: Economic decisions in Farm Animal Health
Table 1. General characteristics of the surveyed dairy farms (n = 99) and the Dutch dairy farm population. Characteristic Survey sample Dutch
population P
Number of dairy cows 73 651 0.004 Milk quota, kg 595,827 497,2002 0.001 Farm size, ha 43.78 41.402 0.219 Labour units 1.44 1.691,3 0.001 Hired labour 0.04 0.043 0.832 Bulk milk SCC, ×1000 cells/mL 212 2114 0.887 Age of farmer 42 NA5 … Dairy farming experience, years 23 NA … Successor for farm business, % Yes 23.2 NA … No 13.1 NA … Not known yet 63.7 NA … Education of farmer, % Elementary education 12.1 NA … Secondary education 63.7 NA … Postsecondary education 24.2 NA … 1Source: Agricultural Economics Research Institute (2005). 2Source: Agricultural Economics Research Institute (2004). 3Source: Research Institute for Animal Husbandry (2005). 4Source: Milk Control Station database for 16615 dairy farms supplying milk to Campina and Friesland Foods, 2005. 5Not available.
Table 2 shows the mean relative importance of the factors that motivate the farmer’s decision to improve mastitis management on the farm. The table contains results for the premium and penalty scenarios (columns “Premium scenario” and “Penalty scenario”). The greater relative importance of a factor implies that farmers consider that factor to be more motivating in their decision to improve mastitis management. In both scenarios, for many motivating factors, the differences between means of factors’ importance are significantly different (P ≤ 0.05).
90

Foulum, 9-10 November 2006: Economic decisions in Farm Animal Health
Table 2. Mean relative importance (rankings in parentheses) of factors influencing farmers’ decision to improve mastitis management (%). Premium scenario
(n = 40) Penalty scenario (n = 43)
Job satisfaction 17.41a (1) 14.90agij (2) Overall situation on the farm 15.81abc (2) 14.89bfhj (3) Economic losses 14.23bdgj (3) 14.39abcehi (4) Animal health and welfare consciousness 13.95cfgh (4) 14.51ck (5) Ease in meeting regulatory requirements 12.45def (5) 9.59d (6) Extra financial incentive based on bulk milk SCC 11.35ehij (6) 16.43efgk (1) Dairy product quality and image 8.63i (7) 8.66d (7) Recognition for a job well done 6.13 (8) 6.63 (8) Total 100.00 100.00 Predictive accuracy, mean of the ACA model fit (R2) 0.762 0.779 W1 = 0.287,
P < 0.001 W = 0.275, P < 0.001
a,b,c,d,e,f,g,h,i,j,kMeans within a column with different superscripts are significantly different (P ≤ 0.05). 1W represents the Kendall’s coefficient of concordance (P = Monte Carlo P).
From Table 2 it appears that except for the factor “extra financial incentive based on BMSCC” that was differently presented in the 2 scenarios, farmers largely agree on the most and least motivating factors. The ranked order of motivating factors is the same. The factors judged by farmers to be the most important are “job satisfaction” and “overall situation on the farm”. These results together with a relatively high importance attached to “economic losses” and “animal health and welfare consciousness” suggest that the improvement of mastitis management is mainly driven by factors that are internal to the farm and the farmer himself. As can also be seen from the table, in both scenarios farmers consider “extra financial incentive based on BMSCC” as one of the 6 most important factors. This factor together with “economic losses” that can also directly influence economic performance of the farm account for around 30% of importance of the 8 considered factors, whereas all internal factors account for about 85% of this importance. This indicates that farmers are not motivated solely by money in their decisions to improve mastitis management. Moreover, internal nonmonetary factors that involve internal esteem and enjoying healthy animals on their farm are equally as motivating as monetary factors (also about 30% of the importance). In this sense, it is essential to look beyond financial incentives in stimulating farmers’ motivation to improve mastitis management.
Overall, the results show almost no difference between perceptions of the 2 groups of respondents (Table 2). The major observed difference is a result of rather different opinion on importance of “extra financial incentive based on BMSCC”. In the questionnaire, this factor
91

Foulum, 9-10 November 2006: Economic decisions in Farm Animal Health
was framed in terms of a price premium for one group and in terms of a price penalty for the other group. Table 2 demonstrates that farmers attach a remarkably greater importance to “extra financial incentive based on BMSCC” when it is formulated as penalty levels (16.43% and ranking 1, column “Penalty scenario”) than as premium levels (11.35% and ranking 6, column “Premium scenario”). This indicates that farmers react differently depending on whether they receive premium or penalty, as extra financial incentive, for a lower and a higher BMSCC, respectively. In this respect, these outcomes also support the evidence of a framing effect in eliciting individuals’ preferences (Rabin, 1998). Predictable influence of this effect can be considered while designing schemes of quality payment to stimulate farmers to improve mastitis management.
The values of Kendall’s coefficient of concordance W (Table 3) suggest that there is a significant but not strong agreement among the farmers’ rankings both for the premium (W = 0.287, P < 0.001) and penalty (W = 0.275, P < 0.001) scenarios (Table 3). This indicates variability in farmers’ opinions on the motivating factors’ importance, which is consistent with the expectation that motivation for improving mastitis management differ between individuals.
For both the premium and penalty scenarios, the first step of the cluster analysis (Ward’s hierarchical method) suggested 3-cluster solutions. In the second stage, refining the clusters using K-means nonhierarchical method resulted in fully identical clusters, compared to clusters identified by the hierarchical procedure. The first cluster in the premium scenario could be described as “premium oriented” motivation (45% of the farmers). Compared with other farmers in the premium scenario, these farmers attach a significantly stronger importance to premium as “extra financial incentive based on BMSCC” (16.07%). The factor “job satisfaction” (20.46%) is valued as most important motivating factor by these farmers. This characteristic, however, is not very pronounced because the difference is statistically significant only compared with the second group. In the penalty scenario, there was a cluster which rather similar characteristics. Likewise, farmers in this cluster may be described as having a “penalty-oriented” motivation. Overall, these results suggest that there are farmers who are rather motivated by “extra financial incentive based on BMSCC”. This implies that these farmers (27.71% of the total sample) can be the most responsive to alternative designs for premium/penalty incentive programs.
The second cluster in the premium scenario represents 35% of the corresponding farmers primarily motivated by having an “efficient (well-organized) farm that easily complies with regulatory requirements”. A rather similar motivation also describes a cluster consisting of 35% of the farmers in the penalty scenario. Farmers in this cluster attach significantly greater importance to “overall situation on the farm” (19.65% and 18.45%) and “ease in meeting regulatory requirements” (16.73% and 11.91%), compared with other clusters in the premium and penalty scenarios, respectively.
The third cluster in the premium scenario and the corresponding cluster in the penalty scenario include 20% and 53% of the respondents of the corresponding sample, respectively, with a “basic economic” motivation. Members of these groups in their decisions to improve
92
Foulum, 9-10 November 2006: Economic decisions in Farm Animal Health
mastitis on the farm are largely inclined to avoid basic economic losses, such as losses relating to milk production, treatment and culling. Compared with other farmers, they attach a significantly greater importance to “economic losses” (21.69% and 18.93% in the premium and penalty scenarios, respectively). An examination of the general farm characteristics did not detect significant differences across the identified farmers’ clusters in both the premium and penalty scenarios for all the main characteristics examined, namely, the number of dairy cows, milk quota, farm size, labour units, BMSCC, age of farmer and dairy farming experience. The same was largely true for the self-reported risk perceptions associated with mastitis management. Conclusions
Findings of this study emphasize the importance of looking at different factors that motivate farmers to adopt recommended practices and decrease BMSCC as well as looking across individual farmers. The individual-level approach presented in this research helps to understand the farmers’ primary motivating factors and to reveal the existing differences in farmers’ motivation.
In general, significant motivating factors are identified that are internal to the farm performance and the farmer himself, whereas external factors that imply esteem and awareness of the whole dairy sector performance provide little motivation to improve mastitis management. Internal nonmonetary factors relating to internal esteem and enjoying healthy animals on the farm are equally motivating as monetary factors affecting farm economic performance. The identified difference in farmers’ perception of importance of “extra financial incentive based on BMSCC” depending on whether farmers think in terms of quality premium or penalty for a lower and a higher BMSCC, respectively, suggests that farmers are expected to be more motivated by price decrease for milk with a higher BMSCC than by price increase for milk with a lower BMSCC. In this respect, the research demonstrates that understanding this effect of context on individual decision making is essential. Also, quality penalty system design tends to be more effective in motivating farmers than quality premium system design.
Individual differences in farmers’ perceptions result in 3 distinct groups according to farmers’ motivation to improve mastitis management: “premium/penalty-oriented” motivation, motivation to have “efficient (well-organized) farm that easily complies with regulatory requirements” and “basic economic” motivation. This is mainly stipulated by differently valued monetary factors relating to farm economic performance. These different motivations do not, however, notably reflect the characteristics of individual farmers and their risk perceptions of mastitis examined in this research. Further research needs to determine the reasons for differences in motivation patterns to be able to respond to emerged groups in the most effective way.
93

Foulum, 9-10 November 2006: Economic decisions in Farm Animal Health
Acknowledgements The authors want to thank Theo Lam (Dutch Udder Health Center), Harrie van den
Bijgaart (Dutch Milk Control Station), Steef Biesterveld and Johan Boelrijk (Campina), Geert Hegen (Friesland Foods) Theo Lam and Kirsten Huijps (Faculty of Veterinary Medicine) for their useful contribution in this study. References Agricultural Economics Research Institute, 2004. Network for Information on Dutch Farms
2004. Agricultural Economics Research Institute, The Hague (in Dutch), NL. Online. Available: http://www.lei.wur.nl/NL/statistieken/Binternet. Accessed March 23, 2006.
Agricultural Economics Research Institute, 2005. Network for Information on Dutch Farms 2005. Agricultural Economics Research Institute, The Hague (in Dutch), NL. Online. Available: http://www.lei.wur.nl/NL/statistieken/Binternet. Accessed March 23, 2006.
Cavazos, G.F., 2003. Useful ideas and principles for the implementation of reinforcement programs to keep milkers motivated. Pages 77-85 in Proc. Natl. Mastitis Counc., Fort Worth, TX. Natl. Mastitis Counc., Inc., Madison, WI.
Churchill, G.A., 1999. Marketing Research. Methodological Foundations. 7th ed. The Dryden Press, Fort Worth, TX.
Den Ouden, M., Nijsing, J.T., Dijkhuizen, A.A., Huirne, R.B.M., 1997. Economic optimization of pork production-marketing chains: I. Model input on animal welfare and costs." Livest. Prod. Sci. 48, 23-37.
Halasa, T., Huijps, K., Østerås, O., Hogeveen, H., 2006. Economic effects of mastitis and mastitis management: A review. Submitted for publication.
Horst, H.S., Huirne, R.B.M., Dijkhuizen, A.A., 1996. Eliciting the relative importance of risk factors concerning contagious animal diseases using conjoint analysis: A preliminary survey report." Prev. Vet. Med. 27, 183-95.
Kuiper, D., Jansen, J., Renes, R.J., Leeuwis, C., van der Zwaag, H., 2005. Social factors related to mastitis control practices: The role of dairy farmers' knowledge, attitude, values, behavior and networks. Pages 576-582 in Proc. 4th IDF Int. Mastitis Conf., H. Hogeveen, ed., Maastricht, NL. Wageningen Academic Publishers, Wageningen, NL.
Lattin, J.M., Carroll, J.D., Green, P.E., 2003. Analyzing Multivariate Data. 1st ed. Thomson Learning, Inc., Toronto, Canada.
Nightingale, C., Schukken, Y.H., 2005. The importance of a low SCC premium policy in the reduction of population wide SCC levels. Pages 558-563 in Proc. 4th IDF Int. Mastitis Conf., H. Hogeveen, ed., Maastricht, NL. Wageningen Academic Publishers, Wageningen, NL.
Rabin, M., 1998. Psychology and economics. J. Econ. Lit. 36, 11-46. Research Institute for Animal Husbandry, 2005. Quantitative Information Animal Husbandry
2005-2006. Research Institute for Animal Husbandry, Lelystad (in Dutch), NL. Rodrigues, A.C.O., Ruegg, P.L., 2005. Actions and outcomes of Wisconsin dairy farms
completing milk quality teams. J. Dairy Sci. 88, 2672-2680.
94

Foulum, 9-10 November 2006: Economic decisions in Farm Animal Health
Schukken, Y.H., Leslie, K.E., Weersink, A.J., Martin, S.W., 1992. Ontario bulk milk somatic cell count reduction program. 1. Impact on somatic cell counts and milk quality. J. Dairy Sci. 75, 3352-3358.
Sérieys, F., Blanche, F., 2005. Impact of epidemiological, zootechnical, managerial and price factors on the economic efficacy of subclinical mastitits treatment during lactation. Pages 224-231 in Proc. 4th IDF Int. Mastitis Conf., H. Hogeveen, ed., Maastricht, NL. Wageningen Academic Publishers, Wageningen, NL.
Valeeva, N.I., Meuwissen, M.P.M., Oude Lansink, A.G.J.M., Huirne, R.B.M., 2005. Improving food safety within the dairy chain: An application of conjoint analysis. J. Dairy Sci. 88, 1601-1612.
Valeeva, N.I., Hogeveen, H., Lam, T.J.G.M., 2006. Motivation of dairy farmers to improve mastitis management. Submitted for publication.
van Schaik, G., Green, L.E., Guzmán, D., Esparza, H., Tadich, N., 2005. Costs and benefits of improved milking practices in smallholder dairy farms in the 10th region of Chile. Pages 242-247 in Proc. 4th IDF Int. Mastitis Conf., H. Hogeveen, ed., Maastricht, NL. Wageningen Academic Publishers, Wageningen, NL.
95

Foulum, 9-10 November 2006: Economic decisions in Farm Animal Health
96
Foulum, 9-10 November 2006: Economic decisions in Farm Animal Health
General discussion
Workshop presentations by PhD-students The twelve presenting students were asked to split up in groups with common interests
within AHE with the purpose of identifying and discussing common challenges and problems within their specific area. Senior scientists divided themselves over the different groups based on their own skills and preferences. If possible, a future project joining the skills and interests of all group members should be suggested. The presentations of the four groups on the following day were very different and resulted in several good discussion points that were elaborated on below in “themes of discussion”:
Group 1 (Kirsten, Claudia, Bouda) had a common interest in focus on the end-user, and how to include farmers’ preferences in economic models. They formulated a project on decision support for farmers considering investing in AMS or an alternative. Group 2 (Lan, Natasha, Jehan) discussed subjects such as social welfare functions, multicriteria analyses, dynamics decision processes, Markov Chain Monte Carlo and Bayesian updating. Group 3 (Christel, Mogens, Hanneke, Tariq) discussed the modelling of diseases: How to choose the correct model - complex vs. simple models. Group 4 (Clara, Wilma, Tina, Erling) raised the questions: Why do we accept incomplete models? How to choose an expert for an expert panel (the latter was not discussed further). Main themes of discussion based on workshops and general discussion Should a PhD-study be fundamental or innovative?
The presented PhD-studies were very different and it was questioned if “adding something” to others work is fundamental or innovative. It can be difficult to define yourself as researcher within the area of Animal Health Economics. On the other hand, it is a new field where it is possible to be innovative. Building your own model is a good learning process and is a guarantee for getting ownership of the project. However, you soon run into problems calling for more complex models. Therefore the capabilities of existing models should be utilized and then it can be decided if a new model is needed or the existing one can be further developed/supplemented. Students with an economic background found it difficult to apply fundamental general economics to AHE and it was concluded that research within the field of AHE is in general not fundamental.
97
Foulum, 9-10 November 2006: Economic decisions in Farm Animal Health
Why do we accept incomplete models? – The balance between simplicity and complexity When building a model there is always a lack of knowledge. It is important to be open and
present the reasons for including/excluding parameters. Explain what can and what cannot be done with the model, so that the user doesn’t get disappointed. It is tempting to add more and more parameters to a model, however, it should only be done if you are absolutely sure that it is necessary for the problem in question. Define what you want from the model before you build it, and remember that a model should tell a story. It was discussed if all disease models could be based on one general model. All models include a basic core of e.g. feeding which could be used in all models. However, with a general disease model you would soon run into its limits when answering specific question on e.g. interactions. So modelling needs a purpose, which will often focus on a specific disease including risk factors and effects. How do we ensure that our models will be implemented?
When building models the first things to consider are: who are the end-users? What is asked for – and who makes the decisions? Models should be developed in collaboration with the end-users whether it is researchers or farmers. Work in the field is needed to get a realistic picture of ‘the systems of concern’ for improving the input for the model. The choice of model should be based on what the end-users trust. There will always be a risk that additional complexity will turn the model into a suspicious black box, which will not be used by the expected end-user. Verification and validation of models
Verification: does the model behave as intended? Validation: does the model reflect the real world? Elements of the model and the
correspondence of the model with the real world should be validated, but not the algorithms; they have been proven before, it is the context in which they are used that should be validated. When does research fall within the area of AHE and what is Animal Health Economics?
– Does the word “Health” need to be included? We need models for healthy animals for Animal Economics. Then we could add the disease aspect. It was questioned if the first step “data analysis to obtain model input” really was a part of AHE as it only covers a little part of the process and has a more mathematical approach. Utility functions were claimed to play a more central role in AHE. However, data analysis is still the first step and a valuable part of the modelling process. The role of AHE in society seems to be to constitute an important line between the decision supporter and the decision maker. In other words: The risk assessor contra the risk taker. A very important issue is responsibility. In case of decision support leading to advice which turned out to be bad – who is responsible, and who is going to carry the losses? Concerning decision support at a national level the question of responsibility is even more important. As long as we are not sure how the farmers act, we cannot apply our models to a national level.
98
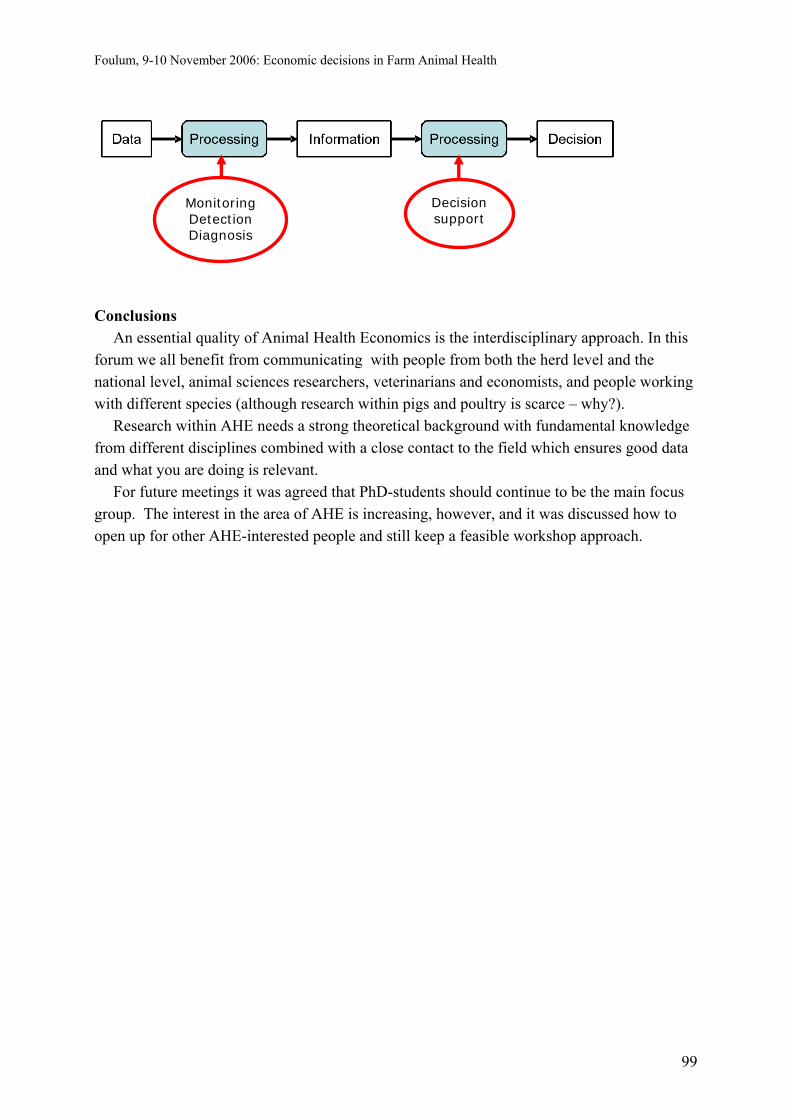
Foulum, 9-10 November 2006: Economic decisions in Farm Animal Health
Decision support
Detection Diagnosis
Monitoring
Conclusions
An essential quality of Animal Health Economics is the interdisciplinary approach. In this forum we all benefit from communicating with people from both the herd level and the national level, animal sciences researchers, veterinarians and economists, and people working with different species (although research within pigs and poultry is scarce – why?).
Research within AHE needs a strong theoretical background with fundamental knowledge from different disciplines combined with a close contact to the field which ensures good data and what you are doing is relevant.
For future meetings it was agreed that PhD-students should continue to be the main focus group. The interest in the area of AHE is increasing, however, and it was discussed how to open up for other AHE-interested people and still keep a feasible workshop approach.
99

Foulum, 9-10 November 2006: Economic decisions in Farm Animal Health
100

Foulum, 9-10 November 2006: Economic decisions in Farm Animal Health
Participants and contact information
Danish Institute of Agricultural Sciences Research Centre Foulum PO Box 50 DK-8830 Tjele Denmark Department of Animal Health, Welfare and Nutrition www.agrsci.dk/sve Herd Health and Production Management Jan Tind Sørensen [email protected] Søren Østergaard [email protected] Anne Braad Kudahl [email protected] Jehan Ettema [email protected] Erling Kristensen [email protected] Disease Mechanisms, -markers and -prevention Torben Bennedsgaard [email protected] Department of Genetics and Biotechnology www.agrsci.dk/gbi Statistics and Decision Analysis Erik Jørgensen [email protected] Lars Relund Nielsen [email protected] University of Copenhagen, Faculty of Life Sciences Bülowsvej 17 DK-1870 Frederiksberg C Denmark Department of Large Animal Sciences www.iph.kvl.dk Carsten Enevoldsen [email protected] Hans Houe [email protected] Tina Birk Jensen [email protected] Liza Rosenbaum Nielsen [email protected] Helle Stege [email protected] Anders Ringgaard Kristensen [email protected] Mogens Krogh [email protected] Institute of Food and Resource Economics Lars Otto [email protected] www.foi.kvl.dk Wageningen University and Research Centre PO Box 8130 6706 KN Wageningen The Netherlands Business Economics Group www.bec.wur.nl Henk Hogeveen [email protected] Helmut Saatkamp [email protected] Natasha Longworth [email protected] Ge Lan [email protected] Bouda Vosough Ahmadi [email protected]
101

Foulum, 9-10 November 2006: Economic decisions in Farm Animal Health
Utrecht University Postbus 80163 3508 TD Utrecht The Netherlands Faculty of Veterinary Sciences www.vet.uu.nl Tariq Halasa [email protected] Kirsten Huijps [email protected] Claudia Kamphuis [email protected] Wilma Steeneveld [email protected] Hanneke van Wichen [email protected] INRA-National Veterinary School of Nantes Atlanpole - La Chantrerie BP 40706 44307 Nantes cedex 3 France Department of Farm Animal Health and Public Health www.vet-nantes.fr Christine Fourichon [email protected] Stéphane Krebs [email protected] Clara Marcé [email protected] Swedish University of Agricultural Sciences Box 7023 750 07 Uppsala Sweden Department of Animal Breeding and Genetics www.hgen.slu.se Christel Hagnestam [email protected] Ulf Emanuelson [email protected] Danish Meat Association Vinkelvej 11 DK-8620 Kjellerup Denmark Danish Pig Production www.dansksvineproduktion.dk Niels Peter Baadsgaard [email protected]
102
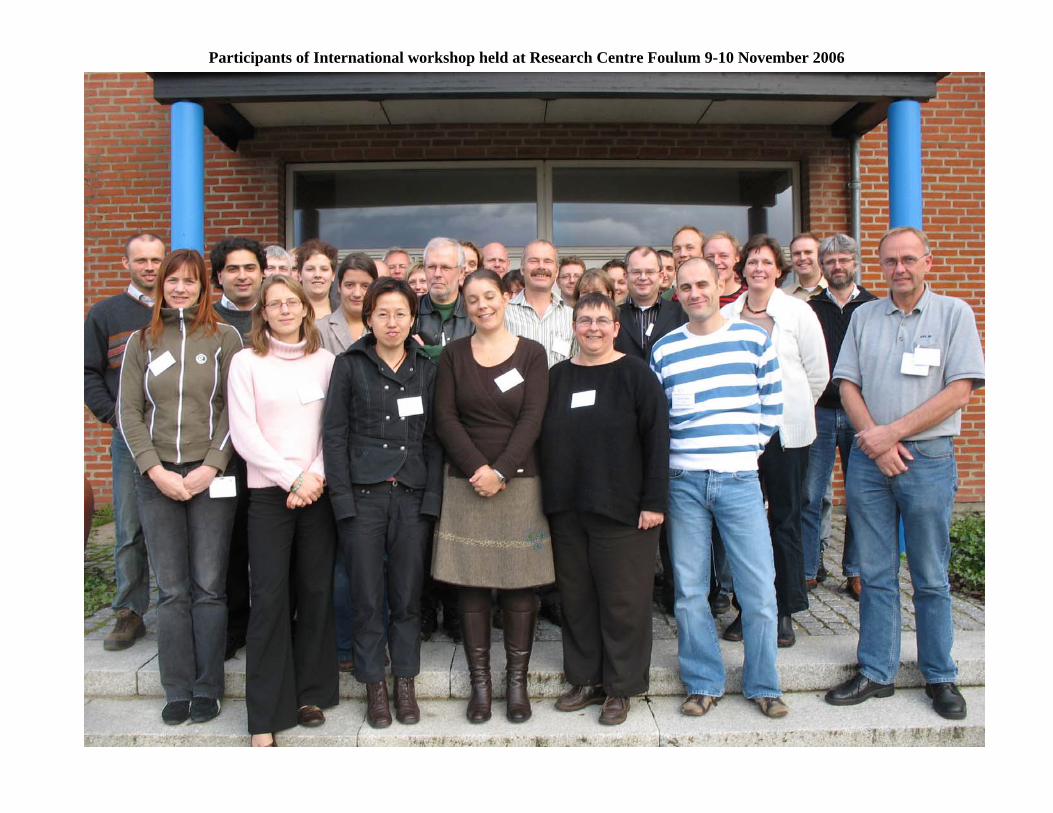
Participants of International workshop held at Research Centre Foulum 9-10 November 2006
Plant science Horticulture animal science
Grøn Viden is published by the Faculty of Agricultural Sciences (DJF) at the University of Aarhus and is issued in separate Horticulture, Plant Sci-ence and Animal Science farming series. For more information on our publications please visit our website www.agrsci.org
SUM
MA
RY
Animal health economics deals with quantifying the economic effects of animal dis-ease, decision support tools in animal health management and further analysis of the management’s impact at animal, herd or national level. Scientists from The Netherlands, France and Sweden have since 1988 organised in-formal workshops to exchange their knowledge and expertise in this field of science. This report contains the summary of the presentations given by 12 PhD students and 2 senior scientists of the Animal Health Economics workshops which was held on the 9th and 10th of November, 2006 at the Research Centre Foulum in Denmark. Dif-ferent disciplines and approaches within Animal Health Economics are dealt with by the different scientists and the report contains a variety of novel results and projects. The resulting discussion is summarized in the report.
Markbrug nr. 301 • November 2004
Lars Monrad Hansen, Peter Esbjerg, Ghita C. Nielsen,
Brian Larsen og Christiane Scheel
Majsrodbillen
Markbrug nr. 301 • N
ovember 2004
Grøn VidenMarkbrug nr. 304 • December 20048
Grøn Viden indeholder informationer
fra Danmarks JordbrugsForskning.
Grøn Viden udkommer i en mark-,
en husdyr- og en havebrugsserie, der
alle henvender sig til konsulenter og
interesserede jordbrugere.
Abonnement tegnes hos
Danmarks JordbrugsForskning
Forskningscenter Foulum
Postboks 50, 8830 Tjele
Tlf. 89 99 10 28 / www.agrsci.dk
Prisen for 2005:
Markbrugsserien kr. 272,50
Husdyrbrugsserien kr. 225,00
Havebrugsserien kr. 187,50.
Adresseændringer meddeles særskilt
til postvæsenet.
Michael Laustsen (ansv. red.)
Layout og tryk:
DigiSource Danmark A/S
ISSN 1397-985X
Forfattere:
Karen Søegaard
Afdeling for Jordbrugsproduktion og
Miljø
Forsidefoto: Maarten van Leeuwen
Generelt
Hvis der er en høj kløverandel i marken, giver det gode
muligheder for at bruge kløveren som en buffer i plan-
lægningen både for at maksimere N-responsen og for at
manipulere med produktionsprofi len.
N-responsen kan forbedres hvis:
• Marker med lav kløverandel prioriteres frem for marker
med høj kløverandel
• 1.års marker prioriteres
• Ved afgræsning kun at tilføre N i den første halvdel af
sæsonen
Hvis kløvergræsset skal benyttes det kommende år, kan
overvintringen forbedres, hvis kløvergræsset afgræsses
frem for slættes, eller hvis N tilføres i starten af vækstsæ-
sonen.
Markbrug nr. 304 • December 2004
Karen Søegaard
Kvælstofgødskning af kløvergræsmarker
Markbrug nr. 304 • D
ecember 2004
Grøn Viden
Markbrug nr. 298 • Oktober 2004
20
Grøn Viden indeholder informationer
fra Danmarks JordbrugsForskning.Grøn Viden udkommer i en mark-, en
husdyr- og en havebrugsserie, der alle
henvender sig til konsulenter og inter-
esserede jordbrugere.Abonnement tegnes hos Danmarks JordbrugsForskningForskningscenter FoulumPostboks 50, 8830 TjeleTlf. 89 99 10 28 / www.agrsci.dkPrisen for 2004: Markbrugsserien kr. 272,50
Husdyrbrugsserien kr. 225,00Havebrugsserien kr. 187,50.Adresseændringer meddeles særskilt til
postvæsenet.Michael Laustsen (ansv. red.)Layout og tryk: DigiSource Danmark A/S
ISSN 1397-985X
Forfattere:
M. Askegaard1, J.E. Olesen1,I.A. Rasmussen2, E. Driessen2,E. Nielsen3, H.C. Thomsen3,H. Bak1 og J.F. Lindberg4.1Afd. for Jordbrugsproduktion og Miljø, DJF
2Afd. for Plantebeskyttelse, DJF3Afd. for Mark- og Stalddrift, DJF
4Grønt Center, HolebyFotos:Henning C. Thomsen
Markbrug nr. 298 • Oktober 2004
M. Askegaard, J.E. Olesen, I.A. Rasmussen, E. Driessen,
E. Nielsen, H.C. Thomsen, H. Bak og J.F. Lindberg.
Økologiske sædskifter til produktion af korn
Markbrug nr. 298 • O
ktober 2004
Grøn Viden
Husdyrbrug nr. 38 • Juli 20048
Grøn Viden indeholder informationer
fra Danmarks JordbrugsForskning.
Grøn Viden udkommer i en mark-, en
husdyr- og en havebrugsserie, der alle
henvender sig til konsulenter og inter-
esserede jordbrugere.
Abonnement tegnes hos
Danmarks JordbrugsForskning
Forskningscenter Foulum
Postboks 50, 8830 Tjele
Tlf. 89 99 10 28 / www.agrsci.dk
Prisen for 2004:
Markbrugsserien kr. 272,50
Husdyrbrugsserien kr. 225,00
Havebrugsserien kr. 187,50.
Adresseændringer meddeles særskilt til
postvæsenet.
Michael Laustsen (ansv. red.)
Layout og tryk:
DigiSource Danmark A/S
ISSN 1397-9868
Husdyrbrug nr. 38 • Juli 2004
Karin Strudsholm
Afdeling for Jordbrugsproduktion og Miljø
Slagtekvalitet og sygdomsfund
hos økologiske slagtesvin
Husdyrbrug nr. 38 • Juli 2004
Grøn Viden
Ministeriet for Fødevarer, Landbrug og Fiskeri
Danmarks JordbrugsForskning
Husdyrbrug nr. 41 • December 2004
Peter Sørensen, Martin R. Weisbjerg og Peter Lund
Fodringens betydning for udnyttelsen
af kvælstof i kvæggylle
Husdyrbrug nr. 41 • D
ecember 2004
Grøn VidenMarkbrug nr. 295 •Juni 2004
Per Schjønning
Langtidseffekter af halmnedmuldning
Markbrug nr. 295 • Juni 2004
Grøn Viden
Ministeriet for Fødevarer, Landbrug og Fiskeri
Danmarks JordbrugsForskning