Embed Size (px)
Citation preview
personal
UNIVERSITY OF PITTSBURGH
[NAME OF THE SCHOOL]
This [thesis/dissertation] was presented
by
[author’s name]
It was defended on
[Month date, year]
and approved by
[Committee Member’s Name, Academic Rank, Departmental Affiliation]
[Committee Member’s Name, Academic Rank, Departmental Affiliation]
[Committee Member’s Name, Academic Rank, Departmental Affiliation]
[Thesis Director/Dissertation Advisor]: [Name, Academic Rank, Departmental
Affiliation]
ECONOMIC DIFFERENTIATION IN
HONGSHAN CORE ZONE COMMUNITIES
(NORTHEASTERN CHINA):
A GEOCHEMICAL PERSPECTIVE
by
Tao Li
B. S., Northwest University (China), 2004
M. A., University of Science and Technology of China (China), 2007
D. Sc., University of Chinese Academy of Sciences (China), 2010
Submitted to the Graduate Faculty of
The Kenneth P. Dietrich School of Arts and Sciences
in partial fulfillment of the requirements for the degree of
Doctor of Philosophy
University of Pittsburgh
2016
ii
UNIVERSITY OF PITTSBURGH
KENNETH P. DIETRICH SCHOOL OF ARTS AND SCIENCES
This dissertation was presented
by
Tao Li
It was defended on
February 29th, 2016
and approved by
Bryan K. Hanks, PhD, Associate Professor, Anthropology
Katheryn M. Linduff, PhD, Professor, History of Art and Architecture
Loukas W. Barton, PhD, Assistant Professor, Anthropology
Chair & Dissertation Advisor:
Robert D. Drennan, PhD, Distinguished Professor, Anthropology
iii
Copyright © by Tao Li
2016
iv
Region-wide, systematic investigations were carried out in the Hongshan
periphery and core zone to investigate how the earliest chiefly polities in
northeastern China came into being. Possible causal factors, such as high
levels of regional populations and intra-community conflict, were rejected by
those regional survey projects. Economic or productive differentiation as an
alternative and plausible explanation was proposed in this research
background to explain the greater and more impressive material culture in
the Hongshan core zone. Seeing pottery networks as a most direct indicator
for economic interdependence between households, a geochemical study was
carried out on 715 sherds selected from 16 Hongshan households in three
residential areas (Sanjia, Dongshanzui, and Erbuchi) in the core zone. The
geochemical study was complemented by a mineralogical investigation on a
smaller sample from the same sherd pool.
Economic Differentiation in Hongshan Core Zone
Communities (Northeastern China):
A Geochemical Perspective
Tao Li, PhD
University of Pittsburgh, 2016
v
The results suggested that pottery-making was organized in different
residential areas using local raw materials; non-utilitarian vessels were
clearly produced with more labor investment and probably a low level of
specialization, but they were no different from utilitarian ones in terms of
procurement sources of pottery raw materials. Altogether, an ordinary
Neolithic village economy is indicated for Hongshan core zone communities.
The pottery distribution patterns suggested a wide and open pottery
network crossing different neighborhoods, residential areas, and political
entities. Economic connections were clearly established between Hongshan
households from a few nearby districts, and the transfer of pottery created a
chain of interaction that connected one end of the Hongshan zone to the other
indirectly and facilitated cultural sharing of styles and other behaviors that
helped create the Hongshan culture. In each residential area, a very few
households stood out against others for their higher household status, and
they all demonstrated a much stronger economic tie with fewer pottery
producers. Yet, considering that higher-status households did not have
exclusive access to certain pottery producers and nor did they rely strongly on
the same producers, control over production and distribution of pottery seems
not likely to be the only (or even a major) strategy that some Hongshan
individuals or households employed to achieve their eliteness or power.
vi
TABLE OF CONTENTS
TABLE OF CONTENTS .................................................................................. VI
LIST OF TABLES ............................................................................................ X
LIST OF FIGURES ......................................................................................... XI
ACKNOWLEDGMENTS .............................................................................. XIII
1. INTRODUCTION ........................................................................................ 1
1.1 Hongshan societies in northeastern China .......................................... 1
1.2 Hongshan core zone and periphery ....................................................... 4
1.3 Causes for the core zone’s greater expression of material culture...... 7
1.4 Economic differentiation in Hongshan core zone communities ........ 10
1.5 Research questions to be investigated in this dissertation ............... 12
1.5.1 Research Question 1 .................................................................. 15
1.5.2 Research Question 2 .................................................................. 17
1.5.3 Research Question 3 .................................................................. 19
1.5.4 Research Question 4 .................................................................. 21
1.5.5 Research Question 5 .................................................................. 22
1.5.6 Additional Research Questions ................................................. 23
vii
2. MATERIALS AND METHODOLOGY ...................................................... 26
2.1 Materials: sherds from Hongshan core zone communities ................ 26
2.1.1 Hongshan core zone pottery: forms and functions ................... 27
2.1.2 Households identified by the upper Daling project ................. 30
2.2 Analytical approaches for sourcing Hongshan pottery ...................... 35
2.2.1 Differentiating pottery by their possible sources ..................... 35
2.2.2 Underlying assumptions for ‘sourcing’ pottery ........................ 37
2.2.3 Possible way of producing pottery in Hongshan times ............ 40
2.2.4 Analytical approaches for extracting geochemical data .......... 41
2.3 Establishing methodology by a series of pilot studies ....................... 44
2.3.1 Selection of 27 Hongshan core zone sherds .............................. 44
2.3.2 Pretreatment of sherd samples and instrumentation ............. 47
2.3.3 Detected elements and concentrations ..................................... 51
2.3.4 HCA of standardized ICP-AES, XRF, and pXRF data ............ 62
2.3.5 Determining the final methodology .......................................... 72
2.4 Sampling of Hongshan core zone sherds for pXRF analysis ............. 75
2.5 Experiment for performing pXRF analysis ........................................ 78
3. STATISTICAL ANALYSES OF COMPOSITIONAL DATA ..................... 83
3.1 Preprocessing of pXRF data ................................................................ 83
3.2 HCA and MDSCAL for data exploratory analysis ............................. 87
3.3 Dendrograms and delineation of production source units................. 91
viii
3.3.1 General patterns noticed on produced dendrograms ............... 91
3.3.2 Delineation of production source units ..................................... 95
3.4 Proportions of PSUs represented at each household ......................... 97
3.5 Summary ............................................................................................ 103
4. MINERAL PHASE ANALYSIS: A COMPLEMENTARY STUDY .......... 105
4.1 The importance of mineralogical data .............................................. 105
4.2 Obtaining mineralogical information ............................................... 107
4.3 Purpose of applying PXRD to Hongshan sherds .............................. 109
4.4 Selection and preparation of 171 sherds for PXRD analysis .......... 110
4.5 Results and Discussion ...................................................................... 117
4.5.1 Identified minerals in the 171 tested sherds ......................... 117
4.5.2 Mineralogical variations among the 12 PSUs ........................ 121
4.5.3 Mineraological difference among sherds or areas .................. 123
4.6 Summary ............................................................................................ 126
5. UNDERSTANDING ECONOMIC DIFFERENTIATION THROUGH
POTTERY PROCUREMENT .................................................................. 128
5.1 Response to Research Question 1 ..................................................... 128
5.2 Response to Research Question 2 ..................................................... 132
5.3 Response to Research Question 3 ..................................................... 138
5.4 Response to Research Question 4 ..................................................... 139
5.5 Response to Research Question 5 ..................................................... 148
ix
5.6 Response to Additional Research Question 1 ................................... 152
5.7 Response to Additional Research Question 2 ................................... 159
5.8 Summary ............................................................................................ 169
APPENDIX. ELECTRONIC ACCESS TO DATASETS AND IMAGES ....... 172
BIBLIOGRAPHY ........................................................................................... 173
x
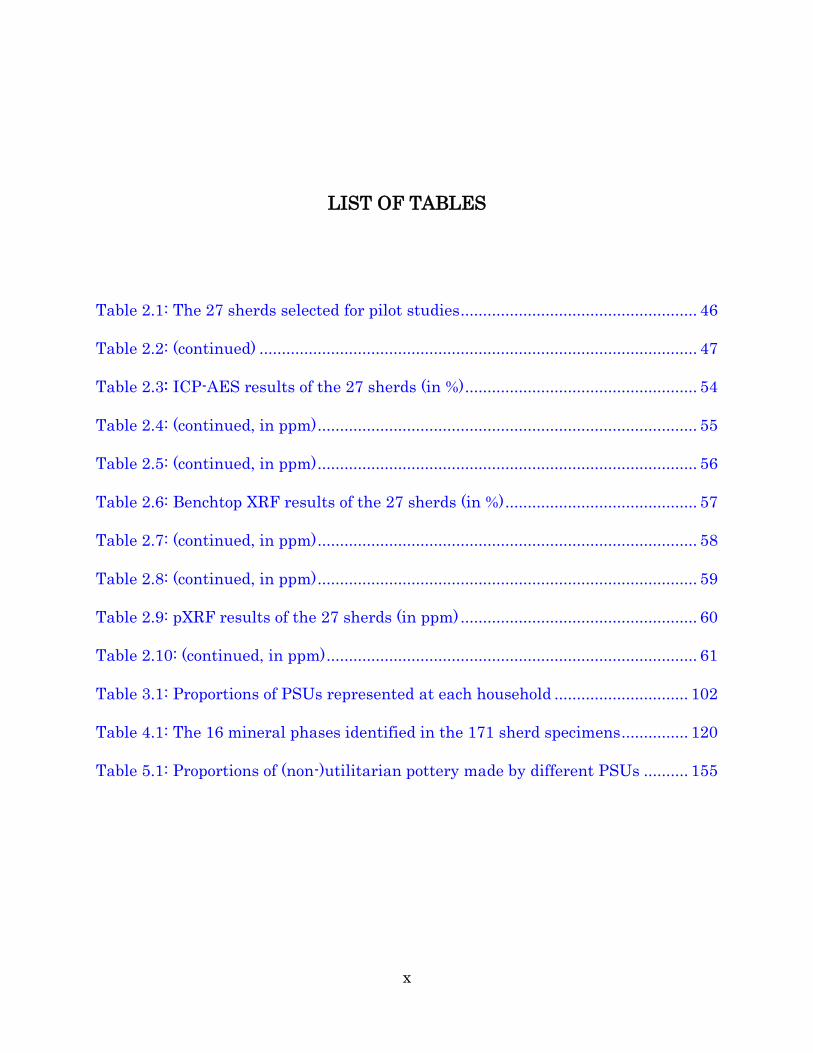
LIST OF TABLES
Table 2.1: The 27 sherds selected for pilot studies ..................................................... 46
Table 2.2: (continued) .................................................................................................. 47
Table 2.3: ICP-AES results of the 27 sherds (in %) .................................................... 54
Table 2.4: (continued, in ppm) ..................................................................................... 55
Table 2.5: (continued, in ppm) ..................................................................................... 56
Table 2.6: Benchtop XRF results of the 27 sherds (in %) ........................................... 57
Table 2.7: (continued, in ppm) ..................................................................................... 58
Table 2.8: (continued, in ppm) ..................................................................................... 59
Table 2.9: pXRF results of the 27 sherds (in ppm) ..................................................... 60
Table 2.10: (continued, in ppm) ................................................................................... 61
Table 3.1: Proportions of PSUs represented at each household .............................. 102
Table 4.1: The 16 mineral phases identified in the 171 sherd specimens ............... 120
Table 5.1: Proportions of (non-)utilitarian pottery made by different PSUs .......... 155
xi
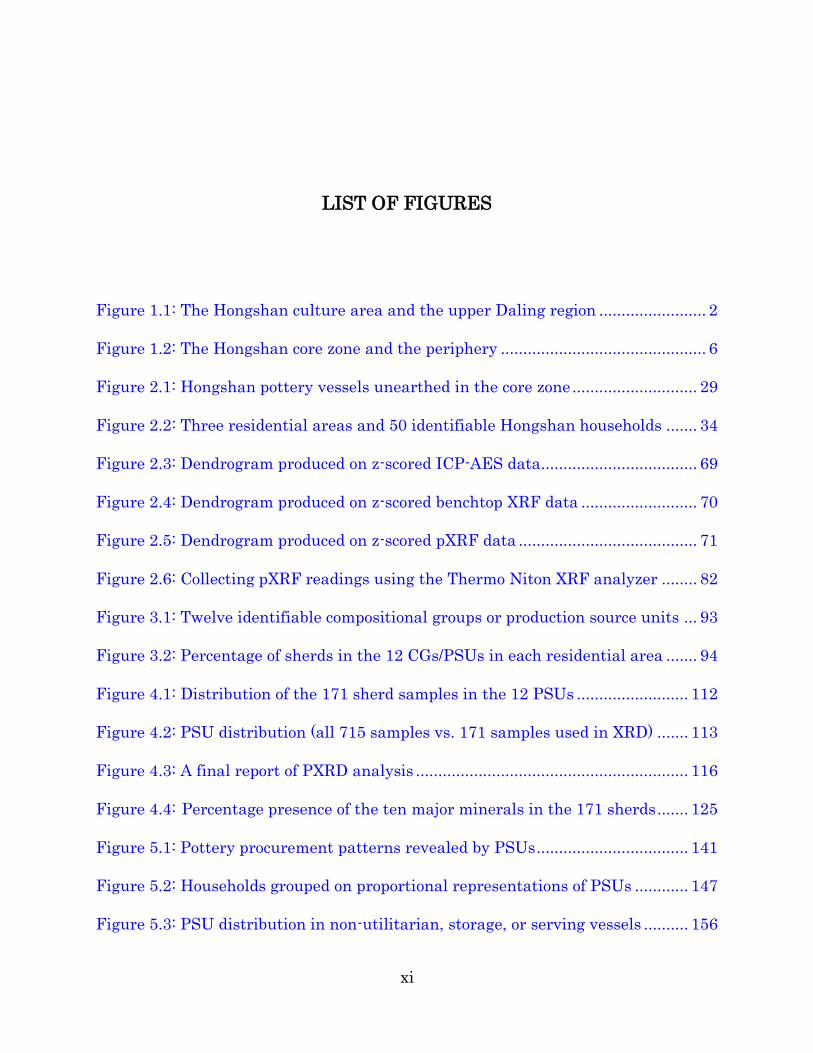
LIST OF FIGURES
Figure 1.1: The Hongshan culture area and the upper Daling region ........................ 2
Figure 1.2: The Hongshan core zone and the periphery .............................................. 6
Figure 2.1: Hongshan pottery vessels unearthed in the core zone ............................ 29
Figure 2.2: Three residential areas and 50 identifiable Hongshan households ....... 34
Figure 2.3: Dendrogram produced on z-scored ICP-AES data ................................... 69
Figure 2.4: Dendrogram produced on z-scored benchtop XRF data .......................... 70
Figure 2.5: Dendrogram produced on z-scored pXRF data ........................................ 71
Figure 2.6: Collecting pXRF readings using the Thermo Niton XRF analyzer ........ 82
Figure 3.1: Twelve identifiable compositional groups or production source units ... 93
Figure 3.2: Percentage of sherds in the 12 CGs/PSUs in each residential area ....... 94
Figure 4.1: Distribution of the 171 sherd samples in the 12 PSUs ......................... 112
Figure 4.2: PSU distribution (all 715 samples vs. 171 samples used in XRD) ....... 113
Figure 4.3: A final report of PXRD analysis ............................................................. 116
Figure 4.4: Percentage presence of the ten major minerals in the 171 sherds ....... 125
Figure 5.1: Pottery procurement patterns revealed by PSUs .................................. 141
Figure 5.2: Households grouped on proportional representations of PSUs ............ 147
Figure 5.3: PSU distribution in non-utilitarian, storage, or serving vessels .......... 156
xii
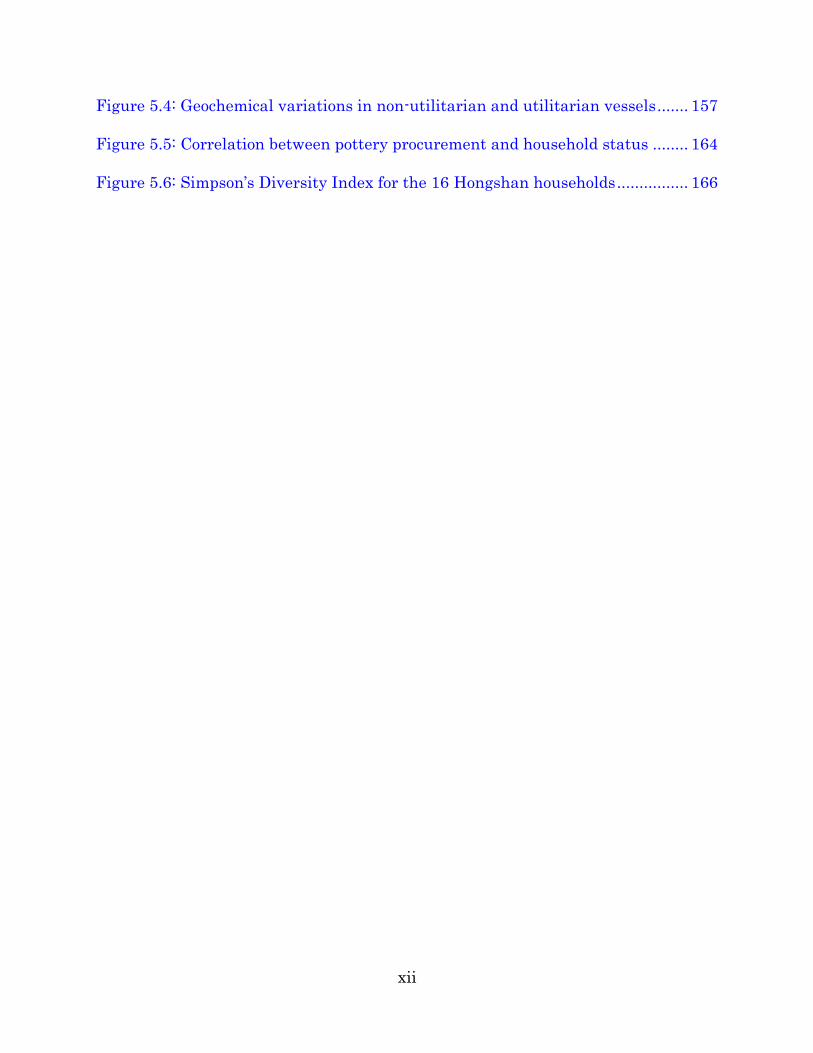
Figure 5.4: Geochemical variations in non-utilitarian and utilitarian vessels ....... 157
Figure 5.5: Correlation between pottery procurement and household status ........ 164
Figure 5.6: Simpson’s Diversity Index for the 16 Hongshan households ................ 166
xiii
ACKNOWLEDGMENTS
First of all, I would like to express my sincerest appreciation to Professor
Robert D. Drennan, my dissertation advisor and a great mentor. Throughout
my entire PhD life at Pitt, Professor Drennan has always been supportive,
caring, and ready for discussion, advice, and help. The weekly meetings and
informal communication (emails, short conversations during trips and on
dining tables, etc.) between Professor Drennan and I have allowed me to
make consistent progress on (and finally be able to finish) my PhD
dissertation. I would also like to thank my other committee members—
Professors Bryan K. Hanks (Anthropology), Katheryn M. Linduff (History of
Art and Architecture), and Loukas W. Barton (Anthropology)—for their keen
observations on the weakness in some of my arguments and constructive
suggestions on how to improve the coherence and clarity of my statements.
Dr. Christian E. Peterson (Department of Anthropology, University of
Hawaii at Manoa) made a big contribution to my PhD project at the
Niuheliang Workstation in western Liaoning. Without his help in ceramic
identification and fruitful discussions, the sample size would be a lot smaller
xiv
and the stratified sampling of Hongshan core zone sherds would not have
been done within a few weeks. I want to thank Dr. LUO Wugan (University
of Chinese Academy of Sciences) for his patience and good suggestions while I
had trouble with the pXRF analysis. Professor LU Xueming (Renmin
University of China) and Mr. ZHU Da, director of the Niuheliang
Workstation, answered my questions on Hongshan material culture, and took
good care of us (food and accommodation) during our stay at the Niuheliang
Workstation. Professor WANG Changsui, my former advisor, and Dr. ZHU
Jian (both from University of Chinese Academy of Sciences) shared important
ideas about sourcing pottery geochemically since the beginning of my PhD
project. Dr. ZHU Jian and his students prepared a small sample of Hongshan
sherds and carried out the ICP-AES and benchtop XRF analyses, the results
of which later helped me make the final decision on which methodology I
would like to apply to the 715 Hongshan sherds.
I would like to give special thanks to my fellow graduate students at
Pitt: James Williams, Camilla Kelsoe, Pedro María Argüello García, Julia
Clark, Adam Berrey, Sebastian Fajardo, Francisco Garrido, Hugo Ikehara, LI
Dongdong, Ng Chuen Yan, CHEN Peiyu, WANG Wenjing, CAI Yan, ZHAO
Chao, QIU Yijia, ZHANG Chi, and RAN Weiyu. I would also like to thank the
Chinese visiting students at Pitt’s departments of Anthropology and History
of Art and Architecture (BI Jingwei, HONG Meng, SONG Haichao, LI Moran,
xv
LIU Yuanqing, FAN Xiaopan, and HAO Yuanlin) and my landlord,
roommates, and friends (Ms. Kathy BAI; LIU Gangqiang, HE Qixin, XU Yi,
YANG Wang, ZHAO Heng, WEI Yanjun, GUO Chuanyu, and WANG
Xiangnyu) for their kindness, understanding, and support.
Finally, I would like to thank my family. My parents have always
respected and supported every decision I have made. My sisters and their in-
laws have been taken good care of my mother while she is fighting against
cancer. My little nephew, Pipi, has been the cutest bundle of joy. My face
would always lighten when watching the video of his swimming with a swim
ring at one month of age. Their unconditional love and care helped me go
through difficult times. Without them, I would not have gone this far.
Completion of this dissertation would not have been possible without
financial support from the National Science Foundation’s Doctoral
Dissertation Improvement Grant (NSF DDIG, grant no.: BCS1444978).
1
1. INTRODUCTION
1.1 Hongshan societies in northeastern China
During Hongshan times (4500–3000 BCE), fairly dramatic sociopolitical
and economic changes took place in northeastern China (western
Liaoning and eastern Inner Mongolia in particular). Decades of
progressive archaeological excavations in this very broad region have
revealed Hongshan public architecture (platforms thought to be used as
temples and altars) and burials often associated with elaborate
offerings (jade finely carved with supernatural themes). Both the public
architecture and burials are quite impressive compared to
contemporaneous late Neolithic remains elsewhere (e.g., Yangshao and
Dawenkou sites in the Yellow River valley), and had made Hongshan
remains stand out as special and unique in prehistoric China (Nelson
2003:13-14).
2
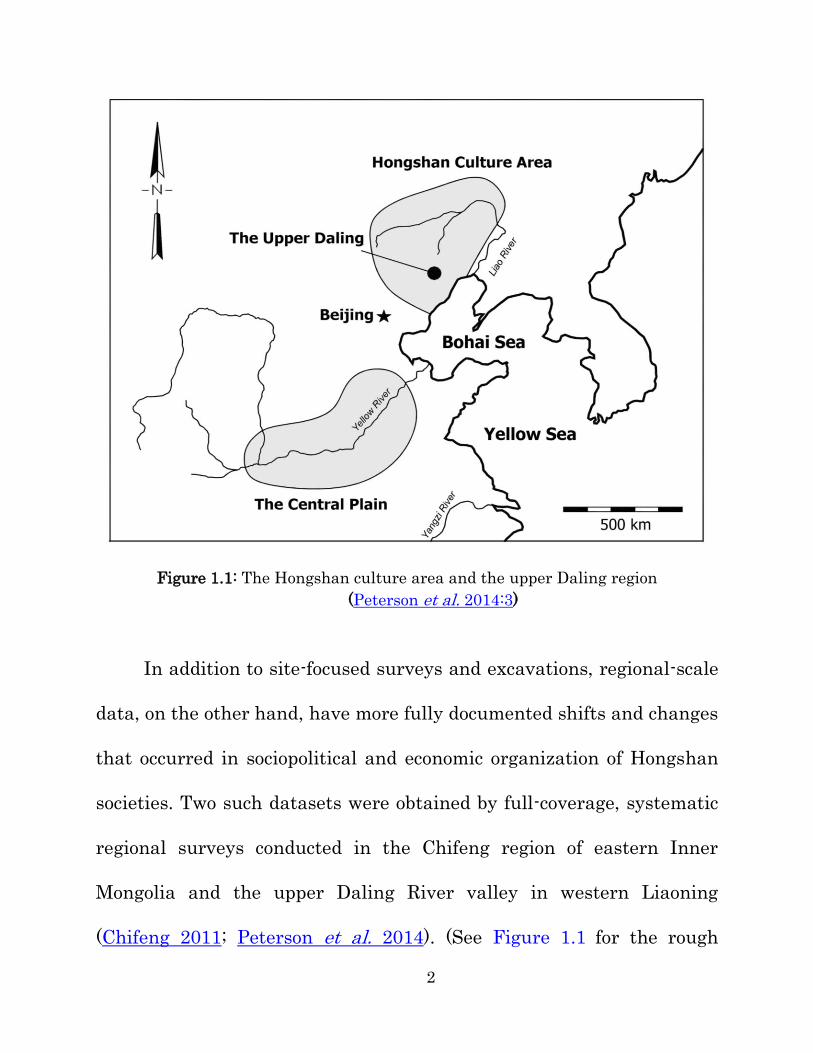
Figure 1.1: The Hongshan culture area and the upper Daling region
(Peterson et al. 2014:3)
In addition to site-focused surveys and excavations, regional-scale
data, on the other hand, have more fully documented shifts and changes
that occurred in sociopolitical and economic organization of Hongshan
societies. Two such datasets were obtained by full-coverage, systematic
regional surveys conducted in the Chifeng region of eastern Inner
Mongolia and the upper Daling River valley in western Liaoning
(Chifeng 2011; Peterson et al. 2014). (See Figure 1.1 for the rough
3
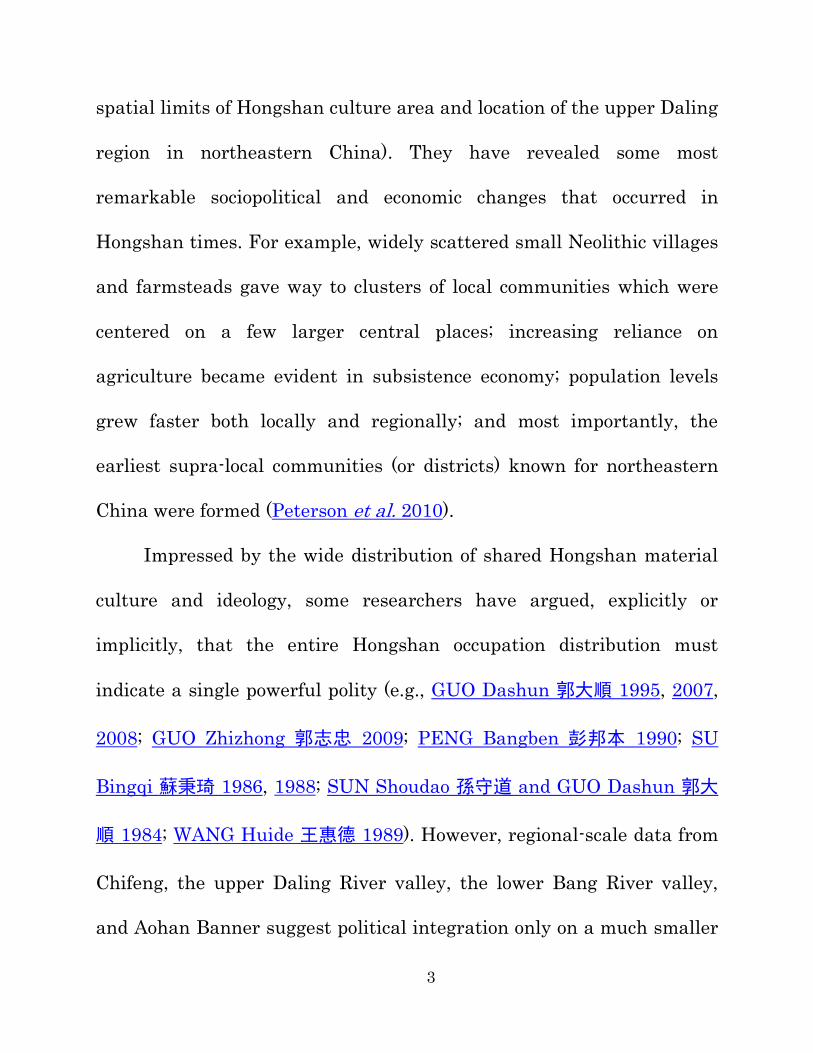
spatial limits of Hongshan culture area and location of the upper Daling
region in northeastern China). They have revealed some most
remarkable sociopolitical and economic changes that occurred in
Hongshan times. For example, widely scattered small Neolithic villages
and farmsteads gave way to clusters of local communities which were
centered on a few larger central places; increasing reliance on
agriculture became evident in subsistence economy; population levels
grew faster both locally and regionally; and most importantly, the
earliest supra-local communities (or districts) known for northeastern
China were formed (Peterson et al. 2010).
Impressed by the wide distribution of shared Hongshan material
culture and ideology, some researchers have argued, explicitly or
implicitly, that the entire Hongshan occupation distribution must
indicate a single powerful polity (e.g., GUO Dashun 郭大順 1995, 2007,
2008; GUO Zhizhong 郭志忠 2009; PENG Bangben 彭邦本 1990; SU
Bingqi 蘇秉琦 1986, 1988; SUN Shoudao 孫守道 and GUO Dashun 郭大
順 1984; WANG Huide 王惠德 1989). However, regional-scale data from
Chifeng, the upper Daling River valley, the lower Bang River valley,
and Aohan Banner suggest political integration only on a much smaller
4
scale. Each of these regional survey projects have identified a great
many small Hongshan polities and found no sign of larger or more
central districts that dominated others. Therefore, overall sociopolitical
integration or centralization of the entire Hongshan culture area was
not supported. It is suggested for the reasons described above that these
small Hongshan polities can be loosely referred to as chiefdoms
(Drennan and Peterson 2006; Peterson 2006). Many scholars (e.g.,
Peterson and LU Xueming 呂學明 2013) have seen the individuals
buried under platforms with symbolically carved jades as important
Hongshan ritual specialists, and since each small district or chiefly
polity appears to have such ritual facilities at its center, Hongshan
political organization has been seen as relying relatively heavily on
religious authority (Drennan and Peterson 2006).
1.2 Hongshan core zone and periphery
Regional-scale data obtained from the upper Daling River valley of
western Liaoning and the Chifeng region of eastern Inner Mongolia
have suggested a great many small Hongshan polities both in the core
5
zone (核心區) and the periphery (周邊區). The distinction between the
core zone and the periphery was made based on the varying densities
and elaborateness of recognizable surface Hongshan public architecture
remains (Peterson 2006:23). It was neither strictly nor neatly defined,
but advanced to facilitate characterization of variation in amounts and
scale of public architecture across the Hongshan area for comparative
purposes. The distinction implies nothing at all about economic
relationships of a world system between core and periphery, but simply
distinguishes a core zone where evidence of Hongshan public
architecture and burial ritual is especially abundant and elaborate,
surrounded by a zone where the same sorts of remains occur in lesser
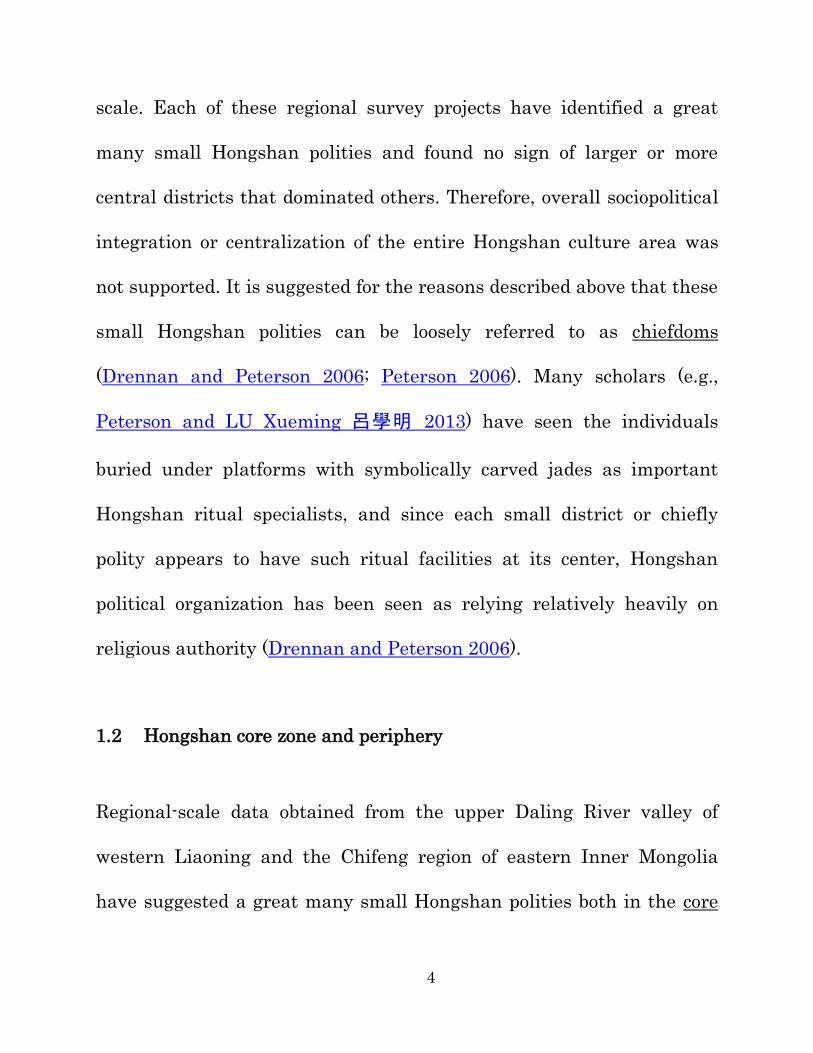
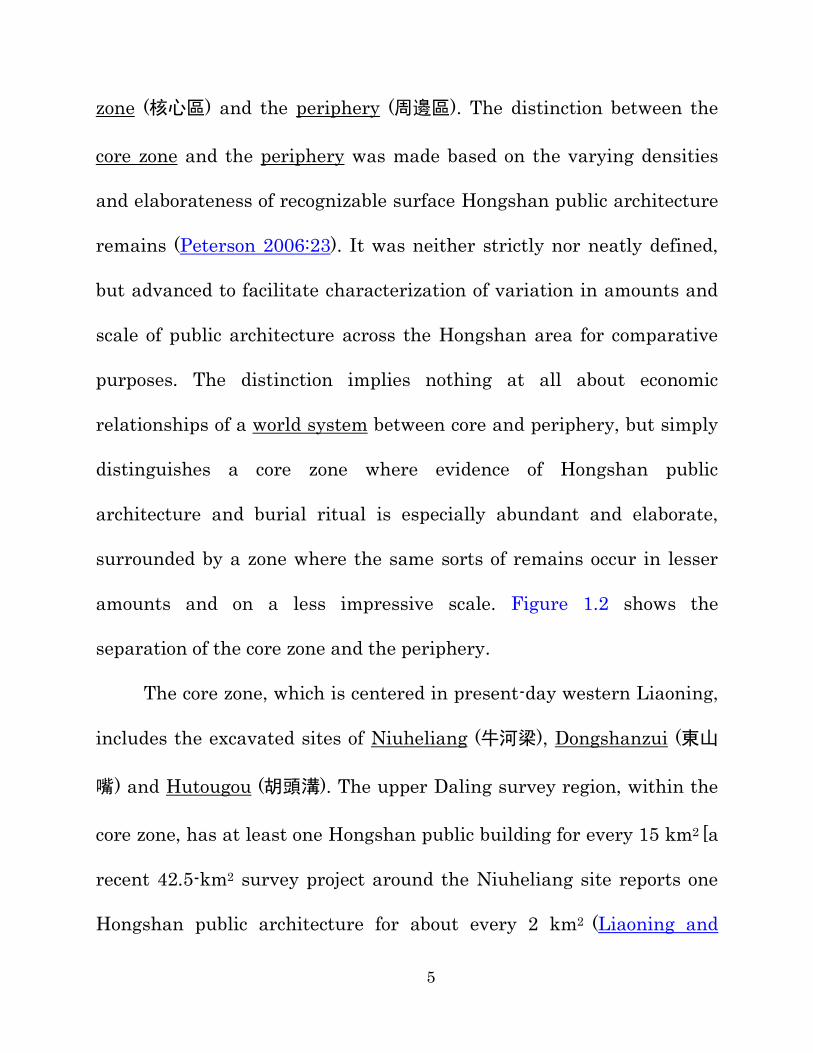
amounts and on a less impressive scale. Figure 1.2 shows the
separation of the core zone and the periphery.
The core zone, which is centered in present-day western Liaoning,
includes the excavated sites of Niuheliang (牛河梁), Dongshanzui (東山
嘴) and Hutougou (胡頭溝). The upper Daling survey region, within the
core zone, has at least one Hongshan public building for every 15 km2 [a
recent 42.5-km2 survey project around the Niuheliang site reports one
Hongshan public architecture for about every 2 km2 (Liaoning and
6
Renmin University of China 2015)]. By contrast, the Chifeng region in
the periphery has less than one Hongshan platform, in a less elaborate
and impressive form, for every 176 km2 (Peterson and LU Xueming 呂學
明 2013; Peterson et al. 2010).
Figure 1.2: The Hongshan core zone and the periphery
(Drennan et al. In press)
The most conspicuous and elaborate Hongshan archaeological
remains, then, are concentrated in the core zone, leading scholars to
consider this part of the Hongshan area, in some sense, the maximal
expression of Hongshan archaeological culture. This provides an
7
opportunity to delve into Hongshan social dynamics by investigating
the factors that produced such a more elaborate but spatially restricted
manifestation of cultural patterns across a much larger area.
1.3 Causes for the core zone’s greater expression of material culture
The regional-scale data have confirmed the greater abundance and
elaboration of Hongshan public architecture and funerary ritual in the
core zone. How, then, did the Hongshan core zone societies produce such
a sociopolitical integration? One possible answer to this question is that
the Hongshan core zone communities might have made such an
achievement on a substantially larger demographic scale, which allowed
correspondingly more powerful leaders to mobilize public works labor
from larger populations.
The upper Daling regional settlement study (e.g., LU Xueming 呂
學明 et al. 2010) has pursued this possibility by estimating regional
population levels of the Hongshan and other periods in the surveyed
area. It was estimated that 750 to 1500 persons lived in 134
communities across the surveyed area (200 km2) during the Hongshan
8
period. This population density (4–8 persons/km2) is only slightly higher
than 2–4 persons/km2 estimated for the Chifeng region well outside the
core zone. The separation of settlement clusters that represented
districts, their roughly similar populations, and the presence in each of
apparently similar facilities for public ritual altogether suggest that
none of them (the Hongshan districts) had become a powerful polity
dominating others (at least in this part of the core zone).
In addition to the similar population levels, communities of the
Hongshan period in the core zone and the periphery show substantial
similarities in other aspects as well, including: locating sites for
occupation; utilizing natural resources (e.g., agricultural and pasture
lands, wild edible plants and animals); performing rituals and
ceremonies; and organizing regional population into individual polities
of relatively small spatial and demographic scale. It is evident that
regional population densities in both the core zone and the periphery
are far lower than would exert any pressure on subsistence resources,
and that there is no evidence suggesting inter-community conflict in
either the core zone or the periphery.
9
To summarize, what differentiates Hongshan communities in the
core zone and the periphery seems to remain in the scale of and amount
of labor and time spent in constructing public architecture related to
ritual and ceremonial activities. This leads us to think of another
possible way to account for greater monumental and ceremonial activity
in the core zone: greater economic (or productive) differentiation.
One simple, obvious reason to connect the symbolic and spiritual
life of Hongshan villagers to economics is that the construction of ritual
facilities requires an economic investment in the form of labor mobilized
to carry out these public works. A greater degree of differentiation
between households in Hongshan villages with regard to productive
activities implies a stronger economic interdependence between
households and a more complex economy, which possibly provided
Hongshan leaders (or elites) with enhanced opportunities to mobilize
labor toward such ends.
Analysis of household artifact assemblages within Fushanzhuang,
a Hongshan village in the Chifeng region in the Hongshan periphery,
has indicated some very modest productive differentiation shown
especially in lithic artifacts (Peterson 2006). If the core zone showed
10
stronger evidence of productive differentiation and thus a more complex
village economy represented by much stronger household
interdependence, this might help us to understand how the greater
investment in public ritual spaces came to be and, most importantly,
how Hongshan elites might achieved their eliteness or power.
1.4 Economic differentiation in Hongshan core zone communities
The term economic differentiation (sometimes also known as productive
differentiation), as we use it here, refers to differences between
households within a local community in the balance of activities
involved in producing subsistence and non-subsistence goods of various
kinds that were widely utilized in daily life by ordinary people. To
maintain consistency in writing, the term economic differentiation
would be used throughout the whole dissertation.
The term economic differentiation was chosen in preference to
craft specialization because we do not wish to imply full-time (or even
part-time) specialists working in dedicated workshops to produce a
considerable volume of goods; because we do not wish to exclude the
production of subsistence goods; and because our focus here is not on
11
the elaborate luxury or prestige goods upon which archaeological
attention to craft specialization (including for Hongshan societies) has
often focused. Despite the widespread use of the term craft
specialization in the archaeological literature, there is considerable
discussion about its proper definition and about the archaeological
indicators of its various forms and modes. Underhill (1996) has
reviewed some of the problems that can result.
In particular, among Hongshan archaeological materials, many
discussions have been based on the finely carved jade and bottomless
ceramic cylinders with elaborate painted decoration — Tongxingqi (筒形
器). These are non-utilitarian goods of great significance in ritual and
ceremonial activities and products of a level of skill that a number of
researchers have argued can only be achieved by craft specialists (e.g.,
LU Xueming 呂學明 and ZHU Da 朱達 2008:73; TENG Haijian 騰海建
2009; XU Zifeng 徐子峰 2004). However, it is worth pointing out that,
even though a possibly greater degree of economic differentiation could
finally be indicated for the Hongshan core zone, it would probably still
fall near the bottom of the scale of specialization usually investigated by
archaeologists. More importantly, the existence of specialized craftsmen
12
producing ritual goods does not necessarily mean that the provisioning
of daily life in Hongshan villages involved very much economic
differentiation or economic interactions between households. It is this
latter aspect of the economy that this dissertation project seeks to
investigate.
1.5 Research questions to be investigated in this dissertation
Pottery is an early human invention, and it has substantially changed
the way humans lived (especially how they prepared, cooked, and stored
food) since its invention. Even after pottery is broken into pieces and
discarded as garbage, it can still survive, either on the surface or below
the surface, for quite a long time due to its durable physical properties.
For these reasons, pottery has been a central focus for archaeological
interpretation and reconstruction of human behavior in the past (e.g.,
Tite 1999, 2008).
A distinction is frequently made between (1) luxury or ceremonial
pottery for ritual, funerary, display and other uses, and (2) utilitarian
pottery for the common activities of everyday life, including cooking,
storage, and transport (e.g., Rice 1987). Production of the former may
13
require a greater amount of time, labor, and specialized knowledge, and
is often argued to be carried out only by very skilled and experienced
craft specialists. The technical requirements for making utilitarian
pottery may be relatively simple(r), and basic functional pottery vessels
could be made virtually by every household or family group for its use
from rudimentary materials widely available in almost any landscape.
The same logic holds true for Hongshan material culture.
Although finely worked jade and elaborately painted pottery cylinders
(Tongxingqi) are much-admired Hongshan artifacts, more than 60 years
of field surveys and excavations have revealed perhaps 300 Hongshan
jade carvings, quite a small quantity and low density considering that
the Hongshan period lasted 1500 years and that Hongshan material
culture is distributed across an area of some 250,000 km2. Tongxingqi
were found in larger quantities at more Hongshan sites, but the number
is still quite small compared with the abundance of Hongshan
utilitarian pottery sherds. It is the millions of sherds of utilitarian
vessels that constitute the vast majority of surviving Hongshan
material culture.
14
Thus, it is utilitarian pottery that this dissertation aims to use as
a window into the economic organization of daily life for ordinary people
in Hongshan villages. Five specific but interrelated research questions
have been formulated in the hope of promoting our current
understanding or generating new understanding of: (1) pottery
production, distribution, and consumption in Hongshan core zone
communities, (2) the varying degrees of access (or reliance) that
households in the Hongshan core zone had to (or on) different pottery
raw materials and pottery providers, and (3) the possible correlation
between pottery procurement sources and differentiation in social or
economic status among households in the Hongshan core zone. As non-
utilitarian Hongshan vessels (Tongxingqi) would be included in the
sampling, we could also investigate from a raw material procurement
perspective how ‘specialized’ the production of non-utilitarian vessels
would look like, compared to that noticed for utilitarian vessels. Finally,
with all the proper interpretations of results obtained for each research
question, we would be able to generate a picture of how residents of
Hongshan core zone communities might have organized their everyday
economic lives, which would advance our conception of what role and to
15
what degree did economic differentiation play in the formation of social
complexity in Hongshan societies.
1.5.1 Research Question 1
How much economic differentiation characterized Hongshan
pottery making? Does it seem that most households made pottery
vessels for their own daily use? Or, at the opposite extreme, was
most of the utilitarian pottery made by only a few pottery
producers?
Pottery, no matter how it was produced and used to serve what
purposes, is often a product of long-term social, cultural, and
technological choices by a particular population. Thus, the way pottery
was produced, distributed, and consumed in a particular prehistoric
society at a particular region and time contains important clues
regarding the pottery consumers’ thoughts and behaviors in their
everyday sociopolitical and economic lives. This in return offers a
chance for us to understand how possibly the prehistoric villagers (such
as the occupants of Hongshan core zone communities) organized
themselves routinely, which can be very important for understanding
local or regional social dynamics. The production of pottery during
16
Hongshan times, as was suggested in section 1.4, was almost certainly
not be carried out on a scale and at a level that match well with what
many scholars focusing on craft production would term “craft
specialization”. However, signs of economic differentiation have been
noticed in the Hongshan periphery (Chifeng region) and there are some
good reasons to lead us to believe that a greater degree of economic
differentiation may characterize the economic lives of Hongshan core
zone communities.
Understanding pottery production, distribution, and consumption
in the Hongshan core zone through a geochemical analysis of carefully
selected sherds is therefore a good way to reveal economic
interdependence between households. On one end, if each household
produced pottery for their own use, the economic communications
between households (as evidenced by the consumption of pottery made
from different procuremnt sources at each household) would be rare (or
at least, very weak), then, households in the Hongshan core zone should
be quite likely self-sufficient and the intra-household interdependence
be very mild.
17
On the other extreme end, if all pottery (whether fine-paste or
coarse-paste, utilitarian or non-utilitarian) consumed at most (if not all)
of the Hongshan core zone communities shows very strong geochemical
homogeneity indicating common production source units, a high level of
intra-household economic interdependence would be indicated. (To be
brief, a production source unit corresponds to a delineated compostional
group, which is believed to very likely result from a specific pottery-
making tradition maintained by a group of people, some particular
processing recipes, or sometimes both. It is for this particular reason
that we argued that a compositional group could represent a production
source unit or a possible pottery producer. A detailed discussion of what
the term “production source unit” means will be presented in section
2.3.4.)
1.5.2 Research Question 2
If most households did not make their own pottery, did they tend to
acquire it from a single producer? Or from several producers?
18
From a materials science perspective, all pottery raw materials were
prepared from clays and inclusions (whether naturally occurring or
intentionally added), which were then shaped, formed, and fired by the
potters to achieve some formal and functional characteristics. Therefore,
geochemical compositions of the final pottery vessels reflect the source
information of where pottery raw materials may have been procured
and the technological traits of how pottery producers prepared raw
materials to ensure that the consumers’ requirements would be met.
The source information about pottery not only refers to the geographical
locations of raw materials exploited and utilized to make that pottery,
but also to the potential number of production source units (PSUs)
involved in pottery production. This latter aspect is a very interesting
topic to investigate as it helps illustrate the local or regional provision
of raw materials.
To be more specific, if a highly homogenous geochemical
composition is not noticed for the investigated Hongshan core zone
pottery, and instead, pottery consumed in each Hongshan core zone
household shows a fairly large geochemical variability, it may suggest
that inhabitants of each household have had access to different
19
production source units and thus indicate the presence of more than one
single pottery producer (or production source unit) in the Hongshan
core zone. Different producers or production source units can be
recognized or identified conceptually by looking for distinctive
compositional groups that are delineated by featured geochemical
compositions of investigated pottery. It is called a “conceptual”
designation of pottery production source units because with the surface
materials from the upper Daling survey project we could only perceive
the presence of different resources provisioned by different production
sources units but would have no clue where exactly they came from or
who had mobilized or prepared them.
1.5.3 Research Question 3
If households tended to acquire all or most of their pottery from a
single producer, did this correspond to zonation within settlements?
That is, did all households in a particular neighborhood rely largely
on a single procurement source? Or were households utilizing
different producers intermingled spatially within settlements?
The upper Daling survey project identified a total of 50 Hongshan
households in three separated residential areas: Sanjia ( 三 家 ),
20
Dongshanzui (東山嘴 ), and Erbuchi (二布尺 ). (More details about
identification of the 50 Hongshan households will be introduced in
section 2.1.2). It is these 50 Hongshan households from the three areas
that constructed the sherd pool from which a sampling would be
selected and studied in this dissertation. Research Question 3 was
designed to explore whether or not one single producer had produced
potttery for all the 50 Hongshan households. Answers to Research
Question 3 relied closely on the delineation of compositional groups or
production source units done to answer Research Question 2. If a very
limited number of compositional groups (or PSUs) are identified, all (or
nearly all) of which are clearly represented at each of the 50 households,
it would lead us to believe that pottery production might have been
carried out by a very few groups of people who dedicated themselves to
pottery making and made a living through pottery exchange or trade
with their near or distant neighbors who put a lot more efforts into
doing other kinds of productive activities (such as farming).
If, in the other scenario, a lot more compositional groups or PSUs
are strongly suggested for the three residential areas, as evidenced by
groupings of pottery on the basis of their geochemical similarities, and if
21
different areas show a focus on different kinds or combinations of PSUs,
then the “one single producer (and maybe regional production center)”
hypothesis is rejected. It would look more likely that pottery production
took place in multiple locations using locally procured raw materials.
1.5.4 Research Question 4
If households tended to acquire pottery from multiple sources, did
the proportions in which these sources were represented vary
substantially from one household to the next? Or were the
proportions of different sources quite similar across households
within a settlement area?
If Research Question 3 is answered negatively (that is, if multiple
production source units are suggested for the three residential areas), it
will be very interesting to know how similarly or differently inhabitants
of two households in their everyday life consumed pottery made by
different production source units. Intra-household variation in
communicating with different production source units and consuming
pottery made by different PSUs can be an indication of household
interdependence and a source of differentiation in household status.
22
More specifically, the ability to access a certain number of pottery
producers and to make such economic connection strong and stable
could have been an important factor that helped some Hongshan
individuals or households achieve economic superiority and therefore
higher status. Research Question 4 aims to investigate such intra-
household variations by making estimates of the proportions of different
PSUs represented at the 16 selected households and then comparing
them for patterns (if any). The difference observed during such
comparisons, whether it is statistically significant or not, would lead us
to formulate hypotheses to interpret the correlation between pottery
procurement and household status.
1.5.5 Research Question 5
To what extent did utilitarian pottery distribution cross the
boundaries between the supra-local communities or districts
delineated in the regional settlement analysis?
This last research question aims to understand communications beyond
the local neighborhoods and asks whether or not (and/or how strongly)
people living in two separate supra-local Hongshan communities could
23
have interacted with each other economically. The delineation of supra-
local communities has been done in regional settlement analysis by the
upper Daling survey project, which assigned Sanjia and Dongshanzui to
one supra-local community while Erbuchi to the other. With a fairly
good number of samples selected from households in three different
residential areas that belonged to two supra-local communities, we will
be able to find out how each household was involved in the regional
pottery networks and especially how pottery was distributed between
supra-local communities. If the distribution of pottery was quite wide
across the landscape and had crossed the geographical limits of supra-
local communities, more active economic interactions between these
supra-local communities would be indicated. A wide pottery distribution
network would also help us understand the formation of shared
Hongshan material culture in the core zone and beyond.
1.5.6 Additional Research Questions
In addition to the five main research questions described above, a large
sampling of sherds would also make some other interesting topics
(although less related to the main focus of this dissertation) potentially
24
discussable. Two such topics seem most relevant and can be organized
into additional research questions.
First, as a result of the stratified sampling strategy (see more
details in section 2.4), the sherd samples consist mainly of utilitarian
vessel sherds but also of some non-utilitarian ones. This offers an
opportunity to compare the geochemical variability of utilitarian vessels
with that of non-utilitarian ones. Hongshan non-utilitarian vessels
(Tongxingqi) have been long believed to be products of highly
specialized production activities due to their finer texture, much larger
shape and form, and more decorations (e.g., LU Xueming 呂學明 and
ZHU Da 朱達 2008:73; TENG Haijian 騰海建 2009; XU Zifeng 徐子峰
2004). A geochemical understanding about procurement sources of both
utilitarian and non-utilitarian vessels would advance our knowledge of
pottery craft specialization in the Hongshan period and especially
within this part of Hongshan core zone. For example, if Tongxingqi
vessels seem to be produced from raw materials or by production source
units very different from those indicated for utilitarian vessels, a
high(er) level of specialization would quite likely be suggested. On the
other extreme end, if they both were made from virtually the same
25
materials and by the same production source units, then the high-level
specialization in production of Tongxingqi might not be supported (at
least from the raw material procurement perspective).
Second, as pottery procurement sources will be established for
each investigated Hongshan household, the varying kinds and
proportions of production source units (PSUs) represented from
household to household will reveal to us the difference in economic
connections between households and their neighbors as well as the
varying capabilities that different households demonstrated in
maintaining those economic ties. Analysis of upper Daling household
assemblages has identified some households as higher status, based on
their utilization of more elaborate and more costly pottery of several
kinds (R. Drennan, Personal Communication, June 14, 2015). This gives
us an opportunity to explore another interesting issue: how did pottery
procurement reflect household interdependence and relate to the
differentiation in household status? Special attention will be paid to
correlations between households status to investigate possible economic
underpinnings of status differentiation in Hongshan societies.
26
2. MATERIALS AND METHODOLOGY
2.1 Materials: sherds from Hongshan core zone communities
As was introduced in Chapter 1, the central theme of this dissertation
project is a geochemical understanding of pottery networking in three
residential areas (Sanjia, Dongshanzui, and Erbuchi) of the Hongshan
core zone. Therefore, the materials to be studied in this dissertation rely
entirely on pottery fragments and sherd specimens sampled from
households identified in those three areas of Hongshan core zone.
Surface collections of the upper Daling survey project were the only
sources that yielded the sampling of sherds in this study. The 50
Hongshan core zone households delineated by intensive surface
collections following regional-scale settlement analysis of the upper
Daling survey project laid the foundation for sherd sampling and
further analysis. Below are some brief descriptions about pottery
27
functions and typologies, collection of surface sherds, and delineation of
households in the upper Daling survey area of the core zone.
2.1.1 Hongshan core zone pottery: forms and functions
Hongshan pottery is believed to have been largely developed from the
pottery making in the Xinglongwa period (6200–5400 BC) (ZHU
Yanping 朱延平 2007). Pottery for both utilitarian and non-utilitarian
uses have been recovered at many Hongshan settlements; in addition,
the same vessel forms, styles, and functions were noticed for pottery
unearthed in both the core zone and the periphery.
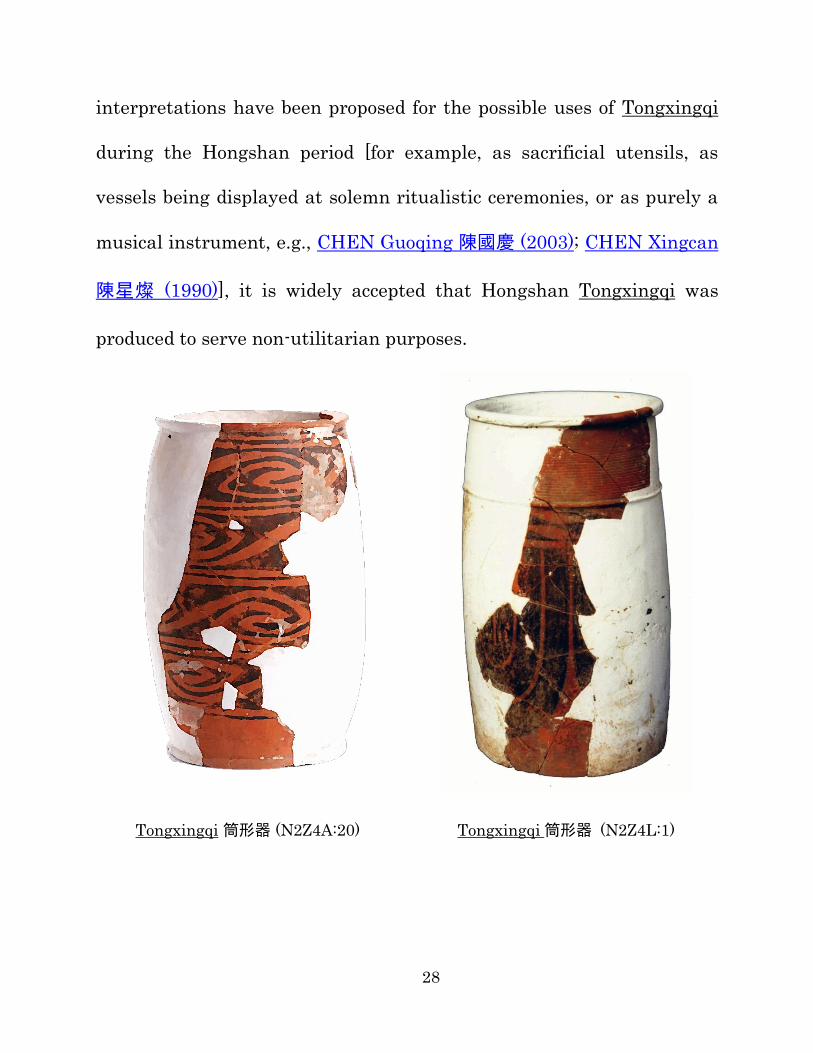
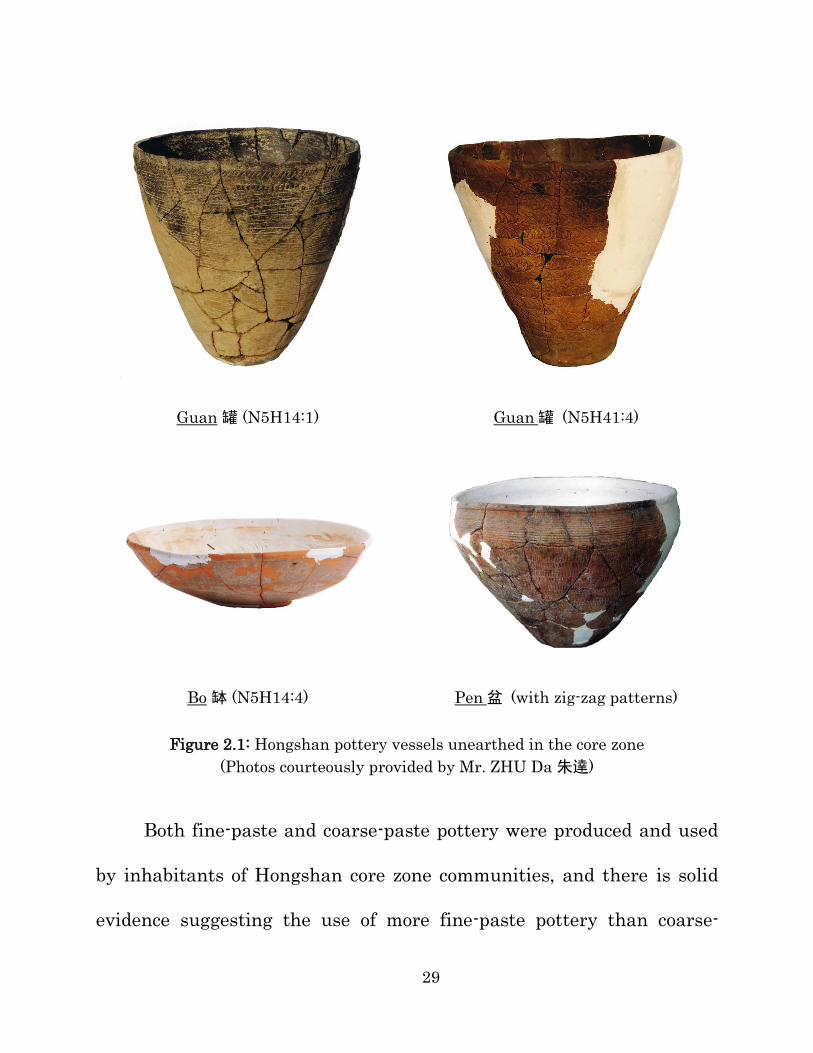
Utilitarian vessels in the Hongshan core zone fall into three
general categories: (1) cooking vessels such as cylindrical jars
(Tongxingguan 筒形罐); (2) serving vessels such as bowls (Bo 缽) and
basins (Pen 盆); and (3) storage vessels such as jars (Guan 罐) and urns
(Weng 甕) (Peterson et al. 2014:14).
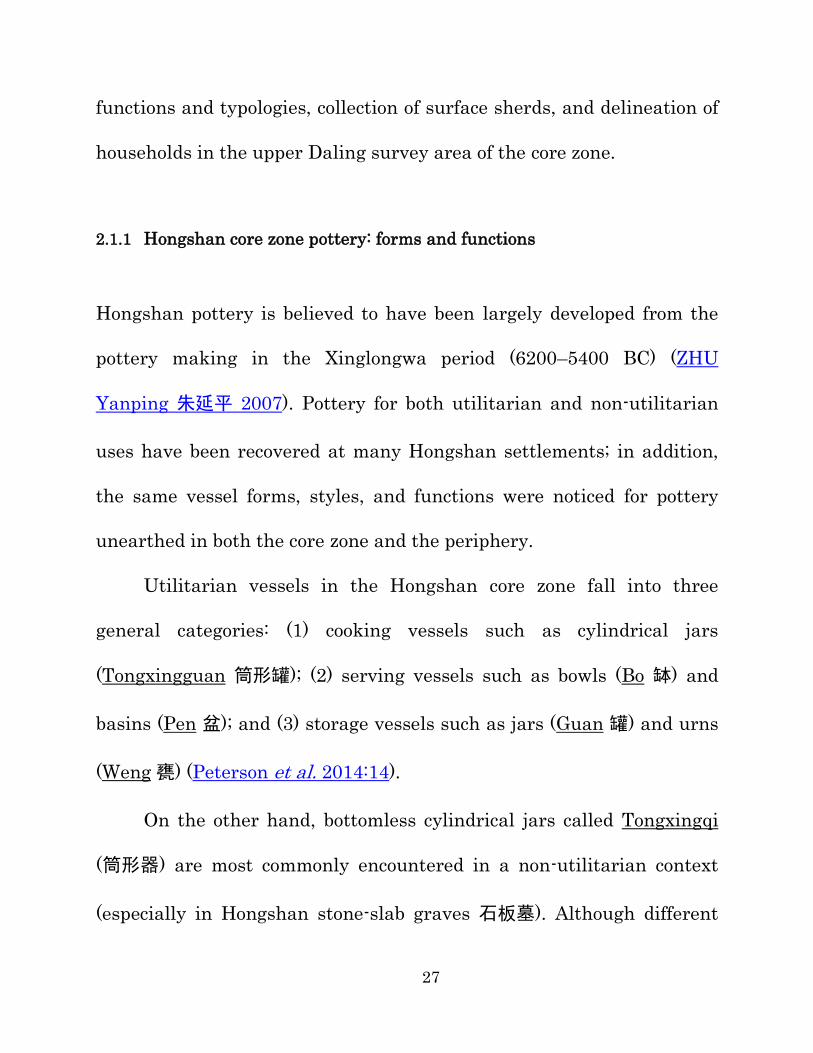
On the other hand, bottomless cylindrical jars called Tongxingqi
(筒形器) are most commonly encountered in a non-utilitarian context
(especially in Hongshan stone-slab graves 石板墓). Although different
28
interpretations have been proposed for the possible uses of Tongxingqi
during the Hongshan period [for example, as sacrificial utensils, as
vessels being displayed at solemn ritualistic ceremonies, or as purely a
musical instrument, e.g., CHEN Guoqing 陳國慶 (2003); CHEN Xingcan
陳星燦 (1990)], it is widely accepted that Hongshan Tongxingqi was
produced to serve non-utilitarian purposes.
Tongxingqi 筒形器 (N2Z4A:20) Tongxingqi 筒形器 (N2Z4L:1)
29
Guan 罐 (N5H14:1) Guan 罐 (N5H41:4)
Bo 缽 (N5H14:4) Pen 盆 (with zig-zag patterns)
Figure 2.1: Hongshan pottery vessels unearthed in the core zone
(Photos courteously provided by Mr. ZHU Da 朱達)
Both fine-paste and coarse-paste pottery were produced and used
by inhabitants of Hongshan core zone communities, and there is solid
evidence suggesting the use of more fine-paste pottery than coarse-
30
paste pottery from early to late Hongshan times. For example, 54% of
the pottery recovered at Xishuiquan (西水泉 ), a site of the middle
Hongshan period, was fine-paste, while this figure climbed to
approximately 80% at Dongshanzui (東山嘴), a late Hongshan site
(TENG Haijian 騰海建 2009).
Tongxingqi are all fine-paste vessels, and sometimes coated with
colors (usually black). Coarse-paste vessels were most likely used for
cooking and storage purposes. Some utilitarian pottery (such as serving
vessels Bo and Pen) was also made from fine clays.
Figure 2.1 shows Tongxingqi and some very typical Hongshan
utilitarian vessels that were most commonly encountered in the
Hongshan core zone (as well as in the periphery).
2.1.2 Households identified by the upper Daling project
The upper Daling regional survey was carried out between 2009 and
2011. It has documented settlement patterns in the upper Daling River
valley (大淩河上游流域) at several scales—regional, local community,
and household (LU Xueming 呂學明 et al. 2010; Peterson et al. 2010,
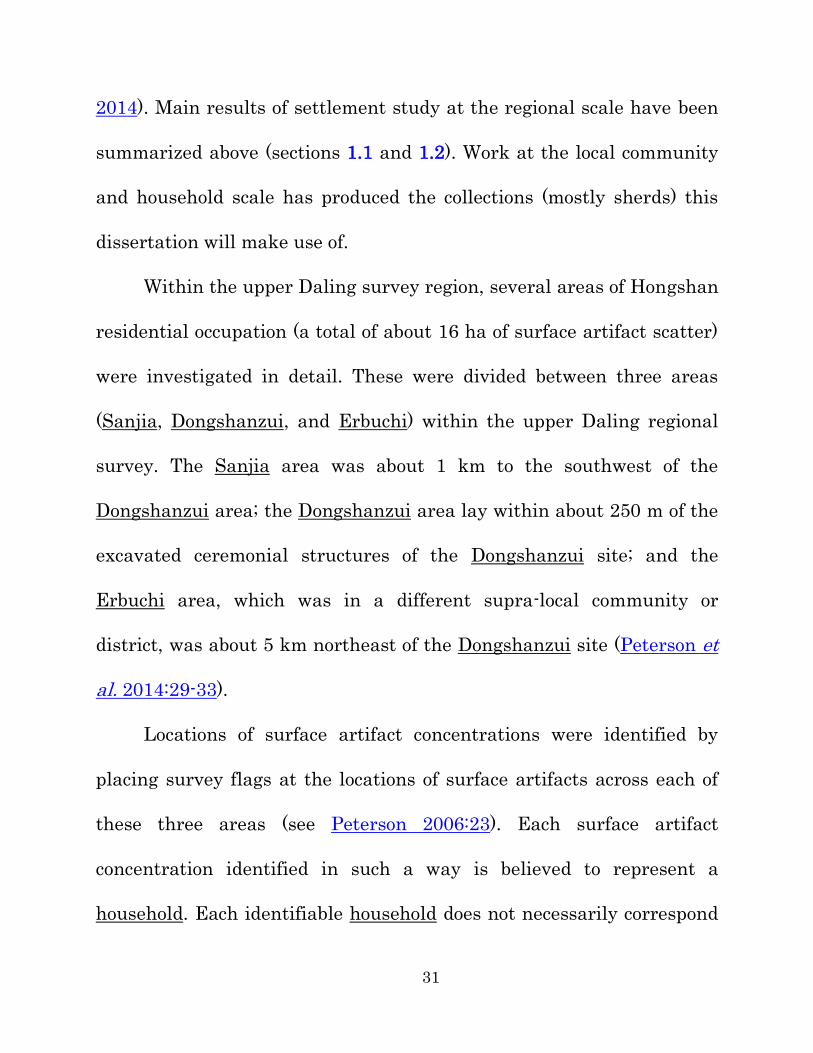
31
2014). Main results of settlement study at the regional scale have been
summarized above (sections 1.1 and 1.2). Work at the local community
and household scale has produced the collections (mostly sherds) this
dissertation will make use of.
Within the upper Daling survey region, several areas of Hongshan
residential occupation (a total of about 16 ha of surface artifact scatter)
were investigated in detail. These were divided between three areas
(Sanjia, Dongshanzui, and Erbuchi) within the upper Daling regional
survey. The Sanjia area was about 1 km to the southwest of the
Dongshanzui area; the Dongshanzui area lay within about 250 m of the
excavated ceremonial structures of the Dongshanzui site; and the
Erbuchi area, which was in a different supra-local community or
district, was about 5 km northeast of the Dongshanzui site (Peterson et
al. 2014:29-33).
Locations of surface artifact concentrations were identified by
placing survey flags at the locations of surface artifacts across each of
these three areas (see Peterson 2006:23). Each surface artifact
concentration identified in such a way is believed to represent a
household. Each identifiable household does not necessarily correspond
32
strictly to one individual household. It could represent individual
households or small groups of households that are closely distributed.
However, no effort was made to subdivide them. The term household
will be consistently used throughout the dissertation to correspond to
trash or garbage concentrations produced by a group of Hongshan
inhabitants who lived together or relatively close to each other and
therefore distinguishable from those produced by others living closer at
more distant locations. In addition to the identification of surface
artifact concentrations, the three areas were also subject to
magnetometer survey and excavation of 1 by 2 m stratigraphic tests,
which confirmed that they were locations of Hongshan residential
debris (Peterson et al. 2014:31-44). This gives us enough confidence
about who produced surface trash concentrations at where.
The largest samples of artifacts were produced by intensively
surface collecting a number of groups of 5 by 5 m squares within these
16 ha of occupation. Vegetation was raked away, and the uppermost 5
cm of soil was screened to recover artifacts of all classes (Peterson et al.
2014:31). Varying densities of artifacts across these grids of 5 by 5 m
squares made it possible to identify 50 individual artifact
33
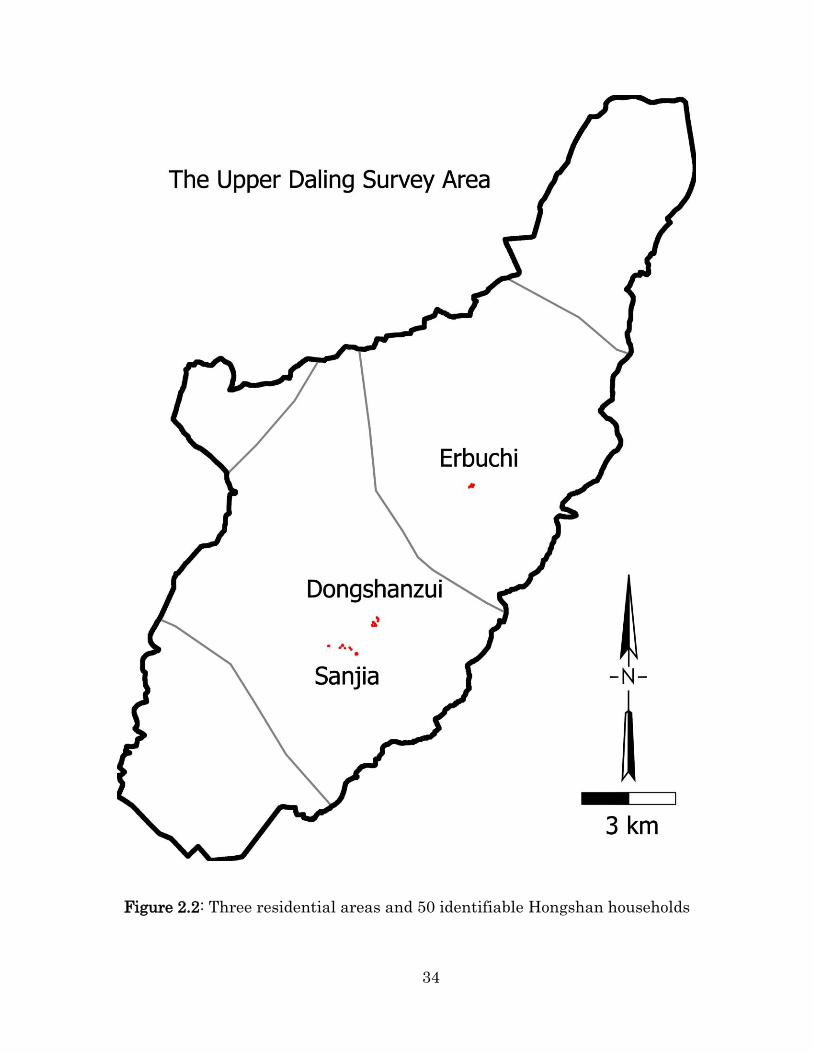
concentrations (or 50 “households”), including: 23 in the Sanjia area, 17
in the Dongshanzui area, and 10 in the Erbuchi area. These
concentrations, as suggested earlier, represent the artifact assemblages
used and discarded by one or a very few closely-spaced Hongshan
households. Variation across these 50 assemblages, then, allows for an
assessment of the nature and degree of variation across a number of
households in a substantial area of residential occupation in the
Hongshan core zone. It is these 50 identifiable Hongshan households
and the sherds collected at them that comprise a pool of sherd samples
this dissertation would later make use of.
Figure 2.2 shows boundaries of the upper Daling survey; the
locations of Sanjia, Dongshanzui, and Erbuchi areas; and the 50
households (represented in red dots) identified in this part of the core
zone.
34
Figure 2.2: Three residential areas and 50 identifiable Hongshan households
35
2.2 Analytical approaches for sourcing Hongshan pottery
2.2.1 Differentiating pottery by their possible sources
A geochemical sourcing study was suggested to answer the five main
research questions proposed in section 1.5. Many archaeometric studies
of pottery and ceramics have shown that the term sourcing can refer to
two closely related but different things: locating and differentiating.
Locating is the process of relating an artifact to a geographic locus
where its (main) raw materials (for example, clay, inclusions, or
pigment) were exploited and used to craft this item. By contrast,
differentiating is the process during which artifacts are classified by
having the similarity and dissimilarity in their physical, mineralogical
or geochemical properties quantitatively (or sometimes qualitatively as
well) measured.
Linking an unearthed sherd to some particular locus where its
raw material were exploited and/or processed is extremely difficult. A
successful locating relies on many things, such as: How unique the raw
materials are in terms of their physical, mineralogical, or geochemical
properties? Can their uniqueness still be preserved, fully or partially,
36
after raw materials were made into an artifact? Are there ways to
qualitatively or quantitatively measure such uniqueness? And so on.
The fragmentary or incomplete nature of archaeological data (especially
those recovered from prehistoric sites that are not well preserved)
makes locating in many cases a job impossible to accomplish. By
contrast, determining the similarity or dissimilarity between one sherd
and others in the same study group can be a lot easier. It simplifies the
sourcing problem by focusing on sherds themselves only and requiring
no sampling of (potential) pottery raw materials. In the best scenario,
the groupings that describe the closeness between sherds and sherds, or
between sherds and their possible raw materials, can be created by both
the locating and differentiating strategies.
This dissertation chose to differentiate, rather than to locate, the
sherds collected at Hongshan core zone communities. The reason for
doing so is simple: no Hongshan kiln or kiln wasters were found within
the 200-km2 survey area, making impossible the sampling of pottery
raw materials. Even if the Hongshan potters actually followed the least-
cost theory and utilized the clay sources most readily available to their
residential areas (just as potters in many archaeological/ethnographic
37
studies did/still do), without clear material evidence suggesting
resources exploitation and production activities, one cannot just include
clay or soil samples collected from anywhere for sourcing studies.
2.2.2 Underlying assumptions for ‘sourcing’ pottery
For many researches that aimed to reconstruct the pottery production,
consumption, and distribution in a given human society at a given time
and place, geochemical data containing multi-elemental and
quantifiable compositional information is a valuable source of
information that one should first look into. For pottery, geochemical
data almost always refer to elemental compositions that are inherited
from soils or clays chosen by the potters at the very beginning of pottery
production and later embedded into the final products (pottery vessels).
Clay is a major component of soils that consists primarily of weathered
rocks but also of decomposed and/or living organic matter from plants
and bacteria. Therefore, the compositional data of pottery relies heavily
on the geochemistry of clay, with the latter being strongly influenced by
the decomposition of rocks into soils as well as by the variety and
quantity of minerals finally preserved in soils or clays.
38
Geochemical sourcing studies on archaeological pottery and
ceramics rely on some theoretical or technical assumptions. The most
important one assumes that geochemical compositions of
pottery/ceramic raw materials (clays) procured from different regions
are distinctive and their distinctiveness can survive the process of
shaping and firing clays into vessels and be quantitatively measured.
Underlying this assumption are four sub-assumptions:
(1) the elemental compositions, including different elements and
their concentrations, should remain quite consistent and stable and be
detectable from the very beginning when a particular type of clay was
chosen and procured to the last minute when vessels made from this
type of clay were used, and then to the moment when they were
discovered and studied again;
(2) clays procured from different geographical locations, after they
were made into vessels, can still be distinguishable from each other by
their featured geochemical compositions;
(3) quantifiable elemental (and sometimes mineralogical as well)
compositions can be easily and reliably extracted by a particular
analytical technique and method; and
39
(4) appropriate quantitative approaches are available and can be
applied to multi-elemental compositional dataset to reveal potentially
meaningful patterns that characterize clays in different locations.
The actual geochemical sourcing of clays can be straightforward or
highly challenging, depending on how well the real-world data satisfy
the aforementioned assumptions. Despite the potential difficulties and
challenges, the geochemical sourcing of clays has been proved powerful
and useful for understanding the transfer of pottery especially among
groups of people living in the Neolithic period (just as the inhabitants
living in households identified in the Hongshan core zone).
It is not simply because technical investigation often is the only
way to understand the pottery production and distribution within and
among regions and peoples, but more importantly because technological
choices were limited, social and cultural needs were relatively simple,
and the distribution of pottery can be relatively easy to predict, back in
this period of time. For example, potters may make use of clays most
readily available to them and did not put too much efforts into clay
pretreatment; overexploitation of clay sources for large-scale production
was rare; pottery were fired at a predictable temperature (usually below
40
1000 °C), which caused no or less dramatic changes in the mineralogical
structure and geochemical compositions of clays.
2.2.3 Possible way of producing pottery in Hongshan times
Regional surveys and archaeological discoveries in northeastern China
have revealed that inhabitants of Hongshan communities manufactured
and used pottery with simple vessel forms throughout the 1500-year
Hongshan period. Most of the pottery vessels were made to serve the
needs for domestic activities (such as storage and serving purpose). In
addition to utilitarian pottery vessels, a special type of pottery,
Tongxingqi, was produced for non-utilitarian purpose, which are large
bottomless pottery cylinders. Compared to utilitarian pottery,
Tongxingqi vessels are much larger in size and often have beautiful
decorations or line drawings on smooth surfaces with fine(r) texture,
which clearly requires more labor and time to manufacture.
For most of the Hongshan occupation sites, material evidence such
as kilns or kiln wasters were not found, making it difficult to recognize
the pottery production activities and locate the possible sources of clays.
The only reported (possible) Hongshan kilns, where dozens of
41
reconstructable pottery vessels (mostly coarsely-made) were unearthed,
were located close to the Hongshan occupation sites (Silengshan 四棱山
and Shangjifangyingzi 上機房營子) in eastern Inner Mongolia (CHEN
Guoqing 陳國慶 and ZHANG Quanchao 張全超 2008; LI Gongdu 李恭篤
1977; LI Gongdu 李恭篤 and GAO Meixuan 高美璇 1987), suggesting
that pottery production was carried out near the residential sites in
Hongshan period.
In summary, Hongshan people (including potters and pottery
consumers) very likely lived their lives and made/used pottery in a
similar way as many other prehistoric groups of people did. Therefore,
small-scale production of pottery using locally or easily accessible clay
sources can be expected for the Hongshan societies.
2.2.4 Analytical approaches for extracting geochemical data
Extracting compositional data from ceramics (including pottery) has
been made a lot easier by the introduction and application of modern
instrumental analyses to archaeological materials. Case studies
reporting satisfactory results from the application of these analytical
42
methods to archaeological materials have been announced in many
regions (North and South America, Europe, Africa, East and Southeast
Asia, Middle East, etc.) and with different archaeological cultures in
different time periods.
Conventional methods to achieve such a purpose in
archaeoceramic studies include inductively coupled plasma atomic
emission spectrometry (ICP-AES), inductively coupled plasma mass
spectrometry (ICP-MS), instrumental neutron activation analysis
(INAA), proton induced x-ray emission (PIXE), and benchtop x-ray
fluorescence spectrometry (XRF). Besides, a strong interest has also
been arising in recent years for the more portable or mobile devices or
instruments. For example, handheld x-ray fluorescence spectrometer
(often referred to as HHXRF or pXRF, this dissertation would
consistently refer to the latter) has an increasing application to
generate compositional data with consistency, accuracy, and precision
in measurements leading to meaningful and satisfying results.
Two candidate approaches (ICP-AES and benchtop XRF with the
fusion method) came forward immediately when a compositional
analysis was proposed for the purpose of revealing pottery networks in
43
Hongshan core zone. These two techniques were believed to better serve
the needs of this dissertation project compared to INAA, PIXE, and
ICP-MS because of the quantitative nature of compositional data they
would provide at more affordable prices.
The pXRF analysis was not considered until a lot more sherds
turned out to be needed to make statistically meaningful arguments.
Neither ICP-AES nor benchtop XRF would allow a geochemical analysis
of a sample size greater than 200 to be done within a few months, in
view of the long, complicated sample preparation steps, the large
amount of labor and time involved, and the total cost. Therefore, a few
months after the ICP-AES and benchtop XRF analyses were done on a
small selected sample of sherds, the pXRF analysis was also applied to
the same sherds to test whether or not it would extract the same kind of
geochemical information as ICP-AES or benchtop XRF did. If the same
or similar observations could be made on the geochemical data
generated by the pXRF analyzer, it would be wise to choose the pXRF
analysis over ICP-AES or benchtop XRF analyses because the former
would at least triple the sample size that could be analyzed by the latter
two.
44
2.3 Establishing methodology by a series of pilot studies
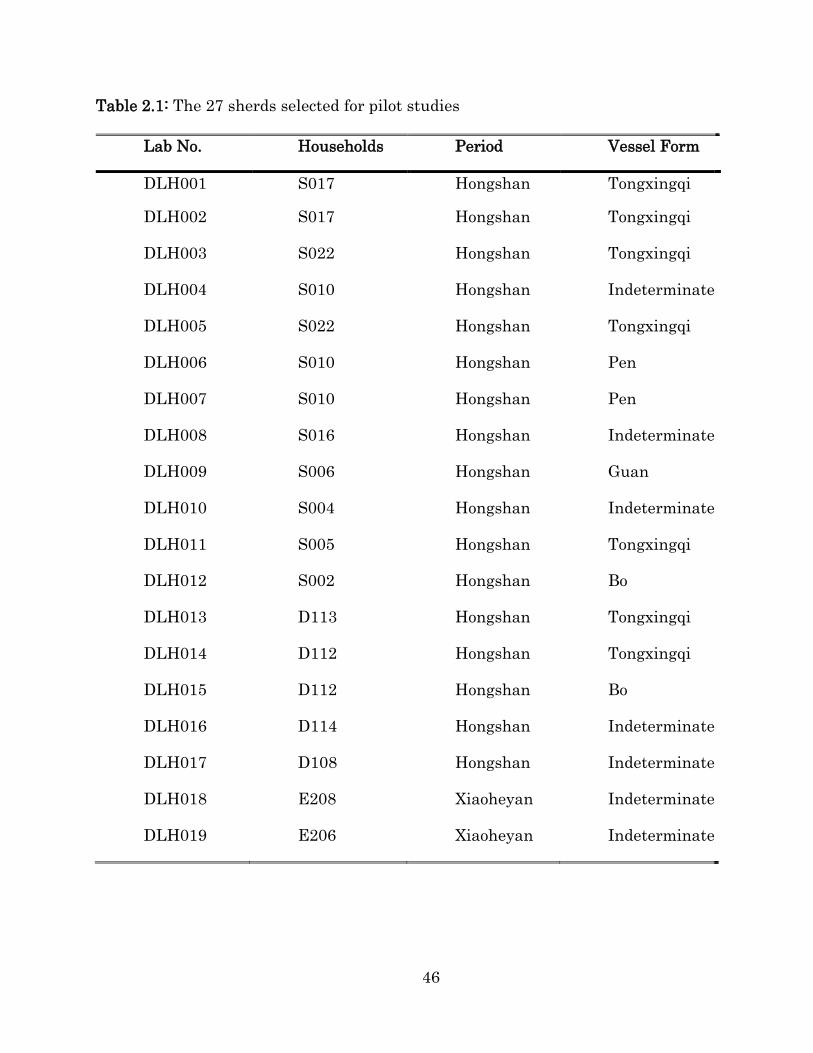
2.3.1 Selection of 27 Hongshan core zone sherds
During the summer (middle August) of 2013, a small sample of sherds
was selected at the Niuheliang Workstation (牛河梁工作站) in western
Liaoning of northeastern China. The sample consisted of 27 sherds
representing a wide variety of vessels from the 50 identifiable
Hongshan core zone communities (see details about the 27 selected
sherds in Table 2.1 and Table 2.2).
These 27 sherds came from both non-utilitarian and utilitarian
vessels, such as Tongxingqi, Guan, Bo, Pen, and other unrecognizable
utilitarian vessel forms. Nineteen (19) of the 27 sherds were fine-paste
while the others were coarse-paste. The selected 27 sherds came from
15 of the 50 identifiable households, including eight (households S002,
S004, S005, S006, S010, S016, S017, and S022) in the Sanjia area, six
(households D101, D108, D109, D112, D113, and D114) in the
Dongshanzui area, and one (household E203) in the Erbuchi area.
Twenty-four (24) out of the 27 sherds were dated to the Hongshan
period, while the other three were identified as Xiaoheyan sherds.
45
The main purpose of selecting sherds of different paste, vessel
form, and periods from multiple households in the three areas was to
represent in the best possible way the spatial and temporal variability
of geochemistry that might characterize the three areas, where these 27
sherds and other sherds to be selected and analyzed would come from.
Only when this goal was well established and the difference in
geochemical profiles of pottery collected from the three areas was
demonstrated would it be reasonable enough to propose distinguishing
different clay sources by quantitatively comparing their geochemical
data.
Otherwise, if it turned out that geochemical profiles of all sherds
from the three areas showed little difference, it would make the
distinction of possibly different clay sources extremely difficult or
impossible. This is certainly a concern that needs to be solved before the
geochemical analysis was applied to several hundred new sherds
46
Table 2.1: The 27 sherds selected for pilot studies
Lab No. Households Period Vessel Form
DLH001 S017 Hongshan Tongxingqi
DLH002 S017 Hongshan Tongxingqi
DLH003 S022 Hongshan Tongxingqi
DLH004 S010 Hongshan Indeterminate
DLH005 S022 Hongshan Tongxingqi
DLH006 S010 Hongshan Pen
DLH007 S010 Hongshan Pen
DLH008 S016 Hongshan Indeterminate
DLH009 S006 Hongshan Guan
DLH010 S004 Hongshan Indeterminate
DLH011 S005 Hongshan Tongxingqi
DLH012 S002 Hongshan Bo
DLH013 D113 Hongshan Tongxingqi
DLH014 D112 Hongshan Tongxingqi
DLH015 D112 Hongshan Bo
DLH016 D114 Hongshan Indeterminate
DLH017 D108 Hongshan Indeterminate
DLH018 E208 Xiaoheyan Indeterminate
DLH019 E206 Xiaoheyan Indeterminate
47
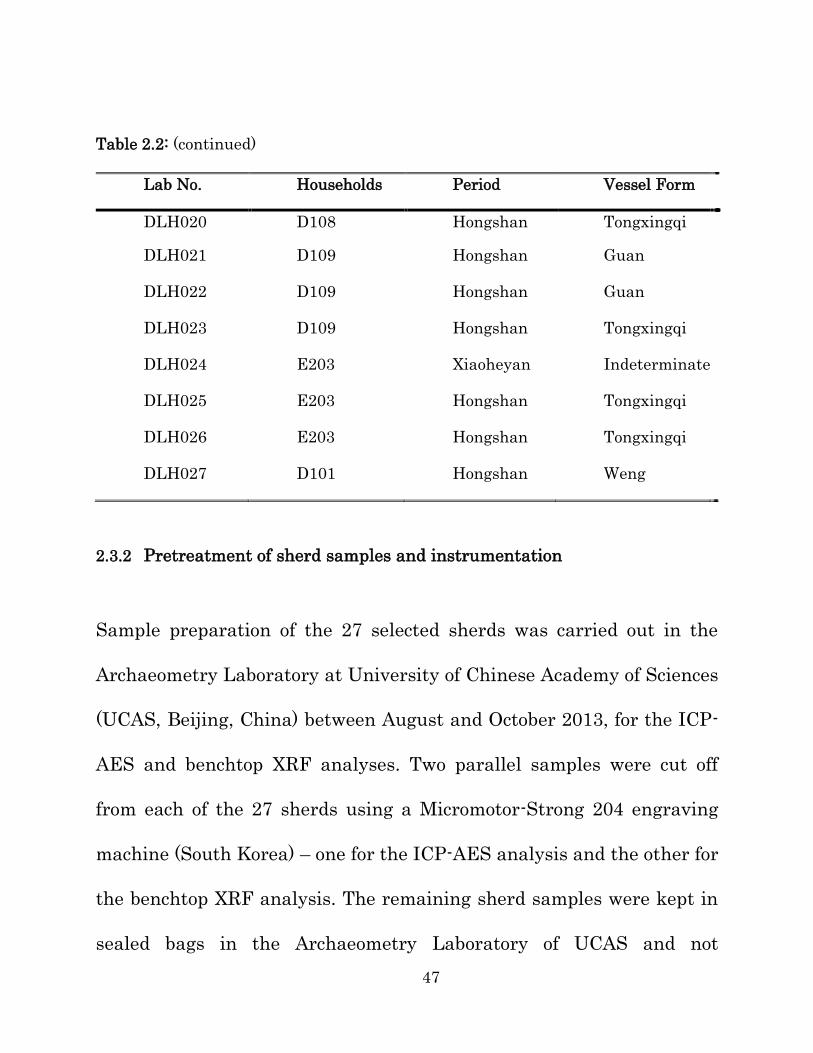
Table 2.2: (continued)
Lab No. Households Period Vessel Form
DLH020 D108 Hongshan Tongxingqi
DLH021 D109 Hongshan Guan
DLH022 D109 Hongshan Guan
DLH023 D109 Hongshan Tongxingqi
DLH024 E203 Xiaoheyan Indeterminate
DLH025 E203 Hongshan Tongxingqi
DLH026 E203 Hongshan Tongxingqi
DLH027 D101 Hongshan Weng
2.3.2 Pretreatment of sherd samples and instrumentation
Sample preparation of the 27 selected sherds was carried out in the
Archaeometry Laboratory at University of Chinese Academy of Sciences
(UCAS, Beijing, China) between August and October 2013, for the ICP-
AES and benchtop XRF analyses. Two parallel samples were cut off
from each of the 27 sherds using a Micromotor-Strong 204 engraving
machine (South Korea) – one for the ICP-AES analysis and the other for
the benchtop XRF analysis. The remaining sherd samples were kept in
sealed bags in the Archaeometry Laboratory of UCAS and not
48
investigated by portable XRF spectrometer until the middle June of
2014 (roughly eight months after the ICP-AES and benchtop XRF
analyses were done).
The procedures to prepare cut sherd samples into solution for the
ICP-AES analysis followed what LI Baoping et al. (2003) has described
in a research paper on applying ICP-MS to ancient Chinese ceramics.
The procedures can be described, in order of priority, as follows: (1) Cut
sherd samples weighing about 250 mg were washed in an ultrasonic
cleaning tank, dried, ground into powder, and passed through a 200-
mesh sieve. (2) The sieved powders were digested with distilled HF and
HNO3 acids in for 24 hours and then immersed in ultra-purified water
for another 24 hours. (3) Dried samples of 100 mg were weighed out and
digested in a solution of aqua regia, perchloric acid and hydrofluoric
acid at 160°C for seven days to be sure all minerals (especially
refractory minerals such as zircon) were dissolved. (4) The liquid
solution was then heated until nearly dry and distilled by 1 ml of aqua
regia.
Sample preparation for the benchtop XRF analysis (or more
precisely, benchtop XRF with the fusion method) was done in a similar
49
way as it was for the ICP-AES analysis, except that the sample was
finally made into fused beads, rather than solutions. Axios-Minerals
wavelength dispersive XRF spectrometer (PANalytical, the
Netherlands) was used in this pilot study, whose X-ray excitation
system consists of a 2.4 kW XRF Super Sharp Tube (SST) with Rh-
anode. The cut sherd samples were ground into powders with agate
mortar, and passed through the 360-mesh sieve. The powders were then
dried to constant weight by being baked at 200℃ for 120 minutes, from
which 0.5 g was selected and placed in an electric XRF bead fusion
furnace until they were transformed into glass beads. The fused glass
beads were fabricated using CLAISSE M4 Gas Fluxer (Canada), and
the fusion agent was 5 g of lithium tetraborate (Li2B4O7).
The pXRF analysis was carried out on the 27 remaining sherd
samples in the middle June of 2014 when they were taken back to the
Niuheliang Workstation (western Liaoning, China), where the original
27 sherds as well as all other sherds collected in the upper Daling
project were housed. Practically speaking, the pXRF analysis can be
done without any pre-treatment on sherd samples. However, most
investigators usually prefer to have their samples pre-prepared in order
50
to obtain better (more reliable and consistent) results. The sample
preparation is quite easy and straightforward compared to those carried
out for ICP-AES and benchtop XRF analyses. Section where two smaller
sherd samples were cut off for the ICP-AES and benchtop XRF analyses
was manually polished on waterproof sandpapers until a smooth
surface was produced on the cross-section of sherd. For the reliability
and consistency concerns, multiple (usually three) pXRF readings were
collected from different areas on each sherd (this means that smooth
surface on each sherd’s cross section should better be three times or
more as large as the 3 mm diameter X-ray beam). If the sherd’s cross
section turned out to be a lot thinner and would not allow for collecting
(more than one) pXRF readings from it, then the sherd’s surface
(outside and/or inside) would be polished in the same way as for the
cross-section of sherd to make sure at least two pXRF readings were
collected for this particular sherd. (More details about collecting pXRF
readings from Hongshan core zone pottery will be presented in section
2.5)
Once the sample preparation was done, the solutions for ICP-AES
analysis and the fused beads for benchtop XRF analysis were analyzed
51
by a Thermo Jarrell Ash IRIS Advantage (USA) ICP spectrometer and a
PANalytical Axios-Minerals XRF-1500 spectrometer (the Netherlands),
respectively, in the Rock/Mineral Preparation and Analysis Lab at the
Institute of Geology and Geophysics (IGG), Chinese Academy of
Sciences (Beijing, China). The pXRF analyzer used in this dissertation –
the Niton XL3t 950 GOLDD+ (Thermo Scientific, USA) – was rented
from a Thermo Fisher Scientific seller in Beijing (China).
2.3.3 Detected elements and concentrations
Major, minor, and trace elements were detected and reported by all the
three analytical methods and techniques (ICP-AES, benchtop XRF, and
pXRF). Following the definitions given by International Union of Pure
and Applied Chemistry (IUPAC), major, minor, and trace elements refer
to substance in concentration of 1–100%, <1%, and <0.01% (or <100
ppm), respectively. However, it should be pointed out that in actual
scientific research the distinction among major, minor and trace
elements can sometimes be subtle, that is, a by-definition trace element
in one organic or inorganic matter (for example, Zirconium or Zr in soils)
can also be a major or minor element in another (such as Zr in zircon)
52
where its abundance was highly concentrated, and vice versa.
Thus, it is important to keep in mind which material systems the
elements were extracted from while talking about the categories of
major, minor, and trace elements. In this dissertation, for convenience
of discussion, a subjective distinction was made between major and
minor/trace elements, that is, detected elements whose concentrations
were at 1% or higher would be treated as a single category – the major
element category, while those with concentrations of less than 1% would
be treated as another – the minor/trace element category.
It is also worth mentioning that, due to different principles of
operation, limit of detection, signal processing, and other factors, the
three analytical approaches reported different combinations of elements
and different measurements of concentrations (even for the same
element). Therefore, even if concentrations of one particular element
were reported by all the three analytical methods, it would be wise not
to compare them directly in their raw, numerical forms. One can either
(1) compare different sherds for concentrations (raw, numeric forms) of
the same element(s) reported by the same technique, or (2) apply
standardization to measured concentrations first, and then compare
53
standardized data from different techniques using statistical tools.
In ICP-AES analysis, concentrations of six major elements (Al, Fe,
Ca, K, Na, Mg, with oxides expressed in weight percentage, %) and
fourteen minor/trace elements (Ti, Mn, P, with oxides expressed in
weight percentage, %; Co, Cu, Li, Mo, Ni, Sr, U, V, Y, Zn and Zr, in
ppm) were determined for each sherd specimen. Results of ICP-AES
analysis are shown in Table 2.3, Table 2.4, and Table 2.5.
For the benchtop XRF analysis, concentrations of seven major
elements (Si, Al, Fe, Mg, Ca, Na, K, with oxides expressed in weight
percentage, %) and eighteen minor/trace elements (Ti, Mn, P, with
oxides expressed in weight percentage, %; Ba, Co, Cr, Cu, Ga, Nb, Ni,
Pb, Rb, Sr, Th, V, Y, Zn, and Zr, in ppm) were measured for each of the
27 sherds. Results are shown in Table 2.6, Table 2.7, and Table 2.8.
Concentrations of up to 33 elements are reported in each pXRF
reading; however, only eleven of them (two major elements such as Fe
and K; and nine minor/trace elements such as Ba, Zr, Sr, Rb, Zn, Ni,
Mn, Ti, and Ca) were consistently and reliably recorded (see section 3.1
for a detailed discussion of how these eleven elements was determined).
Results of pXRF analysis are shown in Table 2.9 and Table 2.10.
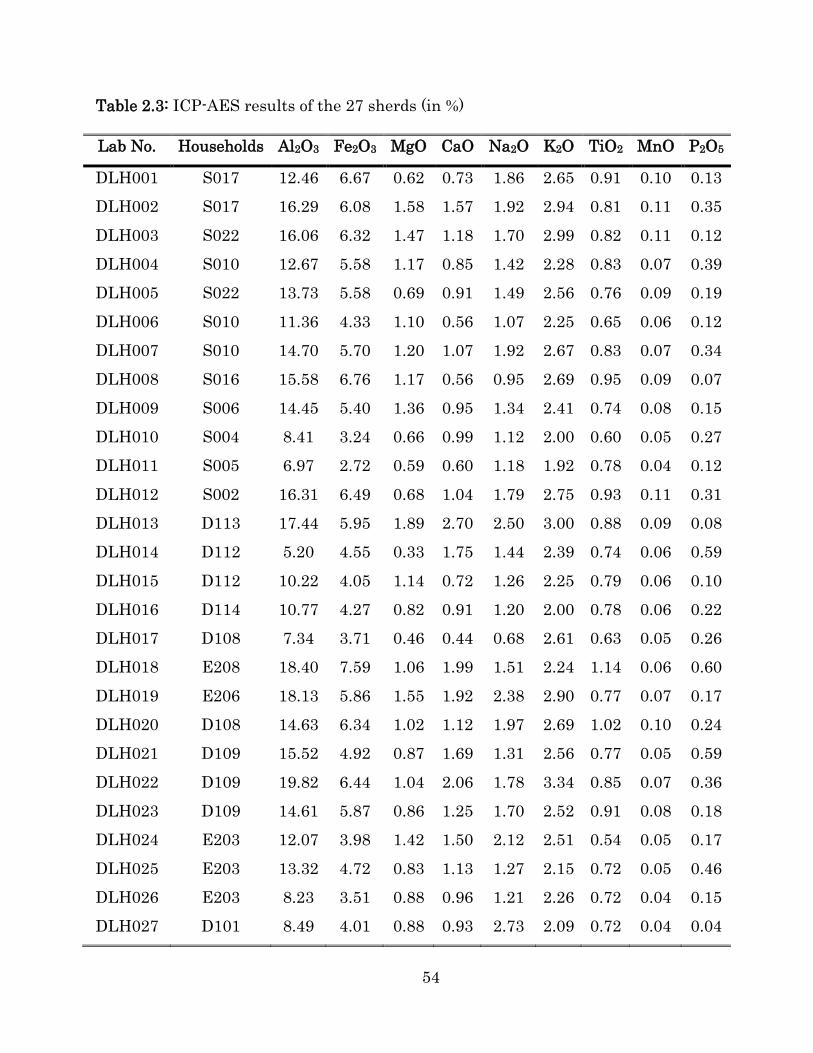
54
Table 2.3: ICP-AES results of the 27 sherds (in %)
Lab No. Households Al2O3 Fe2O3 MgO CaO Na2O K2O TiO2 MnO P2O5
DLH001 S017 12.46 6.67 0.62 0.73 1.86 2.65 0.91 0.10 0.13
DLH002 S017 16.29 6.08 1.58 1.57 1.92 2.94 0.81 0.11 0.35
DLH003 S022 16.06 6.32 1.47 1.18 1.70 2.99 0.82 0.11 0.12
DLH004 S010 12.67 5.58 1.17 0.85 1.42 2.28 0.83 0.07 0.39
DLH005 S022 13.73 5.58 0.69 0.91 1.49 2.56 0.76 0.09 0.19
DLH006 S010 11.36 4.33 1.10 0.56 1.07 2.25 0.65 0.06 0.12
DLH007 S010 14.70 5.70 1.20 1.07 1.92 2.67 0.83 0.07 0.34
DLH008 S016 15.58 6.76 1.17 0.56 0.95 2.69 0.95 0.09 0.07
DLH009 S006 14.45 5.40 1.36 0.95 1.34 2.41 0.74 0.08 0.15
DLH010 S004 8.41 3.24 0.66 0.99 1.12 2.00 0.60 0.05 0.27
DLH011 S005 6.97 2.72 0.59 0.60 1.18 1.92 0.78 0.04 0.12
DLH012 S002 16.31 6.49 0.68 1.04 1.79 2.75 0.93 0.11 0.31
DLH013 D113 17.44 5.95 1.89 2.70 2.50 3.00 0.88 0.09 0.08
DLH014 D112 5.20 4.55 0.33 1.75 1.44 2.39 0.74 0.06 0.59
DLH015 D112 10.22 4.05 1.14 0.72 1.26 2.25 0.79 0.06 0.10
DLH016 D114 10.77 4.27 0.82 0.91 1.20 2.00 0.78 0.06 0.22
DLH017 D108 7.34 3.71 0.46 0.44 0.68 2.61 0.63 0.05 0.26
DLH018 E208 18.40 7.59 1.06 1.99 1.51 2.24 1.14 0.06 0.60
DLH019 E206 18.13 5.86 1.55 1.92 2.38 2.90 0.77 0.07 0.17
DLH020 D108 14.63 6.34 1.02 1.12 1.97 2.69 1.02 0.10 0.24
DLH021 D109 15.52 4.92 0.87 1.69 1.31 2.56 0.77 0.05 0.59
DLH022 D109 19.82 6.44 1.04 2.06 1.78 3.34 0.85 0.07 0.36
DLH023 D109 14.61 5.87 0.86 1.25 1.70 2.52 0.91 0.08 0.18
DLH024 E203 12.07 3.98 1.42 1.50 2.12 2.51 0.54 0.05 0.17
DLH025 E203 13.32 4.72 0.83 1.13 1.27 2.15 0.72 0.05 0.46
DLH026 E203 8.23 3.51 0.88 0.96 1.21 2.26 0.72 0.04 0.15
DLH027 D101 8.49 4.01 0.88 0.93 2.73 2.09 0.72 0.04 0.04
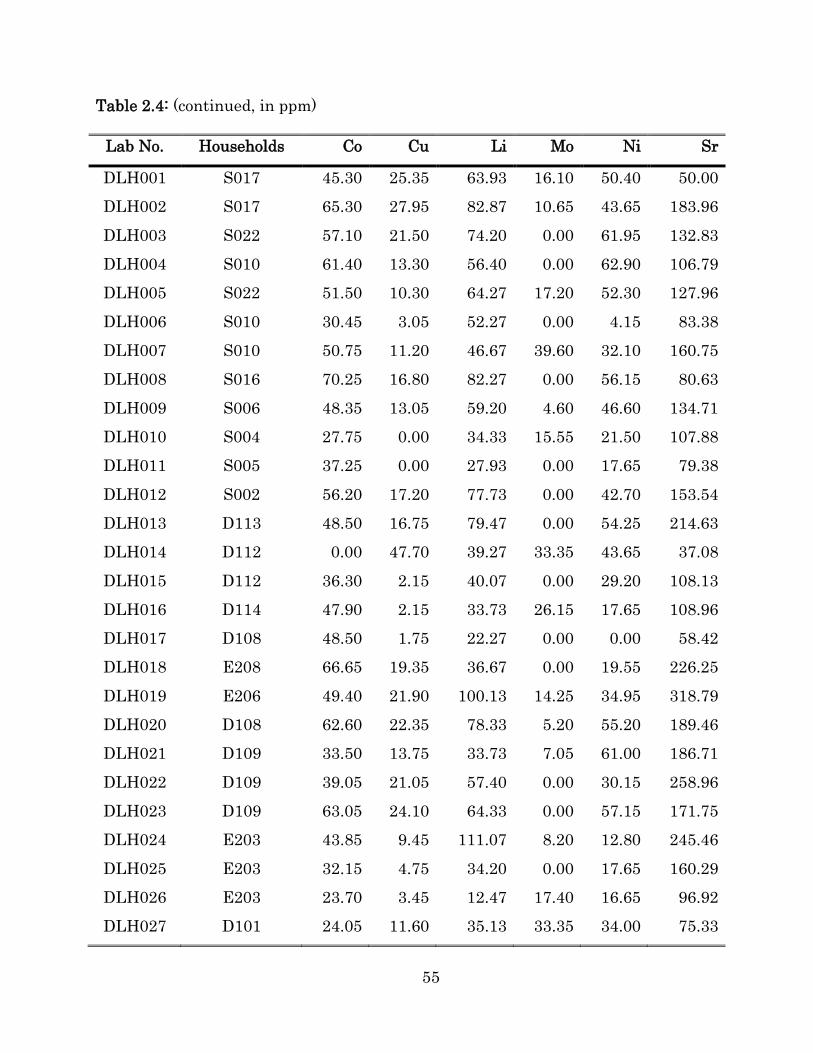
55
Table 2.4: (continued, in ppm)
Lab No. Households Co Cu Li Mo Ni Sr
DLH001 S017 45.30 25.35 63.93 16.10 50.40 50.00
DLH002 S017 65.30 27.95 82.87 10.65 43.65 183.96
DLH003 S022 57.10 21.50 74.20 0.00 61.95 132.83
DLH004 S010 61.40 13.30 56.40 0.00 62.90 106.79
DLH005 S022 51.50 10.30 64.27 17.20 52.30 127.96
DLH006 S010 30.45 3.05 52.27 0.00 4.15 83.38
DLH007 S010 50.75 11.20 46.67 39.60 32.10 160.75
DLH008 S016 70.25 16.80 82.27 0.00 56.15 80.63
DLH009 S006 48.35 13.05 59.20 4.60 46.60 134.71
DLH010 S004 27.75 0.00 34.33 15.55 21.50 107.88
DLH011 S005 37.25 0.00 27.93 0.00 17.65 79.38
DLH012 S002 56.20 17.20 77.73 0.00 42.70 153.54
DLH013 D113 48.50 16.75 79.47 0.00 54.25 214.63
DLH014 D112 0.00 47.70 39.27 33.35 43.65 37.08
DLH015 D112 36.30 2.15 40.07 0.00 29.20 108.13
DLH016 D114 47.90 2.15 33.73 26.15 17.65 108.96
DLH017 D108 48.50 1.75 22.27 0.00 0.00 58.42
DLH018 E208 66.65 19.35 36.67 0.00 19.55 226.25
DLH019 E206 49.40 21.90 100.13 14.25 34.95 318.79
DLH020 D108 62.60 22.35 78.33 5.20 55.20 189.46
DLH021 D109 33.50 13.75 33.73 7.05 61.00 186.71
DLH022 D109 39.05 21.05 57.40 0.00 30.15 258.96
DLH023 D109 63.05 24.10 64.33 0.00 57.15 171.75
DLH024 E203 43.85 9.45 111.07 8.20 12.80 245.46
DLH025 E203 32.15 4.75 34.20 0.00 17.65 160.29
DLH026 E203 23.70 3.45 12.47 17.40 16.65 96.92
DLH027 D101 24.05 11.60 35.13 33.35 34.00 75.33
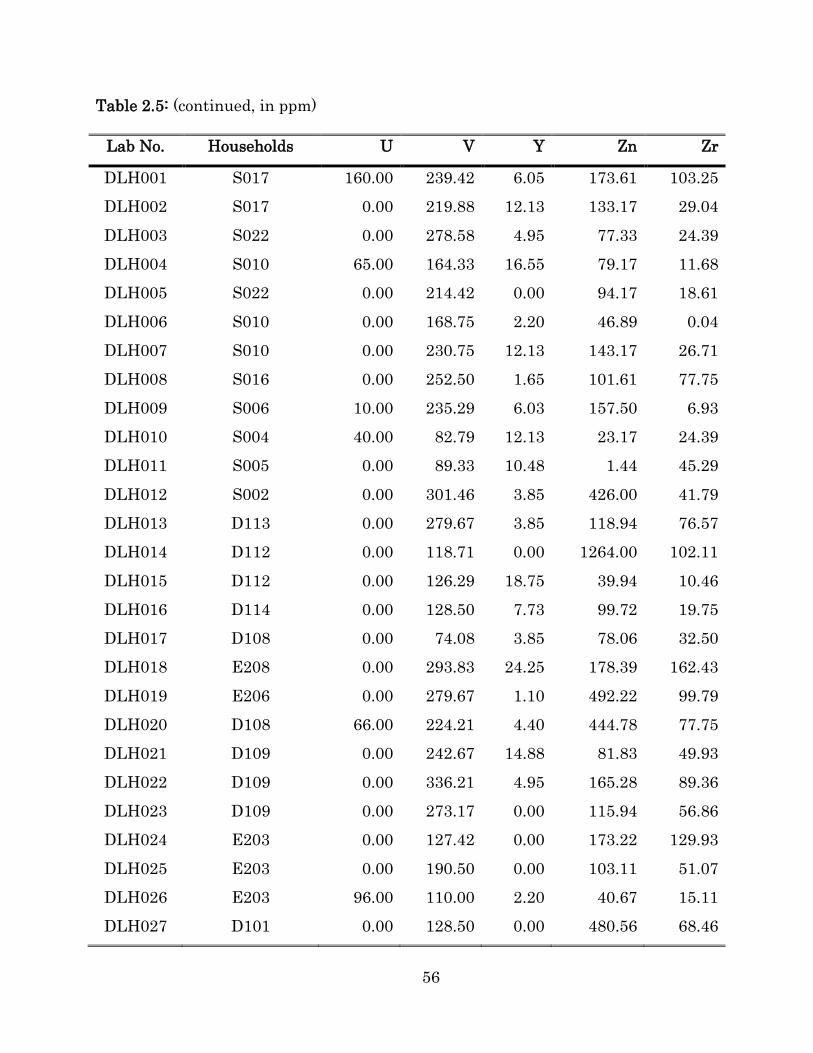
56
Table 2.5: (continued, in ppm)
Lab No. Households U V Y Zn Zr
DLH001 S017 160.00 239.42 6.05 173.61 103.25
DLH002 S017 0.00 219.88 12.13 133.17 29.04
DLH003 S022 0.00 278.58 4.95 77.33 24.39
DLH004 S010 65.00 164.33 16.55 79.17 11.68
DLH005 S022 0.00 214.42 0.00 94.17 18.61
DLH006 S010 0.00 168.75 2.20 46.89 0.04
DLH007 S010 0.00 230.75 12.13 143.17 26.71
DLH008 S016 0.00 252.50 1.65 101.61 77.75
DLH009 S006 10.00 235.29 6.03 157.50 6.93
DLH010 S004 40.00 82.79 12.13 23.17 24.39
DLH011 S005 0.00 89.33 10.48 1.44 45.29
DLH012 S002 0.00 301.46 3.85 426.00 41.79
DLH013 D113 0.00 279.67 3.85 118.94 76.57
DLH014 D112 0.00 118.71 0.00 1264.00 102.11
DLH015 D112 0.00 126.29 18.75 39.94 10.46
DLH016 D114 0.00 128.50 7.73 99.72 19.75
DLH017 D108 0.00 74.08 3.85 78.06 32.50
DLH018 E208 0.00 293.83 24.25 178.39 162.43
DLH019 E206 0.00 279.67 1.10 492.22 99.79
DLH020 D108 66.00 224.21 4.40 444.78 77.75
DLH021 D109 0.00 242.67 14.88 81.83 49.93
DLH022 D109 0.00 336.21 4.95 165.28 89.36
DLH023 D109 0.00 273.17 0.00 115.94 56.86
DLH024 E203 0.00 127.42 0.00 173.22 129.93
DLH025 E203 0.00 190.50 0.00 103.11 51.07
DLH026 E203 96.00 110.00 2.20 40.67 15.11
DLH027 D101 0.00 128.50 0.00 480.56 68.46
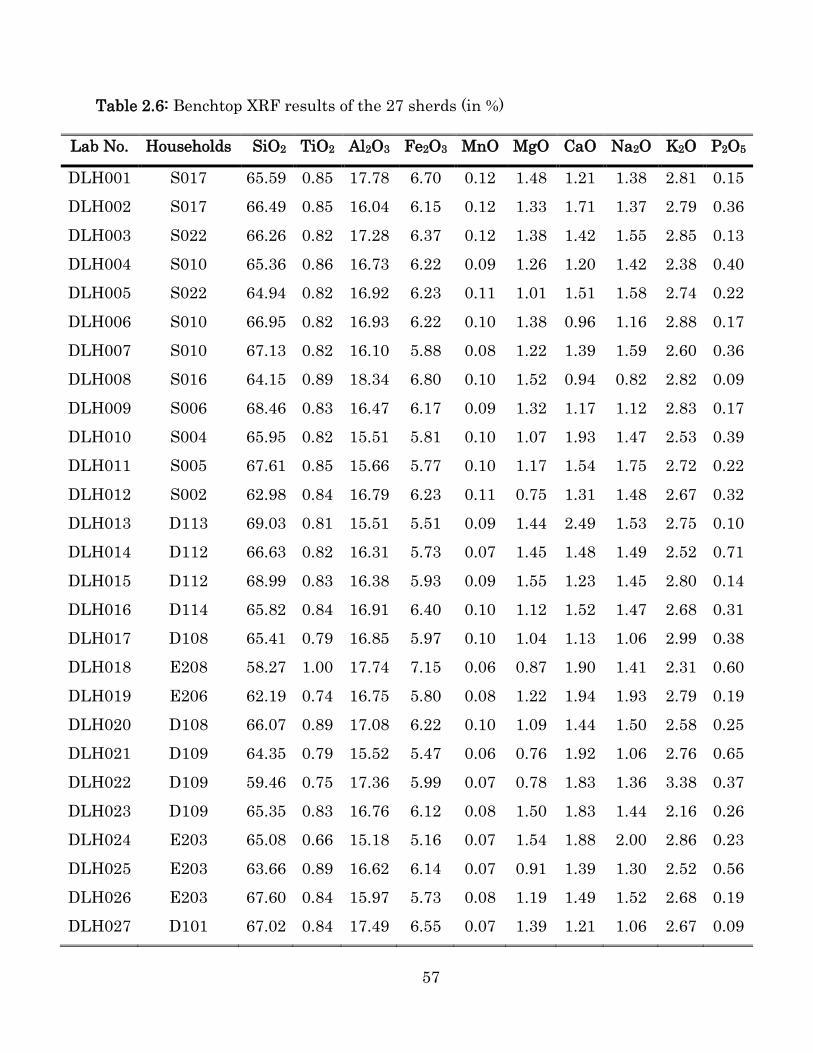
57
Table 2.6: Benchtop XRF results of the 27 sherds (in %)
Lab No. Households SiO2 TiO2 Al2O3 Fe2O3 MnO MgO CaO Na2O K2O P2O5
DLH001 S017 65.59 0.85 17.78 6.70 0.12 1.48 1.21 1.38 2.81 0.15
DLH002 S017 66.49 0.85 16.04 6.15 0.12 1.33 1.71 1.37 2.79 0.36
DLH003 S022 66.26 0.82 17.28 6.37 0.12 1.38 1.42 1.55 2.85 0.13
DLH004 S010 65.36 0.86 16.73 6.22 0.09 1.26 1.20 1.42 2.38 0.40
DLH005 S022 64.94 0.82 16.92 6.23 0.11 1.01 1.51 1.58 2.74 0.22
DLH006 S010 66.95 0.82 16.93 6.22 0.10 1.38 0.96 1.16 2.88 0.17
DLH007 S010 67.13 0.82 16.10 5.88 0.08 1.22 1.39 1.59 2.60 0.36
DLH008 S016 64.15 0.89 18.34 6.80 0.10 1.52 0.94 0.82 2.82 0.09
DLH009 S006 68.46 0.83 16.47 6.17 0.09 1.32 1.17 1.12 2.83 0.17
DLH010 S004 65.95 0.82 15.51 5.81 0.10 1.07 1.93 1.47 2.53 0.39
DLH011 S005 67.61 0.85 15.66 5.77 0.10 1.17 1.54 1.75 2.72 0.22
DLH012 S002 62.98 0.84 16.79 6.23 0.11 0.75 1.31 1.48 2.67 0.32
DLH013 D113 69.03 0.81 15.51 5.51 0.09 1.44 2.49 1.53 2.75 0.10
DLH014 D112 66.63 0.82 16.31 5.73 0.07 1.45 1.48 1.49 2.52 0.71
DLH015 D112 68.99 0.83 16.38 5.93 0.09 1.55 1.23 1.45 2.80 0.14
DLH016 D114 65.82 0.84 16.91 6.40 0.10 1.12 1.52 1.47 2.68 0.31
DLH017 D108 65.41 0.79 16.85 5.97 0.10 1.04 1.13 1.06 2.99 0.38
DLH018 E208 58.27 1.00 17.74 7.15 0.06 0.87 1.90 1.41 2.31 0.60
DLH019 E206 62.19 0.74 16.75 5.80 0.08 1.22 1.94 1.93 2.79 0.19
DLH020 D108 66.07 0.89 17.08 6.22 0.10 1.09 1.44 1.50 2.58 0.25
DLH021 D109 64.35 0.79 15.52 5.47 0.06 0.76 1.92 1.06 2.76 0.65
DLH022 D109 59.46 0.75 17.36 5.99 0.07 0.78 1.83 1.36 3.38 0.37
DLH023 D109 65.35 0.83 16.76 6.12 0.08 1.50 1.83 1.44 2.16 0.26
DLH024 E203 65.08 0.66 15.18 5.16 0.07 1.54 1.88 2.00 2.86 0.23
DLH025 E203 63.66 0.89 16.62 6.14 0.07 0.91 1.39 1.30 2.52 0.56
DLH026 E203 67.60 0.84 15.97 5.73 0.08 1.19 1.49 1.52 2.68 0.19
DLH027 D101 67.02 0.84 17.49 6.55 0.07 1.39 1.21 1.06 2.67 0.09
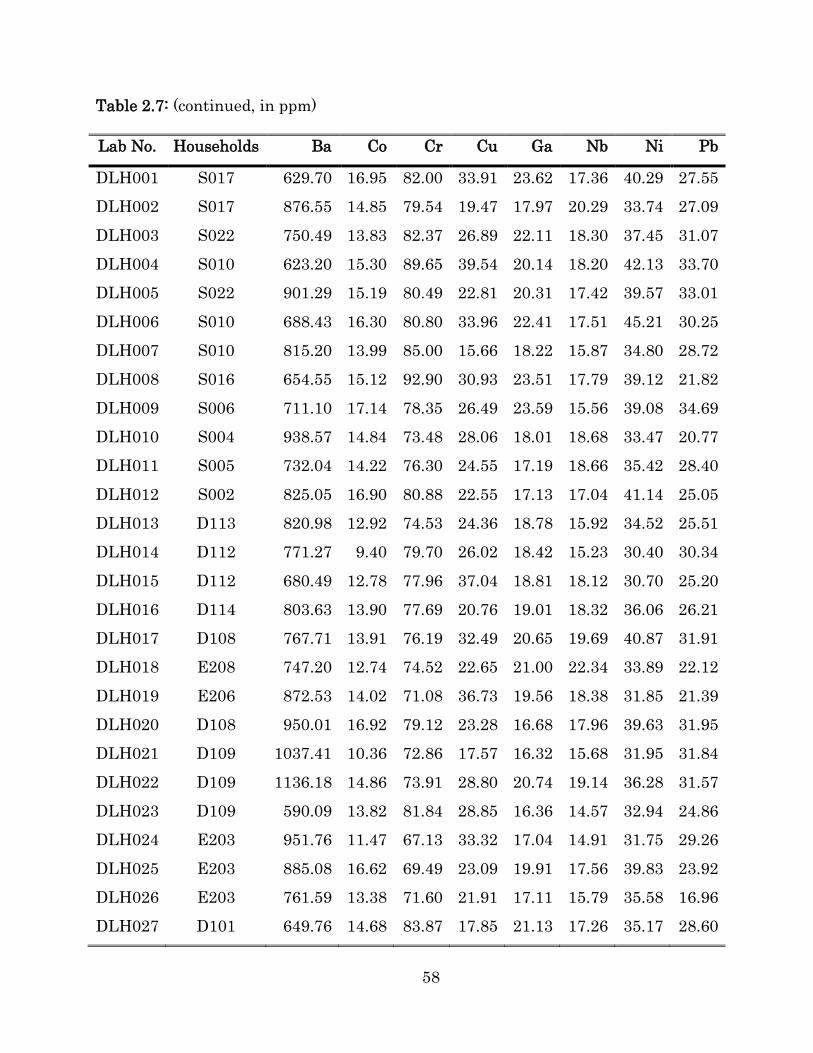
58
Table 2.7: (continued, in ppm)
Lab No. Households Ba Co Cr Cu Ga Nb Ni Pb
DLH001 S017 629.70 16.95 82.00 33.91 23.62 17.36 40.29 27.55
DLH002 S017 876.55 14.85 79.54 19.47 17.97 20.29 33.74 27.09
DLH003 S022 750.49 13.83 82.37 26.89 22.11 18.30 37.45 31.07
DLH004 S010 623.20 15.30 89.65 39.54 20.14 18.20 42.13 33.70
DLH005 S022 901.29 15.19 80.49 22.81 20.31 17.42 39.57 33.01
DLH006 S010 688.43 16.30 80.80 33.96 22.41 17.51 45.21 30.25
DLH007 S010 815.20 13.99 85.00 15.66 18.22 15.87 34.80 28.72
DLH008 S016 654.55 15.12 92.90 30.93 23.51 17.79 39.12 21.82
DLH009 S006 711.10 17.14 78.35 26.49 23.59 15.56 39.08 34.69
DLH010 S004 938.57 14.84 73.48 28.06 18.01 18.68 33.47 20.77
DLH011 S005 732.04 14.22 76.30 24.55 17.19 18.66 35.42 28.40
DLH012 S002 825.05 16.90 80.88 22.55 17.13 17.04 41.14 25.05
DLH013 D113 820.98 12.92 74.53 24.36 18.78 15.92 34.52 25.51
DLH014 D112 771.27 9.40 79.70 26.02 18.42 15.23 30.40 30.34
DLH015 D112 680.49 12.78 77.96 37.04 18.81 18.12 30.70 25.20
DLH016 D114 803.63 13.90 77.69 20.76 19.01 18.32 36.06 26.21
DLH017 D108 767.71 13.91 76.19 32.49 20.65 19.69 40.87 31.91
DLH018 E208 747.20 12.74 74.52 22.65 21.00 22.34 33.89 22.12
DLH019 E206 872.53 14.02 71.08 36.73 19.56 18.38 31.85 21.39
DLH020 D108 950.01 16.92 79.12 23.28 16.68 17.96 39.63 31.95
DLH021 D109 1037.41 10.36 72.86 17.57 16.32 15.68 31.95 31.84
DLH022 D109 1136.18 14.86 73.91 28.80 20.74 19.14 36.28 31.57
DLH023 D109 590.09 13.82 81.84 28.85 16.36 14.57 32.94 24.86
DLH024 E203 951.76 11.47 67.13 33.32 17.04 14.91 31.75 29.26
DLH025 E203 885.08 16.62 69.49 23.09 19.91 17.56 39.83 23.92
DLH026 E203 761.59 13.38 71.60 21.91 17.11 15.79 35.58 16.96
DLH027 D101 649.76 14.68 83.87 17.85 21.13 17.26 35.17 28.60
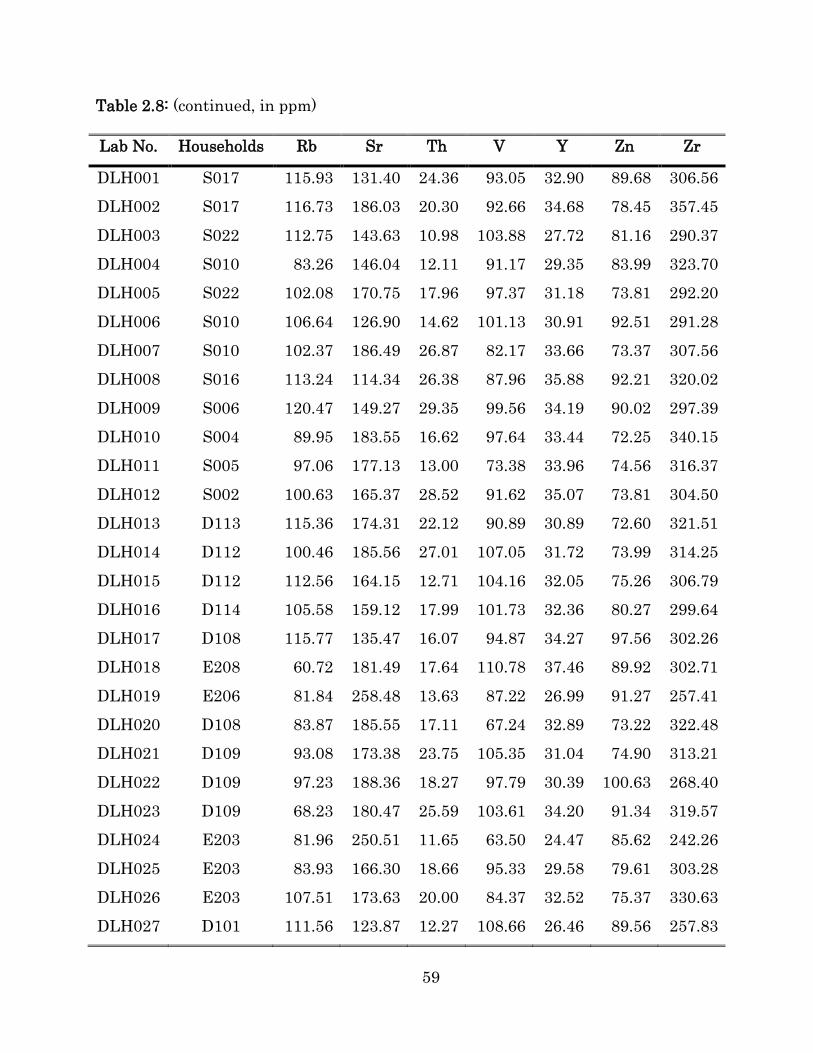
59
Table 2.8: (continued, in ppm)
Lab No. Households Rb Sr Th V Y Zn Zr
DLH001 S017 115.93 131.40 24.36 93.05 32.90 89.68 306.56
DLH002 S017 116.73 186.03 20.30 92.66 34.68 78.45 357.45
DLH003 S022 112.75 143.63 10.98 103.88 27.72 81.16 290.37
DLH004 S010 83.26 146.04 12.11 91.17 29.35 83.99 323.70
DLH005 S022 102.08 170.75 17.96 97.37 31.18 73.81 292.20
DLH006 S010 106.64 126.90 14.62 101.13 30.91 92.51 291.28
DLH007 S010 102.37 186.49 26.87 82.17 33.66 73.37 307.56
DLH008 S016 113.24 114.34 26.38 87.96 35.88 92.21 320.02
DLH009 S006 120.47 149.27 29.35 99.56 34.19 90.02 297.39
DLH010 S004 89.95 183.55 16.62 97.64 33.44 72.25 340.15
DLH011 S005 97.06 177.13 13.00 73.38 33.96 74.56 316.37
DLH012 S002 100.63 165.37 28.52 91.62 35.07 73.81 304.50
DLH013 D113 115.36 174.31 22.12 90.89 30.89 72.60 321.51
DLH014 D112 100.46 185.56 27.01 107.05 31.72 73.99 314.25
DLH015 D112 112.56 164.15 12.71 104.16 32.05 75.26 306.79
DLH016 D114 105.58 159.12 17.99 101.73 32.36 80.27 299.64
DLH017 D108 115.77 135.47 16.07 94.87 34.27 97.56 302.26
DLH018 E208 60.72 181.49 17.64 110.78 37.46 89.92 302.71
DLH019 E206 81.84 258.48 13.63 87.22 26.99 91.27 257.41
DLH020 D108 83.87 185.55 17.11 67.24 32.89 73.22 322.48
DLH021 D109 93.08 173.38 23.75 105.35 31.04 74.90 313.21
DLH022 D109 97.23 188.36 18.27 97.79 30.39 100.63 268.40
DLH023 D109 68.23 180.47 25.59 103.61 34.20 91.34 319.57
DLH024 E203 81.96 250.51 11.65 63.50 24.47 85.62 242.26
DLH025 E203 83.93 166.30 18.66 95.33 29.58 79.61 303.28
DLH026 E203 107.51 173.63 20.00 84.37 32.52 75.37 330.63
DLH027 D101 111.56 123.87 12.27 108.66 26.46 89.56 257.83
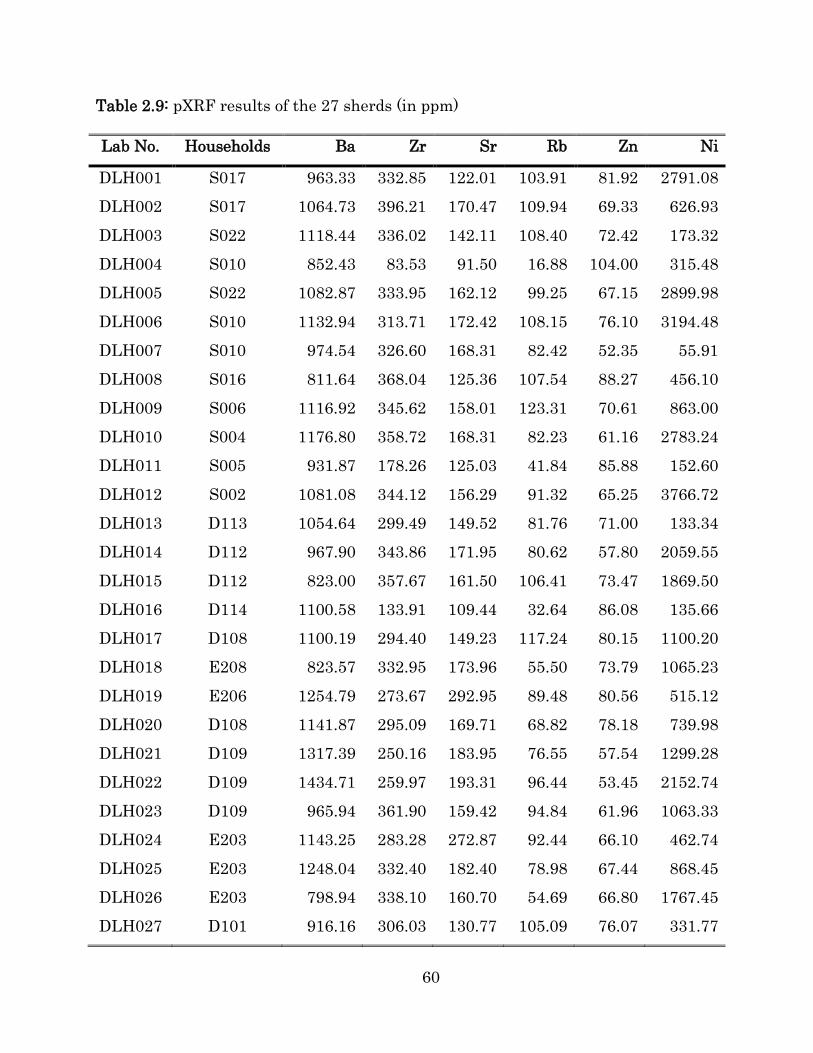
60
Table 2.9: pXRF results of the 27 sherds (in ppm)
Lab No. Households Ba Zr Sr Rb Zn Ni
DLH001 S017 963.33 332.85 122.01 103.91 81.92 2791.08
DLH002 S017 1064.73 396.21 170.47 109.94 69.33 626.93
DLH003 S022 1118.44 336.02 142.11 108.40 72.42 173.32
DLH004 S010 852.43 83.53 91.50 16.88 104.00 315.48
DLH005 S022 1082.87 333.95 162.12 99.25 67.15 2899.98
DLH006 S010 1132.94 313.71 172.42 108.15 76.10 3194.48
DLH007 S010 974.54 326.60 168.31 82.42 52.35 55.91
DLH008 S016 811.64 368.04 125.36 107.54 88.27 456.10
DLH009 S006 1116.92 345.62 158.01 123.31 70.61 863.00
DLH010 S004 1176.80 358.72 168.31 82.23 61.16 2783.24
DLH011 S005 931.87 178.26 125.03 41.84 85.88 152.60
DLH012 S002 1081.08 344.12 156.29 91.32 65.25 3766.72
DLH013 D113 1054.64 299.49 149.52 81.76 71.00 133.34
DLH014 D112 967.90 343.86 171.95 80.62 57.80 2059.55
DLH015 D112 823.00 357.67 161.50 106.41 73.47 1869.50
DLH016 D114 1100.58 133.91 109.44 32.64 86.08 135.66
DLH017 D108 1100.19 294.40 149.23 117.24 80.15 1100.20
DLH018 E208 823.57 332.95 173.96 55.50 73.79 1065.23
DLH019 E206 1254.79 273.67 292.95 89.48 80.56 515.12
DLH020 D108 1141.87 295.09 169.71 68.82 78.18 739.98
DLH021 D109 1317.39 250.16 183.95 76.55 57.54 1299.28
DLH022 D109 1434.71 259.97 193.31 96.44 53.45 2152.74
DLH023 D109 965.94 361.90 159.42 94.84 61.96 1063.33
DLH024 E203 1143.25 283.28 272.87 92.44 66.10 462.74
DLH025 E203 1248.04 332.40 182.40 78.98 67.44 868.45
DLH026 E203 798.94 338.10 160.70 54.69 66.80 1767.45
DLH027 D101 916.16 306.03 130.77 105.09 76.07 331.77
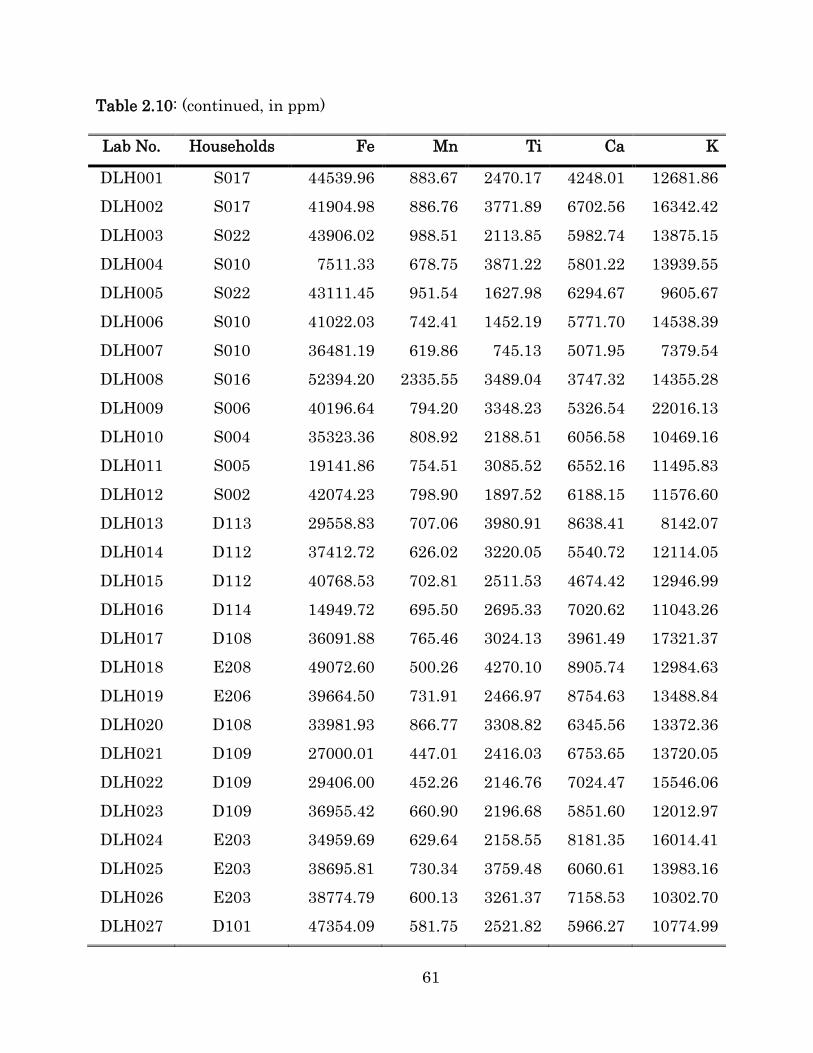
61
Table 2.10: (continued, in ppm)
Lab No. Households Fe Mn Ti Ca K
DLH001 S017 44539.96 883.67 2470.17 4248.01 12681.86
DLH002 S017 41904.98 886.76 3771.89 6702.56 16342.42
DLH003 S022 43906.02 988.51 2113.85 5982.74 13875.15
DLH004 S010 7511.33 678.75 3871.22 5801.22 13939.55
DLH005 S022 43111.45 951.54 1627.98 6294.67 9605.67
DLH006 S010 41022.03 742.41 1452.19 5771.70 14538.39
DLH007 S010 36481.19 619.86 745.13 5071.95 7379.54
DLH008 S016 52394.20 2335.55 3489.04 3747.32 14355.28
DLH009 S006 40196.64 794.20 3348.23 5326.54 22016.13
DLH010 S004 35323.36 808.92 2188.51 6056.58 10469.16
DLH011 S005 19141.86 754.51 3085.52 6552.16 11495.83
DLH012 S002 42074.23 798.90 1897.52 6188.15 11576.60
DLH013 D113 29558.83 707.06 3980.91 8638.41 8142.07
DLH014 D112 37412.72 626.02 3220.05 5540.72 12114.05
DLH015 D112 40768.53 702.81 2511.53 4674.42 12946.99
DLH016 D114 14949.72 695.50 2695.33 7020.62 11043.26
DLH017 D108 36091.88 765.46 3024.13 3961.49 17321.37
DLH018 E208 49072.60 500.26 4270.10 8905.74 12984.63
DLH019 E206 39664.50 731.91 2466.97 8754.63 13488.84
DLH020 D108 33981.93 866.77 3308.82 6345.56 13372.36
DLH021 D109 27000.01 447.01 2416.03 6753.65 13720.05
DLH022 D109 29406.00 452.26 2146.76 7024.47 15546.06
DLH023 D109 36955.42 660.90 2196.68 5851.60 12012.97
DLH024 E203 34959.69 629.64 2158.55 8181.35 16014.41
DLH025 E203 38695.81 730.34 3759.48 6060.61 13983.16
DLH026 E203 38774.79 600.13 3261.37 7158.53 10302.70
DLH027 D101 47354.09 581.75 2521.82 5966.27 10774.99
62
2.3.4 HCA of standardized ICP-AES, XRF, and pXRF data
Different combinations of elements reported by the three analytical
approaches and their concentration values for the 27 sherds can be
treated as three individual geochemical datasets (one for ICP-AES
results, one for benchtop XRF results, and yet another one for pXRF
results). Hierarchical cluster analysis (HCA) provides an opportunity to
explore the patterned distribution of these 27 sherds by examining how
each single sherd was at first aligned separately and then grouped into
clusters with other sherds based on the similarity/dissimilarity in their
geochemical compositions.
As was suggested in section 2.3.3, measurements of concentrations
of chosen elements in each datasets were standardized before the HCA.
The standardization was done first by computing z-scores by
subtracting the mean concentration of an element from concentration
recorded for that particular element in each sherd specimen (whether it
is a ICP-AES, a benchtop XRF, or a pXRF one), then by dividing the
difference by the standard deviation of the batch of readings for that
particular element.
Once the z-score standardization was done, HCA was applied to
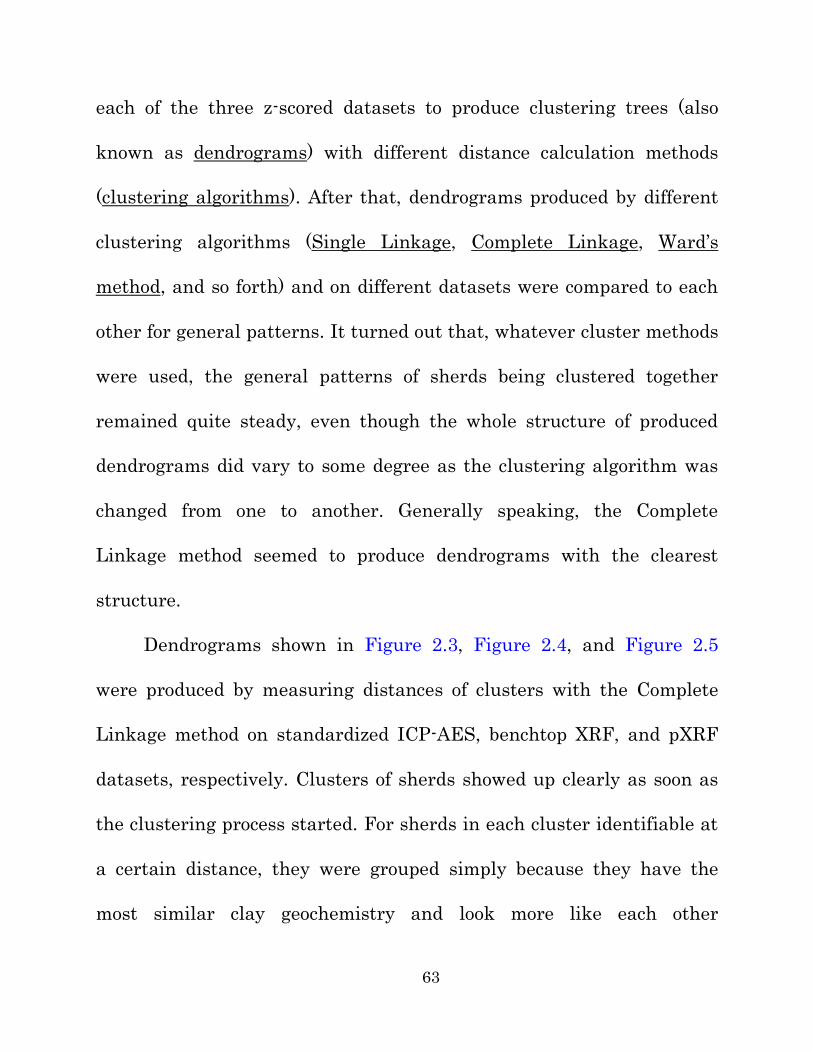
63
each of the three z-scored datasets to produce clustering trees (also
known as dendrograms) with different distance calculation methods
(clustering algorithms). After that, dendrograms produced by different
clustering algorithms (Single Linkage, Complete Linkage, Ward’s
method, and so forth) and on different datasets were compared to each
other for general patterns. It turned out that, whatever cluster methods
were used, the general patterns of sherds being clustered together
remained quite steady, even though the whole structure of produced
dendrograms did vary to some degree as the clustering algorithm was
changed from one to another. Generally speaking, the Complete
Linkage method seemed to produce dendrograms with the clearest
structure.
Dendrograms shown in Figure 2.3, Figure 2.4, and Figure 2.5
were produced by measuring distances of clusters with the Complete
Linkage method on standardized ICP-AES, benchtop XRF, and pXRF
datasets, respectively. Clusters of sherds showed up clearly as soon as
the clustering process started. For sherds in each cluster identifiable at
a certain distance, they were grouped simply because they have the
most similar clay geochemistry and look more like each other
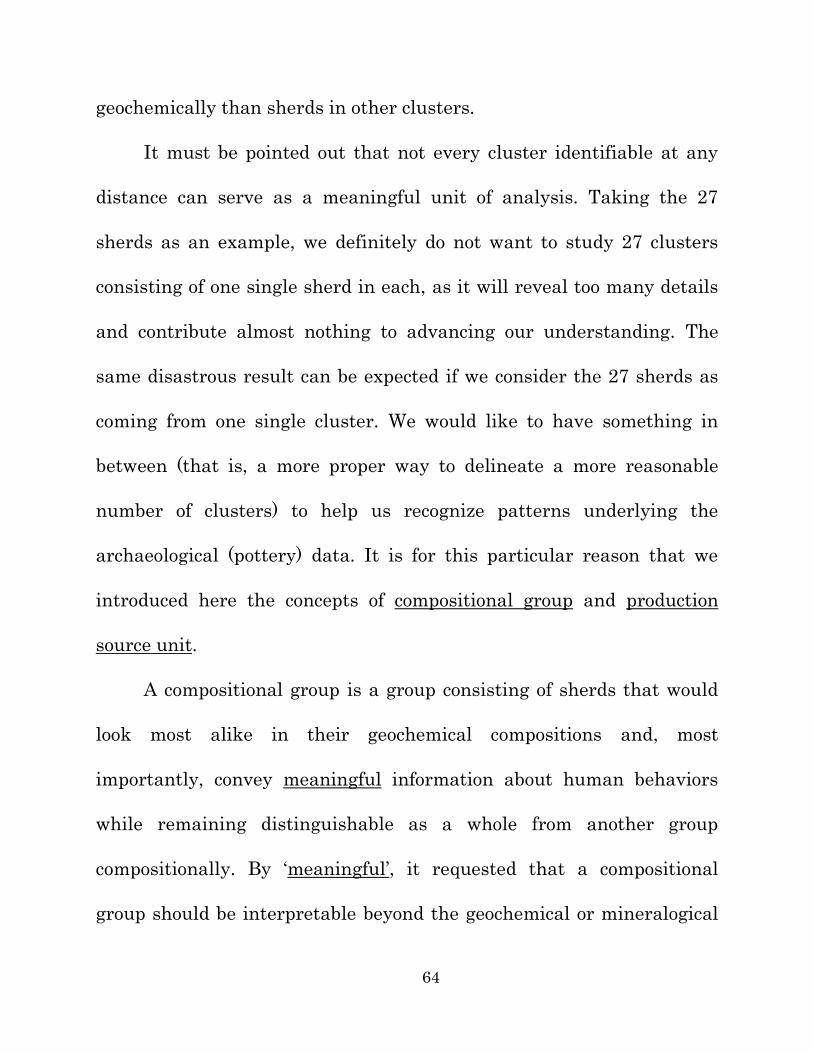
64
geochemically than sherds in other clusters.
It must be pointed out that not every cluster identifiable at any
distance can serve as a meaningful unit of analysis. Taking the 27
sherds as an example, we definitely do not want to study 27 clusters
consisting of one single sherd in each, as it will reveal too many details
and contribute almost nothing to advancing our understanding. The
same disastrous result can be expected if we consider the 27 sherds as
coming from one single cluster. We would like to have something in
between (that is, a more proper way to delineate a more reasonable
number of clusters) to help us recognize patterns underlying the
archaeological (pottery) data. It is for this particular reason that we
introduced here the concepts of compositional group and production
source unit.
A compositional group is a group consisting of sherds that would
look most alike in their geochemical compositions and, most
importantly, convey meaningful information about human behaviors
while remaining distinguishable as a whole from another group
compositionally. By ‘meaningful’, it requested that a compositional
group should be interpretable beyond the geochemical or mineralogical
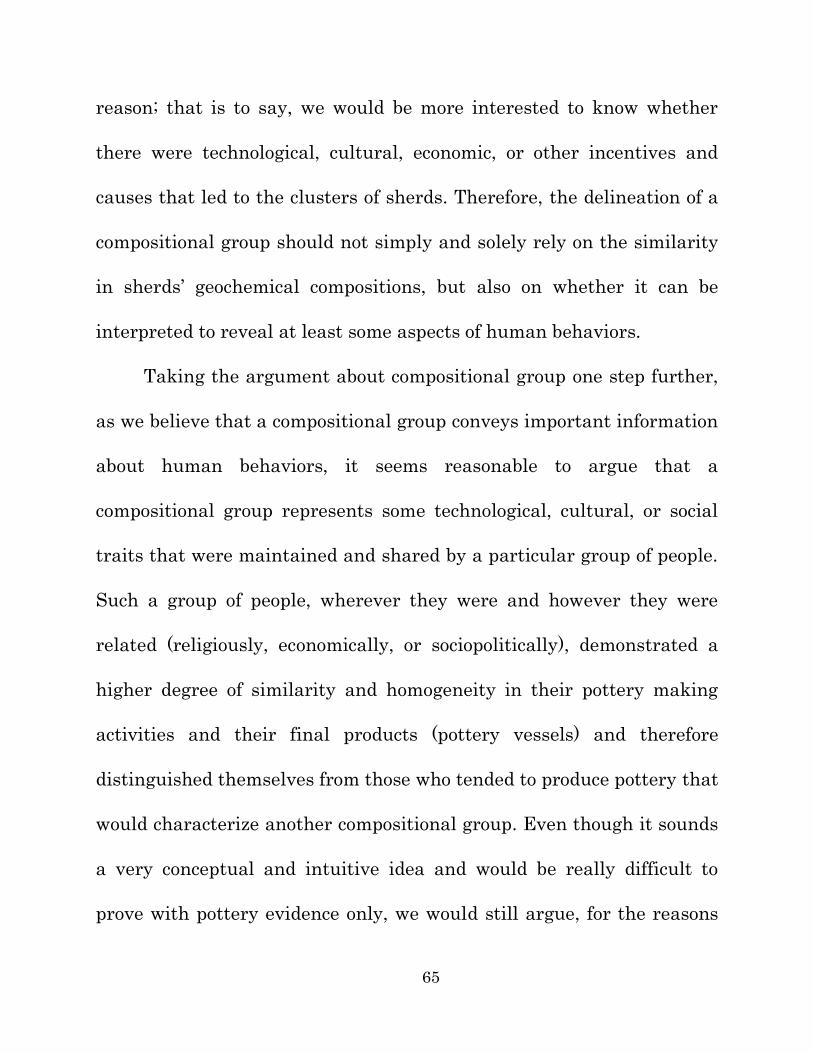
65
reason; that is to say, we would be more interested to know whether
there were technological, cultural, economic, or other incentives and
causes that led to the clusters of sherds. Therefore, the delineation of a
compositional group should not simply and solely rely on the similarity
in sherds’ geochemical compositions, but also on whether it can be
interpreted to reveal at least some aspects of human behaviors.
Taking the argument about compositional group one step further,
as we believe that a compositional group conveys important information
about human behaviors, it seems reasonable to argue that a
compositional group represents some technological, cultural, or social
traits that were maintained and shared by a particular group of people.
Such a group of people, wherever they were and however they were
related (religiously, economically, or sociopolitically), demonstrated a
higher degree of similarity and homogeneity in their pottery making
activities and their final products (pottery vessels) and therefore
distinguished themselves from those who tended to produce pottery that
would characterize another compositional group. Even though it sounds
a very conceptual and intuitive idea and would be really difficult to
prove with pottery evidence only, we would still argue, for the reasons
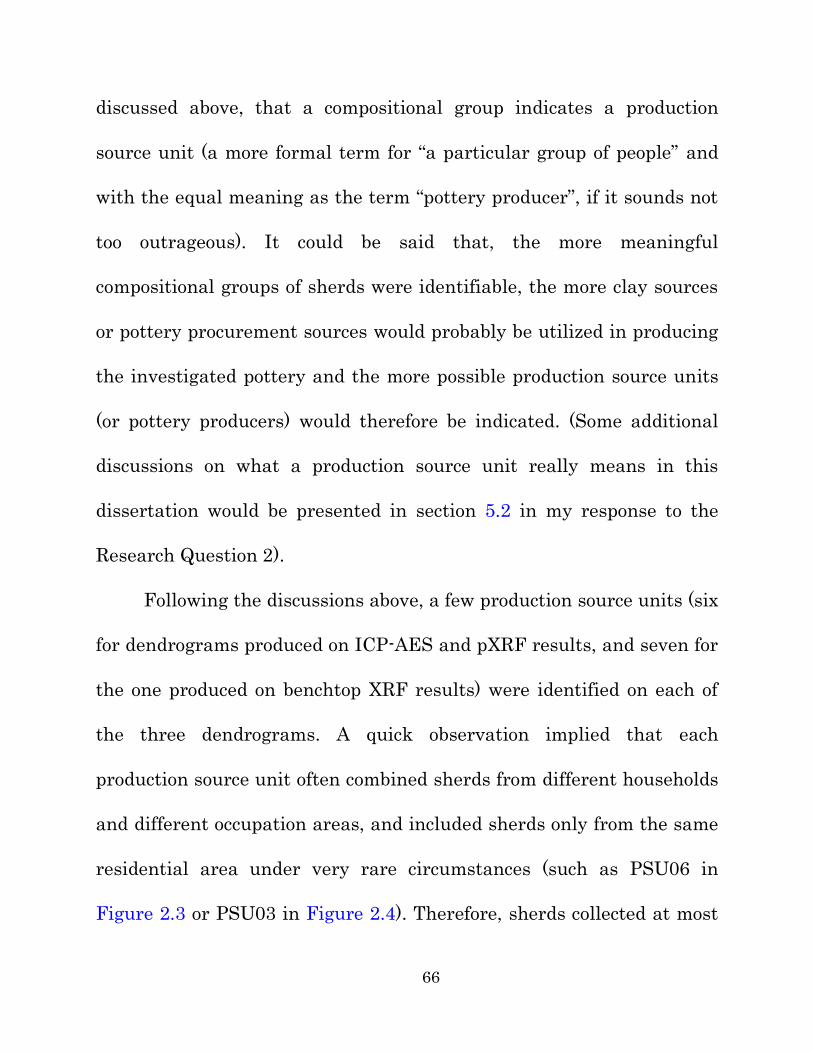
66
discussed above, that a compositional group indicates a production
source unit (a more formal term for “a particular group of people” and
with the equal meaning as the term “pottery producer”, if it sounds not
too outrageous). It could be said that, the more meaningful
compositional groups of sherds were identifiable, the more clay sources
or pottery procurement sources would probably be utilized in producing
the investigated pottery and the more possible production source units
(or pottery producers) would therefore be indicated. (Some additional
discussions on what a production source unit really means in this
dissertation would be presented in section 5.2 in my response to the
Research Question 2).
Following the discussions above, a few production source units (six
for dendrograms produced on ICP-AES and pXRF results, and seven for
the one produced on benchtop XRF results) were identified on each of
the three dendrograms. A quick observation implied that each
production source unit often combined sherds from different households
and different occupation areas, and included sherds only from the same
residential area under very rare circumstances (such as PSU06 in
Figure 2.3 or PSU03 in Figure 2.4). Therefore, sherds collected at most
67
households should have come very likely from multiple production
source units, and very few households could have consumed sherds
made from geochemical compositions characteristic of one production
source unit.
On the other hand, the overall distribution of the 27 sherds across
the dendrograms showed a clear correspondence to the locations where
each household to which the sherd belonged to came from. For example,
in Figure 2.3, PSU06 contained sherds nearly all (87.5%) coming from
the Sanjia area to the south, while PSU04 and PSU05 occurred both in
the Sanjia area (33.3%) and in the more central Dongshanzui area
(66.6%). PSU02 and PSU03 consisted mostly (83.3%) of sherds from the
Erbuchi area to the north, along with one sherd (16.7%) from the
Dongshanzui area. It is obvious that the geochemical differences
between sherds are not exclusive to the three areas; however, their
distribution across the clusters mimics in broad terms the geographical
locations of these areas, which makes sense if these clusters or
production source units indicate the exploitation of raw materials in
different locations.
One more important thing worth mentioning is that sherds from
68
the same household or from households spatially close to each other
within the same occupation area sometimes tend to be grouped
immediately into small compositional groups or production source units
as the clustering progress started, and then mixed with sherds from
other areas when larger clusters were formed. For example, sherds
selected from households S017, S016, and S022 in the Sanjia area, from
households D108 and D109 in the Dongshanzui area, or from
households E203 and E208 in the Erbuchi area, fell into the same
production source unit soon after the clustering process had started.
This observation not only confirmed the basic assumption that sherds
from the same occupation area would more likely be grouped together to
indicate the same production source units, but also suggested that
production source units comprising of mixed sherds from different
households and/or different occupation areas might be the right
evidence that inhabitants of Hongshan core zone communities should
have differential access to pottery made from different clays by different
potters and consumed them in different ways.
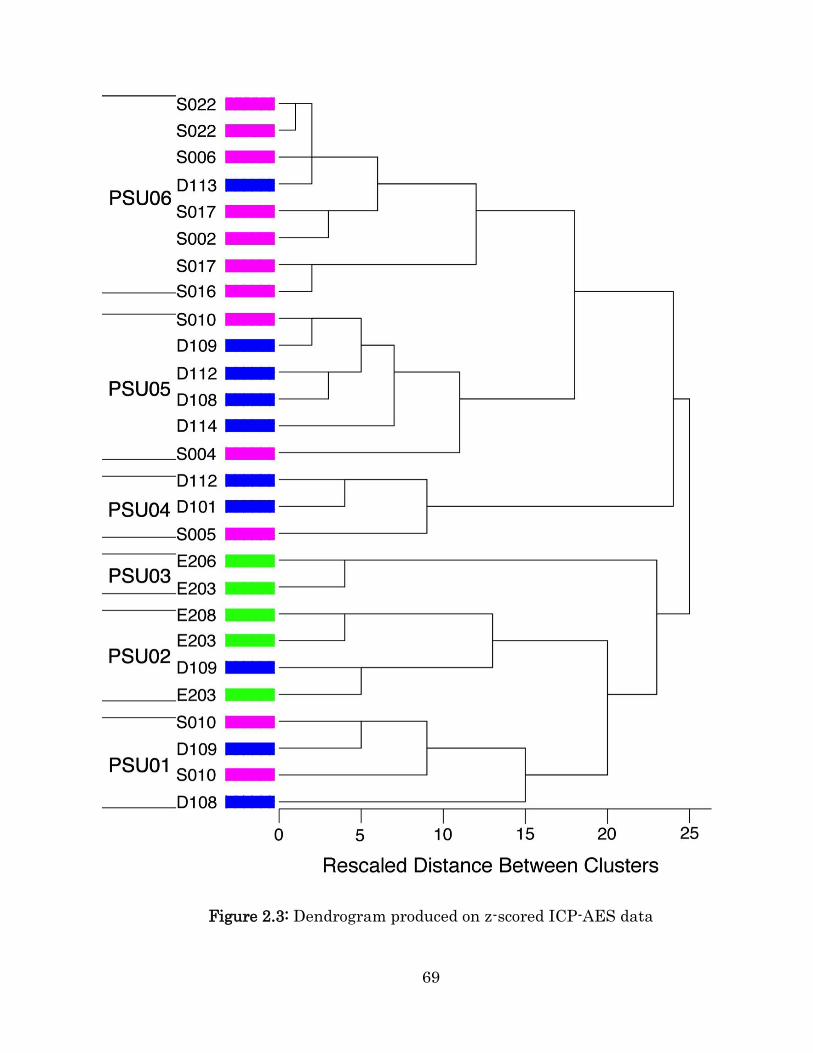
69
Figure 2.3: Dendrogram produced on z-scored ICP-AES data
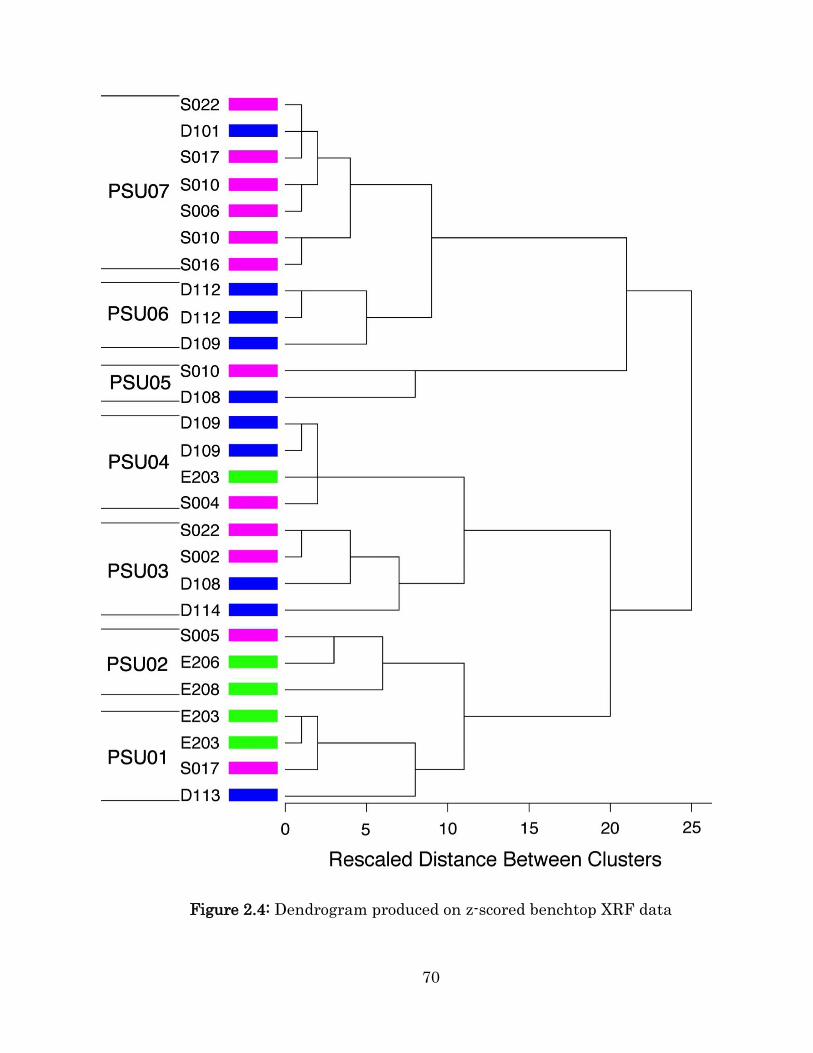
70
Figure 2.4: Dendrogram produced on z-scored benchtop XRF data
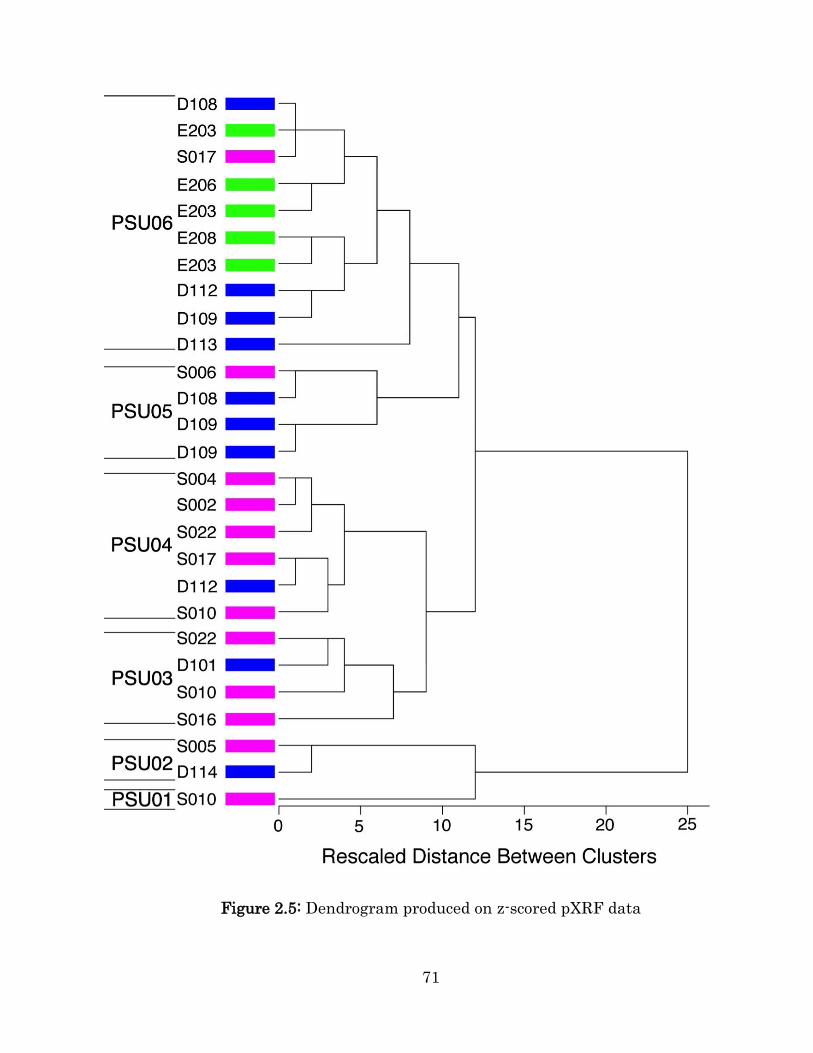
71
Figure 2.5: Dendrogram produced on z-scored pXRF data
72
2.3.5 Determining the final methodology
The results of hierarchical cluster analyses could be summarized into
the following statements: the general patterned distribution of Sanjia
and Erbuchi sherds being distributed more compactly toward each end
of the dendrogram, with Dongshanzui sherds being well mixed in
between, shows some degree of match with the geographical
distribution and spatial relationships of the three areas – that is, Sanjia
and Erbuchi being far away from each other, with Dongshanzui located
in between (although it is in real world much closer to Sanjia than to
Erbuchi). Given that such observations were made only on a very small
sample (27 sherds), it seemed quite impossible to make any ambitious
and conclusive judgment about the mode of pottery production and
distribution in the Sanjia, Dongshanzui, and Erbuchi areas, not to
mention the entire Upper Daling survey area.
However, the pilot studies of the 27 sherds indicated a possibility
of approaching this final goal by performing multivariate statistical
analysis on geochemical data extracted from Hongshan core zone
pottery. If the patterned distribution noticed for the 27 sherds would
still persist when the sample size was enlarged to a few dozen times
73
larger and hundreds of sherds were selected for compositional analysis
following the same strategy as applied to the 27 sherds, some
tantalizing clues to answer this dissertation’s research questions (as
described in section 1.5) would be confirmed. For example, it would
more likely be a general phenomenon that sherds collected (or
consumed) within the same area had been largely made from clays that
were geochemically similar to each other but also geochemically more
different from those that had been used for producing pottery to be
consumed in the other two areas. In other words, sherds collected
within the same area would look more alike in their geochemical
compositions, and therefore tend to be grouped into the same
compositional groups. This would lay the basis to argue for the
distribution of pottery among different households and different
residential areas if sherds consumed in one household (or area) turned
out to fall into compositional groups that were characterized by sherds
intensively consumed in other households (or areas).
Last but not the least, it is important to observe that the
dendrograms produced by performing hierarchical cluster analysis on
ICP-AES, benchtop XRF, and pXRF data all revealed the same kind or
74
nature of information. By the same ‘kind’ or ‘nature’, it refers to several
different things: (1) the general tendency that sherds collected within
the same area seemed geochemically more alike but in the meantime
more different from those from the other two areas in their geochemical
compositions; (2) the similar pattern that sherds collected at the same
household(s) tended to look more alike; and (3) the common feature that
sherds collected at the same household often fell into several
meaningful clusters, suggesting the household’s access to multiple
production source units, rather than a single one.
Therefore, at least in the sense of extracting geochemical
information from sherds and relating them to the production and
distribution of pottery, pXRF achieved the same level of conclusion as
ICP-AES or benchtop XRF did. Considering that pXRF would make
possible a much larger sample size to be analyzed due to its lower cost,
simpler sample preparation process, and readily available
compositional results, it was finally considered as the more appropriate
tool for the purpose of extracting geochemical data out of sherds from
Hongshan core zone communities.
75
2.4 Sampling of Hongshan core zone sherds for pXRF analysis
Once pXRF was chosen as the tool for extracting geochemical
compositions out of Hongshan pottery, it became clear to us that more
sherds could be analyzed and that our sampling strategy should be
adjusted accordingly. The first thing we did was to enlarge the sample
size from 30 (our original estimate, including 10 Tongxingqi sherds, 10
fine-paste vessel sherds, and 10 coarse-paste vessel sherds) to 50 (10
Tongxingqi sherds, 30 fine-paste vessel sherds, and 10 coarse-paste
vessel sherds) per household. This was done to ensure as best as
possible sherds of different pastes, types, and vessel forms, as well as
for different functional uses, would be sampled to represent the
consumption of pottery at each household as well as to reduce the error
ranges involved in estimating proportions of different pottery source
units represented in each household.
Taking into considerations the research questions we were most
interested in and some other topics that were also important and
interesting (such as whether different clays were used for making
vessels of different types for different functions and uses), 50 sherds
were intentionally collected by splitting them into three categories: (1)
76
Tongxingqi, which refers to non-utilitarian, fine-paste pottery, (2) fine-
paste vessel, which refers to finely pasted utilitarian pottery that are
typologically or functionally different from Tongxingqi, and (3) coarse-
paste vessel, which refers to coarse-paste utilitarian pottery.
Tongxingqi, as it is now widely accepted, were made not for daily
use but for ritual and ceremonial activities. The latter two categories
were virtually all sherds from utilitarian pottery, although the fine-
paste utilitarian vessels were assumed to have been used more often as
serving vessels while the coarse-paste one mainly as cooking or storage
purpose. The fine-paste utilitarian vessel sherds are the most abundant,
compared to the rarer Tongxingqi or coarse-paste vessel sherds, in the
sherd pool. Therefore, the random sampling will almost always produce
enough fine-paste vessel sherds but very likely not collect Tongxingqi or
coarse-paste sherds as many as needed to have their geochemical
variations represented in the geochemical study. It is for this particular
reason that the stratified sampling was chosen over the random
sampling. The stratified sampling and the 10-30-10 scheme make sure
that a good, abundant sample of fine-paste utilitarian sherds as well as
77
at least a minimal sample of the rarer Tongxingqi and coarse-paste
utilitarian vessels.
Thirty fine-paste sherds could always be found and selected as
fine-paste vessel sherds consisted of a very high proportion of sherds
collected at each household; in contrast, less than 10 Tongxingqi or 10
coarse-paste sherds were occasionally encountered in some households.
Overall, approximately 50 sherds were included in the stratified
random sample from each household.
In the original plan, 12 of the 50 households were chosen for
sherds to be sampled from: four households from each occupational area
(Sanjia, Dongshanzui, and Erbuchi). The 12 households are as follows:
(1) households 002, 010, 016, and 022 from the Sanjia area; (2)
households 101, 103, 109, 112 from the Dongshanzui area; and (3)
households 201, 203, 207 and 208 from the Erbuchi area. Intensive
surface collections for these 12 households all yielded large numbers of
Hongshan sherds (ranging from 450 to 5,568 sherds), making it more
likely that they represent well the variations to be observed in the
Hongshan garbage deposited in that location. Besides, they also yielded
high proportions of Hongshan sherds, reducing the possibility of
78
chronological confusions. And they were scattered broadly across the
occupation zones, thus providing good spatial representation.
Once the stratified sampling strategy was chosen and the
sampling process was determined, sherds were selected from the 12
households one occupation area after another. When the pXRF analysis
turned out to work faster than previously expected and there still was
time available to analyze more sherds, four more household units—two
from the Sanjia area (households 017 and 023) and the other two from
the Dongshanzui area (households 110 and 116)—were selected
following exactly the same standards and sampling procedures
described above.
In total, we had a sample of 715 sherds selected from 16 out of the
50 households identified in the upper Daling survey area of Hongshan
core zone.
2.5 Experiment for performing pXRF analysis
Before the pXRF analysis was performed on the 27 selected sherds, a
series of tests were carried out on those same sherds in the hope of
finding out as best as possible the experimental settings most
79
appropriate for collecting pXRF readings from Hongshan sherds. The
tests heavily relied on three published works—Goren et al. (2011); Hall
(2012); Zurfluh et al. (2011). The most important things such
experimental tests aimed to investigate include: (1) determination of
elements potentially useful for geochemical sourcing purpose; (2) the
choice of filters (four filters were default equipment with the pXRF
analyzer used in this dissertation); (3) the time of collection for
recording pXRF readings; (4) the size of x-ray beam spot. Other issues
that may influence the collection and interpretation of pXRF readings
directly or indirectly were also evaluated, including: (1) the number of
readings to be collected from each single sherd; (2) the minimum
desired size and shape of sherds in three dimensions (width, length,
thickness); (3) the area from which each pXRF reading was
preferentially collected; (4) the need for sherds to be cut and polished to
produce flat and smoother surfaces; and so forth.
The Niton 950 handheld XRF analyzer we used in this
dissertation project is equipped with two modes that could be most
useful for extracting geochemical information from pottery/ceramics
(Soil and Mining) and four filters for each mode (High, Light, Low,
80
Main). The Soil mode, which uses the Compton Normalization for the
purpose of calibration, is usually employed to measure elements of low
concentrations (less than 1% or in a ppm-level), and it does not measure
light elements such as magnesium (Mg), aluminum (Al), silicon (Si), and
phosphorus (P). In contrast, the Mining mode that uses the
Fundamental Parameter approach records concentrations for light
elements and it is more applied to record elements of higher
concentrations. The High, Light, Low, and Main filters are used to
fluoresce different ranges of elements (for example, Z=47–56 for the
High filter, Z<17 for the Light filter, Z=19–24 for the Low filter, and
transition elements for the Main filter).
Standard materials were not used in the pXRF analysis of
Hongshan core zone pottery because we believed that as long as the
geochemical variations reported by pXRF reveals the same general
distribution patterns as other more accurate and reliable techniques (as
what has been proved in our pilot studies that compare pXRF results
with ICP-AES and benchtop XRF), the pXRF data are acceptable and
reliable and no additional standardization is needed.
81
Some experiments were carried out on the 27 selected Hongshan
core zone sherds to test whether or not the goodness of fit to the line (R-
square or r2) would be improved when average concentration of a
certain element, which was calculated by pXRF readings increasingly
recorded on different areas of the same sherd, was compared to that of
the same element recorded by benchtop XRF. This is one of the ways to
evaluate the degree of match between pXRF and benchtop XRF data
that are believed to be more accurate and reliable. It turned out that
the correlation was weak, especially for major elements such as silicon
(SiO2, r2=0.048) and aluminum (Al2O3, r2=0.186). Compared to major
elements, the trace elements produced by pXRF and benchtop XRF
show a better correlation, for example, r2=0.457 for zirconium (Zr),
r2=0.766 for strontium (Sr), and r2=0.532 for rubidium (Rb). It was
therefore determined that the High, Low, and Main filters for the Soil
mode can best meet our needs.
The final experimental settings for recording pXRF data can be
described as follows: A handheld Niton XL3t 950 GOLDD+ XRF
analyzer equipped with a 50 kV x-ray tube (max. 50 kV, 100 μA, 2 W)
with an Ag anode target excitation source and a Large Drift Detector
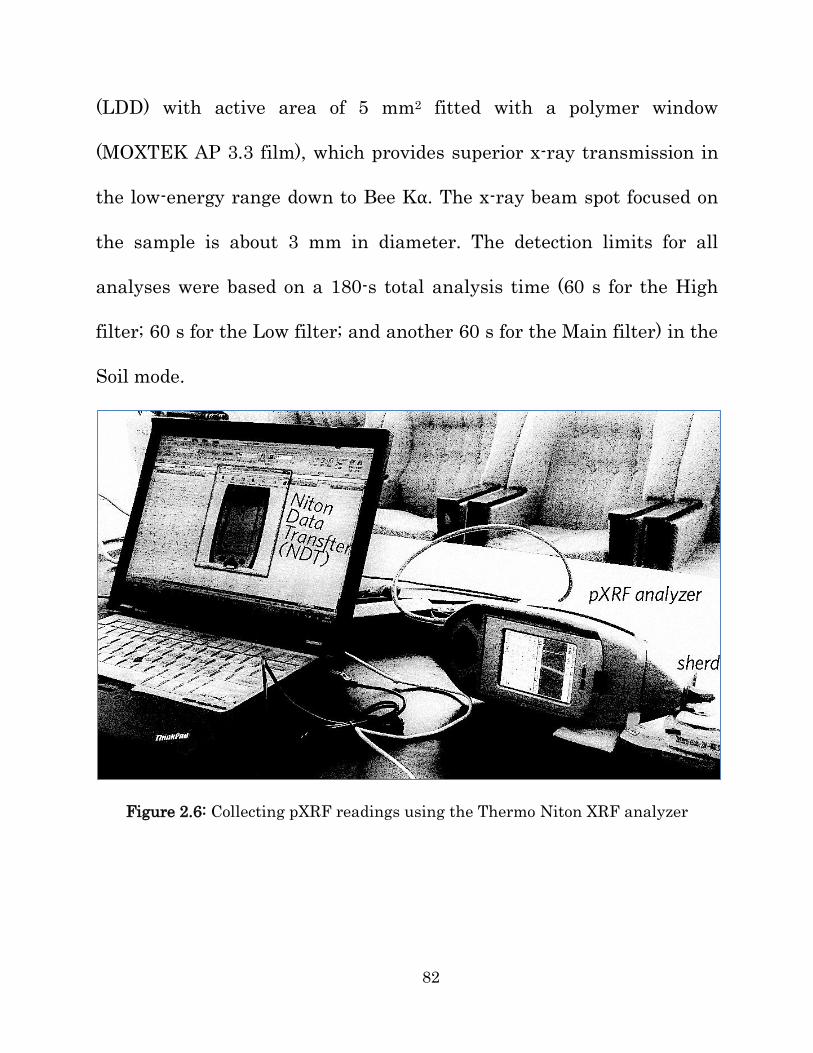
82
(LDD) with active area of 5 mm2 fitted with a polymer window
(MOXTEK AP 3.3 film), which provides superior x-ray transmission in
the low-energy range down to Bee K⍺. The x-ray beam spot focused on
the sample is about 3 mm in diameter. The detection limits for all
analyses were based on a 180-s total analysis time (60 s for the High
filter; 60 s for the Low filter; and another 60 s for the Main filter) in the
Soil mode.
Figure 2.6: Collecting pXRF readings using the Thermo Niton XRF analyzer
83
3. STATISTICAL ANALYSES OF COMPOSITIONAL DATA
3.1 Preprocessing of pXRF data
The pXRF analysis of the 715 selected Hongshan sherds was carried out
in the summer of 2014 at the Niuheliang Workstation, where all sherds
collected from the surface collections and stratigraphic tests in the
upper Daling regional survey are housed. Each of the 715 selected
sherds, as long as it was large or thick enough, was polished by wet
sandpapers to produce smooth surfaces on the sherd’s cross section
and/or, under limited circumstances, on exterior or interior surfaces.
Multiple (at least three) pXRF readings were collected at different areas
on these smooth surfaces. For each pXRF reading, concentrations of up
to 33 elements (Mo, Zr, Sr, U, Rb, Th, Pb, Au, Se, As, Hg, Zn, W, Cu, Ni,
Co, Fe, Mn, Cr, V, Ti, Sc, Ca, K, S, Ba, Cs, Te, Sb, Sn, Cd, Ag, Pd) were
recorded.
84
Once the pXRF analysis was done on all selected sherds, a
geochemical dataset consisting of up to 33 variables (elements)
corresponding to more than 2145 cases (pXRF readings) was
constructed. To prepare it for further multivariate statistical analysis,
this dataset was preprocessed to make sure that: (1) one final pXRF
reading was assigned to each investigated sherd to represent the most
likely geochemical composition in the vessel that the sherd came from;
and (2) only elements whose concentrations were reliably and
consistently recorded were retained while others were excluded from
further analyses. To do that, it was necessary to compare the three or
more pXRF readings collected for each single sherd and look carefully
through each of the 33 batches of pXRF readings (corresponding to the
33 detected elements). Decisions were made as to which pXRF readings
and what elements seemed to be consistently and reliably recorded and
therefore potentially useful for further quantitative data analyses. The
main criteria that were adopted for this purpose can be described in
order as follows:
(1) If pXRF readings reported missing or undetectable
concentrations in too many sherds for certain elements (usually caused
85
by being too low and/or beyond the limit of detection [LOD] of the pXRF
analyzer), these readings as well as elements were excluded from
further data analysis. For example, elements such as U, Au, Se, Hg, W,
Cu, Co, Sc, S, Cd, Ag, and Pd were quickly excluded by this strategy.
(2) For each single sherd, if its pXRF readings showed dramatic
variations (in orders of magnitude) in concentrations of the same
elements at the same time, these readings were excluded; if this
occurred for a limited number of elements and in only one or two of the
sherd’s pXRF readings, then the ‘abnormally’ low or high concentrations
for that particular element(s) were replaced by the arithmetic mean of
concentrations for the same element recorded in the other pXRF
readings for that sherd.
(3) Relative errors were calculated at that point in time for each
batch of pXRF readings (or in other words, concentrations of each
detected element that seemed potentially usable). This was done by
dividing measured concentrations of each detected element by its
associated measurement errors (reported by the Niton pXRF analyzer).
The results were expressed in percentages. Elements with overall high
relative errors (25% and higher) in their pXRF readings were
86
considered as not suitable for further multivariate statistical analyses
and therefore excluded.
Following the procedures described above, eleven elements were
finally considered as appropriate and useful for further mathematical
calculation and statistical analysis due to their higher consistency and
stability in measurements. These eleven elements include major, minor,
and trace elements such as Ba (4–5% of relative error), Zr (1–2% of
relative error), Sr (1–3% of relative error), Rb (3–4% of relative error),
Zn (7–10% of relative error), Ni (5–9.9% of relative error for about 30%
of the sherds, 10–19.9% of relative error for approximately 50% of the
sherds), Fe (0.4–1% of relative error), Mn (5–10% of relative error), Ti
(1–7% of relative error), Ca (1–2% of relative error), and K (1–2% of
relative error).
Concentrations of these eleven elements were recorded by pXRF
analyzer in two different ways: in units of weight percentage (%) or in
units of parts per million (ppm). In addition, some elements (major
elements such as Fe and K) have concentrations several orders of
magnitude higher than others (trace elements such as Ba and Rb).
Therefore, z-score standardization was applied to concentrations of
87
these eleven elements for all 715 sheds, as was done on the 27 sherds in
pilot studies (described in detail in section 2.3.4). This process was
necessary because it permits concentrations of elements to be compared
to each other directly regardless of their units of measurement and
prevents elements with generally very high values for their
measurements from having a much stronger impact on the results than
elements with overall lower measurement values.
3.2 HCA and MDSCAL for data exploratory analysis
Two techniques, hierarchical cluster analysis (HCA) and multi-
dimensional scaling analysis (MDSCAL) were applied to the z-scored
pXRF datasets. Many studies have confirmed that the combined
application of MDSCAL and HCA analyses to the same proximity
matrix of similarities promotes clearer pattern recognition and a better
understanding of the structure underlying the dataset than either of
them would do alone.
The MDSCAL analysis is a tool that aims to conceptualize the
similarity (or dissimilarity) observed in a multivariate dataset. Through
the MDSCAL analysis, the many variables that quantitatively describe
88
a case (for example, a household, a pottery vessel, or a sherd) are often
reduced to two or three variables without losing too much information.
Therefore, the MDSCAL results would be a two-dimensional (2D) graph
or two-dimensional projections of a three-dimensional (3D) graph, which
can be plotted to show the distance (or similarity) among the cases
visually.
The HCA analysis can serve the same purpose as the MDSCAL
analysis did, especially in the sense that cases would finally fall into
different clusters (or groups) based on, for example, how similar or
different they were compared to each other on a number of variables.
Results from the HCA analysis can be presented by a two-dimensional
clustering tree (or a dendrogram), from which one can easily track the
clustering process of how each individual case (whether it is a sherd or
a household where this sherd came from) was joined to others to form
larger clusters as clustering proceeded.
It is hoped that, by applying the HCA and MDSCAL analyses to
processed pXRF data, two main purposes can be achieved: (1) revealing
the distribution pattern of the 715 selected sherds among the 16
selected Hongshan core zone households. With a much larger sample
89
size now, we would be able to evaluate the robustness of conclusions
that were summarized earlier based on the 27 sherds in pilot studies;
and (2) investigating the consumption behaviors at the 16 households
that yielded these 715 sherds. Once meaningful compositional groups
indicating potential production source units are delineated, the degree
to which each of the 16 households relied on these production source
units can be formulated. This gives us a chance to understand whether
inhabitants of the 16 households consumed pottery (or relied on
different production source units) similarly or very differently.
The multivariate statistical analysis began with HCA, which was
performed in the following order: (1) the full pXRF dataset that contains
z-scored concentrations of eleven elements and additional information
(such as households from which each sherd was sampled and areas
where each household was located) was imported into R, an open-source
statistical programming language (URL: https://www.r-project.org,
version: 3.2.2); (2) some most popular agglomeration methods and
measures of similarity often applied in sourcing studies were tried on z-
scored pXRF data, which include: the Complete Linkage on Cosine (or
not-centered Pearson) distance measure; the Complete Linkage on
90
Euclidean distance measure; the Complete Linkage on Pearson
Correlation measure; and the Ward method on Squared Euclidean
distance measure; and (3) identifying the general patterns on different
dendrograms and delineating meaningful clusters or production source
units for further data analysis (such as MDSCAL).
The MDSCAL analysis was also completed in R by first making an
estimate of the proportion of each identifiable production source unit
represented in pottery consumed by each of the 16 households, then
measuring the distance between any two of the 16 households in terms
of the difference in their ways of pottery consumption. Measurements of
distance between any two households were done with Euclidean
distance on estimated, non-standardized proportions. Two-dimensional
representations of the MDSCAL results were plotted and compared for
general and stable patterns that characterized the distribution and
consumption of pottery among the 16 Hongshan core zone households.
91
3.3 Dendrograms and delineation of production source units
3.3.1 General patterns noticed on produced dendrograms
It was not surprising to notice that, when the algorithm method and/or
parameter setting changed from one to another, differences showed up
in the structures of produced dendrograms, which were caused by
changes in the way of each sherd was connected to others to form
clusters. However, the general pattern remained relatively stable, as
can be most clearly noticed in Figure 3.1, with sherds from households
in the Erbuchi area always being clustered more compactly toward one
end of the dendrogram and isolated from those from households in the
Dongshanzui or Sanjia area while sherds from households in the
Dongshanzui or Sanjia area were clustered toward the other end of the
dendrogram showing a much higher level of overlapping. These
observations were consistent with the observations made on the 27
sherds in the pilot studies, and laid the foundation for delineating
production source units.
Closer observations have revealed that, in any of the produced
dendrograms, sherds from households at Dongshanzui were usually
92
well mixed with those from households in the Sanjia or Erbuchi area.
Again, the distribution of sherds across the dendrograms mimics the
spatial relations among Sanjia, Dongshanzui, and Erbuchi (as can be
seen clearly in Figure 3.2). More importantly, they revealed potential
transfer of pottery within and among different areas. For example, it
can be easily noticed that sherds from the same or neighboring
households within the same region tended to join together instantly to
form clusters when the clustering process started while sherds in other
regions were not joined to form larger clusters until the clusters reached
higher levels, and that sherds from the same or neighboring households
were not always joined into one single (whether large or small) cluster
and were often noticed to be mixed with sherds from more distant
households (whether in the same region or in different regions). These
observations strongly suggested the wide distribution and consumption
of pottery made from the same compositional groups or production
source units within the same area or among different areas.
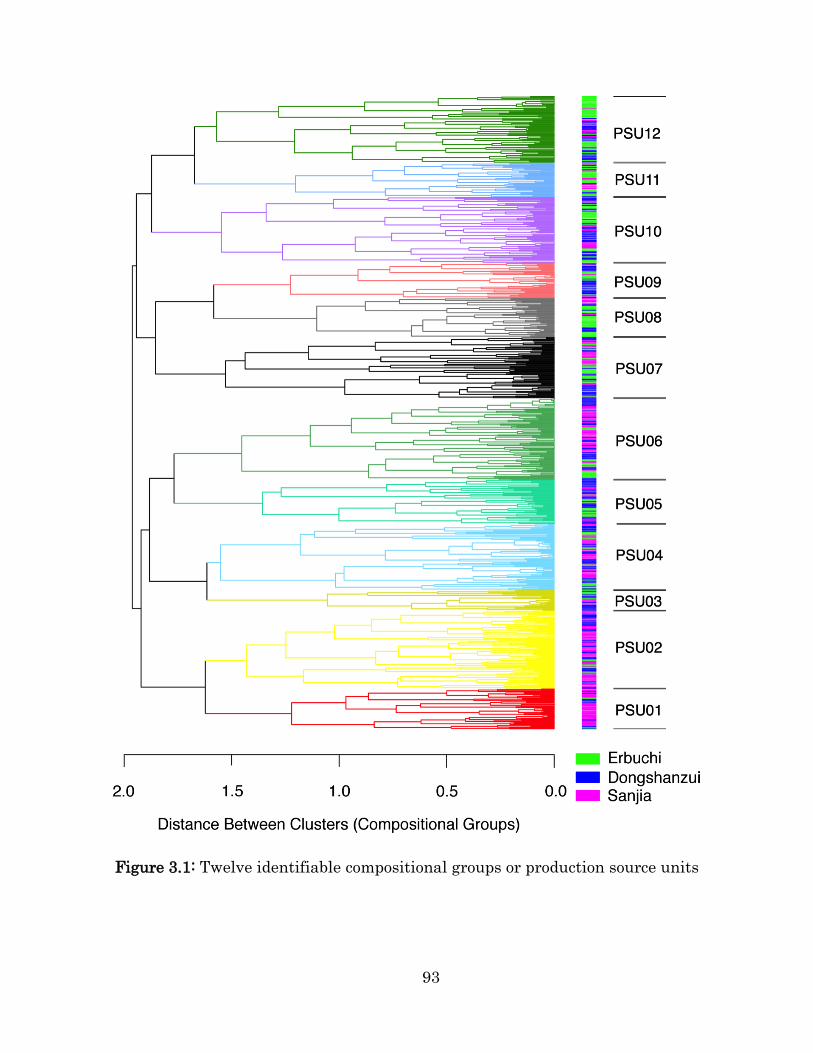
93
Figure 3.1: Twelve identifiable compositional groups or production source units
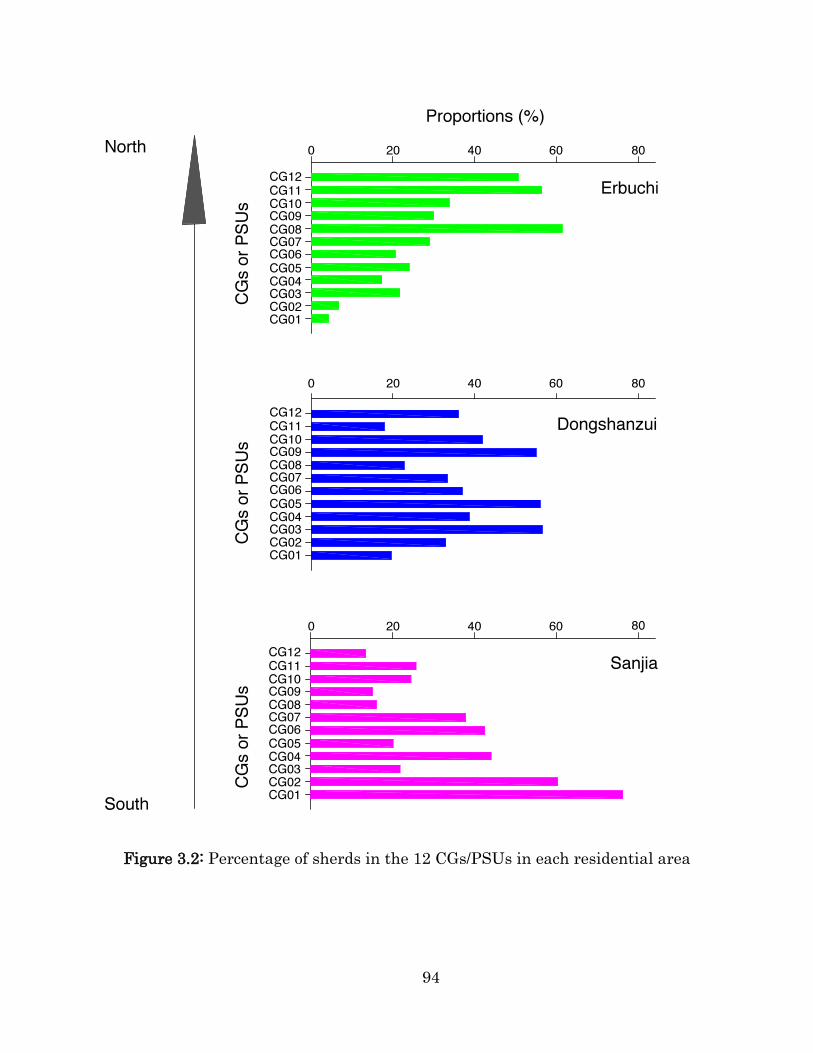
94
Figure 3.2: Percentage of sherds in the 12 CGs/PSUs in each residential area
95
3.3.2 Delineation of production source units
It turned out that geochemical variations among the 715 investigated
sherds were quite noticeable, which seemed to indicate multiple
compositional groups, with each representing a possible different
production source unit. Therefore, the delineation of different
compositional groups was done on the dendrogram in the hope of
recognizing the potential pottery producers (or production source units)
these 715 sherds represented. To reduce the arbitrariness and
subjectiveness as much as possible, the process of delineating
compositional groups on dendrograms was done with the following
questions in mind: Which sherds seem to consistently join with which
others to form clusters during the clustering process? Do sherds from a
certain household tend to be clustered together with those from the
neighboring households, and if yes, do the clusters they have formed
tend to be placed always in a certain part (for instance, towards one end
or right in the middle) of the dendrogram?
It should be pointed out that, even though we followed the
aforementioned procedures as closely as possible, the delineation can
always be done in several different ways, which produced different
96
numbers of meaningful compositional groups. However, none of them
indicates a very few groups (compared to the 16 households) and, no
matter how many compositional groups were delineated, the
distribution patterns of sherds reflecting pottery consumption behaviors
at each household remained highly stable. We reached this conclusion
based on some quite extensive data exploration work, such as: looking
through the proportional representations (will be discussed in detail in
section 3.4) of compositional groups or production source units each
household had relied on in their pottery consumption for stable patterns
while intentionally modifying the number of delineated compositional
groups. To keep our arguments concise and to avoid redundancy in data
presentation and interpretation, only the results of the most convincing
delineation producing the clearest patterns are presented here. Details
about other possible ways of delineating compositional groups on
dendrograms and the pottery consumption patterns they generated can
be found as complementary data in the University of Pittsburgh
Comparative Archaeology Database <www.cadb.pitt.edu>.
Taking the dendrogram (shown in Figure 3.1) produced by the
Complete Linkage method and Cosine distance as a similarity measure
97
for an example. Either 5 (Cosine distance = 1.8814), 12 (Cosine distance
= 1.5833), 13 (Cosine distance = 1.5698), or 19 (Cosine distance = 1.4317)
seems a reasonable number to cut the whole dendrogram into
meaningful compositional groups. However, only twelve (12) generates
the clearest patterns that group sherds into the most meaningful
clusters (compositional groups) and produced the better MDSCAL and
HCA results to recognize the intra-household variation. It is this
dendrogram and the 12 compositional groups delineated from it that
was chosen as the basis for analysis to be discussed below.
3.4 Proportions of PSUs represented at each household
Once the 12 compositional groups were delineated, they suggested to us
that 12 production source units quite likely produced the 715
investigated sherds. It also suggested that 12 strongest economic
connections existed between the 16 Hongshan households and their
pottery providers. If we take sherds in each of the 12 compositional
groups as an individual sampling and make estimates of proportions for
production source units consumed at each household, we can reveal the
production source units different households relied on and measure the
98
intra-household variation in their abilities to establish economic
connections with different pottery producers. It is important to be able
to say at what level of statistical confidence statements about the
proportions of production source units in each household can be made.
An 80% confidence level was believed to serve this goal quite well.
As was discussed in section 2.4, the 715 sherds were selected
following a stratified sampling strategy and each sherd fell into one of
the three categories based on their paste, (possible) vessel form, and
function: (1) Tongxingqi sherds, (2) fine-paste utilitarian vessel sherds,
and (3) coarse-paste utilitarian vessel sherds. With the 12 compositional
groups delineated on the dendrogram shown Figure 3.1, the distribution
of 715 sherds across these 12 compositional groups was determined,
which allowed for making estimates of the proportions of Tongxingqi,
fine-paste, and coarse-paste vessels that were made by the 12
corresponding production source units and consumed at each of the 16
households. If the three paste-form categories were taken as sampling
strata, and their individual estimates were pooled, an estimate of the
overall proportion of each compositional group in all the pottery of each
household could thus be made.
99
Household D101 can be used as an example to show how the
proportional representation of the 12 production source units was
estimated for each household. During the upper Daling project,
household D101 yielded 96 Tongxingqi sherds, 3518 fine-paste vessel
sherds, and 58 coarse-paste vessel sherds in the intensive surface
collections. A sample was selected from these sherds consisting of 10
Tongxingqi, 30 fine-paste vessel, and 10 coarse-paste vessel sherds, as
described earlier. One of the Tongxingqi sherds, one of the fine-paste
vessel sherds, and none of the coarse-paste vessel sherds pertained to
production source unit 1 (PSU01). Thus PSU01 is 10% (1/10) of the
Tongxingqi sample, and this 10% is the best estimate of the proportion
of Tongxingqi sherds at D101 that pertain to PSU01. Following the
same logic, PSU01 is 3.3% (1/30) of the fine-paste vessel sample and 0%
(0/10) of the coarse-paste vessel sample. A standard error (𝑺𝑬) can be
assigned to each estimated proportion as well by the following equation:
𝑺𝑬 = √𝒑(𝟏 − 𝒑)
𝒏
where 𝑺𝑬 is the standard error of the estimated proportion for a given
household, production source unit, and paste-form category; 𝒑 is that
100
estimated proportion; and 𝒏 is the number in the sample for that paste-
form category (usually 10 for Tongxingqi or coarse-paste vessel sherds
and 30 for fine-paste vessel sherds). Since one standard error represents
a confidence level of about 67%, it is then estimated (at about 67%
confidence level) that 10% ± 9.5% of the Tongxingqi vessel sherds,
3.3%±3.1% of the fine-paste vessel sherds, and none (0%) of the fine-
paste vessel sherds at D101 were produced by production source unit 1
(PSU01), even though the standard error of 0 does not mean certainty
that there were no fine-paste sherds at this household pertaining to this
particular production source unit.
The proportion of sherds from a given production source unit
among all the sherds from a household can be estimated by pooling the
estimates for the three paste-form categories:
𝒑 = 𝑵𝒕𝒑𝒕 + 𝑵𝒇𝒑𝒇 + 𝑵𝒄𝒑𝒄
𝑵
where 𝒑 is the proportion of a given production source unit among all
the sherds from a household; 𝑵𝒕 , 𝑵𝒇 and 𝑵𝒄 is the total number of
Tongxingqi, fine-paste, and coarse-paste vessel sherds recovered from
the household, respectively; 𝒑𝒕, 𝒑𝒇, and 𝒑𝒄 is the estimated proportion of
Tongxingqi, fine-paste, and coarse-paste vessel sherds from the
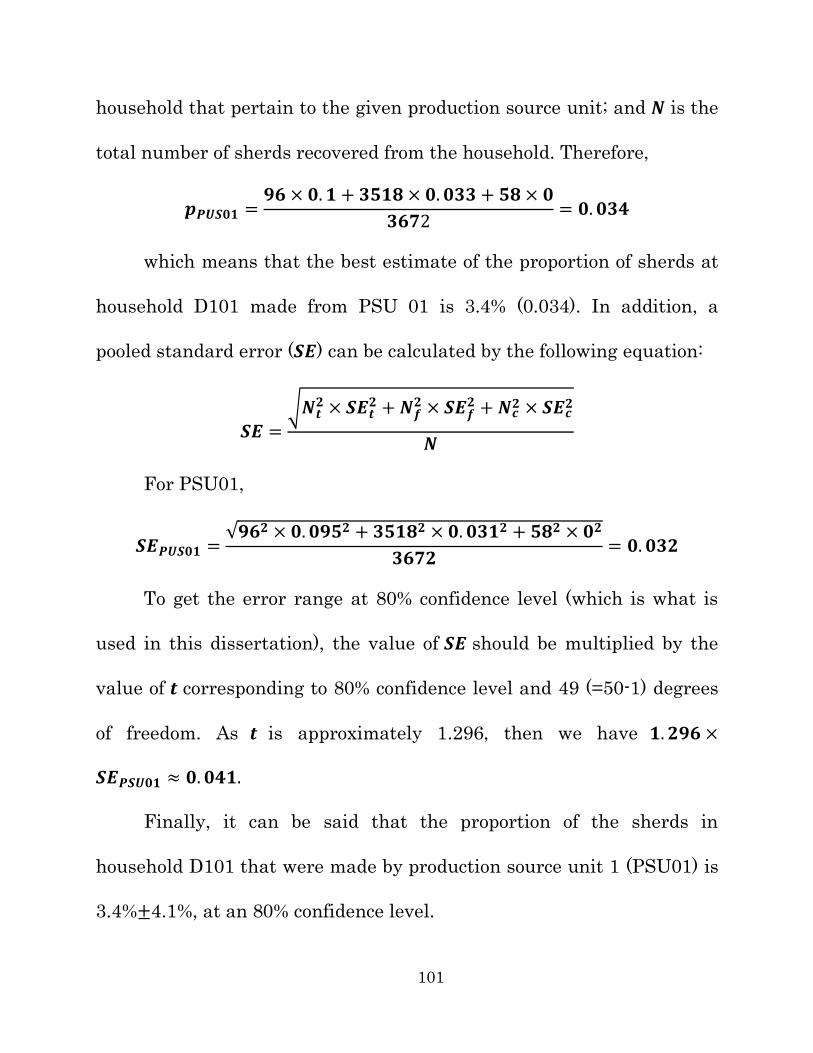
101
household that pertain to the given production source unit; and 𝑵 is the
total number of sherds recovered from the household. Therefore,
𝒑𝑷𝑼𝑺𝟎𝟏 =𝟗𝟔 × 𝟎. 𝟏 + 𝟑𝟓𝟏𝟖 × 𝟎. 𝟎𝟑𝟑 + 𝟓𝟖 × 𝟎
𝟑𝟔𝟕2= 𝟎. 𝟎𝟑𝟒
which means that the best estimate of the proportion of sherds at
household D101 made from PSU 01 is 3.4% (0.034). In addition, a
pooled standard error (𝑺𝑬) can be calculated by the following equation:
𝑺𝑬 =√𝑵𝒕
𝟐 × 𝑺𝑬𝒕𝟐 + 𝑵𝒇
𝟐 × 𝑺𝑬𝒇𝟐 + 𝑵𝒄
𝟐 × 𝑺𝑬𝒄𝟐
𝑵
For PSU01,
𝑺𝑬𝑷𝑼𝑺𝟎𝟏 =√𝟗𝟔𝟐 × 𝟎. 𝟎𝟗𝟓𝟐 + 𝟑𝟓𝟏𝟖𝟐 × 𝟎. 𝟎𝟑𝟏𝟐 + 𝟓𝟖𝟐 × 𝟎𝟐
𝟑𝟔𝟕𝟐= 𝟎. 𝟎𝟑𝟐
To get the error range at 80% confidence level (which is what is
used in this dissertation), the value of 𝑺𝑬 should be multiplied by the
value of 𝒕 corresponding to 80% confidence level and 49 (=50-1) degrees
of freedom. As 𝒕 is approximately 1.296, then we have 𝟏. 𝟐𝟗𝟔 ×
𝑺𝑬𝑷𝑺𝑼𝟎𝟏 ≈ 𝟎. 𝟎𝟒𝟏.
Finally, it can be said that the proportion of the sherds in
household D101 that were made by production source unit 1 (PSU01) is
3.4%±4.1%, at an 80% confidence level.
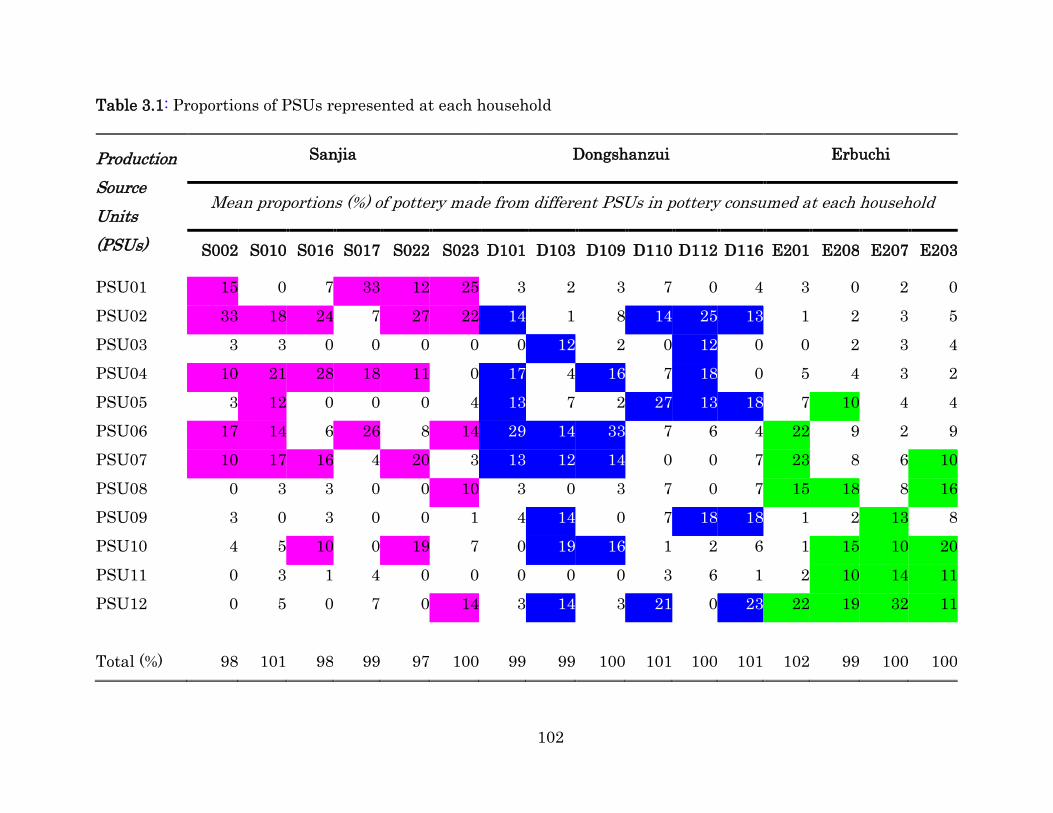
102
Table 3.1: Proportions of PSUs represented at each household
Production
Source
Units
(PSUs)
Sanjia Dongshanzui Erbuchi
Mean proportions (%) of pottery made from different PSUs in pottery consumed at each household
S002 S010 S016 S017 S022 S023 D101 D103 D109 D110 D112 D116 E201 E208 E207 E203
PSU01 15 0 7 33 12 25 3 2 3 7 0 4 3 0 2 0
PSU02 33 18 24 7 27 22 14 1 8 14 25 13 1 2 3 5
PSU03 3 3 0 0 0 0 0 12 2 0 12 0 0 2 3 4
PSU04 10 21 28 18 11 0 17 4 16 7 18 0 5 4 3 2
PSU05 3 12 0 0 0 4 13 7 2 27 13 18 7 10 4 4
PSU06 17 14 6 26 8 14 29 14 33 7 6 4 22 9 2 9
PSU07 10 17 16 4 20 3 13 12 14 0 0 7 23 8 6 10
PSU08 0 3 3 0 0 10 3 0 3 7 0 7 15 18 8 16
PSU09 3 0 3 0 0 1 4 14 0 7 18 18 1 2 13 8
PSU10 4 5 10 0 19 7 0 19 16 1 2 6 1 15 10 20
PSU11 0 3 1 4 0 0 0 0 0 3 6 1 2 10 14 11
PSU12 0 5 0 7 0 14 3 14 3 21 0 23 22 19 32 11
Total (%) 98 101 98 99 97 100 99 99 100 101 100 101 102 99 100 100
103
Following the mathematical calculations described above,
proportions of the sherds recovered from each of the 16 households that
were produced by the 12 production source units can be estimated;
these were shown in Table 3.1. In addition, an error range was also
calculated and assigned to each estimated mean proportion (although
they were omitted from Table 3.1). These proportions of production
source units (PSUs) in different households will become central to the
discussion in Chapter 5 which answers the research questions originally
posed.
3.5 Summary
There are many possible ways to make use of the compositional
information extracted from Hongshan pottery by the pXRF analyzer for
pattern recognition. In this chapter, we chose hierarchical cluster
analysis as the very fundamental tool to build clustering trees and
characterize clusters based on the similarity in sherds’ geochemical
compositions. Twelve compositional groups were identifiable on the
dendrogram with the clearest structures, and they were believed to
indicate 12 different production source units (or 12 possible pottery
104
producers). Based on these 12 delineated compositional groups, we
made estimates of the proportions of different PSUs represented in the
pottery consumed at each household. These 12 production source units
and their proportional representations in the 16 selected Hongshan
households will be the foundation that discussions in Chapter 5 most
heavily rely on.
105
4. MINERAL PHASE ANALYSIS: A COMPLEMENTARY STUDY
4.1 The importance of mineralogical data
Geochemical or compositional data of pottery and its raw materials
have been proven by many case studies (including the present work) to
be extremely useful for constructing regional geochemical baseline and
understanding intra- and inter-regional geochemical variability.
Elements with characteristic fingerprints and variations in their
concentrations recorded by investigative and analytical tools altogether
help describe the geochemical characteristics of pottery raw materials
(clays; mineral inclusions in the silt, sand, temper; etc.), which lay the
very foundation for differentiating or locating pottery raw material
sources exploited by ancient potters. However, it was realized almost
immediately, after the increasing applications of analytical approaches
and instruments to geochemical sourcing studies in 1970s, that
106
geochemical compositions alone did not always suffice to claim
geochemical variability and identify compositional groups.
As Peacock (1970) rightly pointed out in a review article on
scientific analysis of ancient ceramics, chemical analysis demonstrates
the presence/absence of elements in the investigated samples and shows
the variations in geochemical compositions of detected elements. It,
however, does not explain where elements come from or what minerals
they belong to. Such information could be equally important for relating
certain clays to a geographic location or region. One example that has
demonstrated the importance of mineral phase identification to
geochemical sourcing studies is the clay-mineral provinces established
for the Southeastern United States. Even though the entire
Southeastern region seemed to be dominated by some common clay
minerals (such as montmorillonite, kaolinite, illite, and chlorite),
different combinations or proportions of these minerals were noticed to
characterize different parts of the Southeastern region: montmorillonite
tends to dominate in the west while kaolinite in the east; in contrast,
illite and chlorite are more common in the north and south, respectively
(Steponaitis et al. 1996). This study, by combining the geochemical and
107
mineralogical data, convincingly demonstrated that some pottery
specimens were nonlocal products; in addition, it even assigned these
specimens to known geographical locations.
4.2 Obtaining mineralogical information
Probably the most convenient way to gather mineralogical information
from pottery/ceramics and their raw materials is through the modern
instrumental techniques and methods such as X-ray diffraction (XRD),
Fourier transform infrared spectroscopy (FTIR), and Raman
spectroscopy. These different analytical approaches have different
working principles, specific or no requirements for sample preparation,
and simple to complex procedures for data collection and interpretation.
However, they all aim to confirm the presence of certain minerals in the
analyzed samples by recording their unique chemical structures at the
molecular/atomic level. It is also important to keep in mind that,
hypothetically speaking, these equipment can only confirm, rather than
exclude, the presence of a certain mineral as they all have a detection
limit (DL) issue. That is to say, if a certain mineral exists in the
108
analyzed sample in a quantity that is too low to be analyzed by the
equipment, it will not be detected and reported.
It is the powder or polycrystalline X-ray diffraction (PXRD)
analysis that this dissertation will use to extract the mineralogical
compositions out of the selected Hongshan core zone sherds. The PXRD
analysis was chosen because: (1) it is a long-established methodology
and an exceptionally powerful and accurate tool for mineral phase
identification; (2) the minimal sample size for the preparation of ground
power often is a few tenths of grams, which basically causes no visible
damage to materials such as pottery and ceramics; (3) data
interpretation is quite straightforward as a reference library consisting
of crystal structure data of over 140,000 inorganic compounds is
available for the search/match purpose on many XRD units; and last
but not the least (4) it allows for a semi-quantitative determination of
each identified phase. Therefore, the mineralogical composition
presented here is actually a proportional representation indicating the
relative abundance of all identifiable minerals in each powdered,
homogenous sherd specimen.
109
More details about fundamentals of X rays, history of powder X-ray
diffraction, advantages and limitations of PXRD, sample preparation,
collection and processing of X-ray diffraction patterns, and the process
of identifying an unknown powered sample with mixed crystalline
materials or of quantifying the identifiable mineral phases using the
Rietveld refinement method can be found in the following books: Fultz
and Howe (2013:1-58); HUANG Jiwu 黃繼武 and LI Zhou 李周 (2012);
Waseda et al. (2011:21-127); Will (2006); Young (1993).
4.3 Purpose of applying PXRD to Hongshan sherds
The mineralogical data collected by PXRD analysis in this chapter aims
to provide additional information to advance the current understanding
of (or observations made on) geochemical (pXRF) data described in
Chapter 3. More specifically, it will try to demonstrate whether or not
the patterns noticed for geochemical variations across the three areas
(Sanjia, Dongshanzui, and Erbuchi) persist in the mineralogical data.
For example, it would help to determine: (1) What mineralogical
compositions seem to, in a general sense, characterize the pottery raw
materials exploited most often by the Hongshan core zone potters? (2)
110
Whether or not pottery produced by the 12 production source units
shows mineralogical differences as it did geochemically? (3) How does
pottery consumed in one of the three residential areas compare to that
in the other two in terms of their different kinds and quantities of
minerals; and (4) Does the mineralogical difference/similarity seen in
the pottery to correlate with different vessel forms or pastes?
4.4 Selection and preparation of 171 sherds for PXRD analysis
The purpose of proposing a semi-quantitative XRD analysis is to
complement the (pXRF) compositional results with mineralogical
information. It is not simply a comparison or connection between
elements (pXRF data) and mineral phases (XRD data) to explain which
elements may have come from (or been contributed by) what minerals.
The primary focus here is to test whether or not the 12 production
source units delineated by multivariate statistical analysis of pXRF
data seem replicable in mineralogical data, and if yes, how well the
mineralogical compositions correspond to characterize each delineated
production source unit. That being said, we would like to know if there
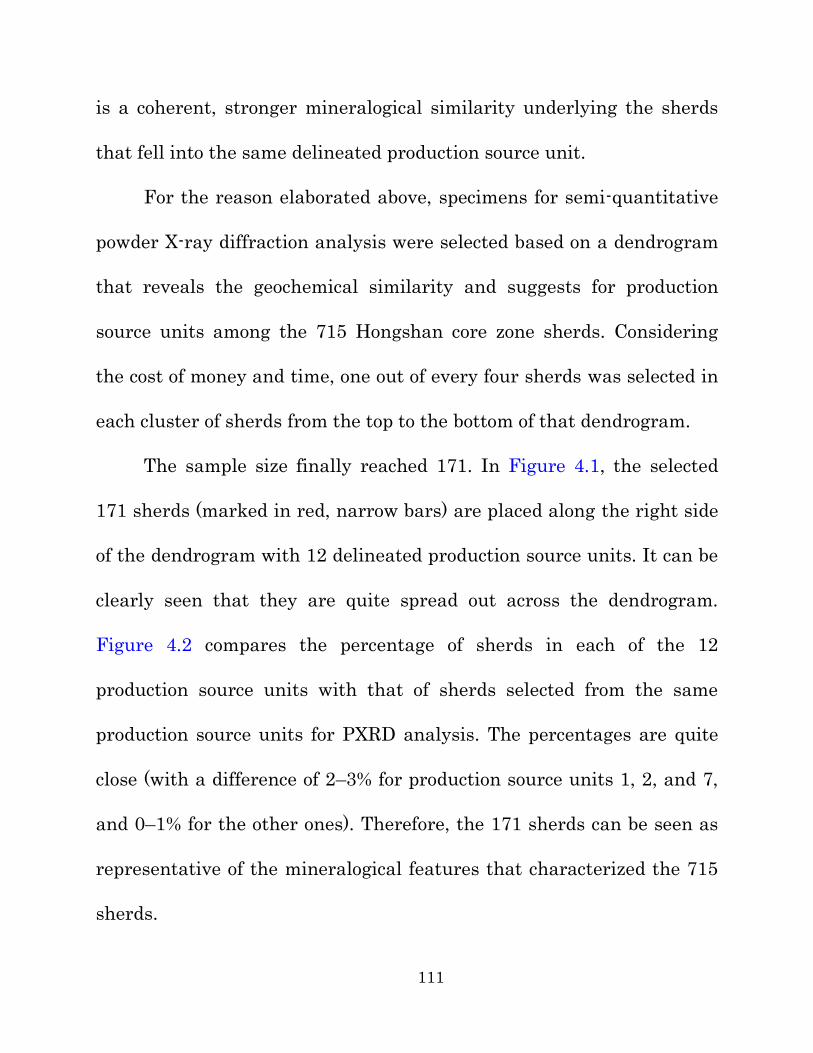
111
is a coherent, stronger mineralogical similarity underlying the sherds
that fell into the same delineated production source unit.
For the reason elaborated above, specimens for semi-quantitative
powder X-ray diffraction analysis were selected based on a dendrogram
that reveals the geochemical similarity and suggests for production
source units among the 715 Hongshan core zone sherds. Considering
the cost of money and time, one out of every four sherds was selected in
each cluster of sherds from the top to the bottom of that dendrogram.
The sample size finally reached 171. In Figure 4.1, the selected
171 sherds (marked in red, narrow bars) are placed along the right side
of the dendrogram with 12 delineated production source units. It can be
clearly seen that they are quite spread out across the dendrogram.
Figure 4.2 compares the percentage of sherds in each of the 12
production source units with that of sherds selected from the same
production source units for PXRD analysis. The percentages are quite
close (with a difference of 2–3% for production source units 1, 2, and 7,
and 0–1% for the other ones). Therefore, the 171 sherds can be seen as
representative of the mineralogical features that characterized the 715
sherds.
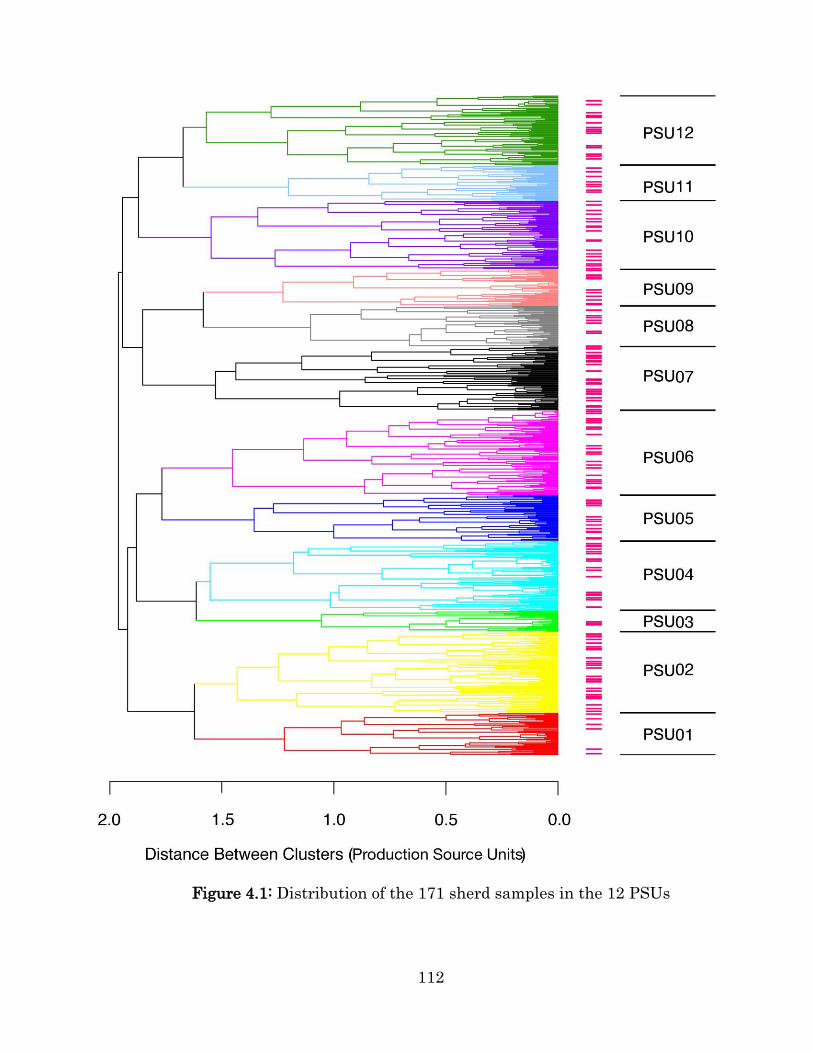
112
Figure 4.1: Distribution of the 171 sherd samples in the 12 PSUs
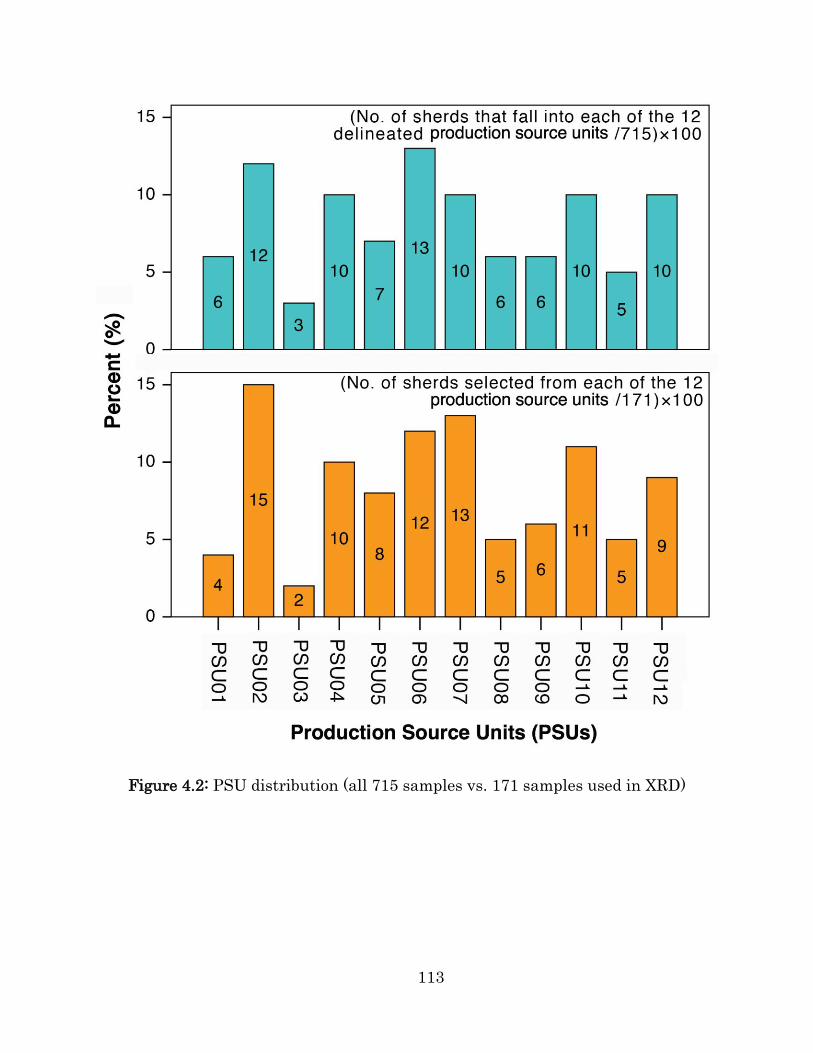
113
Figure 4.2: PSU distribution (all 715 samples vs. 171 samples used in XRD)
114
Among the 171 selected sherds, 169 belong to the Hongshan
period and 2 to the Xiaoheyan period. Sixty-seven (67) of the 171 sherds
can be identified by vessel forms, including 45 non-utilitarian vessels
(44 Tongxingqi and one incense burner) and 22 utilitarian ones (13
Guan, 5 Bo, 3 Pen, and one Weng). In regard to the paste, 57 fine-paste
(including 44 Tongxingqi and 13 fine-paste vessel sherds) and 10
coarse-paste sherds whose vessel forms are identifiable are included in
the 171 selected sherds.
Each of the 171 sherds was photographed before a small specimen
was removed from it. The sampling process was done with a scalpel,
with which a small specimen (weighted to a few hundred micrograms)
was removed from the sherd’s smooth cross-section where pXRF
readings were collected earlier. The specimen was supposed to
represent the mineralogical characteristics of each sherd. Therefore, it
was sampled not from the top surfaces but from the inner part of the
cross-section, in the hope of avoiding or reducing the influence of
dramatic mineral phase transition and transformation due to high
temperature in the firing process.
115
The preparation of sherd specimens into homogenized, finely
ground powder samples and the X-ray diffraction analysis were carried
out in the Key Laboratory of Non-Ferrous Metal Material Sciences and
Engineering, School of Materials Science and Engineering, Central
South University (Changsha, China). A Rigaku (Tokyo, Japan) D/Max-
2500 X-ray diffractometer was used to record diffraction patterns. The
working conditions and instrumental parameters of X-ray
diffractometer, which remained the same for all the 171 samples, can be
found in the final report of semi-quantitative XRD result for each sherd
(see Figure 4.3 for an example, which shows step-scanning
measurements of PXRD pattern, identified phases, and proportion of
each phase estimated by the Rietveld refinement method). Data
processing and interpretation was done with the MDI (Materials Data
Incorporation, USA) Jade XRD software package. Each obtained XRD
pattern was subject to a qualitative analysis at first to determine the
kinds of mineral phases detectable in each sherd specimen, and then to
the Whole-Pattern-Fitting/Rietveld Refinement Function for
quantitative analysis.
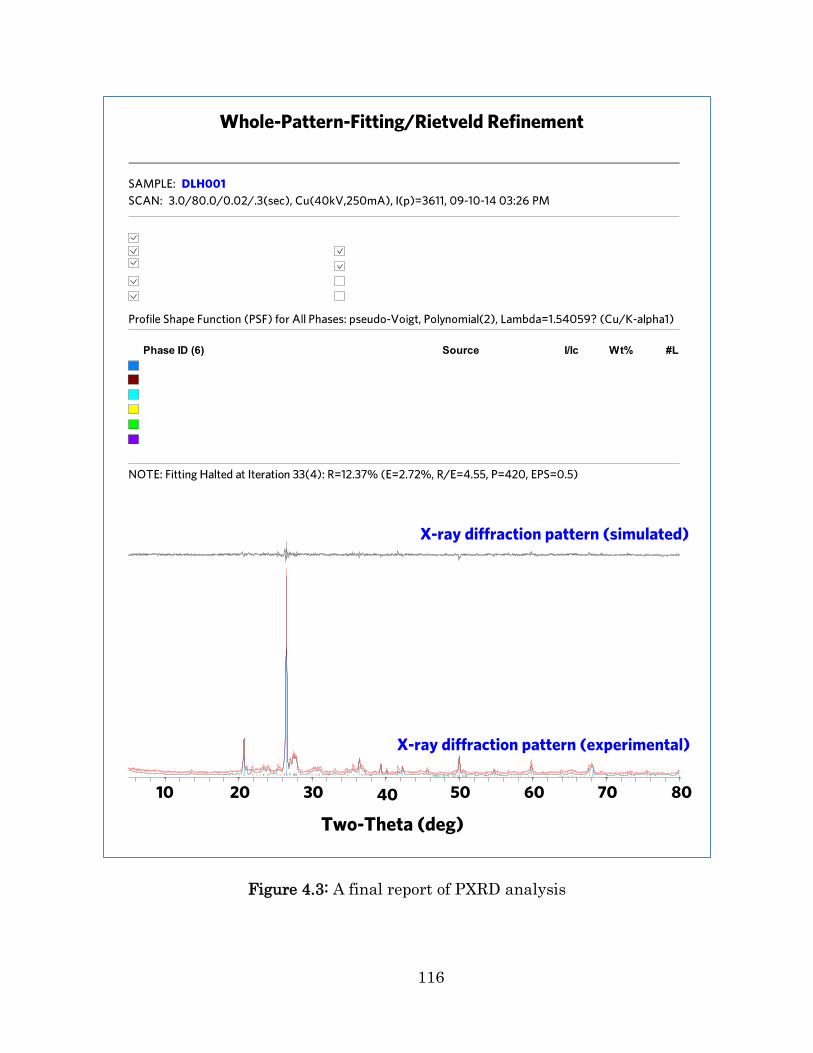
116
Figure 4.3: A final report of PXRD analysis
117
4.5 Results and Discussion
4.5.1 Identified minerals in the 171 tested sherds
In pottery analysis, pottery fabrics are considered as mainly consisting
of two components: plastic clay matrix (70–80, wt%) and non-plastic
inclusions (20–30, wt%). A clay matrix is composed of clay minerals
smaller than 0.02 mm (20 µm), which often are not visible to naked eyes
and can only be seen and studied with the assistance of microscopes.
Inclusions, on the other hand, are mostly present in the form of
minerals with larger particles that are noticeable by direct observation
with naked eyes (Orton and Hughes 2013:71). Mineral inclusions could
occur naturally in the clay sources and be retained in the final
pottery/ceramic products, with or without phase transformation during
the firing process. Or, they could be intentionally selected by potters
and added into the clay to achieve some particular physical properties.
Sometimes, separating the clay matrix and mineral inclusions for
parallel phase identification is important for understanding the pottery
making technology as the potters may have produced pottery using
clays and mineral inclusions from two different geological sources.
118
In the PXRD analysis, each specimen of the 171 selected
Hongshan core zone sherds was ground into fine and well-homogenized
powder. No effort was made to separate the clay matrix and mineral
inclusions for two main reasons: (1) many of the selected Hongshan
sherds (almost all Tongxingqi and a good many fine-paste vessel sherds)
were very finely made and contain very tiny mineral inclusions. Larger
inclusions do exist but only occur in very low frequency and small
quantities, suggesting that they probably are naturally occurring,
rather than intentionally added, in the clay that was used to make into
this pottery; and (2) some fine-paste and all coarse-paste sherds do
contain mineral inclusions a lot larger and more noticeable. Considering
their utilitarian nature and the small spatial scale they were
distributed across, it is hard to imagine that Hongshan potters chose
these minerals quite distant from the locations where clay sources were
exploited, and even if they did, minerals as inclusions should still very
likely be indistinguishable from the clay sources in terms of their
mineralogical compositions. Moreover, time and money are two other
concerns that prevent the separation of clay matrix and mineral
inclusions for parallel phase identification.
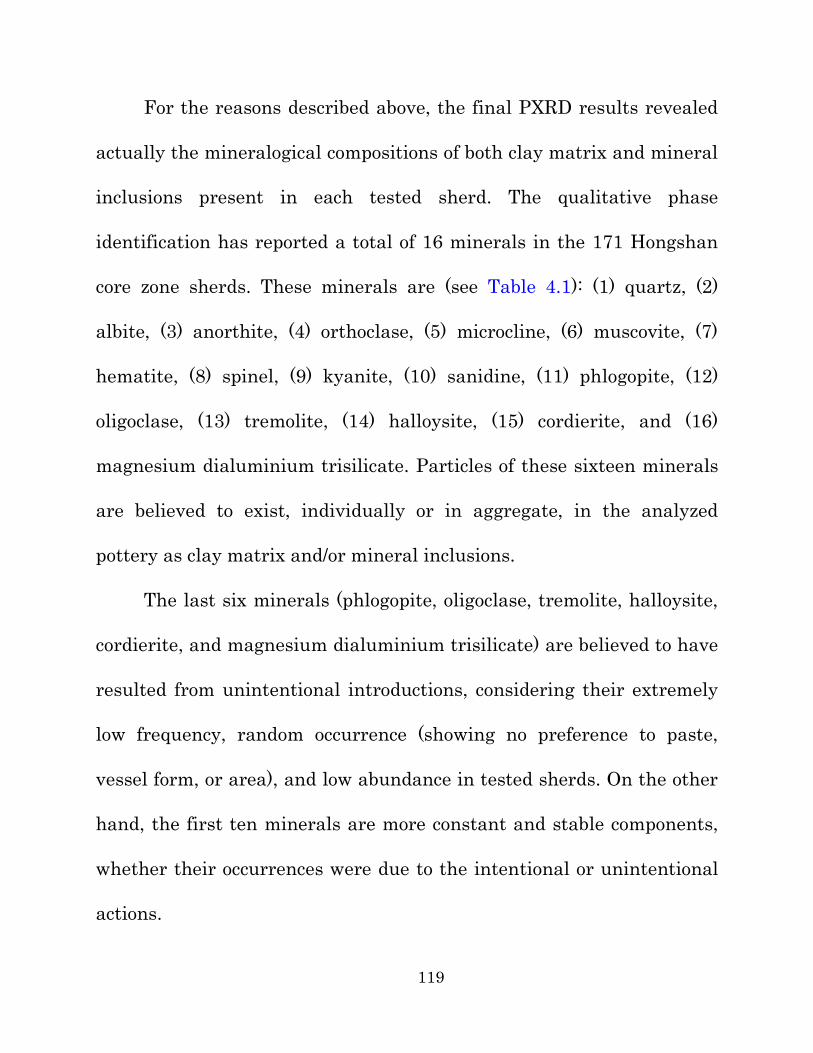
119
For the reasons described above, the final PXRD results revealed
actually the mineralogical compositions of both clay matrix and mineral
inclusions present in each tested sherd. The qualitative phase
identification has reported a total of 16 minerals in the 171 Hongshan
core zone sherds. These minerals are (see Table 4.1): (1) quartz, (2)
albite, (3) anorthite, (4) orthoclase, (5) microcline, (6) muscovite, (7)
hematite, (8) spinel, (9) kyanite, (10) sanidine, (11) phlogopite, (12)
oligoclase, (13) tremolite, (14) halloysite, (15) cordierite, and (16)
magnesium dialuminium trisilicate. Particles of these sixteen minerals
are believed to exist, individually or in aggregate, in the analyzed
pottery as clay matrix and/or mineral inclusions.
The last six minerals (phlogopite, oligoclase, tremolite, halloysite,
cordierite, and magnesium dialuminium trisilicate) are believed to have
resulted from unintentional introductions, considering their extremely
low frequency, random occurrence (showing no preference to paste,
vessel form, or area), and low abundance in tested sherds. On the other
hand, the first ten minerals are more constant and stable components,
whether their occurrences were due to the intentional or unintentional
actions.
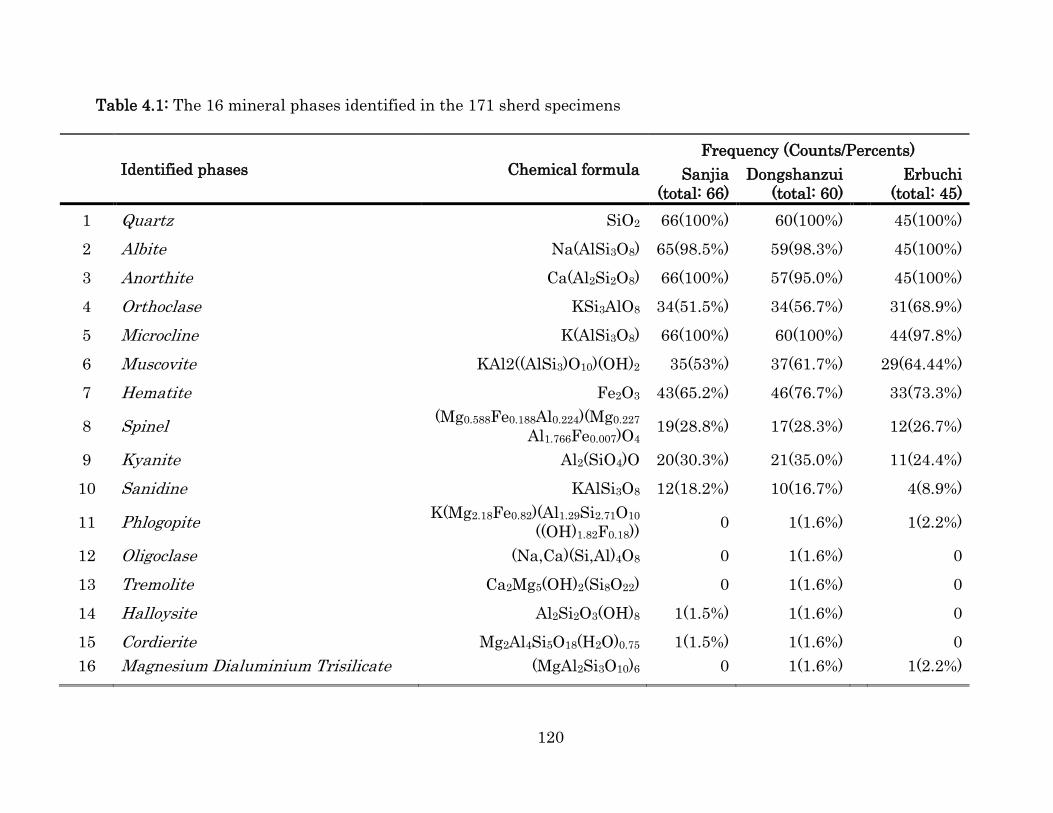
120
Table 4.1: The 16 mineral phases identified in the 171 sherd specimens
Identified phases Chemical formula
Frequency (Counts/Percents)
Sanjia
(total: 66)
Dongshanzui
(total: 60)
Erbuchi
(total: 45)
1 Quartz SiO2 66(100%) 60(100%) 45(100%)
2 Albite Na(AlSi3O8) 65(98.5%) 59(98.3%) 45(100%)
3 Anorthite Ca(Al2Si2O8) 66(100%) 57(95.0%) 45(100%)
4 Orthoclase KSi3AlO8 34(51.5%) 34(56.7%) 31(68.9%)
5 Microcline K(AlSi3O8) 66(100%) 60(100%) 44(97.8%)
6 Muscovite KAl2((AlSi3)O10)(OH)2 35(53%) 37(61.7%) 29(64.44%)
7 Hematite Fe2O3 43(65.2%) 46(76.7%) 33(73.3%)
8 Spinel (Mg0.588Fe0.188Al0.224)(Mg0.227
Al1.766Fe0.007)O4 19(28.8%) 17(28.3%) 12(26.7%)
9 Kyanite Al2(SiO4)O 20(30.3%) 21(35.0%) 11(24.4%)
10 Sanidine KAlSi3O8 12(18.2%) 10(16.7%) 4(8.9%)
11 Phlogopite K(Mg2.18Fe0.82)(Al1.29Si2.71O10
((OH)1.82F0.18)) 0 1(1.6%) 1(2.2%)
12 Oligoclase (Na,Ca)(Si,Al)4O8 0 1(1.6%) 0
13 Tremolite Ca2Mg5(OH)2(Si8O22) 0 1(1.6%) 0
14 Halloysite Al2Si2O3(OH)8 1(1.5%) 1(1.6%) 0
15 Cordierite Mg2Al4Si5O18(H2O)0.75 1(1.5%) 1(1.6%) 0
16 Magnesium Dialuminium Trisilicate (MgAl2Si3O10)6 0 1(1.6%) 1(2.2%)
121
By summarizing the phase identification results, it can be said
that quartz (the most important and common inclusion), feldspars
(albite, anorthite, microcline, orthoclase), mica (muscovite and
phlogopite), ferrous (hematite) and spinel-rich materials, most likely
explain the general mineralogical compositions of clays and/or
inclusions in the Hongshan core zone pottery.
4.5.2 Mineralogical variations among the 12 PSUs
One of the purposes for PXRD analysis to have been carried out on
sherds selected from the 12 PSUs and supposedly representative of each
PSU’s mineralogical characteristics is to test whether or not featured
mineralogical compositions also characterize the same 12 PSUs, just as
geochemical compositions did. With the proportional representation of
mineralogical composition (consisting of the ten major minerals) of
sherds that fell into each of the 12 PSUs, a series of statistical analyses
were carried out to look for patterns in mineralogical compositions. For
example, hierarchical cluster analysis and multi-dimensional scaling
analysis were applied to explore the mineralogical compositions’
122
similarity and dissimilarity between sherds from different areas, of
different pastes, and with different vessel forms.
It turned out that all the 171 sherds were just randomly
distributed and well mixed with each other however their mineralogical
compositions were measured for similarity or dissimilarity. None of the
12 PSUs has mineral(s) or a combination of minerals that seems unique
enough (in kinds or in quantities) to characterize one particular PSU or
several PSUs. This result, upon closer consideration, is not surprising
given the fact that minerals (such as quartz, microcline, albite,
anorthite, and orthoclase) occurred in the 171 sherds at very high
frequency are also in high abundance, which would have resulted in
unanimously high weights for the similarity measure.
In a word, it seems that the 12 production source units delineated
by geochemical data are not replicated by mineralogical data. This leads
us to assume that there is no significant mineralogical difference among
the 715 sherds that are represented by the 171 selected sherds.
Alternatively, we can say that these 171 Hongshan sherds seemed to be
made from raw materials with quite a “homogenous” mineralogical
composition. [Results of hierarchical cluster analysis and multi-
123
dimensional scaling analysis of the mineralogical compositions were
omitted here, but they are available in the University of Pittsburgh
Comparative Archaeology Database < www.cadb.pitt.edu>.]
4.5.3 Mineraological difference among sherds or areas
Figure 4.4 is a graphic representation of the frequency of occurrence of
the first ten minerals in the 171 selected sherds. Quartz, albite,
anorthite, and microcline are detected in almost each and every sherd,
suggesting that they are the most common mineralogical compositions
of clays and/or minerals in clays and/or minerals used to make into all
these 171 Hongshan core zone sherds. Less frequently seen minerals
include orthoclase, muscovite, and hematite, which occur in 50-80% of
the tested sherds. Still less are kyanite, spinel, and sanidine, which are
detected in less than 40% of the tested sherds.
Statistical analyses carried out on the proportional mineralogical
compositions for the three groups of sherds (Tongxingqi, fine-paste, or
coarse-paste vessel sherds) or sherds from the three areas in the hope of
distinguishing them failed to reveal meaningful patterns. The results
showed that variations in contents of the ten minerals do exist among
124
different groups of sherds or sherds from the three areas, but generally
speaking, they are not significant enough to make one group or one area
stand out against the other groups or areas mineralogically. This
finding has two important implications: (1) the three groups of sherds
are mineralogically indistinguishable from each other; and (2) sherds
from the three areas are mineralogically indistinguishable from each
other. There are two possible explanations for such an observation:
either all (both non-utilitarian and utilitarian) pottery consumed in the
three areas was produced by the same group of potters following the
same standards (raw materials, techniques, recipes, procedures, etc.) or
it was all prepared from raw materials (clays and minerals) that came
from several different geographical locations but all fell into the same or
similar geological and/or mineralogical backgrounds.
The pXRF results, however, have clearly suggested pottery
production activities in each of the three areas, as indicated by
geochemical variations among sherds from the three areas. Therefore, it
seems that the former possibility can be excluded. It seems more likely
that different pottery production activities were conducted in each of
the three areas using geochemically different but mineralogically
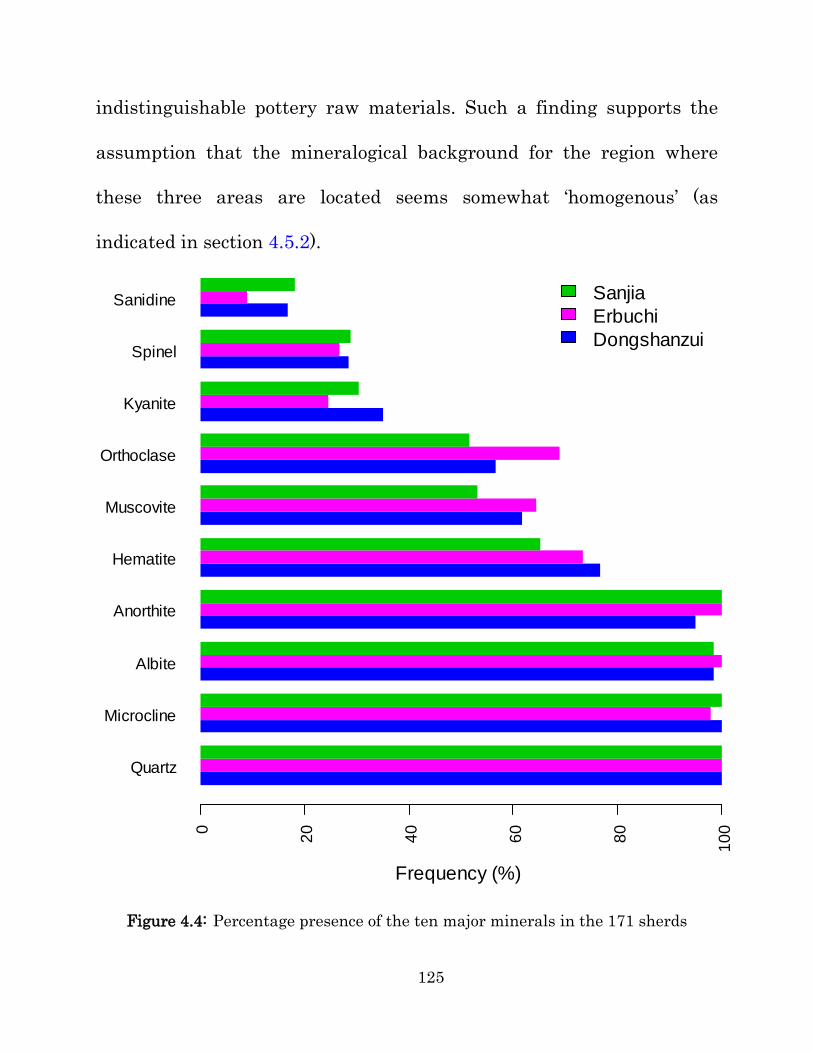
125
indistinguishable pottery raw materials. Such a finding supports the
assumption that the mineralogical background for the region where
these three areas are located seems somewhat ‘homogenous’ (as
indicated in section 4.5.2).
Figure 4.4: Percentage presence of the ten major minerals in the 171 sherds
Quartz
Microcline
Albite
Anorthite
Hematite
Muscovite
Orthoclase
Kyanite
Spinel
Sanidine Sanjia
Erbuchi
Dongshanzui
Frequency (%)
0
20
40
60
80
10
0
126
4.6 Summary
The PXRD analysis of 171 selected Hongshan core zone sherds failed to
replicate the groupings of sherds revealed by pXRF data: sherds that
fell into the 12 production source units do show some variations in their
mineralogical compositions, but such variations cannot be
quantitatively demonstrated as the geochemical variations. Even the
171 sherds, if considered as a full sampling pool, do not suggest any
patterned, noticeable mineralogical variations among the three areas.
Similar conclusions are also applicable to pottery made into different
vessel forms or with different pastes.
Mineraologically, pottery raw materials (such as clays and
inorganic inclusions) are complex mixture of different minerals that all
finally came from weathering rocks (Orton and Hughes 2013:121-125).
Therefore, the mineralogical composition of pottery raw materials is
strongly dependent on their parent materials (weathering rocks). The
investigated Homngshan core zone pottery, as suggested by X-ray
diffraction analysis, shared a lot of minerals in common: quartz and
feldspars being the most common and abundant minerals and less
commonly mica, ferrous (hematite) and spinel-rich substances. All these
127
features agrees well with the mineraological compositions of the locally
obtainable rocks (sandstone, conglomerate, andesite, volcanic rock
fragments, etc.), weathering rocks, and soils (Quaternary loess or loess-
like soils) in low mountians, rolling hills, and flat valley floors where
the Hongshan households were most often located and Hongshan
pottery was distributed (WU Guangju 乌 广 聚 1991:139-140).
Hypothetically speaking, the Hongshan people residing within the
Sanjia, Dongshanzui, and Erbuchi areas can make pottery almost
anywhere near their residential sites using clays and other raw
materials. The mineralogical data did not show any significant
difference among sherds collected from the three areas. Such an
observation, in addition to being seen as a reflection of weak regional
mineralogical variations, can also be considered as supporting evidence
for local pottery production.
128
5. UNDERSTANDING ECONOMIC DIFFERENTIATION THROUGH
POTTERY PROCUREMENT
5.1 Response to Research Question 1
RQ1: Did each of the 16 selected Hongshan households make its own
pottery?
The short answer to this question is No. Firstly, if inhabitants of each of
the 16 selected Hongshan households procured pottery raw materials
themselves and made pottery for their own use, there would have been
approximately 16 compositional groups or production source units
(PSUs) recognizable, when the 715 sampled sherds representing the
pottery consumed at the 16 households formed clusters based on their
geochemical similarities/dissimilarities. This is because inhabitants of
each Hongshan household would have relied heavily on resources that
were easily obtainable and suitable for pottery-making, and customarily
procured raw materials from loci that were quite close to their
129
occupation sites and may or may not be accessed by their neighbors.
Such a pattern of raw materials procurement, along with the different
practices for raw materials processing and pottery-making traditions
conducted within different households, would have generated greater
geochemical variations between pottery produced and consumed at
different households and therefore allowed more compositional groups
or PSUs to be identifiable. It is termed as "approximately 16" because
two households adjacent to each other may have procured raw
materials from the same loci or treated pottery raw materials in the
same way (for example, same recipes and techniques), which made it
difficult to distinguish their pottery geochemically. Therefore, the total
number of identifiable PSUs would be reduced slightly, but it should
still be close to, rather than a lot less than, 16.
Secondly, if every household made their own pottery, there would
have been one PSU (or sometimes two PSUs) dominating the pottery
consumed at each household. If each household procured, whether
consciously or subconsciously, raw materials mainly from one or a very
few loci close to where the household was located and made use of them
for pottery production, the pottery they made and consumed would have
130
been quite likely geochemically or compositionally homogenous.
Therefore, there would have been a good chance that all pottery made
and consumed within each household corresponded to one or two
common PSUs and different households had their own highly
distinctive and dominating PSUs. If this truly happened, we would
expect to see that the selected 50 or so sherds representing pottery
consumed at each of the 16 households were clustered closely to indicate
a single, common PSU.
Thirdly, if each household made their own pottery, there would
have been fewer commonly shared PSUs between different households
and especially between different areas. If each household made their
own pottery, there would have been little or no motivation for pottery to
transfer between different households even within the same area, let
alone to cross the geographical boundaries of the three areas. Thus,
households within one area would have demonstrated a very strong
focus on their own PSUs (that is, a number of PSUs that were mainly or
only seen in that particular area and rarely or not seen in the other two
areas) and barely consumed PSUs typically seen in the other two areas.
131
However, the evidence we have seen on the 715 Hongshan sherds
did not support the hypothesis that every household made their own
pottery. The reasons can be listed as below: (1) Only 12 meaningful
PSUs were recognizable for the 16 Hongshan households. This suggests
less geochemical variations (or in other words, more common PSUs)
than expected for pottery consumed by the 16 households if each of
them actually made pottery for their own use; (2) The pottery consumed
at each of the 16 households indicated the presence of multiple, rather
than one or two, PSUs. This suggests a greater geochemical complexity
for the pottery consumed at each household, because apparently no
household possessed pottery made from only one or two PSUs unique to
that particular household or area; (3) While it seems true that each
household consumed pottery made from multiple PSUs, it is also true
that the pottery sampled from the same household often failed to
indicate a shared PSU that dominates the pottery seen at that
household. Almost all the households consumed pottery made from a
few PSUs at a relatively high level (in terms of the proportional
representation of identifiable PSUs in each household); and (4) The 12
identifiable PSUs are shared not only between households within the
132
same area, but also across the geographical boundaries of the three
areas. For example, PSU12 characterizes the pottery consumed in the
Erbuchi area, but it is also noticed for pottery consumed in the Sanjia
and Dongshanzui areas in some small quantities. This suggests that
pottery made from the 12 PSUs was not restricted to a certain
household or residential area; rather, it was quite extensively
distributed across different households and areas, suggesting a fairly
open, rather than closed, pottery network.
Concluding remarks: It does not seem likely that each of the 16
Hongshan households made pottery for their daily use. The smaller
number of meaningful PSUs than the number of households, the widely
shared PSUs between households and across areas, and the
proportional representation of recognized PSUs at each household,
altogether reject the conclusion that pottery production was organized
by each household in this part of Hongshan core zone.
5.2 Response to Research Question 2
RQ2: If each household did not make their own pottery, were
pottery they consumed produced by a single producer or by multiple
ones?
133
The short answer to this question is: multiple producers, instead of one
single producer, made pottery that each household consumed. The term
“producer”, as it was used here and elsewhere in this dissertation,
indicates individual(s) who was/were most intensively involved in
procuring raw materials and processing them for pottery production in
their own ways. The term "producer" can refer to one person or to a
group of individuals, and the term itself implies nothing about labor
commitment (part-time or full-time), gender (male or female), skills,
experience, and age. It is reasonable to believe, as was discussed in
section 3.3, that there is a close correlation between a particular
Hongshan producer and an identifiable compositional group (or PSU).
This is because different producers often accumulated knowledge (such
as raw materials procurement) at different levels, mastered different
skills and techniques, maintained different technological and cultural
traditions, required different approaches to produce vessels' texture,
form, and size, and showed preferences for different recipes. Any or a
combination of several such factors could have direct influence on
pottery's chemical compositions. A PSU, in such a sense, is believed to
indicate a pottery producer.
134
However, it must be realized that a PSU does not necessarily
correspond strictly to one producer only, for the reason that a PSU is
delineated by the similarity in pottery's geochemical compositions and it
does not tell us exactly who made that pottery, where it was made,
following what technical and cultural traditions (although we know that
different PSUs must have stood for different technological and cultural
characteristics). It is for this reason that we argue that, even though
pottery represented by the 12 PSUs may not correspond strictly to 12
Hongshan producers, there is still a good chance that around 12
producers or producing groups are indicated for the 715 Hongshan
sherds and 12 PSUs. Therefore, the number of identifiable PSUs
strongly suggests that pottery consumed by each of the 16 Hongshan
households was not produced by only one producer but by multiple
(about 12) producers.
The hypothesis that one single producer produced pottery for all
the 16 Hongshan households can also be rejected by examining the
pattern shown in the 12 identifiable PSUs. For example, if there was
one single Hongshan producer and if this producer stayed in one
location and produced pottery for all the Hongshan residents nearby
135
and elsewhere, then all Hongshan households would have shared the
same PSUs as all pottery would be made from the same raw materials;
besides, there would be fewer identifiable (even possibly one) PSUs as
this single producer would continually make use of the materials most
abundant and convenient to obtain, which produced stable and
consistent PSUs. As a result, geochemical variations as revealed by
pottery would have been only mild between households and across the
three areas.
On the other hand, if there was one single Hongshan producer and
if the producer travelled to different areas and made pottery for
residents of visited Hongshan villages (although this possibility is very
low considering the travel and other costs), households within different
areas would have consumed different (groups of) PSUs as pottery would
be made from raw materials immediately and only obtainable within
each area. In this scenario, there would have been dramatic
geochemical variations when pottery from two different areas was
compared, which made different areas easily distinguishable. In
addition, little or no intraregional pottery transfer would be noticed and
136
PSUs would not be shared across the geographical boundaries of the
three areas.
However, the evidence we have seen in the 12 identifiable PSUs
and their proportional representation at each household does not
support either of the two above-mentioned assumptions. On the one
hand, it is clear that not all households in the three areas shared the
same PSUs. Neither is true that there were a very few PSUs (12 PSUs
are definitely not “very few” compared to the 16 households that they
characterized). In fact, each of the 16 households had pottery made from
multiple PSUs (for instance, 14 out of the 16 households had access to 9
and 12 PSUs), and the proportional representation of identifiable PSUs
varies from household to household. The geochemical variations
between different areas are greater than expected and the differences in
geochemical compositions of pottery consumed in different areas are
even sharp enough to make the majority of pottery roughly
distinguishable by their areas.
On the other hand, while PSUs were obviously shared across the
three areas, different areas were noticed to have mainly concentrated
on different groups of PSUs. For example, Erbuchi households relied
137
heavily on PSUs 8 and 11, and Sanjia households on PSUs 1 and 2.
Such a tendency for each area’s households to rely on different
combinations of PSUs implies that pottery production activities took
place within each of the three areas. Some PSUs were more widely
shared than others between different households and among different
areas. Considering that pottery production occurred within each area,
the shared PSUs might have just suggested intraregional pottery
transfer (that is, pottery crossing the geographical boundaries of the
three areas).
Concluding remarks: It seems easy to reject the hypothesis that
there once existed one single Hongshan producer (and maybe one
regional production center) who procured raw materials and made
pottery for inhabitants of all Hongshan households identified by the
upper Daling project. Pottery’s geochemical compositions and the PSUs
they characterized for each household and each area indicates pottery
production activities organized within each residential area. More
importantly, the 12 identifiable PSUs and the distribution patterns of
these PSUs within different households and areas imply that there
were multiple, rather than only one, Hongshan pottery producers.
138
Therefore, we can be confident to say that multiple producers in the
three different areas produced the pottery we have investigated.
5.3 Response to Research Question 3
RQ3: If households tended to acquire all or most of their pottery
from a single producer, did all households in a particular
neighborhood rely largely on a single procurement source? Or were
households utilizing different producers intermingled spatially
within settlements?
Toward the ending paragraph in response to Research Question 2, it
was concluded that not every household made its pottery and neither
did one single producer make pottery for inhabitants of all the 16
Hongshan households. The 12 identifiable PSUs and their proportional
representations at each household could serve as very concrete evidence
for the presence of multiple pottery producers/providers, rather than a
single one. At all aspects, the hypothesis that one single producer had
produced and provided pottery for households in the broad region across
the three areas was not at all supported. Thus, Research Question 3 can
be dismissed.
139
5.4 Response to Research Question 4
RQ4: If households tended to acquire pottery from multiple
producers and sources (PSUs), did the proportions in which these
PSUs were represented vary substantially from one household to the
next? Or were the proportions of different PSUs quite similar across
households within a settlement area?
The short answer to this question is: yes, all the 16 households procured
pottery from multiple PSUs, and the proportional representation of
PSUs does vary from household to household. However, it is also
noticed that the proportional representation of PSUs looks more similar
for households within the same area or the same neighborhood than
those in different areas and neighborhoods.
When the spatial scale is zoomed in from several kilometers to a
few hundred meters in both dimensions to make smaller groups of
households (or neighborhoods) recognizable, even households from the
same neighborhood almost always relied on diverse procurement
sources rather than on a single procurement source (or the same
producer) as their only (or main) pottery provider. What seemed also
true is that households from the same or close neighborhoods often
tended to procure and consume pottery more similarly (in terms of both
140
the kinds and proportions of PSUs), although a very few households
from two separate and more distant neighborhoods did occasionally
consume very similar PSUs in similar proportions. All these findings
suggest a very strong neighborhood-focused pottery distribution and
consumption pattern but also some intra-neighborhood communication
(though less frequent) in accessing and sharing pottery procurement
sources.
The very strong similarity among households within the same
neighborhood, which is usually delineated by a few closely spatially
related households within a smaller spatial extent (one hundred meters
or so in each direction), in consumption of procurement sources can be
readily recognized when proportional representations of the twelve
production source units (PSUs) were compared household by household
and area by area.
Figure 5.1 makes such comparisons more easily noticed by
displaying the proportions of PSUs in the form of bar graphs to
represent the consumption of different procurement sources by each
household.
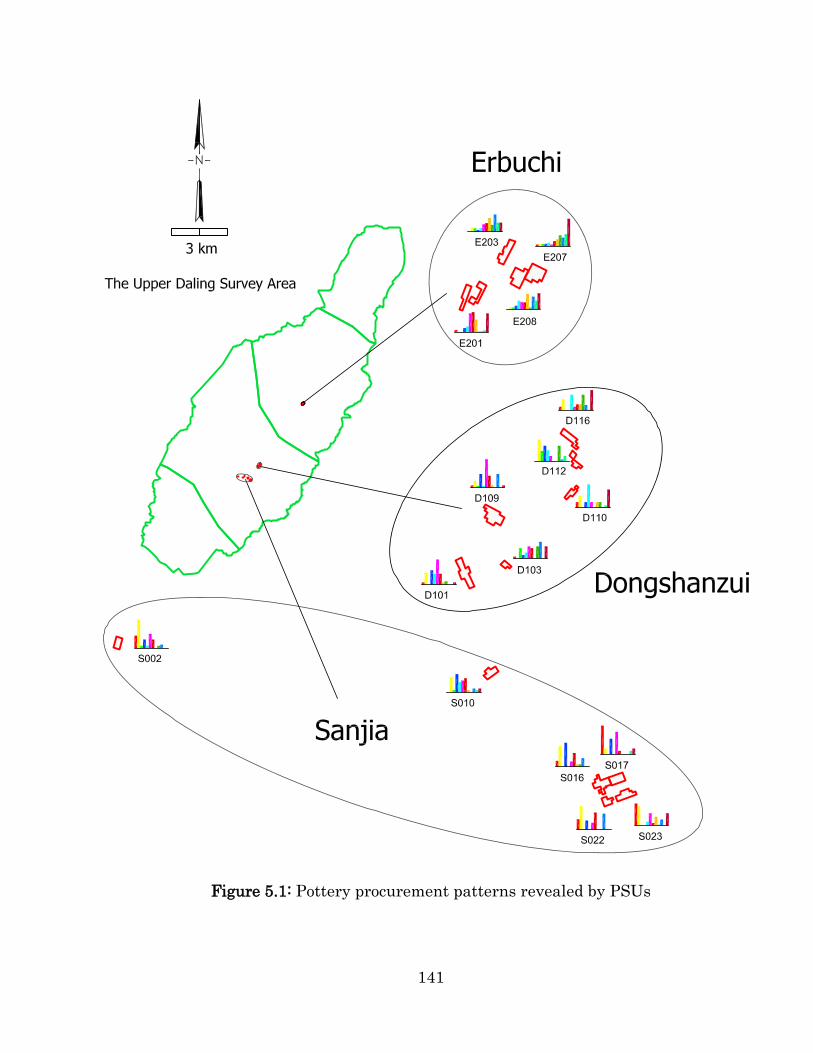
141
Figure 5.1: Pottery procurement patterns revealed by PSUs
142
In Figure 5.1, a clear and strong tendency is the changing focus on
PSUs along the Sanjia-Dongshanzui-Erbuchi direction on a regional
level; more specifically, the first six PSUs (PSU01 to PSU06) were
mostly strongly emphasized by the six Sanjia households, which are
located in the southern part of the survey area; while, on the other
hand, PSU06 to PSU12 were more often noticed in much higher
proportions for households in the Erbuchi area to the north of
Dongshanzui and Sanjia areas. The Dongshanzui households were
distributed in between Sanjia and Erbuchi areas yet much closer to
Sanjia. Two of them (D101 and D109) demonstrated a pattern more
similar to those in the Sanjia area while the other four (D103, D110,
D112, and D116) behaved more like the four Erbuchi households did.
Such a shift in reliance on different procurement sources among
households corresponds well with the change in spatial distance
between households, suggesting again a pattern of pottery making by
multiple producers in different areas and a consumption focus on
pottery made from local raw materials.
On an even smaller spatial scale, households very close to each
other (within neighborhoods) often, although not always, demonstrated
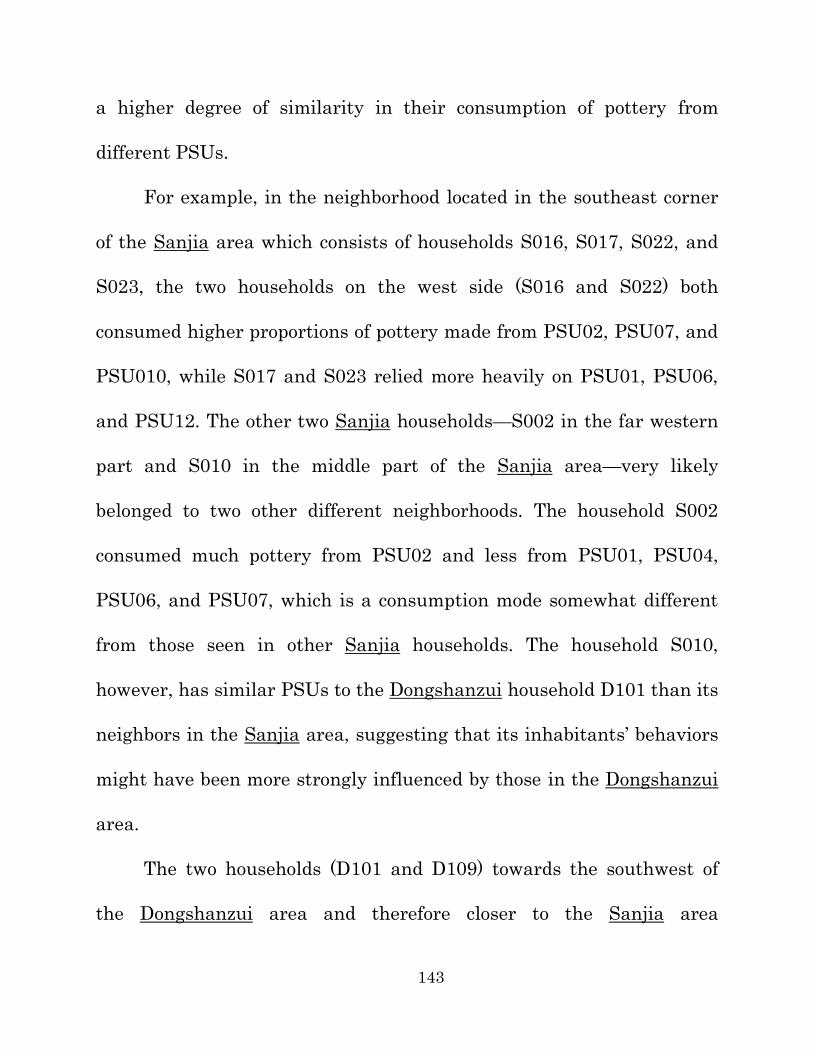
143
a higher degree of similarity in their consumption of pottery from
different PSUs.
For example, in the neighborhood located in the southeast corner
of the Sanjia area which consists of households S016, S017, S022, and
S023, the two households on the west side (S016 and S022) both
consumed higher proportions of pottery made from PSU02, PSU07, and
PSU010, while S017 and S023 relied more heavily on PSU01, PSU06,
and PSU12. The other two Sanjia households—S002 in the far western
part and S010 in the middle part of the Sanjia area—very likely
belonged to two other different neighborhoods. The household S002
consumed much pottery from PSU02 and less from PSU01, PSU04,
PSU06, and PSU07, which is a consumption mode somewhat different
from those seen in other Sanjia households. The household S010,
however, has similar PSUs to the Dongshanzui household D101 than its
neighbors in the Sanjia area, suggesting that its inhabitants’ behaviors
might have been more strongly influenced by those in the Dongshanzui
area.
The two households (D101 and D109) towards the southwest of
the Dongshanzui area and therefore closer to the Sanjia area
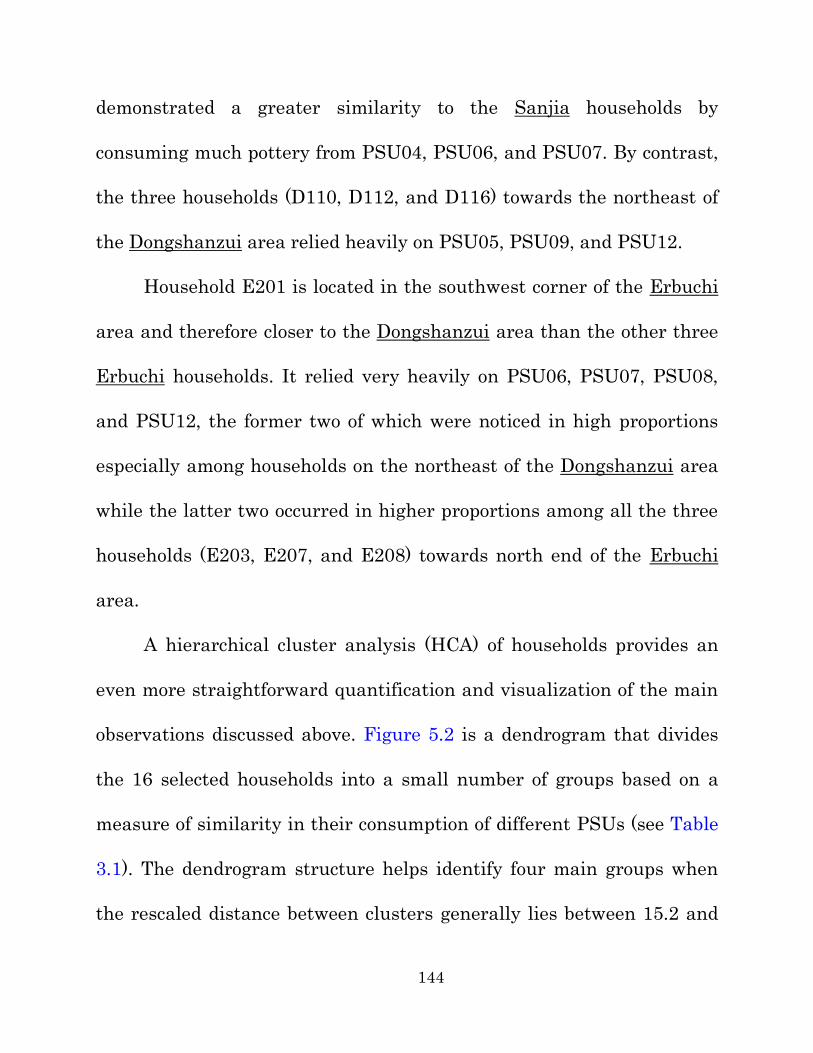
144
demonstrated a greater similarity to the Sanjia households by
consuming much pottery from PSU04, PSU06, and PSU07. By contrast,
the three households (D110, D112, and D116) towards the northeast of
the Dongshanzui area relied heavily on PSU05, PSU09, and PSU12.
Household E201 is located in the southwest corner of the Erbuchi
area and therefore closer to the Dongshanzui area than the other three
Erbuchi households. It relied very heavily on PSU06, PSU07, PSU08,
and PSU12, the former two of which were noticed in high proportions
especially among households on the northeast of the Dongshanzui area
while the latter two occurred in higher proportions among all the three
households (E203, E207, and E208) towards north end of the Erbuchi
area.
A hierarchical cluster analysis (HCA) of households provides an
even more straightforward quantification and visualization of the main
observations discussed above. Figure 5.2 is a dendrogram that divides
the 16 selected households into a small number of groups based on a
measure of similarity in their consumption of different PSUs (see Table
3.1). The dendrogram structure helps identify four main groups when
the rescaled distance between clusters generally lies between 15.2 and
145
17.8: (1) Group 1, which can be further divided into two smaller
clusters—one consisting of three Sanjia households (S002, S016, and
S022) and the other of one Sanjia (S010) and two Dongshanzui (D101
and D109) households; (2) Group 2, which consists of two Sanjia
households (S017 and S023) only; (3) Group 3, which has the three
households (D110, D112, and D116) towards north of the Dongshanzui
area; and (4) Group 4, which includes all the four Erbuchi households
(E201, E203, E207, and E208) and one Dongshanzui household (D103).
The same distribution patterns can be noticed in a two-dimensional
map of MDSCAL analysis as well (the results can be found in the
University of Pittsburgh Comparative Archaeology Database
<www.cadb.pitt.edu>).
To summarize, households were grouped in a slightly different
way in the dendrogram than they were visually perceived on the map in
Figure 5.1, but the general patterns remained quite similar in both
Figure 5.1 and Figure 5.2: pottery production, distribution, and
consumption was organized mainly on the neighborhood level, although
intra-neighborhood and intra-regional exchange and/or trade occurred
less frequently and less intensively. Consequently, Hongshan
146
households in the three areas were actually using mixed pools of pottery
producers, although their dependence on different PSUs was also
certain. The spatial distance between households had a strong influence
on pottery consumption behaviors of inhabitants living in those
households. The chances are greater that two households closer to each
other demonstrate high similarity in the kinds and proportions of PSUs
that they had accessed and consumed than two households farther from
each other.
Concluding remarks: The 12 identifiable PSUs definitely did not
all occur, nor were they equally represented, at each of the 16
Hongshan households. In general, the contrast between households
from different areas is greater than that noticed for households within
the same area. Within the same area, not every household consumed
PSUs in the same way, even though similarities are greater than
differences among households.
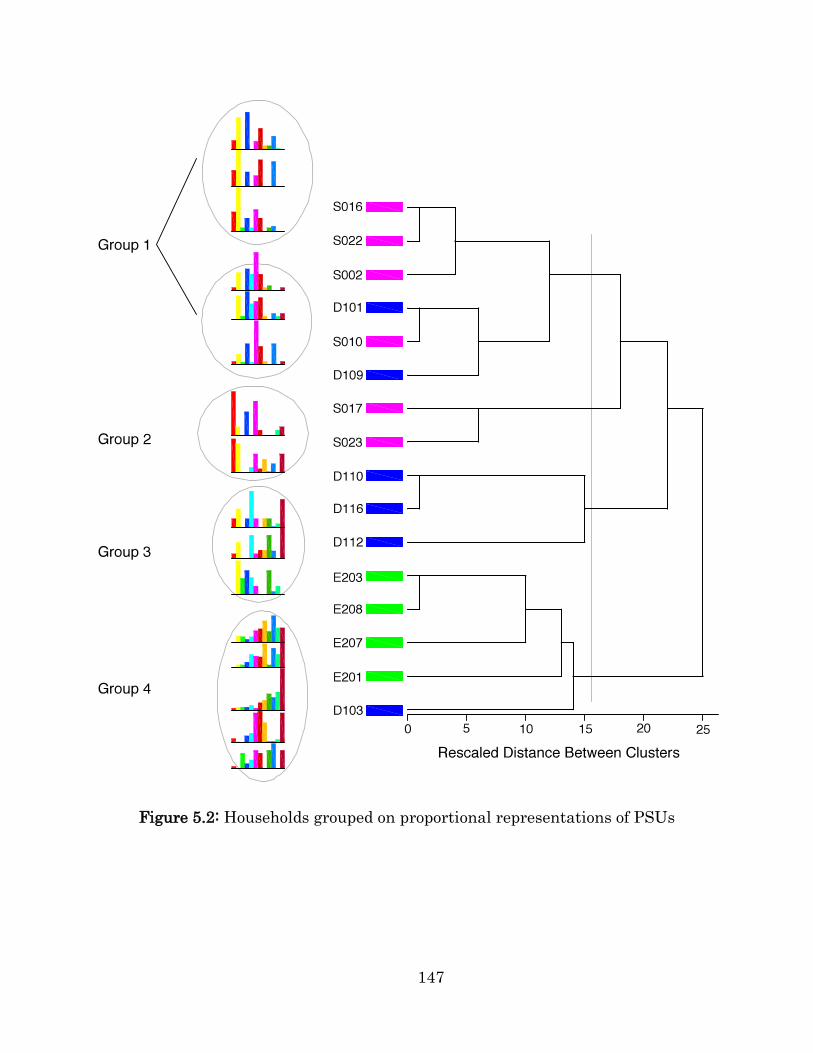
147
Figure 5.2: Households grouped on proportional representations of PSUs
148
5.5 Response to Research Question 5
RQ5: To what extent did utilitarian pottery distribution cross the
boundaries between the supra-local communities or districts
delineated in the regional settlement analysis?
The short answer to this question is: utilitarian pottery and non-
utilitarian vessels were widely distributed across the geographical
boundaries of the three areas studied, pertaining to two different
districts, so clearly pottery crossed the spatial limits of supra-local
Hongshan communities.
We came to this conclusion based on our observations on (1) the
geochemical variations noticed for pottery consumed at each household
and (2) the delineation of supra-local communities done by the upper
Daling project. The upper Daling project delineated four supra-local
Hongshan communities in the 200-km2 survey area and two of them
(District 2 and District 3) were fully included in the survey area with
one including households in the Dongshanzui and Sanjia areas while
the other included households in the Erbuchi area. As has been pointed
out in our response to Research Questions 1 and 2, multiple producers
within each of the three areas produced pottery for residents of local
149
Hongshan communities using locally procured raw materials.
Therefore, the number of PSUs that each household within a Hongshan
supra-local community had access to and the diversity and variability
shown in groups of PSUs represented at different households enhances
our understanding of pottery distribution networks (including the
spatial extent of pottery distribution) among the three areas and the
two Hongshan supra-local communities in particular.
From a geochemical perspective, if pottery produced within each of
the three areas and/or in the two supra-local Hongshan communities
did not cross their geographical boundaries, households within the same
area or the same supra-local community would have consumed only the
pottery made by local PSUs due to the exclusive use of local pottery raw
materials, and not used pottery made by PSUs that characterize the
other two areas or the other supra-local community. It means that
different areas or supra-local communities would have always
concentrated on different groups of PSUs, and barely possessed PSUs
distributed outside of their spatial limits (other areas or supra-local
communities). Such a pattern, when converted into the distribution of
pottery’s geochemical compositions, would result in a few (large)
150
clusters that contained only the pottery from the same areas or the
same supra-local community in each. On the dendrogram that is used
as a classic way to graphically show the pottery’s
similarity/dissimilarity in their geochemical compositions, we would
expect to see (1) pottery from the same area or the same supra-local
community being highly compacted clustered together to form cluster(s)
and (2) pottery from different areas or supra-local communities never
being mixed in the same cluster.
However, as soon as the 12 compositional groups or PSUs were
delineated on the dendrogram (see section 3.3 for details), it became
obvious that the 16 investigated households representing three areas or
two Hongshan supra-local communities had a strong geochemical
complexity in their consumed pottery: (1) within each area, pottery
consumed at neighboring households was sometimes but not always
geochemically most alike. When pottery collected from the same area
was compared by geochemical composition, many but not all households
fell into the same cluster(s) to indicate the same PSUs. Sometimes,
pottery (whether utilitarian or non-utilitarian) consumed at one
household or area turned out to be geochemically more similar to that
151
consumed at households in other areas. In each area, pottery produced
by all 12 identifiable PSUs was noticed, suggesting that the imaginary
“spatial separation between different areas witnessed by the focus on
different groups of PSUs” did not exist; (2) while PSUs were widely
shared between households and areas, no PSUs were restricted to one
particular area or household. Even if we considered the Dongshanzui
and Sanjia households as a single group of households representing one
supra-local Hongshan community and the Erbuchi households as
representing the other supra-local Hongshan community, such an
observation would still be valid: inhabitants of Hongshan households
anywhere in the three areas or in the two supra-local communities
accessed pottery made from different PSUs without much difficulty.
This can be seen as another indication that pottery distribution was not
restricted to an area or a supra-local community; rather, it crossed the
geographical boundaries of different areas and even the different supra-
local communities.
Concluding remarks: Inhabitants of the 16 Hongshan households,
no matter where they lived in the three areas or how they were divided
by sociopolitical units, were able to possess pottery (whether non-
152
utilitarian or utilitarian) made from almost all identifiable PSUs. We
therefore strongly believe that the distribution network of Hongshan
pottery was quite open. Both utilitarian and non-utilitarian pottery
crossed the geographical boundaries of the three areas or those of the
two supra-local Hongshan communities.
5.6 Response to Additional Research Question 1
How “specialized” was the production of non-utilitarian compared
to utilitarian Hongshan pottery?
The short answer to this question is: low-level specialization for both.
We came to this conclusion based on our observations on the
geochemical compositions of Hongshan utilitarian and non-utilitarian
pottery vessels (mainly from a raw materials procurement point of
view). We have already known that producers in each of the three areas
made utilitarian and non-utilitarian pottery. The non-utilitarian vessels
(Tongxingqi) have much larger size, more uniform shape and vessel
form, and clearly finer texture and decorations than utilitarian
Hongshan pottery do. If a high level of craft specialization were
153
developed in Hongshan pottery production, we would be more likely to
see some evidence of it on Tongxingqi vessels than on utilitarian
pottery. For example, pottery raw materials procured from some
particular loci would have been consistently used, and/or some specific
processing techniques would have been developed or adopted, to ensure
the good quality of final products of Tongxingqi vessels, which would
generate a very high geochemical homogeneity among Tongxingqi
vessels than for utilitarian pottery. If this actually occurred, we would
have noticed that some PSUs were mainly or only noticed on
Tongxingqi vessels and barely seen in utilitarian vessel; while
utilitarian vessels, on the other hand, showed little or no preference to
certain PSUs.
However, from the estimated proportional representations of
Tongxingqi and utilitarian vessels in the 12 identifiable PSUs
(proportions were estimated following the same procedures described in
section 3.4), whose results are shown in Table 5.1 and Figure 5.3, we
noticed that both non-utilitarian and utilitarian vessels were made from
the same kinds of PSUs and no PSUs seems to be restricted to the
production of Tongxingqi vessels or to the production of utilitarian
154
(storage and serving) vessels. That is to say, no particular raw
materials (as indicated by PSUs) were reserved for the production of
non-utilitarian or utilitarian vessels across the three areas. From the
geochemical perspective, compositions of non-utilitarian and utilitarian
Hongshan vessels were always mixed together and not distinguishable
from one another as two separate groups, suggesting that raw materials
for making Tongxingqi vessels were no different from those used for
making utilitarian vessels.
On the other hand, however, we have also noticed that, although
non-utilitarian (Tongxingqi) vessels were not made from some
intentionally chosen PSUs or raw materials, their geochemical
compositions did look more consistent and less variable than those
noticed on utilitarian vessels. This argument is strongly supported by
Figure 5.4 that is a plot of two-dimensional scaling analysis of
geochemical compositions of non-utilitarian and utilitarian pottery. The
scatter plot was obtained through the construction of a similarity
matrix with Euclidean distances of z-scored concentrations of the 11
elements on 212 Hongshan sherds whose vessel forms are identifiable.
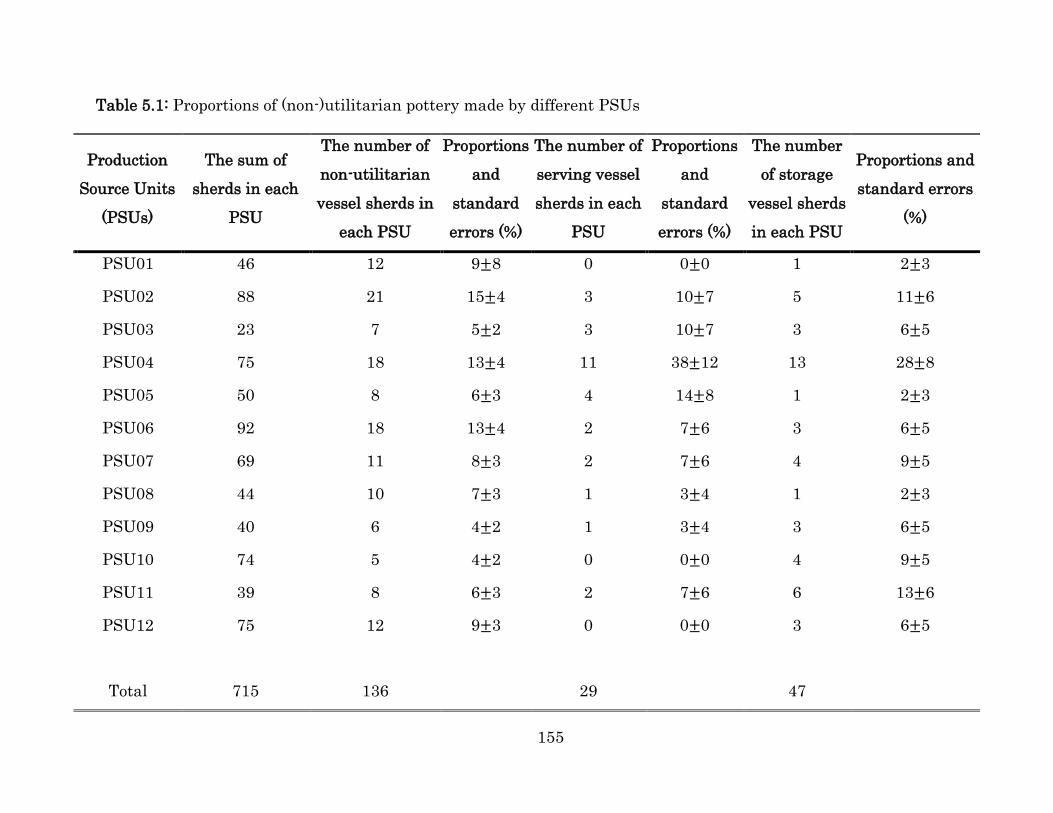
155
Table 5.1: Proportions of (non-)utilitarian pottery made by different PSUs
Production
Source Units
(PSUs)
The sum of
sherds in each
PSU
The number of
non-utilitarian
vessel sherds in
each PSU
Proportions
and
standard
errors (%)
The number of
serving vessel
sherds in each
PSU
Proportions
and
standard
errors (%)
The number
of storage
vessel sherds
in each PSU
Proportions and
standard errors
(%)
PSU01 46 12 9±8 0 0±0 1 2±3
PSU02 88 21 15±4 3 10±7 5 11±6
PSU03 23 7 5±2 3 10±7 3 6±5
PSU04 75 18 13±4 11 38±12 13 28±8
PSU05 50 8 6±3 4 14±8 1 2±3
PSU06 92 18 13±4 2 7±6 3 6±5
PSU07 69 11 8±3 2 7±6 4 9±5
PSU08 44 10 7±3 1 3±4 1 2±3
PSU09 40 6 4±2 1 3±4 3 6±5
PSU10 74 5 4±2 0 0±0 4 9±5
PSU11 39 8 6±3 2 7±6 6 13±6
PSU12 75 12 9±3 0 0±0 3 6±5
Total 715 136 29 47
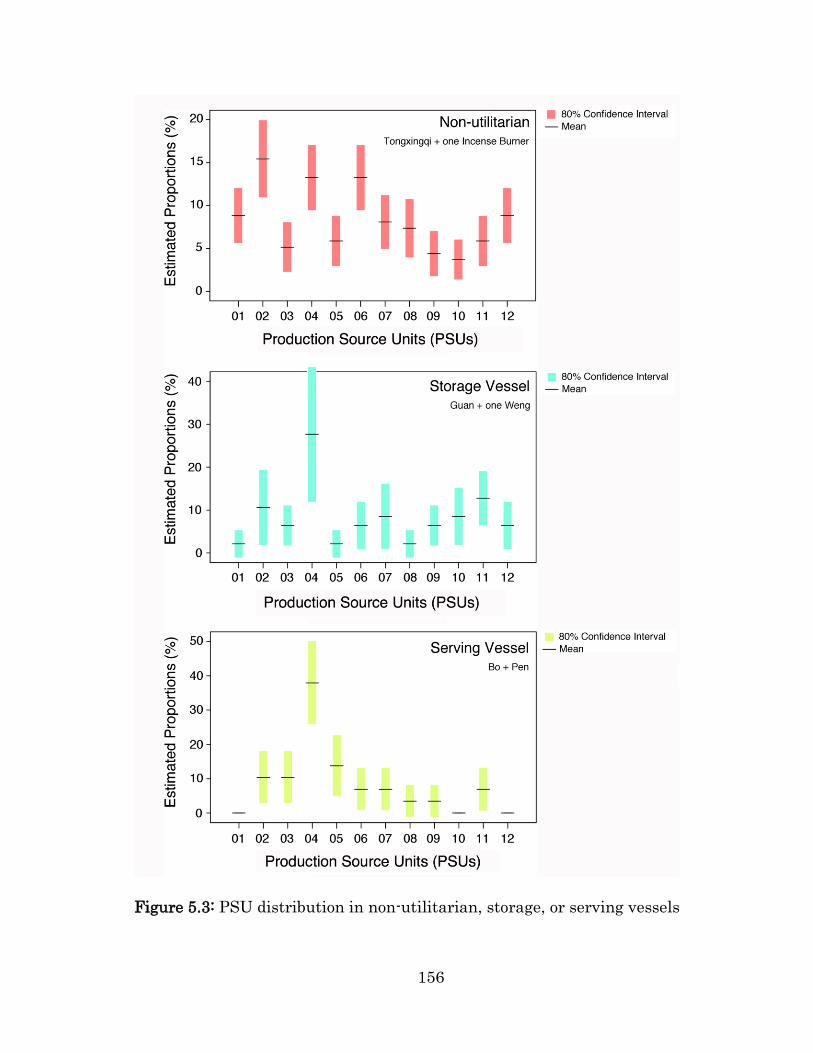
156
Figure 5.3: PSU distribution in non-utilitarian, storage, or serving vessels
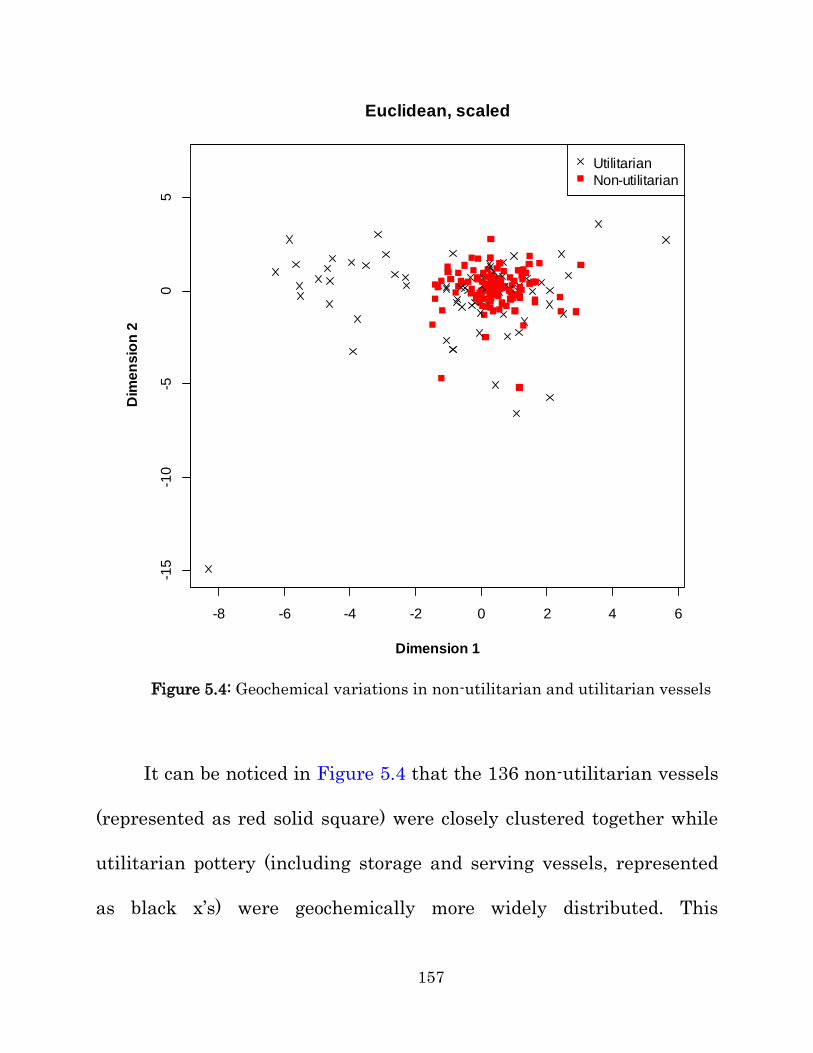
157
Figure 5.4: Geochemical variations in non-utilitarian and utilitarian vessels
It can be noticed in Figure 5.4 that the 136 non-utilitarian vessels
(represented as red solid square) were closely clustered together while
utilitarian pottery (including storage and serving vessels, represented
as black x’s) were geochemically more widely distributed. This
-8 -6 -4 -2 0 2 4 6
-15
-10
-50
5
Euclidean, scaled
Dimension 1
Dim
en
sio
n 2
Utilitarian
Non-utilitarian
158
distribution pattern of geochemical compositions suggests that
Hongshan pottery producers must have established some degree of
“standardization” for the production of non-utilitarian vessels, which
may include (but is not limited to) similar standards for selecting soils
and clays and similar procedures to get them ready for pottery
production. Although Tongxingqi were more standardized in these ways
than utilitarian vessels, the differences between the two classes of
pottery are not overwhelming. A visible cluster of utilitarian vessels
occurs in exactly the same part of the MDSCAL space where many
Tongxingqi cluster. Both classes of pottery are also represented by a
scatter of specimens lying out from this cluster, but such outliers are
more abundant and more widely scattered for utilitarian vessels than
for Tongxingqi. The degree of standardization in Tongxingqi production
that is indicated is thus not dramatically greater than that seen for
utilitarian vessels.
Concluding remarks: The Hongshan potters did not make non-
utilitarian and utilitarian pottery with very different raw materials.
However, Hongshan non-utilitarian vessels did show a greater
geochemical homogeneity than utilitarian ones did, suggesting that a
159
more restricted range of post-soil selection treatments might have been
applied in the production of non-utilitarian vessels. Such a more careful
labor investment in the production of non-utilitarian vessels suggests
some degree of craft “specialization”. However, considering the whole
pattern of raw materials procurement, it was a very low level of
specialization that falls far below the expectations that many scholars
have proposed for Hongshan craft (pottery) production.
5.7 Response to Additional Research Question 2
What are the implications of pottery procurement for understanding
economic or social status?
The analyses we have carried out have revealed important information
about pottery procurement by Hongshan households within and among
different areas or different supra-local communities. It is clear that
pottery distribution was spatially wide and crossed different areas and
supra-local communities; that households anywhere in the three areas
or in the two Hongshan supra-local communities acquired pottery made
from multiple PSUs; that the proportions of PSUs represented at each
160
household differ from one household to another; and that there were
often one or two households standing out against others in the same
neighborhood in terms of their pottery procurement (access to and
proportions of different PSUs).
By looking at the way pottery made by different PSUs was
procured and consumed at each Hongshan household, and by
understanding the general pattern of pottery procurement pictured for
different areas and especially in the two different Hongshan supra-local
communities, we came to the conclusion that Hongshan households
organized into the same neighborhood were often differentiated by their
ability to access different PSUs and possess pottery made from them. As
the access to and reliance on different PSUs reflects the ability,
frequency, and intensity inhabitants of each Hongshan household
maintained in communicating with their counterparts (pottery
producers, for instance) within and outside of the same geographical
region or the same sociopolitical unit, one naturally occurring thought
would be that households with more diverse sources (PSUs) would
suggest more intense interaction and communication with a greater
number of different pottery producers. The motivation for a higher
161
degree of interaction and communication on the part of some
households is an interesting topic to explore, as it may closely relate to
the sources of power that helped some Hongshan individuals or
households to achieve higher status at least in this part of Hongshan
core zone.
The upper Daling project has identified some (more precisely, 12)
households with higher status from the 50 identified Hongshan
households by carrying out multidimensional scaling analysis on
ceramic assemblages recovered at these 50 households (R. Drennan,
Personal Communication, June 14, 2015). Whether the higher status
was wealth-related or prestige-related has remained unclear so far.
Four variables were used to produce the clearest pattern, including:
proportion of decorated sherds, proportion of slipped sherds, proportion
of fine-paste sherds, and proportion of serving vessels. Five out of the 12
households with higher-status were included in the 16 selected
Hongshan households, including three in the Sanjia area (S016, S017,
and S022), one in the Dongshanzui area (D109), and one in the Erbuchi
area (E201). Since we have already established the pottery procurement
for these same five households as well as for eleven households without
162
higher status, we would wonder if there would be any correlation
between household status and pottery procurement patterns.
To approach such a goal, we need to find out: Did higher-status
households acquire pottery and pottery procurement sources in a whole
different way than households with lower status did? Or did they all
behave in the same or similar ways? This question can be answered by
an examination and comparison of the proportional representations of
identifiable PSUs noticed for those higher-status and lower-status
households.
Figure 5.5 places the proportional representations of PSUs at the
five higher-status households (S016, S017, S022; D109; E201) on the
left and those at the other eleven households with lower status (S002,
S010, S023; D101, D103, D110, D112, D116; E203, E207, E208) on the
right, both in an order of spatial progression from the southern to the
middle part of the survey region if examined from the top to the bottom.
One observation that can be made instantly on Figure 5.5 is that
higher-status households unanimously strongly concentrated on a few
(usually three or four) PSUs, which as a whole could account for about
70% to 80% or more of their pottery; and that they consumed very little
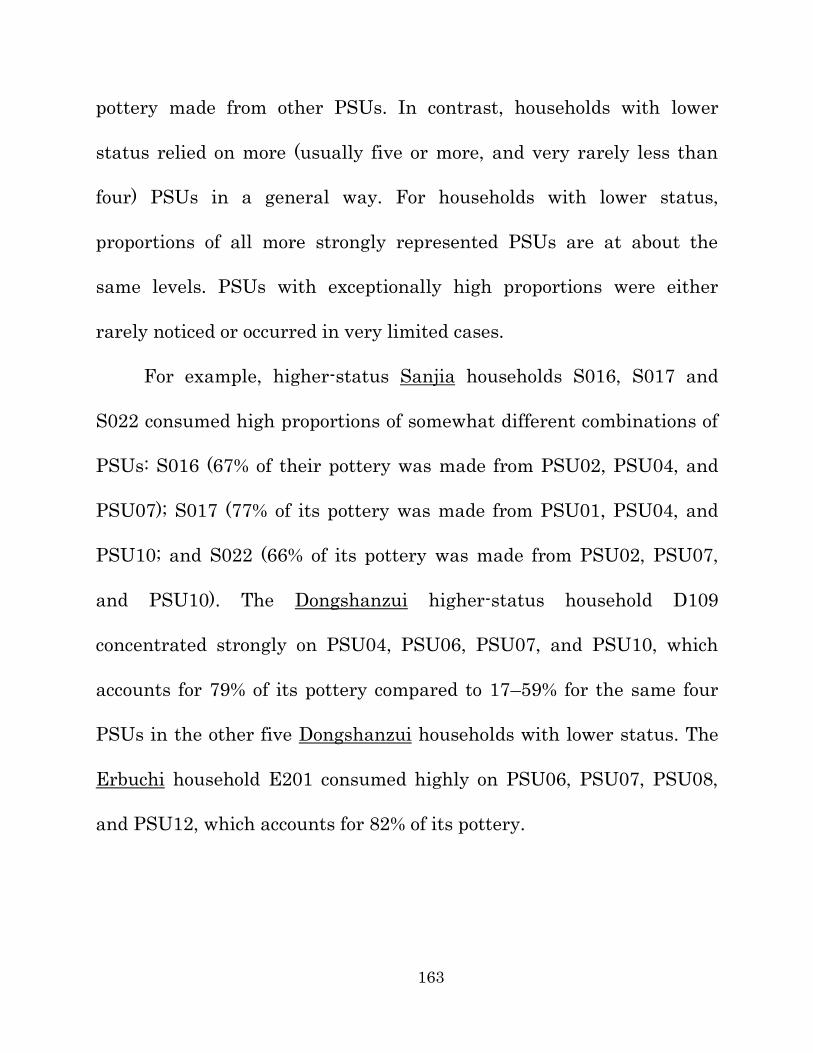
163
pottery made from other PSUs. In contrast, households with lower
status relied on more (usually five or more, and very rarely less than
four) PSUs in a general way. For households with lower status,
proportions of all more strongly represented PSUs are at about the
same levels. PSUs with exceptionally high proportions were either
rarely noticed or occurred in very limited cases.
For example, higher-status Sanjia households S016, S017 and
S022 consumed high proportions of somewhat different combinations of
PSUs: S016 (67% of their pottery was made from PSU02, PSU04, and
PSU07); S017 (77% of its pottery was made from PSU01, PSU04, and
PSU10; and S022 (66% of its pottery was made from PSU02, PSU07,
and PSU10). The Dongshanzui higher-status household D109
concentrated strongly on PSU04, PSU06, PSU07, and PSU10, which
accounts for 79% of its pottery compared to 17–59% for the same four
PSUs in the other five Dongshanzui households with lower status. The
Erbuchi household E201 consumed highly on PSU06, PSU07, PSU08,
and PSU12, which accounts for 82% of its pottery.
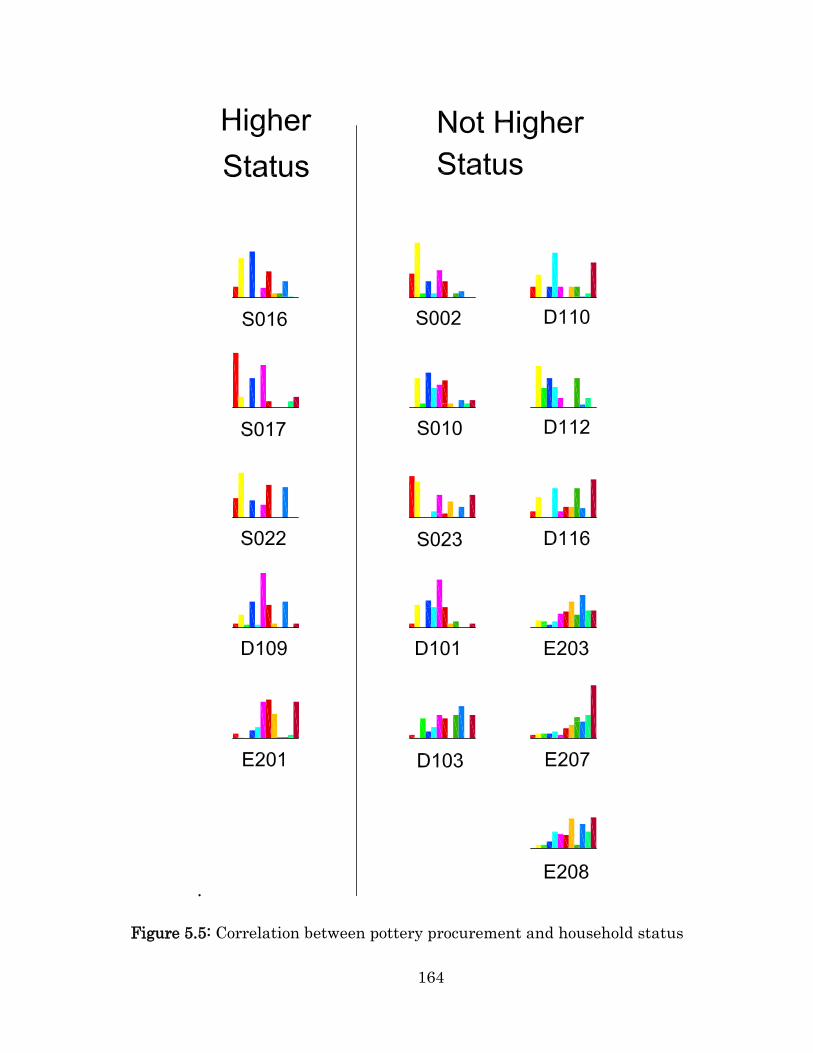
164
.
Figure 5.5: Correlation between pottery procurement and household status
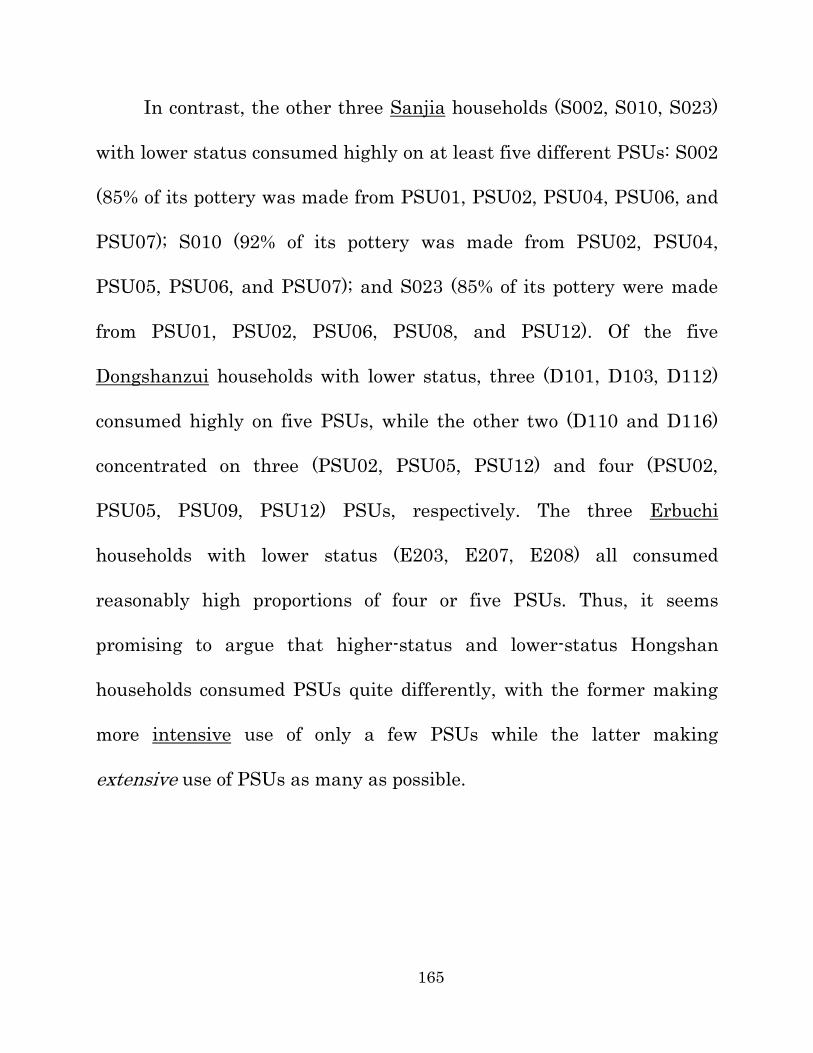
165
In contrast, the other three Sanjia households (S002, S010, S023)
with lower status consumed highly on at least five different PSUs: S002
(85% of its pottery was made from PSU01, PSU02, PSU04, PSU06, and
PSU07); S010 (92% of its pottery was made from PSU02, PSU04,
PSU05, PSU06, and PSU07); and S023 (85% of its pottery were made
from PSU01, PSU02, PSU06, PSU08, and PSU12). Of the five
Dongshanzui households with lower status, three (D101, D103, D112)
consumed highly on five PSUs, while the other two (D110 and D116)
concentrated on three (PSU02, PSU05, PSU12) and four (PSU02,
PSU05, PSU09, PSU12) PSUs, respectively. The three Erbuchi
households with lower status (E203, E207, E208) all consumed
reasonably high proportions of four or five PSUs. Thus, it seems
promising to argue that higher-status and lower-status Hongshan
households consumed PSUs quite differently, with the former making
more intensive use of only a few PSUs while the latter making
extensive use of PSUs as many as possible.
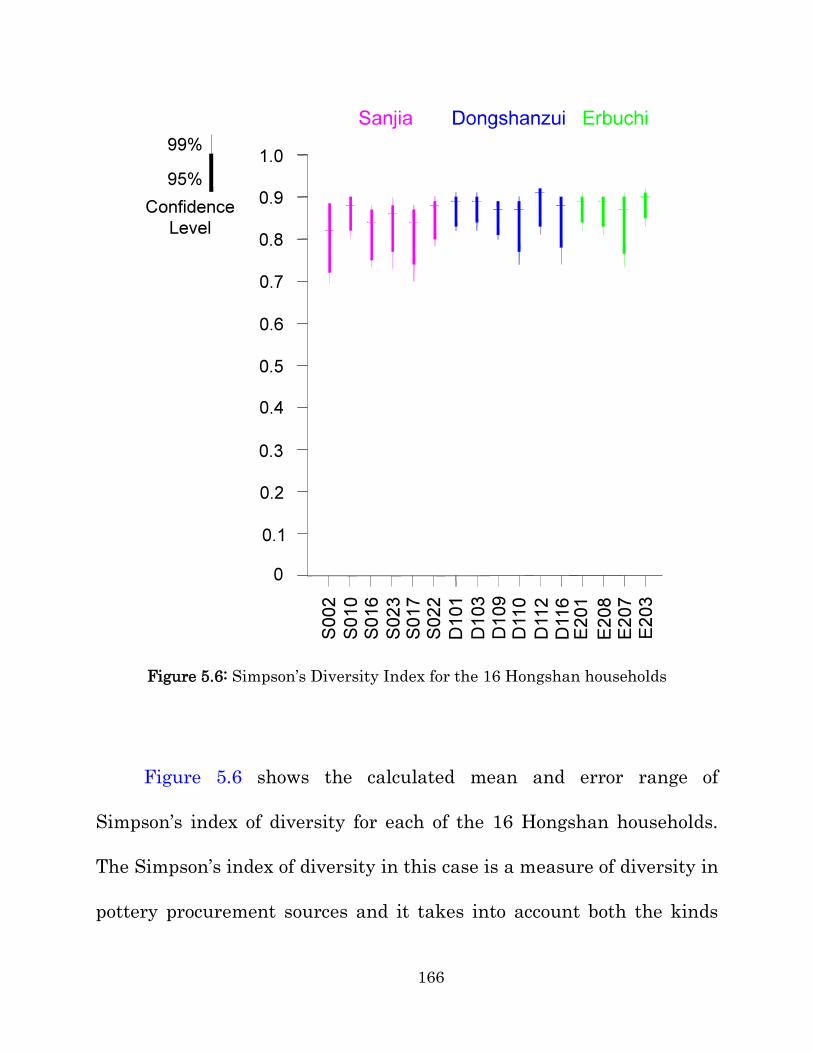
166
Figure 5.6: Simpson’s Diversity Index for the 16 Hongshan households
Figure 5.6 shows the calculated mean and error range of
Simpson’s index of diversity for each of the 16 Hongshan households.
The Simpson’s index of diversity in this case is a measure of diversity in
pottery procurement sources and it takes into account both the kinds
167
and relative abundance of PSUs noticed for each household. In general,
all households have a pretty high diversity (the D value lies between
0.82 and 0.91), which is simply a reflection of the fact that a good many
PSUs are represented at each of the 16 households. Given the small
sample size and large error ranges in Figure 5.6, differences between
households do not have much statistical significance. However, there
are some patterns worth mentioning. Most of the households that are
not higher status have diversity values either noticeably higher or lower
than values noticed for the higher status households, which could be an
indication for a relatively consistent degree of diversity in pottery
procurement for higher status households.
Further examination of Figure 5.5 reveals detail that is behind
this pattern. As discussed earlier, higher status households usually
have high proportions of three or sometimes four PSUs, which reflects a
pattern in which a consistent three or four PSUs were strongly favored
by these higher status households and contributed to 70-80% of the
household's pottery while other PSUs were represented only much more
weakly. It is not always the same three or four PSUs, but there is
always a strong representation of three or four PSUs in higher status
168
households. Often (although not always) those three or four strongly
represented PSUs occur in quite similar proportions; only in the case of
household D109 does a single PSU stand out as clearly the most
strongly represented. As for the households without indications of
higher status, on the other hand, they very often have a larger number
of relatively high proportions and/or a less clear separation between a
few high proportions and the rest that are lower. This usually produces
a higher PSU diversity index for lower status households, although
there are exceptions, such as household D110 with a pattern (and a
diversity index) very like that of higher status households, and
households S002 and E207 with a single strongly dominant PSU that
produces a lower diversity score.
Concluding remarks: The subtle but consistently patterned
distinction between higher and lower status households in regard to
pottery procurement could be a clue to different ways in which higher
and lower status households tend to participate in economic networks.
Higher status households, like lower status ones, seem to procure
pottery from many PSUs, but they consistently seem to have three or
four especially strong connections. This might reflect the higher status
169
households' successful balance between breadth and depth of social and
economic network ties to other households (in this case to pottery
producing households). A modest number of network links seem well
developed (and similarly well developed), and the distinction between
these and the weaker links to a larger number of PSUs is clearer for
higher status households.
5.8 Summary
Pottery production in Hongshan core zone of northeastern China seems
quite similar to that seen at early to middle Neolithic sites in other
parts of China. Pottery-making was organized in different areas and
probably carried out near residential places, using raw materials that
can be easily procured, to serve the needs of different local populations.
Pottery-making techniques were quite simple and did not involve much
highly specialized activities (such as very complicated shaping and
decorating work). Utilitarian vessels were made mainly to serve the
needs of everyday life and were far less variable in form; by contrast,
non-utilitarian vessels were clearly produced with more labor
investment and probably at some low level of specialization, even
170
though they were no different from utilitarian ones in terms of raw
materials sources. Such information altogether indicated an ordinary
Neolithic village economy for Hongshan core zone communities. The
same conclusion should also hold true for Hongshan societies in the
periphery.
On the other hand, although Hongshan households in each
residential zone showed a focus on more local sources of pottery, pottery
made from different producers was indeed widely distributed across a
wide landscape and shared between different neighborhoods, areas, and
political entities. This led us to believe that people from a few nearby
districts (a few km apart from each other, like the spatial distances
between the Sanjia, Dongshanzui, and Erbuchi areas) participated in
the same pottery distribution networks. Such interactions almost
certainly did not involve transferring pottery (utilitarian or non-
utilitarian) hundreds of km from one end of the Hongshan zone to the
other end (after all, no pottery of non-local origin was identified among
the 715 Hongshan sherds analyzed for this study). Pottery exchange
involving only a relatively small set of neighboring districts can,
nonetheless, create a chain of interaction that indirectly connects a
171
population across a large area like that of the Hongshan culture area
and facilitates the kind of cultural sharing of styles and other behaviors
that amount to an archaeological culture (the Hongshan culture).
The varying kinds and proportions of pottery consumed at the 16
Hongshan households disclosed even more interesting aspects of
economic ties, household variability, and status differentiation in this
part of the Hongshan core zone than was expected. In each area, few
households stood out against others for their higher status. These
households all seemed to have established a much stronger economic tie
with fewer pottery producers than their neighbors of commoner
households did. In broad terms, it seems not the ability to access as
many PSUs as possible that helped these households attain higher
status, but instead stronger ties with fewer PSUs. However, considering
that higher-status households did not have exclusive access to certain
pottery producers and that they did not rely primarily on just one or
two producers, control over production and distribution of pottery does
not seem to be indicated and could thus not have been a principal
strategy employed by Hongshan households to achieve higher status
and whatever degree of power over others they might have enjoyed.
172
APPENDIX. ELECTRONIC ACCESS TO DATASETS AND IMAGES
The geochemical and mineralogical datasets collected by this research are
available online in the University of Pittsburgh Comparative Archaeology
Database <www.cadb.pitt.edu>. The intent is that these two datasets can be
used for comparative purposes or further data exploratory analysis by
researchers who are interested in sourcing pottery geochemically or
mineralogically using the same analytical methods and instruments (the
Niton handheld x-ray fluorescence analyzer or the semi-quantitative powdery
x-ray diffraction analysis with the Rietveld method).
The two datasets are available as tabular data in .xls and comma-
delimited ASCII text, which document in detail the elements (or mineral
phases) and their concentrations (or percentages), as well as the
archaeological contexts for each corresponding sherd that generated the
geochemical (or mineralogical) composition. Results of some trial analyses
(hierarchical cluster analysis and multidimensional scaling analysis) on the
two datasets, produced by R programming language, are presented as PDF
files.
173
BIBLIOGRAPHY
CHEN Guoqing 陳國慶
2003 Qianxi Hongshan Wenhua Tongxingqi 淺析紅山文化筒形器
(Preliminary Discussion on Hongshan Bottomless Cylindrical
Jars). Beifang Wenwu 北方文物 (Northern Cultural Relics)
2003(4):9-14.
CHEN Guoqing 陳國慶, and ZHANG Quanchao 張全超
2008 Qianxi Liaoxi Diqu Shiqian Shidai De Taoyao 淺析遼西地區史前時
代的陶窯 (Preliminary Analysis of Prehistoric Pottery Kilns Found
in Western Liaoning). Neimenggu Wenwu Kaogu 內蒙古文物考古
(Inner Mongolian Cultural Relics and Archaeology) 2008(1):61-65.
CHEN Xingcan 陳星燦
1990 Hongshan Wenhua Caitao Tongxingqi Shi Taogu Tuikao 紅山文化
彩陶筒形器是陶鼓推考 (Was Hongshan Painted Pottery Cylinders
Used as Drums?). Beifang Wenwu 北方文物 (Northern Cultural
Relics) 1990(1):26-29.
Chifeng International Collaborative Archaeological Research Project
2011 Settlement Patterns in the Chifeng Region. Pittsburgh, PA: Center
for Comparative Archaeology, University of Pittsburgh.
174
Drennan, Robert D., LU Xueming 呂學明, and Christian E. Peterson
In press Niuheliang and Its Place in Hongshan Society. Antiquity.
Drennan, Robert D., and Christian E. Peterson
2006 Patterned Variation in Prehistoric Chiefdoms. Proceedings of the
National Academy of Sciences 103(11):3960-3967.
Fultz, Brent, and James M. Howe
2013 Transmission Electron Microscopy and Diffractometry of
Materials. Fourth ed. Heidelberg: Springer Berlin Heidelberg.
Goren, Yuval, Hans Mommsen, and Jörg Klinger
2011 Non-Destructive Provenance Study of Cuneiform Tablets Using
Portable X-Ray Fluorescence (pXRF). Journal of Archaeological
Science 38(3):684-696.
GUO Dashun 郭大順
1995 Hongshan and Related Cultures. In The Archaeology of Northeast
China: Beyond the Great Wall, Sarah M. Nelson (ed.), pp. 21-64.
London and New York: Routledge.
2007 Liaohe Liuyu Wenming Qiyuan Yanjiu De Huigu Yu Qianzhan 遼
河流域文明起源研究的回顧與前瞻 (Retrospection and Prospect of
Research on the Origin of Civilization in the Liao River valley).
Liaoning Shifan Daxue Xuebao 遼寧師範大學學報 (Journal of
Liaoning Normal University) 2007(1):113-116.
2008 Dongbei Wenhua Yu Hongshan Wenming 東北文化與紅山文明
(Ancient Cultures in Northeastern China and Hongshan
Civilization). Dongbei Shidi 東北史地 (Northeastern History and
Geography) 2008(5):50-56.
175
GUO Zhizhong 郭志忠
2009 Hongshan Wenhua Yanjiu Licheng De Huigu Yu Zhanwang 紅山文
化研究歷程的回顧與展望 (Review of History of Research on
Hongshan Culture and Prospect of Future Research). Neimenggu
Wenwu Kaogu 內蒙古文物考古 (Inner Mongolian Cultural Relics
and Archaeology) 2009(1):45-53.
Hall, Gwendy E.M.
2012 Evaluation of the Performance of Portable XRF in the Mineral
Exploration and Mining Industry. Geoanalysis 2012 (The 8th
International Conference on the Analysis of Geological and
Environmental Materials), Buzios, Rio de janeiro, Brazil.
HUANG Jiwu 黃繼武, and LI Zhou 李周 (eds.)
2012 Duojing Cailiao X Shexian Yanshe: Shiyan Yuanli, Fangfa, Yu
Yingyong 多晶材料 x 射線衍射:實驗原理、方法與應用 (X-Ray
Diffraction of Polycrystalline Materials: Principles, Techniques,
and Applications). Beijing 北京: Metallurgical Industry Press 冶金
工业出版社.
LI Baoping, ZHAO Jianxin, Kenneth D. Collerson, and Alan Greig
2003 Application of ICP-MS Trace Element Analysis in Study of Ancient
Chinese Ceramics. Chinese Science Bulletin 48(12):1219-1224.
LI Gongdu 李恭篤
1977 Liaoning Aohanqi Xiaoheyan Sanzhong Yuanshi Wenhua De
Faxian 遼寧敖漢旗小河沿三種原始文化的發現 (Remains of Primitive
Culture at Hsiao-Ho-Yen in Aohan Banner, Liaoning Province).
Wenwu 文物 (Cultural Relics) 1977(12):1-22.
176
LI Gongdu 李恭篤, and GAO Meixuan 高美璇
1987 Neimenggu Aohanqi Silengshan Hongshan Wenhua Yaozhi 內蒙古
敖漢旗四棱山紅山文化窯址 (Hongshan Pottery Kilns Excavated at
Silengshan in Aohan Banner, Inner Mongolia). Shiqian Yanjiu 史
前研究 (Prehistory) 1987(4):4-18.
Liaoning Province Institute of Archaeology and Cultural Relics 遼寧省文物考
古研究所, and School of History at Renmin University of China 中國人民大學
歷史學院
2015 2014 Nian Niuheliang Yizhi Xitongxing Quyu Kaogu Diaocha
Yanjiu 2014 年牛河梁遺址系統性區域考古調查研究. Huaxia Kaogu
華夏考古 (Huaxia Archaeology) 2015(3):3-8.
LU Xueming 呂學明, Christian E. Peterson, Robert D. Drennan, and ZHU Da
朱達
2010 Liaoning Dalinghe Shangyou Liuyu Kaogu Diaocha Jianbao 遼寧大
凌河上游流域考古調查簡報 (Preliminary Report on the
Archaeological Survey to the Upper Reach of Daling River,
Liaoning). Kaogu 考古 (Archaeology) 2010(5):24-35.
LU Xueming 呂學明, and ZHU Da 朱達
2008 Chongxian Nushen: Niuheliang Yizhi 重現女神: 牛河梁
(Rediscovery of the Goddess: Niuheliang Site). Tianjin 天津:
Tianjin Guji Chubanshe 天津古籍出版社.
Nelson, Sarah M.
2003 Introduction. In The Archaeology of Northeast China: Beyond the
Great Wall, Sarah M. Nelson (ed.), pp. 1-21. London and New
York: Routledge.
177
Orton, Clive, and Michael Hughes
2013 Pottery in Archaeology. New York: Cambridge University Press.
Peacock, David P. S.
1970 The Scientific Analysis of Ancient Ceramics: A Review. World
Archaeology 1(3):375-389.
PENG Bangben 彭邦本
1990 Niuheliang Yizhi Yu Wenming Qiyuan De Zhu Yinsu 牛河梁遺址與
文明起源的諸因素 (Niuheliang Archaeological Site and Driving
Forces for Early Civilizations). Chifeng Xueyuan Xuebao (Hanwen
Zhexue Shehui Kexueban) 赤峰學院學報(華文哲學社會科學版)
(Journal of Chifeng College, Philosophy and Social Science)
1990(3):11-18.
Peterson, Christian E.
2006 "Crafting" Hongshan Communities? Household Archaeology in the
Chifeng Region of Eastern Inner Mongolia, PRC. Ph.D.
Dissertation, Department of Anthropology, University of
Pittsburgh, Pittsburgh, PA.
Peterson, Christian E., and LU Xueming 呂學明
2013 Understanding Hongshan Period Social Dynamics. In A
Companion to Chinese Archaeology, Anne P. Underhill (ed.), pp.
55-80. Boston, MA: Wiley-Blackwell.
Peterson, Christian E., LU Xueming 呂學明, Robert D. Drennan, and ZHU Da
朱達
2010 Hongshan Chiefly Communities in Neolithic Northeastern China.
Proceedings of the National Academy of Sciences 107(13):5756-
5761.
178
2014 Hongshan Regional Organization in the Upper Daling River Valley
大凌河上游流域紅山文化區域性社會組織. Pittsburgh 匹茲堡;
Shenyang 瀋陽: University of Pittsburgh Center for Comparative
Archaeology 匹茲堡大學比較考古學中心; Liaoning Province
Institute of Archaeology and Cultural Relics 遼寧省文物考古研究所.
Rice, Prudence M.
1987 Pottery Analysis: A Source Book. Chicago, IL: University of
Chicago Press.
Steponaitis, Vincas P., M. James Blackman, and Hector Neff
1996 Large-Scale Patterns in the Chemical Composition of
Mississippian Pottery. American Antiquity 61(3):555-572.
SU Bingqi 蘇秉琦
1986 Liaoxi Diqu De Guwenhua, Gucheng, Guguo 遼西地區的古文化古城
古國 (Ancient Cultures, Ancient Cities, and Ancient States in
Western Liao Region). Wenwu 文物 (Cultural Relics) 1986(8):41-
44.
1988 Zhonghua Wenming De Xinshuguang 中華文明的新曙光 (New
Light on the Chinese Civilization). Dongnan Wenhua 東南文化
(Southeast Culture) 1988(5):1-7.
SUN Shoudao 孫守道, and GUO Dashun 郭大順
1984 Lun Liaohe Liuyu De Yuanshi Wenming Yu Longde Qiyuan 論遼河
流域的原始文明與龍的起源 (Primitive Civilization in the Liao River
Valley and the Origin of Dragon). Wenwu 文物 (Cultural Relics)
1984(6):11-20.
179
TENG Haijian 騰海建
2009 Hongshan Wenhua De Shengchan Jishu Zhuangkuang Ji
Shengchanli Shuiping Shulun 紅山文化的生產技術狀況及生產力水
平初論 (Review of Hongshan Culture Production Technology
Status and Productivity Levels). Chifeng Xueyuan Xuebao
(Hanwen Zhexue Shehui Kexueban) 赤峰學院學報(華文哲學社會科
學版) (Journal of Chifeng College, Philosophy and Social Science)
30(4):3-8.
Tite, Michael S.
1999 Pottery Produciton, Distribution and Consumption: The
Contribution of the Physical Sciences. Journal of Archaeological
Method and Theory 6(3):181-233.
2008 Ceramic Production, Provenance and Use: A Review.
Archaeometry 50(2):216-231.
Underhill, Anne P.
1996 Craft Production and Social Evolution During the Longshan Period
of Northern China. In Craft Specialization and Social Evolution: In
Memory of V. Gordon Childe, Bernard Wailes (ed.), pp. 133-150.
Philadelphia, PA: The University of Pennsylvania Museum of
Archaeology and Anthropology.
WANG Huide 王惠德
1989 Lun Hongshan Wenhua Daibiao De Zhongguo Gudai Wenming 論
紅山文化代表的中國古代文明 (Discussion on Hongshan Culture and
Ancient Chinese Civilizations). Chifeng Xueyuan Xuebao (Hanwen
Zhexue Shehui Kexueban) 赤峰學院學報(華文哲學社會科學版)
(Journal of Chifeng College, Philosophy and Social Science)
1989(2):48-55.
180
Waseda, Yoshio, Eiichiro Matsubara, and Kozo Shinoda
2011 X-Ray Diffraction Crystallography: Introduction, Examples, and
Solved Problems. Heidelberg: Springer-Verlag Berlin Heidelberg.
Will, Georg
2006 Powder Diffraction: The Rietveld Method and the Two Stage
Method to Determine and Refine Crystal Structures from Powder
Diffraction Data. Berlin Heidelberg: Springer-Verlag Berlin
Heidelberg.
WU Guangju 乌广聚
1991 Kaerqin Zuoyi Menguzu Zhizhixian Dimingzhi 喀喇沁左翼蒙古族自
治县地名志 (Toponymy Study of Harqin Left Wing Mongol
Autonomous County). Shenyang 沈阳: Liaoning Nationalities Press
辽宁民族出版社.
XU Zifeng 徐子峰
2004 Hongshan Wenhua Jingji Xingtai Chutan 紅山文化經濟形態初探
(Preliminary Discussion on Hongshan Economy). Chifeng Xueyuan
Xuebao (Hanwen Zhexue Shehui Kexueban) 赤峰學院學報(華文哲學
社會科學版) (Journal of Chifeng College, Philosophy and Social
Science) 25(2):5-6.
Young, R. A. (ed.)
1993 The Rietveld Method. Oxford: IUCr/Oxford University Press.
ZHU Yanping 朱延平
2007 Hongshan Wenhua Caitao Wenyang Tanyuan 紅山文化彩陶紋樣探
源 (Seeking the Roots of Designs on Painted Hongshan Pottery).
Bianjiang Kaogu Yanjiu 邊疆考古研究 (Research of China's
Frontier Archaeology) 2007(01):78-87.
181
Zurfluh, Florian J., Beda A. Hofmann, Edwin Gnos, and Urs Eggenberger
2011 Evaluation of the Utility of Handheld XRF in Meteoritics. X-ray
Spectrometry 40(6):449-463.