Embed Size (px)
Citation preview
United States Department of Agriculture
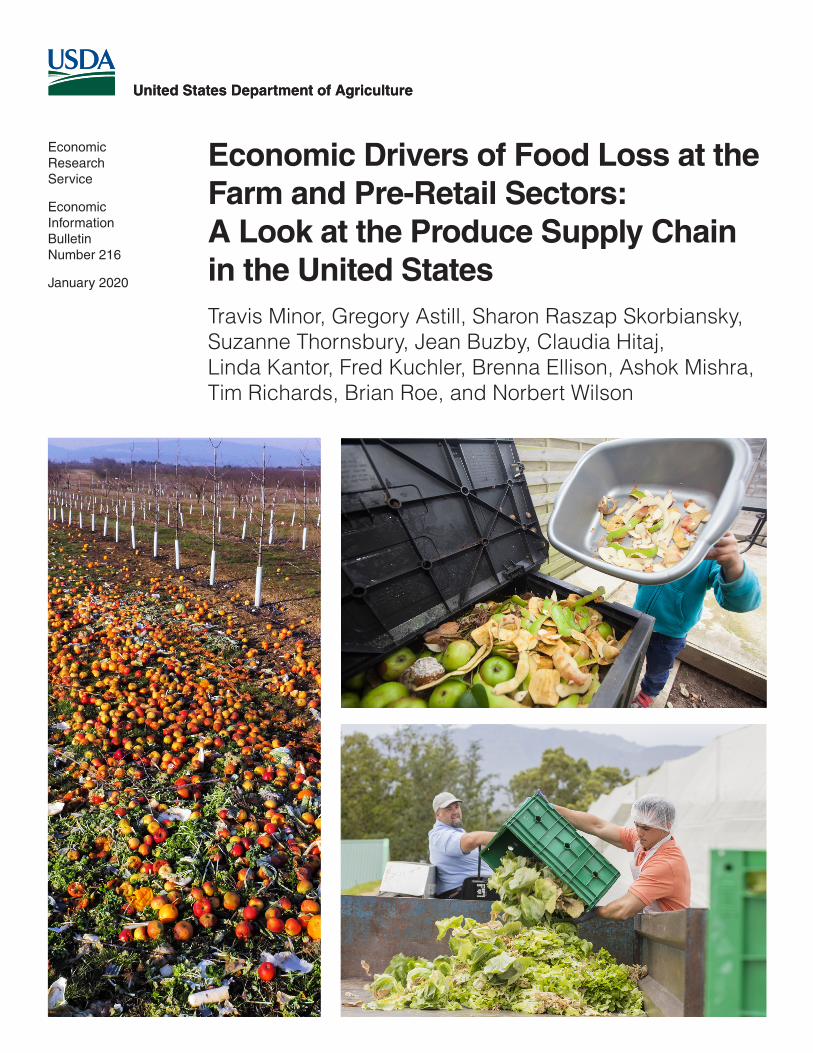
Economic Drivers of Food Loss at the Farm and Pre-Retail Sectors: A Look at the Produce Supply Chain in the United States
United States Department of Agriculture
Travis Minor, Gregory Astill, Sharon Raszap Skorbiansky, Suzanne Thornsbury, Jean Buzby, Claudia Hitaj, Linda Kantor, Fred Kuchler, Brenna Ellison, Ashok Mishra, Tim Richards, Brian Roe, and Norbert Wilson
Economic Research Service
Economic Information Bulletin Number 216
January 2020
Economic Research Service www.ers.usda.gov
United States Department of Agriculture
Recommended citation format for this publication:
Minor, Travis, Gregory Astill, Sharon Raszap Skorbiansky, Suzanne Thornsbury, Jean Buzby, Claudia Hitaj, Linda Kantor, Fred Kuchler, Brenna Ellison, Ashok Mishra, Tim Richards, Brian Roe, and Norbert Wilson, Economic Drivers of Food Loss at the Farm and Pre-Retail Sectors: A Look at the Produce Supply Chain in the United States, EIB-216, January 2020.
Cover images: Getty Images
Use of commercial and trade names does not imply approval or constitute endorsement by USDA.
To ensure the quality of its research reports and satisfy governmentwide standards, ERS requires that all research reports with substantively new material be reviewed by qualified technical research peers. This technical peer review process, coordinated by ERS' Peer Review Coordinating Council, allows experts who possess the technical background, perspective, and expertise to provide an objective and meaningful assessment of the output’s substantive content and clarity of communication during the publication’s review.
In accordance with Federal civil rights law and U.S. Department of Agriculture (USDA) civil rights regulations and policies, the USDA, its Agencies, offices, and employees, and institutions participating in or administering USDA programs are prohibited from discriminating based on race, color, national origin, religion, sex, gender identity (including gender expression), sexual orientation, disability, age, marital status, family/parental status, income derived from a public assistance program, political beliefs, or reprisal or retaliation for prior civil rights activity, in any program or activity conducted or funded by USDA (not all bases apply to all programs). Remedies and complaint filing deadlines vary by program or incident.
Persons with disabilities who require alternative means of communication for program information (e.g., Braille, large print, audiotape, American Sign Language, etc.) should contact the responsible Agency or USDA's TARGET Center at (202) 720-2600 (voice and TTY) or contact USDA through the Federal Relay Service at (800) 877-8339. Additionally, program information may be made available in languages other than English.
To file a program discrimination complaint, complete the USDA Program Discrimination Complaint Form, AD-3027, found online at How to File a Program Discrimination Complaint and at any USDA office or write a letter addressed to USDA and provide in the letter all of the information requested in the form. To request a copy of the complaint form, call (866) 632-9992. Submit your completed form or letter to USDA by: (1) mail: U.S. Department of Agriculture, Office of the Assistant Secretary for Civil Rights, 1400 Independence Avenue, SW, Washington, D.C. 20250-9410; (2) fax: (202) 690-7442; or (3) email: [email protected].
USDA is an equal opportunity provider, employer, and lender.
United States Department of Agriculture
Economic Research Service
Economic Information Bulletin Number 216
January 2020
AbstractThis report explores economic drivers of fresh-produce (i.e., fruits and vegetables) loss on the farm and in pre-retail sectors. Price volatility, labor costs and availability, supply chain constraints, retail and consumer quality standards, contract incentives, and existing policy are identified as factors influencing food loss on farms and in distribution channels. To be successful, efforts to mitigate food loss by recovering or recycling food must have viable markets and demonstrate their economic value to growers.
Keywords: food loss, food waste, fruit, vegetable, farm income, produce
Acknowledgments
The authors thank Anne Riddle, formerly of U.S. Department of Agriculture (USDA), Economic Research Service (ERS), for developing and maintaining cost-of-production data used in this report. The authors would like to thank the following individuals for technical peer reviews: Karina Gallardo, associate professor and extension specialist at Washington State University; Ellen Meyer, economist with the U.S. Environmental Protection Agency; Bradley Rickard, the Ruth and William Morgan associate professor in applied economics and management at Cornell University; Donald Hinman, agricultural economist with USDA’s Agricultural Marketing Service; and two anonymous reviewers. Thanks also to USDA, ERS staff members John Weber and Courtney Knauth for editing the report and Andres Guerrero for layout and design.
Travis Minor, Gregory Astill, Sharon Raszap Skorbiansky, SuzanneThornsbury, Jean Buzby, Claudia Hitaj, Linda Kantor, Fred Kuchler, Brenna Ellison, Ashok Mishra, Tim Richards, Brian Roe, and Norbert Wilson
Economic Drivers of Food Loss at the Farm and Pre-Retail Sectors: A Look at the Produce Supply Chain in the United States
ii Economic Drivers of Food Loss at the Farm and Pre-Retail Sectors: A Look at the Produce Supply Chain in the United States, EIB-216
USDA, Economic Research Service
Contents
Summary . . . . . . . . . . . . . . . . . . . . . . . . . . . . . . . . . . . . . . . . . . . . . . . . . . . . . . . . . . . . . . . . . . . . . iii
Introduction . . . . . . . . . . . . . . . . . . . . . . . . . . . . . . . . . . . . . . . . . . . . . . . . . . . . . . . . . . . . . . . . . . . .1
Food Loss Defined . . . . . . . . . . . . . . . . . . . . . . . . . . . . . . . . . . . . . . . . . . . . . . . . . . . . . . . . . . . . .2
Why Fruits and Vegetables? . . . . . . . . . . . . . . . . . . . . . . . . . . . . . . . . . . . . . . . . . . . . . . . . . . . . . .5
Drivers of Food Loss and Barriers to Recovery . . . . . . . . . . . . . . . . . . . . . . . . . . . . . . . . . . . . . . .6
Price Volatility . . . . . . . . . . . . . . . . . . . . . . . . . . . . . . . . . . . . . . . . . . . . . . . . . . . . . . . . . . . . . . . .6
Labor Costs and Availability . . . . . . . . . . . . . . . . . . . . . . . . . . . . . . . . . . . . . . . . . . . . . . . . . . . . 10
Supply Chain . . . . . . . . . . . . . . . . . . . . . . . . . . . . . . . . . . . . . . . . . . . . . . . . . . . . . . . . . . . . . . . .13
Standards and Consumer Expectations . . . . . . . . . . . . . . . . . . . . . . . . . . . . . . . . . . . . . . . . . . . . 14
Contracts . . . . . . . . . . . . . . . . . . . . . . . . . . . . . . . . . . . . . . . . . . . . . . . . . . . . . . . . . . . . . . . . . . . 16
Existing Policy and Unintended Consequences . . . . . . . . . . . . . . . . . . . . . . . . . . . . . . . . . . . . . . 17
Potential Solutions . . . . . . . . . . . . . . . . . . . . . . . . . . . . . . . . . . . . . . . . . . . . . . . . . . . . . . . . . . . . . .19
Gleaning and Food Donation . . . . . . . . . . . . . . . . . . . . . . . . . . . . . . . . . . . . . . . . . . . . . . . . . . . . 19
Food Recovery, Recycling, and Alternative Markets . . . . . . . . . . . . . . . . . . . . . . . . . . . . . . . . . .20
Government and Private Sector Investments To Reduce Food Loss . . . . . . . . . . . . . . . . . . . . . .23
Conclusions . . . . . . . . . . . . . . . . . . . . . . . . . . . . . . . . . . . . . . . . . . . . . . . . . . . . . . . . . . . . . . . . . . .26
References . . . . . . . . . . . . . . . . . . . . . . . . . . . . . . . . . . . . . . . . . . . . . . . . . . . . . . . . . . . . . . . . . . . .27
ERS is a primary source of economic research and
analysis from the U.S. Department of Agriculture, providing timely informa-
tion on economic and policy issues related to agriculture, food, the environment, and
rural America.
United States Department of Agriculture
A report summary from the Economic Research Service January 2020
Economic Drivers of Food Loss at the Farm and Pre-Retail Sectors: A Look at the Produce Supply Chain in the United States
Travis Minor, Gregory Astill, Sharon Raszap Skorbiansky, Suzanne Thornsbury, Jean Buzby, Claudia Hitaj, Linda Kantor, Fred Kuchler, Brenna Ellison, Ashok Mishra, Tim Richards, Brian Roe, and Norbert Wilson
www.ers.usda.gov
United States Department of
Economic Drivers of Food Loss at the Farm and Pre-Retail Sectors: A Look at the Produce Supply Chain in the United States
United States Department of
Travis Minor, Gregory Astill, Sharon Raszap Skorbiansky, Suzanne Thornsbury, Jean Buzby, Claudia Hitaj, Linda Kantor, Fred Kuchler, Brenna Ellison, Ashok Mishra, Tim Richards, Brian Roe, and Norbert Wilson
Economic Research Service
Economic Information Bulletin Number 216
January 2020
Summary
What Is the Issue?
The U.S. Department of Agriculture estimates the value of uneaten food at the retail and consumer levels at around $161.6 billion annually. While a considerable number of studies have examined this type of food loss, few have analyzed the economic factors that result in loss of food on farms and in distribution channels. This study provides an overview of the drivers of food loss on the farm and other pre-retail sectors with a focus on economic incentives that underlie the way fresh foods are grown, processed, and marketed in the United States. Food loss as it relates to fresh fruits and vegetables is of particular interest because these foods are highly perishable and important to diet quality.
What Did the Study Find?
The balancing of expected costs, revenues, and risks from the sale of produce by growers and distributors plays a substantial role in what is often described as “loss” at the pre-retail level in the produce supply chain. Examples of factors influencing food loss include:
• Price volatility—Prices of fresh produce are volatile. When prices fall below the cost it would take to get additional produce to market, growers may not advance produce through the supply chain because doing so becomes unprofitable. When prices rise, growers harvest more intensively (either by hiring more labor or by lowering product thresholds), and may have the incentive to send lower-cosmetic-quality product to market, which can then be subject to increased loss further down the supply chain.
• Labor costs and availability—Labor, particularly harvest labor, constitutes a relatively high share of the cost of growing and marketing fresh produce. Rising wages and labor availability often combine to increase the costs to harvest a field, leading growers to sometimes abandon the crop before harvest and make numerous other production and marketing decisions that directly impact levels of food loss.

• Supply-chain factors—Investments in infrastructure for produce commodities (e.g., vacuum cooling refrigerated-storage facilities) are large, with benefits often shared across multiple growers. Incurring these costs for crops that would otherwise be discarded and would command (at most) a lower price often is not profitable for a single grower.
• Standards and consumer expectations—Produce that does not meet aesthetic or other require-ments, at any stage in the supply chain, is likely to be rejected, either by buyers or by final consumers. Growers, shippers, and retailers make decisions about what and when to cull based on perceived consumer preferences; if any of these supply chain stages anticipate a buyer will not accept their produce, the produce will not be harvested or advanced through the supply chain.
• Contracts—Agreed-upon product quality (i.e., contracting) may reduce some of the vari-ability in returns to growers that would otherwise be inherent in produce markets. However, contracts can also contribute to food loss by acting as barriers to entry for growers who are not already included but might seek access for excess product.
• Policy constraints—Policy (at the State, local, or Federal levels) can play a role in supporting food-loss reduction, recovery, and recycling (e.g., tax incentives for donating food); however, some existing policies may unintentionally serve as barriers (e.g., restrictions on gleaning (collection of excess food for the purpose of donation), supply control through private-public marketing orders) or fail to address the underlying causes of loss. Quality standards such as private and public marketing orders may also impact food loss rates.
While estimates exist of the value of uneaten food at the retail and consumer levels, numerous factors (e.g., data availability, coordination across stakeholders) make it difficult to provide consis-tent, reliable, national estimates of food loss on the farm and at the pre-retail level. Accurately collecting data on national food loss at the farm and pre-retail sectors would constitute a significant investment that is beyond the scope of this study. Opportunities to reduce food losses and improve farm income have begun to emerge. This study’s findings suggest that successful efforts to mitigate food loss need to be accessible and profitable to growers to reduce losses in the pre-retail supply chain.
How Was the Study Conducted?
This study provides an economic framework for analyzing drivers of onfarm and pre-retail food loss. It collects and synthesizes information about fruit and vegetable food loss from the farm through the pre-retail supply chain gathered from relevant academic research, unstructured (nonsurvey) input from industry representatives, and growers themselves as well as case studies of specific commodities. Informal conversations with growers and other industry representatives are used to help frame the issue and provide insights about the definition, scope, and challenges surrounding issues of food loss in fresh produce. The study presents case studies of several key commodities (fresh field tomatoes, processing tomatoes, potatoes, strawberries, romaine lettuce, and fresh peaches) and summarizes the findings of a book on the topic titled “The Economics of Food Loss in the Produce Industry.”
www.ers.usda.gov

1 Economic Drivers of Food Loss at the Farm and Pre-Retail Sectors: A Look at the Produce Supply Chain in the United States, EIB-216
USDA, Economic Research Service
Economic Drivers of Food Loss at the Farm and Pre-Retail Sectors: A Look at the Produce Supply Chain in the United States
Introduction
Loss of agricultural production destined for food consumption (food loss) in the United States occurs at all levels of the supply chain from farmers to consumers. The U.S. Department of Agriculture’s (USDA) Economic Research Service (ERS) placed a value of uneaten food at the retail and consumer levels at around $161.6 billion in 2010 dollars annually in the United States alone (Buzby et al., 2014a). This represents losses of 31 percent of food produced in the United States: 133 billion pounds out of 430 billion pounds. The Food and Agriculture Organization of the United Nations (FAO) estimates that 1.3 billion metric tons (2,866 billion pounds) of food worldwide are produced and not consumed each year, representing approximately one-third of total food produc-tion by volume (FAO, 2011). At first glance, reducing or recovering lost food represents a potentially substantial opportunity to improve the efficiency of food production systems due to the implied waste of inputs in production, shipping, and storage.
While a considerable amount of the academic literature has been devoted to understanding how food loss occurs at the consumer and retail levels, relatively little is known about how much, or why, food loss occurs earlier in the supply chain. Most studies of food loss in the United States consider loss occurring at the retail level and consumer level (Buzby et al., 2016; Buzby et al., 2015; Buzby et al., 2009, Muth et al., 2011; Hoover, 2017), or end-use levels (e.g., food that reaches the consumer but is not consumed) of the supply chain (EPA, 2018). However, significant losses occur on farms and in distribution channels before food reaches retail outlets. Fruit and vegetables are especially prone to losses at these stages due to their perishability, importance of product appearance, and fluctuations in prices. Most studies of fruit and vegetable loss have focused on agronomic and technical issues, but much produce is “lost” because farmers and distributors view the produce as unprofitable or excessively risky to move forward. Measures designed to mitigate food loss must take into account these economic factors if they are to succeed.
This study investigates the economic drivers of fruit and vegetable loss on farms and in distribution channels of the supply chain using information gathered from peer-reviewed studies and conver-sations with experts, policymakers, industry representatives, and growers themselves. The initial investigation identifies commonalities among six produce commodities that are used to develop case studies. This study addresses some of the existing knowledge (and data) gaps by summarizing what is known about the economic drivers of food loss as it applies to onfarm fruit and vegetable produc-tion and losses in the pre-retail supply chain. By first examining economic drivers of food loss (price volatility, labor constraints, supply chain rigidities, standards and consumer preferences), the study then explores some potential opportunities for reduction of food loss and opportunities to improve grower income.
2 Economic Drivers of Food Loss at the Farm and Pre-Retail Sectors: A Look at the Produce Supply Chain in the United States, EIB-216
USDA, Economic Research Service
Food Loss Defined
Definitions of food loss vary widely by market sector and methodology (e.g., FAO, 2011; ReFED, 2016; Gunders, 2016; WWF, 2017; EPA, 2018). This study adapts one of the most inclusive defini-tions of food loss. ERS economists define food loss as “…the edible amount of food available for human consumption but is not consumed” (Buzby et al., 2014a). That definition, which originally focused on only retail and consumer losses, is applied to the onfarm and pre-retail losses explored in this report. That is, any edible part of food produced that may be intended for human consump-tion, but which is not consumed, may be considered food loss at any point in the supply chain. This definition includes food grown to maturity, but not harvested, and left in the field for any reason. Additionally, food harvested, but either eliminated or diverted from the supply chain, perhaps because of size, color, contamination, or shape concerns, is also food loss.
Defining “food waste” is another challenge. Because this study defines food loss broadly, food waste is herein considered a subset of loss, similar to the approach in Buzby et al. (2014a) and FAO (2019). Other studies define waste as an entirely different outcome dependent on where along the supply chain it occurs (EPA, 2018; WWF, 2018) or as separate from loss due to the underlying motiva-tions behind the lost product (Lipinski et al., 2013). This study focuses on the underlying issues and drivers of food loss, rather than distinguishing loss from waste. Therefore, it uses the singular term “food loss,” defined broadly to encompass both loss and waste.1 Equivalently, using the terminology “food loss and waste” would be functionally the same.
1 For a more detailed discussion of some of the definitions of food loss and waste, see box “Complicating Factors for Understanding Food Loss.”

3 Economic Drivers of Food Loss at the Farm and Pre-Retail Sectors: A Look at the Produce Supply Chain in the United States, EIB-216
USDA, Economic Research Service
Complicating Factors for Understanding Food Loss
Current understanding of food loss is hampered by a variety of factors (Hanson et al., 2016; Ellison et al., 2019; Minor et al., 2019). First, no singular definition of food loss exists, and because there is no agreed-upon terminology, there is also no universally agreed-upon way to measure losses.
Lack of Consensus
Table B.1 lays out the similarities and differences among some of the major food loss defini-tions, which largely come from whether inedible portions of food are included, whether waste is a subset of loss, and where waste or loss occurs along the supply chain, from production on the farm to the retail shelf.
Table B.1 Definitions of food loss and waste
Agency Food loss Food waste
Does loss include inedible food?
Is waste subset of
loss?
Where does waste begin in the supply
chain?
USDA, ERS (Buzby et al, 2014a)
The amount of edible food, post-harvest, that is available for human consumption but is not consumed for any reason.
NA1 No Yes NA
U.S. EPA (2018)
Unused product from the agricul-tural sector, such as unharvested crops.
Food such as plate waste, spoiled food, or peels and rinds considered inedible.
Yes No After the farm level
FAO (2019)
Refers to any food that is lost in the supply chain between the producer and the market.
Refers to the discarding or alter-native use of food that is safe and nutritious for human consumption.
No Yes After the producer
WWF (2017/18)
Average unhar-vested weight as a percent of total yield.
Any food that is not used for its intended purpose.
? No After the farm level
EU Fusions (2016)
N/A Food and ined-ible parts of food removed from the food supply chain.
Yes Yes NA
WRI (2016)
Food and/or asso-ciated inedible parts removed from the food supply chain.
NA Yes Yes NA
—continue

4 Economic Drivers of Food Loss at the Farm and Pre-Retail Sectors: A Look at the Produce Supply Chain in the United States, EIB-216
USDA, Economic Research Service
Table B.1 Definitions of food loss and waste—continued
Agency Food loss Food waste
Does loss include inedible food?
Is waste subset of
loss?
Where does waste begin in the supply
chain?
NRDC (2012)
NA All edible and ined-ible parts discarded or wasted.
Yes NA NA
ReFED (2016)
… unintended loss of food during harvesting, post-harvest handling, processing, and distribution.
Food grown and produced for human consumption but not eaten.
Yes Yes NA
Note: NA = not applicable. ReFED additionally defines “Onfarm loss” as “Food loss that occurs on farms and in packinghouses; distinguished from food waste in landfills because the majority of this loss is tilled into soils as nutrients.” 1ERS previously defined food waste as “Component of food loss and occurs when an edible item goes uncon-sumed…”; however, this definition is no longer in use (Buzby et al., 2014).
Sources: See column 1 in table.
Resources spent on competing definitions dividing loss from waste can lead to different assump-tions regarding the nature of food loss and can somewhat miss the point, as defining food loss by itself does not lead to a deeper understanding of the issue, its importance, or potential mitiga-tors. “Waste” is further viewed as a pejorative term and linked with finding fault or assigning blame for an outcome (Creamer and Johnson, 2018). The table shows that some agencies have begun to use this term exclusively. If this causes either producers or consumers to become more defensive about the issue of food loss, it may be more harmful in finding solutions than it is successful at highlighting the problem.
Measurement difficulties and lack of data
Measurement has the potential to clarify and focus efforts. Realizing the importance of compa-rability across studies, the Food Loss & Waste Protocol (FLWP) released a “Food Loss and Waste (FLW) Accounting and Reporting Standard” to help researchers globally create measure-ments that are consistent, transparent, and comparable across various dimensions (Hanson et al., 2016). The report simply defines FLW as a combination of what is lost (edible versus ined-ible) and its (unintended) destination. Destination is important because it reveals that diversion of food, even if it is not able to be quantified, can be ranked from highest to least priority, the origins of which can be traced back to EPA and USDA’s Food Recovery Hierarchy (EPA, 2017).
Large-scale, nationally representative surveys of food loss are relatively rare and extremely expensive. In lieu of this, many researchers rely on small-scale, indepth studies of food loss on a particular commodity or region (WWF, 2018). This type of analysis sheds light on the indi-vidual instances studied and may help to inform the larger conversation around food loss gener-ally. However, without some common denominator, it is nearly impossible to tell if the estimates from one study are comparable to those of another, are representative of a larger geographic area, or are representative of a longer timeframe.
5 Economic Drivers of Food Loss at the Farm and Pre-Retail Sectors: A Look at the Produce Supply Chain in the United States, EIB-216
USDA, Economic Research Service
Why Fruits and Vegetables?
This study analyzes loss in fruit and vegetable markets for two reasons. First, due to their extreme perishability and high levels of consumption, fruits and vegetables are a leading contributor to food loss nationwide (FAO, 2011; Lipinski et al., 2013). ERS estimates that fruits and vegetables (fresh and processed) account for approximately one-third of total U.S. food losses at the retail and consumer levels by weight (Buzby et al., 2014a).2 Because fruits and vegetables provide some of the more difficult challenges to overcome in their supply chain (i.e., high perishability, short shelf life, susceptibility to bruising), insights from this market could potentially be adapted to less perishable food products.3
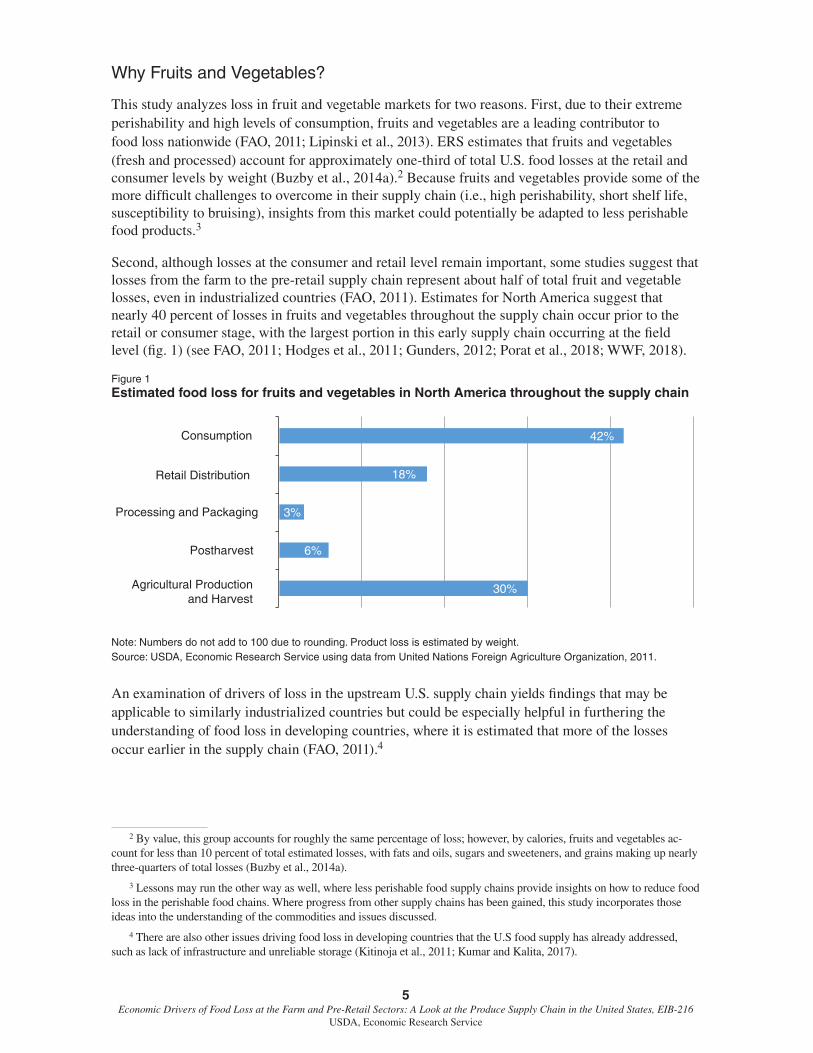
Second, although losses at the consumer and retail level remain important, some studies suggest that losses from the farm to the pre-retail supply chain represent about half of total fruit and vegetable losses, even in industrialized countries (FAO, 2011). Estimates for North America suggest that nearly 40 percent of losses in fruits and vegetables throughout the supply chain occur prior to the retail or consumer stage, with the largest portion in this early supply chain occurring at the field level (fig. 1) (see FAO, 2011; Hodges et al., 2011; Gunders, 2012; Porat et al., 2018; WWF, 2018).
Figure 1 Estimated food loss for fruits and vegetables in North America throughout the supply chain
30%
6%
3%
18%
42%
Postharvest
Agricultural Productionand Harvest
Processing and Packaging
Retail Distribution
Consumption
Note: Numbers do not add to 100 due to rounding. Product loss is estimated by weight. Source: USDA, Economic Research Service using data from United Nations Foreign Agriculture Organization, 2011.
An examination of drivers of loss in the upstream U.S. supply chain yields findings that may be applicable to similarly industrialized countries but could be especially helpful in furthering the understanding of food loss in developing countries, where it is estimated that more of the losses occur earlier in the supply chain (FAO, 2011).4
2 By value, this group accounts for roughly the same percentage of loss; however, by calories, fruits and vegetables ac-count for less than 10 percent of total estimated losses, with fats and oils, sugars and sweeteners, and grains making up nearly three-quarters of total losses (Buzby et al., 2014a).
3 Lessons may run the other way as well, where less perishable food supply chains provide insights on how to reduce food loss in the perishable food chains. Where progress from other supply chains has been gained, this study incorporates those ideas into the understanding of the commodities and issues discussed.
4 There are also other issues driving food loss in developing countries that the U.S food supply has already addressed, such as lack of infrastructure and unreliable storage (Kitinoja et al., 2011; Kumar and Kalita, 2017).
6 Economic Drivers of Food Loss at the Farm and Pre-Retail Sectors: A Look at the Produce Supply Chain in the United States, EIB-216
USDA, Economic Research Service
Drivers of Food Loss and Barriers to Recovery
Compared with efforts to measure food loss in the United States (e.g., FAO, 2011; Buzby et al., 2014a; Buzby et al., 2015; Stenmarck et al., 2016; WWF, 2017, FAO 2018), relatively less atten-tion has been given to identifying the causes of food loss, particularly at earlier stages of the supply chain (Canali et al., 2014; Gunders, 2017; WWF, 2018). If growers and processors maximize profit, one may assume that food loss occurs because eliminating loss is not economically sound under current market conditions.
Often, consumers conceive of the fresh-produce supply chain as seamlessly moving from “farm to fork.” The reality is much more complex. Supply chains are complicated, with products moving rapidly across the globe. Produce can be sold and resold, packed and repacked, before reaching the final consumer. In addition, supply chains evolve as technology changes. Moving highly perishable fresh produce from the farm to the consumer often involves the use of advanced technologies for vacuum cooling, packaging, refrigerated trucking and storage, and other infrastructure to maintain product quality and marketability (Minor et al., 2019b).5
Agricultural production of fruits and vegetables is inherently risky, as produce in the field and in orchards is exposed to multiple pressures from weather and pests/diseases. Yield and quality change by year and region, depending in part on factors outside of a grower’s control. The same planted area may exceed expected yield in one year under ideal conditions and produce a shortfall the next year under less than ideal conditions. This inherent variability may explain occasional food losses, as growers may overplant as part of a risk management strategy to combat uncertainty in the field (see box “Case Study Analysis” for a brief overview of the differences observed in the markets studies for this report; the commonalities between markets generated the drivers of food loss explored later in this study).
Price Volatility
A primary market factor driving food loss is the prevailing market price relative to costs. Produce markets are extremely volatile. Because fresh produce is inelastic in demand (changes in prices often do not drastically affect the consumer’s purchase choice), changes in the supply cause prices to fluctuate rapidly (Andreyeva et al., 2010; Weatherspoon et al., 2013). In most cases, U.S. produce markets are highly integrated with global partners (or competitors). Prices fluctuate daily and can often cause the value of edible product to drop below the marginal cost of production, which in turn means that production is simply not economically viable. Depending on where and when the price fluctuations occur, produce could be left in the field, discarded at a packing shed, or dumped from the back of a truck (De Gorter, 2014).
Prices vary not only from year to year but within a given growing season. Some price fluctuations are relatively predictable. For example, prices often increase later in the season as total production begins to decline, though exceptions occur. Others price fluctuations are more idiosyncratic, and thus harder to incorporate into expectations (see box “Weather, Disease, and Pests as Sources of Food Loss” for more discussion on the effects of weather, disease, and pests on price variability).
5 Some factors will matter more for certain commodities. For example, commodities such as apples or potatoes, which can be stored over a longer time period, will have less rigidity in their supply chain constraints. Therefore, while this study attempts to cover fruits and vegetables as a whole, some economic drivers will impact certain markets more than others. Simi-larly, some solutions for reducing food loss may work better in certain markets than in others.
7 Economic Drivers of Food Loss at the Farm and Pre-Retail Sectors: A Look at the Produce Supply Chain in the United States, EIB-216
USDA, Economic Research Service
Case Study Analysis
To gain a first-hand understanding of factors driving food loss at the farm level, this study examined the supply chain in a variety of produce industries. These case studies provide anec-dotal evidence on food loss. Commonalities amongst industries led to a discussion of drivers and potential solutions, but collected here are some of the more specific findings in each commodity market.
Field tomatoes—Mature green tomatoes are hand-harvested while ripe but still green and later undergo treatment to produce the familiar red color. The supply chain is complicated, and one firm can perform many roles (grower, packer, storage and gassing facility operators, re-packer, fresh-cut processor, or transporter), which facilitates coordination and reduces losses. Two key factors are reported as drivers of loss—the market and the natural environment. These factors are interrelated: environmental events can affect price, and market conditions impact the degree of damage from environmental factors that buyers will accept.
Processing tomatoes—Relative to the fresh produce industry, the processing industry is highly efficient. Processing tomatoes are machine-harvested ripe and delivered for immediate use at a processing plant; additionally, processing tomatoes do not face the strict aesthetic standards that contribute to losses in fresh markets. Because losses are relatively low and less frequent, it is difficult to find secondary markets for any leftover product, but this may not be necessary as the product is more storable than fresh commodities.
Potatoes—Potatoes are mechanically harvested, and food loss at this stage is minimal, with unwanted potatoes relegated to animal feed. Potatoes are rarely re-packed and tend to move directly from the packing shed to retail or foodservice distribution centers. Therefore, fresh potatoes tend to experience much less loss due to structural issues in the supply chain than other fresh commodities. Technological developments both from varietal development and production techniques have also resulted in higher yields.
Strawberries—This delicate fruit, which is available year round, is currently hand-picked and is susceptible to plant diseases, insect damage, and competition with weeds for nutrients, water, and light, as well as market fluctuations. The supply chain of strawberry production reveals multiple points where food loss can occur. After fruiting, growers make repeated decisions to harvest fields depending on maturation, quality, and price of fruit and labor availability. In addition, growers may decide to leave product in the field or mow over the field in response to changing market conditions.
Romaine lettuce—Because the heads of romaine are more open than lettuce varieties that produce a closed head, there is more outer leaf trim associated with harvesting of romaine lettuce, contributing to higher estimated levels of food loss. As growers produce more hearts and other value-added preparations of romaine lettuce to meet evolving consumer demands, more outer leaves are trimmed and left in the field. Currently, that trim is plowed under at the end of the growing season to enrich the soil for future plantings, as an effective means of collecting and/or redistributing product trim has not been identified.
Peaches—Thinning and pruning minimize the need to reject peaches at a later stage by increasing the size and quality of peaches produced. Pruning also affects harvest labor, since lower tree heights enable the peaches to be harvested from the ground or with very short ladders.

8 Economic Drivers of Food Loss at the Farm and Pre-Retail Sectors: A Look at the Produce Supply Chain in the United States, EIB-216
USDA, Economic Research Service
Weather, Disease, and Pests as Sources of Food Loss
Domestic pest and weather events affect produce prices, quality of the produce, and risk manage-ment needs throughout the supply chain, with unfavorable production situations limiting supply and increasing prices. The number one issue from the natural environment that farmers in the case studies described as impacting food loss was weather, specifically unpredictable weather. The main weather-based drivers in food loss described in the case studies include temperature (both too hot and too cold), precipitation and moisture (too much and too little), and excessive sun damage.
High temperatures may affect harvesting decisions, particularly given that California, Arizona, and Florida temperatures might exceed 100 degrees during harvest. Unseasonable temperatures can also influence how and when a plant matures. Growers also reported how temperature could cause too many commodities to ripen at the same time, making it difficult to harvest them (due to labor constraints) and generating a surplus for the market.
Food loss is also driven by too much or too little moisture, including periods of drought or excessive rain and damage from too much dew. Beyond weather, growers also reported pests and disease as environmental factors that drive loss. And while a significant investment has been made on multiple fronts to reduce pest and disease damage, these sources of loss still represent one of the most salient drivers of loss to a grower. As with market fluctuations, growers invest a great deal of effort in trying to mitigate food loss due to environmental impact, including tech-niques to carefully control soil nutrients and crop irrigation in arid settings. Even for veteran growers, however, managing environmental factors to reduce loss can feel like more of an art than a science (Baker et al., 2019).
In a recent example, in the early months of 2017, heavy rains in California delayed the harvest of numerous crops. Because of the heavy rainfall, lettuce fields and other fields in the vicinity flooded. This delayed the planting, harvest, and shipment of the crop in California, the leading U.S. producer of many fresh commodities. This delay created a shortage in the retail space for lettuce, which consumers are accustomed to purchasing year-round, and created a spike in both the wholesale and retail price of most lettuces (Parr et al., 2018). Growers across the country scrambled to harvest as much product as they possibly could. Labor that might not have been destined for lettuce harvesting was diverted to lettuce harvesting as growers attempted to fill the shortage and take advantage of the historically high prices. In spring 2017, it is unlikely that any marketable lettuces were left untouched around the country for those few months when California harvests were delayed (Astill and Minor, 2019).
Finally, moving production to controlled environments, such as greenhouses or vertical farming concepts, has the potential to reduce food waste by minimizing environmental exposure that can create cosmetic imperfections. These production systems also allow production schedules to synchronize to the timing of typical consumer demand patterns rather than to favorable weather patterns, which may also reduce waste through closer alignment of the timing of the demand and supply of perishable produce.
9 Economic Drivers of Food Loss at the Farm and Pre-Retail Sectors: A Look at the Produce Supply Chain in the United States, EIB-216
USDA, Economic Research Service
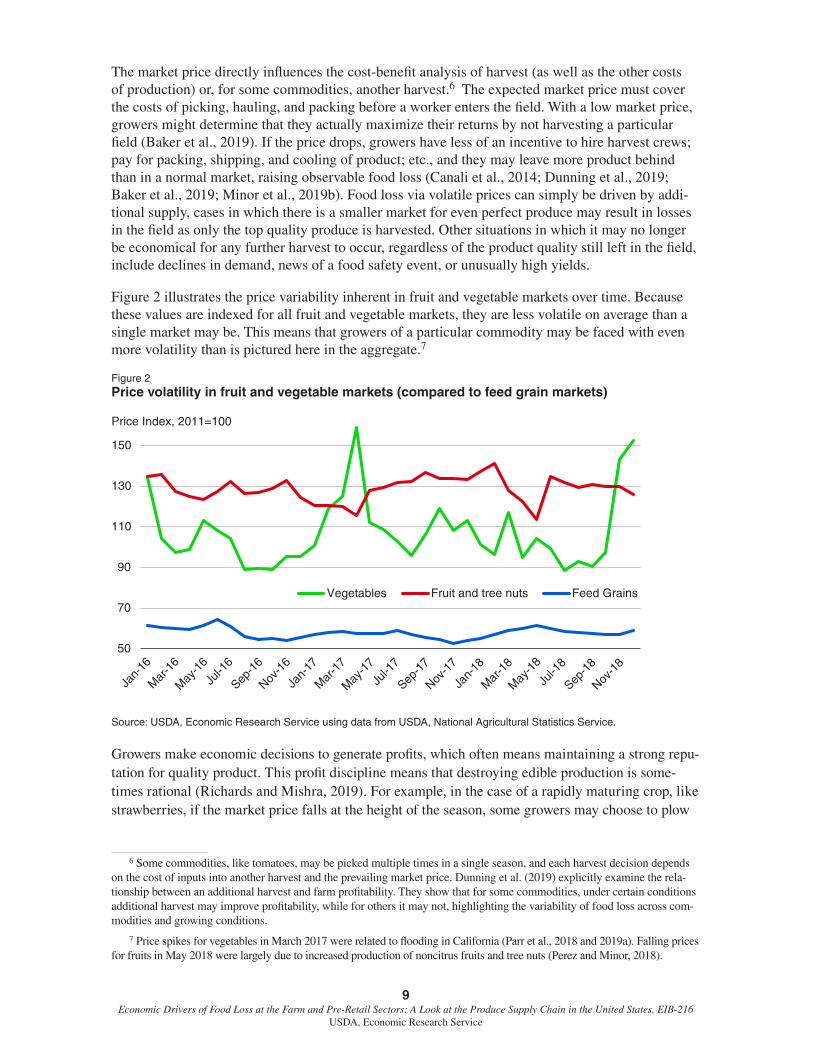
The market price directly influences the cost-benefit analysis of harvest (as well as the other costs of production) or, for some commodities, another harvest.6 The expected market price must cover the costs of picking, hauling, and packing before a worker enters the field. With a low market price, growers might determine that they actually maximize their returns by not harvesting a particular field (Baker et al., 2019). If the price drops, growers have less of an incentive to hire harvest crews; pay for packing, shipping, and cooling of product; etc., and they may leave more product behind than in a normal market, raising observable food loss (Canali et al., 2014; Dunning et al., 2019; Baker et al., 2019; Minor et al., 2019b). Food loss via volatile prices can simply be driven by addi-tional supply, cases in which there is a smaller market for even perfect produce may result in losses in the field as only the top quality produce is harvested. Other situations in which it may no longer be economical for any further harvest to occur, regardless of the product quality still left in the field, include declines in demand, news of a food safety event, or unusually high yields.
Figure 2 illustrates the price variability inherent in fruit and vegetable markets over time. Because these values are indexed for all fruit and vegetable markets, they are less volatile on average than a single market may be. This means that growers of a particular commodity may be faced with even more volatility than is pictured here in the aggregate.7
Figure 2 Price volatility in fruit and vegetable markets (compared to feed grain markets)
50
70
90
110
130
150
Price Index, 2011=100
Vegetables
Jan-
16
Mar
-16
May
-16
Jul-1
6
Sep-1
6
Nov-1
6
Jan-
17
Mar
-17
May
-17
Jul-1
7
Sep-1
7
Nov-1
7
Jan-
18
Mar
-18
Jul-1
8
Sep-1
8
May
-18
Nov-1
8
Fruit and tree nuts Feed Grains
Source: USDA, Economic Research Service using data from USDA, National Agricultural Statistics Service.
Growers make economic decisions to generate profits, which often means maintaining a strong repu-tation for quality product. This profit discipline means that destroying edible production is some-times rational (Richards and Mishra, 2019). For example, in the case of a rapidly maturing crop, like strawberries, if the market price falls at the height of the season, some growers may choose to plow
6 Some commodities, like tomatoes, may be picked multiple times in a single season, and each harvest decision depends on the cost of inputs into another harvest and the prevailing market price. Dunning et al. (2019) explicitly examine the rela-tionship between an additional harvest and farm profitability. They show that for some commodities, under certain conditions additional harvest may improve profitability, while for others it may not, highlighting the variability of food loss across com-modities and growing conditions.
7 Price spikes for vegetables in March 2017 were related to flooding in California (Parr et al., 2018 and 2019a). Falling prices for fruits in May 2018 were largely due to increased production of noncitrus fruits and tree nuts (Perez and Minor, 2018).
10 Economic Drivers of Food Loss at the Farm and Pre-Retail Sectors: A Look at the Produce Supply Chain in the United States, EIB-216
USDA, Economic Research Service
rather than harvest (Hsu-Flanders et al., 2019). While this could benefit individual producers, some edible produce will be lost.
Acceptance levels of quality standards are also flexible for crops that mature quickly, are highly perishable, and are subject to rapid price changes. That is, acceptable quality thresholds may be relaxed by private industry when fresh produce is in short supply and prices are higher.8 Often informally communicated to harvest crews in real time, higher prices due to a short crop may result in less product left in the field or culled during packing and sorting. High market prices may also stimulate additional harvest passes for crops, further decreasing usable product left unharvested.
Price shocks in fresh produce markets are often difficult or impossible to anticipate, particularly in cases where growers sell into national or global markets.9 Despite these challenges, growers attempt to predict market conditions when making planting decisions and then try to adjust to market volatility in real time. Ultimately, however, because market prices are typically beyond the control of any single producer, growing fresh produce remains a highly speculative and risky venture (Baker et al., 2019).
Labor Costs and Availability
Food loss literature also cites the input cost and availability of labor as a significant factor influ-encing produce losses (Baker et al., 2019; Astill and Minor, 2019; Hsu-Flanders et al., 2019; WWF, 2018). Labor demand can increase during the season depending on the types of other crops coming to maturity in an area. For example, tomatoes or peppers can be picked 6-8 times per season as fruit ripens to the optimal stage. However, harvesting fresh produce is costly and relies on the availability of manual labor. Growers calculate whether the incremental revenue from another harvest will cover the associated costs and may decide to leave some produce in the field when labor costs rise and/or anticipated harvest is relatively small.
Indeed, many fresh produce commodities are harvested exclusively by hand. For example, with leafy greens, the harvester makes a single cut just above the ground to release the head from the soil. The head is then trimmed of excess leaves with one or two more cuts and packed. This whole process is done very quickly; a matter of seconds from the first cut to being packed. Workers are highly trained to make sure the product meets buyer specifications, so it is both attractive and appealing to retail consumers. Workers are not explicitly trained to minimize product loss as a primary outcome. That is, the goal of harvesting is not to capture all of the edible product that could possibly survive transportation and storage because this is not what buyers and, ultimately, consumers are interested in purchasing (Astill and Minor, 2019).10
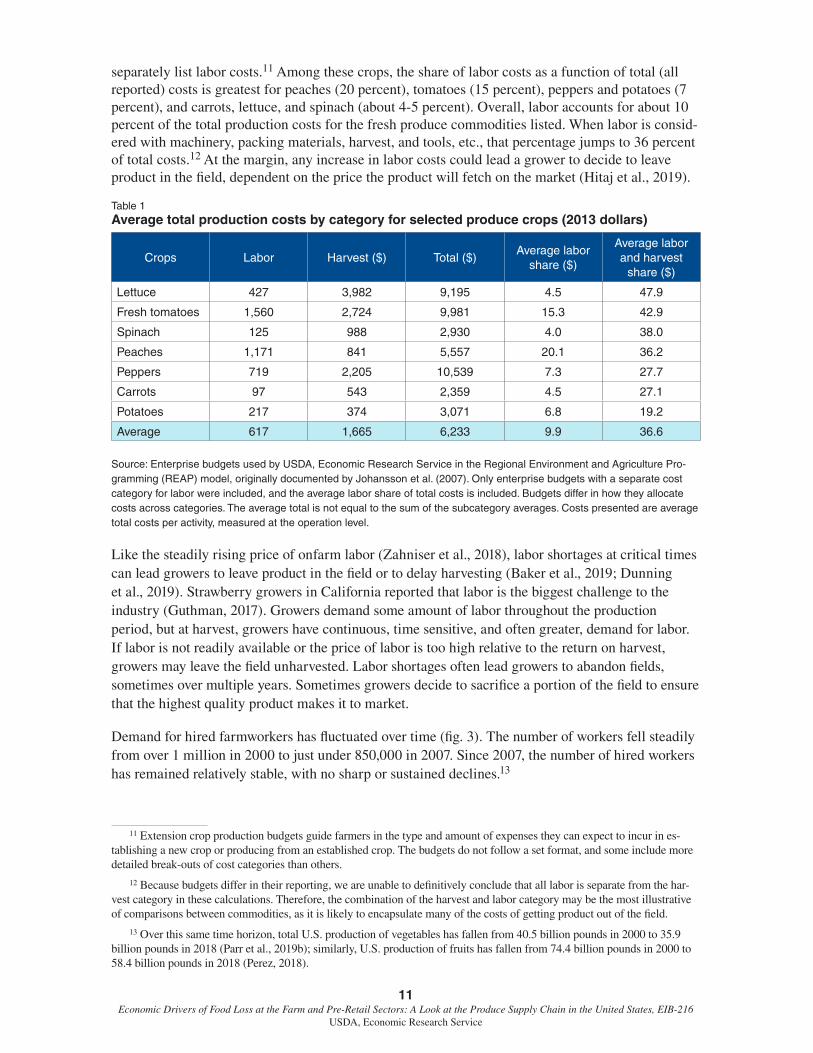
Rising labor costs shift the cost-benefit analysis of harvesting decisions, indirectly driving increases in food loss (Zahniser et al., 2018). For fresh produce, much of the additional cost of recovery is related to the harvesting itself, which leaves the growers vulnerable to fluctuating labor costs. Production costs vary depending on the type of crop, labor, and harvest activities. Table 1 summa-rizes average production costs by category for selected commodities with estimated budgets that
8 These thresholds relate to a variety of factors including shape, size, and look of the product (USDA, AMS, 2019a and 2019b). For example, a buyer may begin to accept U.S. grade No. 2s, rather than only grade No. 1s, in a time of tight supply. These are not food safety thresholds, and thus the shift in grade should not affect the food safety quality of the produce.
9 A grower selling locally may have a good idea of the other factors affecting price (neighboring production, weather, etc.), but these factors become much more difficult to predict and incorporate effectively on a national or global scale.
10 For more information, see the section on standards and consumer expectations.
11 Economic Drivers of Food Loss at the Farm and Pre-Retail Sectors: A Look at the Produce Supply Chain in the United States, EIB-216
USDA, Economic Research Service
separately list labor costs.11 Among these crops, the share of labor costs as a function of total (all reported) costs is greatest for peaches (20 percent), tomatoes (15 percent), peppers and potatoes (7 percent), and carrots, lettuce, and spinach (about 4-5 percent). Overall, labor accounts for about 10 percent of the total production costs for the fresh produce commodities listed. When labor is consid-ered with machinery, packing materials, harvest, and tools, etc., that percentage jumps to 36 percent of total costs.12 At the margin, any increase in labor costs could lead a grower to decide to leave product in the field, dependent on the price the product will fetch on the market (Hitaj et al., 2019).
Table 1 Average total production costs by category for selected produce crops (2013 dollars)
Crops Labor Harvest ($) Total ($)Average labor
share ($)
Average labor and harvest
share ($)
Lettuce 427 3,982 9,195 4.5 47.9
Fresh tomatoes 1,560 2,724 9,981 15.3 42.9
Spinach 125 988 2,930 4.0 38.0
Peaches 1,171 841 5,557 20.1 36.2
Peppers 719 2,205 10,539 7.3 27.7
Carrots 97 543 2,359 4.5 27.1
Potatoes 217 374 3,071 6.8 19.2
Average 617 1,665 6,233 9.9 36.6
Source: Enterprise budgets used by USDA, Economic Research Service in the Regional Environment and Agriculture Pro-gramming (REAP) model, originally documented by Johansson et al. (2007). Only enterprise budgets with a separate cost category for labor were included, and the average labor share of total costs is included. Budgets differ in how they allocate costs across categories. The average total is not equal to the sum of the subcategory averages. Costs presented are average total costs per activity, measured at the operation level.
Like the steadily rising price of onfarm labor (Zahniser et al., 2018), labor shortages at critical times can lead growers to leave product in the field or to delay harvesting (Baker et al., 2019; Dunning et al., 2019). Strawberry growers in California reported that labor is the biggest challenge to the industry (Guthman, 2017). Growers demand some amount of labor throughout the production period, but at harvest, growers have continuous, time sensitive, and often greater, demand for labor. If labor is not readily available or the price of labor is too high relative to the return on harvest, growers may leave the field unharvested. Labor shortages often lead growers to abandon fields, sometimes over multiple years. Sometimes growers decide to sacrifice a portion of the field to ensure that the highest quality product makes it to market.
Demand for hired farmworkers has fluctuated over time (fig. 3). The number of workers fell steadily from over 1 million in 2000 to just under 850,000 in 2007. Since 2007, the number of hired workers has remained relatively stable, with no sharp or sustained declines.13
11 Extension crop production budgets guide farmers in the type and amount of expenses they can expect to incur in es-tablishing a new crop or producing from an established crop. The budgets do not follow a set format, and some include more detailed break-outs of cost categories than others.
12 Because budgets differ in their reporting, we are unable to definitively conclude that all labor is separate from the har-vest category in these calculations. Therefore, the combination of the harvest and labor category may be the most illustrative of comparisons between commodities, as it is likely to encapsulate many of the costs of getting product out of the field.
13 Over this same time horizon, total U.S. production of vegetables has fallen from 40.5 billion pounds in 2000 to 35.9 billion pounds in 2018 (Parr et al., 2019b); similarly, U.S. production of fruits has fallen from 74.4 billion pounds in 2000 to 58.4 billion pounds in 2018 (Perez, 2018).

12 Economic Drivers of Food Loss at the Farm and Pre-Retail Sectors: A Look at the Produce Supply Chain in the United States, EIB-216
USDA, Economic Research Service
Figure 3 U.S. hired farmworkers for all crops
700,000
20002001
20022003
20042005
20062007
20082009
20102011
20122013
20142015
20162017
2018
750,000
800,000
850,000
900,000
950,000
1,000,000
1,050,000
1,100,000
Number of hired farmworkers
Source: USDA, Economic Research Service using data from USDA, National Agricultural Statistics Service (NASS). Numbers presented are from annual July estimates of the number of workers. Because farm work is highly seasonal, NASS presents estimates four times throughout the year. All estimates show a similar decline over time; we chose to illustrate the July num-bers as they may best capture the beginning of the harvest season for some produce.
To combat the loss in more traditional (migrant) labor sources, many growers have turned to alterna-tive programs and recruitment strategies (Zahniser et al., 2018). For example, growers are increas-ingly reliant on obtaining guest workers through the H-2A visa program or through farm labor contractors (FLCs). Since 2010, the number of H-2A approved workers and applications across all agricultural industries (not only fresh produce) has grown by 276 percent (fig. 4).
Figure 4 H-2A workers and applications in U.S. agriculture
0
1,000
2,000
3,000
4,000
5,000
6,000
7,000
8,000
9,000
10,000
0
50,000
100,000
150,000
200,000
2010 2011 2012 2013 2014 2015 2016 2017
Number of H-2A applications
Workers
Number of H-2A workers
Applications
Source: USDA, Economic Research Service using data from U.S. Department of Labor, Office of Foreign Labor Certification.

13 Economic Drivers of Food Loss at the Farm and Pre-Retail Sectors: A Look at the Produce Supply Chain in the United States, EIB-216
USDA, Economic Research Service
Harvesting produce, including minimizing damage and recognizing quality differences, requires skill and experience. In addition to the challenges posed by labor scarcity, the class of qualified laborers is “aging out” at a faster pace than the influx of new, and younger, laborers. Demographic shifts such as lower birth rates in Mexico, a major source of U.S. farm labor, is curtailing the supply of laborers (Taylor et al., 2012; Charlton and Taylor, 2013; Fan et al. 2015; Zahniser et al., 2018). Further, improved economic conditions and education in Mexico and the rising cost of housing in primary growing regions have hampered the supply of laborers.
The labor compensation method (piece-rate versus hourly wage) may also affect harvest losses (Hill, 2019; Stevens, 2019). As piece-rate compensation increases with the total amount harvested, workers may rush and harvest all sizes and grades and fail to remove stems or stalks that could puncture other produce.14 Alternatively, hourly wage compensation provides less incentive for the quantity harvested and may induce workers to pick more carefully. This is often beneficial for plant health and for harvesting produce that makes both size and grade standards, potentially reducing discard rates at the packinghouse while increasing the amount of product left behind in the field (Baker et al., 2019).
Supply Chain
While market fluctuation in the sales price and the price of inputs are often first cited as drivers of food loss, market infrastructure and supply chain rigidities are also contributing factors. However, much of the food loss discussion in the United States ignores the early stages of the fresh food supply chain, from the farm through transportation and processing (Kitinoja et al., 2018). This is partly because some early research suggested that losses are relatively small near the farm stage in developed countries (FAO, 2011) and because losses at these early stages may be less visible to the public than post-consumer waste.15
After harvest, the shipping and packing process can play a pivotal role in produce being left behind or culled from the marketplace. Because of the extreme perishability and sensitive nature of many produce crops, the fresh produce industry has invested heavily in streamlining the supply chain to minimize post-harvest loss. Many commodities are packed fresh from the field and immediately go into vacuum cooling or other controlled-environment storage within hours (Astill and Minor, 2019). Some commodities are not field packed but are instead packed in large open-air bins suitable for transport in trucks. Retailers examine produce upon delivery and cull damaged items. Growers and shippers receive frequent feedback and quality assessment from the receiving dock, much of which is passed on by quality supervisors in the form of daily, weekly, and monthly reports. Thus, throughout the supply chain, growers and buyers make frequent decisions about practices that might lower the chance of loss. This is a process of continuous quality improvement.
Throughout the shipping process, maintaining appropriate temperature, carbon dioxide levels, and humidity is important to preserving quality. Loss of quality through mold growth, bruising, or other causes of deterioration can occur during shipping. In these conditions, produce at the bottom of a container can be damaged by the weight of the produce packed on top of it. Picking under-ripe produce helps avoid some of the damage incurred during shipping. In order to harvest the more-ripe produce left behind, this shipping process would have to be adjusted, which would likely mean a substantial investment in infrastructure (Baker et al., 2019). As the container environment is contin-uously monitored, the problem of quality loss during transportation can be largely attributed to
14 That is, a piece rate may initially result in more produce taken out of the field but may lead to greater losses further down the supply chain as damaged produce deteriorates more quickly, possibly affecting other produce packed nearby.
15 Onfarm losses are often plowed under to enhance soil fertility, making them less visible than food rotting in a landfill.

14 Economic Drivers of Food Loss at the Farm and Pre-Retail Sectors: A Look at the Produce Supply Chain in the United States, EIB-216
USDA, Economic Research Service
poorly selected product. Because the risk of lost product more often falls back to the grower and not the shipper, growers are careful to select produce that is well suited for the typically long-haul ship-ments to a final consumer (Hsu-Flanders et al., 2019).
Nevertheless, some loss persists. The cold chain is critical to maintaining quality from the point of harvest to the final consumer.16 Disruptions in the cold chain (e.g., power failure, faulty equipment) lead to rapid deterioration of quality and food loss. Many larger growers in major production areas have cooling units that cool the product quickly.17 Any delay in entering the cold chain quickly reduces marketability; consequently, cooling units must be located near central growing regions, if not directly on the farm (Hsu-Flanders et al., 2019).
Due to the high level of investment in infrastructure for a specific commodity market, switching produce to a different outlet is not typically a straightforward process. Some products not sold into the fresh market, such as blueberries and apples, may be easily moved to alternate (albeit typi-cally less valuable) processing markets. Other products, such as fresh tomatoes, do not have these options as standards and varieties vary substantially by intended use (e.g., fresh versus processed end products). Infrastructure investments for produce commodities are substantial, and undertaking these costs for currently lost food, which would command a lower price in alternative markets, often simply does not make economic sense for a single grower.
Standards and Consumer Expectations
Retail specifications, along with grading standards, explicitly state requirements for a product’s appearance and other characteristics. Buyers have quality standards for specific reasons, such as food safety considerations or consumer preferences, and will reject a deficient load, resulting in lost profits and loss of reputation (Calvin et al., 2001). The most visible standards related to fresh produce are voluntary standards set by USDA’s Agricultural Marketing Service (AMS) in conjunc-tion with the affected industry. According to AMS, “U.S. Grade Standards for vegetables are voluntary and provide the fruit, vegetable, and specialty crop industry with a uniform language for describing the quality and condition of commodities in the marketplace” (USDA, AMS, 2019a) and help provide some stability and solve marketing problems that growers cannot solve indi-vidually (USDA, AMS, 2019a and 2019b).18 AMS also supports marketing orders, which “are industry-driven programs that help fruit, vegetable, and specialty crop producers and handlers achieve marketing success" (USDA, AMS, 2019c), by providing oversight authority on more than 20 individual specialty crop (SC) markets. In addition to setting “mandatory minimum standards on products shipped in order to prevent inferior quality product from depressing the market for the whole crop,” marketing orders also “assure customer satisfaction, and drive increasing consumer repurchase" (USDA, AMS, 2017). These sets of standards are meant to provide a common language for producers and buyers to communicate about quality and promote efficiency in marketing and procurement.19
16 “Cold chain” refers to multiple steps in the harvest and transportation of fresh produce where temperature and other environmental factors are under control to prolong product shelf life. Typically, once a product enters the cold chain, tempera-ture and other environmental factors are maintained as the product changes hands.
17 For smaller growers, cooling may take place through affiliated packing sheds rather than onfarm. For many fresh pro-duce items, cooling is necessary, not optional, regardless of farm size.
18 The standards discussed here are outside of those Federal (Astill et al., 2018 and Astill et al., 2019) and buyer-driven (Minor et al., 2019a) food safety requirements, which are discussed more thoroughly in the section “Existing Policy and Unintended Consequences.”
19 Private standards may also exist in these markets, often specific to an individual commodity market (which could be a commodity, region, or a buyer-seller relationship). Private agreements go beyond what is provided by the public standards and may require a higher quality threshold or certification of other practices (e.g., environmental, human rights) not overseen by USDA.

15 Economic Drivers of Food Loss at the Farm and Pre-Retail Sectors: A Look at the Produce Supply Chain in the United States, EIB-216
USDA, Economic Research Service
Moving produce through the supply chain includes inspectors, requested by financially interested parties (often marketing orders or other industry representatives), who maintain grades and stan-dards in the industry. Through random and representative sampling, inspectors evaluate the product based on various factors including maturity, appearance, color, shape, size and the presentation of the packaging (USDA, AMS, 2019a and 2019b). Inspectors assess the condition of the product, looking for defects, such as signs of bruises, leaking fruit, mold, decay, or other signs of deteriora-tion. This process generates a score that inspectors use in assigning a grade and determining if spec-ifications have been met. The inspector never makes decisions regarding disposition of the product, but the inspection certificate helps industry members determine value, which can guide disposition decisions. Companies make decisions about quality based on these standards and market conditions, deciding to advance or cull produce accordingly (Hsu-Flanders et al., 2019).
Grades and standards may help to mitigate costs incurred from unsaleable product by stopping the unsaleable product as early in the supply chain as possible. Cosmetic imperfections visible in the field may worsen over time, resulting in unsaleable product after transportation through the supply chain. Mildly decayed or moldy produce, while technically edible, could contaminate nearby product that meets standards, rendering it ultimately unsaleable as well and exacerbating loss. In such cases, moving unsaleable food forward incurs additional labor, transportation, and storage costs, which reduces profit relative to simply abandoning the product in the field, or repurposing it for some other more efficient use (e.g., compost).
While the stated goals of these standards often do not directly address food loss, many of the goals, such as opening products to the largest number of potential markets, may have spillover effects in curbing some loss. More recently, market opportunities provided by Fruit Vegetables and Specialty Crop (FVSC) marketing orders have expanded to include actions on food loss. The Florida Citrus and Idaho-Eastern Oregon Marketing Orders provide specific processing outlets for product that does not meet fresh grade standards. (USDA, AMS, 2019c).
Conversely, grades and standards and consumer preferences prevent some edible product from moving forward in the supply chain because it is deemed unmarketable. For instance, if consumers are unwilling to purchase “ugly fruit” (e.g., an apple with russeting on the skin), retailers are unlikely to accept fruit below a cosmetic threshold that includes the undesirable attribute. The actual quality of fresh produce grown on the farm is uncertain and will fluctuate with many factors outside a grower’s control (e.g., weather, disease, and pests). Fresh produce that does not meet aesthetic or other requirements is likely to result in food loss regardless of whether the produce is grown under contract for a restaurant or for sale in a local farmers’ market.
Rigid consumer preferences, or at least rigid retailer interpretations of consumer preferences, trans-lated to quality thresholds are cited as a driver of in-field loss for produce (Baker et al., 2019). If growers anticipate customers will not buy produce below a certain standard, the produce will not be harvested. Retailers and consumers are accustomed to uniform, relatively perfect fruits and vege-tables. This typically results in cosmetically deformed or misshapen produce and any that are too large or too small being left in the field, despite the fact that they may be nutritionally equivalent to the more uniform fruit and vegetables. This leaves edible food behind that would be satisfactory for consumers who may not require perfect uniformity of produce (Baker et al., 2019).
16 Economic Drivers of Food Loss at the Farm and Pre-Retail Sectors: A Look at the Produce Supply Chain in the United States, EIB-216
USDA, Economic Research Service
Contracts
To limit uncertainty associated with produce quality standards and pricing, some markets have incorporated formal contracting into their buying procedure. Growers and buyers of agricultural goods (such as processors or handlers) use agricultural contracts to reduce risk and secure marketing channels for sales of goods outside of traditional spot markets. Produce contracts will most often specify the volume, sales price, and physical quality of the product to be delivered. In this way, contracts help solve the issue of coordination: growers would like to sell all of their output, while buyers would like to purchase the quantity they need. As agricultural contracts continue to increase over time, they may increasingly influence food loss in different market contexts.20
Loss rates may differ when buyers and sellers trade produce via contracts. Growers with fixed price contracts or an agreed-upon volume will harvest regardless of the market price since they have a guaranteed contract price and do not have the ability to leave produce in the field if they believe the agreed price was not favorable, ex post. Contracts reduce market-price volatility, compared to spot markets. Marketing contracts can help reduce food loss by coordinating the terms of trade for buyers and sellers. More frequent monitoring reduces the likelihood of food loss due to quality uncertainty. Third-party graders reduce risk within the contract, which reduces the likelihood of food loss due to conflicts over the delivered quality of produce (Skorbiansky and Ellison, 2019). A well written contract includes explicit expectations and standards. Often, contracts may reduce some of thevara-bility inherent in produce markets, but they would need to be written with food loss in mind to reduce unintended consequences.21
Growers and processors may be risk averse, preferring a surplus to a shortage, when they must deliver or have the opportunity to sell a pre-determined volume (Kahneman et al., 1991, De Gorter, 2014). Some contracts severely penalize shortages, whereas a surplus may also be bought by the customer (possibly at a lower price) or sold into secondary channels. Keeping additional product on hand can be a grower’s optimal strategy for risk management.
There are a few other situations where contract use could exacerbate food loss. Depending on the value and fragility of relationships, growers may be more likely to overplant, ensuring product they deliver is at or above expectations. Premium schedules, which incentivize off-season produc-tion, could shift the distribution of output quality downward, increasing the likelihood of rejected produce. Finally, poorly written contracts may incentivize food loss if there is an opportunity for moral hazard or adverse selection22 to influence a grower’s profits. In addition, poor enforcement of contracted standards could also create losses. Carefully written contracts avoid such issues by providing the necessary incentives or payment schedule to ensure growers invest in producing high-quality output and ensuring buyers adhere to the terms of sale.
20 Almost 40 percent of the value of U.S. agricultural production in 2008 was grown under contract, compared to 28 percent in 1991 (McDonald and Korb, 2011).
21 Most current market contracts do not seem to address or acknowledge food loss in any way (McDonald and Korb, 2011).
22 Moral hazard and adverse selection are two problems that can occur when there is information asymmetry. Moral hazard happens if a grower lacks incentive to protect crops against risk given protection from the consequences (e.g., crop insurance could incentivize growers to take on more risk than necessary (Smith and Goodwin, 1996) and that risk could lead to losses). Adverse selection happens if the growers or buyers have private information about themselves that has not been shared (e.g., growers with private knowledge of poor soil quality may not share this information for fear of losing a contract).

17 Economic Drivers of Food Loss at the Farm and Pre-Retail Sectors: A Look at the Produce Supply Chain in the United States, EIB-216
USDA, Economic Research Service
Existing Policy and Unintended Consequences
A single-minded pursuit of any policy goal may lead to unintended consequences, and food loss reductions are no exception. For example, if a policy incentivized growers to send all of their edible produce to a wholesaler, it could result in defective or imperfect produce being thrown out at later points in the supply chain (i.e., at the wholesaler, retailer, or consumer levels). This policy would not actually reduce food loss; rather, it simply shifts the point where the losses occur, likely requiring more investment in ultimately uneaten produce that may end up in a landfill. Such a policy would also prevent growers from plowing under the damaged or cosmetically imperfect produce and fertil-izing future crops. The further down the supply chain food is lost, the more resources will have been expended.
Foodborne Illness Outbreaks as a Source of Food Loss
Relatively low-frequency but high-impact events, such as a foodborne illness outbreak linked to a particular crop, were often cited by growers as a potential source of food loss. These events could prove harmful to a market if all consumers quickly stop their purchase of a commodity which is deemed safe, but that information is not able to be quickly and easily passed along to the buyers.
For example, in March 2018, illnesses of E. coli O157:H7 began to be identified. The outbreak, which ran until the end of June and affected 36 States, consisted of 210 illnesses and 5 deaths that were linked to romaine lettuce produced in the Yuma growing region of Arizona. In November 2018, another E. coli O147:H7 outbreak occurred when 62 individuals were made ill after eating romaine ultimately found to be harvested in central California. During the fall outbreak, FDA first advised consumers to avoid romaine lettuce. Later, the agency revised its advice to avoid romaine from central California.
When each of the outbreaks in 2018 began to gain national attention, growers outside of the implicated area were unable to sell their product through traditional retail channels for a period of time. Some consumers were unwilling to purchase any romaine, even with assurances that the product was not grown in the contaminated region. In the case of the spring 2018 outbreak in Yuma, prices were so low that some California growers found it more cost effective to simply plow their romaine crop under than to harvest, cool, and ship the product. Both outbreaks led to dramatic swings in price that altered growers’ decision process about harvesting, labor, and shipping, all of which led to extreme changes in the amount of food loss in the market. A study of a similarly sized outbreak in 2006 shows that consumers largely substituted away from implicated produce items to substitute goods at a similar rate (Arnade et al., 2009). This suggests that while traditional consumers of romaine may have purchased less during the 2018 outbreaks, they likely substituted a different leafy green, creating an ambiguous effect on overall food loss.

18 Economic Drivers of Food Loss at the Farm and Pre-Retail Sectors: A Look at the Produce Supply Chain in the United States, EIB-216
USDA, Economic Research Service
Existing policies may also incentivize growers to leave product in the field or exclude it from the early supply chain. Product can also be left unharvested due to food safety risks associated with potential microbial contamination. For example, the Leafy Greens Marketing Agreement (LGMA) mandates a harvest buffer of 3 feet from any signs of animal intrusion and a minimum of 5 feet from the presence of animal feces (CA LGMA, 2019).23
Growers harvest all salvageable product possible while reducing the risk of unsafe food entering the marketplace. While it may be technically possible to reduce the amount of product lost at this stage by reducing the harvest buffer zone, it is unlikely to be economically efficient due to potentially severe negative impacts for consumers (e.g., serious foodborne illness or death), does not specify any set harvest interval or buffer zone but suggests “measures reasonably necessary” (Astill et al., 2018) growers, and the industry (e.g., sales loss and liability) (see box “Foodborne Illness Outbreaks as a Source of Food Loss”).
Tax policy has implications for food loss at the farm level. For example, donations represent a potential tax savings for many businesses, and some States as well as the Federal Government incen-tivize farm donations to nonprofit entities (USC, 2011; NGP, 2015). However, many growers may be unaware of these benefits, or because the benefits take the form of income-tax deductions rather than a direct payment of funds, growers may choose not to take them. There are concerns among growers about loss of reputation and liability exposure from a product once it moves forward in the supply chain (Minor et al., 2019b). For example, because growers cannot verify that donated produce will be handled in a safe and secure manner, there is concern that donated food could be implicated in a foodborne illness traced back to a grower’s operation. The Bill Emerson Good Samaritan Food Donation Act limits growers’ liability (USC, 1996), but producers are still reluctant to let product with their label be at increased risk of a foodborne illness event. Some growers suggest that even having their product labeled at a food bank could potentially damage the brand, suggesting that their produce was of lower quality.24
23 Some growers may quarantine off less (if not formally a part of LGMA) or more depending on the type of animal or severity of the intrusion. The Food Safety Modernization Act’s Produce Rule does not specify any set harvest interval or buf-fer zone but suggests “measures reasonably necessary” (Astill et al., 2018).
24 It could require additional resources to remove labels or packaging that might identify the grower prior to donation, an investment which would not be recouped.
19 Economic Drivers of Food Loss at the Farm and Pre-Retail Sectors: A Look at the Produce Supply Chain in the United States, EIB-216
USDA, Economic Research Service
Potential Solutions
Potential solutions to food loss generally fall into two broad approaches: source reduction and redis-tribution. The first step on the EPA’s food recovery hierarchy is source reduction of surplus food, and some argue that the most efficient means of reducing food loss throughout the supply chain is to identify sources of loss and stop those unproductive areas of production (EPA, 2017). Such preventative actions may include new value-added products from excess or lower grade produce, new efficiencies that reduce harvesting cost and damage to product during harvest, new technolo-gies for preserving the quality of produce while in distribution, retail, or even in consumers’ chiller drawers. This type of source reduction has obvious environmental benefits if indeed the losses are avoidable because less land, fertilizers, water, and other inputs are put into produce growth that does not get consumed by people and could also be beneficial to the grower’s bottom line, if they were no longer sinking those same costly inputs (plus labor) into the ultimately unsold product. However, difficulties arise around the uncertainty surrounding food production and loss and the risk manage-ment strategies employed by producers. As outlined above, the causes of food loss in fresh produce markets in general are volatile, changing from season to season and crop to crop—there could even be no produce lost in some years.
Research into market mechanisms that underlie food loss is growing as policymakers realize the potential opportunity to move toward food security, environmental, and resource-use goals simply by making better use of what is already being grown. Further, researchers are also beginning to understand that alleviating the problem of food loss requires a solution that benefits all parties involved in food recovery (ReFED, 2016; WWF, 2018). In some cases, actions might provide new economic opportunities and stimulate rural development, actions, and ideas explored more fully in the following sections.
Gleaning and Food Donation
Perhaps the most traditional method for collecting and redistributing unsold or unharvested food is gleaning. Gleaning refers to the collection of excess food from farms, other supply chain sectors, or retail sources for the purpose of donation. Gleaning reduces the amount of food loss while also potentially providing produce for people who may be food insecure (i.e., they lack access to enough food to maintain a healthy life). Today, a significant amount of gleaning takes place through a system of donation, generally collected by volunteers who are typically not the beneficiaries, to mitigate food loss while also feeding people in poverty.
Gleaning organizations tend to be united by a common mission, but approaches and organizational structures differ (Gunders, 2017).25 As of 2019, the National Gleaning Project listed 282 organiza-tions and chapters operating in 45 States, the District of Columbia, and nationally (NGP, 2015). While the list is not exhaustive, it represents the range of gleaning models in the United States.
Commercial farms often have larger volumes of excess produce, so they are better suited for gleaning and donations. Gleaners that partner with commercial growers constitute some of the largest donors to food banks in terms of volume (Vitiello et al., 2013). Coordinating the logistics of harvest and transportation at a single farm is easier than aggregating donations from many sites. In addition to partnering with commercial farms, some high-volume gleaning organizations are harnessing the expertise of farm laborers to harvest excess produce. Some employ low-income farm-workers to glean produce that is distributed through their own programs and local partners.
25 In fact, gleaning was a priority of USDA Secretary Glickman throughout the 1990s, an interest that stemmed from a 1977 report to Congress (see GAO, 1977).
20 Economic Drivers of Food Loss at the Farm and Pre-Retail Sectors: A Look at the Produce Supply Chain in the United States, EIB-216
USDA, Economic Research Service
Because these workers are already trained and guaranteed a wage, they form a reliable and efficient labor pool. However, smaller and volunteer-supported gleaning organizations remain a large part of the food recovery landscape (Feeding America, 2014; NGP, 2017b; Gallagher et al. 2019).
Fresh produce is perishable and often requires cold storage, so gleaners must overcome challenges related to packaging, transportation, and storage. Many gleaning operations operate similar to a small wholesaler, with logistics management and infrastructure development. Management and distribution are coordinated by full-time staff members, in addition to a large volunteer labor base (NGP, 2017a).
Successful gleaning organizations build trust and establish rapport by developing expert agricultural knowledge, maintaining consistent communication with their suppliers, and performing quality work that does not interfere with other farm operations. This helps ensure they avoid posing addi-tional costs to producers. Growers benefit from a set schedule and by having a known and reliable outlet for crops that would otherwise go unharvested. There are reasons growers may benefit from harvesting a crop, even if it would not be marketed. For example, harvesting unmarketable product may help mitigate the risk of disease or encourage continued production.26 In these instances, main-tenance gleaning occurs when a continuously fruiting crop is harvestable that growers do not have the time or labor to manage. For example, if gleaners harvest green beans early in the season, the plants will be available for a subsequent harvest that could provide the producer with additional income. Gleaning can further benefit farmers by reducing the time and monetary costs (e.g., trans-portation costs and tipping fees) associated with disposing of unmarketable produce that cannot be plowed under, such as orchard crops. Finally, gleaning can yield indirect benefits for a grower by increasing visibility within the community (NGP, 2017a and 2017b).
However, there are numerous barriers to a successful gleaning operation as well. Because most operate as not-for-profit entities and the food recovered is often donated, there is little monetary incentive for growers to participate. In fact, the model is built on largely charitable funding external to the growers, originating from a variety of sources that may or may not be sustainable over time (NGP, 2017a). Additionally, though there are some benefits to the growers through reduced tax liability, removal of unwanted produce, or public service, the direct monetary benefits may not exist at all, while the real (sunk) costs of producing that food remain. Because gleaned produce has left the field, a grower may additionally have to invest in compost or other agricultural inputs, which could have been generated by plowing under the surplus food. For a gleaning operation to be sustainable and successful, it needs to provide value to the consumer (through food donations) as well as to the supplier (the grower) through some demonstrated means.
Food Recovery, Recycling, and Alternative Markets
The persistence of food insecurity in the United States suggests that food recovery may be a poten-tial solution to both food loss and food insecurity. However, perishability, transportation costs, and fragmented infrastructure complicate comprehensive recovery efforts (Buzby et al., 2014b). The number and capacity of food recovery and diversion companies have exploded recently, which may improve landfill diversion rates.27
26 For example, most fruit trees are picked clean annually to encourage the next year’s crop, except for citrus and avoca-dos, which can have fruit on the tree for multiple seasons. Additionally, greens, cucumbers, peppers, and tomatoes are kept trimmed or picked to encourage continued production.
27 Even if some food is diverted or donated, there is still food that never makes it to these secondary outlets. Additionally, there is some concern that factoring these outlets into planting decisions could induce more planting, rather than less. (Gal-lagher et al., 2019).

21 Economic Drivers of Food Loss at the Farm and Pre-Retail Sectors: A Look at the Produce Supply Chain in the United States, EIB-216
USDA, Economic Research Service
Some companies create value-added products out of surplus produce, essentially “recycling” the previously lost produce. For example, Misfit Juicery and Ugly Juice, located in New York and the San Francisco Bay Area, respectively, purchase surplus produce, juice it, then sell the juice directly to consumers or to retail locations. Other companies like Ocado and Rubies in the Rubble sell fruit leather and condiments using surplus produce as a way to combat loss and recover more produce (Gallagher et al. 2019). If food recovery efforts entail lower transaction costs or provide a new use for the previously unused product, they are much more likely to be undertaken by producers as a means of lowering observed food loss.
An additional potential solution to reducing food loss is through secondary markets for excess or cosmetically imperfect produce. Cosmetic and standards issues in produce are challenging to manage, even with alternative markets. Though processing markets for many commodities exist for a lower grade product, market demand may not line up with the supply of damaged produce, which varies over the course of a season.28 Further, many growers decide prior to the growing season if their product is intended for fresh or processed markets, and they make pre-production decisions, such as variety selection, accordingly. There are other barriers as well. For example, processed produce is more likely to be grown under contract, and many growers are not physically located near the processor, meaning the growers’ access may be limited geographically or through market structure (i.e., no contracts). Finally, many commodities, such as tomatoes, have entirely sepa-rate markets for fresh and processed varieties. In such cases, because the varieties grown for fresh consumption differ from those grown for canning, it is not feasible for a grower to simply switch from the fresh to processed market.
Several companies have created a model where consumers pay for a subscription service and receive a box of “ugly” produce. Among these companies are Imperfect Produce, Perfectly Imperfect Produce, Hungry Harvest, and Full Harvest, which source below-grade or "ugly" produce that would otherwise have been wasted and direct it to consumers. In a traditional Community Supported Agriculture (CSA) model, farmers are paid 100 percent of the price of the box at the beginning of the season, at the time of year when expenses are high, but revenues are low. This model modifies the traditional CSA by sourcing surplus product from multiple farms (at a significant discount) or retail outlets and consolidating this into a single packaged consumer product, potentially supporting multiple suppliers29 (see box “Retail Space for Cosmetically Imperfect Produce”).
Research shows that the surplus-recovery business model used by these firms can be economically beneficial (Richards and Hamilton, 2018). These technology-based food recovery systems operate by efficiently bridging two-sided markets, in which consumers demand a variety of suppliers, and suppliers demand a large number of consumers. Further, these market intermediaries can work effi-ciently by creating a previously untapped market for produce sales, likely greater than the opportu-nities a single grower would have on its own.
In order for these new initiatives to continue to be profitable, there must be some benefit to the farmer, and society more generally. Currently, farmers can receive a tax deduction for charitable donations of excess produce, but these benefits do not exist for food sold to secondary sellers like
28 Fruit and vegetable processors act much more like a typical food processor, with a steady, contracted supply of inputs. Fresh fruit and vegetable growing, however, is much more seasonal, and food loss (or surplus) that might be sold into these alternative markets is sporadic. This complication in timing makes selling surplus produce into these channels more compli-cated and not a stable, long-term solution.
29 With this model, the consumers still pay up front, typically month-to-month or weekly rather than for the whole season. Growers are likely paid more traditionally at a piece rate by the aggregator.
22 Economic Drivers of Food Loss at the Farm and Pre-Retail Sectors: A Look at the Produce Supply Chain in the United States, EIB-216
USDA, Economic Research Service
Imperfect Produce, even at a steep discount. While this model does provide an outlet for less-than-perfect produce, some critics have questioned the unintended consequences of creating a market for wasted produce that otherwise might have been donated to food banks or sold directly to consumers as part of a traditional CSA program. Additionally, because of the sporadic nature of ugly produce, a steady supply is difficult to guarantee, causing some companies to fill orders with produce from more traditional outlets.
Retail Space for Cosmetically Imperfect Produce
Several grocery stores and larger food retailers have introduced new marketing strategies to market imperfect produce, although the persistence of some of their initiatives is unclear. In 2017, the grocery chain Hannaford began a program called “Misfits,” which placed reduced-price produce that was misshaped in visible locations in several stores around the Northeast (Haines, 2017). In 2019, Kroger introduced a line of branded misfit produce called “Pickuliar Picks” in connection with its Zero Hunger, Zero Waste campaign (Rose, 2018). Walmart has launched similar campaigns marketing “ugly” produce incorporating discounted product. Walmart’s examples seem more specifically targeted at particular crops, including one for pota-toes called “Spuglies” that debuted at 400 stores in Texas in 2016 and a separate campaign for apples called “I’m Perfect” in 2016, which launched at 300 stores in Florida (Haddon, 2016). These initiatives are a part of Walmart’s larger effort toward monitoring spoilage in its supply chains. In a slight variation on this model, Daily Table based its business model around creating a low-cost grocery option for community residents without the stigma of receiving free food from a food charity such as a food pantry. Daily Table was founded by a former president of Trader Joe’s and operates with support of donors, with a focus on healthy food and community engagement. While many of these initiatives are new, some of the U.S.-based solutions have been in existence for over 70 years. Grocery Outlet, which was founded in 1946 and operates 225 retail stores, sources products that otherwise would be wasted and sells them at a discount.
Internationally, other grocers and cooperatives have made efforts to integrate ugly produce into grocery chains. In France, the chain Intermarche launched a campaign called “Inglorious Fruits and Vegetables.” In Portugal, a group of citizens with concerns beyond food loss founded a cooperative called Fruita Feia, or “Ugly Fruit” (Godoy, 2014). The creators of Fuita Feia devel-oped the organization in response to the economic downturn in Western Europe. In general, retailers in Europe have made headway in ugly produce campaigns and food loss mitigation; yet, as with the U.S. examples, the lasting impact that these groups have had on food loss across produce supply chains is unclear. Looking into the future, whether these efforts can signifi-cantly reduce food loss is an unanswered question.
Recently, there have been some high profile roll-backs of these programs. Walmart, Whole Foods, and others national retailers have discontinued their blemished fruits and vegetables, citing inconsistent consumer interest. Another cited constraint is the difference between the expected discount by consumers and what is feasible for producers and retailers (Choi and McFetridge, 2019). While the failure of these types of marketing strategies in traditional retail settings calls into question the feasibility of this approach long term, some suggest more consumer education on the value of these products still needs to occur (Gallagher et al., 2019 and Dunning et al., 2019).
23 Economic Drivers of Food Loss at the Farm and Pre-Retail Sectors: A Look at the Produce Supply Chain in the United States, EIB-216
USDA, Economic Research Service
Government and Private Sector Investments To Reduce Food Loss
Because food loss occurs for many reasons, one grower is often unable to conceive of and incorporate a solution on his or her own. Thus, larger entities, such as local, State, and Federal Governments, alongside outside investors have begun to address food loss throughout the supply chain.
USDA’s National Institute of Food and Agriculture (NIFA) is funding numerous research proj-ects aimed to curtail food loss. The Cyber-Physical Systems Competitive Grants Program is a joint funding opportunity with the National Science Foundation (NSF) focused on scientific and engineering principles that underpin the integration of cyber and physical elements. Goals for the program include increasing food security through the development of high-output, controlled environment agricultural technologies and systems and more robust agricultural systems in general (NSF, 2019). In addition, grants provided through the Agriculture Economics and Rural Communities and Agriculture and Food Research Initiative with researchers at Arizona State University and the University of Georgia aim to apply machine learning to the food waste supply chain and to understand the effects of food retail density on municipal waste levels (USDA, NIFA 2017 and 2019a).
Additionally, NIFA funds projects that touch on a number of issues related to food loss through the Specialty Crops Research Initiative (SCRI). The SCRI works to address the needs of the specialty crop industry by improving crop characteristics; addressing threats from pests and disease; increasing production efficiency, productivity, and processing; researching and imple-menting new technology; and developing methods to control food safety hazards (USDA, NIFA, 2019b). Similarly, Value-Added Producer Grants, administered through the USDA’s office of Rural Development helps agricultural producers enter into value-added activities related to the processing and marketing of new products, with the goals of generating new products, creating and expanding marketing opportunities, and increasing producer income (USDA RD, 2019). Although food loss is never explicitly stated in the goals of these projects, progress on any one of these topics could help to curb food loss at the producer level or throughout the early supply chain.
USDA’s Agricultural Research Service (ARS) also has numerous projects underway that have begun to address food loss specifically for fruit and vegetable markets. The Healthy Processed Foods Research initiative has already begun to bring new products and market access to certain growers. With a stated goal to “Increase the commercial value of plant-based, postharvest waste materials … by reprocessing into healthful food ingredients,” this research initiative is designed to use processing technologies to improve grower incomes and total food usage. Findings have improved or identified markets for discarded potato skins, whole grape seed flour, persimmons, and mushrooms (USDA, ARS, 2019a).
In addition, the Produce Safety and Microbiology National Program has many projects underway and completed on the microbial pathogens associated with foodborne illness (USDA, ARS, 2019b). While they may not directly address food loss as a primary goal, any projects that improve safety and marketability of produce have the potential to improve grower income and reduce food lost at the farm or early supply chain.
Another frequently cited factor limiting food recovery, and thus driving food loss, is failure in logis-tics (Buzby et al., 2014b). Along the supply chain from farms to wholesalers, inventory management errors and unpredictable market shifts contribute to food loss (ReFED, 2016). The manifestations of these challenges include identifying excess food along a supply chain, communicating the avail-
24 Economic Drivers of Food Loss at the Farm and Pre-Retail Sectors: A Look at the Produce Supply Chain in the United States, EIB-216
USDA, Economic Research Service
ability of excess food to potential users, and coordinating the transportation of food in a timely and efficient manner. For example, many growers do not realize how much of their food loss can be directed into secondary markets because of failures to communicate loss information along the supply chain. In addition, because of the size of a single farming operation, it may not be feasible to collect such information in a rigorous and systematic way.
Over the past several years, the technology and venture capital worlds have taken an interest in food loss. Logistics software firms are developing solutions to mitigate food loss through better commu-nication by identifying areas for reduction and diversion of unused food. Using their software prod-ucts, these firms help clients more easily communicate among their units: for example, data sharing between sales and purchasing departments can help avoid over-purchasing of products. One initia-tive is Meal Connect, sponsored by Feeding America, which serves as a platform to connect food donors with needy food banks and their partners (Feeding America, 2019). Additionally, companies are able to track changes in food loss over time, allowing them to monitor their progress toward sustainability goals and enhance employee and customer engagement (Gallagher et al., 2019).
One startup began as an online marketplace, but after early difficulties, the firm decided to focus more on software and inventory management (Food Cowboy, 2019). This company found that a major impediment was matching supply with demand, as well as providing transportation for pickup and delivery. By working on better inventory management systems, in concert with purchasing departments, the company was able to implement scalable plans that increased communication, built data, and found alternative buyers. Another group of startups works on reducing spoilage along the supply chain. For example, one firm has released a proprietary coating for avocados and other fruit that slows ripening (McShane, 2019). Its product acts to slow water loss and oxidation, thus extending shelf-life for retailers and consumers. Similarly, firms are producing an edible biopolymer coating to extend produce shelf-life and support quality through the supply chain (Yousuf et al., 2018). USDA, ARS, too, has multiple projects aimed at extending product life. The Genetic Improvement of Fruits and Vegetables Laboratory works across commodities to improve shelf-life, overcome transportation difficulties, and produce new varieties through selective breeding and development of genomic resources (USDA, ARS, 2019c).
The investments by outside entities highlight the growing interest in curbing food loss as it pertains to all stages of the supply chain for fruits and vegetables. The strategies outlined previously often begin with the goal of reducing observable food loss. However, for food loss reduction efforts to succeed at all stages of the supply chain, there needs to be a demonstrated economic value starting with growers and following through to the final consumer (whether in a traditional market or for donated food). Regardless of impacts on food loss, some growers have begun to streamline their own supply chain to more efficiently reach the final consumer and to increase the portion of retail value they receive.
Direct-to-consumer sales channels and streamlining logistics are both gaining popularity among growers and consumers. These strategies are designed to move food more efficiently from the producer to the consumer, and/or extend the shelf-life for fresh produce. Each strategy’s aim is to improve growers' share of the consumer dollar, but the effect on overall food loss is not fully known.
Access to farmers’ markets or other diversified markets can be an important factor in limiting food loss in some cases. In addition to the ugly produce mentioned previously, produce that is too ripe to ship over large distances can be sold immediately to consumers in farm stores or farmers’ markets, reducing the amount of produce loss. Similarly, by selling to schools that have a farm-to-school
25 Economic Drivers of Food Loss at the Farm and Pre-Retail Sectors: A Look at the Produce Supply Chain in the United States, EIB-216
USDA, Economic Research Service
lunch program and other local or direct markets, growers can receive benefits of diversifying their sales and selling product that might otherwise have been unsalvageable (Izumi et al., 2010). These outlets, which tend to be more locally focused and thus have a quicker turn-around for rapidly ripening product, provide an immediate outlet for produce.
While these markets operate well when established, it is typically outside the scope of a single grower to establish a farmers’ market or create the infrastructure necessary to sell into a new market channel while still maintaining established market channels. Accessing new markets with new stan-dards requires heightened management effort and expertise; however, studies have demonstrated the benefits of growers’ increasing use of less traditional market channels. The increased costs of partic-ipation in local markets, such as hauling and selling produce themselves, have been demonstrated to be offset by higher prices, quicker product turnover, and reduced uncertainty in the marketplace when selling in innovative or emerging market channels (Verhaegen and Huylenbroeck, 2001). Recent research has shown that consumers buy and spend more on fruits and vegetables if they shop at a direct-to-consumer outlet, such as a farmers’ market, suggesting that it may be a profitable outlet for growers with produce that may not survive cross-country shipping (Stewart and Dong, 2018). Finally, these direct outlets have been shown to open new markets for consumers who might not otherwise have had access to fresh produce, strengthening the financial incentives for growers to participate (Evans et al., 2012; Dimitri et al., 2015).

26 Economic Drivers of Food Loss at the Farm and Pre-Retail Sectors: A Look at the Produce Supply Chain in the United States, EIB-216
USDA, Economic Research Service
Conclusions
Many factors contribute to food loss at the farm level. This study identifies common themes and drivers, and identifies several public and private investments aimed at curbing food loss. If food is never produced with an intention of it going to landfill, this study reveals other underlying drivers of loss exist, which may include price volatility in the marketplace, labor constraints, supply chain rigidities, grades and standards, consumer preferences, or existing policies that unintentionally exac-erbate food loss. Once the effects, incentives, and competing goals are considered together, one can begin to understand how to balance resources devoted to reducing food loss alongside other goals, such as maintaining farm profitability.
Reducing food loss, like any singular focus in a complex system, does not occur in a vacuum, and each action has an opportunity cost. Food loss reduction may be greatest when considered alongside other competing factors for the individual grower, processor, retailer, and consumer. If reducing food loss takes away resources devoted to farm profitability, for example, it is unlikely that any grower would choose to participate. However, if reducing food loss is considered alongside more traditional goals like improving farm income, industry adoption of food loss initiatives may be more likely. Additionally, how the issue is framed (e.g., as a distribution problem, as a way to feed hungry people, as a path to increase farm profit) may lead to different mitigation strategies that produce different “winners” and “losers.”
There are emerging retail markets and opportunities that can both alleviate food loss and improve growers' income, as evidenced by consumer interest in "ugly" or "imperfect" produce. As the condi-tions for food loss are multifaceted, so, too, are the strategies that alleviate that loss and improve grower welfare. This study attempts to identify likely contributing factors to food loss early in the supply chain. However, collecting and analyzing nationally representative data could identify which of the potential driving factors are most significant and highlight the opportunities to most substan-tially reduce food loss.

27 Economic Drivers of Food Loss at the Farm and Pre-Retail Sectors: A Look at the Produce Supply Chain in the United States, EIB-216
USDA, Economic Research Service
References
Andreyeva, T., M.W. Long, and K.D. Brownell. 2010. “The Impact of Food Prices on Consumption: A Systematic Review of Research on the Price Elasticity of Demand for Food,” American Journal of Public Health 100(2), pp.216-22.
Arnade, C., L. Calvin, and F. Kuchler. 2009. “Consumer Response to a Food Safety Shock: The 2006 Food-Borne Illness Outbreak of E. coli O157: H7 Linked to Spinach.” Review of Agricultural Economics 31(4), pp.734-50.
Astill, G., and T. Minor. 2019. “Food Loss in the Romaine Lettuce Industry,” in Economics of Food Loss in Produce: From the Farm to the Pre-retail Supply Chain, Taylor and Francis Group.
Astill, G., T. Minor, L. Calvin, and S. Thornsbury. 2019. U.S. Produce Growers' Decisionmaking Under Evolving Food Safety Standards, EIB-210, U.S. Department of Agriculture, Economic Research Service.
Astill, G., T. Minor, L. Calvin, and S. Thornsbury. 2018. Before Implementation of the Food Safety Modernization Act's Produce Rule: A Survey of U.S. Produce Growers, EIB-194, U.S. Department of Agriculture, Economic Research Service.
Baker, G., L. Calvin, A. Gillman, L. Kitnoja, T. Osland, P. Pearson, L. Prezkop, B.E. Roe, E. Spang, and J.B. Tooley. 2019. “Tomato Tales: Comparing Loss-Reduction Drivers and Opportunities Across U.S. Fresh Tomato Supply Chains,” in Economics of Food Loss in Produce: From the Farm to the Pre-Retail Supply Chain, Taylor and Francis Group.
Bazerghi, C., F.H. McKay, and M. Dunn. 2016. “The Role of Food Banks in Addressing Food Insecurity: A Systematic Review,” Journal of Community Health 41(4), pp.732-40.
Buzby, J., J. Campuzano, C. Ammon, J.T. Bentley, and B. Padera. 2016. Updated Supermarket Shrink Estimates for Fresh Foods and Their Implications for ERS Loss-Adjusted Food Availability Data, EIB-155, U.S. Department of Agriculture, Economic Research Service.
Buzby, J., J. Bentley, B. Padera, C. Ammon, and J. Campuzano. 2015. “Estimated Fresh Produce Shrink and Food Loss in US Supermarkets,” Agriculture 5(3), pp.626-48.
Buzby, J., H.F. Wells, and J. Hyman. 2014a. The Estimated Amount, Value, and Calories of Postharvest Food Losses at the Retail and Consumer Levels in the United States, EIB-121, U.S. Department of Agriculture, Economic Research Service.
Buzby, J.C., H.F. Wells, and J. Aulakh. 2014b. “Food Loss—Questions About the Amount and Causes Still Remain,” Amber Waves, U.S. Department of Agriculture, Economic Research Service, June.
Buzby, J.C., H.F. Wells, B. Axtman, and J. Mickey, 2009. Supermarket Loss Estimates for Fresh Fruit, Vegetables, Meat, Poultry, and Seafood and Their Use in the ERS Loss-Adjusted Food Availability Data, EIB-44, U.S. Department of Agriculture, Economic Research Service.
California Leafy Green Marketing Agreement (CA LGMA). 2019. Commodity Specific Food Safety Guidelines for the Production and Harvest of Lettuce and Leafy Greens. Accessed on the LGMA website.
28 Economic Drivers of Food Loss at the Farm and Pre-Retail Sectors: A Look at the Produce Supply Chain in the United States, EIB-216
USDA, Economic Research Service
Calvin, L., R.L. Cook, M. Denbaly, C. Dimitri, L. Glaser, C. Handy, M. Jekanowski, P. Kaufman, B. Krissoff, G. Thompson. 2001. U.S. Fresh Fruit and Vegetable Marketing: Emerging Trade Practices, Trends, and Issues, AER-795, U.S. Department of Agriculture, Economic Research Service.
Canali, M., K. Östergren, P. Amani, L. Aramyan, S. Sijtsema, O. Korhonen, K. Silvennoinen, G. Moates, K. Waldron, and C. O’Connor. 2014. “Drivers of Current Food Waste Generation, Threats of Future Increase and Opportunities for Reduction,” EU FUSIONS. Canali (ed.).
Centers for Disease Control and Prevention (CDC). 2018. “Multistate Outbreak of E. coli O157:H7 Infections Linked to Romaine Lettuce” (Final Update). Accessed on the CDC website.
Charlton, D., and J.E. Taylor. 2013. “Mexicans Are Leaving Farm Work: What Does It Mean for U.S. Agriculture and Immigration Policy?” Agricultural and Resource Economics Update, Volume 16, pp.1-4.
Choi, C., and S. McFetridge. 2019. “The Attraction to “Ugly Produce” Might Be Ending for Grocers and Shoppers,” Des Moines Register, February 21.
Creamer, N., and L.K. Johnson. 2018. “Introducing Farm-Level Loss Into the Food Waste Discussion,” Huffington Post.
De Gorter, H. 2014. “Economics of Food Losses and Waste: Concepts and Practical Implications,” Background study prepared at the request of the Agricultural and Development Economics Division (ESA) of the Food and Agriculture Organization of the United Nations, Rome.
Dimitri, C., L. Oberholtzer, M. Zive, and C. Sandolo. 2015. “Enhancing Food Security of Low-Income Consumers: An Investigation of Financial Incentives for Use at Farmers Markets,” Food Policy 52, pp.64-70.
Dunning, R., L. Johnson, and K. Boys. 2019. “Putting Dollars to Waste: Estimating the Value of On-Farm Food Loss,” Choices, Quarter 1.
Ellison, B., M.K. Muth, E. Golan, 2019. “Opportunities and Challenges in Conducting Economic Research on Food Loss and Waste,” Applied Economic Perspectives and Policy, Volume 41, Issue 1, March, pp 1-19.
Evans, A.E., R. Jennings, A.W. Smiley, J.L. Medina, S.V Sharma, R. Rutledge, M.H. Stigler, and D.M. Hoelscher. 2012. “Introduction of Farm Stands in Low-Income Communities Increases Fruit and Vegetable Consumption Among Community Residents,” Health & Place 18(5), pp. 1137-43.
Fan, M., S. Gabbard, A. Alves Pena, and J.M. Perloff. 2015. “Why Do Fewer Agricultural Workers Migrate Now?” American Journal of Agricultural Economics 97(3), pp.665-79.
Feeding America. 2019. “Meal Connect.” Accessed on the Meal Connect website.
Feeding America. 2014. “Hunger in America in 2014.”
Food and Agricultural Organization of the United Nations (FAO). 2018. “Technical Platform on the Measurement and Reduction of Food Loss and Waste. Food and Agriculture Organization of the United Nations.” Accessed on the FAO website on November 1, 2018.
29 Economic Drivers of Food Loss at the Farm and Pre-Retail Sectors: A Look at the Produce Supply Chain in the United States, EIB-216
USDA, Economic Research Service
Food and Agricultural Organization of the United Nations (FAO). 2011. “Global Food Losses and Food Waste–Extent, Causes and Prevention. SAVE FOOD: An Initiative on Food Loss and Waste Reduction.”
Food Cowboy. 2019. “Food Waste in the Supply Chain.” Accessed on the Food Cowboy website.
Gallagher, L., A.S. Hsu-Flanders, and N.L.W. Wilson. 2019. “Potential Solutions to Food Loss,” in Economics of Food Loss in Produce: From the Farm to the Pre-Retail Supply Chain, Taylor and Francis Group.
Golan, E., T. Minor, and S. Thornsbury. 2019. “Loss and Waste, Are We Really Measuring a Problem?” in Economics of Food Loss in Produce: From the Farm to the Pre-Retail Supply Chain, Taylor and Francis Group.
Godoy, M. 2014. In Europe, Ugly Sells In The Produce Aisle. National Public Radio. Food For Thought. Dec. 9.
Gunders, D. 2017. Wasted: How America Is Losing up to 40 Percent of Its Food From Farm to Fork to Landfill, Second edition, New York: Natural Resources Defense Council.
Gunders, D. 2012. Wasted: How America Is Losing up to 40 Percent of Its Food From Farm to Fork to Landfill, New York: Natural Resources Defense Council.
Guthman, J. 2017. “Paradoxes of the Border: Labor Shortages and Farmworker Agency in Reworking California’s Strawberry Fields,” Economic Geography 93(1), 24-43.
Haddon, H. 2016. “Supermarkets Make Stars Out of Weird Apples, Knobbled Carrots and “Spuglies,” The Wall Street Journal, September 16.
Haines, J. 2017. “Hannaford to Ugly Produce—Looks Are Not Everything,” Bangor Daily News, March 15.
Hanson, C., B. Lipinski, K. Robertson, D. Dias, I. Gavilan, P. Gréverath, S. Ritter, J. Fonseca, R. Van Otterdijk, T. Timmermans, and J. Lomax. 2016. “Food Loss and Waste Accounting and Reporting Standard,” WRI, Nestlé, CGF, FAO, EU-funded FUSIONS project, UNEP, WRAP, WBCSD, NRI. URL.
Hill, A.E. 2019. “The Labor Supply of U.S. Agricultural Workers,” UC Davis Working Paper Series.
Hitaj, C., F. Last, and S. Zahniser. 2019. “Labor Constraints as a Source of Food Loss,” in Economics of Food Loss in Produce: From the Farm to the Pre-Retail Supply Chain, Taylor and Francis Group.
Hodges, R.J., J.C. Buzby, and B. Bennett. 2011. “Postharvest Losses and Waste in Developed and Less Developed Countries: Opportunities to Improve Resource Use,” The Journal of Agricultural Science 149(S1), pp. 37-45.
Hoover, D. 2017. “Estimating Quantities and Types of Food Waste at the City Level,” Natural Resources Defense Council (NRDC). Accessible on the NRDC website.
30 Economic Drivers of Food Loss at the Farm and Pre-Retail Sectors: A Look at the Produce Supply Chain in the United States, EIB-216
USDA, Economic Research Service
Hsu-Flanders, A.S., L. Gallagher, and N.L. Wilson, W. 2019. “Strawberries: Food Loss and Loss Prevention Opportunities,” Economics of Food Loss in Produce: From the Farm to the Pre-Retail Supply Chain, Taylor and Francis Group.
Izumi, B.T., D.W. Wright, and M.W. Hamm. 2010. “Market Diversification and Social Benefits: Motivations of Farmers Participating in Farm to School Programs,” Journal of Rural Studies 26(4), pp. 374-82.
Johansson, R., M. Peters, and R. House. 2007. Regional Environment and Agriculture Programming Model (REAP), TB-1916, U.S. Department of Agriculture, Economic Research Service.
Kahneman, D., J.L. Knetsch, and R.H. Thaler. 1991. “Anomalies: The Endowment Effect, Loss Aversion, and Status Quo Bias,” Journal of Economic Perspectives 5(1), pp. 193-206.
Kitinoja, L., S. Saran, S.K. Roy, and A.A. Kader. 2011. “Postharvest Technology for Developing Countries: Challenges and Opportunities in Research, Outreach and Advocacy,” Journal of the Science of Food and Agriculture 91(4), pp. 597-603.
Kitinoja, L., V.Y. Tokala, and A. Brondy. 2018. A Review of Global Postharvest Loss Assessments in Plant-Based Food Crops: Recent Findings and Measurement Gaps,” Journal of Postharvest Technology 6(4).
Kumar, D., and P. Kalita. 2017. “Reducing Postharvest Losses During Storage of Grain Crops to Strengthen Food Security in Developing Countries,” Foods 6(1), p. 8.
Lipinski, B., C. Hanson, J. Lomax, L. Kitinoja, R. Waite, and T. Searchinger. 2013. “Reducing Food Loss and Waste,” World Resources Institute Working Paper, pp. 1-40.
MacDonald, J.M., and P. Korb. 2011. Agricultural Contracting Update: Contracts in 2008, EIB-72, U.S. Department of Agriculture, Economic Research Service.
McShane, G. 2019. “Apeel Sciences to Join Europe’s Fight Against Food Waste With Shelf-Life Solution Launch,” Produce Business U.K.
Minor, T., and Thornsbury, S. 2019. “Introduction” Economics of Food Loss in Produce: From the Farm to the Pre-retail supply chain. Taylor and Francis.
Minor, T., G. Hawkes, E. McLaughlin, K. Park, and L. Calvin. 2019a. Food Safety Requirements for Produce Growers: Retailer Demands and the Food Safety Modernization Act, EIB-206, U.S. Department of Agriculture, Economic Research Service.
Minor, T., C. Hitaj, F. Kuchler. S.R. Skorbiansky, B. Roe, and S. Thornsbury. 2019b. “Exploring Food Loss From Farm-to-Retail in the Produce Industry,” Choices, Quarter 1.
Muth, M., S. Karns, S. Nielsen, J. Buzby, and H. Farah-Wells. 2011. Consumer-Level Food Loss Estimates and Their Use in the ERS Loss-Adjusted Food Availability Data, TB-1927, U.S. Department of Agriculture, Economic Research Service.
National Gleaning Project (NGP). 2015. “The National Gleaning Project: Guide to the Online Gleaning Resources Hub,” Vermont Law School, Center for Agricultural Food Systems.
31 Economic Drivers of Food Loss at the Farm and Pre-Retail Sectors: A Look at the Produce Supply Chain in the United States, EIB-216
USDA, Economic Research Service
National Gleaning Project (NGP). 2017a. “Models for Success: A Set of Case Studies Examining Gleaning Efforts Across the United States,” Vermont Law School, Center for Agricultural Food Systems.
National Gleaning Project (NGP). 2017b. “Reducing Food Insecurity and Food Waste: Improving the National Framework to Support Gleaning Operations,” Vermont Law School, Center for Agricultural Food Systems.
National Science Foundation (NSF). 2019. Cyber-Physical Systems (CPS) PROGRAM SOLICITATION. NSF 19-553.
Parr, B., J. Bond, and T. Minor. 2019a. Vegetables and Pulses Outlook, U.S. Department of Agriculture, Economic Research Service, May.
Parr, B., J. Bond, and T. Minor. 2019b. “Vegetables and Pulses Yearbook Data,” U.S. Department of Agriculture, Economic Research Service (ERS). Accessible on the ERS website.
Parr, B., J. Bond, and T. Minor. 2018. Vegetables and Pulses Outlook, U.S. Department of Agriculture, Economic Research Service, October.
Perez, A. 2018. “Fruit and Tree Nuts Yearbook Data,” U.S. Department of Agriculture, Economic Research Service (ERS). Accessible on the ERS website.
Perez, A., and T. Minor. 2018. Fruit and Tree Nuts Outlook, U.S. Department of Agriculture, Economic Research Service, September.
Porat, R., A. Lichter, L.A. Terry, R. Harker, and J. Buzby. 2018. “Postharvest Losses of Fruit and Vegetables During Retail and in Consumers’ Homes: Quantifications, Causes, and Means of Prevention,” Postharvest Biology and Technology 139, pp. 135-49.
ReFED. 2016. A Roadmap to Reduce USF Waste by 20 Percent. Accessible on ReFED website.
Richards, T.J., and S.F. Hamilton. 2018. “Food Waste in the Sharing Economy,” Food Policy 75, pp. 109-23.
Richards, T.J., and A.K. Mishra. 2019. “Empirical Modeling of Food Loss in the Produce Sector,” in Economics of Food Loss in Produce: From the Farm to the Pre-Retail Supply Chain. Taylor and Francis Group.
Rose, L. 2018. Kroger's New Produce Program Targets Food Waste. The Daily Meal. Oct. 17.
Skorbiansky, S.R. and B. Ellison. 2019. “Contracting and Quality Standards in Fresh Produce Markets and How it Impacts Food Loss,” in Economics of Food Loss in Produce: From the Farm to the Pre-Retail Supply Chain, Taylor and Francis Group.
Smith, V.H., and B.K. Goodwin. 1996. “Crop Insurance, Moral Hazard, and Agricultural Chemical Use,” American Journal of Agricultural Economics 78.2: 428-38.
Stenmarck, Â., C. Jensen, T. Quested, G. Moates, M. Buksti, B. Cseh, S. Juul, A. Parry, A. Politano, B. Redlingshofer, and S. Scherhaufer. 2016. “Estimates of European Food Waste Levels,” IVL Swedish Environmental Research Institute.
32 Economic Drivers of Food Loss at the Farm and Pre-Retail Sectors: A Look at the Produce Supply Chain in the United States, EIB-216
USDA, Economic Research Service
Stevens, A. 2019. “Temperature, Wages, and Agricultural Labor Productivity,” UC Berkeley Working Paper, Accessible on UC Berkeley website.
Stewart, H., and D. Dong. 2018. The Relationship Between Patronizing Direct-to-Consumer Outlets and a Household’s Demand for Fruits and Vegetables, ERR-242, U.S. Department of Agriculture, Economic Research Service.
Stewart, H., J. Hyman, A. Carlson, and E. Frazao. 2016. The Cost of Satisfying Fruit and Vegetable Recommendations in the Dietary Guidelines, EB-27, U.S. Department of Agriculture, Economic Research Service.
Taylor, J.E., D. Charlton, and A. Yúnez-Naude. 2012. “The End of Farm Labor Abundance,” Applied Economic Perspectives and Policy 34(4), pp. 587-98.
United States Code (USC). 1996. “Bill Emerson Good Samaritan Food Donation Act.”
United States Code (USC). 2011. Supplement 5, Title 26 - INTERNAL REVENUE CODE: PART VI - ITEMIZED DEDUCTIONS FOR INDIVIDUALS AND CORPORATIONS: Sec. 170 - Charitable, etc., contributions and gifts.
U.S. Department of Agriculture (USDA). 2019. “Food Loss and Waste,” Accessible on the USDA web site.
U.S. Department of Agriculture, Agricultural Marketing Service (USDA, AMS). 2019a. “Grades and Standards: Fruits,” Accessible on the USDA, AMS website.
U.S. Department of Agriculture, Agricultural Marketing Service (USDA, AMS). 2019b. “Grades and Standards: Vegetables,” Accessible on the USDA, AMS website.
U.S. Department of Agriculture, Agricultural Marketing Service (USDA, AMS). 2019c. “Specialty Crops Marketing Orders & Agreements,” Accessible on the USDA, AMS website.
U.S. Department of Agriculture, Agricultural Marketing Service (USDA, AMS). 2017. “Fruit, Vegetables & Specialty Crop Marketing Orders and Agreements,” Fact Sheet. Accessible on the USDA, AMS website.
U.S. Department of Agriculture, Agricultural Research Service (USDA, ARS). 2019a. “Healthy Processed Foods Research. Adding Value to Plant-Based Waste Materials Through Development of Novel, Healthy Ingredients and Functional Foods,” Accessible on the USDA, ARS website.
U.S. Department of Agriculture, Agricultural Research Service (USDA, ARS). 2019b. “Produce Safety and Microbiology Research,” Accessible on the USDA, ARS website.
U.S. Department of Agriculture, Agricultural Research Service (USDA, ARS). 2019c. “Genetic Improvement for Fruits & Vegetables Laboratory: Beltsville, MD,” Accessible on the USDA, ARS website.
U.S. Department of Agriculture, Economic Research Service (USDA, ERS). 2018. “Food Availability (Per Capita) Data System,” Accessible on the USDA, ERS website.

33 Economic Drivers of Food Loss at the Farm and Pre-Retail Sectors: A Look at the Produce Supply Chain in the United States, EIB-216
USDA, Economic Research Service
U.S. Department of Agriculture, National Institute of Food and Agriculture (USDA, NIFA). 2017. “Food Waste: A Market-Based Solution Using Commercial Peer-to-Peer Mutualization Systems,” Accessible on the USDA, NIFA website.
U.S. Department of Agriculture, National Institute of Food and Agriculture (USDA, NIFA). 2019a. “Food Waste and Food Retail Density,” Accessible on the USDA, NIFA website.
U.S. Department of Agriculture, National Institute of Food and Agriculture (USDA, NIFA). 2019b. “Specialty Crop Research Initiative (SCRI),” Accessible on the USDA, NIFA website.
U.S. Department of Agriculture, Rural Development (USDA, RD). 2019. “Value Added Producer Grants,” Accessible on the USDA website.
U.S. Environmental Protection Agency (EPA). 2017. “Food Recovery Hierarchy,” Accessed from the EPA website on November 1, 2018.
U.S. Environmental Protection Agency (EPA). 2018. “Advancing Sustainable Materials Management: 2015 Fact Sheet.”
U.S. Government Accountability Office (GAO). 1977. Food Waste: An Opportunity to Improve Resource Use, Report to Congress.
Verhaegen, I., and G. Van Huylenbroeck. 2001. “Costs and Benefits for Farmers Participating in Innovative Marketing Channels for Quality Food Products,” Journal of Rural Studies 17(4), pp. 443-56.
Vitiello, D., J.A. Grisso, R. Fischman, and K.L. Whiteside. 2013. Food Relief Goes Local: Gardening, Gleaning, and Farming for Food Banks in the US, Center for Public Health Initiatives, Philadelphia.
Vitiello, D., J.A. Grisso, K.L. Whiteside, and R. Fischman. 2015. “From Commodity Surplus to Food Justice: Food Banks and Local Agriculture in the United States,” Agriculture and Human Values 32(3), pp. 419-30.
Weatherspoon, D., J. Oehmke, A. Dembélé, M. Coleman, T. Satimanon, and L. Weatherspoon. 2013. “Price and Expenditure Elasticities for Fresh Fruits in an Urban Food Desert,” Urban Studies 50(1), pp. 88-106.
World Wildlife Foundation (WWF). 2018. “No Food Left Behind Part 1: Underutilized Produce Ripe for Alternative Markets.”
World Wildlife Foundation (WWF). 2017. “Fighting Food Waste in Hotels.”
Yousuf, B., O.S. Qadri, and A.K. Srivastava. 2018. “Recent Developments in Shelf-Life Extension of Fresh-Cut Fruits and Vegetables by Application of Different Edible Coatings: A Review,” Lwt 89, pp. 198-209.
Zahniser, S., J. Taylor, T. Hertz, and D. Charlton. 2018. Farm Labor Markets in the United States and Mexico Pose Challenges for U.S. Agriculture, EIB-201, U.S. Department of Agriculture, Economic Research Service.