Embed Size (px)
Citation preview

Economic Effects of the Deepwater Horizon Oil SpillBrian Richard
Dept. of Economic and Workforce Development
Mississippi Gulf Coast
Importance of the Gulf of Mexico to the Mississippi Gulf Coast economy TourismFisheries
Impacts of the Oil Spill
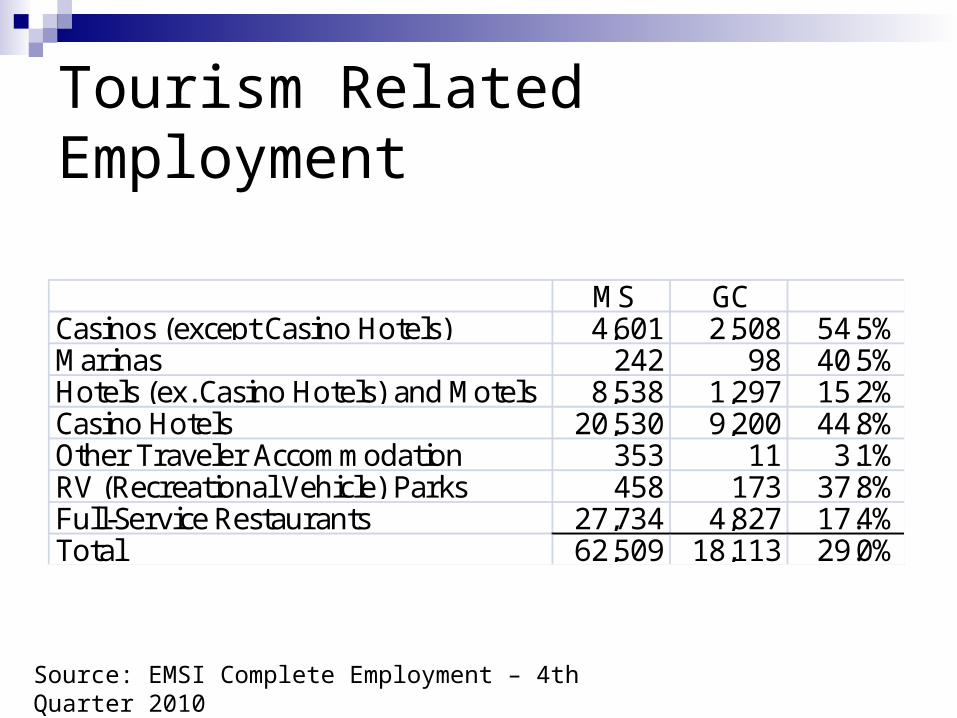
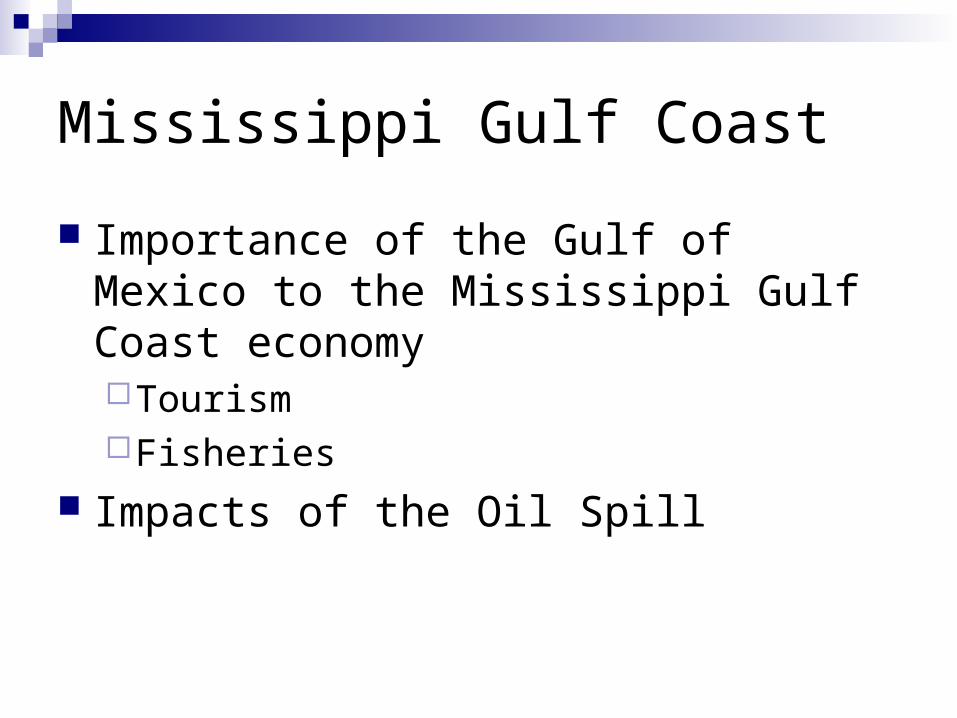
Tourism Related Employment
MS GCCasinos (except Casino Hotels) 4,601 2,508 54.5%Marinas 242 98 40.5%Hotels (ex. Casino Hotels) and Motels 8,538 1,297 15.2%Casino Hotels 20,530 9,200 44.8%Other Traveler Accommodation 353 11 3.1%RV (Recreational Vehicle) Parks 458 173 37.8%Full-Service Restaurants 27,734 4,827 17.4%Total 62,509 18,113 29.0%
Source: EMSI Complete Employment – 4th Quarter 2010
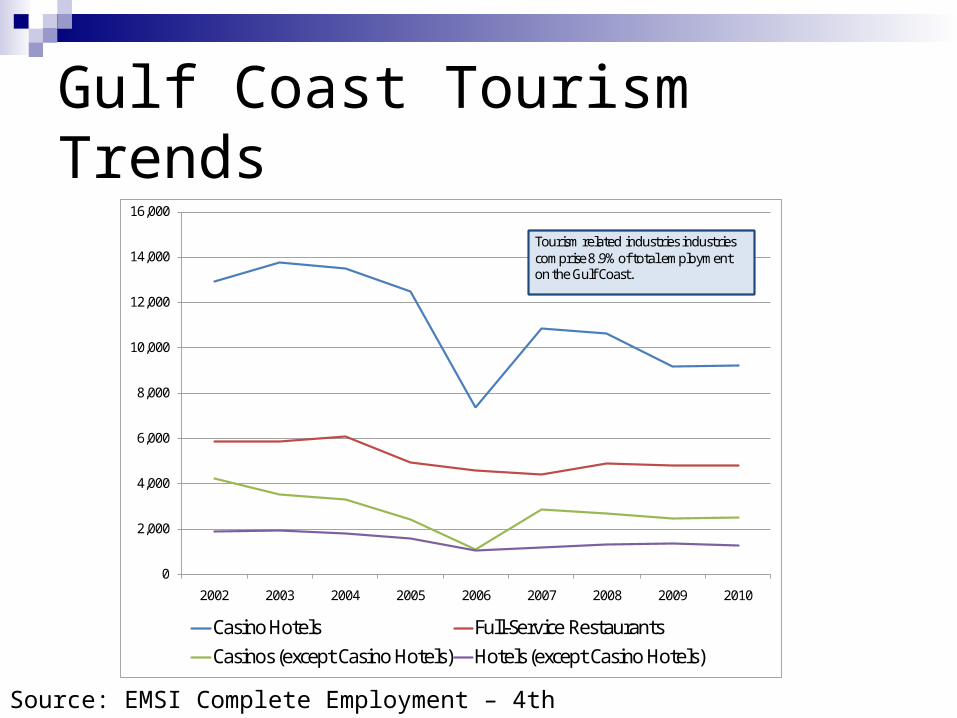
Gulf Coast Tourism Trends
0
2,000
4,000
6,000
8,000
10,000
12,000
14,000
16,000
2002 2003 2004 2005 2006 2007 2008 2009 2010
Casino Hotels Full-Service RestaurantsCasinos (except Casino Hotels) Hotels (except Casino Hotels)
Tourism related industries industries comprise 8.9% of total employment on the Gulf Coast.
Source: EMSI Complete Employment – 4th Quarter 2010
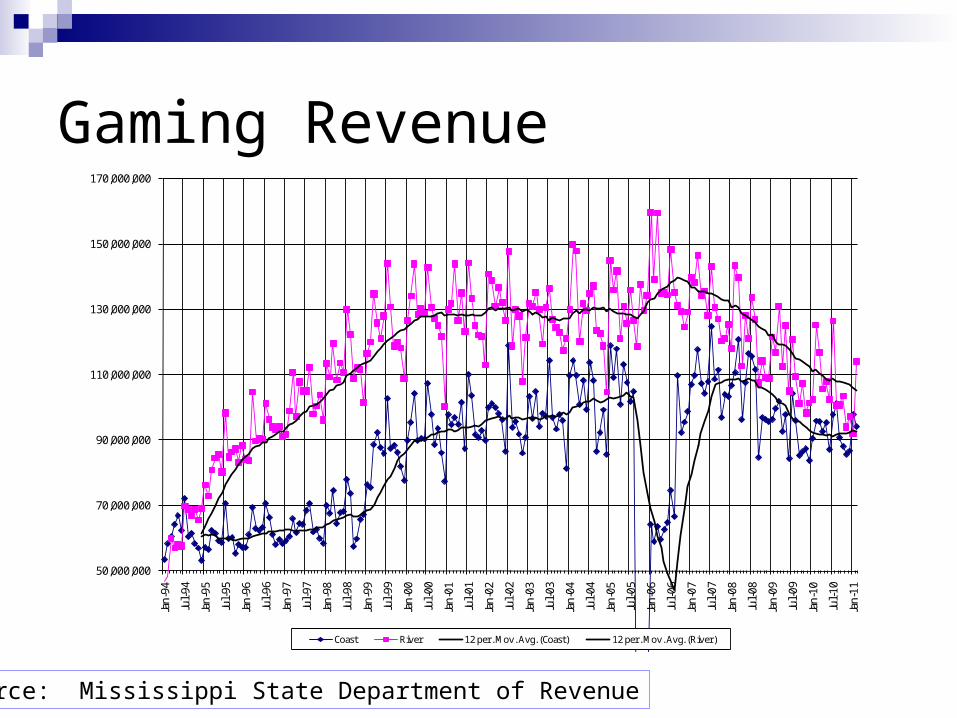
Gaming Revenue
Source: Mississippi State Department of Revenue
50,000,000
70,000,000
90,000,000
110,000,000
130,000,000
150,000,000
170,000,000Ja
n-94
Jul-
94
Jan-
95
Jul-
95
Jan-
96
Jul-
96
Jan-
97
Jul-
97
Jan-
98
Jul-
98
Jan-
99
Jul-
99
Jan-
00
Jul-
00
Jan-
01
Jul-
01
Jan-
02
Jul-
02
Jan-
03
Jul-
03
Jan-
04
Jul-
04
Jan-
05
Jul-
05
Jan-
06
Jul-
06
Jan-
07
Jul-
07
Jan-
08
Jul-
08
Jan-
09
Jul-
09
Jan-
10
Jul-
10
Jan-
11
Coast River 12 per. Mov. Avg. (Coast) 12 per. Mov. Avg. (River)
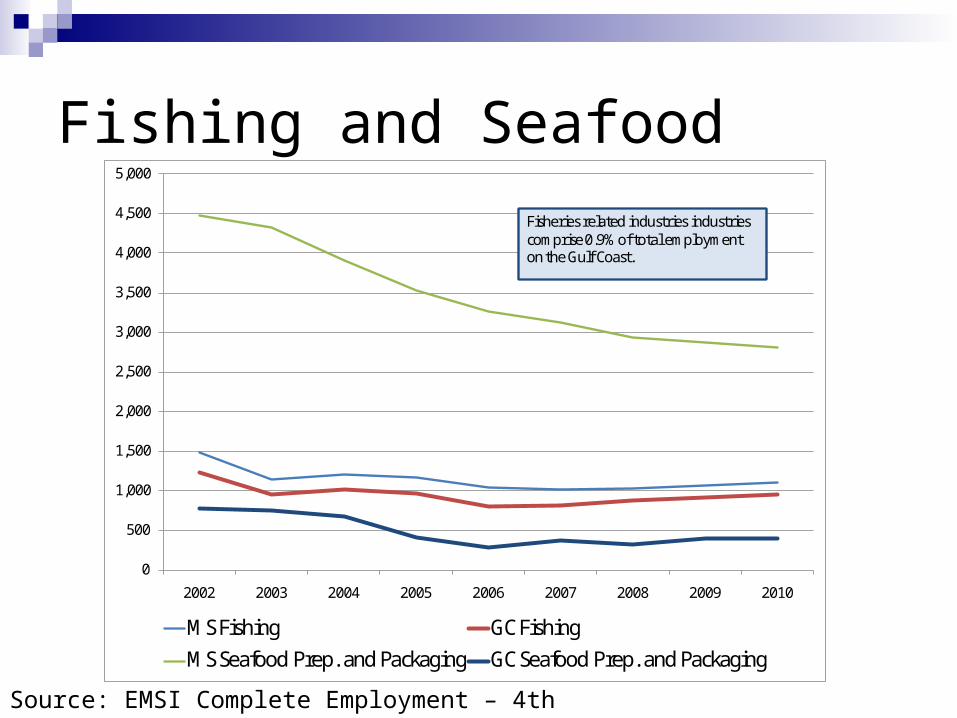
Fishing and Seafood
Source: EMSI Complete Employment – 4th Quarter 2010
0
500
1,000
1,500
2,000
2,500
3,000
3,500
4,000
4,500
5,000
2002 2003 2004 2005 2006 2007 2008 2009 2010
MS Fishing GC FishingMS Seafood Prep. and Packaging GC Seafood Prep. and Packaging
Fisheries related industries industries comprise 0.9% of total employment on the Gulf Coast.
Economic Impacts
Economic Impact: the economy-wide effect on employment and incomes produced by a policy, event, or decision
Fiscal Impact: the effect on tax revenues produced by a policy, event, or decision
Source: BusinessDictionary.com
Economic Impacts
We know (and will continue to track) some of what happened in the economy with the oil spill
The research is estimating what would have happened without the oil spill
The difference between what did happen and what would have happened is the economic impact
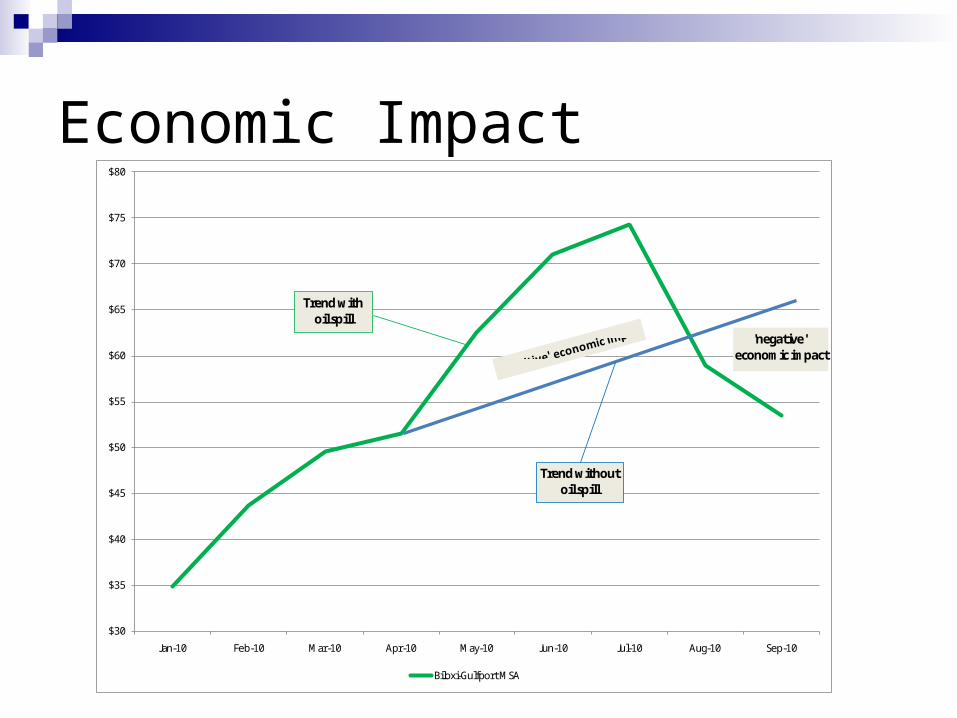
Economic Impact
$30
$35
$40
$45
$50
$55
$60
$65
$70
$75
$80
Jan-10 Feb-10 Mar-10 Apr-10 May-10 Jun-10 Jul-10 Aug-10 Sep-10
Biloxi-Gulfport MSA
'negative'economic impact
Trend withoil spill
Trend withoutoil spill
Economic Impacts
ChallengesHow are the effects of the oil spill isolated
from everything else going on in the economy?
Katrina recovery Recession/recovery
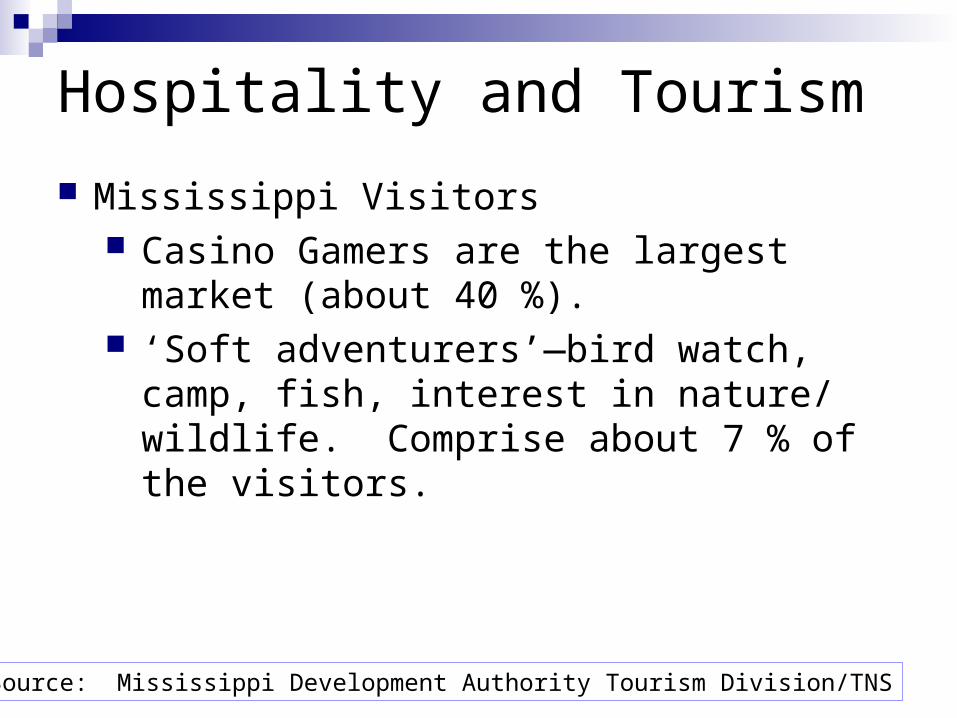
Hospitality and Tourism
Mississippi Visitors Casino Gamers are the largest market (about
40 %). ‘Soft adventurers’—bird watch, camp, fish,
interest in nature/ wildlife. Comprise about 7 % of the visitors.
Source: Mississippi Development Authority Tourism Division/TNS
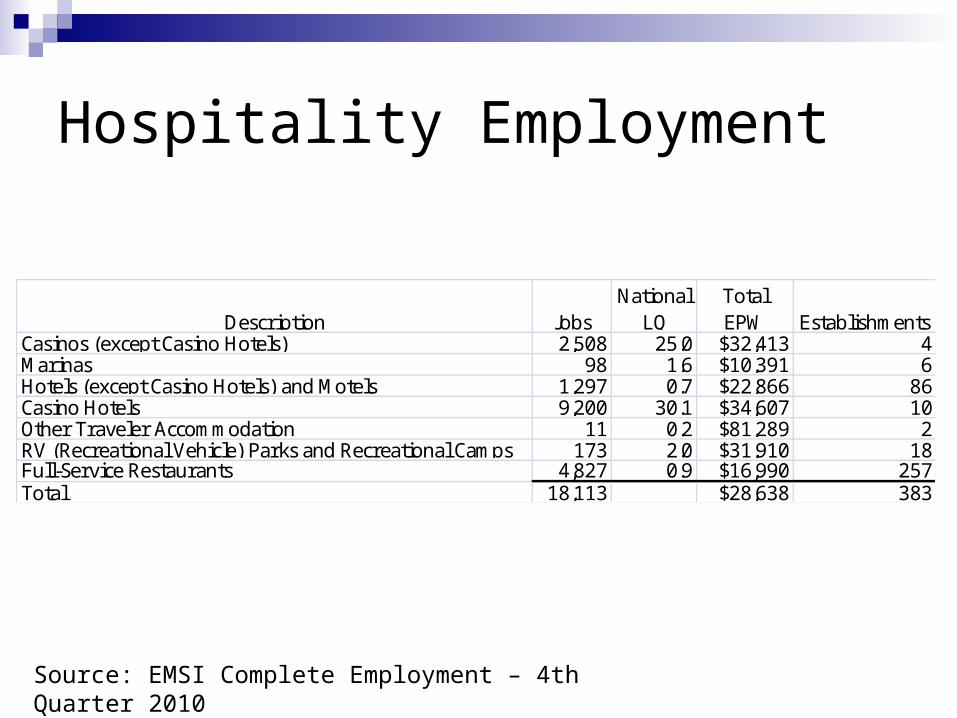
Hospitality Employment
Source: EMSI Complete Employment – 4th Quarter 2010
Description JobsNational
LQTotal EPW Establishments
Casinos (except Casino Hotels) 2,508 25.0 $32,413 4Marinas 98 1.6 $10,391 6Hotels (except Casino Hotels) and Motels 1,297 0.7 $22,866 86Casino Hotels 9,200 30.1 $34,607 10Other Traveler Accommodation 11 0.2 $81,289 2RV (Recreational Vehicle) Parks and Recreational Camps 173 2.0 $31,910 18Full-Service Restaurants 4,827 0.9 $16,990 257Total 18,113 $28,638 383
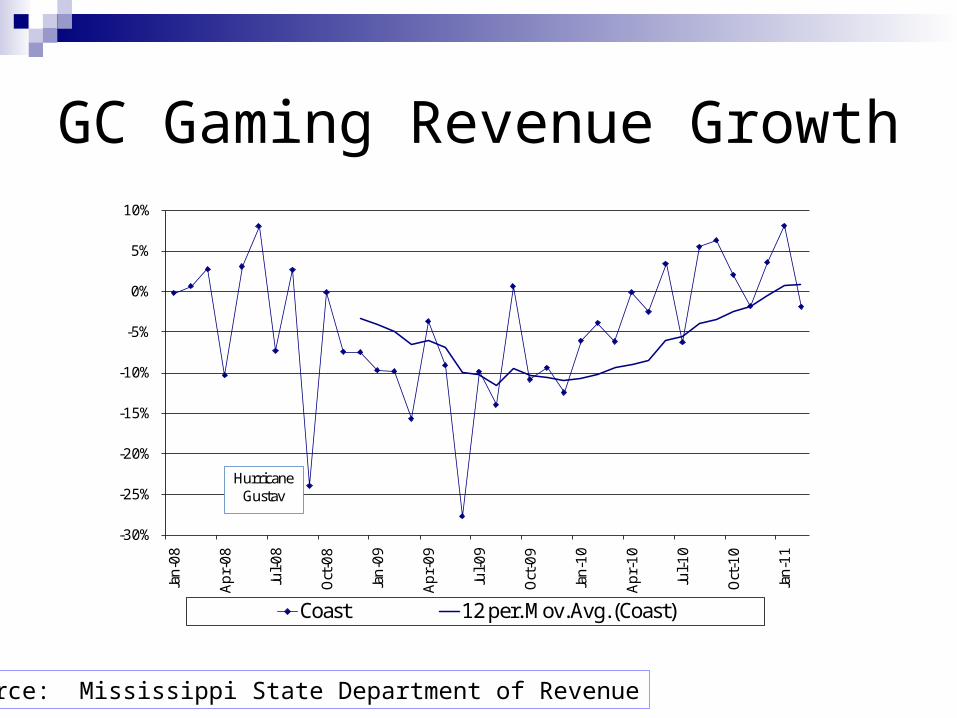
GC Gaming Revenue Growth
Source: Mississippi State Department of Revenue
-30%
-25%
-20%
-15%
-10%
-5%
0%
5%
10%
Jan
-08
Ap
r-0
8
Jul-
08
Oct
-08
Jan
-09
Ap
r-0
9
Jul-
09
Oct
-09
Jan
-10
Ap
r-1
0
Jul-
10
Oct
-10
Jan
-11
Coast 12 per. Mov. Avg. (Coast)
Hurricane Gustav
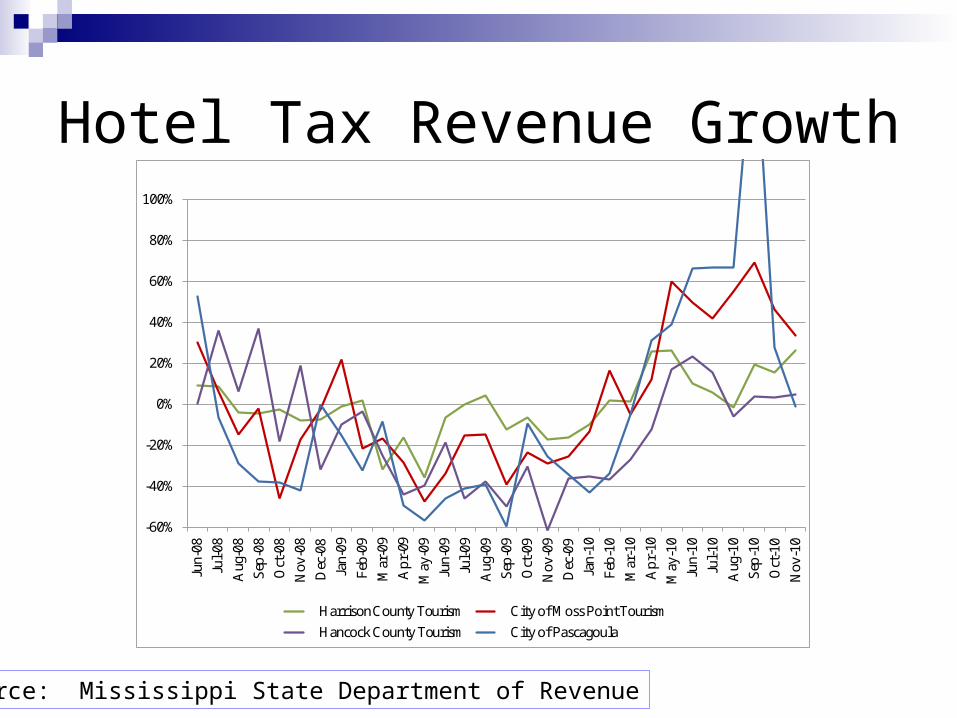
Hotel Tax Revenue Growth
Source: Mississippi State Department of Revenue
-60%
-40%
-20%
0%
20%
40%
60%
80%
100%Ju
n-08
Jul-
08
Aug
-08
Sep
-08
Oct
-08
Nov
-08
Dec
-08
Jan-
09
Feb
-09
Mar
-09
Ap
r-09
May
-09
Jun-
09
Jul-
09
Aug
-09
Sep
-09
Oct
-09
Nov
-09
Dec
-09
Jan-
10
Feb
-10
Mar
-10
Ap
r-10
May
-10
Jun-
10
Jul-
10
Aug
-10
Sep
-10
Oct
-10
Nov
-10
Harrison County Tourism City of Moss Point Tourism
Hancock County Tourism City of Pascagoula
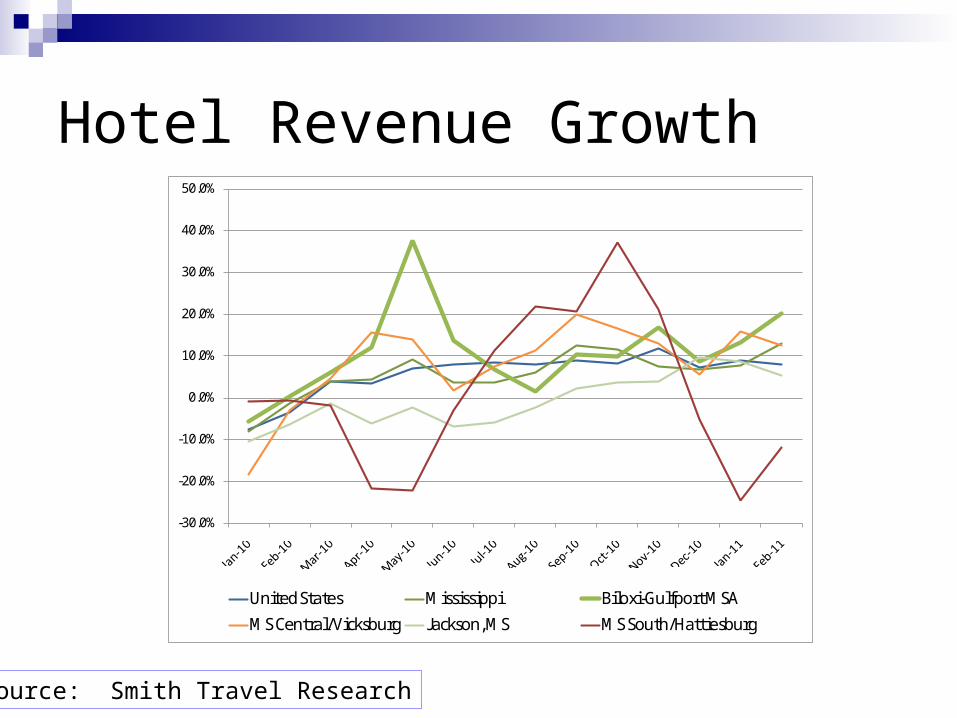
Hotel Revenue Growth
Source: Smith Travel Research
-30.0%
-20.0%
-10.0%
0.0%
10.0%
20.0%
30.0%
40.0%
50.0%
United States Mississippi Biloxi-Gulfport MSA
MS Central/Vicksburg Jackson, MS MS South/Hattiesburg
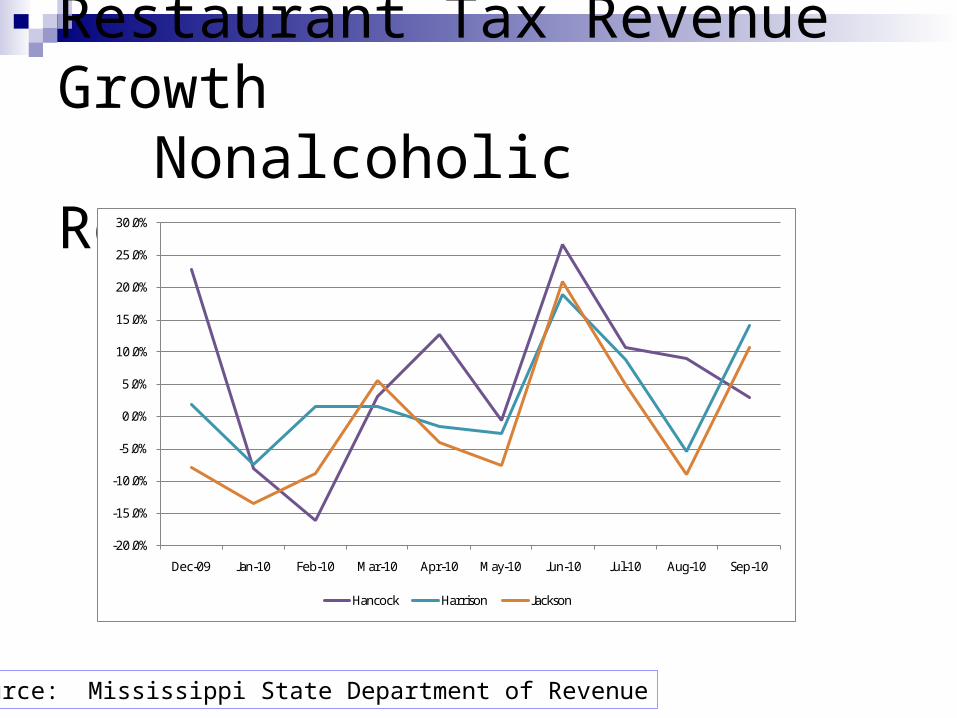
Restaurant Tax Revenue GrowthNonalcoholic Restaurants
Source: Mississippi State Department of Revenue
-20.0%
-15.0%
-10.0%
-5.0%
0.0%
5.0%
10.0%
15.0%
20.0%
25.0%
30.0%
Dec-09 Jan-10 Feb-10 Mar-10 Apr-10 May-10 Jun-10 Jul-10 Aug-10 Sep-10
Hancock Harrison Jackson
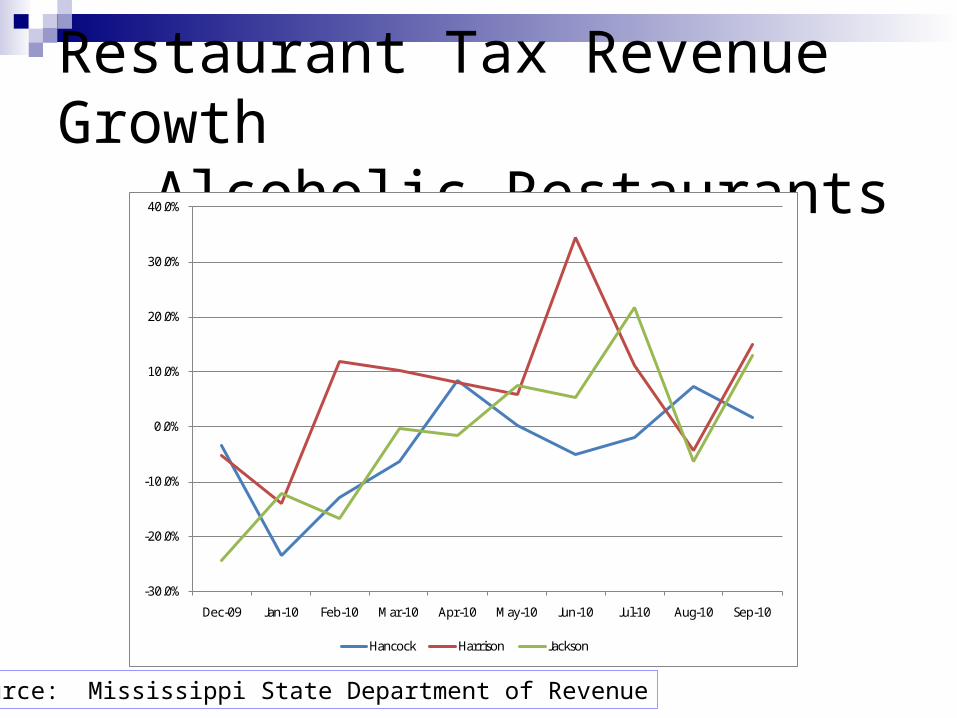
Restaurant Tax Revenue GrowthAlcoholic Restaurants
Source: Mississippi State Department of Revenue
-30.0%
-20.0%
-10.0%
0.0%
10.0%
20.0%
30.0%
40.0%
Dec-09 Jan-10 Feb-10 Mar-10 Apr-10 May-10 Jun-10 Jul-10 Aug-10 Sep-10
Hancock Harrison Jackson
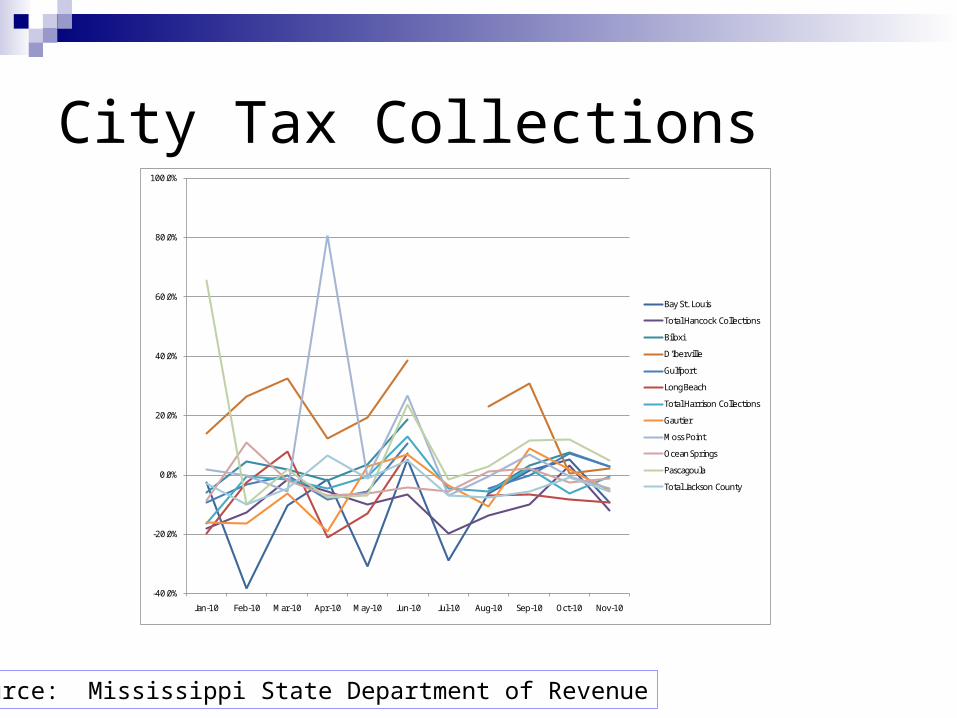
City Tax Collections
Source: Mississippi State Department of Revenue
-40.0%
-20.0%
0.0%
20.0%
40.0%
60.0%
80.0%
100.0%
Jan-10 Feb-10 Mar-10 Apr-10 May-10 Jun-10 Jul-10 Aug-10 Sep-10 Oct-10 Nov-10
Bay St. Louis
Total Hancock Collections
Biloxi
D'Iberville
Gulfport
Long Beach
Total Harrison Collections
Gautier
Moss Point
Ocean Springs
Pascagoula
Total Jackson County
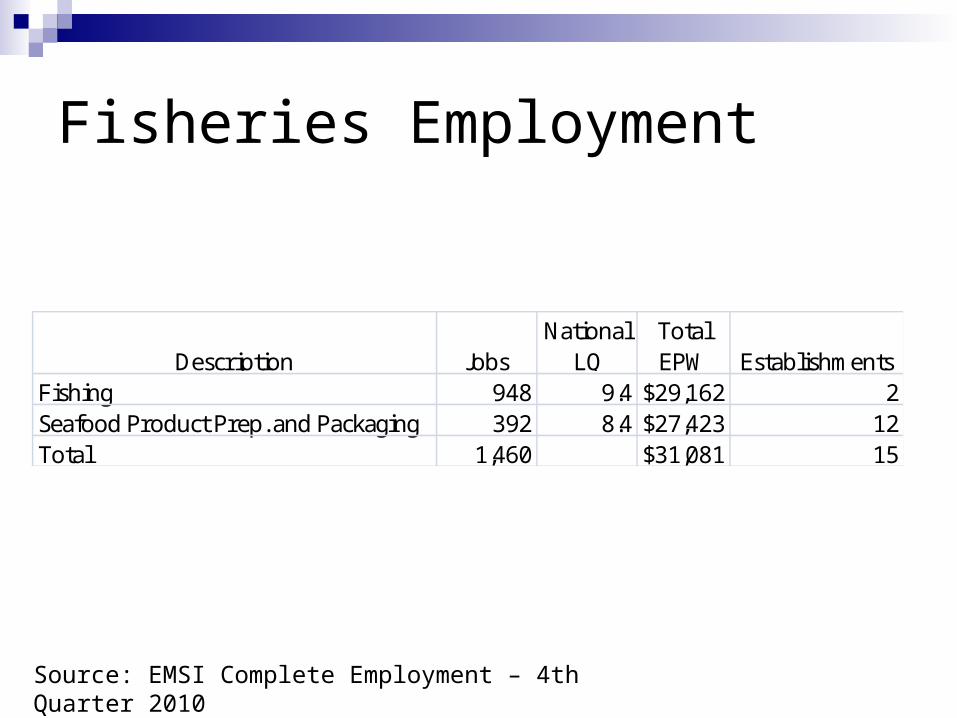
Fisheries Employment
Source: EMSI Complete Employment – 4th Quarter 2010
Description JobsNational
LQTotal EPW Establishments
Fishing 948 9.4 $29,162 2Seafood Product Prep. and Packaging 392 8.4 $27,423 12Total 1,460 $31,081 15
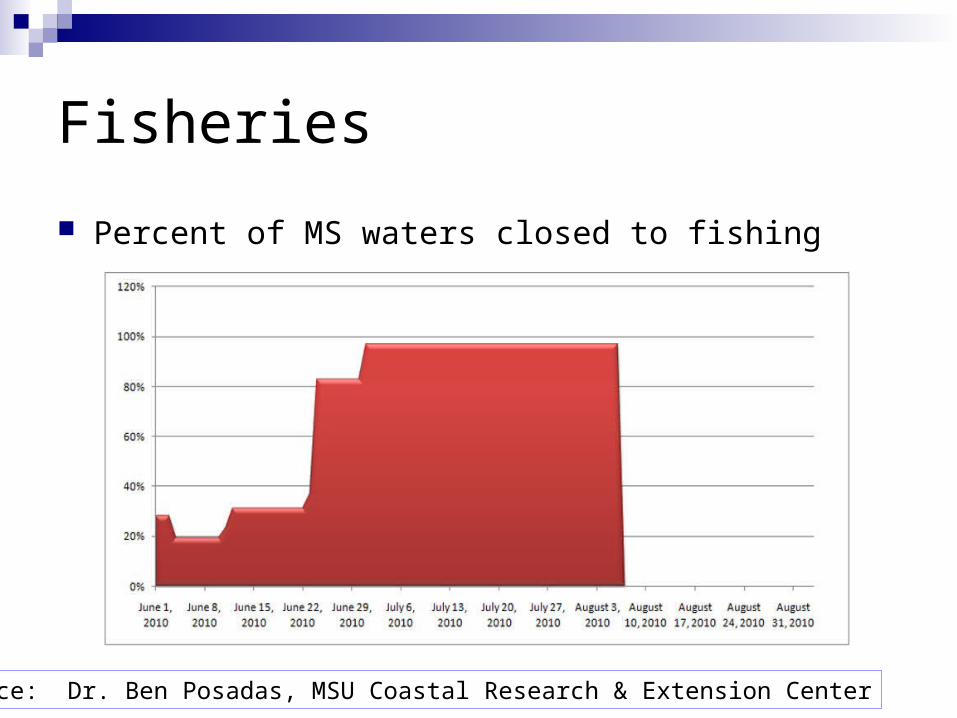
Fisheries
Percent of MS waters closed to fishing
Source: Dr. Ben Posadas, MSU Coastal Research & Extension Center
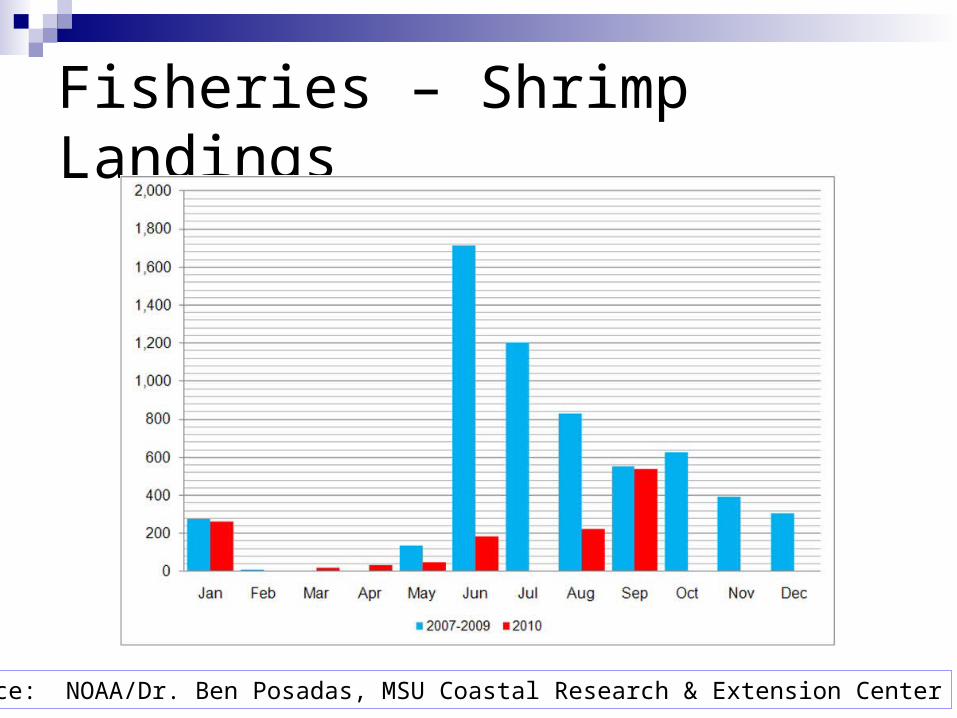
Fisheries – Shrimp Landings
Source: NOAA/Dr. Ben Posadas, MSU Coastal Research & Extension Center

Decoding the Trends
$30
$35
$40
$45
$50
$55
$60
$65
$70
$75
$80
Jan-10 Feb-10 Mar-10 Apr-10 May-10 Jun-10 Jul-10 Aug-10 Sep-10
Biloxi-Gulfport MSA
'negative'economic impact
Trend withoil spill
Trend withoutoil spill
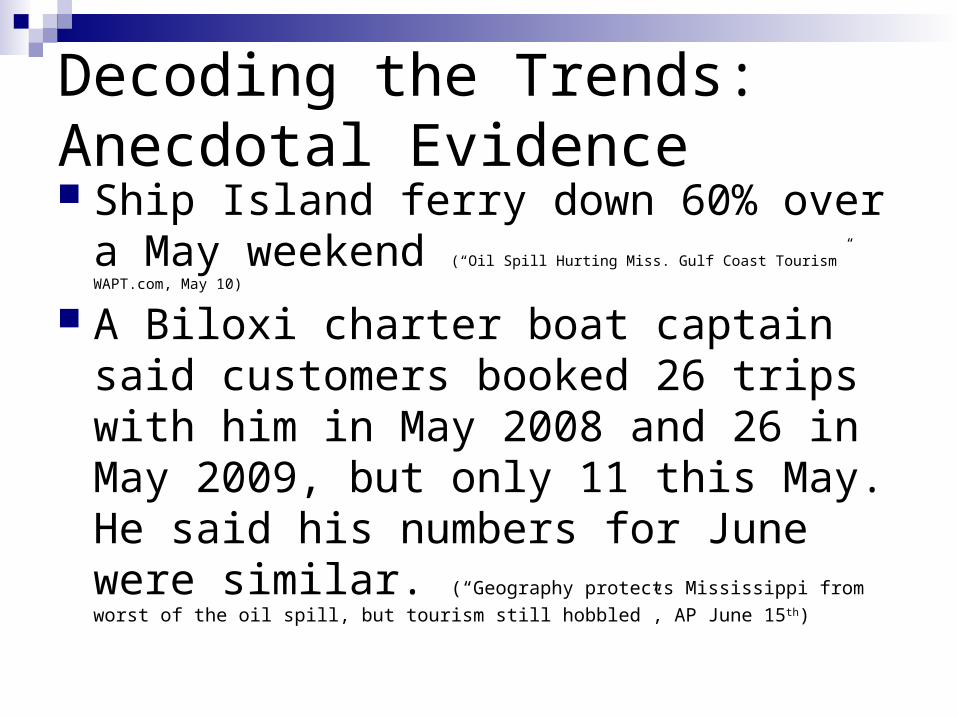
Decoding the Trends:Anecdotal Evidence Ship Island ferry down 60% over a May
weekend (“Oil Spill Hurting Miss. Gulf Coast Tourism” WAPT.com, May 10)
A Biloxi charter boat captain said customers booked 26 trips with him in May 2008 and 26 in May 2009, but only 11 this May. He said his numbers for June were similar. (“Geography protects Mississippi from worst of the oil spill, but tourism still
hobbled”, AP June 15th)
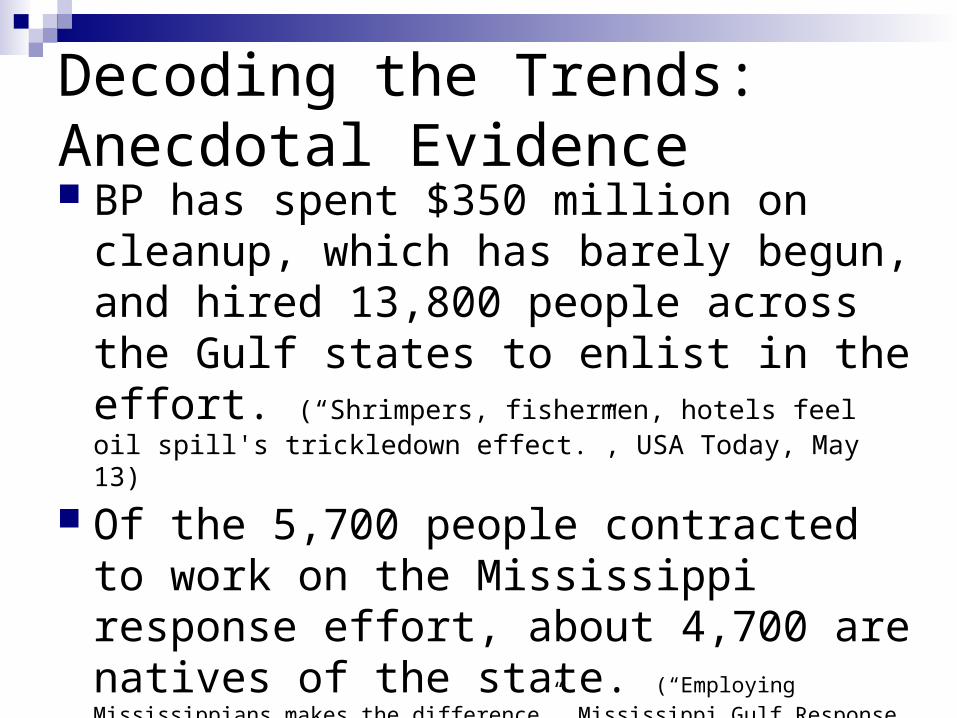
BP has spent $350 million on cleanup, which has barely begun, and hired 13,800 people across the Gulf states to enlist in the effort. (“Shrimpers, fishermen, hotels feel oil spill's trickledown effect.”, USA Today, May 13)
Of the 5,700 people contracted to work on the Mississippi response effort, about 4,700 are natives of the state. (“Employing Mississippians makes the
difference”, Mississippi Gulf Response (BP), June 21st)
Decoding the Trends:Anecdotal Evidence
Decoding the Trends
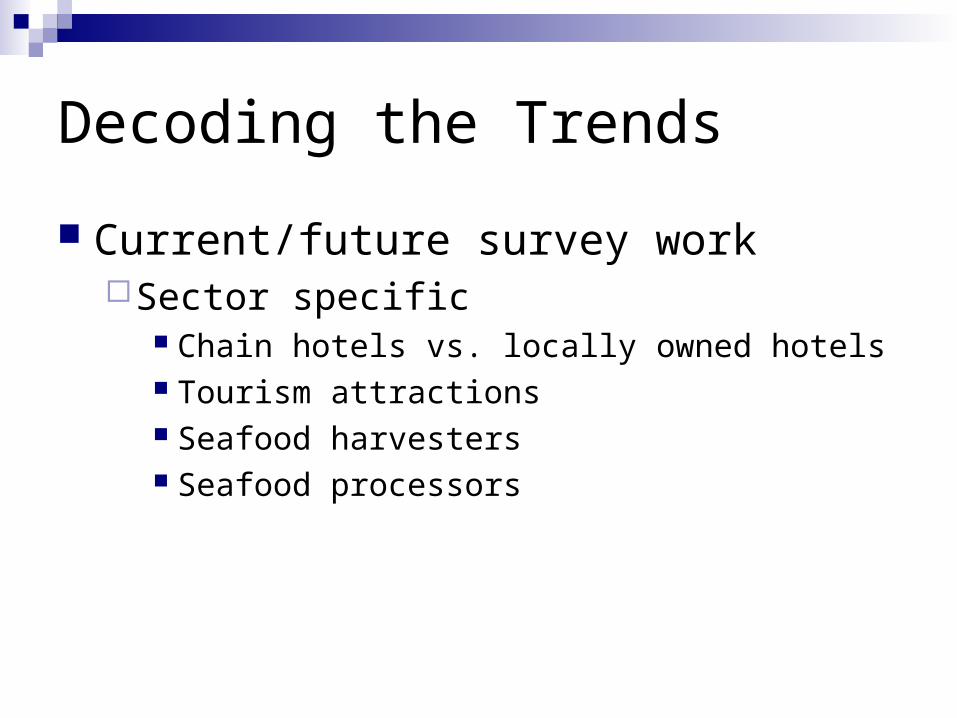
Current/future survey workSector specific
Chain hotels vs. locally owned hotels Tourism attractions Seafood harvesters Seafood processors

Decoding the Trends
Future survey work – looking forwardNational attitude surveys
Seafood safety/desirability Tourism
Soft adventurers (fishing, bird watching, etc.) may be less inclined to come to the Gulf Coast
Did Gulf Coast tourism customers find other regions to visit?
Decoding the Trends
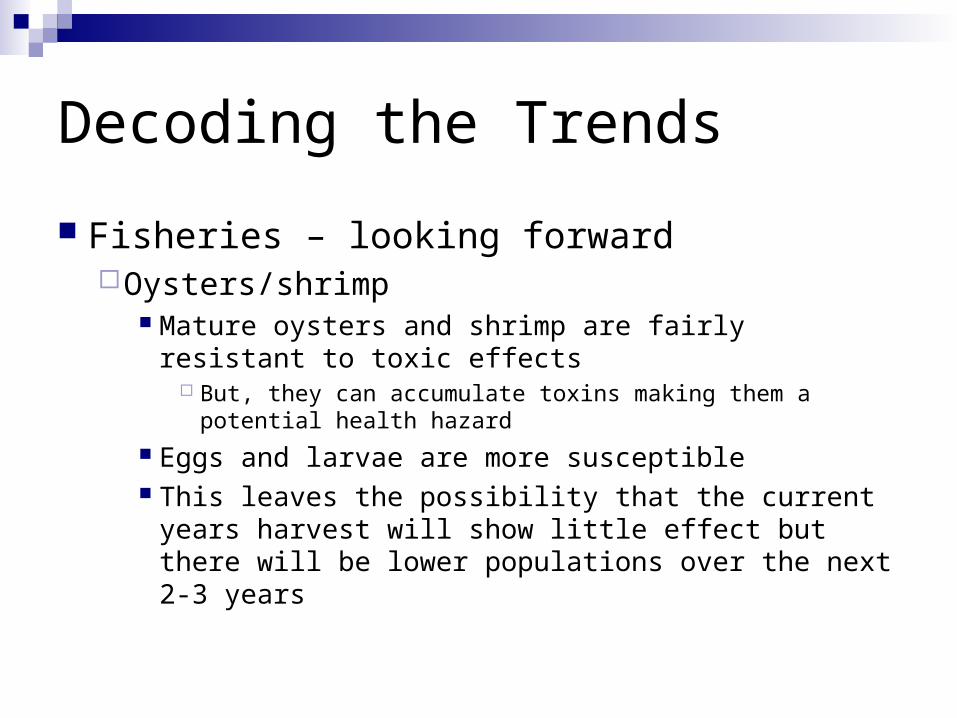
Fisheries – looking forwardOysters/shrimp
Mature oysters and shrimp are fairly resistant to toxic effects
But, they can accumulate toxins making them a potential health hazard
Eggs and larvae are more susceptible This leaves the possibility that the current years
harvest will show little effect but there will be lower populations over the next 2-3 years

Decoding the Trends
Fisheries – looking forwardFinfish
Mature finfish can swim away from the hazard This may cause a geographic shift in the harvest
Evidence from previous oil spills suggests that the finfish abundance will return relatively quickly
Decoding the Trends
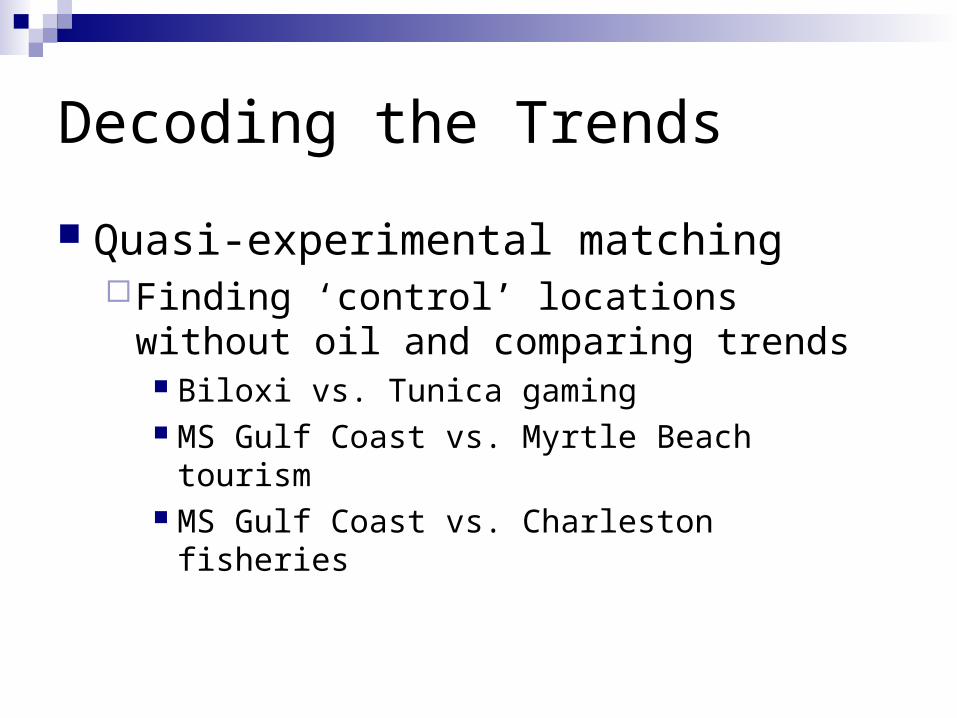
Quasi-experimental matchingFinding ‘control’ locations without oil and
comparing trends Biloxi vs. Tunica gaming MS Gulf Coast vs. Myrtle Beach tourism MS Gulf Coast vs. Charleston fisheries
Modeling the Impacts
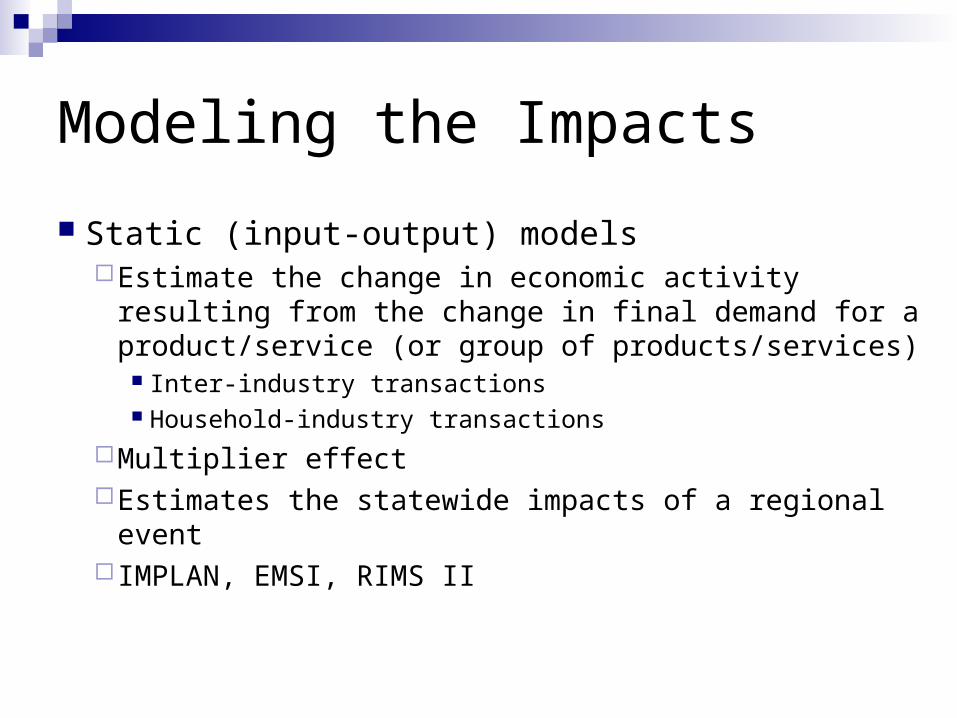
Static (input-output) modelsEstimate the change in economic activity resulting
from the change in final demand for a product/service (or group of products/services)
Inter-industry transactions Household-industry transactions
Multiplier effectEstimates the statewide impacts of a regional event IMPLAN, EMSI, RIMS II
Modeling the Impacts
Dynamic modelsBuilds upon input-output model allowing for changes
in price levels, labor mobility, etc.Estimates the statewide impacts of a regional event In addition to changes in final demand, inputs to the
model might include changes in prices, wage rates, imports, exports, etc.
Projects impacts into the futureREMI

Economic Effects of the Deepwater Horizon Oil Spill
Discussion/Questions