Embed Size (px)
Citation preview
The Bucharest University of Economic Studies The Faculty of Accounting and Management Information Technology
Romanian Society of Economic and Financial Analysis (RSEFA)
Economic-Financial Analysis and Valuation Real Estate Market Challenges
Scientific Symposium
Bucharest
Decembre 2013

2
Scientific Committee Ion ANGHEL – Bucharest Academy of Economic Studies Ioan BĂTRÂNCEA – “Babeș-Bolyai” University of Cluj Napoca Lucian BUȘE – University of Craiova Eduard DINU – Bucharest Academy of Economic Studies Silvia PETRESCU – “Al.I. Cuza” University of Iași Vasile ROBU – Bucharest Academy of Economic Studies Elena Claudia ȘERBAN – Bucharest Academy of Economic Studies Petru ȘTEFEA – West University of Timișoara
3
Contents The demographic evolution, the dynamics of the dwelling stock in Romania and the evolution of the real estates’ prices in Romania
Ion Anghel, Anca Maria Hristea ............................................................................................................................ 5 The challenges of banking system in the Romanian real estate market
Dan Dumitru Popescu ......................................................................................................................................... 13 Effects of the financial crisis and of the evolution of real estate market on the construction field in Romania
Mihaela Diana Oancea Negescu ........................................................................................................................ 27 Real estate market evolution trends in the context of the current economic crisis, integral part of the ecolonomic crisis
Ana Maria Popescu, Irina Daniela Cişmaşu ....................................................................................................... 41 Real estate market and evolution of interest for real estate credits
Adrian Anica-Popa .............................................................................................................................................. 51
Particularities of business generating real estate properties appraisal Ana Maria Popescu............................................................................................................................................. 63
Application of sensitivity analysis in estimating the value of the business Adrian Anica-Popa, Raluca-Florentina Creţu ...................................................................................................... 71
The income approach in the appraisal of real estate Raluca-Florentina Creţu, Ştefania-Cristina Curea .............................................................................................. 87
Accounting practices and treatments regarding the real estate assets. Reference points for the decisional process
Iulia David-Sobolevschi, Monica Aureliana Petcu, Ovidiu Bunget, Marian Lăpuşte ........................................... 97

4
Note: The authors are responsible for the content of their articles and for obtaining necessary permissions.
Text revision: Gabriela Ochiană Computerized drawing up: Nicoleta Bobocea Cover: Nicoleta Bobocea Subscriptions distribution: Mircea Dinu Tel./Fax: 021/210.73.10; 021/210.63.07
021/210.63.08
Data base indexation: EconLit http://www.aeaweb.org Research Papers in Economics (RePEc) http://www.ideas.repec.org http://econpapers.repec.org Directory of Open Access Journals (DOAJ) http: //www.doaj.org EBSCO Publishing http://www.ebscohost.com International Consortium for the Advancement of Academic Publication (ICAAP) http://www.icaap.org Cabell’s Directories http://www.cabells.com CNCSIS B+
www.economieteoreticasiaplicata.ro; www.ectap.ro
Reception of texts: [email protected]
ISSN 1841-8678 (Print)ISSN 1844-0029 (Online)
The demographic evolution, the dynamics of the dwelling stock in Romania and the evolution of the real estates’ prices in Romania
Ion ANGHEL The Bucharest University of Economic Studies [email protected] Anca Maria HRISTEA The Bucharest University of Economic Studies [email protected]
Abstract. The purpose of this research is to identify the changes of the demographic variables, the building of houses and prices of the real estates in order to have a basis of understanding and estimating the evolution of the real estate industry from our country. For this purpose we have chosen the three major components that we will analyze through the prism of their concomitant evolution after 1989. The result of the research shows us the existence of important correlations between the demographic variable, the evolution of the building and the prices of the real estates, as well as a pattern that emphasizes the economic cycle that is characteristic to the real estate industry. In conclusion the correlated analysis can offer a high potential for anticipating the future evolution of the real estate industry and of the construction field.
Keywords: evaluation; uncertainty; risk; real estate properties; demography. JEL Classification: L83, O18, Q56, R11, M15. REL Classification: 14I, 14K, 15B, 15E.
Theoretical and Applied Economics Volume XX (2013), Special Issue, pp. 5-12
Ion Anghel, Anca Maria Hristea 6
Introduction
Romania has gone through an important stage, a stage that unlikely to repeat in the years after 1989, especially through the fact that a vast majority of the real estates (residences, commercial, industrial, agricultural) has gone from the state’s property into private property.
We expect this stage to emphasize profound evolutions in the real estate field, regarding the demographic evolution and the dynamics of the housing fund and the prices of the real estates, the context being extremely volatile in the period we analyzed.
The study wants to emphasize how three major components in the understanding and estimation of the evolution of the real estate industry have evolved in the period after 1989, namely the demographic factor, the housing fund and the prices of the real estates.
1. The demographic evolution in Romania
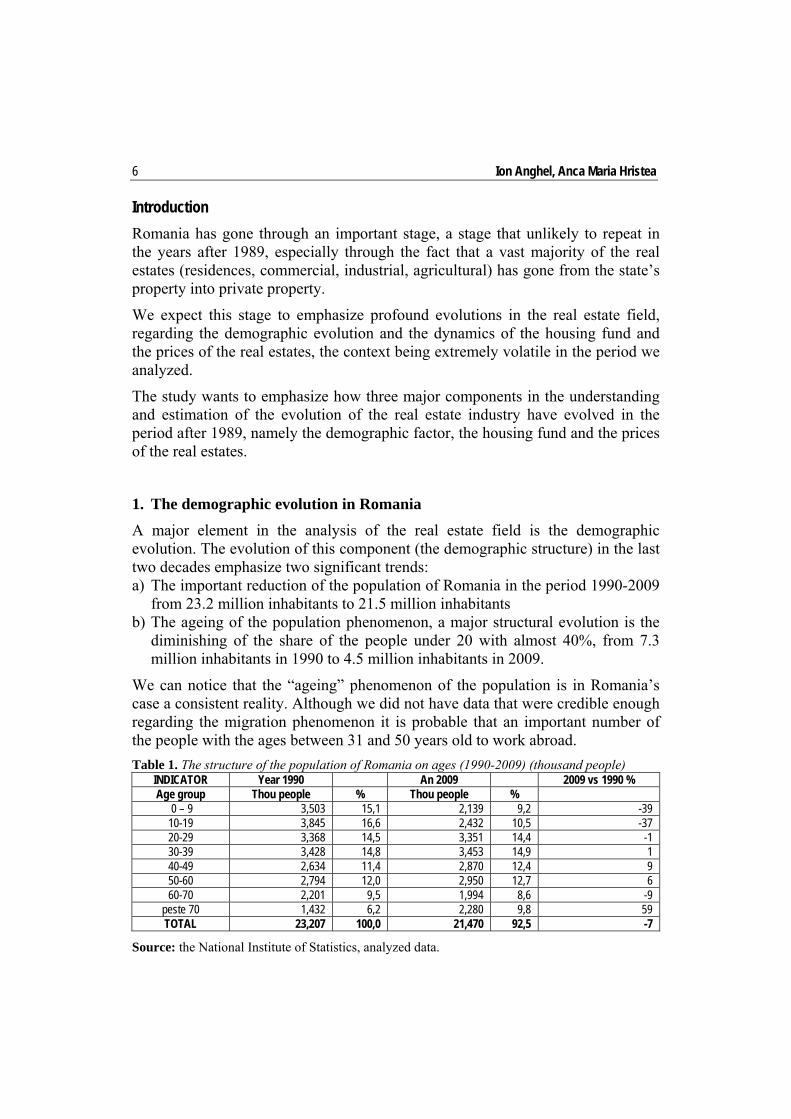
A major element in the analysis of the real estate field is the demographic evolution. The evolution of this component (the demographic structure) in the last two decades emphasize two significant trends: a) The important reduction of the population of Romania in the period 1990-2009
from 23.2 million inhabitants to 21.5 million inhabitants b) The ageing of the population phenomenon, a major structural evolution is the
diminishing of the share of the people under 20 with almost 40%, from 7.3 million inhabitants in 1990 to 4.5 million inhabitants in 2009.
We can notice that the “ageing” phenomenon of the population is in Romania’s case a consistent reality. Although we did not have data that were credible enough regarding the migration phenomenon it is probable that an important number of the people with the ages between 31 and 50 years old to work abroad.
Table 1. The structure of the population of Romania on ages (1990-2009) (thousand people) INDICATOR Year 1990 An 2009 2009 vs 1990 % Age group Thou people % Thou people %
0 – 9 3,503 15,1 2,139 9,2 -39 10-19 3,845 16,6 2,432 10,5 -37 20-29 3,368 14,5 3,351 14,4 -1 30-39 3,428 14,8 3,453 14,9 1 40-49 2,634 11,4 2,870 12,4 9 50-60 2,794 12,0 2,950 12,7 6 60-70 2,201 9,5 1,994 8,6 -9
peste 70 1,432 6,2 2,280 9,8 59 TOTAL 23,207 100,0 21,470 92,5 -7
Source: the National Institute of Statistics, analyzed data.
The demographic evolution, the dynamics of the dwelling stock in Romania
7
7
For the real estate developers, the structural analysis of the population is important because it offers useful data in the future decisions for development. Thus, in Romania the population between 31 and 50 years old represents the majority compoenent (about 6 million inhabitants), this category being followed by the population between 51 and 70 years old and the population under 20 years old (over 4.5 million inhabitants).
An important age category from the point of view of buying a fist dwelling (between 20 and 29 years old) is about 3.4 million inhabitants, in the conditions in which the number of new houses made in the real estate boom period was 50-60 thousand houses a year.
We must notice the fact that the share of the population over 70 years old increased significantly, being about 10% in 2009, namely 2.3 million inhabitants. This situation determines the increase of the demand for medicines and medical services and it represent a cause for the increasing demand for space from the part of pharmacies and medical clinics.
2. The evolution of the housing fund
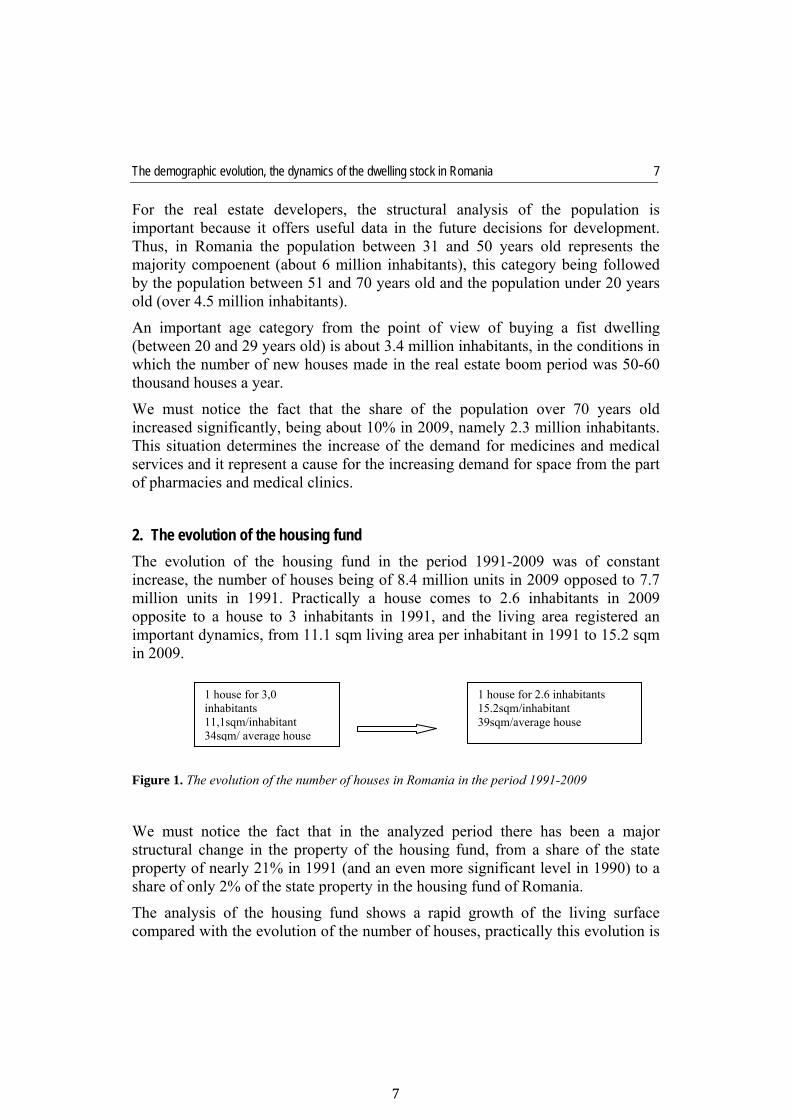
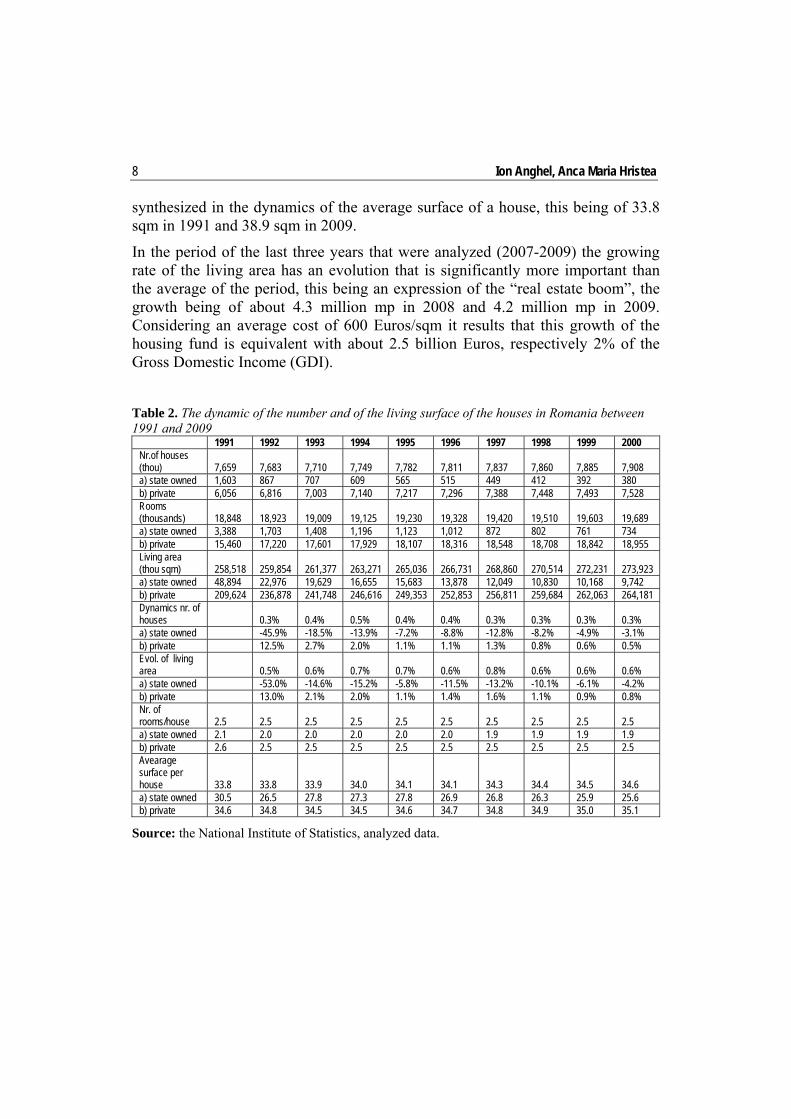
The evolution of the housing fund in the period 1991-2009 was of constant increase, the number of houses being of 8.4 million units in 2009 opposed to 7.7 million units in 1991. Practically a house comes to 2.6 inhabitants in 2009 opposite to a house to 3 inhabitants in 1991, and the living area registered an important dynamics, from 11.1 sqm living area per inhabitant in 1991 to 15.2 sqm in 2009.
Figure 1. The evolution of the number of houses in Romania in the period 1991-2009
We must notice the fact that in the analyzed period there has been a major structural change in the property of the housing fund, from a share of the state property of nearly 21% in 1991 (and an even more significant level in 1990) to a share of only 2% of the state property in the housing fund of Romania.
The analysis of the housing fund shows a rapid growth of the living surface compared with the evolution of the number of houses, practically this evolution is
1 house for 3,0 inhabitants 11,1sqm/inhabitant 34sqm/ average house
1 house for 2.6 inhabitants 15.2sqm/inhabitant 39sqm/average house
Ion Anghel, Anca Maria Hristea 8
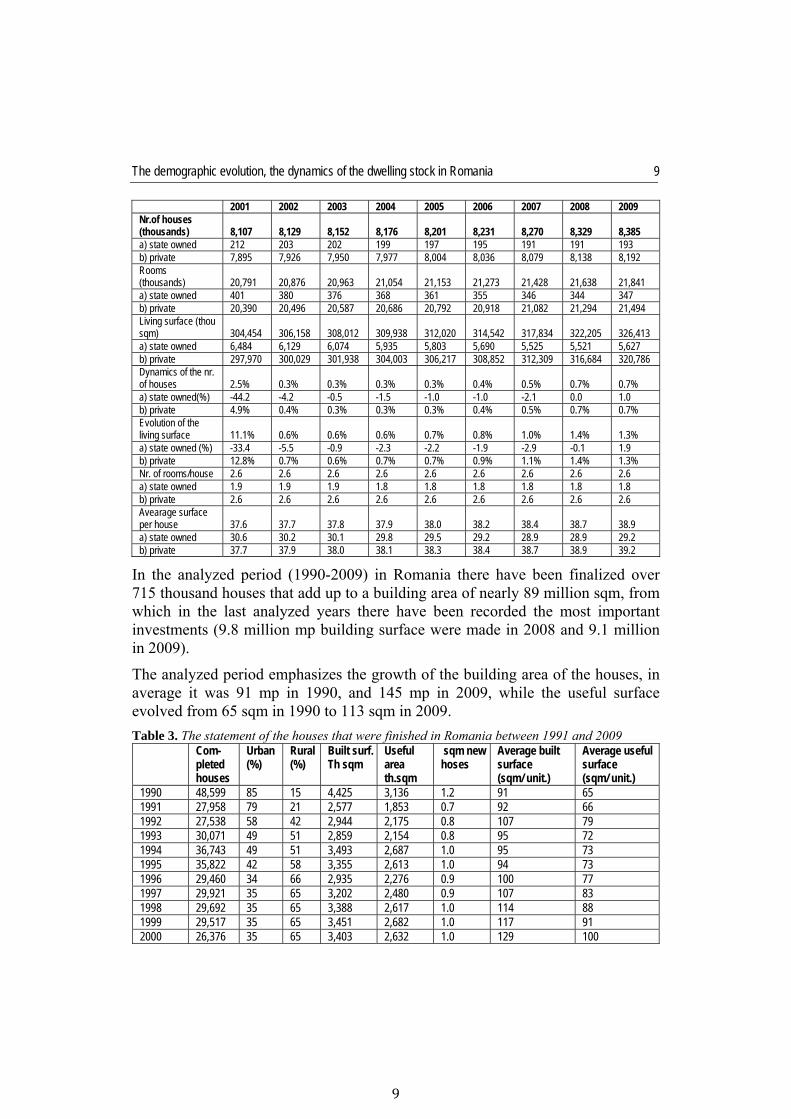
synthesized in the dynamics of the average surface of a house, this being of 33.8 sqm in 1991 and 38.9 sqm in 2009.
In the period of the last three years that were analyzed (2007-2009) the growing rate of the living area has an evolution that is significantly more important than the average of the period, this being an expression of the “real estate boom”, the growth being of about 4.3 million mp in 2008 and 4.2 million mp in 2009. Considering an average cost of 600 Euros/sqm it results that this growth of the housing fund is equivalent with about 2.5 billion Euros, respectively 2% of the Gross Domestic Income (GDI).
Table 2. The dynamic of the number and of the living surface of the houses in Romania between 1991 and 2009
1991 1992 1993 1994 1995 1996 1997 1998 1999 2000 Nr.of houses (thou) 7,659 7,683 7,710 7,749 7,782 7,811 7,837 7,860 7,885 7,908 a) state owned 1,603 867 707 609 565 515 449 412 392 380 b) private 6,056 6,816 7,003 7,140 7,217 7,296 7,388 7,448 7,493 7,528 Rooms (thousands) 18,848 18,923 19,009 19,125 19,230 19,328 19,420 19,510 19,603 19,689 a) state owned 3,388 1,703 1,408 1,196 1,123 1,012 872 802 761 734 b) private 15,460 17,220 17,601 17,929 18,107 18,316 18,548 18,708 18,842 18,955 Living area (thou sqm) 258,518 259,854 261,377 263,271 265,036 266,731 268,860 270,514 272,231 273,923 a) state owned 48,894 22,976 19,629 16,655 15,683 13,878 12,049 10,830 10,168 9,742 b) private 209,624 236,878 241,748 246,616 249,353 252,853 256,811 259,684 262,063 264,181 Dynamics nr. of houses 0.3% 0.4% 0.5% 0.4% 0.4% 0.3% 0.3% 0.3% 0.3% a) state owned -45.9% -18.5% -13.9% -7.2% -8.8% -12.8% -8.2% -4.9% -3.1% b) private 12.5% 2.7% 2.0% 1.1% 1.1% 1.3% 0.8% 0.6% 0.5% Evol. of living area 0.5% 0.6% 0.7% 0.7% 0.6% 0.8% 0.6% 0.6% 0.6% a) state owned -53.0% -14.6% -15.2% -5.8% -11.5% -13.2% -10.1% -6.1% -4.2% b) private 13.0% 2.1% 2.0% 1.1% 1.4% 1.6% 1.1% 0.9% 0.8% Nr. of rooms/house 2.5 2.5 2.5 2.5 2.5 2.5 2.5 2.5 2.5 2.5 a) state owned 2.1 2.0 2.0 2.0 2.0 2.0 1.9 1.9 1.9 1.9 b) private 2.6 2.5 2.5 2.5 2.5 2.5 2.5 2.5 2.5 2.5 Avearage surface per house 33.8 33.8 33.9 34.0 34.1 34.1 34.3 34.4 34.5 34.6 a) state owned 30.5 26.5 27.8 27.3 27.8 26.9 26.8 26.3 25.9 25.6 b) private 34.6 34.8 34.5 34.5 34.6 34.7 34.8 34.9 35.0 35.1
Source: the National Institute of Statistics, analyzed data.
The demographic evolution, the dynamics of the dwelling stock in Romania
9
9
2001 2002 2003 2004 2005 2006 2007 2008 2009 Nr.of houses (thousands) 8,107 8,129 8,152 8,176 8,201 8,231 8,270 8,329 8,385 a) state owned 212 203 202 199 197 195 191 191 193 b) private 7,895 7,926 7,950 7,977 8,004 8,036 8,079 8,138 8,192 Rooms (thousands) 20,791 20,876 20,963 21,054 21,153 21,273 21,428 21,638 21,841 a) state owned 401 380 376 368 361 355 346 344 347 b) private 20,390 20,496 20,587 20,686 20,792 20,918 21,082 21,294 21,494 Living surface (thou sqm) 304,454 306,158 308,012 309,938 312,020 314,542 317,834 322,205 326,413 a) state owned 6,484 6,129 6,074 5,935 5,803 5,690 5,525 5,521 5,627 b) private 297,970 300,029 301,938 304,003 306,217 308,852 312,309 316,684 320,786 Dynamics of the nr. of houses 2.5% 0.3% 0.3% 0.3% 0.3% 0.4% 0.5% 0.7% 0.7% a) state owned(%) -44.2 -4.2 -0.5 -1.5 -1.0 -1.0 -2.1 0.0 1.0 b) private 4.9% 0.4% 0.3% 0.3% 0.3% 0.4% 0.5% 0.7% 0.7% Evolution of the living surface 11.1% 0.6% 0.6% 0.6% 0.7% 0.8% 1.0% 1.4% 1.3% a) state owned (%) -33.4 -5.5 -0.9 -2.3 -2.2 -1.9 -2.9 -0.1 1.9 b) private 12.8% 0.7% 0.6% 0.7% 0.7% 0.9% 1.1% 1.4% 1.3% Nr. of rooms/house 2.6 2.6 2.6 2.6 2.6 2.6 2.6 2.6 2.6 a) state owned 1.9 1.9 1.9 1.8 1.8 1.8 1.8 1.8 1.8 b) private 2.6 2.6 2.6 2.6 2.6 2.6 2.6 2.6 2.6 Avearage surface per house 37.6 37.7 37.8 37.9 38.0 38.2 38.4 38.7 38.9 a) state owned 30.6 30.2 30.1 29.8 29.5 29.2 28.9 28.9 29.2 b) private 37.7 37.9 38.0 38.1 38.3 38.4 38.7 38.9 39.2
In the analyzed period (1990-2009) in Romania there have been finalized over 715 thousand houses that add up to a building area of nearly 89 million sqm, from which in the last analyzed years there have been recorded the most important investments (9.8 million mp building surface were made in 2008 and 9.1 million in 2009).
The analyzed period emphasizes the growth of the building area of the houses, in average it was 91 mp in 1990, and 145 mp in 2009, while the useful surface evolved from 65 sqm in 1990 to 113 sqm in 2009.
Table 3. The statement of the houses that were finished in Romania between 1991 and 2009 Com-
pleted houses
Urban (%)
Rural (%)
Built surf. Th sqm
Useful area th.sqm
sqm new hoses
Average built surface (sqm/ unit.)
Average useful surface (sqm/ unit.)
1990 48,599 85 15 4,425 3,136 1.2 91 65 1991 27,958 79 21 2,577 1,853 0.7 92 66 1992 27,538 58 42 2,944 2,175 0.8 107 79 1993 30,071 49 51 2,859 2,154 0.8 95 72 1994 36,743 49 51 3,493 2,687 1.0 95 73 1995 35,822 42 58 3,355 2,613 1.0 94 73 1996 29,460 34 66 2,935 2,276 0.9 100 77 1997 29,921 35 65 3,202 2,480 0.9 107 83 1998 29,692 35 65 3,388 2,617 1.0 114 88 1999 29,517 35 65 3,451 2,682 1.0 117 91 2000 26,376 35 65 3,403 2,632 1.0 129 100
Ion Anghel, Anca Maria Hristea 10
Com-pleted houses
Urban (%)
Rural (%)
Built surf. Th sqm
Useful area th.sqm
sqm new hoses
Average built surface (sqm/ unit.)
Average useful surface (sqm/ unit.)
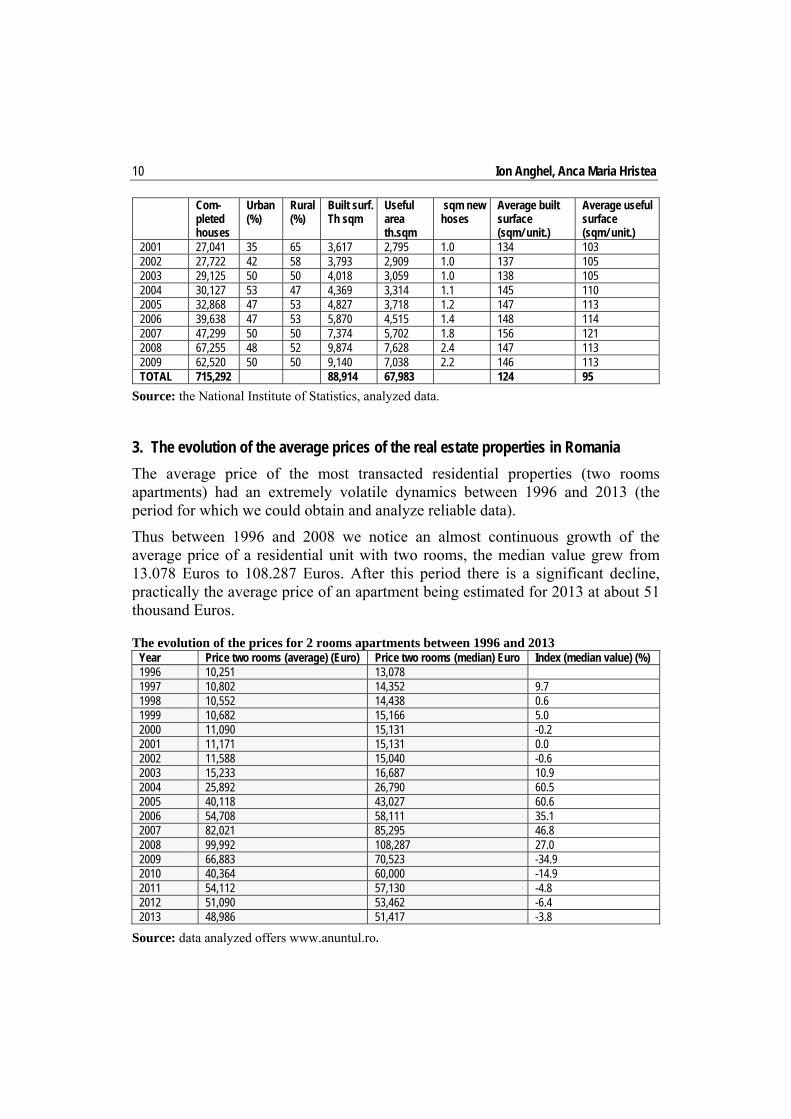
2001 27,041 35 65 3,617 2,795 1.0 134 103 2002 27,722 42 58 3,793 2,909 1.0 137 105 2003 29,125 50 50 4,018 3,059 1.0 138 105 2004 30,127 53 47 4,369 3,314 1.1 145 110 2005 32,868 47 53 4,827 3,718 1.2 147 113 2006 39,638 47 53 5,870 4,515 1.4 148 114 2007 47,299 50 50 7,374 5,702 1.8 156 121 2008 67,255 48 52 9,874 7,628 2.4 147 113 2009 62,520 50 50 9,140 7,038 2.2 146 113 TOTAL 715,292 88,914 67,983 124 95
Source: the National Institute of Statistics, analyzed data.
3. The evolution of the average prices of the real estate properties in Romania
The average price of the most transacted residential properties (two rooms apartments) had an extremely volatile dynamics between 1996 and 2013 (the period for which we could obtain and analyze reliable data).
Thus between 1996 and 2008 we notice an almost continuous growth of the average price of a residential unit with two rooms, the median value grew from 13.078 Euros to 108.287 Euros. After this period there is a significant decline, practically the average price of an apartment being estimated for 2013 at about 51 thousand Euros.
The evolution of the prices for 2 rooms apartments between 1996 and 2013 Year Price two rooms (average) (Euro) Price two rooms (median) Euro Index (median value) (%) 1996 10,251 13,0781997 10,802 14,352 9.71998 10,552 14,438 0.61999 10,682 15,166 5.02000 11,090 15,131 -0.22001 11,171 15,131 0.02002 11,588 15,040 -0.62003 15,233 16,687 10.92004 25,892 26,790 60.52005 40,118 43,027 60.62006 54,708 58,111 35.12007 82,021 85,295 46.82008 99,992 108,287 27.02009 66,883 70,523 -34.92010 40,364 60,000 -14.92011 54,112 57,130 -4.82012 51,090 53,462 -6.42013 48,986 51,417 -3.8
Source: data analyzed offers www.anuntul.ro.
The demographic evolution, the dynamics of the dwelling stock in Romania
11
11
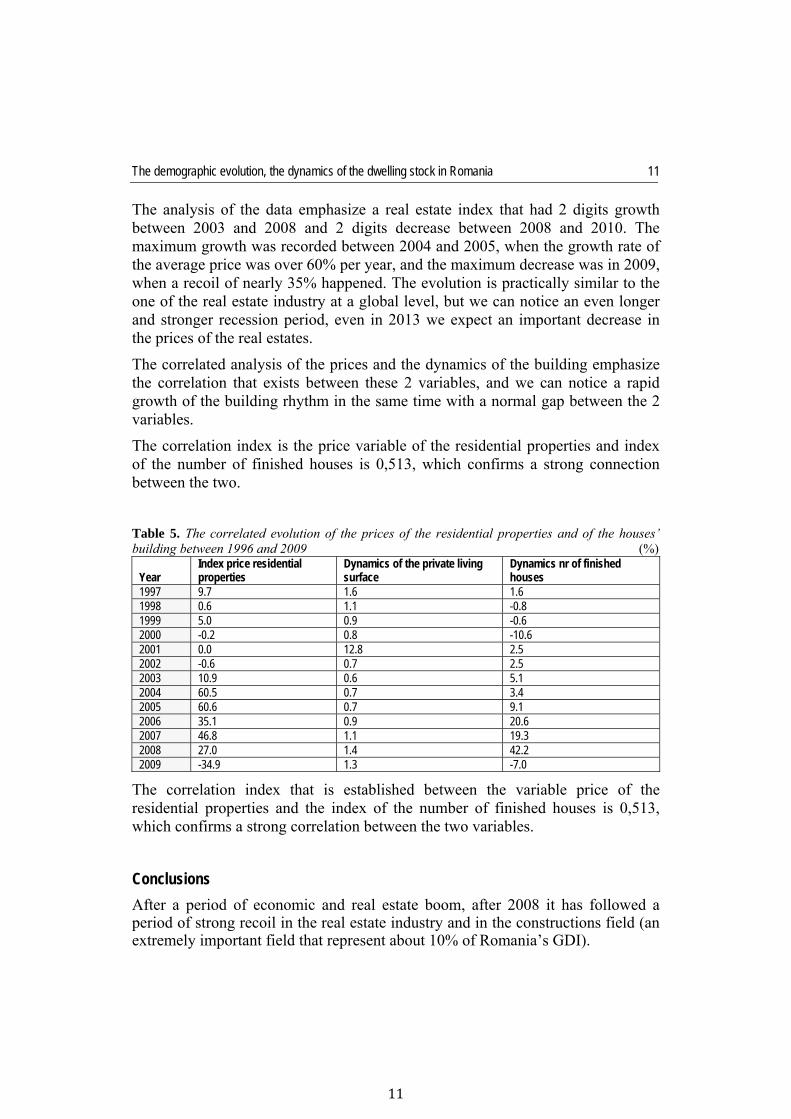
The analysis of the data emphasize a real estate index that had 2 digits growth between 2003 and 2008 and 2 digits decrease between 2008 and 2010. The maximum growth was recorded between 2004 and 2005, when the growth rate of the average price was over 60% per year, and the maximum decrease was in 2009, when a recoil of nearly 35% happened. The evolution is practically similar to the one of the real estate industry at a global level, but we can notice an even longer and stronger recession period, even in 2013 we expect an important decrease in the prices of the real estates.
The correlated analysis of the prices and the dynamics of the building emphasize the correlation that exists between these 2 variables, and we can notice a rapid growth of the building rhythm in the same time with a normal gap between the 2 variables.
The correlation index is the price variable of the residential properties and index of the number of finished houses is 0,513, which confirms a strong connection between the two.
Table 5. The correlated evolution of the prices of the residential properties and of the houses’ building between 1996 and 2009 (%)
Year Index price residential properties
Dynamics of the private living surface
Dynamics nr of finished houses
1997 9.7 1.6 1.61998 0.6 1.1 -0.81999 5.0 0.9 -0.62000 -0.2 0.8 -10.62001 0.0 12.8 2.52002 -0.6 0.7 2.52003 10.9 0.6 5.12004 60.5 0.7 3.42005 60.6 0.7 9.12006 35.1 0.9 20.62007 46.8 1.1 19.32008 27.0 1.4 42.22009 -34.9 1.3 -7.0
The correlation index that is established between the variable price of the residential properties and the index of the number of finished houses is 0,513, which confirms a strong correlation between the two variables.
Conclusions
After a period of economic and real estate boom, after 2008 it has followed a period of strong recoil in the real estate industry and in the constructions field (an extremely important field that represent about 10% of Romania’s GDI).
Ion Anghel, Anca Maria Hristea 12
The purpose of this research was to identify the evolution of a three variables set that are considered to be correlated: the demographic evolution, the dynamics of the construction of houses and the evolution in the real estate prices, in order to have an understanding and estimation basis for the next evolution of the real estate industry in our country.
The three analyzed components indicate the existence of some important correlations between the demographic evolution, the construction rhythm and the prices of the real estates. The correlation index between the prices of the residential properties and the evolution of the number of finished houses is 0.513, which confirms a positive and strong correlation between the two.
The research also emphasized a pattern that confirms the existence of an economic cycle that is characteristic to the real estate industry, which is marked by an increased volatility. In conclusion, the correlated analysis of the three components can offer a high potential to anticipate the future evolution of the real estate industry and of the construction field.
References Anghel, I., Onofrei, M. (2013). Dezvoltarea proprietăților imobiliare, Editura Economică,
București, 2013 Anghel, I. (coordinator) Negescu, O.M., Anica-Popa, A., Popescu, A.M. (2010). Evaluarea
Întreprinderii, Editura Economică, pp. 161-162, 217-220 Anica-Popa, A., Motofei, Cătălina (2010). „Înfiinţarea şi modernizarea diferitelor tipuri de
infrastructuri şi implicaţiile asupra actorilor din industria materialelor de construcţii”, Romanian Statistical Review Supliment, nr. 3, pp. 266-272
Bernanke, B. (2007). Housing, Housing Finance and Monetary Policy, speech at the Federal Reserve Bank of Kansas City’s Economic Symposium, Jackson Hole, Wyoming. Creţu, Raluca Florentina, Şerban, Elena Claudia (2011). “Analysis of the facts that have generated
crisis and their impact on the SMEs in Romania”, Universitatea “Lucian Blaga” din Sibiu, Facultatea de Stiinţe Economice, Conferinţă ISI Procedings, 18th International Economic Conference IECS 2011 „Crises after the crisis. Inquiries from a national, European and global perspective” Sibiu, România, May 19-20, 2011, ISBN CD 978-606-12-0139-6, pp. 160-166, categoria A, lucrare publicată în Revista Economica indexată BDI, http://iecs.ulbsibiu.ro/archive/2011/iecs_2011_program.pdf, http://economice.ulbsibiu.ro/revista. economica/archive/RE%202-55-2011.pdf accesată în 5.11.2012;
Popescu, D.D. (2009). “Market risk assessment of a bank. Methods and measurements”, Theoretical and Applied Economics-Supplement, Economic-Financial Analysis and Property Valuation, Bucharest May 29-31
Institutul Naţional de Statistică (2011). Anuarul statistic al României, ediţia 2011 Urban Land Institute and Pwc, Emerging Trends in Real Estate® Europe 2012
The challenges of banking system in the Romanian real estate market
Dan Dumitru POPESCU The Bucharest University of Economic Studies [email protected]
Abstract. The turmoil triggered by tensions in the US subprime mortgage market is only the latest instance of financial markets disruptions of the past decades that showed the dysfunctions and vulnerabilities of the global financial system and the threat financial crises can pose to the real economy. With unpredictable economies and highly volatile financial markets, the European banking system is facing some of its toughest tests. According to the Global Financial Stability Report (GFSR) published by IMF in April 2011, the financial crisis generated by the collapse of the housing market may be more severe and persistent than other types of crisis. IMF considers that periods of “ups and downs” on the housing market may be determined by excessive competition between the financial institu-tions, inadequate regulation and supervision, massive flows of foreign capital, low monetary policy rates for long periods as well as the increase of the population’s average revenues. In the past few years, with FDIs dried up and an insufficient amount of local savings, Romanian banks have resorted more and more to lending from the central bank. It comes therefore that local banks place liquidity as the second highest risk threatening the local banking industry. With a significant portion of outstanding loans set to re-gear towards the second half of 2012, new loans will be highly restrictive to proven, prime institutional stock in established locations. New development financing for all sectors will continue to be extremely scarce in the absence of significant, secured pre-leasing. Considering the newly-enforced loan-to-value borrowing criteria and the increase in lending margins, many investment funds, especially the opportunistic ones, will face the need of readjusting their return expectations and investment strategies in terms of new geographies and asset classes. Prime real estate investment products continue to represent the sole target for the core institutional investors “flight to quality” in an attempt to hedge against medium- and long-term inflationary prospects. In the context of the announced Romanian GDP growth above the European Union average and the increase availability of prime stock, we foresee an improved attractiveness for the Romanian market, although the actual transaction activity will remain highly dependent on global macro economic factors and debt financing.
Keywords: bank competition; bank funding; banks; cost of funding (of banks); cost of housing loans; debt service; housing finance; loan maturity; loan-to-value ratio; monetary policy transmission; mortgage; retail deposits; securitization. JEL Classification: D53, E3, E5, E42, E44, E51, E52, E58, G01, G21, R21.
Theoretical and Applied Economics Volume XX (2013), Special Issue, pp. 13-26
Dan Dumitru Popescu 14
Introduction
The turmoil triggered by tensions in the US subprime mortgage market is only the latest instance of financial markets disruptions of the past decades that showed the dysfunctions and vulnerabilities of the global financial system and the threat financial crises can pose to the real economy. Ever since the Asian Financial Crisis, concerns have risen over whether policy-makers have sufficient tools to maintain financial stability. With unpredictable economies and highly volatile financial markets, the European banking system is facing some of its toughest tests.
Faced with unprecedented challenges to the financial, budgetary and real sectors alike, EU policymakers decided to broaden the economic policy coordination framework by: (i) introducing stricter and proactive monitoring of fiscal and macroeconomic imbalances; (ii) strengthening the corrective measures for fiscal slippages; (iii) making additional funds available to Member States; (iv) rendering the European rescue funds more flexible. Greece was also on the agenda with debt restructuring and the second economic adjustment program. The ECB decided to conduct three-year refinancing operations (December 2011 and February 2012) and to cut the policy rate to 0.75 percent in July 2012 in order to prevent any disorderly developments in lending conditions across the EU. Before the crisis, local banks had an excess of liquidity due to the foreign direct investments (FDI) flows which rushed towards Romania and the National Bank struggled to sterilize this massive amount of foreign currency, which strengthened the RON, but had also an inflationary effect. The financial crisis which hit the system at the end of 2008 supported NBR’s increasingly restrictive monetary policy. In the past few years, with FDIs dried up and an insufficient amount of local savings, Romanian banks have resorted more and more to lending from the central bank. It comes therefore that local banks place liquidity as the second highest risk threatening the local banking industry. In close connection to that risk there is the capital availability vulnerability as local bankers are preoccupied that, with new capital adequacy regulations to be enforced at European level, their mother banks might tighten up the financing tap and the whole CEE region could be confronted with another credit crunch The banks should be seeking to rebuild shattered trust and confidence, rein in costs, focus on core businesses, absorb regulatory demands, increase lending and de-risk the balance sheet, all while delivering improved shareholder returns. The new regulations issued by the central bank significantly tightened the conditions of mortgage lending terms; commercial banks reduced the financing of real estate needs and began to redirect towards short-term loans, less risky in times of financial uncertainty. The financial crisis can be seen as an opportunity for banks to balance their portfolio by redirecting towards innovative products and services, ultimately benefiting the end consumer. This turning point
The challenges of banking system in the Romanian real estate market
15
15
will also determine competitors to look at cost positions with the interest invested previously in market share expansion. Another top risk identified by Romanian bankers is the macro-economic one, in close connection with the sovereign debts turmoil in the Euro zone which might spill-over towards Romania and could push the local economy back into recession. On top of that, bankers fear that political interference and new prudential regulation are straining even further the scarce resources available and making it more difficult to maintain profitability and supply credit to the economy in order to finance the economic recovery.
The status of the real estate and banking market
Economic climate
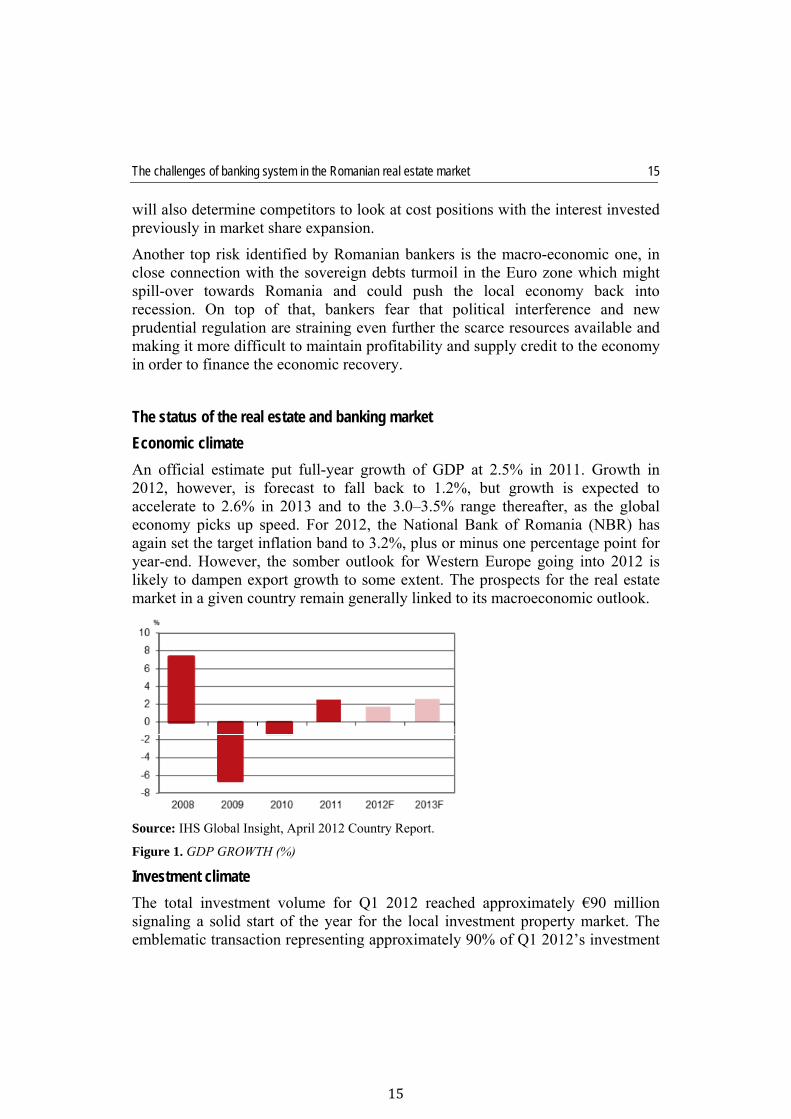
An official estimate put full-year growth of GDP at 2.5% in 2011. Growth in 2012, however, is forecast to fall back to 1.2%, but growth is expected to accelerate to 2.6% in 2013 and to the 3.0–3.5% range thereafter, as the global economy picks up speed. For 2012, the National Bank of Romania (NBR) has again set the target inflation band to 3.2%, plus or minus one percentage point for year-end. However, the somber outlook for Western Europe going into 2012 is likely to dampen export growth to some extent. The prospects for the real estate market in a given country remain generally linked to its macroeconomic outlook.
Source: IHS Global Insight, April 2012 Country Report.
Figure 1. GDP GROWTH (%)
Investment climate
The total investment volume for Q1 2012 reached approximately €90 million signaling a solid start of the year for the local investment property market. The emblematic transaction representing approximately 90% of Q1 2012’s investment
Dan Dumitru Popescu 16
volume was the successful disposal of Timisoara’s landmark office complex: City Business Centre. The debt market is still severely restricted, with the local banking sector continuing to repair its balance sheets before mid-year’s statutory Basel reporting requirements. We envisage an increased focus on asset management activity and addressing “difficult” or non-performing loan portfolios in an attempt to maximize the equity recovery process. With a significant portion of outstanding loans set to re-gear towards the second half of 2012, new loans will be highly restrictive to proven, prime institutional stock in established locations. New development financing for all sectors will continue to be extremely scarce in the absence of significant, secured pre-leasing. Considering the newly-enforced loan-to-value borrowing criteria and the increase in lending margins, many investment funds, especially the opportunistic ones, will face the need of readjusting their return expectations and investment strategies in terms of new geographies and asset classes. Prime real estate investment products continue to represent the sole target for the core institutional investors “flight to quality” in an attempt to hedge against medium- and long-term inflationary prospects. In the context of the announced Romanian GDP growth above the European Union average and the increase availability of prime stock, we foresee an improved attractiveness for the Romanian market, although the actual transaction activity will remain highly dependent on global macro economic factors and debt financing.
Property investors are having a tough time making themselves heard above the multitude of issues banks are facing from all directions, and that theme is set to intensify over 2012. Banks have to raise significant amounts of money over the next months. Assuming they manage to do all of that, governments will put banks under pressure to lend, but property is not a priority over consumers and corporations Aside from these macro pressures, some consider property finance unattractive because of the limited amount of business it brings for the bank.
Office market supply
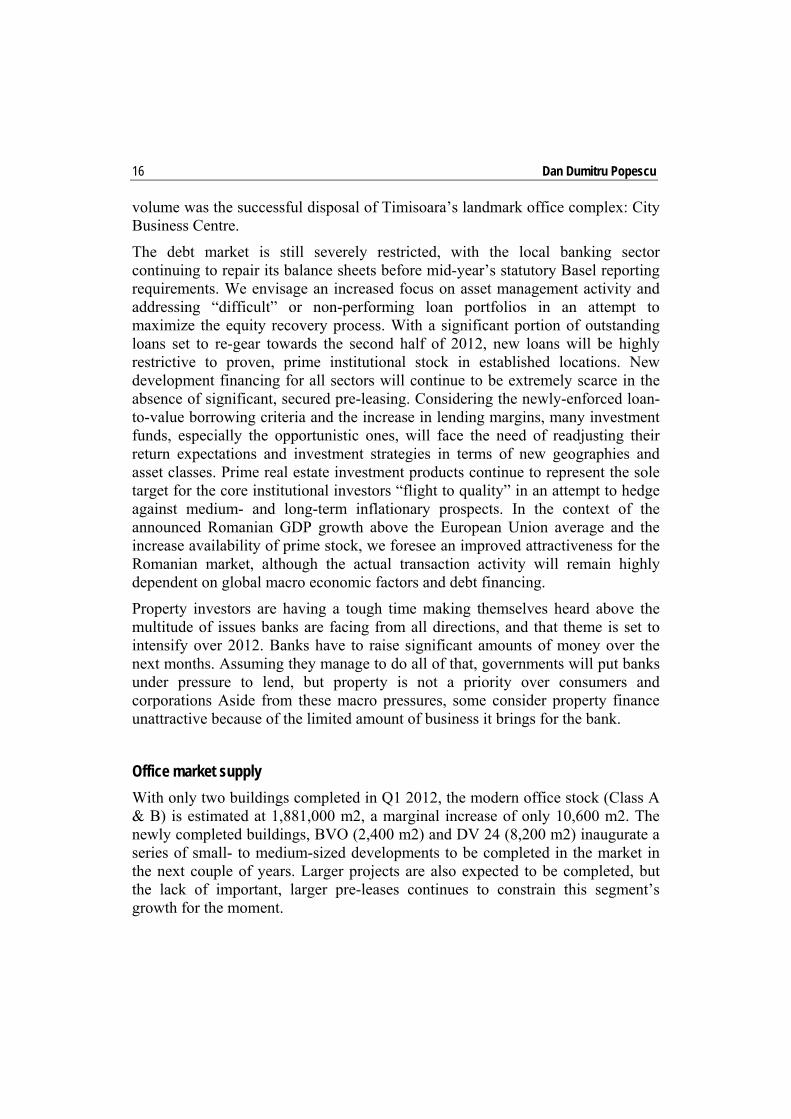
With only two buildings completed in Q1 2012, the modern office stock (Class A & B) is estimated at 1,881,000 m2, a marginal increase of only 10,600 m2. The newly completed buildings, BVO (2,400 m2) and DV 24 (8,200 m2) inaugurate a series of small- to medium-sized developments to be completed in the market in the next couple of years. Larger projects are also expected to be completed, but the lack of important, larger pre-leases continues to constrain this segment’s growth for the moment.
The challenges of banking system in the Romanian real estate market
17
17
Source: Jones Lang LaSalle.
Figure 2. Class A stock
Retail market supply
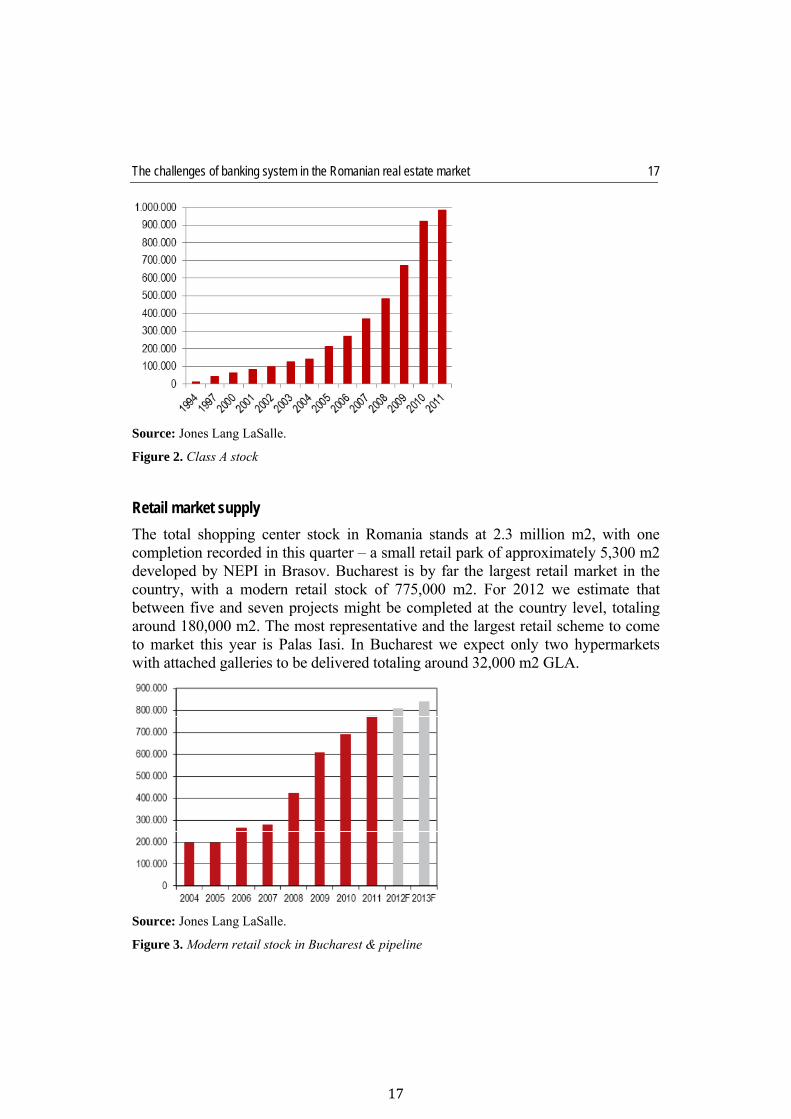
The total shopping center stock in Romania stands at 2.3 million m2, with one completion recorded in this quarter – a small retail park of approximately 5,300 m2 developed by NEPI in Brasov. Bucharest is by far the largest retail market in the country, with a modern retail stock of 775,000 m2. For 2012 we estimate that between five and seven projects might be completed at the country level, totaling around 180,000 m2. The most representative and the largest retail scheme to come to market this year is Palas Iasi. In Bucharest we expect only two hypermarkets with attached galleries to be delivered totaling around 32,000 m2 GLA.
Source: Jones Lang LaSalle.
Figure 3. Modern retail stock in Bucharest & pipeline
Dan Dumitru Popescu 18
Market development forecast
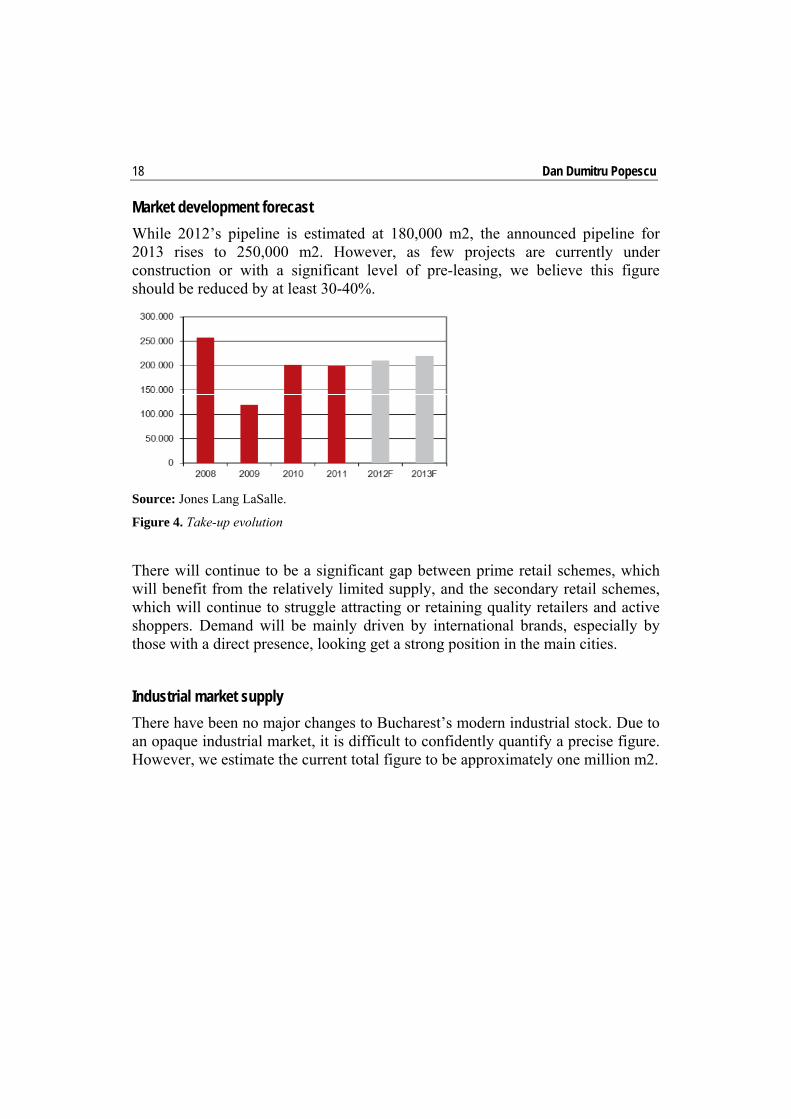
While 2012’s pipeline is estimated at 180,000 m2, the announced pipeline for 2013 rises to 250,000 m2. However, as few projects are currently under construction or with a significant level of pre-leasing, we believe this figure should be reduced by at least 30-40%.
Source: Jones Lang LaSalle.
Figure 4. Take-up evolution
There will continue to be a significant gap between prime retail schemes, which will benefit from the relatively limited supply, and the secondary retail schemes, which will continue to struggle attracting or retaining quality retailers and active shoppers. Demand will be mainly driven by international brands, especially by those with a direct presence, looking get a strong position in the main cities.
Industrial market supply
There have been no major changes to Bucharest’s modern industrial stock. Due to an opaque industrial market, it is difficult to confidently quantify a precise figure. However, we estimate the current total figure to be approximately one million m2.
The challenges of banking system in the Romanian real estate market
19
19
Source: Jones Lang LaSalle.
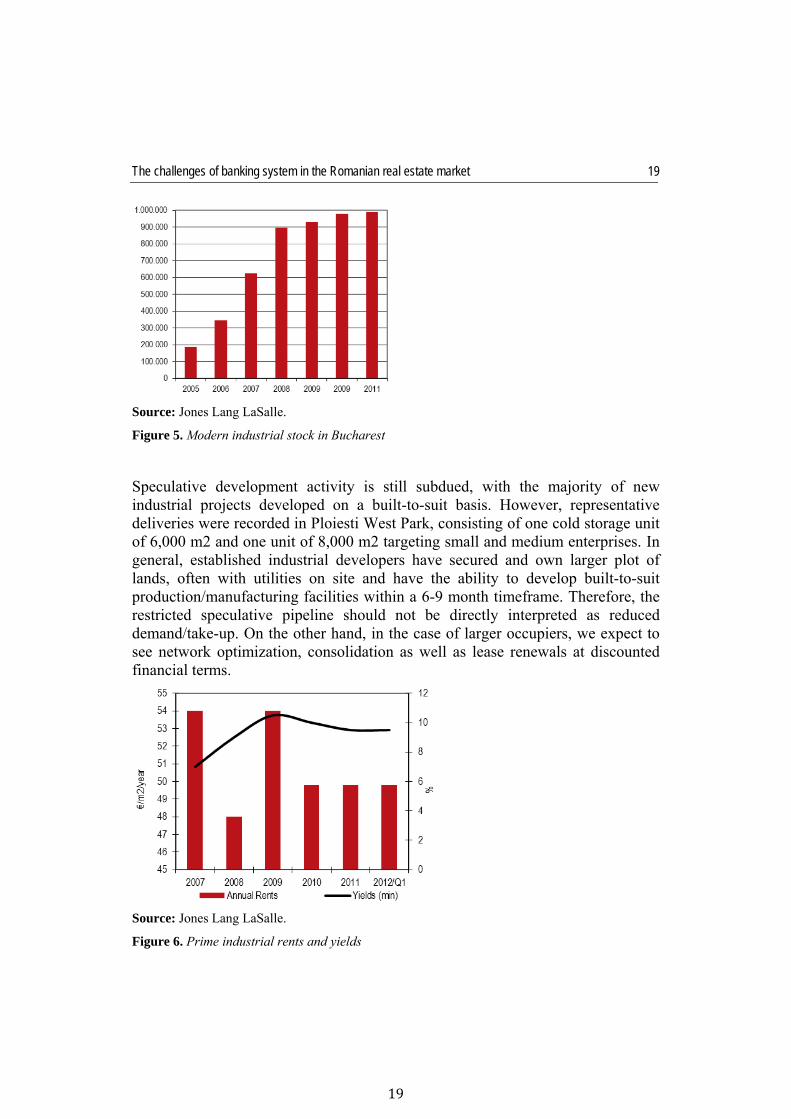
Figure 5. Modern industrial stock in Bucharest
Speculative development activity is still subdued, with the majority of new industrial projects developed on a built-to-suit basis. However, representative deliveries were recorded in Ploiesti West Park, consisting of one cold storage unit of 6,000 m2 and one unit of 8,000 m2 targeting small and medium enterprises. In general, established industrial developers have secured and own larger plot of lands, often with utilities on site and have the ability to develop built-to-suit production/manufacturing facilities within a 6-9 month timeframe. Therefore, the restricted speculative pipeline should not be directly interpreted as reduced demand/take-up. On the other hand, in the case of larger occupiers, we expect to see network optimization, consolidation as well as lease renewals at discounted financial terms.
Source: Jones Lang LaSalle.
Figure 6. Prime industrial rents and yields
Dan Dumitru Popescu 20
Residential market supply
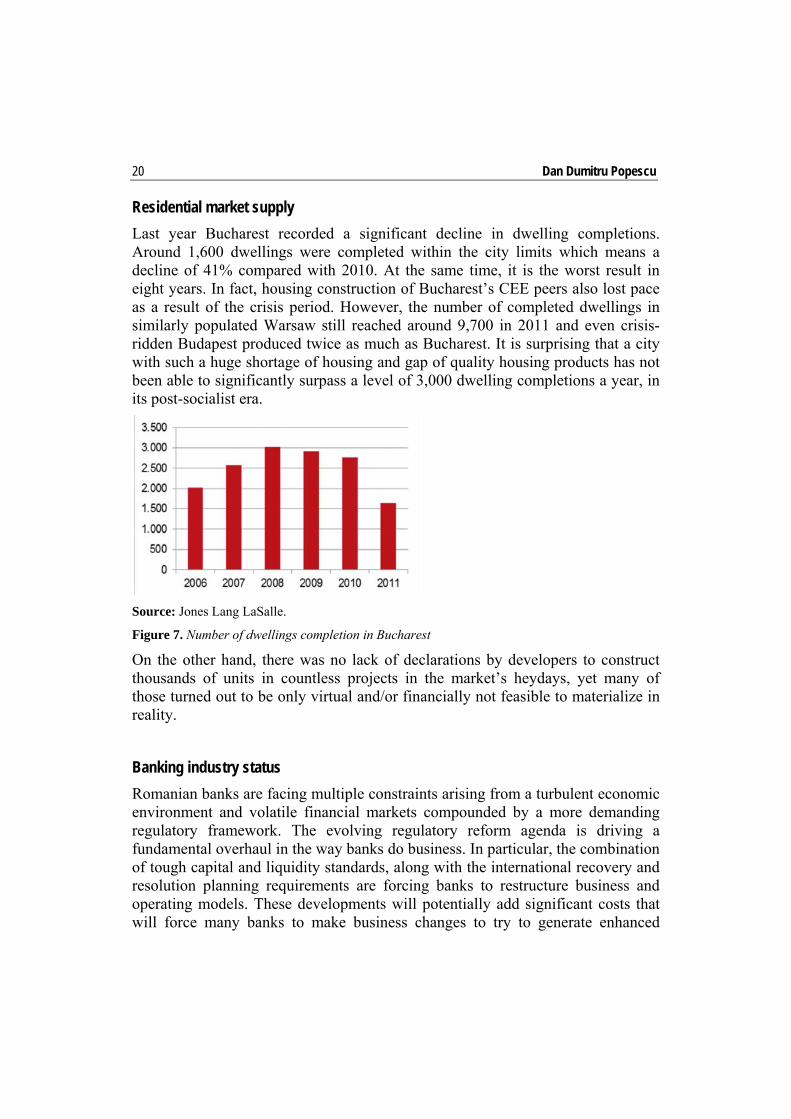
Last year Bucharest recorded a significant decline in dwelling completions. Around 1,600 dwellings were completed within the city limits which means a decline of 41% compared with 2010. At the same time, it is the worst result in eight years. In fact, housing construction of Bucharest’s CEE peers also lost pace as a result of the crisis period. However, the number of completed dwellings in similarly populated Warsaw still reached around 9,700 in 2011 and even crisis-ridden Budapest produced twice as much as Bucharest. It is surprising that a city with such a huge shortage of housing and gap of quality housing products has not been able to significantly surpass a level of 3,000 dwelling completions a year, in its post-socialist era.
Source: Jones Lang LaSalle.
Figure 7. Number of dwellings completion in Bucharest
On the other hand, there was no lack of declarations by developers to construct thousands of units in countless projects in the market’s heydays, yet many of those turned out to be only virtual and/or financially not feasible to materialize in reality.
Banking industry status
Romanian banks are facing multiple constraints arising from a turbulent economic environment and volatile financial markets compounded by a more demanding regulatory framework. The evolving regulatory reform agenda is driving a fundamental overhaul in the way banks do business. In particular, the combination of tough capital and liquidity standards, along with the international recovery and resolution planning requirements are forcing banks to restructure business and operating models. These developments will potentially add significant costs that will force many banks to make business changes to try to generate enhanced
The challenges of banking system in the Romanian real estate market
21
21
returns in the years ahead (although these changes are also being decided for business and economic reasons).
Local banking system continues to confront with poor lending activity, NPLs outburst, and orderly deleverage of foreign-parent banks. Households, heavily indebted (especially in FCY), worried by unemployment rate increase and poor economic prospects, changed slightly the consumption behaviour to a more cautious approach of the future. Economic activity shows signs of slowing down in H2’12 tempering corporations’ credit demand.
The credit quality worsening outburst in the four past months, driven by weaker economic activity than initially anticipation, and also by unexpected depreciation of RON against FCY in Jul’12 and Aug’12. NPLs spike from 15.9% as of end-Mar’12 to 17.3% as of end-Aug’12 point to more active management of NPLs (including NPLs write-offs) to be undertaken by banks, but they should be prepared to absorb potential losses. The coverage ratio (calculated for loss exposure higher than RON 20,000) at 77.8% as of end-Jun’12, the relative high loan to value ratio (LTV) at approximately 85%, and solvency ratio at 14.7% as of end-Jun’12 unveil adequate ability to absorb potential losses, whilst unexpected losses should be limited.
This is the result of exuberant lending before the economic crisis, when internal credit norms have been relaxed for most of the local banks, which resulted in an increased exposure and higher vulnerability to individual credit defaults. At the end of 2011, the rate of underperforming loans reached over 14% now is over 19%. According to the current accounting practices, these assets are classified as losses and banks need to provision them. While the economy is still vulnerable and consumers struggle with rising living costs, but little or no income growth, while disposable incomes are squeezed to the limit, banks fear that the situation might get even worse.
Lending conditions are expected to further post an orderly behavior, considering the following factors: (i) furthering of balanced macroeconomic policies under the EU-IMF-WB arrangements; (ii) lending strategies of the leading banking groups operating in Romania contemplate to preserve their local investments; and (iii) the EU-wide implementation of new arrangements supportive of preventing any disorderly or overly fast financial deleveraging, the centerpiece of the European Bank Coordination Vienna Initiative 2.0 being to strengthen cooperation between supervisory authorities in home and host countries.
The financial soundness of the companies’ sector improved, with mixed developments in terms of structure. The sustainable change in the economic growth pattern continued, in line with the expectations. The financing
Dan Dumitru Popescu 22
arrangements Romania signed with the EU, the IMF and the WB laid the groundwork for enhancing payment discipline economy-wide and made it likely for the vulnerabilities that companies pose to financial stability to decrease once arrears to the government budget have been reduced. Moreover, the major risks that the non financial corporation’s sector poses to financial stability are still those seen over the past few years, namely the (declining) debt repayment capacity towards banks and NBFIs and loose payment discipline towards business partners.
In 2011, non-financial corporations’ return on equity added 2 percentage points year on year to 8.2 percent and total cash flows were in positive territory and on the rise. Developments were however uneven for the different company types. Significant structural vulnerabilities were found for: (i) SMEs, which reported a growing credit risk (the non-performing loan ratio reached 23.2 percent in July 2012 from 15.1 percent at end-2010), much higher than that of corporations (4.3 percent in July 2012); (ii) trade, construction and real-estate companies (accounting for approximately 50 percent of total bank loans to companies) that have a riskier financial profile and high indebtedness; (iii) domestic private and state-owned companies that recorded, on aggregate, weak performance of their financial standing; and (iv) companies undergoing insolvency or bankruptcy proceedings that threaten financial stability due to the large loan stock, great number of major payment incidents and the high level of past-due debts to their business partners (NBR 2012).
Due to the imbalance between savings and loans, Romanian banks feel exposed to a potential credit crunch that would limit financial flows towards the CEE region altogether.
In close connection to that risk, there is the fear that capital will be unavailable or very expensive to access, especially since new capital adequacy requirements, such as Basel III, will put extra strain on the bank’s balance sheets. More preoccupying is the fact that losses are not evenly distributed amongst the local banking players with several banks registering most of the losses. It is, therefore, likely that these institutions will have to bring new capital in order to cope with the National Bank’s prudential requirements and might be forced to shed market share, or even exit the Romanian market.
On top of these worries, there is also the looming danger of another slip into recession, as the Euro zone continues its apparently never-ending turmoil, while the local economy remains vulnerable to exogenous factors and recovery is frail.
Banks are subject to significant regulatory pressure to reduce their assets to meet capital requirements, and consequently commercial real estate lending will be hit disproportionately by banks’ need to rebalance portfolios. When debt is found, it will be expensive, as financing costs for banks continue to rise, even without the
The challenges of banking system in the Romanian real estate market
23
23
capital cost of meeting regulatory requirements. Set against this backdrop and against the ongoing uncertainty of how regulations such as Basel III, Solvency II, and the Alternative Investment Fund Managers Directive will eventually treat the market, banks were having difficulty in devising strategies and remaining confident about any given property sector or country. Making investment decisions has become a granular process, and few places are considered a sure bet.
Nevertheless, the Romanian banking sector remains in a good position as regards hedging against risks stemming from corporate loans: the capital adequacy ratio (14.7 percent in June 2012) stays well above the regulated threshold; provisioning for expected risks associated with the companies’ sector stands at an adequate level (about 92 percent in June 2012); the value of required collateral generally covers risks (loan-to-value – LTV – ratio, i.e. the percentage value for the loan amount divided by the value of the collateral used for the loan, equals approximately 85 percent). The persistence of a challenging global environment calls for maintaining the above-mentioned prudential indicators at proper levels. In this vein, the large share of loans in foreign currency granted to SMEs (largely un-hedged borrowers) is likely to entail measures for extending the regulations on foreign exchange lending so as to cover all un-hedged borrowers, SMEs included, in accordance with the ESRB recommendations. The companies’ payment discipline in relation to non-bank entities improved in terms of business partners, but remained loose vis-à-vis public entities. The household sector is affected primarily by high indebtedness, especially in terms of loans in foreign currency, while the debt servicing capacity has continued to contract, albeit at a slower pace. The second vulnerability of the household sector is its persisting short foreign exchange position in relation to the financial sector, in spite of the downward trend seen in 2012. Households’ indebtedness tended to stabilize in the period under review in this Report, under the impact of marginally positive developments in lending, which translated into softer demand for new loans and slightly lower rates. The vulnerability of households’ indebtedness is augmented by the large share of foreign currency-denominated debt in the loan stock (68 percent in June 2012), mainly housing loans and mortgage-backed consumer loans, and by the fact that new business is still largely extended in foreign exchange (56 percent of the loan stock in 2011 and in the period January-July 2012). New foreign currency-denominated loans are mostly for housing (60 percent of the new business in the reported period). Banks’ non-performing loan ratio in relation to households rose to 9.5 percent in June 2012.
The outlook for the developments in households’ non-performing loans is mixed: the number of debtors who first recorded payments overdue for more than 90 days in 2011 and 2012 H1 declined by a hefty 11 percent; the probability to include loans into lower overdue buckets or to keep them in the same category increased;
Dan Dumitru Popescu 24
and households’ expectations on their financial standing have improved. On the other hand, the debt rescheduling measures aimed at enhancing households’ repayment capacity proved to have a relatively low efficiency, as the economic growth outlook is not very bright, and the risk stemming from foreign currency lending has remained high.
Conclusions
The real-estate and mortgage loan sector continues to pose a notable vulnerability to financial stability due to the declining quality of mortgage loans to households and companies, given the large share of such exposures in banks’ and NBFIs’ balance sheets (more than 59 percent in June 2012) and the ongoing downward adjustment in property prices. The above-mentioned developments, together with the challenges that businesses are facing amid the current international conditions call for maintaining a cautious policy on mortgage loans to households in view of: (i) the need to preserve prudent LTV ratios; (ii) the ongoing banks’ balance sheet adjustment, and (iii) the improvement in households’ financial culture so as to fully comprehend the risks arising from Forex lending.
Supplementing the regulatory framework for credit institutions with provisions allowing the central bank to take stabilization measures for distressed banks, the instruments needed to preserve financial system stability via containing contagion risk are made available.
The stabilization measures are meant to ensure depositor protection and the continuation of bank services, implying full or partial transfer of assets and liabilities to one or several eligible institutions or to a bridge bank established for this purpose, as well as a more prominent role for the Bank Deposit Guarantee Fund. This endeavor is part of the EU-wide concerns to set up a framework for bank recovery and resolution as an alternative to the legislation on bankruptcy. The stabilization measures are aimed at avoiding disruptions in the smooth functioning of the financial system and of the economy, they draw prevalently on private sector resources and may only be applied to distressed credit institutions that could threaten fi nancial stability. The NBR assesses the systemic nature of credit institutions in Romania on a regular basis from the perspective of preserving a robust financial system.
Basel III is likely to make bank financing more expensive.
Banks are still more interested in financing income-generating projects than development projects, even if their openness to finance new developments has increased in comparison to 2010.
The challenges of banking system in the Romanian real estate market
25
25
Bank expectations on the potential increase in the size of their future loan portfolios are distinctively improving.
The hotel sector remains the least preferred by banks in terms of financing, but again good projects can obtain reasonable terms for financing.
This year and the years to come will be the year that property financing becomes a major casualty of the measures banks take to deal with regulatory and macro-economic level pressures.
It will be the year the market finds that, as banks set about deleveraging, the process will not loosen up capital for fresh property lending, as it gets diverted to lower-risk or more politically palatable industries.
It will be the year when the market sees debt become increasingly short term and expensive, as lenders pass on the costs of regulation to borrowers. And because of scarcity of traditional debt providers, 2012 will be the year when the need to find alternative sources of funding becomes imperative.
Property investors are having a tough time making themselves heard above the multitude of issues banks are facing from all directions, and that theme is set to intensify. New entrants into the space will be similarly choosy.
Insurers are widely expected to increase activity but only at terms that perfectly suit them. Currently, ten life insurers are active in the United Kingdom and continental Europe, according to DTZ Research – including AIG, Allianz, AXA, Aviva, Legal & General, Met Life, M&G, and Canada Life – a number it says is likely to double over the next three years. To match liabilities, such investors will feast on a menu of large chunks of prime-focused, long-term (upwards of five years), and fixed-rate debt that will primarily benefit those in the market that do not really need it.
References Anghel I., Onofrei, M. (2013). „Dezvoltarea imobiliară. Analiză şi principii”, „Economia
Proprietăţilor Imobiliare”, ISBN 978-973-709-659-3 Bernanke, B. (2007). Housing, Housing Finance and Monetary Policy, Federal Reserve Bank of
Kansas City’s Economic Symposium, Jackson Hole, Wyoming Bucharest City Report Q1 2012, Jones Lang Lasalle CEE Property Lending Barometer 2012 -A survey of banks on the prospects for real estate sector
lending in CEE-by KPMG
Dan Dumitru Popescu 26
Dedu,V., Stoica, T. (2011). “The Monetary Policy and the Real Estate Market”, Theoretical and Applied Economics, Volume XVIII (2011), No. 12(565), pp. 5-14
ECB- HOUSING FINANCE IN THE EURO AREA- OCCASIONAL PAPER SERIES NO 101 / MARCH 2009-Task Force of the Monetary Policy Committee of the European System of Central Banks
Emerging Trends in Real Estate® Europe 2012, Urban Land Institute and Pwc European Commission (2008). Towards a Common Operational European Definition of Over-
Indebtedness. Georgescu, F. (2006). „Stadiul pregatirii pentru aplicarea reglementarilor Basel II în sistemul
bancar romanesc”– prezentare Finmedia, Bucuresti Georgescu, F. (2007). „Stadiul actual al aplicarii Acordului Basel II”– prezentare Finmedia,
București Goldman, S. et al. (2004). The Practice of Risk Management, Euromoney Books, London Greuning, H. (2004). Analyzing and managing banking risk, Editura Irecson, București James, T. (2003). Energy Price Risk: Trading and Price Risk Management. Gordonsvile, VA,
USA: Palgrave Macmillan Jorion, P. (2001). Value at Risk, Editura Mc. Graw-Hill National Bank of Romania-Financial Stability Report for 2012 Popescu, D.D. (2009). “Market risk assessment of a bank. Methods and measurements”,
Theoretical and Applied Economics-Supplement, Economic-Financial Analysis and Property Valuation, Bucharest, May 29-31
Effects of the financial crisis and of the evolution of real estate market on the construction field in Romania
Mihaela Diana OANCEA NEGESCU The Bucharest University of Economic Studies [email protected]
Abstract. In the last years, real estate developers, companies that offer construction materials and construction companies have met a decline following the trigger of the financial crisis at the end of 2008. The study aims the identification of the correlations between the economic conjecture outlined at international and national level and the evolution of the constructions sector. The unfavorable effects of the real estate crisis on the constructions field were emphasized.
Keywords: real estate market; economic crisis; constructions industry.
Theoretical and Applied Economics Volume XX (2013), Special Issue, pp. 27-40
Mihaela Diana Oancea Negescu 28
Introduction
At the level of the real estate market and constructions sector, the effects of the financial crisis were deeply felt since the 4th quarter of 2008, when, on the background of international crisis, the real estate market recorded a block if not a reduction, with repercussions at the level of real estate agencies and developers. The immediate effects were felt in the construction companies and manufacturers of construction materials, by reduction of activity and, implicitly, by reduction of company’s performances.
From studies performed and the results recorded at the level of activity domains, it has been ascertained that the main channel of crisis expansion are represented by the financial one – with the restriction of the access to loans through the limitation of external financing, the commercial one – the slowing or even reduction of exports and the exchange rate one – the depreciation of the national currency. The financial crisis (Creţu, 2011) is only a form of manifestation of the economic crisis and it reflects a lack of confidence in the financial system, an important diminution of the stock market transactions volume, a deregulation of the market mechanisms.
In the conditions of the market economy, any enterprises conceives its own actions policy through which it establishes the current and future evolution directions, and also the actual modalities to achieve them, to ensure the survival on the market and overall development. Moreover, in order to increase their performances it is necessary that the decisions adopted to be based on updated data, information and knowledge (Anica-Popa, 2011).
With a spectacular increase during the last years, construction industry of Romania managed to dominate this sector at the level of the European Union. Since 2000, the construction market of Romania has begun to increase slowly, but constantly. In all these years, the private sector was the one to massively invest in the sector, holding a weight of more than 80% out of total works financed from private sources.
In the actual context, no company allows to run a lucrative activity without having a clear perspective both on short term and medium-long term, to ensure its subsis-tence, but also efficiency, in the conditions in which the environment becomes more complex and dynamic. The competitiveness in this environment can be influenced both by the increase of productivity, but also by the dynamics of production costs, with a direct impact on selling prices. In this way, forecasting the production costs in the constructions field and their implications on economic performances can be a strong managerial instrument for companies from the construction field.
1.1. Moment of financial crisis trigger
The trigger of financial crisis that occurred four years ago, in 2008, had various elements which announced the imminent danger of real estate market downfall:
Effects of the financial crisis and of the evolution of real estate market
29
29
The first signs, that occurred both at the level of Romania and other countries too, were represented by the over-production existing mostly in Spain and Ireland, countries which reported a level of works which surpassed national demographics and real market demand. Furthermore, prices in real estate segment were rising, becoming more and more incompatible with the financial resources of the buyers. Out of the desire to solve the problem of dwellings, the banks carried out, in the years before 2008, a policy which resulted in an accentuate debt of acquisitions. This adaptation crisis began to show signs since 2007 especially in these two countries, Spain and Ireland, then generalizing itself in the first semester of 2008.
In the United States, the situation was somehow ameliorated with the help of the so-called “sub-prime”, through which banks accepted to grant loans in exchange of mini-mum guarantees. Thus, American banks offered massive loans in these conditions which led to the situation that, in time, population was unable to reimburse the loans.
The next step was represented by the credit crisis. The crisis aggravated more and more starting in July 2008, transforming into a crisis of loans. In these conditions, banks did not wished to assume the risk to borrow an institution which hides dubious receivables, affected by derivative products based on the principle of “sub-prime”. The immediate effect was to stop the credit offer for housing and enterprises. The credits for housing fell by 33% in 2008 compared with 2007.
The two elements previously presented, over-production and credit crisis, were completed during the 4th quarter of 2008, at the level of residential real estate market, by a third element, that is the negative anticipations of most real estate agents. In these conditions, banks, out of the desire to diminish the risks they expose themselves to, stopped the refinancing loans, but also hardened the credit conditions. The effect was the stop of price increase and the buyers ascertained even a decreasing tendency for housing prices, becoming thus more patient in investing, further waiting the decrease of prices. The drastic reduction of real estate transactions has determined the developers to become more prudent, lowering or even renouncing the new projects that were to be started in the near future. For real estate developers, the effects of the financial crisis meant an increase of inventories, and they eventually withdrew from the market, in the expectation of some offers, profitable enough.
1.2. Real estate market in Romania
The sector of housing construction was hit hardly by economic crisis in Romania. Thus, after four years of crisis, the number of houses finished in our country decreased by 34% in 2011, as against the period marking the peak reached by this segment – the year 2008.
Mihaela Diana Oancea Negescu 30
From the statistical point of view, this represents the fourth largest decrease in the Central and Eastern Europe, according to a study developed by the Polish research company PMR. According to PMR study, in Romania were finished 44,456 new houses in 2011, as against 67,255 units in 2008, when the maximum level was reach.
From the viewpoint of housing number, we observe an increase, as from one year to another, in absolute figures, this number increased until 2008, when the decline of investments occurred.
The year 2006 represents an year during which, through houses for distressed people, the growth was net superior to previous years. The same rhythm is recorded for the engineering constructions, residential buildings, houses in progress etc., where the increases are constant, but certain.
The investments came, mostly, from full private funds, a notable role having, during the last two years, the possibility of civil constructions, including credit-based houses, that were more easily granted, and that, through this mortgage credit, can mean an advantage in the periods to come.
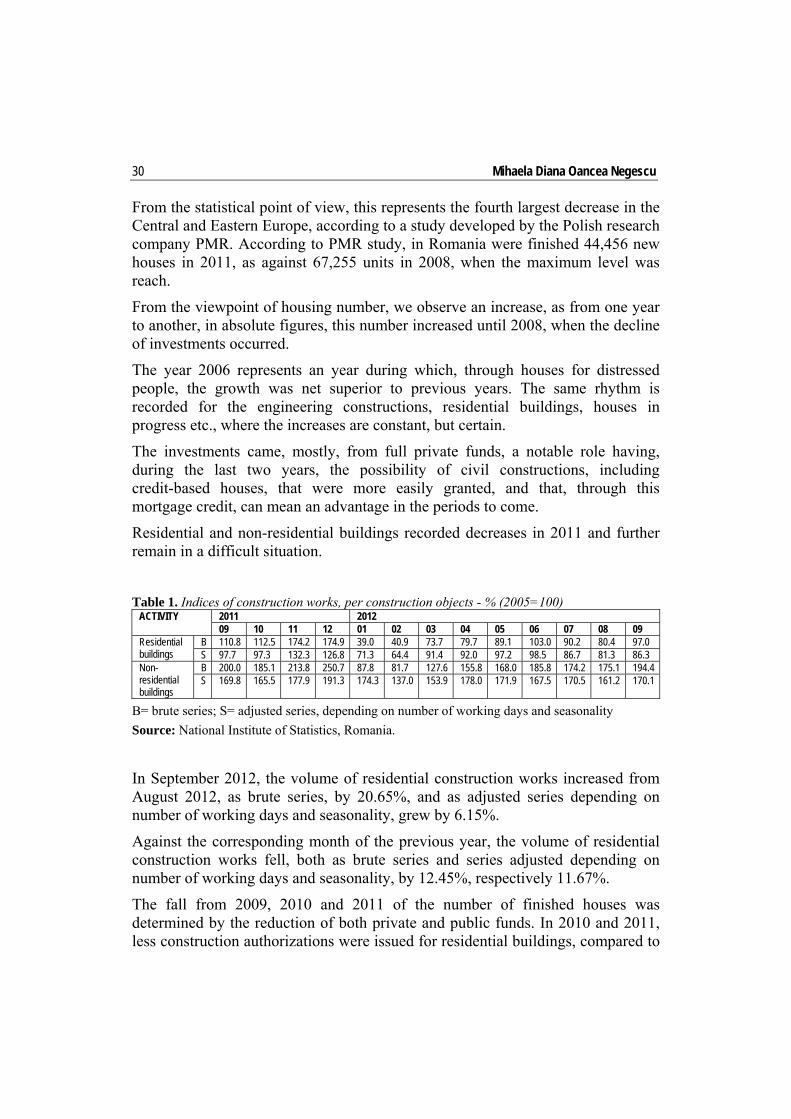
Residential and non-residential buildings recorded decreases in 2011 and further remain in a difficult situation.
Table 1. Indices of construction works, per construction objects - % (2005=100) ACTIVITY 2011 2012
09 10 11 12 01 02 03 04 05 06 07 08 09 Residential buildings
B 110.8 112.5 174.2 174.9 39.0 40.9 73.7 79.7 89.1 103.0 90.2 80.4 97.0 S 97.7 97.3 132.3 126.8 71.3 64.4 91.4 92.0 97.2 98.5 86.7 81.3 86.3
Non-residential buildings
B 200.0 185.1 213.8 250.7 87.8 81.7 127.6 155.8 168.0 185.8 174.2 175.1 194.4S 169.8 165.5 177.9 191.3 174.3 137.0 153.9 178.0 171.9 167.5 170.5 161.2 170.1
B= brute series; S= adjusted series, depending on number of working days and seasonality
Source: National Institute of Statistics, Romania.
In September 2012, the volume of residential construction works increased from August 2012, as brute series, by 20.65%, and as adjusted series depending on number of working days and seasonality, grew by 6.15%.
Against the corresponding month of the previous year, the volume of residential construction works fell, both as brute series and series adjusted depending on number of working days and seasonality, by 12.45%, respectively 11.67%.
The fall from 2009, 2010 and 2011 of the number of finished houses was determined by the reduction of both private and public funds. In 2010 and 2011, less construction authorizations were issued for residential buildings, compared to
Effects of the financial crisis and of the evolution of real estate market
31
31
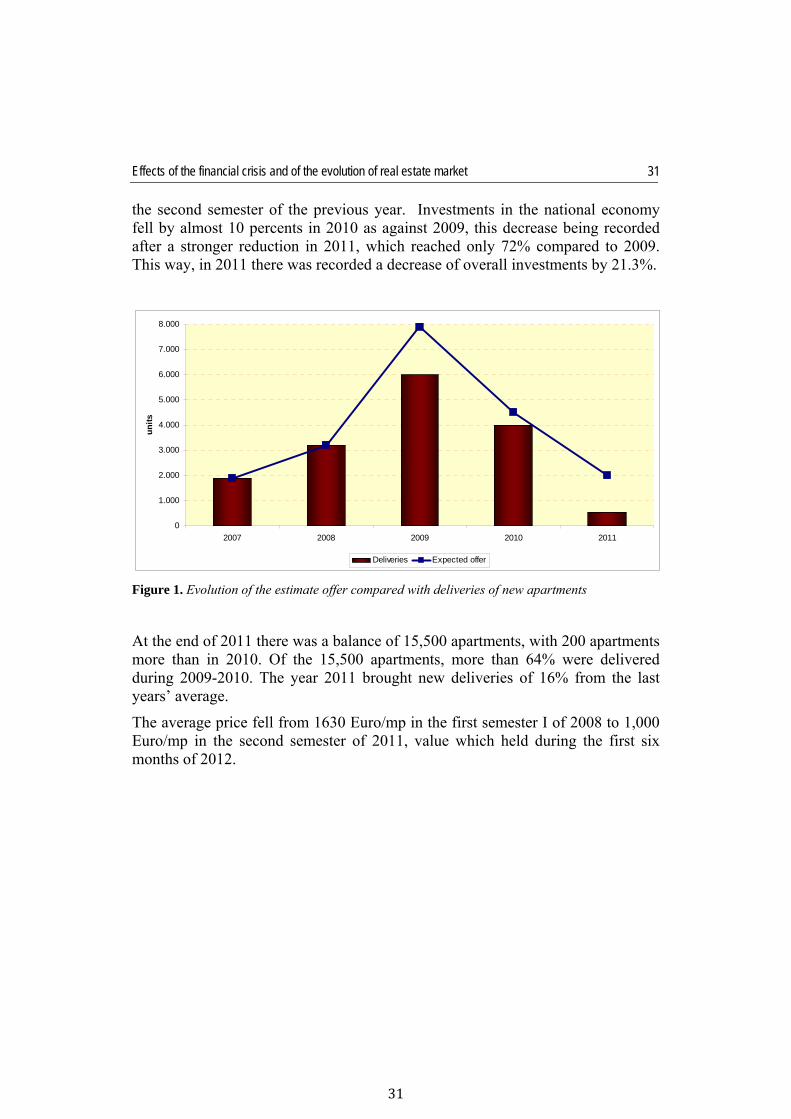
the second semester of the previous year. Investments in the national economy fell by almost 10 percents in 2010 as against 2009, this decrease being recorded after a stronger reduction in 2011, which reached only 72% compared to 2009. This way, in 2011 there was recorded a decrease of overall investments by 21.3%.
Figure 1. Evolution of the estimate offer compared with deliveries of new apartments
At the end of 2011 there was a balance of 15,500 apartments, with 200 apartments more than in 2010. Of the 15,500 apartments, more than 64% were delivered during 2009-2010. The year 2011 brought new deliveries of 16% from the last years’ average.
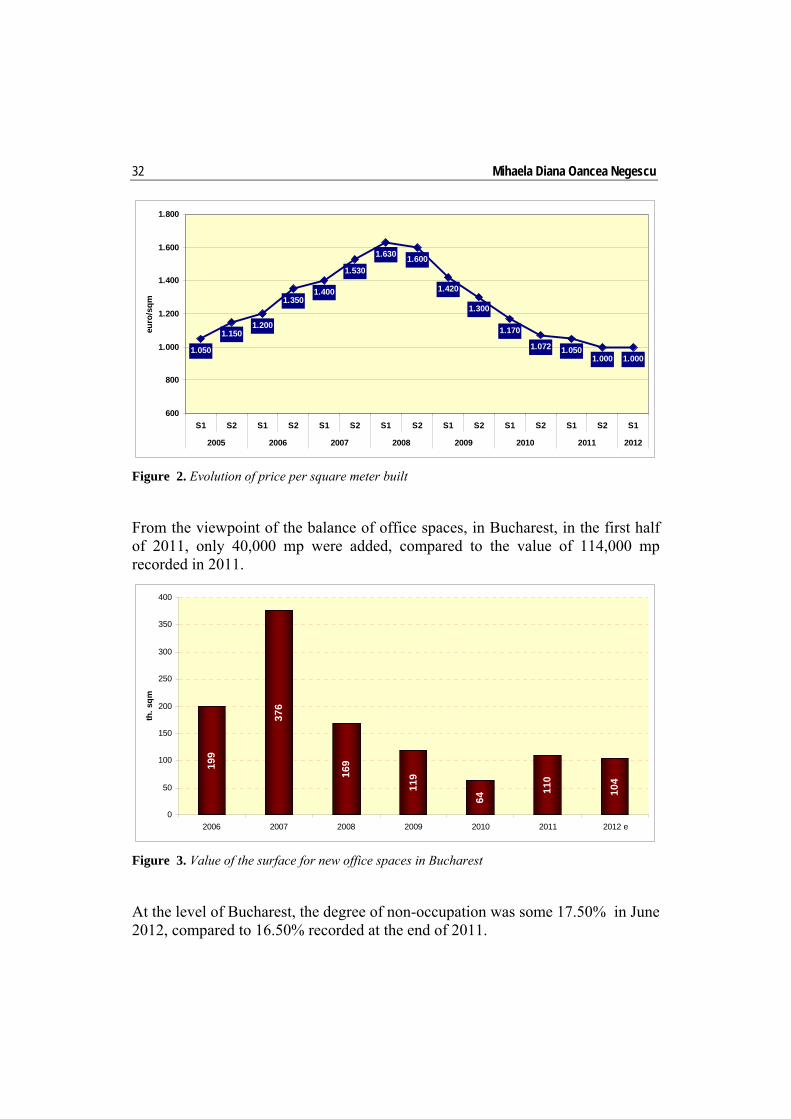
The average price fell from 1630 Euro/mp in the first semester I of 2008 to 1,000 Euro/mp in the second semester of 2011, value which held during the first six months of 2012.
0
1.000
2.000
3.000
4.000
5.000
6.000
7.000
8.000
2007 2008 2009 2010 2011
units
Deliveries Expected offer
Mihaela Diana Oancea Negescu 32
Figure 2. Evolution of price per square meter built
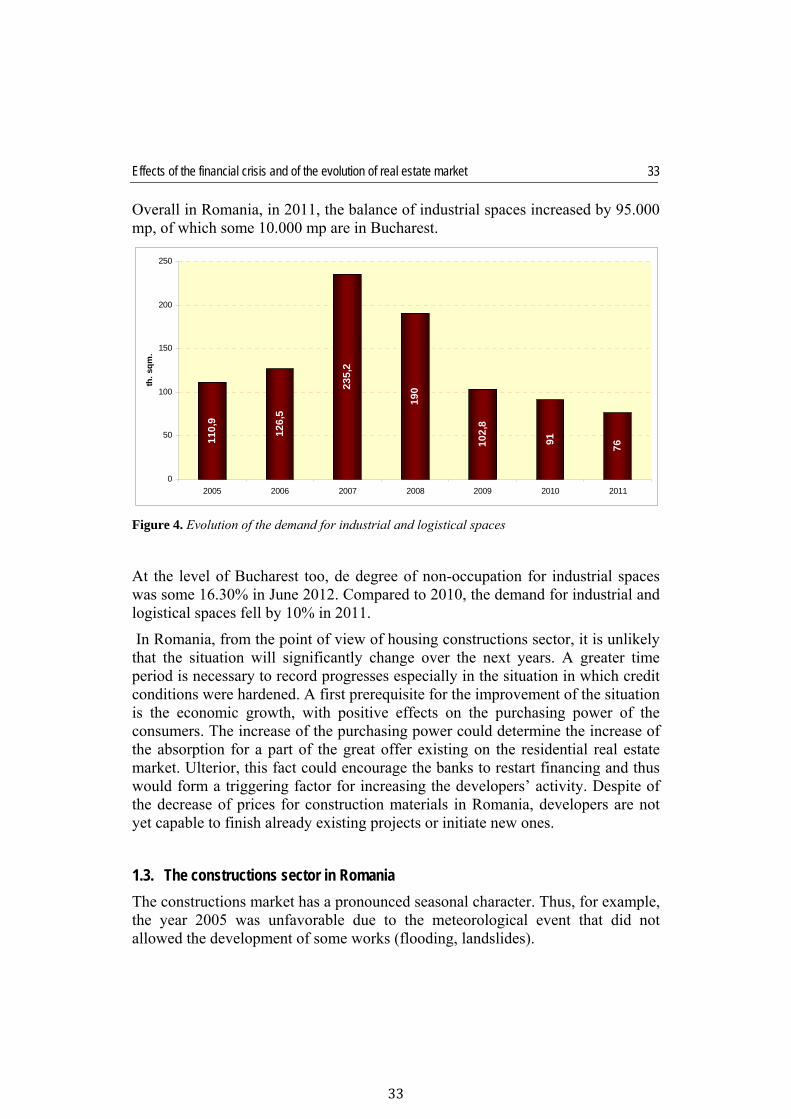
From the viewpoint of the balance of office spaces, in Bucharest, in the first half of 2011, only 40,000 mp were added, compared to the value of 114,000 mp recorded in 2011.
Figure 3. Value of the surface for new office spaces in Bucharest
At the level of Bucharest, the degree of non-occupation was some 17.50% in June 2012, compared to 16.50% recorded at the end of 2011.
1.050
1.1501.200
1.3501.400
1.530
1.630 1.600
1.420
1.300
1.170
1.072 1.0501.000 1.000
600
800
1.000
1.200
1.400
1.600
1.800
S1 S2 S1 S2 S1 S2 S1 S2 S1 S2 S1 S2 S1 S2 S1
2005 2006 2007 2008 2009 2010 2011 2012
euro
/sqm
199
376
169
119
64
110
104
0
50
100
150
200
250
300
350
400
2006 2007 2008 2009 2010 2011 2012 e
th. s
qm
Effects of the financial crisis and of the evolution of real estate market
33
33
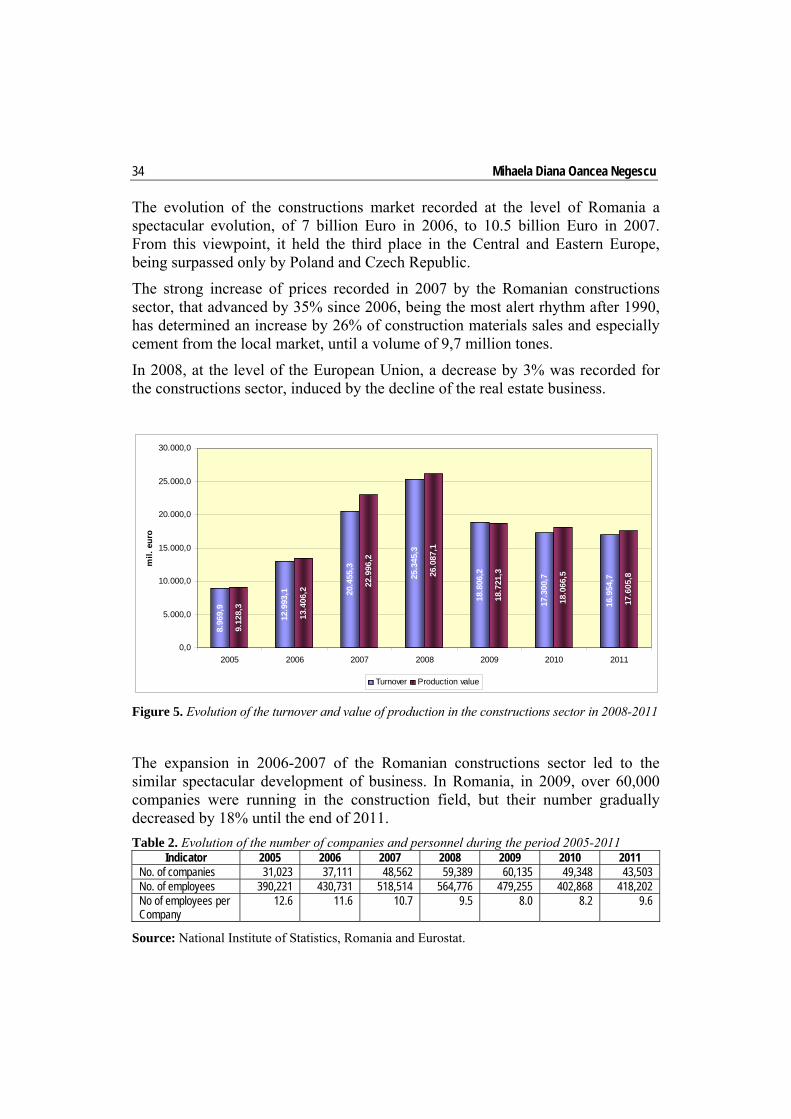
Overall in Romania, in 2011, the balance of industrial spaces increased by 95.000 mp, of which some 10.000 mp are in Bucharest.
Figure 4. Evolution of the demand for industrial and logistical spaces
At the level of Bucharest too, de degree of non-occupation for industrial spaces was some 16.30% in June 2012. Compared to 2010, the demand for industrial and logistical spaces fell by 10% in 2011.
In Romania, from the point of view of housing constructions sector, it is unlikely that the situation will significantly change over the next years. A greater time period is necessary to record progresses especially in the situation in which credit conditions were hardened. A first prerequisite for the improvement of the situation is the economic growth, with positive effects on the purchasing power of the consumers. The increase of the purchasing power could determine the increase of the absorption for a part of the great offer existing on the residential real estate market. Ulterior, this fact could encourage the banks to restart financing and thus would form a triggering factor for increasing the developers’ activity. Despite of the decrease of prices for construction materials in Romania, developers are not yet capable to finish already existing projects or initiate new ones.
1.3. The constructions sector in Romania
The constructions market has a pronounced seasonal character. Thus, for example, the year 2005 was unfavorable due to the meteorological event that did not allowed the development of some works (flooding, landslides).
110,
9
126,
5
235,
2
190
102,
8
91 76
0
50
100
150
200
250
2005 2006 2007 2008 2009 2010 2011
th. s
qm.
Mihaela Diana Oancea Negescu 34
The evolution of the constructions market recorded at the level of Romania a spectacular evolution, of 7 billion Euro in 2006, to 10.5 billion Euro in 2007. From this viewpoint, it held the third place in the Central and Eastern Europe, being surpassed only by Poland and Czech Republic.
The strong increase of prices recorded in 2007 by the Romanian constructions sector, that advanced by 35% since 2006, being the most alert rhythm after 1990, has determined an increase by 26% of construction materials sales and especially cement from the local market, until a volume of 9,7 million tones.
In 2008, at the level of the European Union, a decrease by 3% was recorded for the constructions sector, induced by the decline of the real estate business.
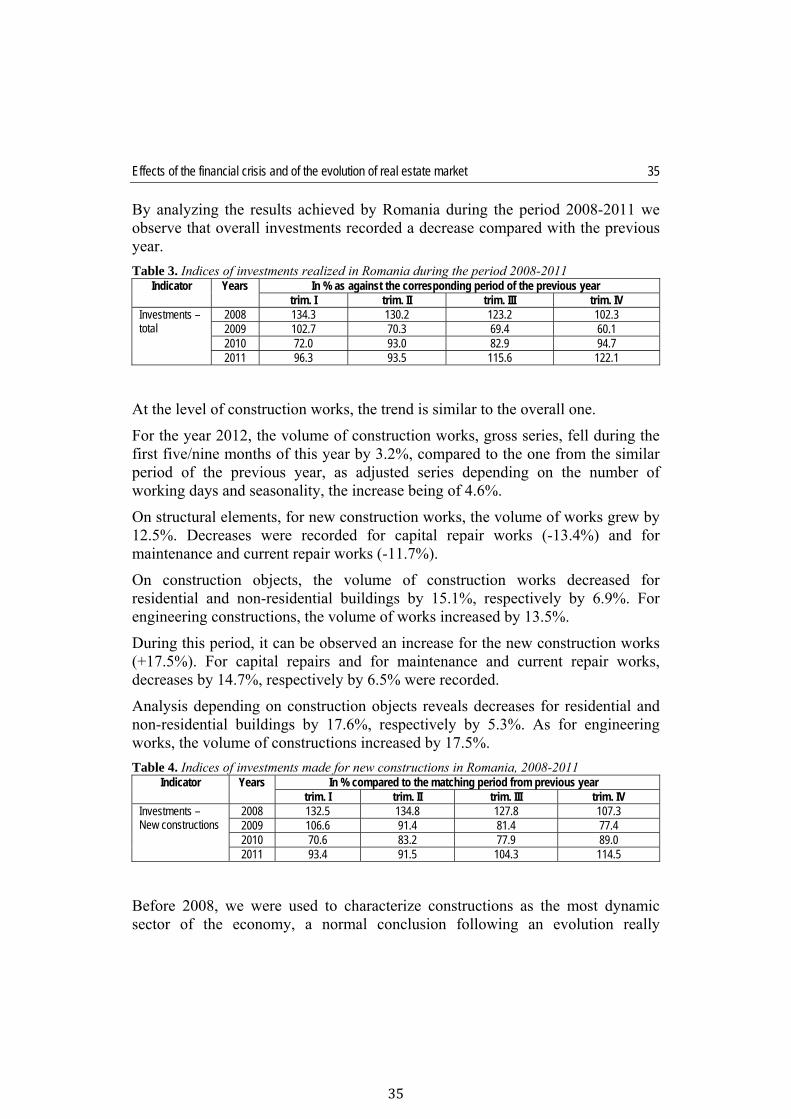
Figure 5. Evolution of the turnover and value of production in the constructions sector in 2008-2011
The expansion in 2006-2007 of the Romanian constructions sector led to the similar spectacular development of business. In Romania, in 2009, over 60,000 companies were running in the construction field, but their number gradually decreased by 18% until the end of 2011.
Table 2. Evolution of the number of companies and personnel during the period 2005-2011 Indicator 2005 2006 2007 2008 2009 2010 2011
No. of companies 31,023 37,111 48,562 59,389 60,135 49,348 43,503 No. of employees 390,221 430,731 518,514 564,776 479,255 402,868 418,202 No of employees per Company
12.6 11.6 10.7 9.5 8.0 8.2 9.6
Source: National Institute of Statistics, Romania and Eurostat.
8.96
9,9
12.9
93,1 20
.455
,3
25.3
45,3
18.8
06,2
17.3
00,7
16.9
54,7
9.12
8,3
13.4
06,2
22.9
96,2
26.0
87,1
18.7
21,3
18.0
66,5
17.6
05,8
0,0
5.000,0
10.000,0
15.000,0
20.000,0
25.000,0
30.000,0
2005 2006 2007 2008 2009 2010 2011
mil.
eur
o
Turnover Production value
Effects of the financial crisis and of the evolution of real estate market
35
35
By analyzing the results achieved by Romania during the period 2008-2011 we observe that overall investments recorded a decrease compared with the previous year.
Table 3. Indices of investments realized in Romania during the period 2008-2011 Indicator Years
In % as against the corresponding period of the previous year
trim. I trim. II trim. III trim. IV Investments – total
2008 134.3 130.2 123.2 102.3 2009 102.7 70.3 69.4 60.1 2010 72.0 93.0 82.9 94.7 2011 96.3 93.5 115.6 122.1
At the level of construction works, the trend is similar to the overall one.
For the year 2012, the volume of construction works, gross series, fell during the first five/nine months of this year by 3.2%, compared to the one from the similar period of the previous year, as adjusted series depending on the number of working days and seasonality, the increase being of 4.6%.
On structural elements, for new construction works, the volume of works grew by 12.5%. Decreases were recorded for capital repair works (-13.4%) and for maintenance and current repair works (-11.7%).
On construction objects, the volume of construction works decreased for residential and non-residential buildings by 15.1%, respectively by 6.9%. For engineering constructions, the volume of works increased by 13.5%.
During this period, it can be observed an increase for the new construction works (+17.5%). For capital repairs and for maintenance and current repair works, decreases by 14.7%, respectively by 6.5% were recorded.
Analysis depending on construction objects reveals decreases for residential and non-residential buildings by 17.6%, respectively by 5.3%. As for engineering works, the volume of constructions increased by 17.5%.
Table 4. Indices of investments made for new constructions in Romania, 2008-2011 Indicator Years
In % compared to the matching period from previous year
trim. I trim. II trim. III trim. IV Investments – New constructions
2008 132.5 134.8 127.8 107.3 2009 106.6 91.4 81.4 77.4 2010 70.6 83.2 77.9 89.0 2011 93.4 91.5 104.3 114.5
Before 2008, we were used to characterize constructions as the most dynamic sector of the economy, a normal conclusion following an evolution really
Mihaela Diana Oancea Negescu 36
fulminating, followed by a downfall started in January 2009 and then continued during the period 2010 – June 2012.
Presently, the greatest part of construction materials on the market, accounting for some circa 60% -70%, is manufactured in Romania.
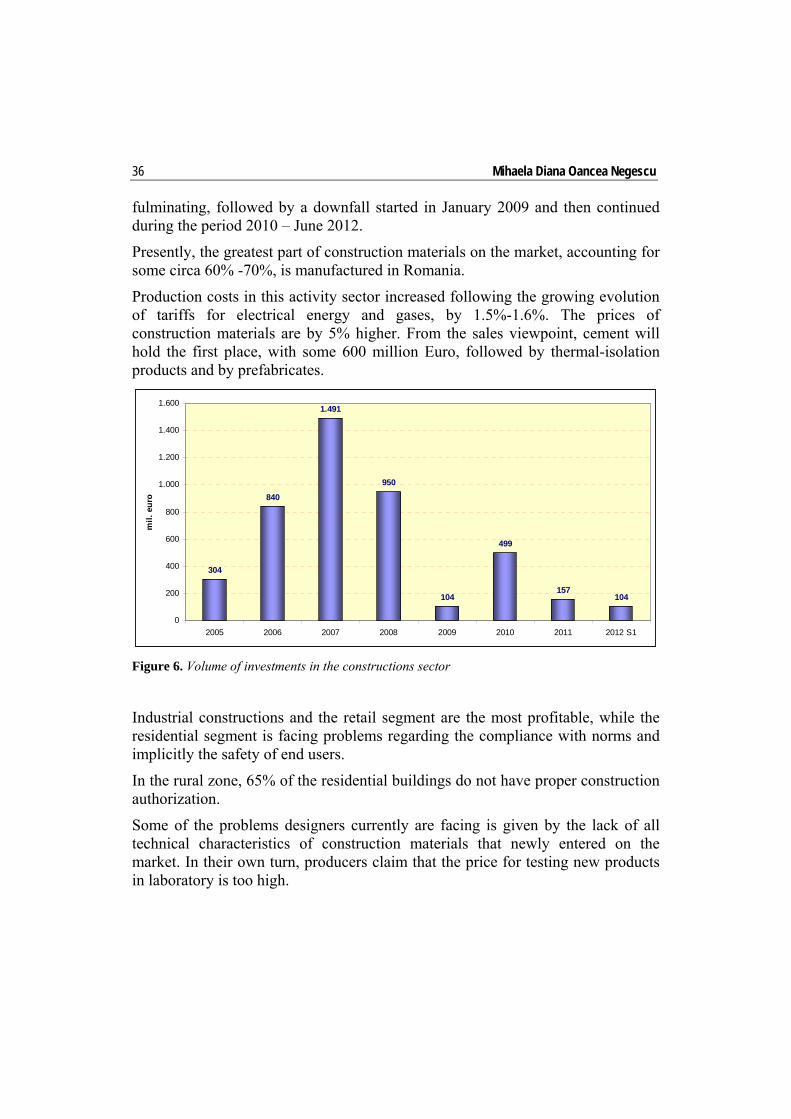
Production costs in this activity sector increased following the growing evolution of tariffs for electrical energy and gases, by 1.5%-1.6%. The prices of construction materials are by 5% higher. From the sales viewpoint, cement will hold the first place, with some 600 million Euro, followed by thermal-isolation products and by prefabricates.
Figure 6. Volume of investments in the constructions sector
Industrial constructions and the retail segment are the most profitable, while the residential segment is facing problems regarding the compliance with norms and implicitly the safety of end users.
In the rural zone, 65% of the residential buildings do not have proper construction authorization.
Some of the problems designers currently are facing is given by the lack of all technical characteristics of construction materials that newly entered on the market. In their own turn, producers claim that the price for testing new products in laboratory is too high.
304
840
1.491
950
104
499
157104
0
200
400
600
800
1.000
1.200
1.400
1.600
2005 2006 2007 2008 2009 2010 2011 2012 S1
mil.
eur
o
Effects of the financial crisis and of the evolution of real estate market
37
37
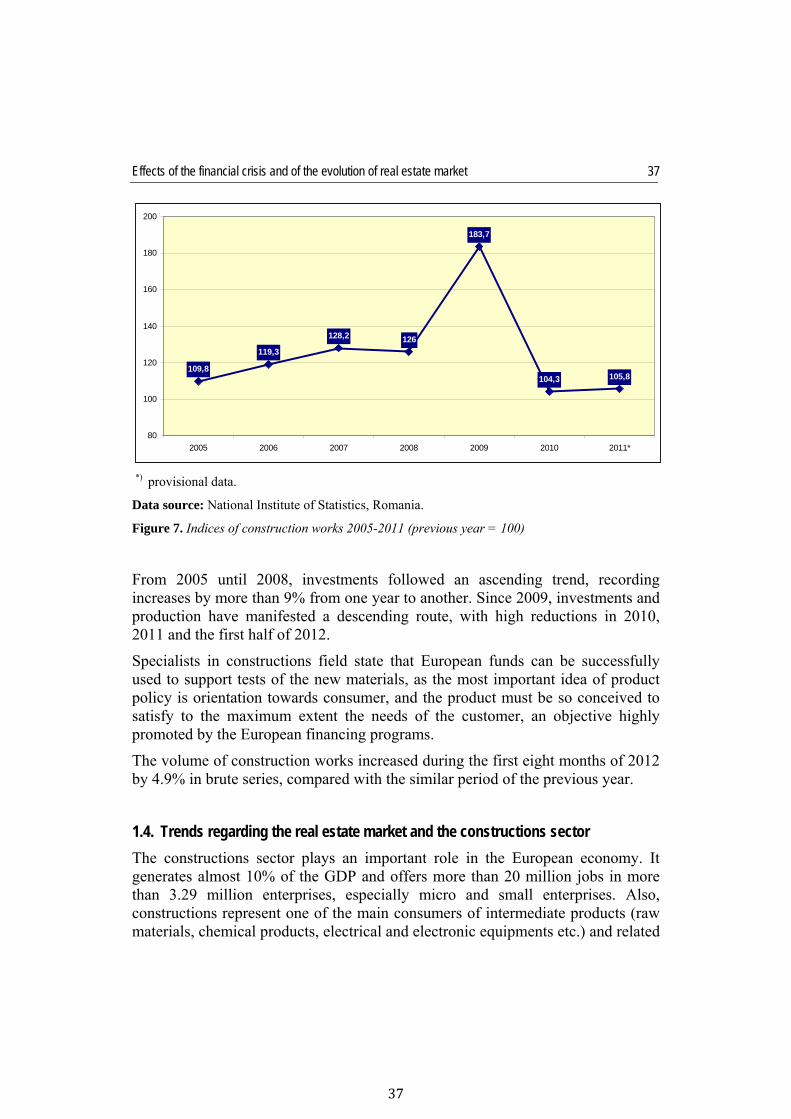
*) provisional data.
Data source: National Institute of Statistics, Romania.
Figure 7. Indices of construction works 2005-2011 (previous year = 100)
From 2005 until 2008, investments followed an ascending trend, recording increases by more than 9% from one year to another. Since 2009, investments and production have manifested a descending route, with high reductions in 2010, 2011 and the first half of 2012.
Specialists in constructions field state that European funds can be successfully used to support tests of the new materials, as the most important idea of product policy is orientation towards consumer, and the product must be so conceived to satisfy to the maximum extent the needs of the customer, an objective highly promoted by the European financing programs.
The volume of construction works increased during the first eight months of 2012 by 4.9% in brute series, compared with the similar period of the previous year.
1.4. Trends regarding the real estate market and the constructions sector
The constructions sector plays an important role in the European economy. It generates almost 10% of the GDP and offers more than 20 million jobs in more than 3.29 million enterprises, especially micro and small enterprises. Also, constructions represent one of the main consumers of intermediate products (raw materials, chemical products, electrical and electronic equipments etc.) and related
109,8
119,3
128,2 126
183,7
104,3 105,8
80
100
120
140
160
180
200
2005 2006 2007 2008 2009 2010 2011*
Mihaela Diana Oancea Negescu 38
services. Due to its economic importance, the performance in the construction sector can influence in a significant manner the overall development of the economy.
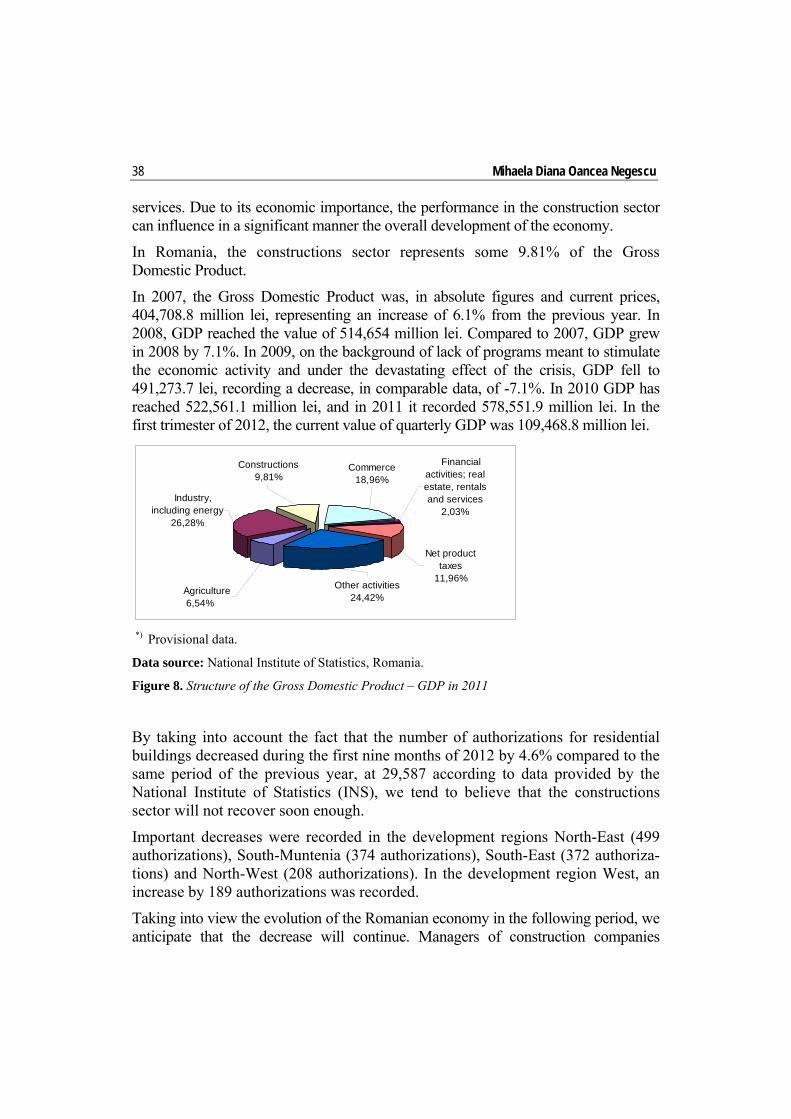
In Romania, the constructions sector represents some 9.81% of the Gross Domestic Product.
In 2007, the Gross Domestic Product was, in absolute figures and current prices, 404,708.8 million lei, representing an increase of 6.1% from the previous year. In 2008, GDP reached the value of 514,654 million lei. Compared to 2007, GDP grew in 2008 by 7.1%. In 2009, on the background of lack of programs meant to stimulate the economic activity and under the devastating effect of the crisis, GDP fell to 491,273.7 lei, recording a decrease, in comparable data, of -7.1%. In 2010 GDP has reached 522,561.1 million lei, and in 2011 it recorded 578,551.9 million lei. In the first trimester of 2012, the current value of quarterly GDP was 109,468.8 million lei.
*) Provisional data.
Data source: National Institute of Statistics, Romania.
Figure 8. Structure of the Gross Domestic Product – GDP in 2011
By taking into account the fact that the number of authorizations for residential buildings decreased during the first nine months of 2012 by 4.6% compared to the same period of the previous year, at 29,587 according to data provided by the National Institute of Statistics (INS), we tend to believe that the constructions sector will not recover soon enough.
Important decreases were recorded in the development regions North-East (499 authorizations), South-Muntenia (374 authorizations), South-East (372 authoriza-tions) and North-West (208 authorizations). In the development region West, an increase by 189 authorizations was recorded.
Taking into view the evolution of the Romanian economy in the following period, we anticipate that the decrease will continue. Managers of construction companies
Industry, including energy
26,28%
Agriculture6,54%
Other activities24,42%
Net product taxes
11,96%
Constructions9,81%
Commerce18,96%
Financial activities; real estate, rentals and services
2,03%
Effects of the financial crisis and of the evolution of real estate market
39
39
estimate for the next three months a decrease of the production volume and balance of contracts and orders. The reduction of the activity volume could determine the decrease of employees’ number subsequent to the market contraction.
In return, the gap between demand and offer, generated by the volume of industrial production in the next period, will lead to a moderate increase of prices for construction works.
Also, the infrastructure programs with European funds and investments in agriculture, especially the irrigations projects, are a real support for the constructions market. Its trend, at least until October 2012, is to fall below the level of 2011. According to the estimations of specialists, in 2012 the constructions market could be expected to decrease slightly under the level recorded in 2011, if considering the business of the constructors.
From the viewpoint of residential constructions, these affect in a lesser manner the constructions sector, even if a slight recovery is recorded in certain areas, especially the ones with distinguished economic potential.
The existence of European funds and infrastructure projects are the only factors that can impose an annual increase for the constructions sector in the years to come. The main engine of this growth is the continuation and even the start of works for highway constructions, airport and seaport rehabilitation works, improvement works for national, county and communal roads, construction of houses, office areas and deposits, and last but not least, the continuation of projects for the thermal rehabilitation of existing houses (Anica-Popa, Motofei, 2010).
The sector of road infrastructure works did not manifested significant decreases in 2009 and 2010, despite the severe economic decline remarked in Romania, and grew in 2011 to 18.7 billion lei (4.4 billion Euro), the turnover is nine times higher than the level for 2002 and with more than 20% higher than in 2010.
Until 2021, it is forecasted that Romania needs more than 10 billion Euro, only to improve the railroad corridors IV and IX, which transit Romania, linking the North with the South of Europe and the East with the South. According to the long-term strategy of the railroad sector, the costs of all improvement and renewal of the railroad infrastructure go over 17 billion Euro. Financial efforts, until 2021, will come from more sources, such as the state budget, the European funds and banking loans.
The data necessary for the analysis of the real estate market and constructions sector can be processed within a data warehouse centered environment. As an example, the SQL Server suite allows, through its Business Intelligence instruments, the use of specific economic and financial analysis techniques on the data collected from various information systems.
Mihaela Diana Oancea Negescu 40
Conclusions
Following a continuous increase of the constructions market during the period 2005-2008, the volume of constructions in Romania fell continuously until the half of 2012. Residential and non-residential constructions recorded decreases in 2011 and further remain in a difficult situation. By taking into account the evolution of our country during the following period, we consider that the decreasing trend will maintain. In Romania, from the viewpoint of houses construction, it is unlikely that the situation will significantly change over the next years. It is necessary a longer period of time to record progresses, especially in the situation in which credit conditions hardened. At the level of Romania, the constructions sector represents some 9.81% of the Gross Domestic Product.
For the revival of the domain, there are necessary further investments or other measures meant to stimulate the construction of houses, which will further have an amplified effect on the economic growth of Romania. Only the increase of demand will make possible the growth of the volume of works and implicitly of the turnover.
References Anghelache, C-tin (2011). România 2011. Starea economică în malaxorul crizei, Editura
Economică, Bucureşti Anica-Popa, I. (2011). “Development life cycle of the organizational memory for accounting
domain”, Proceedings of Creating Global Competitive Economies: A 360-Degree Approach (17th IBIMA), Milan, Italy, 14-15 November 2011
Anica-Popa, A., Motofei, Cătălina (2010). „Înfiinţarea şi modernizarea diferitelor tipuri de infrastructuri şi implicaţiile asupra actorilor din industria materialelor de construcţii”, Romanian Statistical Review Supliment, nr. 3, pp. 266-272, ISSN 1018-046X
Bărbulescu, A., Mecu, D.G. (2011). Managementul fondurilor structurale - de la idee la proiect, Editura Artifex, Bucureşti
Creţu, Raluca, Florentina, Şerban, Elena, Claudia (2011). “Analysis of the facts that have generated crisis and their impact on the SMEs in Romania”, Universitatea “Lucian Blaga” din Sibiu, Facultatea de Stiinţe Economice, Conferinţă ISI Procedings, 18th International Economic Conference IECS 2011 „Crises after the crisis. Inquiries from a national, European and global perspective”, Sibiu, România, May 19-20, 2011, ISBN CD 978-606-12-0139-6, pp. 160-166, categoria A, lucrare publicată în Revista Economica indexată BDI,http://iecs.ulbsibiu.ro/archive/2011/iecs_2011_program.pdf,http://economice.ulbsibiu.ro/revista.economica/archive/RE%202-55-2011.pdf accesată în 5.11.2012;
Manole, Al. (2007). “Techniques of Turnovers’ Evolution and Structure Analysis Using SQL Server 2005”, Theoretical and Applied Economics, Volume 7, Issue 7 (July), pp. 41-46
Colliers international (2012). 2012 Eastern Europe Real Estate Review, www.colliers.com Colliers international (2012). Romania, Research & forecast report mid-year 2012,
www.colliers.com Institutul Naţional de Statistică (2011). Anuarul statistic al României, ediţia 2011 www.insse.ro www.epp.eurostat.ec.europa.eu
Real estate market evolution trends in the context of the current economic crisis, integral part of the ecolonomic crisis
Ana Maria POPESCU The Bucharest University of Economic Studies [email protected] Irina Daniela CIŞMAŞU The Bucharest University of Economic Studies [email protected]
Abstract. The current economic crisis is an integral part of the ecolonomic crisis, because economy is an integral part of ecolonomics. The event that started as a financial crisis has amplified, by incorporating other markets, in addition to the real estate market, and has turned into a global economic crisis. All these systems are interacting and interrelating, acting as a whole, but with the specific particularities of each system.
Keywords: economic crisis; global economic crisis; real estate market; features.
Theoretical and Applied Economics Volume XX (2013), Special Issue, pp. 41-50

Ana Maria Popescu, Irina Daniela Cişmaşu 42
Introduction
In the evolution of the natural or human created environment living element, the interaction between health and crisis is part of the normal progress.
At our planet level, we are the “full integrated living entities”, the human created environment being an organic part of the natural environment. The coexisting “cosmeo-stasis” expression, based on Hwa Jen philosophy, can be explained by means of the following formulas: ”one in one; one in all; all in one; all in all”.
In the human created environment, as well as in the interactions between human beings and the natural environment, due to his behavior, the human being is considered the “internal” factor that interferes with the coexisting “cosmeo-stasis”, generating the hazards that trigger crises, as well as the overcoming opportunities.
The excesses and deficiencies of human behavior, also reflected in the institutional one, beyond the critical source of self-regulating “integrated totality”, are the ones preparing the troubles called crises. These can exist at the human being, family, community, business organization, economic and social life level, at the level of institutions defining the rules of the game in society, in case of relations between countries etc.
Currently, we are calling ecolonomic, system crisis the events registered at planet level, because the emerged hazards are negatively and severely affecting all components of the human created environment, including his interactions with the living world analogy.
The economic crisis is an integral part of the ecolonomic crisis, with specific causes related to the human behavior excesses and deficiencies in the business world, which have disrupted the relations between the economic results and the human beings’ expectations of ”having” and “being”, at human being level.
The real estate market crisis, organic part of the economic and social crisis, originates from the greed excesses – governed by the financial profits maximization and by the human fulfillment deficiencies, determined by the loss of confidence in loan facilities and incomes, in the values governing the business and society environment.
Overcoming the real estate market crisis is a process that should represent an organic part of removing the human and institutional excesses and deficiencies that have generated the humanity-free greed, responsibility-free freedom, politics without healthy principles, market with no economical responsibility, science with no humanism, etc.
Real estate market evolution trends in the context of the current economic crisis
43
43
The opportunities of overcoming the current ecolonomic crisis, which also includes the economic and social crisis, have their roots in the causes that have generated the hazards, all of them being related to “human beings downfall”, materialized in an over-proportional evolution, in a “higher” knowledge and a “lower” enforcement morality.
Regaining the spiritual side of values in consistency with human expectations represents the key of the transition from profit-oriented businesses to human-oriented businesses.
1. Markets crisis – organic component of the current ecolonomic crisis
The research based on the new paradigm called “the health of the living totality”(1) highlight the need of interpreting life, in general, and the economic-social life, in particular, as a system of interrelations and interactions between the “integrated living totalities”.(2)
By “common living totality” we understand the interrelations between the life of the living“ in the human-created environment, in the form of human families, human communities, business organizations, institutions governing the behavior games in the economic-social and political life of the state and the relations between them(3).
The human being, as human individual who became a human person, is both nature and society. This means that the integral human being includes the principles of self homeostasis, governed by the living nature laws, but also by the values-principles related to the society where he lives, works and loves in. For the harmony between the laws of nature and the society laws existing in the human being, the “system wisdom” has granted the human being with human organs: brain, eyes, hands, legs etc., in order to concomitantly exercise both the specific biological and social functions(4).
When there is harmony between these functions we say that the human being’s health as “integrated living totality” ensures the maximum use of his energetic potential, being able to keep under control the adverse consequences of behavior excesses and deficits materialized in the interactions that occur on the vertical of the human living, but also on the horizontal, where he coexists and succeeds.
A healthy human being as “integrated living totality” is defined by the set of harmonious interrelations and interactions both with himself, with the divinity in which he has faith, on the vertical of his own purpose evolution, as well as with his fellows, with the analogy of the living world to which he organically belongs.

Ana Maria Popescu, Irina Daniela Cişmaşu 44
Based on this perspective the supporters of this new world consider that “integrated living totality” we should also talk about the health of the human family, about the “health of the human community”, “the health of the business organization”, “the institutional health” of the state.
Ecolonomically, a healthy human being can only grow in healthy families, healthy communities, healthy business organizations, healthy institutions, in a healthy natural environment.
For instance, a healthy business organization, which is in fact the “labor family”, can be considered whenever its results – goods and services, incomes generated by the production thereof: wages, profit, interests, dividends, taxes etc. – are the expression of a harmony with the natural environment between companies and shareholders, between such organization and the relevant community, between this and the families of those working in the economic society etc.
When business is good for people, according to Richard Bronson, when the obtained products are manufactured in harmony with the environment requirements and in compliance with people, communities and family aspirations, then and only then we can talk about healthy economic profits.
In the economic life, or in the business life, the human behaviors materialized in demand and supply are integrated within certain markets subject to interrelations and interactions, governed by entries, transformations and exits specific for various economic processes, part of a certain labor division.
Each of these economic life markets, where all participants are selling and buying what is required for their own interests: families, enterprises, public administration etc. and all together have their own ‘’homeostasis”, organic part of the “invisible hand” that governs our choices by using limited resources under uncertainty conditions.
When these choices made by the economic life participants in compliance with their own needs-interests are based on the principles of life in harmony, based on the liability freedom, freedom of solidarity and social excesses, the behavior excesses and difficulties are almost “invisible” as negative influences, the rule “win-win” becomes the engine of the political motivation for all those involved.
The hazards that are forecasting crisis occur whenever the human behavior excesses and difficulties, in its various forms, are affecting the economic life “homeostasis”, by braking the harmonies between “having” and “being” at the level of shareholders, families and communities, public institutions etc.
In essence, these hazards originate from freedom excesses and responsibility deficiencies, greed excesses and humanity deficiencies; the financial gain
Real estate market evolution trends in the context of the current economic crisis
45
45
excesses and ecological, family, community obstacles caused by pollution, unemployment, tax evasion, corruption, etc.
When the behavior excesses and deficiencies on various markets of the economic life interconnect, become deeper and comprehensive, the entire economic life is in crisis, and when these spread at the “entire economic life” level, the economic crisis occurs. It affects all living components created by human kind, the health thereof as an integrated living totality and, consequently, the health of the entire common living.
The solution to the current events is not only a problem of the financial life, as some are unfortunately stating, but of the entire economic-social, institutional life, which, at a global scale, has lost its compasses. That means that it has lost its values and principles laying at the basis of the “entire human living health”. Instead of healthy values and principles we have seen “durable similar values and principles, for people and their families, human communities and business organizations for the life game and environment institutions” that guarantee our survival”. We refer to: greed run by egotist selfishness, a pathological individualism, the desire of dominating at all price and anyone, the desire for power, by using scientific knowledge.
And, by using Einstein’s wisdom in the settlement of the current economic, systemic and universal crisis we can state that, in order to identify the opportunities of the crisis itself, we need another human and institutional mind, totally different from the one that has caused the most severe deficit of love, confidence and faith of humankind history, expressed in the “human kind downfall’’.
In our opinion, the human kind rise through its conscience, by placing the bases of a new educational model, which integrates the value of love in the creation of a valuable person, instead of the successful person, the value of freedom for purpose and of faith in certitude with the defining elements of universal harmony, represents the solution for the current ecolonomic crisis.
2. Crisis particularities on the real estate market
As stated above, the real estate market crisis is an integral part of the “crisis of markets” included in the economic life, and, consequently, the causes generating human and institutional behavior excesses and deficiencies can also be found in this field, but in determined specific forms of the economic interests that accompany the supply and demand on such market.
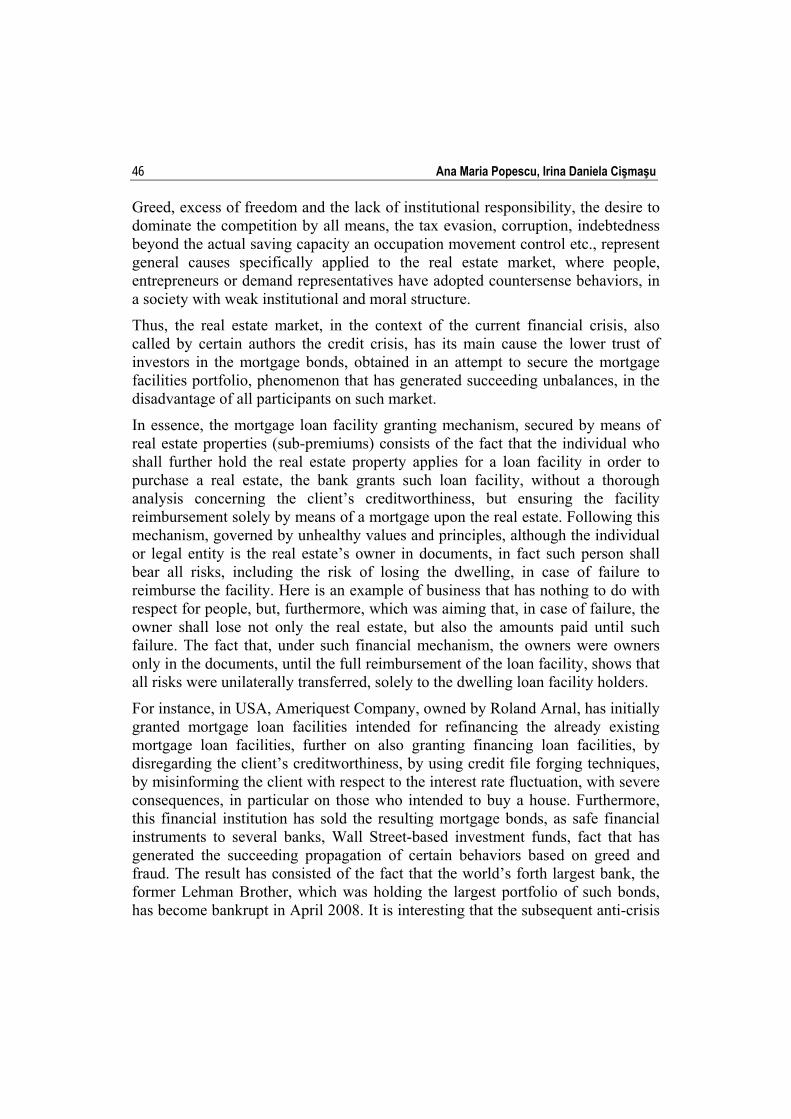
Ana Maria Popescu, Irina Daniela Cişmaşu 46
Greed, excess of freedom and the lack of institutional responsibility, the desire to dominate the competition by all means, the tax evasion, corruption, indebtedness beyond the actual saving capacity an occupation movement control etc., represent general causes specifically applied to the real estate market, where people, entrepreneurs or demand representatives have adopted countersense behaviors, in a society with weak institutional and moral structure.
Thus, the real estate market, in the context of the current financial crisis, also called by certain authors the credit crisis, has its main cause the lower trust of investors in the mortgage bonds, obtained in an attempt to secure the mortgage facilities portfolio, phenomenon that has generated succeeding unbalances, in the disadvantage of all participants on such market.
In essence, the mortgage loan facility granting mechanism, secured by means of real estate properties (sub-premiums) consists of the fact that the individual who shall further hold the real estate property applies for a loan facility in order to purchase a real estate, the bank grants such loan facility, without a thorough analysis concerning the client’s creditworthiness, but ensuring the facility reimbursement solely by means of a mortgage upon the real estate. Following this mechanism, governed by unhealthy values and principles, although the individual or legal entity is the real estate’s owner in documents, in fact such person shall bear all risks, including the risk of losing the dwelling, in case of failure to reimburse the facility. Here is an example of business that has nothing to do with respect for people, but, furthermore, which was aiming that, in case of failure, the owner shall lose not only the real estate, but also the amounts paid until such failure. The fact that, under such financial mechanism, the owners were owners only in the documents, until the full reimbursement of the loan facility, shows that all risks were unilaterally transferred, solely to the dwelling loan facility holders.
For instance, in USA, Ameriquest Company, owned by Roland Arnal, has initially granted mortgage loan facilities intended for refinancing the already existing mortgage loan facilities, further on also granting financing loan facilities, by disregarding the client’s creditworthiness, by using credit file forging techniques, by misinforming the client with respect to the interest rate fluctuation, with severe consequences, in particular on those who intended to buy a house. Furthermore, this financial institution has sold the resulting mortgage bonds, as safe financial instruments to several banks, Wall Street-based investment funds, fact that has generated the succeeding propagation of certain behaviors based on greed and fraud. The result has consisted of the fact that the world’s forth largest bank, the former Lehman Brother, which was holding the largest portfolio of such bonds, has become bankrupt in April 2008. It is interesting that the subsequent anti-crisis
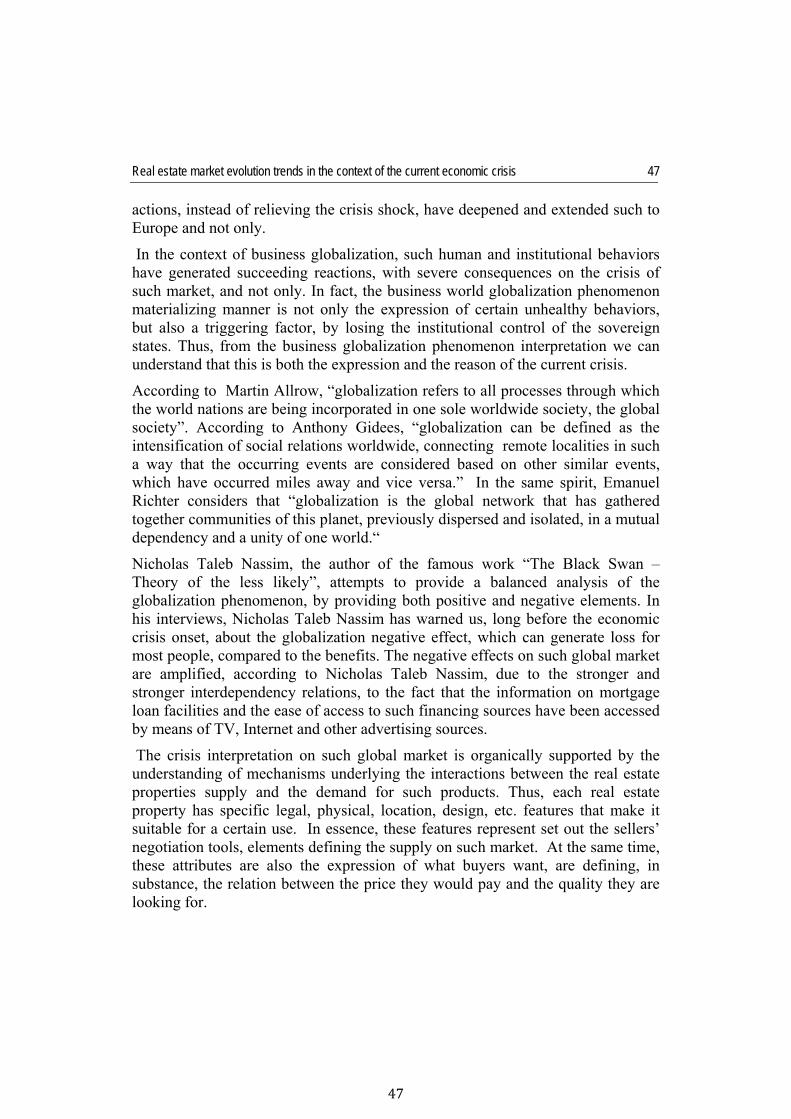
Real estate market evolution trends in the context of the current economic crisis
47
47
actions, instead of relieving the crisis shock, have deepened and extended such to Europe and not only.
In the context of business globalization, such human and institutional behaviors have generated succeeding reactions, with severe consequences on the crisis of such market, and not only. In fact, the business world globalization phenomenon materializing manner is not only the expression of certain unhealthy behaviors, but also a triggering factor, by losing the institutional control of the sovereign states. Thus, from the business globalization phenomenon interpretation we can understand that this is both the expression and the reason of the current crisis.
According to Martin Allrow, “globalization refers to all processes through which the world nations are being incorporated in one sole worldwide society, the global society”. According to Anthony Gidees, “globalization can be defined as the intensification of social relations worldwide, connecting remote localities in such a way that the occurring events are considered based on other similar events, which have occurred miles away and vice versa.” In the same spirit, Emanuel Richter considers that “globalization is the global network that has gathered together communities of this planet, previously dispersed and isolated, in a mutual dependency and a unity of one world.“
Nicholas Taleb Nassim, the author of the famous work “The Black Swan – Theory of the less likely”, attempts to provide a balanced analysis of the globalization phenomenon, by providing both positive and negative elements. In his interviews, Nicholas Taleb Nassim has warned us, long before the economic crisis onset, about the globalization negative effect, which can generate loss for most people, compared to the benefits. The negative effects on such global market are amplified, according to Nicholas Taleb Nassim, due to the stronger and stronger interdependency relations, to the fact that the information on mortgage loan facilities and the ease of access to such financing sources have been accessed by means of TV, Internet and other advertising sources.
The crisis interpretation on such global market is organically supported by the understanding of mechanisms underlying the interactions between the real estate properties supply and the demand for such products. Thus, each real estate property has specific legal, physical, location, design, etc. features that make it suitable for a certain use. In essence, these features represent set out the sellers’ negotiation tools, elements defining the supply on such market. At the same time, these attributes are also the expression of what buyers want, are defining, in substance, the relation between the price they would pay and the quality they are looking for.
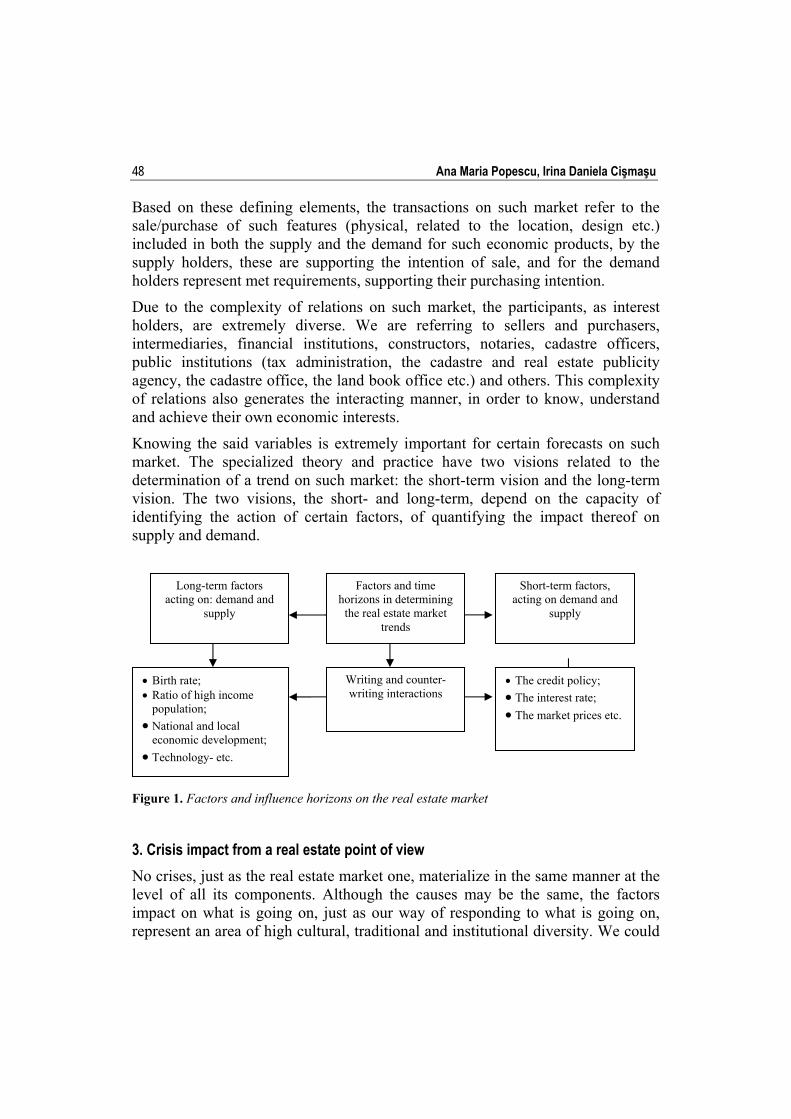
Ana Maria Popescu, Irina Daniela Cişmaşu 48
Based on these defining elements, the transactions on such market refer to the sale/purchase of such features (physical, related to the location, design etc.) included in both the supply and the demand for such economic products, by the supply holders, these are supporting the intention of sale, and for the demand holders represent met requirements, supporting their purchasing intention.
Due to the complexity of relations on such market, the participants, as interest holders, are extremely diverse. We are referring to sellers and purchasers, intermediaries, financial institutions, constructors, notaries, cadastre officers, public institutions (tax administration, the cadastre and real estate publicity agency, the cadastre office, the land book office etc.) and others. This complexity of relations also generates the interacting manner, in order to know, understand and achieve their own economic interests.
Knowing the said variables is extremely important for certain forecasts on such market. The specialized theory and practice have two visions related to the determination of a trend on such market: the short-term vision and the long-term vision. The two visions, the short- and long-term, depend on the capacity of identifying the action of certain factors, of quantifying the impact thereof on supply and demand.
Figure 1. Factors and influence horizons on the real estate market
3. Crisis impact from a real estate point of view
No crises, just as the real estate market one, materialize in the same manner at the level of all its components. Although the causes may be the same, the factors impact on what is going on, just as our way of responding to what is going on, represent an area of high cultural, traditional and institutional diversity. We could
Long-term factors acting on: demand and
supply
Factors and time horizons in determining
the real estate market trends
Short-term factors, acting on demand and
supply
Birth rate; Ratio of high income
population;
National and local economic development;
Technology- etc.
Writing and counter-writing interactions
The credit policy;
The interest rate; The market prices etc.
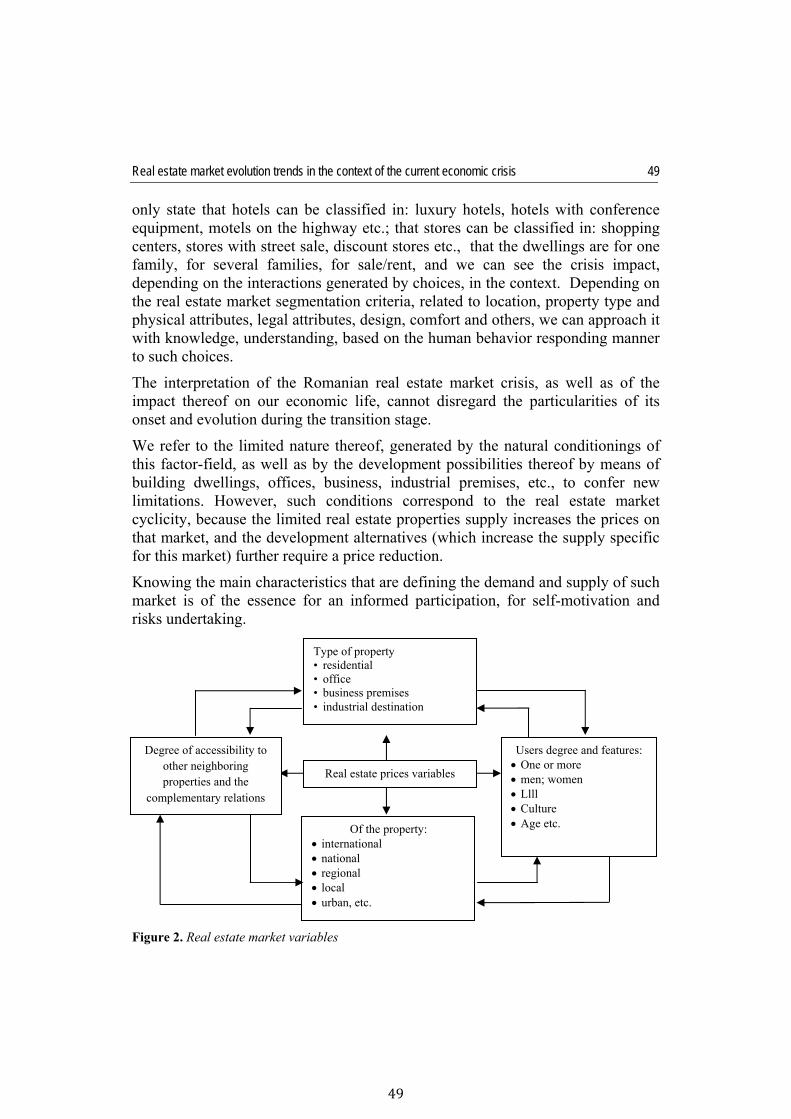
Real estate market evolution trends in the context of the current economic crisis
49
49
only state that hotels can be classified in: luxury hotels, hotels with conference equipment, motels on the highway etc.; that stores can be classified in: shopping centers, stores with street sale, discount stores etc., that the dwellings are for one family, for several families, for sale/rent, and we can see the crisis impact, depending on the interactions generated by choices, in the context. Depending on the real estate market segmentation criteria, related to location, property type and physical attributes, legal attributes, design, comfort and others, we can approach it with knowledge, understanding, based on the human behavior responding manner to such choices.
The interpretation of the Romanian real estate market crisis, as well as of the impact thereof on our economic life, cannot disregard the particularities of its onset and evolution during the transition stage.
We refer to the limited nature thereof, generated by the natural conditionings of this factor-field, as well as by the development possibilities thereof by means of building dwellings, offices, business, industrial premises, etc., to confer new limitations. However, such conditions correspond to the real estate market cyclicity, because the limited real estate properties supply increases the prices on that market, and the development alternatives (which increase the supply specific for this market) further require a price reduction.
Knowing the main characteristics that are defining the demand and supply of such market is of the essence for an informed participation, for self-motivation and risks undertaking.
Figure 2. Real estate market variables
Real estate prices variables
Degree of accessibility to other neighboring properties and the
complementary relations
Users degree and features: One or more men; women Llll Culture Age etc.Of the property:
international national regional local urban, etc.
Type of property • residential • office • business premises • industrial destination
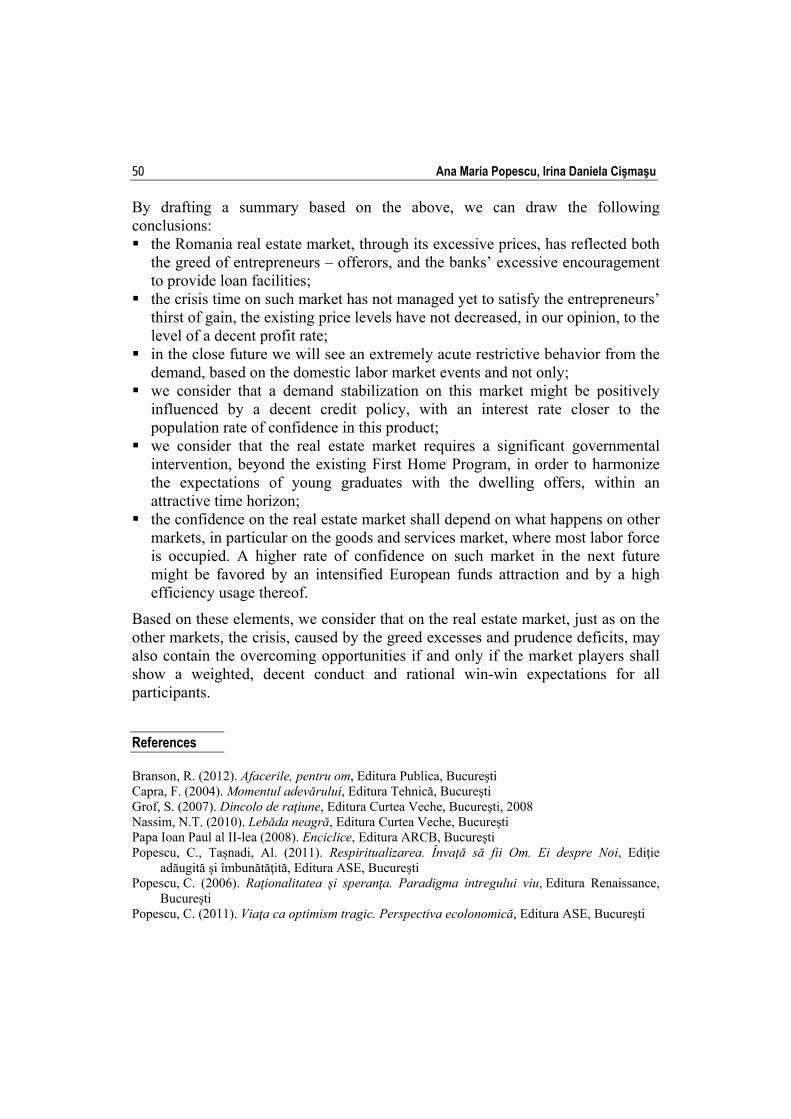
Ana Maria Popescu, Irina Daniela Cişmaşu 50
By drafting a summary based on the above, we can draw the following conclusions: the Romania real estate market, through its excessive prices, has reflected both
the greed of entrepreneurs – offerors, and the banks’ excessive encouragement to provide loan facilities;
the crisis time on such market has not managed yet to satisfy the entrepreneurs’ thirst of gain, the existing price levels have not decreased, in our opinion, to the level of a decent profit rate;
in the close future we will see an extremely acute restrictive behavior from the demand, based on the domestic labor market events and not only;
we consider that a demand stabilization on this market might be positively influenced by a decent credit policy, with an interest rate closer to the population rate of confidence in this product;
we consider that the real estate market requires a significant governmental intervention, beyond the existing First Home Program, in order to harmonize the expectations of young graduates with the dwelling offers, within an attractive time horizon;
the confidence on the real estate market shall depend on what happens on other markets, in particular on the goods and services market, where most labor force is occupied. A higher rate of confidence on such market in the next future might be favored by an intensified European funds attraction and by a high efficiency usage thereof.
Based on these elements, we consider that on the real estate market, just as on the other markets, the crisis, caused by the greed excesses and prudence deficits, may also contain the overcoming opportunities if and only if the market players shall show a weighted, decent conduct and rational win-win expectations for all participants.
References Branson, R. (2012). Afacerile, pentru om, Editura Publica, Bucureşti Capra, F. (2004). Momentul adevărului, Editura Tehnică, Bucureşti Grof, S. (2007). Dincolo de raţiune, Editura Curtea Veche, Bucureşti, 2008 Nassim, N.T. (2010). Lebăda neagră, Editura Curtea Veche, Bucureşti Papa Ioan Paul al II-lea (2008). Enciclice, Editura ARCB, Bucureşti Popescu, C., Tașnadi, Al. (2011). Respiritualizarea. Învaţă să fii Om. Ei despre Noi, Ediţie
adăugită şi îmbunătăţită, Editura ASE, București Popescu, C. (2006). Raţionalitatea şi speranţa. Paradigma intregului viu, Editura Renaissance,
Bucureşti Popescu, C. (2011). Viaţa ca optimism tragic. Perspectiva ecolonomică, Editura ASE, Bucureşti
Real estate market and evolution of interest for real estate credits
Adrian ANICA-POPA The Bucharest University of Economic Studies [email protected]
Abstract. Real estate market, developers and construction companies met a decline in the last year due to the financial crisis that begun at the end of 2008. The study aims to identify the correlations between the economic conjecture identified at national and international level and the evolution of the real estate market. Also, it was emphasized the correlation between the evolution of the real properties prices and the interest rate level for mortgage credits.
Keywords: real estate market; economic crisis; mortgage credits; interest.
Theoretical and Applied Economics Volume XX (2013), Special Issue, pp. 51-62
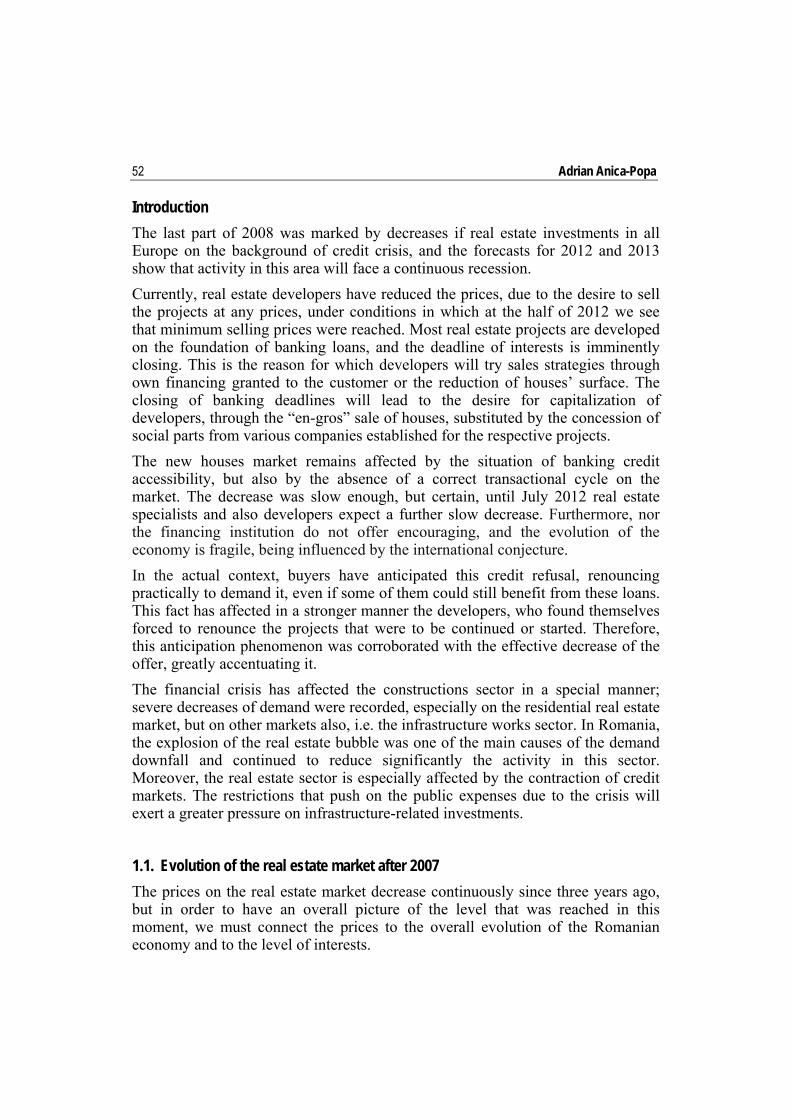
Adrian Anica-Popa 52
Introduction
The last part of 2008 was marked by decreases if real estate investments in all Europe on the background of credit crisis, and the forecasts for 2012 and 2013 show that activity in this area will face a continuous recession.
Currently, real estate developers have reduced the prices, due to the desire to sell the projects at any prices, under conditions in which at the half of 2012 we see that minimum selling prices were reached. Most real estate projects are developed on the foundation of banking loans, and the deadline of interests is imminently closing. This is the reason for which developers will try sales strategies through own financing granted to the customer or the reduction of houses’ surface. The closing of banking deadlines will lead to the desire for capitalization of developers, through the “en-gros” sale of houses, substituted by the concession of social parts from various companies established for the respective projects.
The new houses market remains affected by the situation of banking credit accessibility, but also by the absence of a correct transactional cycle on the market. The decrease was slow enough, but certain, until July 2012 real estate specialists and also developers expect a further slow decrease. Furthermore, nor the financing institution do not offer encouraging, and the evolution of the economy is fragile, being influenced by the international conjecture.
In the actual context, buyers have anticipated this credit refusal, renouncing practically to demand it, even if some of them could still benefit from these loans. This fact has affected in a stronger manner the developers, who found themselves forced to renounce the projects that were to be continued or started. Therefore, this anticipation phenomenon was corroborated with the effective decrease of the offer, greatly accentuating it.
The financial crisis has affected the constructions sector in a special manner; severe decreases of demand were recorded, especially on the residential real estate market, but on other markets also, i.e. the infrastructure works sector. In Romania, the explosion of the real estate bubble was one of the main causes of the demand downfall and continued to reduce significantly the activity in this sector. Moreover, the real estate sector is especially affected by the contraction of credit markets. The restrictions that push on the public expenses due to the crisis will exert a greater pressure on infrastructure-related investments.
1.1. Evolution of the real estate market after 2007
The prices on the real estate market decrease continuously since three years ago, but in order to have an overall picture of the level that was reached in this moment, we must connect the prices to the overall evolution of the Romanian economy and to the level of interests.
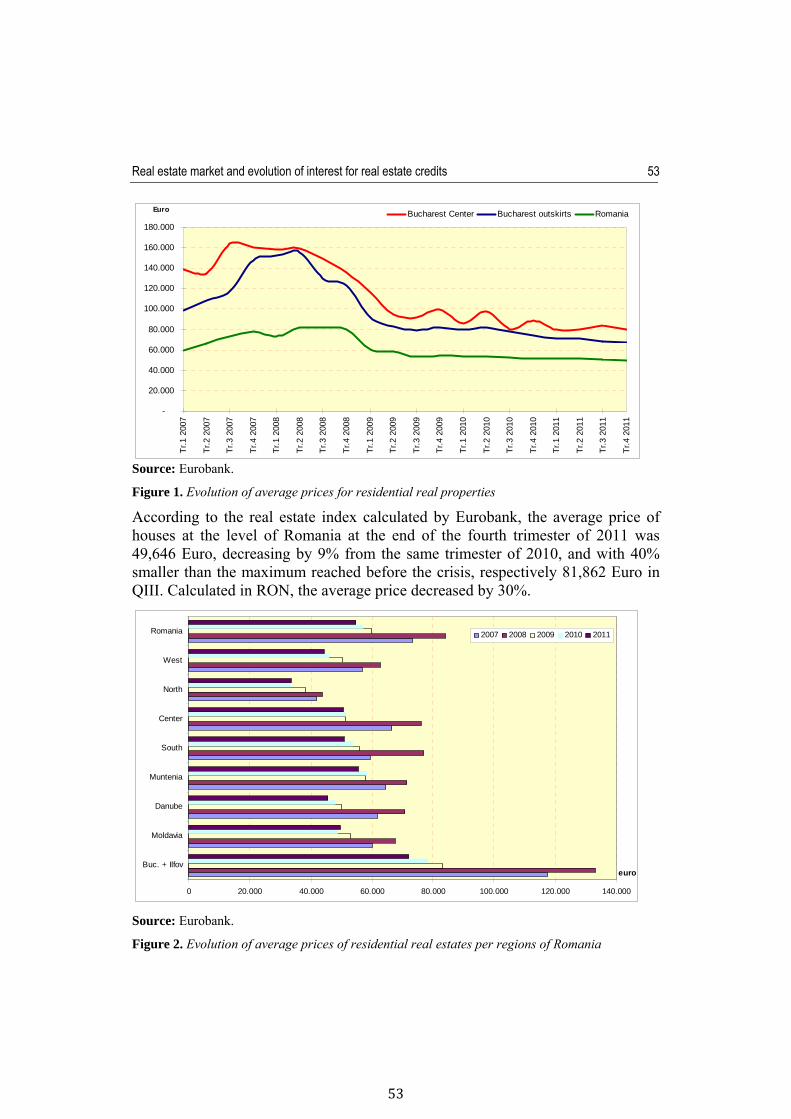
Real estate market and evolution of interest for real estate credits
53
53
Source: Eurobank.
Figure 1. Evolution of average prices for residential real properties
According to the real estate index calculated by Eurobank, the average price of houses at the level of Romania at the end of the fourth trimester of 2011 was 49,646 Euro, decreasing by 9% from the same trimester of 2010, and with 40% smaller than the maximum reached before the crisis, respectively 81,862 Euro in QIII. Calculated in RON, the average price decreased by 30%.
Source: Eurobank.
Figure 2. Evolution of average prices of residential real estates per regions of Romania
-
20.000
40.000
60.000
80.000
100.000
120.000
140.000
160.000
180.000
Tr.1
200
7
Tr.2
200
7
Tr.3
200
7
Tr.4
200
7
Tr.1
200
8
Tr.2
200
8
Tr.3
200
8
Tr.4
200
8
Tr.1
200
9
Tr.2
200
9
Tr.3
200
9
Tr.4
200
9
Tr.1
201
0
Tr.2
201
0
Tr.3
201
0
Tr.4
201
0
Tr.1
201
1
Tr.2
201
1
Tr.3
201
1
Tr.4
201
1
Euro Bucharest Center Bucharest outskirts Romania
0 20.000 40.000 60.000 80.000 100.000 120.000 140.000
Buc. + Ilfov
Moldavia
Danube
Muntenia
South
Center
North
West
Romania
euro
2007 2008 2009 2010 2011
Adrian Anica-Popa 54
The effect of financial crisis triggering was the one to stop the increase of prices, and the buyers have even ascertained a decreasing trend for house prices, becoming meanwhile more patient into making investments further expecting the reduction of prices. The drastic decrease of real estate transactions has determined the developers to become mode prudent, downsizing or renouncing the new projects that were to be launched in the near future. In this case, the psychological factor acts like a brake, the buyers being more reticent regarding the acquisitions and moreover in the problem of houses, viewed by the most part of the population as the most important investment of a lifetime. If until September 2008, the applicable principle was “anything I buy today, tomorrow it will be more expensive”, after this period acquisitions are not made anymore on emotional factors, they have disappeared and left more place to the rational place.
1.2. Evaluation of the health status of Romania
Evaluation of the health status of a country reflects on a macroeconomic indicator named the Gross Domestic Product – GDP. The Gross Domestic Product reflects the sum of the market value of all merchandises and services meant for final consumption, manufactured in all the branches inside a country during an year.
The components of the Gross Domestic Product are: The private consumption – it is normally the greatest component of the GDP,
representing the expenses of households inside the economy. These expenses can be classified as: sustainable goods, perishable goods and services;
The state expenses – or the consumption of the public sector, represent the sum of all government expenses for finished goods and services. It includes the salaries of public sector employees, acquisition of armament etc.;
Investments include investments in plants, equipments, inventories and do not include the exchange of existing assets;
Exports represent the gross exports of a country, including goods and services, destined to be consumed in another country;
Imports represent gross imports.
The abrupt decline of GDP in Romania in 2009 followed the strong reduction of constructions, agriculture and services. On the other hand, in 2010, the real growth ratio of the GDP was supported by industry, the constructions remained a sector with negative growth ratio. For the following years, there is a prognosis that envisions a positive real growth ratio of the GDP, the recovery process being sustained by constructions, industry and services.
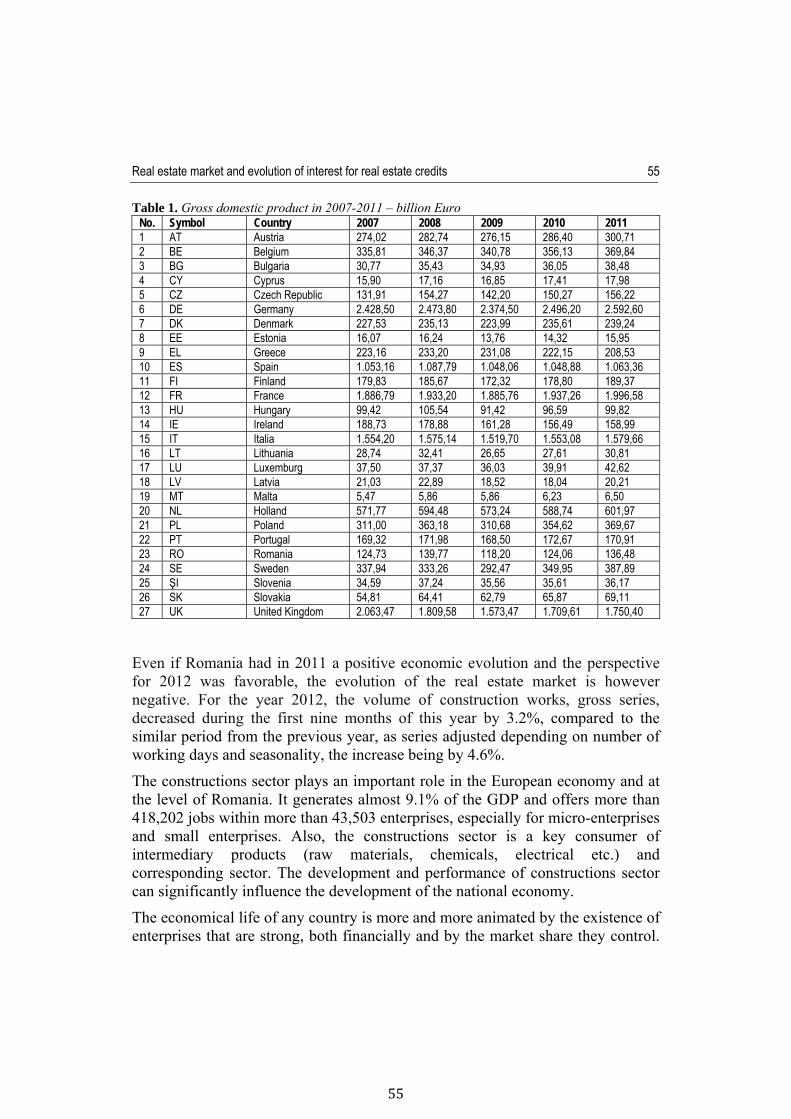
Real estate market and evolution of interest for real estate credits
55
55
Table 1. Gross domestic product in 2007-2011 – billion Euro No. Symbol Country 2007 2008 2009 2010 2011 1 AT Austria 274,02 282,74 276,15 286,40 300,71 2 BE Belgium 335,81 346,37 340,78 356,13 369,84 3 BG Bulgaria 30,77 35,43 34,93 36,05 38,48 4 CY Cyprus 15,90 17,16 16,85 17,41 17,98 5 CZ Czech Republic 131,91 154,27 142,20 150,27 156,22 6 DE Germany 2.428,50 2.473,80 2.374,50 2.496,20 2.592,60 7 DK Denmark 227,53 235,13 223,99 235,61 239,24 8 EE Estonia 16,07 16,24 13,76 14,32 15,95 9 EL Greece 223,16 233,20 231,08 222,15 208,53 10 ES Spain 1.053,16 1.087,79 1.048,06 1.048,88 1.063,36 11 FI Finland 179,83 185,67 172,32 178,80 189,37 12 FR France 1.886,79 1.933,20 1.885,76 1.937,26 1.996,58 13 HU Hungary 99,42 105,54 91,42 96,59 99,82 14 IE Ireland 188,73 178,88 161,28 156,49 158,99 15 IT Italia 1.554,20 1.575,14 1.519,70 1.553,08 1.579,66 16 LT Lithuania 28,74 32,41 26,65 27,61 30,81 17 LU Luxemburg 37,50 37,37 36,03 39,91 42,62 18 LV Latvia 21,03 22,89 18,52 18,04 20,21 19 MT Malta 5,47 5,86 5,86 6,23 6,50 20 NL Holland 571,77 594,48 573,24 588,74 601,97 21 PL Poland 311,00 363,18 310,68 354,62 369,67 22 PT Portugal 169,32 171,98 168,50 172,67 170,91 23 RO Romania 124,73 139,77 118,20 124,06 136,48 24 SE Sweden 337,94 333,26 292,47 349,95 387,89 25 ŞI Slovenia 34,59 37,24 35,56 35,61 36,17 26 SK Slovakia 54,81 64,41 62,79 65,87 69,11 27 UK United Kingdom 2.063,47 1.809,58 1.573,47 1.709,61 1.750,40
Even if Romania had in 2011 a positive economic evolution and the perspective for 2012 was favorable, the evolution of the real estate market is however negative. For the year 2012, the volume of construction works, gross series, decreased during the first nine months of this year by 3.2%, compared to the similar period from the previous year, as series adjusted depending on number of working days and seasonality, the increase being by 4.6%.
The constructions sector plays an important role in the European economy and at the level of Romania. It generates almost 9.1% of the GDP and offers more than 418,202 jobs within more than 43,503 enterprises, especially for micro-enterprises and small enterprises. Also, the constructions sector is a key consumer of intermediary products (raw materials, chemicals, electrical etc.) and corresponding sector. The development and performance of constructions sector can significantly influence the development of the national economy.
The economical life of any country is more and more animated by the existence of enterprises that are strong, both financially and by the market share they control.
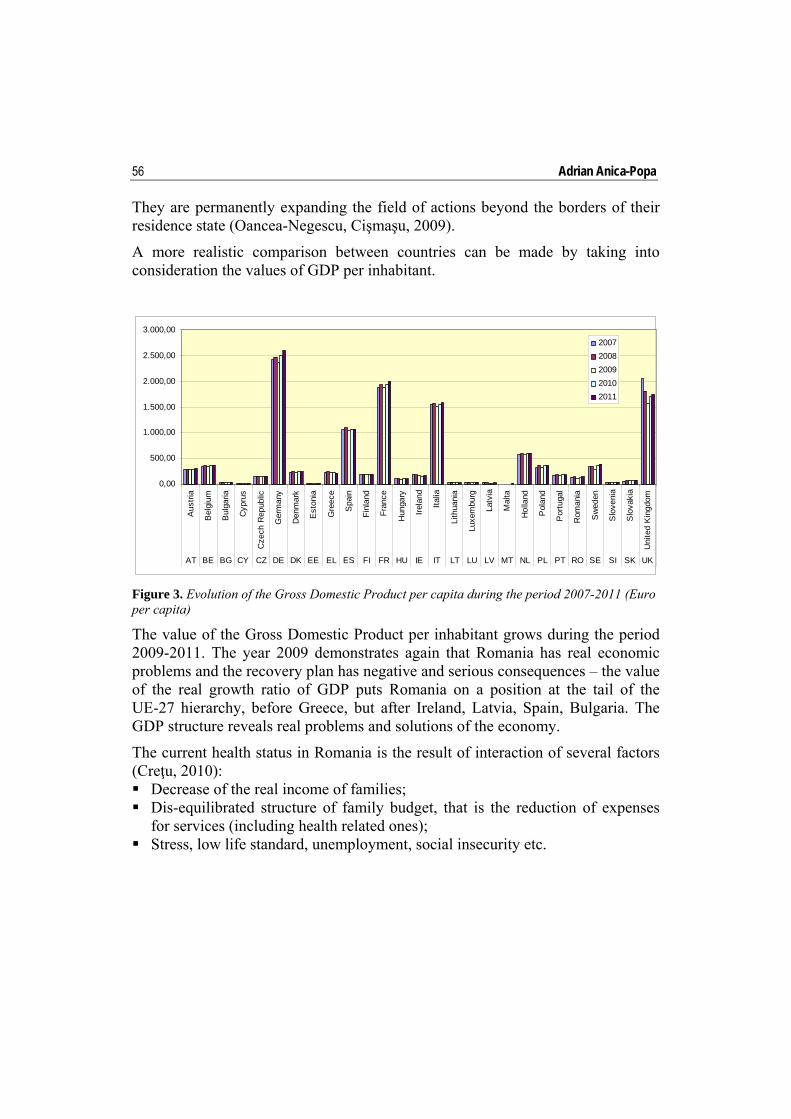
Adrian Anica-Popa 56
They are permanently expanding the field of actions beyond the borders of their residence state (Oancea-Negescu, Cişmaşu, 2009).
A more realistic comparison between countries can be made by taking into consideration the values of GDP per inhabitant.
Figure 3. Evolution of the Gross Domestic Product per capita during the period 2007-2011 (Euro per capita)
The value of the Gross Domestic Product per inhabitant grows during the period 2009-2011. The year 2009 demonstrates again that Romania has real economic problems and the recovery plan has negative and serious consequences – the value of the real growth ratio of GDP puts Romania on a position at the tail of the UE-27 hierarchy, before Greece, but after Ireland, Latvia, Spain, Bulgaria. The GDP structure reveals real problems and solutions of the economy.
The current health status in Romania is the result of interaction of several factors (Creţu, 2010): Decrease of the real income of families; Dis-equilibrated structure of family budget, that is the reduction of expenses
for services (including health related ones); Stress, low life standard, unemployment, social insecurity etc.
0,00
500,00
1.000,00
1.500,00
2.000,00
2.500,00
3.000,00
Aus
tria
Bel
gium
Bul
garia
Cyp
rus
Cze
ch R
epub
lic
Ger
man
y
Den
mar
k
Est
onia
Gre
ece
Spa
in
Finl
and
Fran
ce
Hun
gary
Irela
nd
Italia
Lith
uani
a
Luxe
mbu
rg
Latv
ia
Mal
ta
Hol
land
Pol
and
Por
tuga
l
Rom
ania
Sw
eden
Slo
veni
a
Slo
vaki
a
Uni
ted
Kin
gdom
AT BE BG CY CZ DE DK EE EL ES FI FR HU IE IT LT LU LV MT NL PL PT RO SE SI SK UK
20072008200920102011
Real estate market and evolution of interest for real estate credits
57
57
1.3. The evolution of interests in Romania before and after the triggering of the financial crisis
As an answer to the crisis, some countries of the European Union have invested in stimulatory packages, i.e. through investments in anticipate infrastructure projects, reduced TVA quotas for new constructions and/or building renovations, preferential interest rates for mortgage credits etc. It is necessary the elaboration of some adequate policies that are to stimulate the economic growth and occupation of labor force on short term, but to simultaneously encourage a reshape of the construction sector on long term. The increase of the population purchasing power can infuse a certain credibility for the banks and revive the real estate market. In the same time, in order to reduce costs and to increase productivity it is necessary that companies involved on construction industry to collaborate in order to implement inter-organizational information systems (Anica-Popa, 2011).
The starting point is the level of the reference interest rate, offered by the National Bank of Romania.
Table 2. Reference interest of NBR during the period 2007-2011 No. Name 2007 2008 2009 2010 2011 1 January 8.75 7.50 10.25 8.00 6.25 2 February 8.75 8.00 10.25 7.50 6.25 3 March 8.08 9.00 10.14 7.25 6.25 4 April 8.00 9.03 10.07 7.00 6.25 5 may 7.50 9.50 10.02 6.50 6.25 6 June 7.25 9.75 9.71 6.25 6.25 7 July 7.25 9.75 9.50 6.25 6.25 8 August 6.10 10.00 9.00 6.25 6.25 9 September 6.48 10.25 8.53 6.25 6.25 10 October 6.87 10.25 8.50 6.25 6.00 11 November 7.00 10.25 8.00 6.25 6.00 12 December 7.50 10.25 8.00 6.25 6.00
As it can be seen, there is a trend, at least until this moment, of reducing the reference interest of NBR.
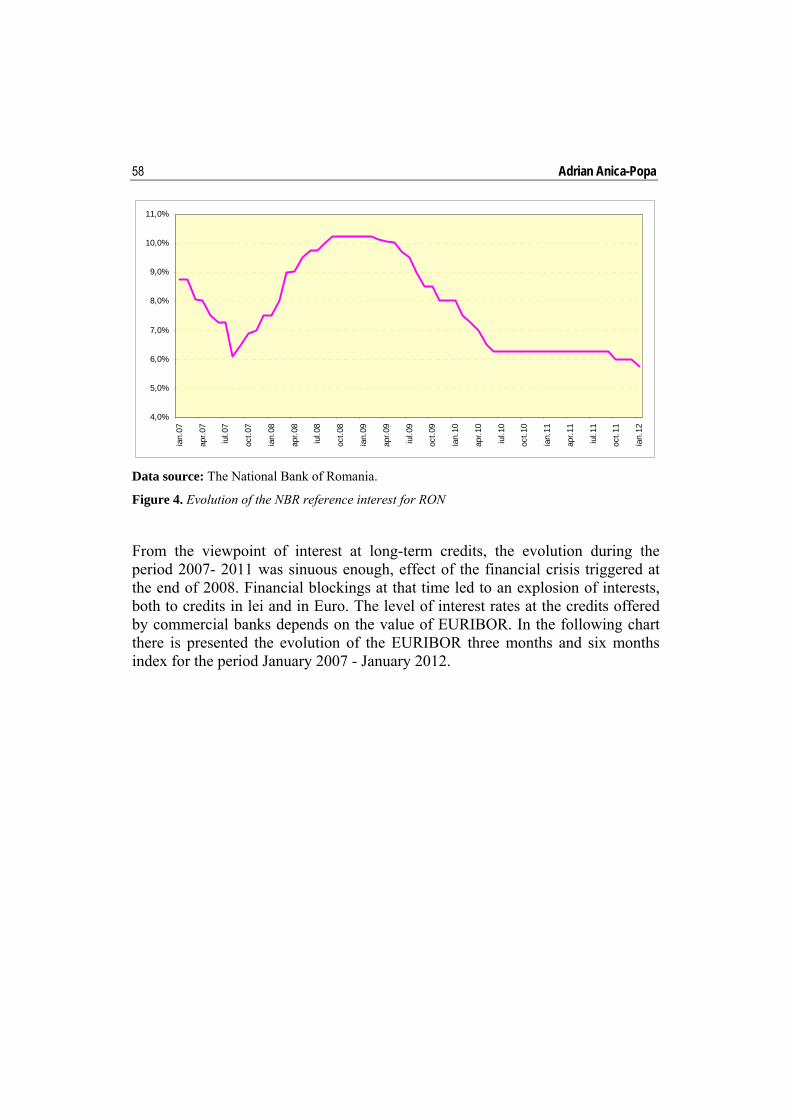
Adrian Anica-Popa 58
Data source: The National Bank of Romania.
Figure 4. Evolution of the NBR reference interest for RON
From the viewpoint of interest at long-term credits, the evolution during the period 2007- 2011 was sinuous enough, effect of the financial crisis triggered at the end of 2008. Financial blockings at that time led to an explosion of interests, both to credits in lei and in Euro. The level of interest rates at the credits offered by commercial banks depends on the value of EURIBOR. In the following chart there is presented the evolution of the EURIBOR three months and six months index for the period January 2007 - January 2012.
4,0%
5,0%
6,0%
7,0%
8,0%
9,0%
10,0%
11,0%
ian.
07
apr.0
7
iul.0
7
oct.0
7
ian.
08
apr.0
8
iul.0
8
oct.0
8
ian.
09
apr.0
9
iul.0
9
oct.0
9
ian.
10
apr.1
0
iul.1
0
oct.1
0
ian.
11
apr.1
1
iul.1
1
oct.1
1
ian.
12
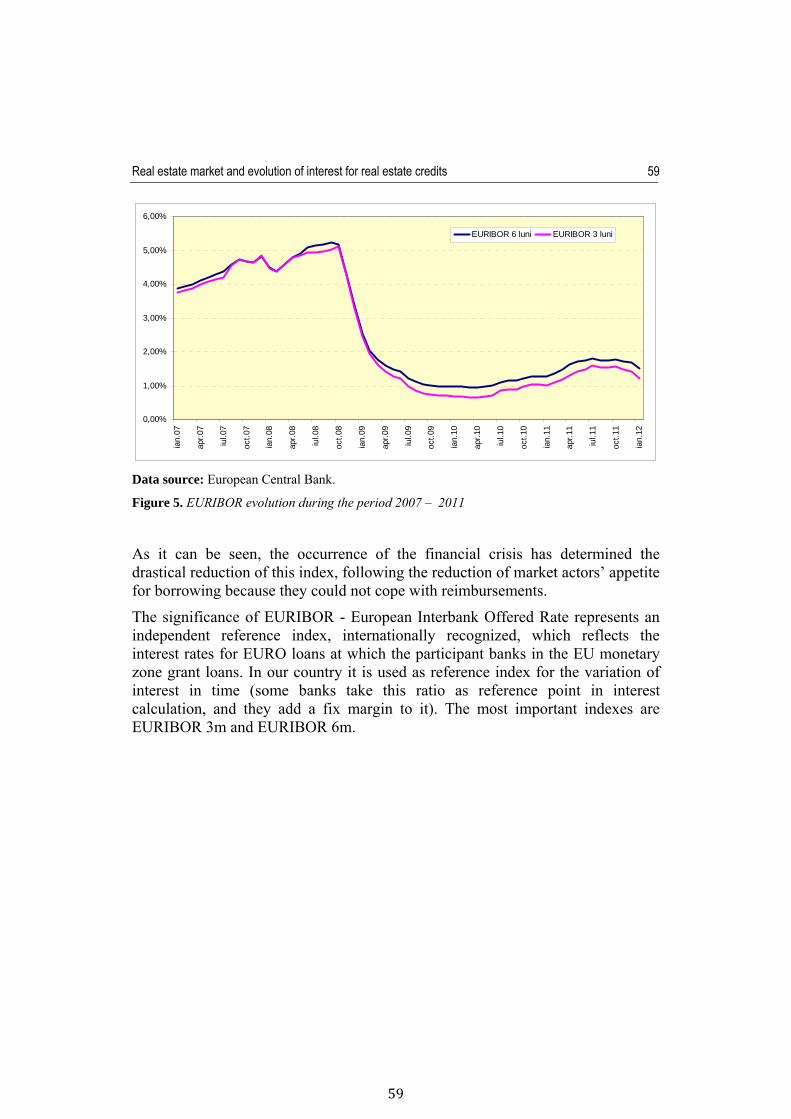
Real estate market and evolution of interest for real estate credits
59
59
Data source: European Central Bank.
Figure 5. EURIBOR evolution during the period 2007 – 2011
As it can be seen, the occurrence of the financial crisis has determined the drastical reduction of this index, following the reduction of market actors’ appetite for borrowing because they could not cope with reimbursements.
The significance of EURIBOR - European Interbank Offered Rate represents an independent reference index, internationally recognized, which reflects the interest rates for EURO loans at which the participant banks in the EU monetary zone grant loans. In our country it is used as reference index for the variation of interest in time (some banks take this ratio as reference point in interest calculation, and they add a fix margin to it). The most important indexes are EURIBOR 3m and EURIBOR 6m.
0,00%
1,00%
2,00%
3,00%
4,00%
5,00%
6,00%
ian.
07
apr.0
7
iul.0
7
oct.0
7
ian.
08
apr.0
8
iul.0
8
oct.0
8
ian.
09
apr.0
9
iul.0
9
oct.0
9
ian.
10
apr.1
0
iul.1
0
oct.1
0
ian.
11
apr.1
1
iul.1
1
oct.1
1
ian.
12
EURIBOR 6 luni EURIBOR 3 luni
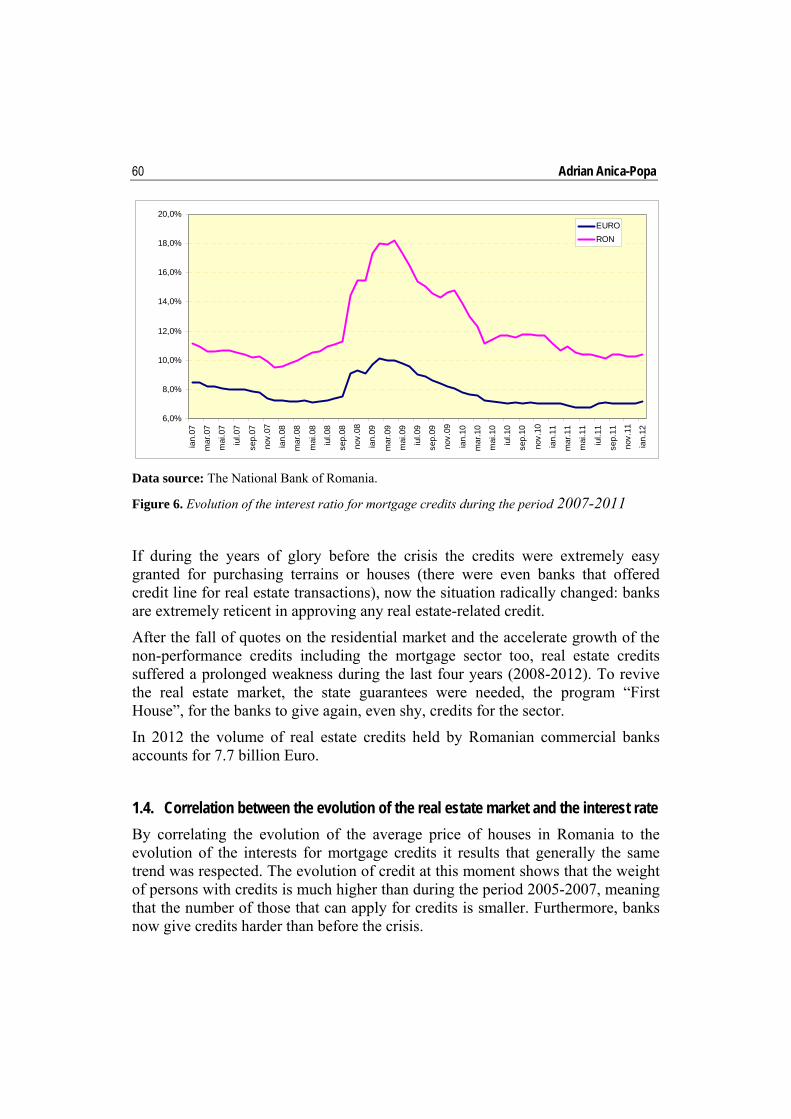
Adrian Anica-Popa 60
Data source: The National Bank of Romania.
Figure 6. Evolution of the interest ratio for mortgage credits during the period 2007-2011
If during the years of glory before the crisis the credits were extremely easy granted for purchasing terrains or houses (there were even banks that offered credit line for real estate transactions), now the situation radically changed: banks are extremely reticent in approving any real estate-related credit.
After the fall of quotes on the residential market and the accelerate growth of the non-performance credits including the mortgage sector too, real estate credits suffered a prolonged weakness during the last four years (2008-2012). To revive the real estate market, the state guarantees were needed, the program “First House”, for the banks to give again, even shy, credits for the sector.
In 2012 the volume of real estate credits held by Romanian commercial banks accounts for 7.7 billion Euro.
1.4. Correlation between the evolution of the real estate market and the interest rate
By correlating the evolution of the average price of houses in Romania to the evolution of the interests for mortgage credits it results that generally the same trend was respected. The evolution of credit at this moment shows that the weight of persons with credits is much higher than during the period 2005-2007, meaning that the number of those that can apply for credits is smaller. Furthermore, banks now give credits harder than before the crisis.
6,0%
8,0%
10,0%
12,0%
14,0%
16,0%
18,0%
20,0%
ian.
07
mar
.07
mai
.07
iul.0
7
sep.
07
nov.
07
ian.
08
mar
.08
mai
.08
iul.0
8
sep.
08
nov.
08
ian.
09
mar
.09
mai
.09
iul.0
9
sep.
09
nov.
09
ian.
10
mar
.10
mai
.10
iul.1
0
sep.
10
nov.
10
ian.
11
mar
.11
mai
.11
iul.1
1
sep.
11
nov.
11
ian.
12
EURORON
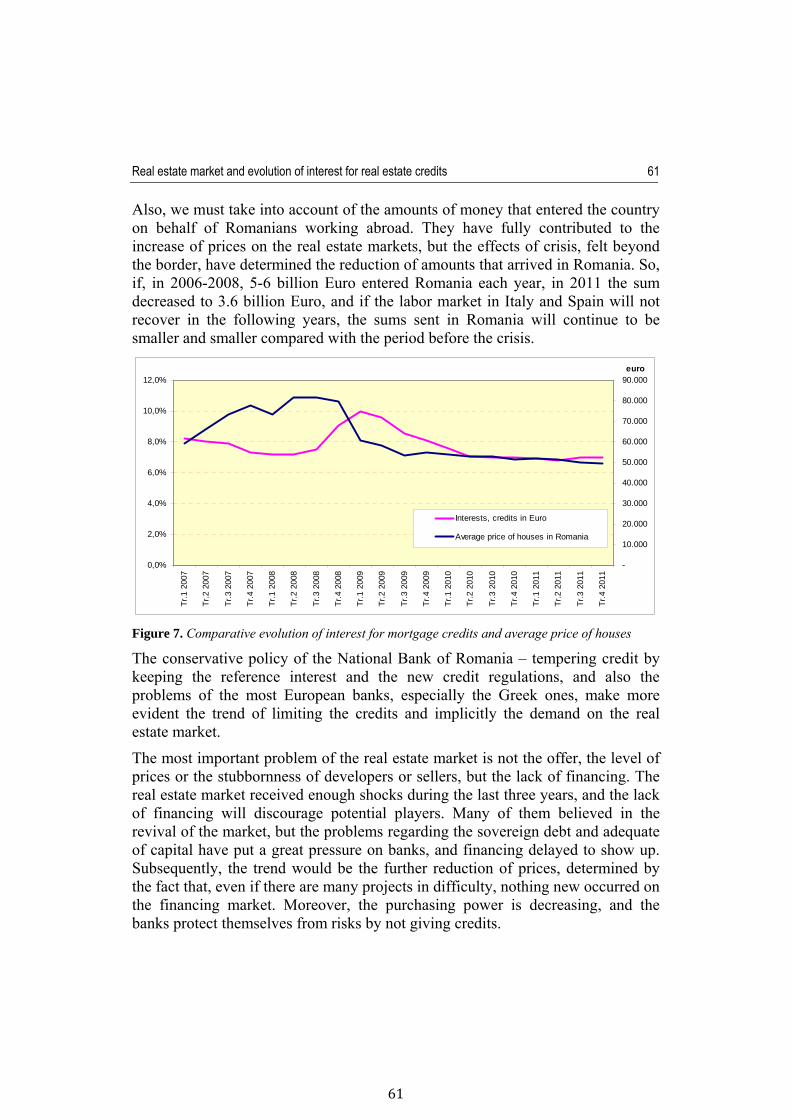
Real estate market and evolution of interest for real estate credits
61
61
Also, we must take into account of the amounts of money that entered the country on behalf of Romanians working abroad. They have fully contributed to the increase of prices on the real estate markets, but the effects of crisis, felt beyond the border, have determined the reduction of amounts that arrived in Romania. So, if, in 2006-2008, 5-6 billion Euro entered Romania each year, in 2011 the sum decreased to 3.6 billion Euro, and if the labor market in Italy and Spain will not recover in the following years, the sums sent in Romania will continue to be smaller and smaller compared with the period before the crisis.
Figure 7. Comparative evolution of interest for mortgage credits and average price of houses
The conservative policy of the National Bank of Romania – tempering credit by keeping the reference interest and the new credit regulations, and also the problems of the most European banks, especially the Greek ones, make more evident the trend of limiting the credits and implicitly the demand on the real estate market.
The most important problem of the real estate market is not the offer, the level of prices or the stubbornness of developers or sellers, but the lack of financing. The real estate market received enough shocks during the last three years, and the lack of financing will discourage potential players. Many of them believed in the revival of the market, but the problems regarding the sovereign debt and adequate of capital have put a great pressure on banks, and financing delayed to show up. Subsequently, the trend would be the further reduction of prices, determined by the fact that, even if there are many projects in difficulty, nothing new occurred on the financing market. Moreover, the purchasing power is decreasing, and the banks protect themselves from risks by not giving credits.
0,0%
2,0%
4,0%
6,0%
8,0%
10,0%
12,0%
Tr.1
200
7
Tr.2
200
7
Tr.3
200
7
Tr.4
200
7
Tr.1
200
8
Tr.2
200
8
Tr.3
200
8
Tr.4
200
8
Tr.1
200
9
Tr.2
200
9
Tr.3
200
9
Tr.4
200
9
Tr.1
201
0
Tr.2
201
0
Tr.3
201
0
Tr.4
201
0
Tr.1
201
1
Tr.2
201
1
Tr.3
201
1
Tr.4
201
1
-
10.000
20.000
30.000
40.000
50.000
60.000
70.000
80.000
90.000euro
Interests, credits in Euro
Average price of houses in Romania
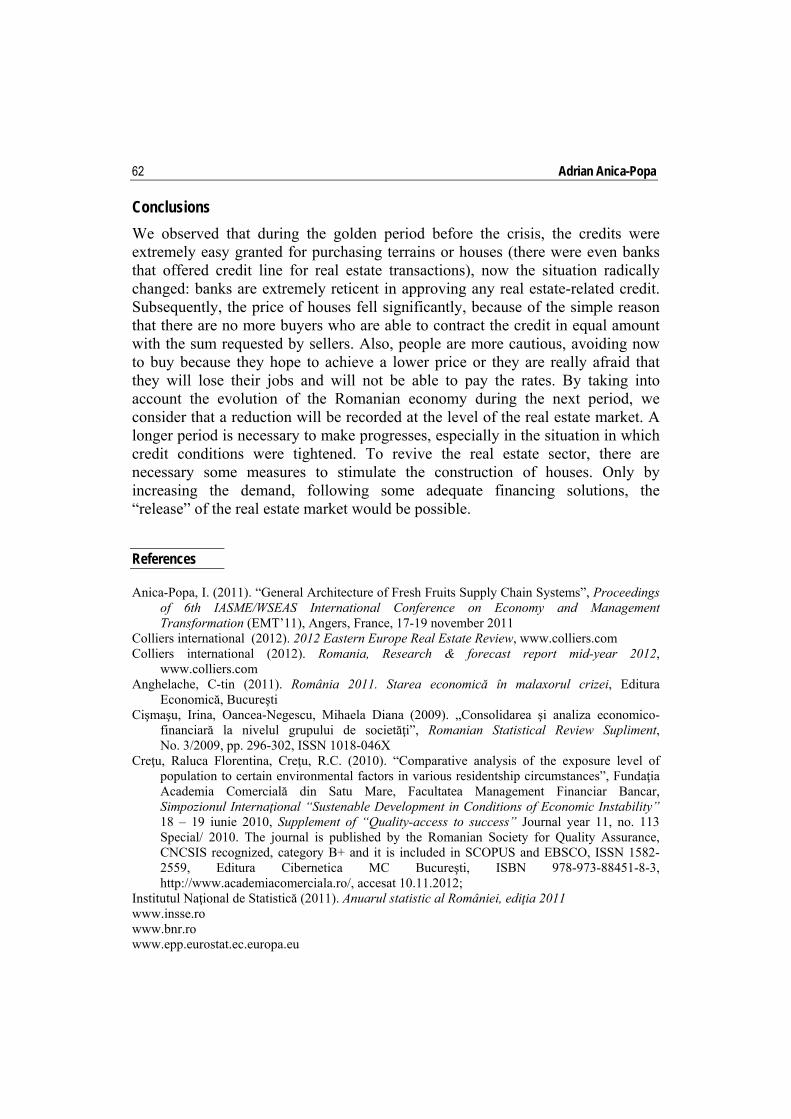
Adrian Anica-Popa 62
Conclusions
We observed that during the golden period before the crisis, the credits were extremely easy granted for purchasing terrains or houses (there were even banks that offered credit line for real estate transactions), now the situation radically changed: banks are extremely reticent in approving any real estate-related credit. Subsequently, the price of houses fell significantly, because of the simple reason that there are no more buyers who are able to contract the credit in equal amount with the sum requested by sellers. Also, people are more cautious, avoiding now to buy because they hope to achieve a lower price or they are really afraid that they will lose their jobs and will not be able to pay the rates. By taking into account the evolution of the Romanian economy during the next period, we consider that a reduction will be recorded at the level of the real estate market. A longer period is necessary to make progresses, especially in the situation in which credit conditions were tightened. To revive the real estate sector, there are necessary some measures to stimulate the construction of houses. Only by increasing the demand, following some adequate financing solutions, the “release” of the real estate market would be possible.
References Anica-Popa, I. (2011). “General Architecture of Fresh Fruits Supply Chain Systems”, Proceedings
of 6th IASME/WSEAS International Conference on Economy and Management Transformation (EMT’11), Angers, France, 17-19 november 2011
Colliers international (2012). 2012 Eastern Europe Real Estate Review, www.colliers.com Colliers international (2012). Romania, Research & forecast report mid-year 2012,
www.colliers.com Anghelache, C-tin (2011). România 2011. Starea economică în malaxorul crizei, Editura
Economică, Bucureşti Cişmaşu, Irina, Oancea-Negescu, Mihaela Diana (2009). „Consolidarea şi analiza economico-
financiară la nivelul grupului de societăţi”, Romanian Statistical Review Supliment, No. 3/2009, pp. 296-302, ISSN 1018-046X
Creţu, Raluca Florentina, Creţu, R.C. (2010). “Comparative analysis of the exposure level of population to certain environmental factors in various residentship circumstances”, Fundaţia Academia Comercială din Satu Mare, Facultatea Management Financiar Bancar, Simpozionul Internaţional “Sustenable Development in Conditions of Economic Instability” 18 – 19 iunie 2010, Supplement of “Quality-access to success” Journal year 11, no. 113 Special/ 2010. The journal is published by the Romanian Society for Quality Assurance, CNCSIS recognized, category B+ and it is included in SCOPUS and EBSCO, ISSN 1582-2559, Editura Cibernetica MC Bucureşti, ISBN 978-973-88451-8-3, http://www.academiacomerciala.ro/, accesat 10.11.2012;
Institutul Naţional de Statistică (2011). Anuarul statistic al României, ediţia 2011 www.insse.ro www.bnr.ro www.epp.eurostat.ec.europa.eu
Particularities of business generating real estate properties appraisal
Ana Maria POPESCU The Bucharest University of Economic Studies [email protected]
Abstract. During the last 3-5 years, the most complex debates concerning the appraisal methodology have focused on two topics. The first topic refers to the appraisal of entities’ intangible assets and has materialized in two fundamental documents, drafted by the Appraisal Foundation (2010) (Appraisal Foundation, Best practices for valuations in financial reporting – contributory assets) and International Valuation Standards Council – IVSC (2012) (Appraisal guidelines 3, Intangible assets appraisal, ANEVAR, 2012). The second topic refers to the profit generating real estate properties appraisal and to the assignment of the market value thereof (and of the price paid in order to acquire such) to the identifiable assets thereof. There is a close connection between the two topics, because a current debate topic consists exactly of identifying and appraising the entities’ separate intangible assets of specific use and the accounting and fiscal treatment of the goodwill generated by the acquisition of a PIGP.
Keywords: real estate properties appraisal; assignment of the market.
Theoretical and Applied Economics Volume XX (2013), Special Issue, pp. 63-70
Ana Maria Popescu 64
Introduction real estate properties appraisal
In this article we shall only refer to few methodological considerations, concerning the structure of profit generating real estate property assets and the appraisal thereof.
PIGP are identically defined by IVSC and by the Royal Institute of Chartered Surveyors - RICS (2012), namely: “any type of real estate property assigned for a certain type of business, where the property value reflects the commercial potential for such business” and include hotels, theaters, gas stations, bars, restaurants, camping, motels, over- and underground parking places, cinema theaters, clubs, etc. The most complex PIGP are the hotels, and consequently the appraisal thereof is the most used analysis and exemplifying topic.
With respect to PIGP appraisal, currently there are two very recent documents providing information and recommendations, issued by the Appraisal Institute (2012) (Guide Notes to the Standards of Professional Appraisal Practice of the Appraisal Institute, Effective May 8, 2012, GN5, Appraisals of real estate with related personal property, business property, or intangible assets) and RICS (2012), RICS Valuation – Professional Standards, GN 2 Valuation of individual trade related properties). Please note that, although the manual of International Valuation Standards (IVS), eighth edition, 2007, has set out a mandatory standard, namely GN 12, the Business generating properties appraisal, in the 2011 edition of the IVS, IVSC had no longer included a standard on this topic, the reasoning consisting of the requirement to perform a material review of this standard’s structure and content, following an ample consultation with the experts in this specific appraisal area. IVSC has included in its business plan the approval and publication of this standard during the forth quarter of year 2013.
In order to perform a business generating property appraisal mission, a certified real estate appraiser, member of ANEVAR, must be familiar and comply with the requirements of the 12 International Valuation Standards 2011 (IVS), as well as of the Methodological Valuation Guidelines (GME) and Valuation guidelines (GE), passed as mandatory standards. Furthermore, although not mandatory, the three appraisal guidelines, drafted by IVSC in July, 2012, represent a real support in becoming familiar with and enforcing the best practice for valuation.
Particularities of business generating real estate properties appraisal
65
65
All the above mentioned documents have been edited and provided to the interested persons in the theory on tangible and intangible assets appraisal and appraisal practice.
Particularities of the PIGA appraisal
There is a wide consensus regarding the PIGA appraisal complexity, due to the predominant real estate property characteristics, but also due to the existence, in almost all cases, of chattels and of certain intangible assets. Consequently, such an appraisal also implies the enforcement of standards concerning the three categories of assets and, implicitly, the attendance of appraisers specialized in the valuation thereof. We will set out below few of the profit generating real estate properties specific features, which generate the particularity of such entities’ appraisal.
First of all, the essential feature of PIGPs is the fact that these have been initially designed or have been adjusted for a specific use, no other use being financially feasible; thus, it results that, due to the lack of usage flexibility, the value of the right upon the real estate property (in whole or burdened by a lease) is directly conditioned by the extent of the profit or rent that might be obtained by the owner following such specific use, either by means of direct usage, or by assigning the right of use (lease). Consequently, the largest ratio in a PIGP market value is held by the real estate property value (ranging between 50-60%). For appraising purposes, the direct effect of this particularity consists of the possibility to apply and the appropriateness of applying the “profit method”, also known as the profit capitalization method, due to long remaining economic life of the building and land arrangements. This avoids the potential controversies generated by the assumptions based on which the reversion value has been determined (namely the terminal capitalization rate, as well as the arguments based on which the explicit forecasting term has been determined). On the other hand, the discounted cash flow method (DCF) is not recommended unless the appraisal subject consists of a PIGP during a project stage or in progress. But even in this latter case, one could apply the profit capitalization method, based on the assumption that the PIGP has reached the stabilized profit (as set out in the example below).
Ana Maria Popescu 66
Secondly, the appraisal subject is not a real estate property, but an operational entity generally consisting of all or just part of the six classes of assets set out below: 1. the above mentioned real estate property (full ownership right or ownership
right burdened by lease); 2. the chattels, which include the equipment installed (and not built) by the
occupants or for the occupants and which, upon the occupancy termination, can be sold, abandoned, taken by the landlord or by the tenant, depending on the leasing agreement provisions or on the parties’ contribution to such installation. Representative examples include the refrigerating facilities, air conditioning systems and store cash registers, as well as booths, bars, shop windows, light spots installed in public places, as well as heating facilities, fireplaces, ornaments in case of dwellings;
3. the tenant’s set ups, consisting of the changes performed on the real estate property in order to be used by a certain tenant. The characteristic thereof consists of the fact that these are built on a location or in a building and become an integral part of the real estate property, which cannot be removed or relocated at the end of the lease, without unjustified expenses. Examples of tenant set ups, borne by the latter, by the owner or by both parties, include a new partitioning of the leased premises, wall safe deposit boxes, reception desk, etc;
4. any transferable licenses, certificates, authorizations and permits; 5. identifiable intangible assets, such as a brand, advantageous agreements,
including management agreements; and 6. the goodwill.
Generally, the stock of consumables and the receivables are separately evaluated and separately acquired by the purchaser.
Third, a PIGP appraisal takes place based on several extraordinary assumptions, depending on the circumstances applicable to the appraised subject. Such extraordinary usual assumptions, as set out in the RICS manual, are: notes
(a) the assumption that the business has been closed and no documents on the previous activity exist, in order to be provided to potential purchasers or tenants;
(b) based on the same assumption as the one set out at letter a) above, but with the assumption that no stock required in order to resume the business exist;
Particularities of business generating real estate properties appraisal
67
67
(c) that a functional entity, provided with all required endowments, so that it could be immediately opened for business activities; and
(d) based on certain business forecasts, with the assumption that such forecasts have been proved. This assumption is appropriate for the appraisal of a PIGP in progress.
Forth, the privileged appraisal method is the so-called “profit method”, which is in fact the EBITDA capitalization method (the gross operating profit plus depreciation) of the year when this indicator has become stable. Generally, EBITDA capitalization takes place by applying an EBITDA market multiple, selected from comparable PIGP recently transacted on the market area defined by the appraiser. The advantages of this method are as follows: this is the method applied on the market and recognized by the market players
in order to determine an operational entity’s market value; the simplicity and easy understanding thereof by the customers and recipients
of the appraisal reports; due to the fact that, generally, EBITDA has a positive value, the multiple
thereof can also be computed for entities that register loss; this formula determines the value of the entire entity, namely the value of all
assets required for operation purposes, value that can be further assigned to such assets (as set out above). On the other hand, by determining the entity value, the profit method enables one to perform certain comparisons between entities with different indebtedness levels.
Profit method applying stages
The computation formula of a PIGP market value (Vp) is simple:
Vp = EBITDAnst × EBITDA market multiple, where
EBITDAnst shall mean the annual EBITDA normalized and stabilized at a value that will remain constant for an undetermined period of time and which, consequently, can be capitalized.
Although the computation formula is simple, a credible EBITDAnst determination implies a thorough comparative financial analysis performed by the appraisers.
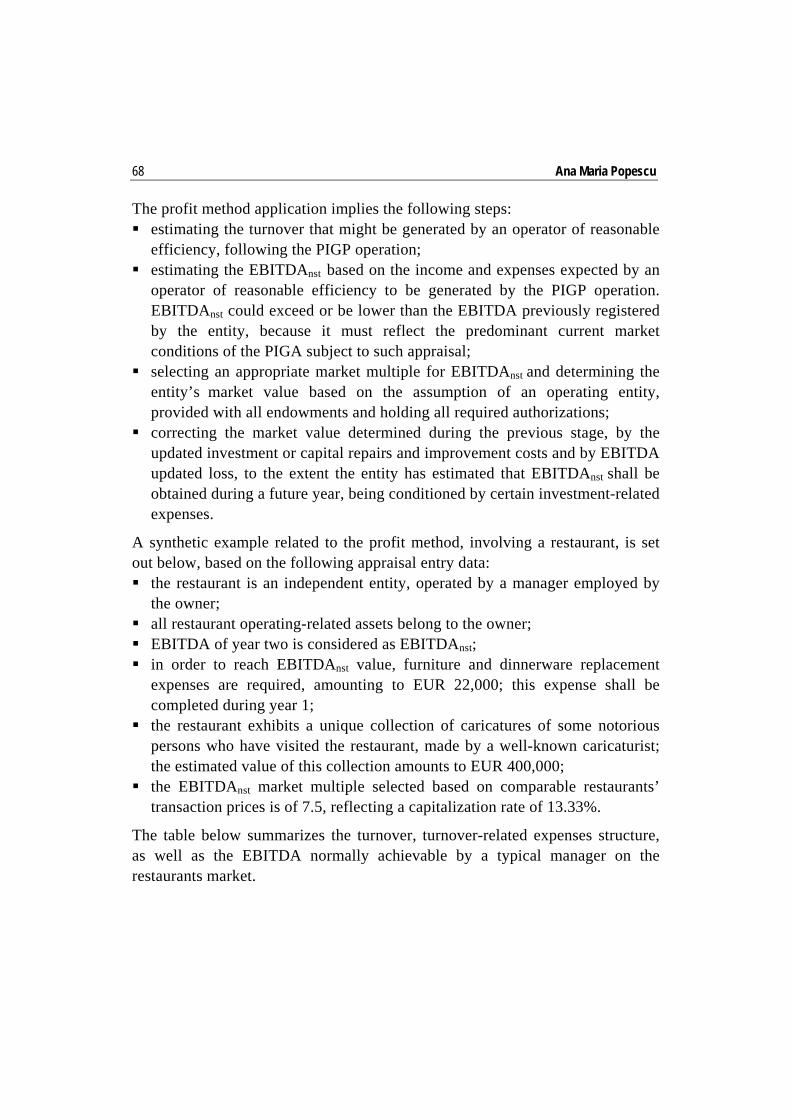
Ana Maria Popescu 68
The profit method application implies the following steps: estimating the turnover that might be generated by an operator of reasonable
efficiency, following the PIGP operation; estimating the EBITDAnst based on the income and expenses expected by an
operator of reasonable efficiency to be generated by the PIGP operation. EBITDAnst could exceed or be lower than the EBITDA previously registered by the entity, because it must reflect the predominant current market conditions of the PIGA subject to such appraisal;
selecting an appropriate market multiple for EBITDAnst and determining the entity’s market value based on the assumption of an operating entity, provided with all endowments and holding all required authorizations;
correcting the market value determined during the previous stage, by the updated investment or capital repairs and improvement costs and by EBITDA updated loss, to the extent the entity has estimated that EBITDAnst shall be obtained during a future year, being conditioned by certain investment-related expenses.
A synthetic example related to the profit method, involving a restaurant, is set out below, based on the following appraisal entry data: the restaurant is an independent entity, operated by a manager employed by
the owner; all restaurant operating-related assets belong to the owner; EBITDA of year two is considered as EBITDAnst; in order to reach EBITDAnst value, furniture and dinnerware replacement
expenses are required, amounting to EUR 22,000; this expense shall be completed during year 1;
the restaurant exhibits a unique collection of caricatures of some notorious persons who have visited the restaurant, made by a well-known caricaturist; the estimated value of this collection amounts to EUR 400,000;
the EBITDAnst market multiple selected based on comparable restaurants’ transaction prices is of 7.5, reflecting a capitalization rate of 13.33%.
The table below summarizes the turnover, turnover-related expenses structure, as well as the EBITDA normally achievable by a typical manager on the restaurants market.
Particularities of business generating real estate properties appraisal
69
69
Year 1 Year 2 EURO Turnover Foodstuff 600,000 75.0% 800,000 72.7% Beverage 200,000 25.0% 300,000 27.3% Total 800,000 100.0% 1,100,000 100.0% Sold goods-related costs Foodstuff 220,000 36.7% 270,000 33.8% Beverage 80,000 40.0% 100,000 33.3% Total 300,000 37.5% 370,000 33.6% Gross income 500,000 62.5% 730,000 66.4% Other incomes 0 0.0% 0 0.0% Total gross income Total 500,000 62.5% 730,000 66.4% Variable expenses Personnel-related expenses 120,000 15.0% 160,000 14.5% Employees benefits 12,000 1.5% 16,000 1.5% Direct operating expenses 40,400 5.1% 50,000 4.5% Marketing 8,000 1.0% 12,000 1.1% Utilities 20,000 2.5% 30,000 2.7% Repair and maintenance 22,000 2.8% 33,000 3.0% General and administrative 45,000 5.6% 55,000 5.0% Total 267,400 33.4% 356,000 32.4% Gross profit prior to fixed costs 232,600 29.1% 374,000 34.0% Fixed costs Real estate tax 5,200 0.7% 5,200 0.5% Property insurance 3,000 0.4% 3,200 0.3% EBITDA 224,400 28.1% 365,600 33.2%
The market value of the restaurant (Vpr) shall be determined as follows:
Vpr = 365,600 × 7.5 = EUR 2,742,000
The EBITDA updated loss, related to an updating rate of 13.33% shall be:
(365,600 – 244,400) × 0.882 = Euro 107,000 (rounded up)
The updated replacement expenses are: 22,000 × 0.882 = EUR 19,400
Consequently, the final market value of the restaurant, determined based on the profit method, shall be:
EUR 2,742,000 – EUR 107,000 – EUR 19,400 + EUR 400,000 = EUR 3,015,600
Rounded up, that means EUR 3 mil
Conclusion
In case of PIGP appraisal, the appraised subject consists of a real estate property, which also includes chattels, separate intangible assets connected to the real estate property, and potential real estate property goodwill. The profit
Ana Maria Popescu 70
method enables us to determine the aggregate value of all these assets based on special assumptions, which show a hypothetical circumstance where a PIGA can be evaluated. In the above mentioned application, the said hypothetical circumstance refers to EBITDA value stabilizing condition, in which case from the market value determined based on the capitalization technique are deducted the updated expenses required in order to reach such stage, as well as the updated EBITDA loss related to the same period of time. But, in case a PIGP includes special chattels, with a value that exceeds the similar chattels held by comparable PIGPs, the additional value thereof should be added as a separate value. References Guide Notes to the Standards of Professional Appraisal Practice of the Appraisal Institute,
Effective May 8, 2012, GN5, Apraisals of real estate with related personal property, business property, or intangible assets)
RICS Valuation – Profesional Standards, GN 2 Valuation of individual trade related properties), 2012
Application of sensitivity analysis in estimating the value of the business
Adrian ANICA-POPA The Bucharest Academy of Economic Studies [email protected] Raluca Florentina CREŢU The Bucharest Academy of Economic Studies [email protected]
Abstract. The target of the research is to identify the implications of modifying variables on the value of the business. The type of research consists of a case study aiming to identify the critical variables that might influence the value of the business and to determine the possibility of reaching a certain value, as well as establishing the reliability range where this can function by means of using stochastic exponents developed based on the Monte Carlo method. All these elements are depending on great number of economical, political and social criteria. We have therefore chosen an enterprise activating in the field of manufacturing construction materials. The result of the research points towards the existence of some elements of uncertainty with a great impact on the value of the business, as well as towards another category of factors with an insignificant influence. As a conclusion, shaping of performances, identification of risks and stochastic simulations can provide a high potential for the forecast of the business value. The usefulness of the study resides in the fact that the evaluation of the business might be influenced by a series of uncertainties under conditions of a more and more complex and dynamic economical environment.
Keywords: evaluation; uncertainty; risk; sensitivity. JEL Classification: L83, O18, Q56, R11, M15. REL Classification: 14I, 14K, 15B, 15E.
Theoretical and Applied Economics Volume XX (2013), Special Issue, pp. 71-86
Adrian Anica-Popa, Raluca-Florentina Creţu 72
1. Introduction
The need for evaluating the business derives from the needs of the present and potential users (stockholders), creditors, public administration specialized institutions and the public at large to have a dimension of the business being analyzed.
According to the International Evaluation Standards, there are three kinds of approaches: the asset approach, the income approach and the approach by comparison. In order to identify the variables effects that might influence a business value, we have chosen the income approach as an example. The income approach supposes the value estimation of an enterprise or of a set of stocks by calculating the present value of the future economical benefits that the investors or owners estimate that the business will generate. From a technical standpoint, this is done by means of capitalizing the net profit and/or updating the cash-flow or the dividends.
As far as capitalizing methods are concerned, a representative and repeatable level of the income (in most cases the net profit or the dividends) relates to a capitalizing rate or it is multiplied with a multiple of the considered income, thus converting income into a value.
In case of updating methods, cash-flow or dividends are estimated for every year of a certain forecast period of time and then they are converted into a value by using an discount rate. As a rule, for the unspecified period of time, cash-flow is replaced by the remaining value of the business, which is also updated in its turn.
As far as income approach is concerned, the value of the business, wholly or partly, depends on the cash-flow and the future economic benefits generated by that business.
The income based approach requires an estimation of a capitalizing rate, where income is capitalized in order to become a number, or of an discount rate, where the cash-flow is updated in order o estimate the right rate, the evaluator must take into account factors such as: the level of interest rates, profitability rates expected by investors for similar investments and the inherent risk of the expected benefits flow.
2. Discounted Cash-flow method (DCF)
As far as the updated cash flow and/or dividends method is concerned, cash flow collecting is estimated for each of the coming periods of time. These collections are converted into a value by applying the discount rate, using the techniques of the updated value.
There are several definitions of the cash flow to be used. In practice, it is often used the net cash flow (the cash flow that could be distributed to shareholders) or the current dividends (especially when it comes for minority shareholders). The discount rate has to be coherent with the definition of the cash flow in use.
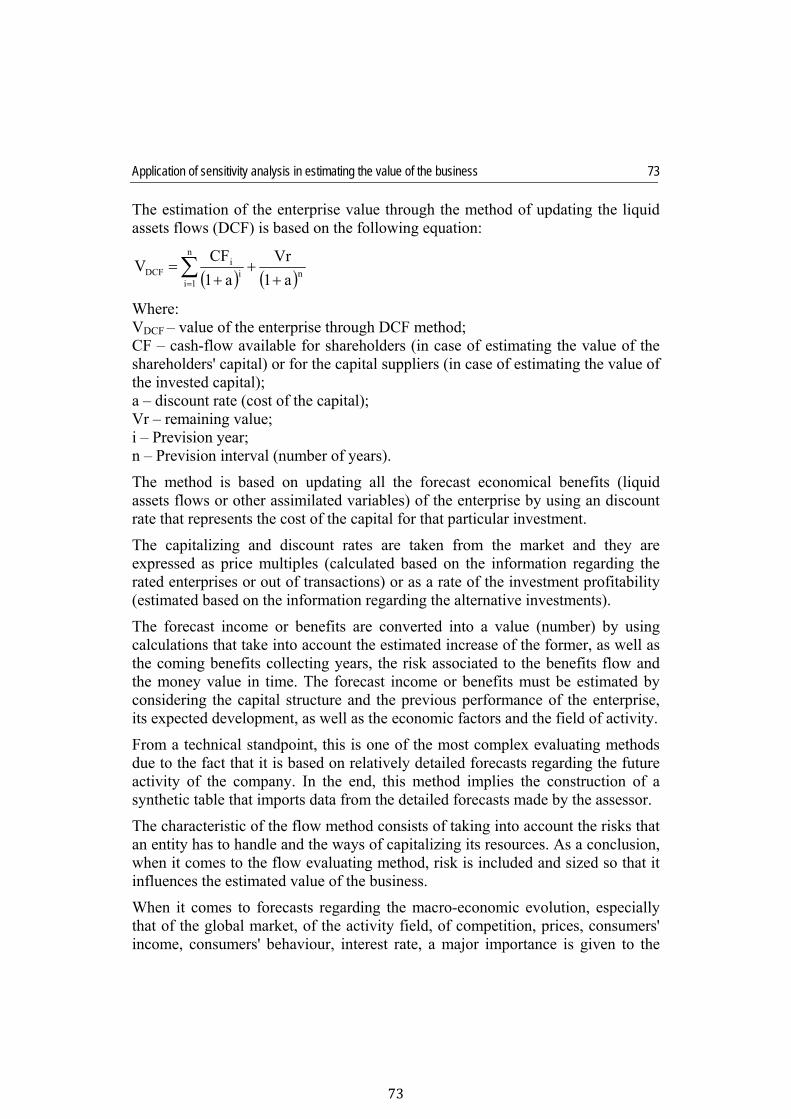
Application of sensitivity analysis in estimating the value of the business
73
73
The estimation of the enterprise value through the method of updating the liquid assets flows (DCF) is based on the following equation:
n
n
1ii
iDCF
a1
Vr
a1
CFV
Where: VDCF – value of the enterprise through DCF method; CF – cash-flow available for shareholders (in case of estimating the value of the shareholders' capital) or for the capital suppliers (in case of estimating the value of the invested capital); a – discount rate (cost of the capital); Vr – remaining value; i – Prevision year; n – Prevision interval (number of years).
The method is based on updating all the forecast economical benefits (liquid assets flows or other assimilated variables) of the enterprise by using an discount rate that represents the cost of the capital for that particular investment.
The capitalizing and discount rates are taken from the market and they are expressed as price multiples (calculated based on the information regarding the rated enterprises or out of transactions) or as a rate of the investment profitability (estimated based on the information regarding the alternative investments).
The forecast income or benefits are converted into a value (number) by using calculations that take into account the estimated increase of the former, as well as the coming benefits collecting years, the risk associated to the benefits flow and the money value in time. The forecast income or benefits must be estimated by considering the capital structure and the previous performance of the enterprise, its expected development, as well as the economic factors and the field of activity.
From a technical standpoint, this is one of the most complex evaluating methods due to the fact that it is based on relatively detailed forecasts regarding the future activity of the company. In the end, this method implies the construction of a synthetic table that imports data from the detailed forecasts made by the assessor.
The characteristic of the flow method consists of taking into account the risks that an entity has to handle and the ways of capitalizing its resources. As a conclusion, when it comes to the flow evaluating method, risk is included and sized so that it influences the estimated value of the business.
When it comes to forecasts regarding the macro-economic evolution, especially that of the global market, of the activity field, of competition, prices, consumers' income, consumers' behaviour, interest rate, a major importance is given to the
Adrian Anica-Popa, Raluca-Florentina Creţu 74
competent national authorities, such as the National Statistics Institute and the National Bank of Romania, that provide interested people with statistics databases with information characterized by a high reliability level, as well as with other forecasts of economic and financial analysts that are commonly recognized as competent with regard to market evolution; their analyses are published in specialized newspapers such as The Financial Magazine, The Business Guide, Capital Magazine, Business Magazine, Standard Business.
3. General risks in sight in evaluating the business
Risk is a set of circumstances or events that compromise reaching a target (Dobroțeanu, Dobroțeanu, 2007).
As far as a company is concerned, risk is directly generated by its incapability of adapting, in time and to the lowest cost, to the variation of the circumstances. This includes not only the possibility of a side effect, but especially the possibility of an opportunity.
Risk analyses must take into account the following aspects: Occurrence frequency of the events that define risk; Severity of these events, calculated by the amplitude of the consequences; Perception of such events; Confidence in forecasts regarding risks.
These four factors – occurrence frequency of risks, severity of risk events, risk perception and confidence in risk forecasts – are fundamental for any risk analyses as they also include the feedback to the risk event and, as a consequence, also the other side of the risk – the opportunities. Intelligent answers to challenges of risk events often change a disaster into a new opportunity.
When assessing the situation of an enterprise, one must comprehend very well the circumstances or the events that jeopardize it, as these cannot be universalized for all enterprises.
Classification of the risks is done from several perspectives:
Depending on the analyzed position(1) (Halpern et al., 1998, Emery, Finnerty, 1998):
From a company investors' standpoint, risk can be classified as: – Market risk, also known as systematic risk. This is generated by the company:
economic depression, unfavourable variations of interest and inflation rates; military conflicts etc;
Application of sensitivity analysis in estimating the value of the business
75
75
– Company's specific risk, also known as non-systematic risk, generated by company specific factors. This risk is generated by unfavourable hazard events that might jeopardize a company: loss of important contracts, un-successful marketing programs of the company; litigations; strikes; etc.
– Total risk, made up of the systematic risk of the market and the non-systematic risk of the company.
From a company's standpoint, the risk of an enterprise can be classified the following way: – The specific risk of a company's business, corresponding to the economic risk
and the operational risk; – Financial risk of a company, as a result of the company's decision to use capital
on loan; – Total risk of a company, borne by its owners and made up of the economic and
financial risk.
In evaluating an enterprise, the following categories of risks will be taken into account: Economic risks represent the way the enterprise is going to be affected by the changes of the economic environment where it operates. As an example, it refers to the effect of the forecast fluctuations of the interest rate on the company and industry, in general. Business risks – the assessor can investigate the company as far as factor associated risk is concerned, such as sales and increase of volatility. Operational risks – the enterprise will be analyzed in order to establish what kind of risks it is exposed to as a result of its agreements and costs associated to its operations. This evaluation equally includes the analysis of fixed costs in comparison to the variable costs. Financial risks – financial costs associated to an enterprise are related to the value of the obligations and its capability of covering the debts. One can analyze the capital structure of similar companies in order to compare the studied enterprise and its risk profile. Asset related risks – these risks refer to the duration of the economic existence and the status of the assets owned by the company. Old assets have a greater risk level for the company due to their higher maintenance costs, low productivity and tear from a functional and technological point of view. Product related risks – product risks refer to diversifying the company's range of products, by adding product lines that might disappear as a consequence of the competitors introducing more reviving products. Market related risks – this type of risk refers to how well positioned a company is from a geographical point of view. If a company operates on a local level, local changes can affect it to a great extent. A more geographically diversified market might reduce this type of risk.
Adrian Anica-Popa, Raluca-Florentina Creţu 76
Technological risks – new technologies might have a side effect impact on the company if this is not capable of keeping the pace with other companies acting in the same field (as far as technology is concerned). Risks generated from the laws in force – agencies that issue certain rules for the industry where the company activates may have a negative impact on it. The best example regarding rules is the one that refers to environmental laws. Legislative risks – costs incurred by litigations can put an end to a success business. Litigation can cause such a great financial pressure on a business, that this cannot continue existing.
4. Short description of the market and of the business to be evaluated
Romanian market is characterized by strong competition as there are numerous national and foreign companies that over the last years have chosen to import cement from China and Bulgaria. The main outlet is mainly made up of small, medium size and big companies that activate in the field of producing cement, concrete prefabricated products and reinforced concrete or even companies acting in the construction field, quite reliable customers, so the risk of dysfunctions caused by one disappearing customer is very little.
The subject to be evaluated is one of the main cement producers in Romania. In the same time, this is the first Romanian cement producer that introduced the use of alternative fuels in the production process. The company sells its products all over the country. The latest year’s development of the Romanian constructions field has resulted into an equally spectacular expansion of the construction materials business that has registered annual increase rate of 25-30% going up to a level of 5.5 billion Euros in 2008. Prices of the construction materials have dropped down during the three studied years, depending on the areas. However, given the depression of the real estate market generated by the global financial crisis, companies producing construction materials will continue to practice a price dropping policy in order to compensate for the reduced market enquiry.
The main source of development for the cement market will reside in the infrastructure and industrial works, given the fact that the residential market is currently stuck. The infrastructure development could become the main pier for increasing the constructions industry. Deblocking infrastructure projects might be excellent for the constructions industry and might create a lot of jobs. In Romania there is a real outlet market for the products generated by the construction materials industry, especially cement. Apart from works corresponding to real estate properties (residential, commercial, and industrial), the use of construction materials requires also another category of works that refer to structure.
Application of sensitivity analysis in estimating the value of the business
77
77
From the point of view of the performances registered by the studied business, we found an oscillating evolution between 2008 and 2010 of the turnover, the labour productivity, increase of the expenses efficiency in comparison to the turnover. However, at the activity branch level and implicitly at a company's level, one can identify a few threats: increase of the competitors' pressure, existence of the financial crisis, existence of a lower enquiry than the offer given the level of the products offered.
Within the income approach, starting from the present situation of the construction materials sector, in general, and from the performance of the enterprise studied, in particular, we have attempted to outline the future evolution possibilities in such a way so to determine the current value of the business.
The income based approach whose aim is to establish the value of the business by capitalizing profit or updating cash-flows is equally important for evaluating big or small enterprises.
Both in case of evaluating the business value by updating liquid assets flows, as well as by capitalizing the net profit, the estimation of the business risks must be done. Regardless of the activity field, companies are exposed to political instability risks, to risks generated by a potential and temporary imbalance of the legal frame and even to risks related to fluctuation of the exchange rate and the inflation rate. All these risks will be retrieved into the cost of the capital corresponding to the studied business.
Given the subject to be evaluated, investments for preserving the capacity are equally risky with the ones of the company as they are financed by amortization and, therefore, they have an discount rate similar to the company's own capital costs. In establishing the final discount rate, we have taken also considered that the subject to be evaluated is not quoted on the stock market even if it registers considerable performances in its field of activity, that it does not depend on short, medium and long term loans, that it is a market leader as far as cement production is concerned and that the investments carried out during the last years enable a flexibility and an acclimation of the production to the cement delivery compulsory requirements imposed by the European Union starting with 2010.
5. Analysis of the business risk
Political instability Factors that might generate political instability might influence, as well, in a negative way the business environment in Romania. This way, any stagnancy of the envisaged reforms in Romania, any economic measure without a macro-
Adrian Anica-Popa, Raluca-Florentina Creţu 78
economic base and other measures that through their impact might even result into the potential diminishing of the country rating might affect in a negative way the local business environment and implicitly the one of the studied business.
Risks generated by a potential and temporary instability of the legislative frame Romanian laws are harmonized to a great extent with the legislation of the European Union, reflecting the recommendations imposed by the guiding lines and the principles of the community acquis. Despite all these, there can be changes of the legislation in force as far as application of the EU norms is concerned that might impose on the Romanian companies an acclimation to the new requirements especially under the circumstances of the laws and rules in force which are sometimes, to a great extent, inconsistently put into practice. Factors that might generate a legislative instability are: Frequent change of the laws, including the ones impacting the activity of the
companies in the construction materials industry; Lack of clearly established criteria in the decision making process of the
administrative authorities; Risks generated by changes in the legislation regarding companies and the
Romanian capital market.
Risks related to the instability of the exchange rate and inflation rate Although inflation is on a decreasing trend, investors must be aware of the fact that there is a risk that the inflation pressure on the economy could also persist in the future (as an example: increase of the utilities prices, salary increases). Generally speaking, inflation pressure generates control measures adopted by the National Bank of Romania (in short, BNR) with an impact on the Romanian companies (and therefore, implicitly, on the subject to be evaluated).
Given the company's characteristics (production, export), a part of the activity of the studied enterprise might be affected by the risks generated by the fluctuation of the exchange rate.
As far as inflation rate is concerned, this continues to be higher than the European average level. Risks relating to inflation result into increasing the volume of costs as well as into the need of adjusting salaries to the inflation, with a possibility of generating on top of everything the price increase of the products offered by the studied company.
All these risks will be embodied in the cost of the capital associated to the subject to be evaluated.
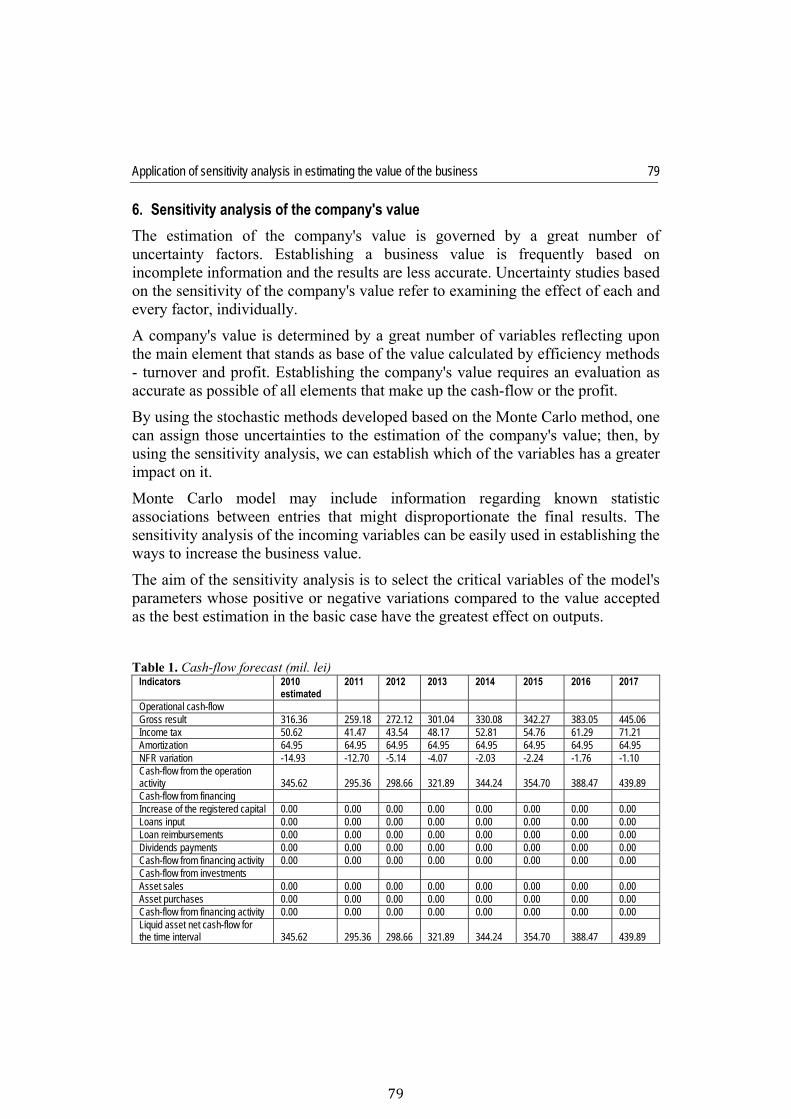
Application of sensitivity analysis in estimating the value of the business
79
79
6. Sensitivity analysis of the company's value
The estimation of the company's value is governed by a great number of uncertainty factors. Establishing a business value is frequently based on incomplete information and the results are less accurate. Uncertainty studies based on the sensitivity of the company's value refer to examining the effect of each and every factor, individually.
A company's value is determined by a great number of variables reflecting upon the main element that stands as base of the value calculated by efficiency methods - turnover and profit. Establishing the company's value requires an evaluation as accurate as possible of all elements that make up the cash-flow or the profit.
By using the stochastic methods developed based on the Monte Carlo method, one can assign those uncertainties to the estimation of the company's value; then, by using the sensitivity analysis, we can establish which of the variables has a greater impact on it.
Monte Carlo model may include information regarding known statistic associations between entries that might disproportionate the final results. The sensitivity analysis of the incoming variables can be easily used in establishing the ways to increase the business value.
The aim of the sensitivity analysis is to select the critical variables of the model's parameters whose positive or negative variations compared to the value accepted as the best estimation in the basic case have the greatest effect on outputs.
Table 1. Cash-flow forecast (mil. lei)
Indicators 2010 estimated
2011 2012 2013 2014 2015 2016 2017
Operational cash-flow Gross result 316.36 259.18 272.12 301.04 330.08 342.27 383.05 445.06 Income tax 50.62 41.47 43.54 48.17 52.81 54.76 61.29 71.21 Amortization 64.95 64.95 64.95 64.95 64.95 64.95 64.95 64.95 NFR variation -14.93 -12.70 -5.14 -4.07 -2.03 -2.24 -1.76 -1.10 Cash-flow from the operation activity 345.62 295.36 298.66 321.89 344.24 354.70 388.47 439.89 Cash-flow from financing Increase of the registered capital 0.00 0.00 0.00 0.00 0.00 0.00 0.00 0.00 Loans input 0.00 0.00 0.00 0.00 0.00 0.00 0.00 0.00 Loan reimbursements 0.00 0.00 0.00 0.00 0.00 0.00 0.00 0.00 Dividends payments 0.00 0.00 0.00 0.00 0.00 0.00 0.00 0.00 Cash-flow from financing activity 0.00 0.00 0.00 0.00 0.00 0.00 0.00 0.00 Cash-flow from investments Asset sales 0.00 0.00 0.00 0.00 0.00 0.00 0.00 0.00 Asset purchases 0.00 0.00 0.00 0.00 0.00 0.00 0.00 0.00 Cash-flow from financing activity 0.00 0.00 0.00 0.00 0.00 0.00 0.00 0.00 Liquid asset net cash-flow for the time interval 345.62 295.36 298.66 321.89 344.24 354.70 388.47 439.89
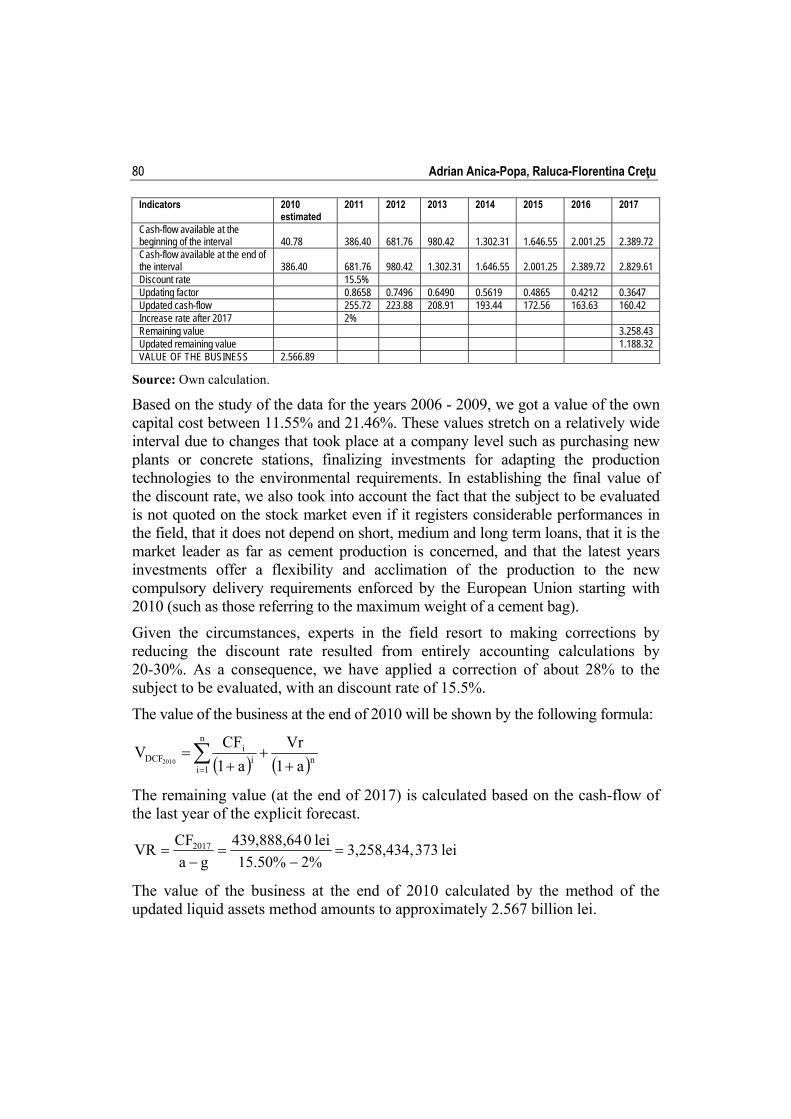
Adrian Anica-Popa, Raluca-Florentina Creţu 80
Indicators 2010 estimated
2011 2012 2013 2014 2015 2016 2017
Cash-flow available at the beginning of the interval 40.78 386.40 681.76 980.42 1.302.31 1.646.55 2.001.25 2.389.72 Cash-flow available at the end of the interval 386.40 681.76 980.42 1.302.31 1.646.55 2.001.25 2.389.72 2.829.61 Discount rate 15.5% Updating factor 0.8658 0.7496 0.6490 0.5619 0.4865 0.4212 0.3647 Updated cash-flow 255.72 223.88 208.91 193.44 172.56 163.63 160.42 Increase rate after 2017 2% Remaining value 3.258.43 Updated remaining value 1.188.32 VALUE OF THE BUSINESS 2.566.89
Source: Own calculation.
Based on the study of the data for the years 2006 - 2009, we got a value of the own capital cost between 11.55% and 21.46%. These values stretch on a relatively wide interval due to changes that took place at a company level such as purchasing new plants or concrete stations, finalizing investments for adapting the production technologies to the environmental requirements. In establishing the final value of the discount rate, we also took into account the fact that the subject to be evaluated is not quoted on the stock market even if it registers considerable performances in the field, that it does not depend on short, medium and long term loans, that it is the market leader as far as cement production is concerned, and that the latest years investments offer a flexibility and acclimation of the production to the new compulsory delivery requirements enforced by the European Union starting with 2010 (such as those referring to the maximum weight of a cement bag).
Given the circumstances, experts in the field resort to making corrections by reducing the discount rate resulted from entirely accounting calculations by 20-30%. As a consequence, we have applied a correction of about 28% to the subject to be evaluated, with an discount rate of 15.5%.
The value of the business at the end of 2010 will be shown by the following formula:
nn
1ii
iDCF
a1
Vr
a1
CFV
2010
The remaining value (at the end of 2017) is calculated based on the cash-flow of the last year of the explicit forecast.
lei 3733,258,434,2%15.50%
lei 0439,888,64
ga
CFVR 2017
The value of the business at the end of 2010 calculated by the method of the updated liquid assets method amounts to approximately 2.567 billion lei.
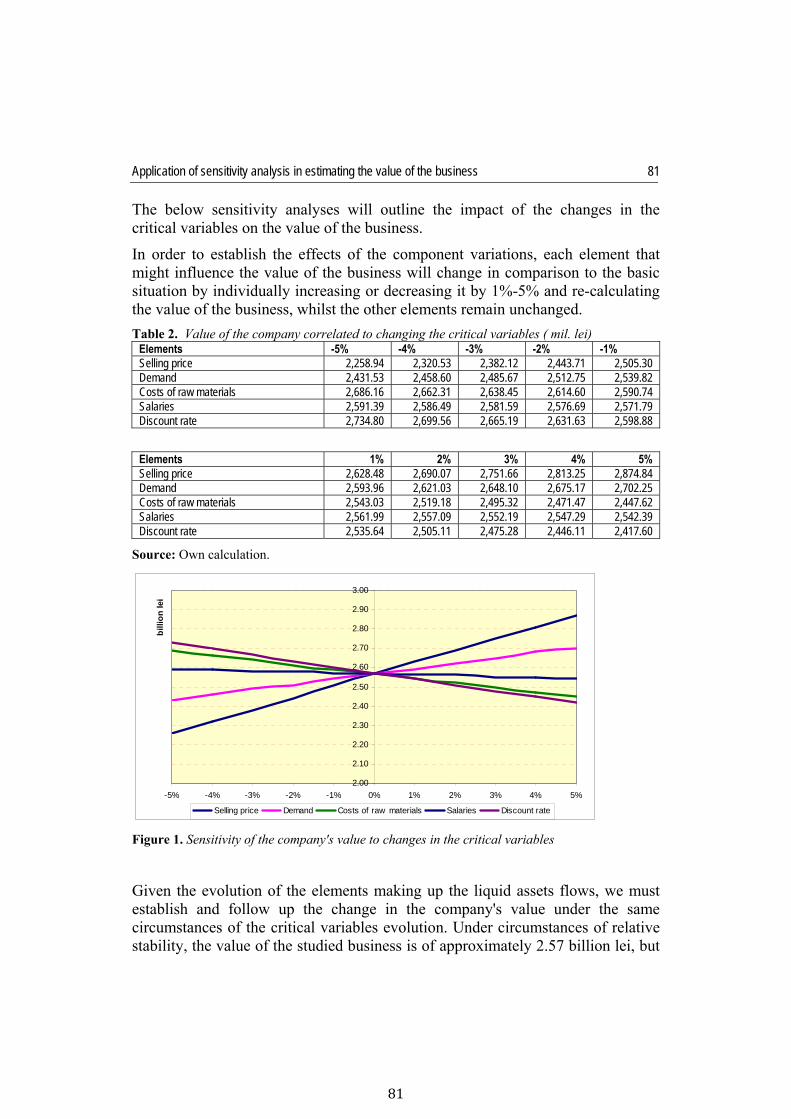
Application of sensitivity analysis in estimating the value of the business
81
81
The below sensitivity analyses will outline the impact of the changes in the critical variables on the value of the business.
In order to establish the effects of the component variations, each element that might influence the value of the business will change in comparison to the basic situation by individually increasing or decreasing it by 1%-5% and re-calculating the value of the business, whilst the other elements remain unchanged.
Table 2. Value of the company correlated to changing the critical variables ( mil. lei) Elements -5% -4% -3% -2% -1% Selling price 2,258.94 2,320.53 2,382.12 2,443.71 2,505.30 Demand 2,431.53 2,458.60 2,485.67 2,512.75 2,539.82 Costs of raw materials 2,686.16 2,662.31 2,638.45 2,614.60 2,590.74 Salaries 2,591.39 2,586.49 2,581.59 2,576.69 2,571.79 Discount rate 2,734.80 2,699.56 2,665.19 2,631.63 2,598.88
Elements 1% 2% 3% 4% 5% Selling price 2,628.48 2,690.07 2,751.66 2,813.25 2,874.84 Demand 2,593.96 2,621.03 2,648.10 2,675.17 2,702.25 Costs of raw materials 2,543.03 2,519.18 2,495.32 2,471.47 2,447.62 Salaries 2,561.99 2,557.09 2,552.19 2,547.29 2,542.39 Discount rate 2,535.64 2,505.11 2,475.28 2,446.11 2,417.60
Source: Own calculation.
2.00
2.10
2.20
2.30
2.40
2.50
2.60
2.70
2.80
2.90
3.00
-5% -4% -3% -2% -1% 0% 1% 2% 3% 4% 5%
billi
on le
i
Selling price Demand Costs of raw materials Salaries Discount rate
Figure 1. Sensitivity of the company's value to changes in the critical variables
Given the evolution of the elements making up the liquid assets flows, we must establish and follow up the change in the company's value under the same circumstances of the critical variables evolution. Under circumstances of relative stability, the value of the studied business is of approximately 2.57 billion lei, but
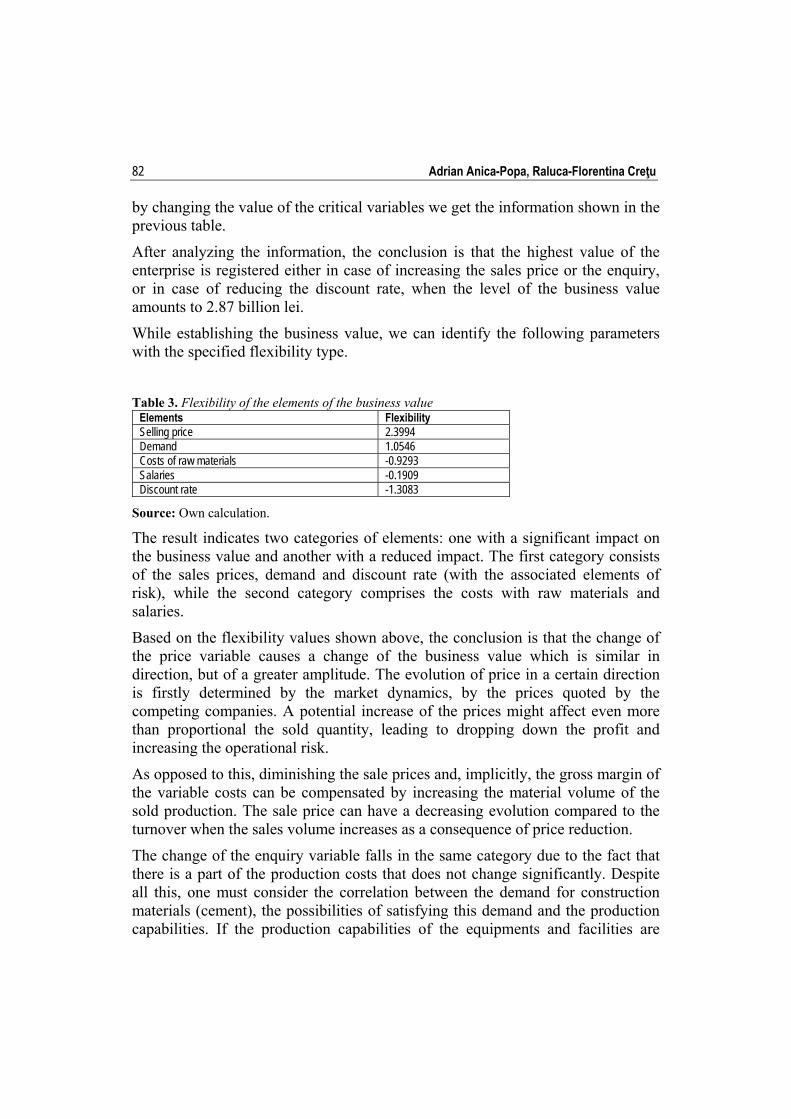
Adrian Anica-Popa, Raluca-Florentina Creţu 82
by changing the value of the critical variables we get the information shown in the previous table.
After analyzing the information, the conclusion is that the highest value of the enterprise is registered either in case of increasing the sales price or the enquiry, or in case of reducing the discount rate, when the level of the business value amounts to 2.87 billion lei.
While establishing the business value, we can identify the following parameters with the specified flexibility type.
Table 3. Flexibility of the elements of the business value Elements Flexibility Selling price 2.3994Demand 1.0546Costs of raw materials -0.9293Salaries -0.1909Discount rate -1.3083
Source: Own calculation.
The result indicates two categories of elements: one with a significant impact on the business value and another with a reduced impact. The first category consists of the sales prices, demand and discount rate (with the associated elements of risk), while the second category comprises the costs with raw materials and salaries.
Based on the flexibility values shown above, the conclusion is that the change of the price variable causes a change of the business value which is similar in direction, but of a greater amplitude. The evolution of price in a certain direction is firstly determined by the market dynamics, by the prices quoted by the competing companies. A potential increase of the prices might affect even more than proportional the sold quantity, leading to dropping down the profit and increasing the operational risk.
As opposed to this, diminishing the sale prices and, implicitly, the gross margin of the variable costs can be compensated by increasing the material volume of the sold production. The sale price can have a decreasing evolution compared to the turnover when the sales volume increases as a consequence of price reduction.
The change of the enquiry variable falls in the same category due to the fact that there is a part of the production costs that does not change significantly. Despite all this, one must consider the correlation between the demand for construction materials (cement), the possibilities of satisfying this demand and the production capabilities. If the production capabilities of the equipments and facilities are
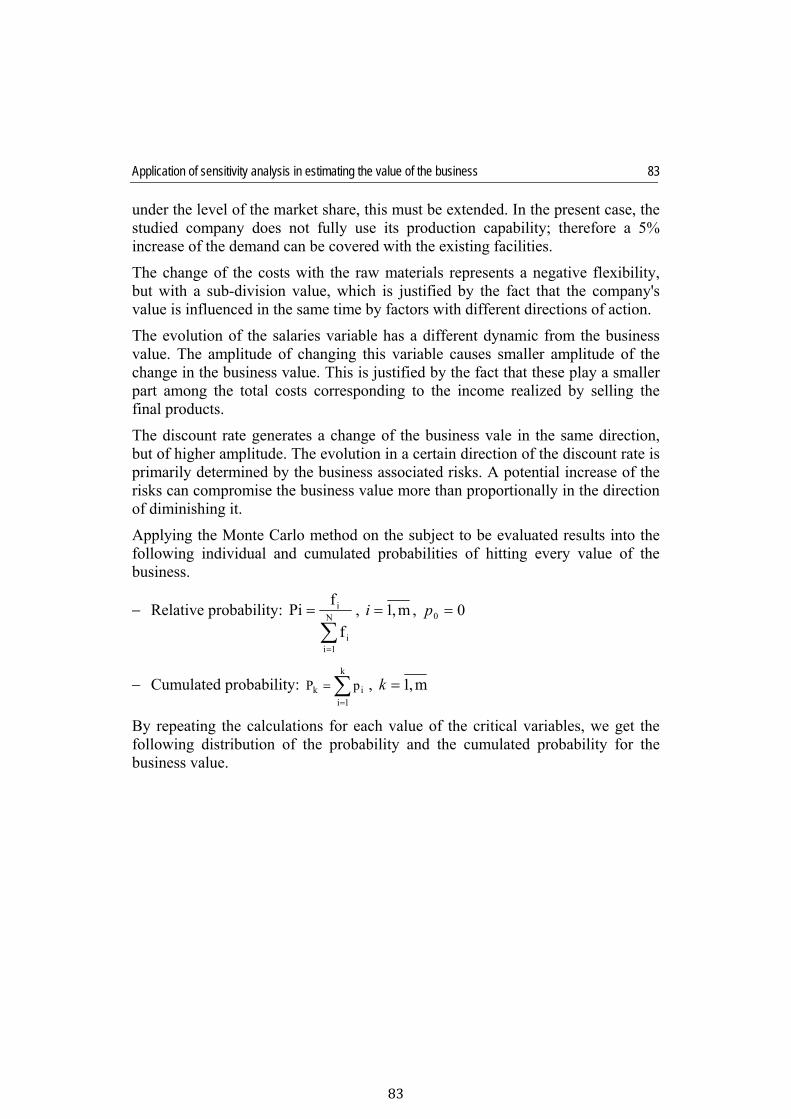
Application of sensitivity analysis in estimating the value of the business
83
83
under the level of the market share, this must be extended. In the present case, the studied company does not fully use its production capability; therefore a 5% increase of the demand can be covered with the existing facilities.
The change of the costs with the raw materials represents a negative flexibility, but with a sub-division value, which is justified by the fact that the company's value is influenced in the same time by factors with different directions of action.
The evolution of the salaries variable has a different dynamic from the business value. The amplitude of changing this variable causes smaller amplitude of the change in the business value. This is justified by the fact that these play a smaller part among the total costs corresponding to the income realized by selling the final products.
The discount rate generates a change of the business vale in the same direction, but of higher amplitude. The evolution in a certain direction of the discount rate is primarily determined by the business associated risks. A potential increase of the risks can compromise the business value more than proportionally in the direction of diminishing it.
Applying the Monte Carlo method on the subject to be evaluated results into the following individual and cumulated probabilities of hitting every value of the business.
Relative probability:
N
1ii
i
f
fPi , m,1i , 00 p
Cumulated probability:
k
1iik pP , m,1k
By repeating the calculations for each value of the critical variables, we get the following distribution of the probability and the cumulated probability for the business value.
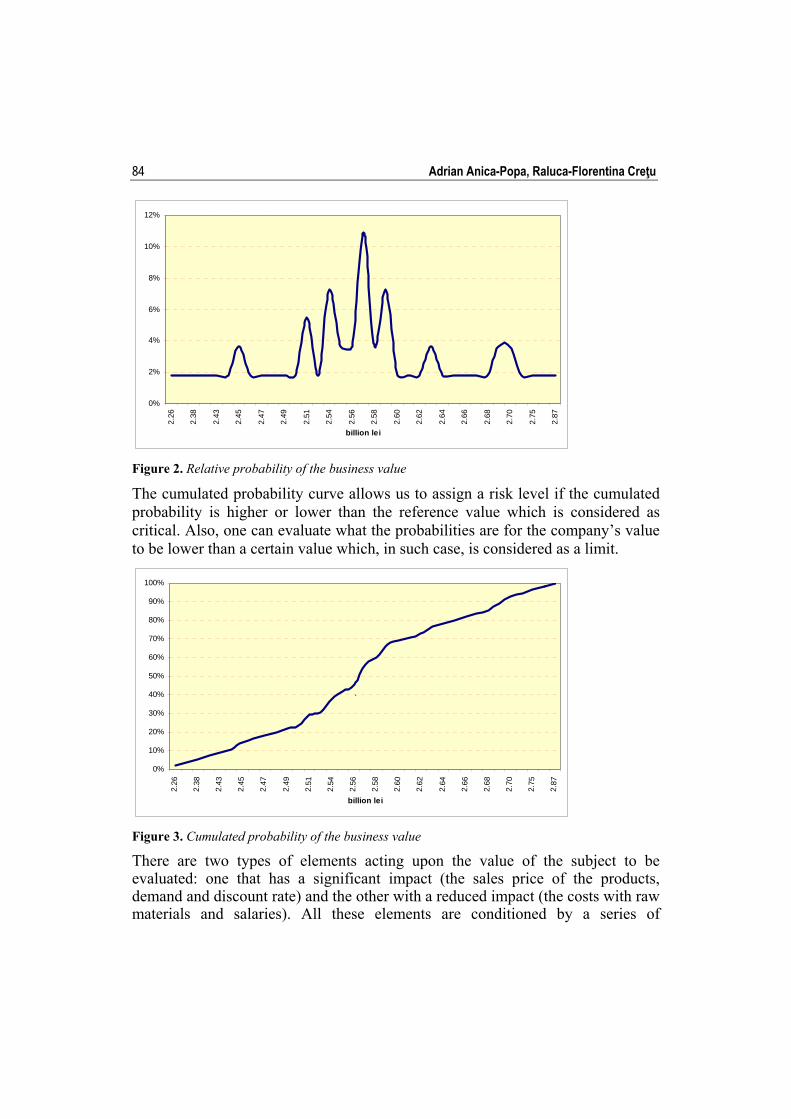
Adrian Anica-Popa, Raluca-Florentina Creţu 84
0%
2%
4%
6%
8%
10%
12%
2.26
2.38
2.43
2.45
2.47
2.49
2.51
2.54
2.56
2.58
2.60
2.62
2.64
2.66
2.68
2.70
2.75
2.87
billion lei
Figure 2. Relative probability of the business value
The cumulated probability curve allows us to assign a risk level if the cumulated probability is higher or lower than the reference value which is considered as critical. Also, one can evaluate what the probabilities are for the company’s value to be lower than a certain value which, in such case, is considered as a limit.
0%
10%
20%
30%
40%
50%
60%
70%
80%
90%
100%
2.26
2.38
2.43
2.45
2.47
2.49
2.51
2.54
2.56
2.58
2.60
2.62
2.64
2.66
2.68
2.70
2.75
2.87
billion lei
`
Figure 3. Cumulated probability of the business value
There are two types of elements acting upon the value of the subject to be evaluated: one that has a significant impact (the sales price of the products, demand and discount rate) and the other with a reduced impact (the costs with raw materials and salaries). All these elements are conditioned by a series of
Application of sensitivity analysis in estimating the value of the business
85
85
economic, political, social criteria. All these can stand as foundation to the sales/purchasing decisions of such business.
The probability study shows that there’s relatively high probability that the business value sticks around the value of 2.57 billion lei.
Conclusions
The need for evaluating the company and company related operational units derives from the users’ necessity, that is present and potential investors (shareholders), employees, creditors, public administration specialized institutions and public at large, respectively.
The opportunity of investing in the capital market (active and therefore sufficiently diversified) represents the profitability required by all investors (supposedly homogeneous as far as the expected profitability is concerned) for the amount of risk of the investment project. The opportunity cost of the capital is the profitability that investors give up if they invest in a certain investment project and not in real estate values from the same category of risk.
The cost of capital mainly depends on the application of funds and not on their resources, which represents the minimum rate that might be accepted for a business in order to reward the company’s shareholders on a long term for the investment that they have made at the moment of buying the shares of the respective company.
Taking into account the durability of the company, the persistency of the activity and its potential of generating profit, the total value of the company amounts to 2.567 billion lei. This value has been calculated based on updating the liquid assets flows.
By using stochastic models developed based on the Monte Carlo method, we can assign those uncertainties to estimating the company’s value so that, afterwards, by means of the sensitivity analysis we can establish which of the variables has a greater impact on this. The Monte Carlo model may include information regarding known statistic correlations between entries that might vitiate the final results. The sensitivity analysis of the entry variables can be easily used in establishing the ways for increasing the business value.
As far as the sensitivity analysis is concerned, the critical variables that have been identified at the level of the subject to be evaluated refer to the sales price, demand, raw materials, salaries, discount rate. There are two categories of elements acting upon the business value: one with a significant impact (the sales price of the products, the demand and the discount rate) and the other with a reduced impact (the costs with the raw materials and the salaries). All these elements are conditioned by a series of economic, political, social criteria and these can stand as foundation for the sales/purchasing decisions of such a business.
Adrian Anica-Popa, Raluca-Florentina Creţu 86
The probability study shows that there’s relatively high probability that the business value sticks around the value of 2.57 billion lei.
We have noticed that the subject to be evaluated has a high potential and that the increase of the company’s value, depends, on one hand, on the dynamics of the economic environment where this is acting and, on the other hand, on the decisions of the managing teams.
We estimate that, under circumstances of economic instability and given the lack of relevant information from the market in order to apply the comparison method, the most agreeable method for establishing a business value is by updating the liquid assets flows, as this shows best the potential evolutions of the enterprise.
Note (1) See Macmillan Dictionary of Modern Economy (1999) Codecs Publishing House.
References Antill, N., Lee, K. (2008). Company valuation under IFRS, Athenaeum Press Limited, Tyne & Wear, Great Britain Dobroţeanu, C., Dobroţeanu, L. (2007). Audit intern, Editura Infomega, Bucureşti Emery, D.R., Finnerty J.D. (1998). Principles of Finance, West Publishing Company Halpern, P., Weston, J.F., Brigham, E.F. (1998). Finanţe Manageriale, Editura Economică, Bucureşti Hitchner, J.R. (2006). Financial valuation: applications and models, Second Edition, Published by John Wiley & Sona, Inc, United States of America Ioniţă, I. (2009). Evaluarea afacerilor, Editura ASE, Bucureşti Pratt, S., Niculita, A. (2008). Valuing a Business. The Analysis and Appraisal of Closely Held Companies – Fifth Edition, The McGraw-Hill Companies, United States of America Robu, V., Anghel, I., Şerban, E.C., Ţuţui, D. (2003). Evaluarea întreprinderii, Editura ASE, București Robu, V., Anica-Popa A. (2007). „Sensitivity analysis for forecasting the cost and performance of the enterprises in the construction industry”, Revista de contabilitate şi informatică de gestiune, supliment 2007, pp. 135-147 Saltelli, A., Chan, K., Scott, E.M. (2000). Sensitivity Analysis, West Sussex, UK: John Wiley & Sons, Ltd. Stan, S., Anghel, I. (2007). Evaluarea întreprinderii, Editura IROVAL, Bucureşti Thompson, T. (1996). Is Cost of Capital an Outmoded Concept?, Northwestern University Anuarul statistic al României (2008) Dicţionar Macmillan de Economie Modernă (1999). Editura Codecs Standardele Internaţionale de Evaluare (2011). Ediţia a IX-a www.insse.ro www.epp.eurostat.ec.europa.eu
The income approach in the appraisal of real estate
Raluca-Florentina CREŢU The Bucharest University of Economic Studies [email protected] Ştefania-Cristina CUREA The Bucharest University of Economic Studies [email protected]
Abstract. The income approach is one of the three methods used in the appraisal of real estate that provides an indication of the value by changing upcoming cash-flows into a single value of the capital. Prevision principle is fundamental for this approach. The assessor uses a series of methods, techniques and mathematic procedures for purposes of analyzing the capability of the property for generating benefits and converting these into an indication of the updated value of the latter. Following these general considerations, the present study is aiming to show the income approach in an agricultural entity having a vegetal profile.
Keywords: the appraisal real estate; income; expenses; agricultural entity; capitalizing rate. JEL Classification: D14, D24, E32, G32, J43, L66, M41, O13. REL Classification: 14I, 14K, 15B, 15E.
Theoretical and Applied Economics Volume XX (2013), Special Issue, pp. 87-96
Raluca-Florentina Creţu, Ştefania-Cristina Curea 88
Introduction
The consistency of the income approach resides in estimating the value of a real estate property by calculating the actual value of the owner’s/investor’s expected benefits (Işvănescu, 2001, p. 156).
In our country, the International Valuation Standards (IVS) have been adopted as compulsory standards for the members of the National Association of Assessors in Romania (ANEVAR) starting with January 1st, 2004; this has contributed, on one hand, to increasing the quality of the assessors’ services and, on the other hand, to enhancing the credibility of the valuation reports among the great group of the users of valuation services.
In Romania, IVSs have been brought up to date in 2011, bringing along a series of changes as the result of three years of intense activity of the Standard Board of the International Valuation Standards Council (IVSC) and of the contributions of many well-known personalities famous for their participation in improving and simplifying valuation theory, methodology and practices. These changes have pointed towards formal aspects, such as name, numbering, size and structure of each standard, as well as towards fundamental aspects such as the focus of each standard on explaining the valuation principles and their applications.
The income approach is one of the three methods of valuating real estate properties and it is based on the idea of continuous use that is the valuated property carrying through its operational activity, without being affected.
Goals
The hereby study is aiming to show the ways of establishing the market value of the property rights over an agricultural entity with vegetal profile, in conformity with the 2011 International Valuation Standards. We will therefore identify the specific aspects regarding the estimation of the capitalization rate, the method of capitalizing the income, respectively the fundamental techniques used for acquiring a compelling opinion regarding value, as well as showing the most appropriate situations for using the method together with its limits. In the same time, we will also analyze the relation between the income approach and the valuation principles, anticipation and change respectively.
Methodology
For purposes of establishing the market value of the property rights over an agricultural farm with vegetal profile, we will use the income approach method in order to estimate the capitalization rate and the method of capitalizing income. We will show our final point of view with regard to the market value of the farm by means of identifying the net income calculated as balance between the gross
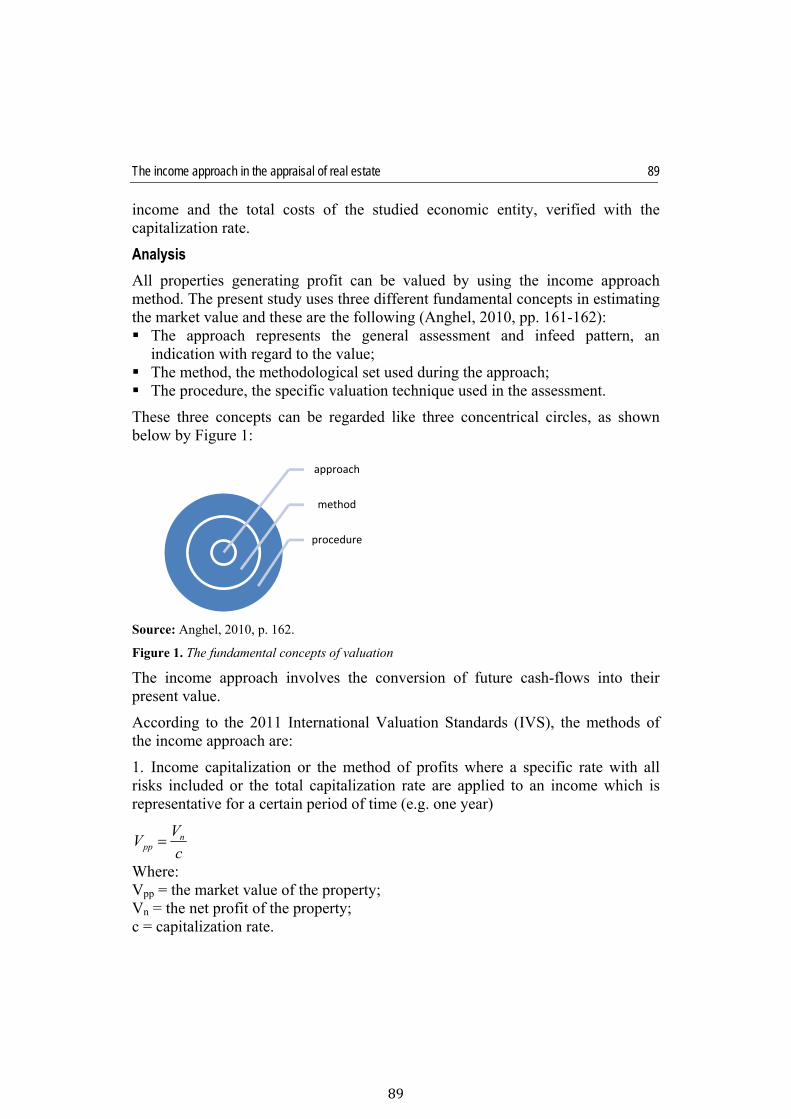
The income approach in the appraisal of real estate
89
89
income and the total costs of the studied economic entity, verified with the capitalization rate.
Analysis
All properties generating profit can be valued by using the income approach method. The present study uses three different fundamental concepts in estimating the market value and these are the following (Anghel, 2010, pp. 161-162): The approach represents the general assessment and infeed pattern, an
indication with regard to the value; The method, the methodological set used during the approach; The procedure, the specific valuation technique used in the assessment.
These three concepts can be regarded like three concentrical circles, as shown below by Figure 1:
Source: Anghel, 2010, p. 162.
Figure 1. The fundamental concepts of valuation
The income approach involves the conversion of future cash-flows into their present value.
According to the 2011 International Valuation Standards (IVS), the methods of the income approach are:
1. Income capitalization or the method of profits where a specific rate with all risks included or the total capitalization rate are applied to an income which is representative for a certain period of time (e.g. one year)
c
VV n
pp
Where: Vpp = the market value of the property; Vn = the net profit of the property; c = capitalization rate.
approach
method
procedure
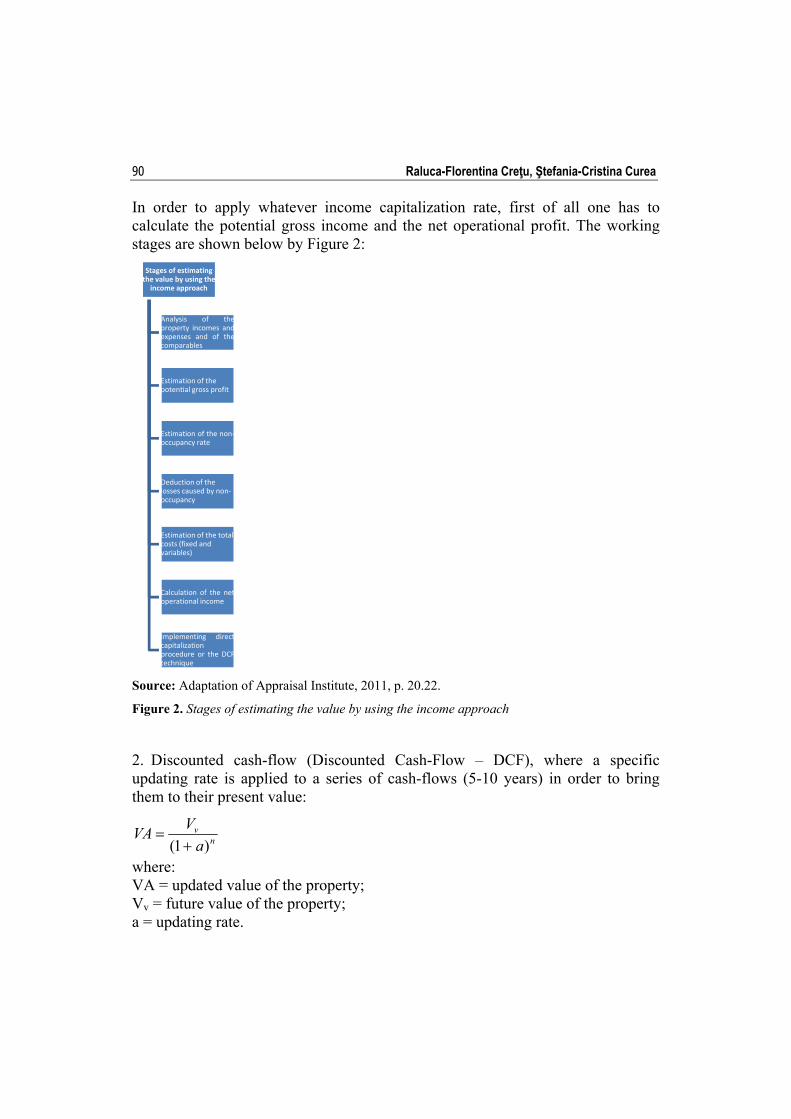
Raluca-Florentina Creţu, Ştefania-Cristina Curea 90
In order to apply whatever income capitalization rate, first of all one has to calculate the potential gross income and the net operational profit. The working stages are shown below by Figure 2:
Source: Adaptation of Appraisal Institute, 2011, p. 20.22.
Figure 2. Stages of estimating the value by using the income approach
2. Discounted cash-flow (Discounted Cash-Flow – DCF), where a specific updating rate is applied to a series of cash-flows (5-10 years) in order to bring them to their present value:
nv
a
VVA
)1(
where: VA = updated value of the property; Vv = future value of the property; a = updating rate.
Stages of estimating the value by using the income approach
Analysis of theproperty incomes andexpenses and of thecomparables
Estimation of the potential gross profit
Estimation of the non‐occupancy rate
Deduction of the losses caused by non‐occupancy
Estimation of the total costs (fixed and variables)
Calculation of the netoperational income
Implementing directcapitalizationprocedure or the DCFtechnique
The income approach in the appraisal of real estate
91
91
nn
a
CF
a
CF
a
CFVA
)1(.....
)1()1( 22
11
where: CF = cash-flow corresponding to the studied period of time; n = number of years corresponding to the studied period of time.
Establishing cost of capital or discount rate (Angel, 2010, p. 173) is a key element in the methods of the income-based approach. The cost of equity has been for decades the purpose of the work of many famous economists that embraced the challenge of finding the appropriate method of calculation (Ciora, 2011, p. 684).
The discounted cash-flow analysis (DCF) is used in order to calculate the updated value of the property by applying an updating rate to a set of income flows and an estimated final value.
nT
nn
DCF a
V
a
CF
a
CF
a
CFV
)1()1(.....
)1()1( 22
11
where: VDCF = value of the property; VT = final value.
3. Various models of valuating options.
The capitalization rate (Işfănescu, 2001, pp. 159-160) is used for converting a constant and repeatable flow into the present value of the property. The capitalization rate takes over all future fluctuations of the income taken into account for estimating the value. Fluctuations of the future incomes are included in the capitalization by deducting the annual income increase rate from the updating rate using the Gordon-Shapiro proportion:
gac where: c = capitalization rate; a = updating rate; g = increase rate.
Raluca-Florentina Creţu, Ştefania-Cristina Curea 92
pp
n
V
Vc
where: Vpp = market value of the property; Vn = net income of the property; c = capitalization rate.
Special attention has to be given to the value of the property resulted from the income approach more than to the value resulted from other approaches due to the fact that using capitalization is done in order to simulate the buyers'/investors' motivations, relying on the gross income multipliers.
This is the reason why the income capitalization method cannot rely exclusively on the information supplied by comparable sales, although the information supplied by the market are extremely important. Income updating requires establishing an appropriate updating rate, meaning that this has to reflect the investors' profit expectations.
The fundamental principle of the income approach consists of anticipation due to the fact that all capitalization methods, techniques and procedures take into account the future forecast benefits and estimate their updated value. These must equally and correctly anticipate the change of profits in time, within the income approach.
When applying the capitalization procedure, one must correctly estimate both the profits as well as the expenses of the studied property.
When estimating profit, the following conditions must be considered (Appraisal Institute, 2011, p. 21.2): Potential gross profit (VBP) representing the total income generated by the
studied real estate property under circumstances of maximum use; Real gross income (VBE) representing the profit adjusted due to the losses
caused by non-occupancy; Operational net profit (VNE) which is the profit calculated after deducting all
operational expenses; The cash-flow relating to own capital.
Operational expenses are divided into fixed, variable and expenses allocated for replacements.
Generally speaking, fixed expenses are paid regardless of the occupancy level of the studied property. Taxes and costs generated by property insurance are part of this category; these are values which must be calculated as precisely as possible in order to get a real picture of the property value. Other types of expenses can be
The income approach in the appraisal of real estate
93
93
added on top of these, such as: buildings repairs and maintenance, water bills, amortization, management etc.
The variable expenses consist of: utilities, salaries, commissions, operational interests, etc which vary along the year.
Allocation for replacement, equally known as provision, is calculated for the temporary replacements of some of the buildings components such as: kitchen equipments, toilets, boilers, elevator, carpet, roof (the covering sheets), outside painting, footways, roads, parking, etc.
Scenario: The present study is aiming to determine the market value of the property right over a modern agriculture farm with vegetal profile which is equipped with functional buildings and equipments, including irrigation systems and crops storing spaces, by using the income approach.
The respect of the EU norms from the environment and agricultural production quality angles of view impose the search for the optimum variants to plant them (Oancea-Negescu, 2009, p.137 ).
The increase of agricultural production (Anica-Popa, 2009, p. 169) and of its quality does not exclude the use of fertilizers and pesticides, but is based mainly on the limitation of the usage of chemical substances and of more natural methods regarding the protection of the cultures, than the ones used in the intensive agriculture.
Green economics and Green politics emphasize the new alternatives that have been found in every field of economy (Vîrjan, 2008, p. 56).
The economic entity has 150 hectares cultivated with 4 agricultural seedlings, as shown below under Table 1:
Table 1. Income obtained by the economic entity Area unit Tons/ha Price (Euro/ton) Income (Euro) Bakery wheat 60 ha 5.5 180 59,400.00 Corn 40 ha 4.5 165 29,700.00 Rape 30 ha 2.5 395 29,625.00 Sun flower 20 ha 2.0 410 16,400.00 TOTAL 150 135,125 ROUNDED TOTAL 135,000
Source: our own calculations.
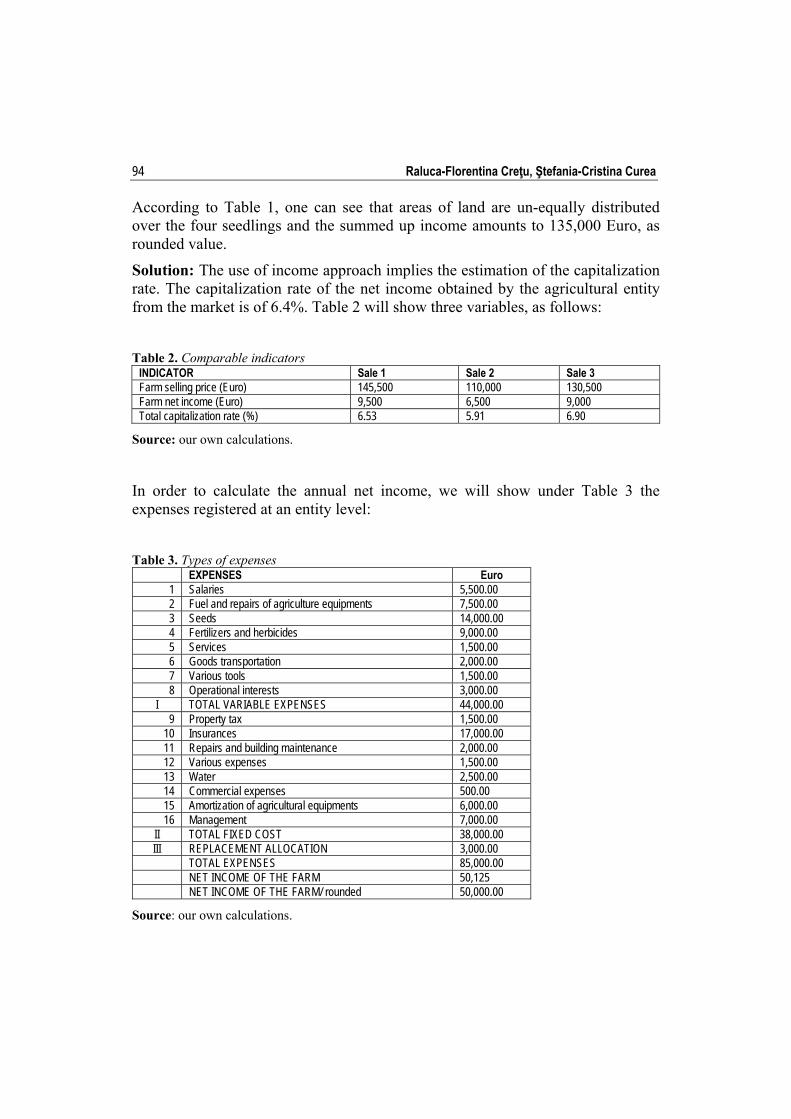
Raluca-Florentina Creţu, Ştefania-Cristina Curea 94
According to Table 1, one can see that areas of land are un-equally distributed over the four seedlings and the summed up income amounts to 135,000 Euro, as rounded value.
Solution: The use of income approach implies the estimation of the capitalization rate. The capitalization rate of the net income obtained by the agricultural entity from the market is of 6.4%. Table 2 will show three variables, as follows:
Table 2. Comparable indicators
INDICATOR Sale 1 Sale 2 Sale 3 Farm selling price (Euro) 145,500 110,000 130,500 Farm net income (Euro) 9,500 6,500 9,000 Total capitalization rate (%) 6.53 5.91 6.90
Source: our own calculations.
In order to calculate the annual net income, we will show under Table 3 the expenses registered at an entity level:
Table 3. Types of expenses EXPENSES Euro
1 Salaries 5,500.002 Fuel and repairs of agriculture equipments 7,500.003 Seeds 14,000.004 Fertilizers and herbicides 9,000.005 Services 1,500.006 Goods transportation 2,000.007 Various tools 1,500.008 Operational interests 3,000.00
I TOTAL VARIABLE EXPENSES 44,000.009 Property tax 1,500.00
10 Insurances 17,000.0011 Repairs and building maintenance 2,000.0012 Various expenses 1,500.0013 Water 2,500.0014 Commercial expenses 500.0015 Amortization of agricultural equipments 6,000.0016 Management 7,000.00
II TOTAL FIXED COST 38,000.00III REPLACEMENT ALLOCATION 3,000.00
TOTAL EXPENSES 85,000.00 NET INCOME OF THE FARM 50,125 NET INCOME OF THE FARM/ rounded 50,000.00
Source: our own calculations.
The income approach in the appraisal of real estate
95
95
Final opinion: Given a 6.4% capitalization rate, the market value of the property right over the 150 hectares of land for agriculture and the equipments of the eco-nomic entity (irrigation system, storing spaces, agriculture units and equipments) amounts to 781,250.00 Euro (50,000 Euro/0.064), respectively 5,200 euro/hectare.
Euro Euro/haFinal opinion 781,250.00 5,208.33Final opinion (rounded) 781,250 5,200
Conclusions
Income approach is one of the three methods of establishing the market value which is used especially in those cases when the property generates profit.
In order to determine the final opinion with regard to the market value of the property rights over the studied economic entity, we have calculated the capitalization rate, identified the income and expenses and established in the end the net income of the studied entity as per the 2011 International Valuation Standards (IVS).
References Anghel, I. (coordonator) Negescu, O.M., Anica-Popa, A., Popescu, A.M. (2010). Evaluarea
Întreprinderii, Editura Economică, pp. 161-162, 217-220 Anica-Popa, A., Cişmaşu, I.D. (2009). “Adaptation of production technologies with the aim to
increase the quality of the agricultural production and the respect towards the environmental norms”, Theoretical and Applied Economics, pp. 165-173, accesată la data 5.11.2012,http://www.store.ectap.ro/suplimente/Simpozion-29-31.05.2009_en.pdf#page=189
Appraisal Institute (2011). The Appraisal of Real Estate, 13th Edition, Edition in Romanian language, Bucharest
Ciora C. (2011). “Cost of equity in emerging markets. Evidence from Romanian listed companies”, International Research Journal of Applied Finance, Vol. II, No. 6, June, pp. 683-691, ISSN: 2229-6891, http://irjaf.com/uploads/irjaf_vol_2_issue_6.pdf; accesat 5.11.2012
Işfănescu, A., Robu, V., Anghel, I. (2001). “Abordarea pe bază de venit în evaluarea întreprinderii”, Evaluarea Întreprinderii, Editura Tribuna Economică, pp. 156-169
International Valuation Standards Council (2011). “Cadrul general”, Standardele Internaţionale de Evaluare, IROVAL – Bucureşti, pp. 33-34

Raluca-Florentina Creţu, Ştefania-Cristina Curea 96
Oancea-Negescu, M.D., Cişmaşu, I.D., Motofei, C. (2009). “Agricultura ecologică şi performanţa fermelor agricole”, Revista Română de Statistică, Supliment, No. 6, June, pp.137-142
Vîrjan, D. (2008). “Green economy - a chance for mankind, International Conference”, “Ecological Performance in a competitive economy, Supplement of Quality-access to success”, Journal Year 9, No. 94, Edited by Romanian Society for Quality Assurance, pp.55-59, Bucharest 20-21 November
Accounting practices and treatments regarding the real estate assets. Reference points for the decisional process
Iulia DAVID-SOBOLEVSCHI Academy of Economic Studies [email protected] Monica Aureliana PETCU Academy of Economic Studies [email protected] Ovidiu BUNGET West University of Timişoara [email protected] Marian LĂPUŞTE “Alexandru Ioan Cuza” Police Academy, Bucharest [email protected]
Abstract. The fundamentation of the investment decision on the real estate market according to the financial goals, the domain-specific constraints and the macro environment requires the systematization and profound study of the associated concepts. On the real estate market there are transacted real estate assets, which are structured in terms of the rights owned on them, their position within the real estate transaction, and the organizing manner of the partaker. This undertaking targets the accounting particularities of the real estate assets at enterprise level, by introspecting the recognition principles, the accounting and fiscal procedures, as well as their incidence on the financial performance and position indicators.
Keywords: real estate assets; recognition; revaluation; depreciation. JEL Classification: M41, M42, D04. REL Classification: 14I, 14J, 11F.
Theoretical and Applied Economics Volume XX (2013), Special Issue, pp. 97-108
Iulia David-Sobolevschi, Monica Aureliana Petcu, Ovidiu Bunget, Lăpuşte Marian 98
Introduction
The complexity and dynamics of the activities reflected in accounting and the connection to the market economy exigencies determined the transit of accounting from the “accountant’s paradigm to the manager’s paradigm” (Feleagă, Ionaşcu, 1998, p. 11) and imposed the occurrence of new concepts and notions, amplifying the domain-specific toolkit.
The need of “transparent, useful, essential information … for a neat and efficient market” (Greuning, 2007, p. 23), in a globalized but extremely diverse world, and the expansion of the users’ area for this information were the obvious and objective requests for ensuring the compatibility of concepts, notions and created data, as well as for the systematization and standardization of procedures and treatments adopted within the national practices.
By the significant weight they have within the enterprise assets, as well as by their major impact on the markets, the real estate assets are one of the domains constantly treated and adapted to a sustained dynamic of conceptualizations and interrelations between the various theoretizations.
Research methodology
The purpose of this undertaking is the dissemination and treatment of the accounting aspects related to the holding, exploitation, alienation or write-off of the real estate assets.
The goals of the research include: the operationalization of the identified aspects and their reflection in the
enterprise’s financial performance and position; the correlation/integration of the theoretical statements from various rules and
standards, in an integrating and explanatory approach.
The research methodology targets the fundamental theoretical statements from the legislation and standards in the domain, which represents the reference for the approach of the accounting of real estate assets. For that purpose, the specialized literature was revised and the ideas useful to the approached matter were synthesized. The deductive judgment allowed the establishment of logical connections between the used concepts and the testing of the expressed assumptions through empirical studies.
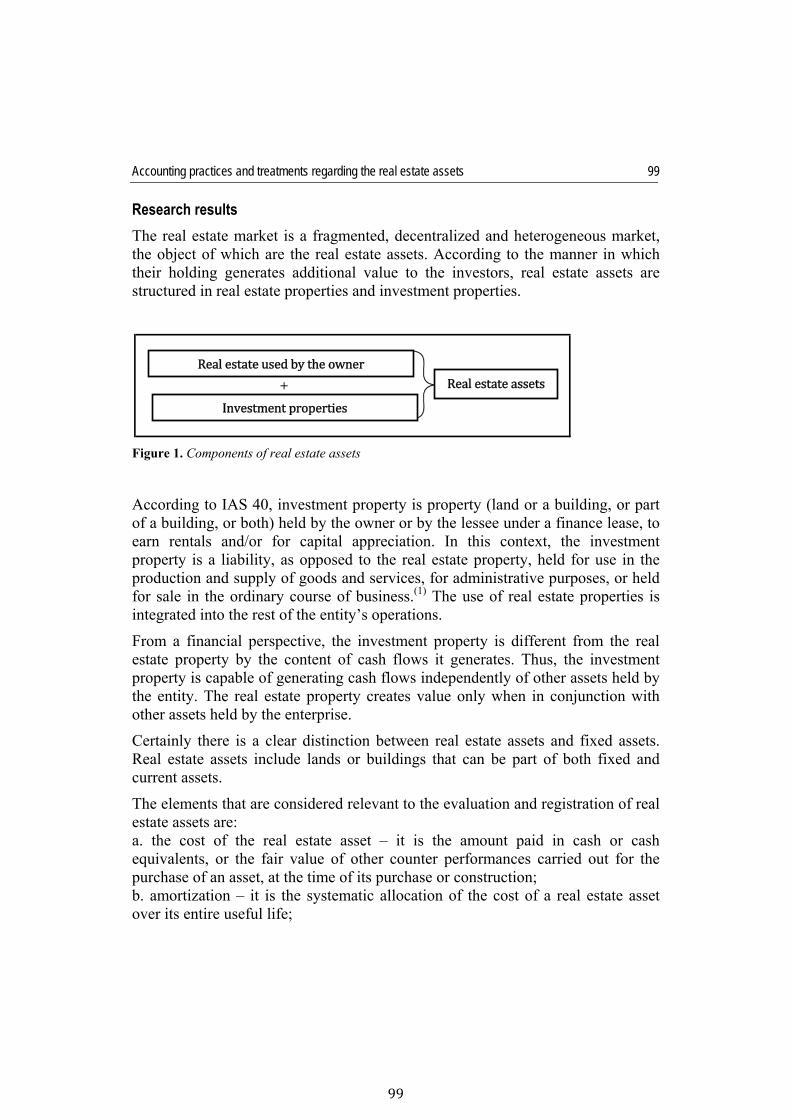
Accounting practices and treatments regarding the real estate assets
99
99
Research results
The real estate market is a fragmented, decentralized and heterogeneous market, the object of which are the real estate assets. According to the manner in which their holding generates additional value to the investors, real estate assets are structured in real estate properties and investment properties.
Figure 1. Components of real estate assets
According to IAS 40, investment property is property (land or a building, or part of a building, or both) held by the owner or by the lessee under a finance lease, to earn rentals and/or for capital appreciation. In this context, the investment property is a liability, as opposed to the real estate property, held for use in the production and supply of goods and services, for administrative purposes, or held for sale in the ordinary course of business.(1) The use of real estate properties is integrated into the rest of the entity’s operations.
From a financial perspective, the investment property is different from the real estate property by the content of cash flows it generates. Thus, the investment property is capable of generating cash flows independently of other assets held by the entity. The real estate property creates value only when in conjunction with other assets held by the enterprise.
Certainly there is a clear distinction between real estate assets and fixed assets. Real estate assets include lands or buildings that can be part of both fixed and current assets.
The elements that are considered relevant to the evaluation and registration of real estate assets are: a. the cost of the real estate asset – it is the amount paid in cash or cash equivalents, or the fair value of other counter performances carried out for the purchase of an asset, at the time of its purchase or construction; b. amortization – it is the systematic allocation of the cost of a real estate asset over its entire useful life;
Proprietăţi imobiliare utilizate de posesor
+ Active imobiliare
Investiţii imobiliare
Realestateassets
Realestateusedbytheowner
Investmentproperties
Iulia David-Sobolevschi, Monica Aureliana Petcu, Ovidiu Bunget, Lăpuşte Marian 100
c. realizable value – it is the present value of cash flows that the real estate assets held by the enterprise are expected to generate by their sale for the above mentioned purposes, or that the enterprise expects to obtain after paying up debt; d. fair value – it is the amount of exchange of real estate assets by two parties of their own free will, in a transaction where the cost is objectively determined; e. residual value – it is the net amount that an enterprise expects to obtain from a real estate asset at the end of its useful life, after deducting the estimated costs of disposal, if the assets were already of the age and in the condition expected at the end of their useful life; f. useful life – it is the period of time over which the enterprise expects to obtain cash flows from the asset holding.
Real estate assets are recognized as an asset of an enterprise when: it is probable that the future economic benefits associated with the asset will
flow to the enterprise; and the cost of the asset can be measured reliably.
This is the professional argument used to apply the definition criteria for the specific circumstances or types.
A real estate asset which is recognized as an asset shall be measured initially at its cost. The cost of a real estate asset is made of: the purchase price, custom duties and non-refundable taxes; any directly attributable costs to bring the asset to the location and conditions
necessary for it to be capable of operating in the manner intended by management.
Even though administrative costs are not capitalized, there are truly incremental costs of an asset, such as a consulting fee or commission paid to an agent hired specifically to assist in the acquisition, which may be treated as a part of the initial amount to be recognized as the asset cost.
Certain operations are deeply related to the construction or development process of an asset, but they are not necessary in the process of bringing it to the location and conditions necessary for it to be capable of operating in the manner intended by management. At the same time, there are incidental operations that are not directly related to the asset, which may occur before or during the development, construction or implementation activities of that asset (the field destined to a building may generate income if used as a parking lot, until the beginning of the construction of the building. This type of income and the associated costs are recognized in the profit and loss account of the exercise in which they are generated, as income and expenditure).
Accounting practices and treatments regarding the real estate assets
101
101
The accounting treatment for subsequent expenditure regarding the real estate assets is imposed by their nature, and stipulated in Order no. 3055 from 29 October 2009 on the approval of accounting regulations in accordance with European directives. Therefore, as a general rule, the costs of assets conservation are not capitalized because they only bring that asset to the initial functioning parameters. These costs are recognized in the Profit and Loss Account as soon as they are paid. At the same time, the investments related to real estate assets that are carried out as subsequent expenditure, which improve their initial technical parameters and lead to future economic benefits, are capitalized. Benefits are obtained both directly from income increase, and indirectly from the reduction of maintenance and functioning expenses. In the case of buildings, investments shall guarantee the protection of human and material values and the improvement of the comfort degree and ambient, or their rehabilitation and thermal modernization. The recognition of real estate assets is also mentioned in the Government Decision no. 2139 from 30 November 2004, for approving the Catalogue regarding the classification and normal operating times of fixed assets. The amortization of these investments is made either during the normal use period left or by increasing the normal use period up to 10%, or up to 20% in the case of public institutions. If the subsequent expenditure is carried out after the expiration of the normal period, a technical committee or an independent technical expert shall establish a new normal period.
A practice generated by the low liquidity of enterprises is represented by the acquirement of real estate assets in exchange for a similar asset or not (also called non-monetary transactions), or a combination of assets and cash flows. The cost of the new asset is represented by the fair value, unless: the exchange transaction lacks commercial quality or commercial substance; or the fair value of neither the asset received nor the asset given up can be
measured reliably.
The accounting treatment regarding the mutual exchange of assets is different in the applicable regulations. Thus, Order no. 3055 from 29 October 2009 stipulates that the exchange of assets refers to two distinct transactions (two goods deliveries with payment), which should be reflected in separate accounting registers, at market value, only by compensating payment and associated receivables. The International Financial Reporting Standards stipulate the simplification of accounting registers by recording in the profit and loss account the difference between the cost of the real estate asset and its market value at the moment of the transfer.
As for the subsequent recognition of the real estate assets, an enterprise may decide on the basic accounting treatment or on the allowed alternative one, which corresponds to the applied accounting policy. According to the basic accounting
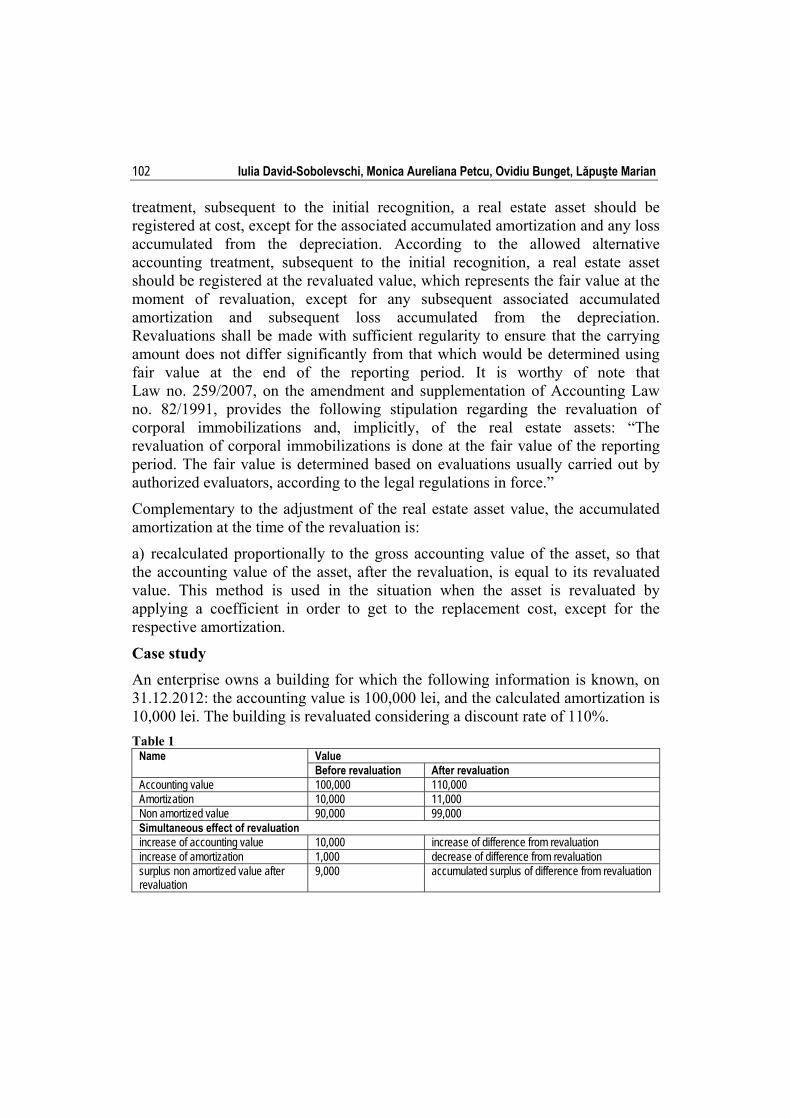
Iulia David-Sobolevschi, Monica Aureliana Petcu, Ovidiu Bunget, Lăpuşte Marian 102
treatment, subsequent to the initial recognition, a real estate asset should be registered at cost, except for the associated accumulated amortization and any loss accumulated from the depreciation. According to the allowed alternative accounting treatment, subsequent to the initial recognition, a real estate asset should be registered at the revaluated value, which represents the fair value at the moment of revaluation, except for any subsequent associated accumulated amortization and subsequent loss accumulated from the depreciation. Revaluations shall be made with sufficient regularity to ensure that the carrying amount does not differ significantly from that which would be determined using fair value at the end of the reporting period. It is worthy of note that Law no. 259/2007, on the amendment and supplementation of Accounting Law no. 82/1991, provides the following stipulation regarding the revaluation of corporal immobilizations and, implicitly, of the real estate assets: “The revaluation of corporal immobilizations is done at the fair value of the reporting period. The fair value is determined based on evaluations usually carried out by authorized evaluators, according to the legal regulations in force.”
Complementary to the adjustment of the real estate asset value, the accumulated amortization at the time of the revaluation is:
a) recalculated proportionally to the gross accounting value of the asset, so that the accounting value of the asset, after the revaluation, is equal to its revaluated value. This method is used in the situation when the asset is revaluated by applying a coefficient in order to get to the replacement cost, except for the respective amortization.
Case study An enterprise owns a building for which the following information is known, on 31.12.2012: the accounting value is 100,000 lei, and the calculated amortization is 10,000 lei. The building is revaluated considering a discount rate of 110%.
Table 1 Name Value
Before revaluation After revaluationAccounting value 100,000 110,000Amortization 10,000 11,000Non amortized value 90,000 99,000Simultaneous effect of revaluation increase of accounting value 10,000 increase of difference from revaluation increase of amortization 1,000 decrease of difference from revaluation surplus non amortized value after revaluation
9,000 accumulated surplus of difference from revaluation
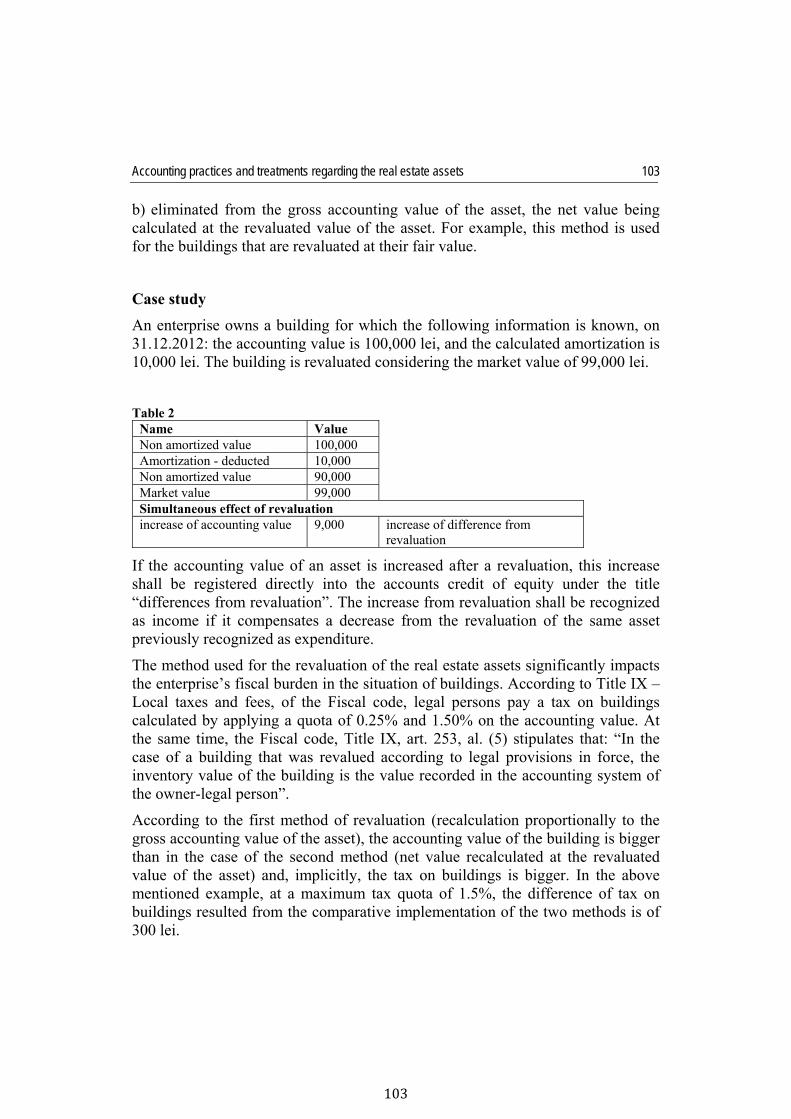
Accounting practices and treatments regarding the real estate assets
103
103
b) eliminated from the gross accounting value of the asset, the net value being calculated at the revaluated value of the asset. For example, this method is used for the buildings that are revaluated at their fair value.
Case study An enterprise owns a building for which the following information is known, on 31.12.2012: the accounting value is 100,000 lei, and the calculated amortization is 10,000 lei. The building is revaluated considering the market value of 99,000 lei.
Table 2 Name Value Non amortized value 100,000 Amortization - deducted 10,000 Non amortized value 90,000 Market value 99,000 Simultaneous effect of revaluation increase of accounting value 9,000 increase of difference from
revaluation
If the accounting value of an asset is increased after a revaluation, this increase shall be registered directly into the accounts credit of equity under the title “differences from revaluation”. The increase from revaluation shall be recognized as income if it compensates a decrease from the revaluation of the same asset previously recognized as expenditure.
The method used for the revaluation of the real estate assets significantly impacts the enterprise’s fiscal burden in the situation of buildings. According to Title IX – Local taxes and fees, of the Fiscal code, legal persons pay a tax on buildings calculated by applying a quota of 0.25% and 1.50% on the accounting value. At the same time, the Fiscal code, Title IX, art. 253, al. (5) stipulates that: “In the case of a building that was revalued according to legal provisions in force, the inventory value of the building is the value recorded in the accounting system of the owner-legal person”.
According to the first method of revaluation (recalculation proportionally to the gross accounting value of the asset), the accounting value of the building is bigger than in the case of the second method (net value recalculated at the revaluated value of the asset) and, implicitly, the tax on buildings is bigger. In the above mentioned example, at a maximum tax quota of 1.5%, the difference of tax on buildings resulted from the comparative implementation of the two methods is of 300 lei.
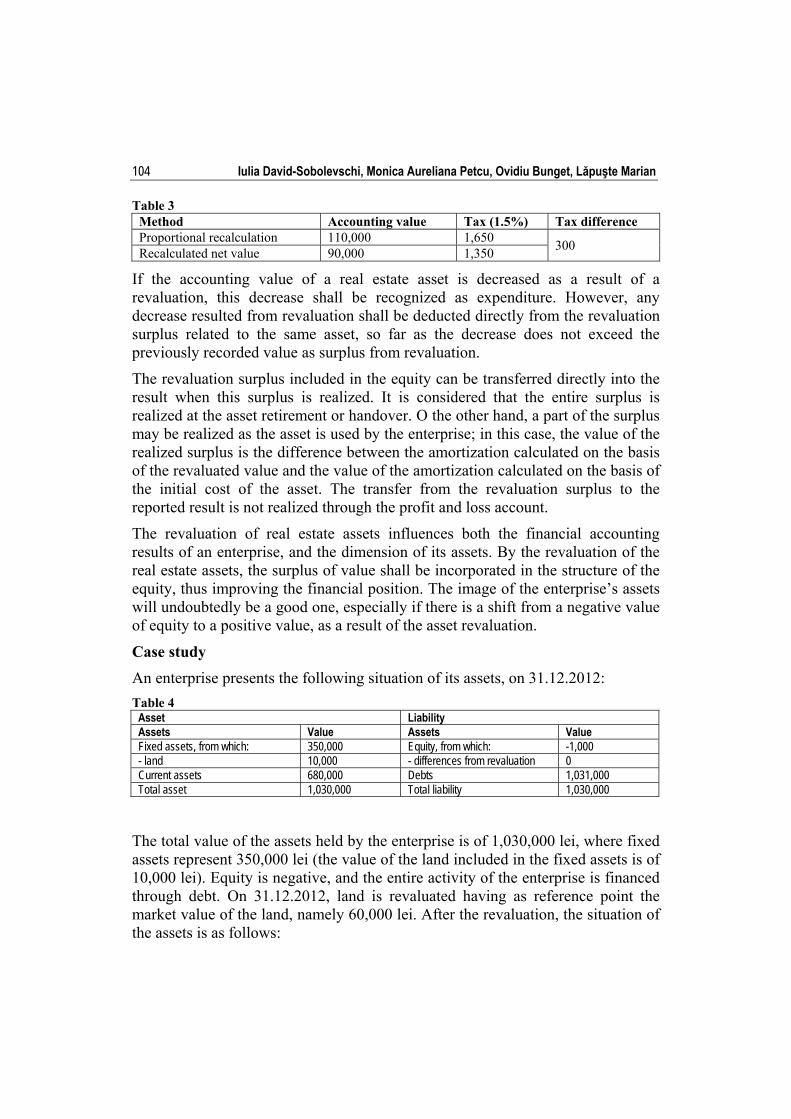
Iulia David-Sobolevschi, Monica Aureliana Petcu, Ovidiu Bunget, Lăpuşte Marian 104
Table 3 Method Accounting value Tax (1.5%) Tax difference Proportional recalculation 110,000 1,650
300 Recalculated net value 90,000 1,350
If the accounting value of a real estate asset is decreased as a result of a revaluation, this decrease shall be recognized as expenditure. However, any decrease resulted from revaluation shall be deducted directly from the revaluation surplus related to the same asset, so far as the decrease does not exceed the previously recorded value as surplus from revaluation.
The revaluation surplus included in the equity can be transferred directly into the result when this surplus is realized. It is considered that the entire surplus is realized at the asset retirement or handover. O the other hand, a part of the surplus may be realized as the asset is used by the enterprise; in this case, the value of the realized surplus is the difference between the amortization calculated on the basis of the revaluated value and the value of the amortization calculated on the basis of the initial cost of the asset. The transfer from the revaluation surplus to the reported result is not realized through the profit and loss account.
The revaluation of real estate assets influences both the financial accounting results of an enterprise, and the dimension of its assets. By the revaluation of the real estate assets, the surplus of value shall be incorporated in the structure of the equity, thus improving the financial position. The image of the enterprise’s assets will undoubtedly be a good one, especially if there is a shift from a negative value of equity to a positive value, as a result of the asset revaluation.
Case study An enterprise presents the following situation of its assets, on 31.12.2012:
Table 4 Asset LiabilityAssets Value Assets Value Fixed assets, from which: 350,000 Equity, from which: -1,000 - land 10,000 - differences from revaluation 0 Current assets 680,000 Debts 1,031,000 Total asset 1,030,000 Total liability 1,030,000
The total value of the assets held by the enterprise is of 1,030,000 lei, where fixed assets represent 350,000 lei (the value of the land included in the fixed assets is of 10,000 lei). Equity is negative, and the entire activity of the enterprise is financed through debt. On 31.12.2012, land is revaluated having as reference point the market value of the land, namely 60,000 lei. After the revaluation, the situation of the assets is as follows:
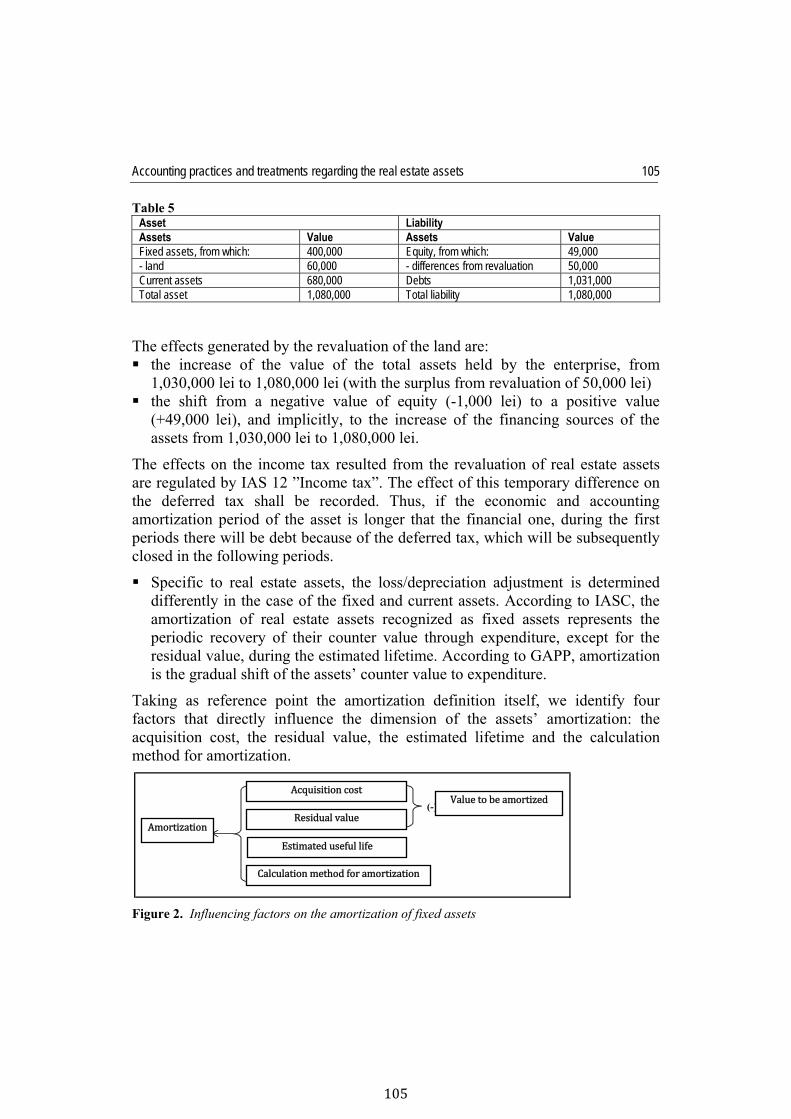
Accounting practices and treatments regarding the real estate assets
105
105
Table 5 Asset LiabilityAssets Value Assets Value Fixed assets, from which: 400,000 Equity, from which: 49,000 - land 60,000 - differences from revaluation 50,000 Current assets 680,000 Debts 1,031,000 Total asset 1,080,000 Total liability 1,080,000
The effects generated by the revaluation of the land are: the increase of the value of the total assets held by the enterprise, from
1,030,000 lei to 1,080,000 lei (with the surplus from revaluation of 50,000 lei) the shift from a negative value of equity (-1,000 lei) to a positive value
(+49,000 lei), and implicitly, to the increase of the financing sources of the assets from 1,030,000 lei to 1,080,000 lei.
The effects on the income tax resulted from the revaluation of real estate assets are regulated by IAS 12 ”Income tax”. The effect of this temporary difference on the deferred tax shall be recorded. Thus, if the economic and accounting amortization period of the asset is longer that the financial one, during the first periods there will be debt because of the deferred tax, which will be subsequently closed in the following periods.
Specific to real estate assets, the loss/depreciation adjustment is determined differently in the case of the fixed and current assets. According to IASC, the amortization of real estate assets recognized as fixed assets represents the periodic recovery of their counter value through expenditure, except for the residual value, during the estimated lifetime. According to GAPP, amortization is the gradual shift of the assets’ counter value to expenditure.
Taking as reference point the amortization definition itself, we identify four factors that directly influence the dimension of the assets’ amortization: the acquisition cost, the residual value, the estimated lifetime and the calculation method for amortization.
Figure 2. Influencing factors on the amortization of fixed assets
Costul de achiziţie(-) Valoarea de amortizat
Valoarea rezidualăAmortizare
Durata de viaţă estimată
Metoda de calcul al amortizării
Amortization
Acquisitioncost
Residualvalue
Estimatedusefullife
Calculationmethodforamortization
Valuetobeamortized

Iulia David-Sobolevschi, Monica Aureliana Petcu, Ovidiu Bunget, Lăpuşte Marian 106
The residual value of an asset (or the recovered value, the retirement value) represents the net recovery, residue or exchange value at the estimated time of decommission. The residual value of an asset may increase to a value equal or superior to the accounting value of the asset. If this happens, the calculated amortization will be null, until the residual value is smaller than the accounting value of the asset.
By deducting the residual value from the acquisition cost we obtain the calculation basis of the amortization within the estimated useful life, respectively the value to be amortized (or the amortizable value). The amortizable value of a real estate asset such as fixed assets shall be systematically allocated along the useful life of the asset.
Lands and buildings are individual assets and they are financially treated in a distinct manner, even when they are purchased together. Usually, lands have indefinite useful lives, hence they are not amortized. If the acquisition cost of the land includes the supported cost after the deconstruction, elimination or restoration of the construction, the restoration cost of the land is amortized during the procurement of benefits resulted from the respective costs. This is also the treatment applicable to all the development works. Therefore, on the subject of land, there are two possibilities: lands – evaluated by the recognized acquisition cost, which represents non-
amortizable assets since the useful life is indefinite; land developments – treated as amortizable assets, for which the useful life is
definite.
Buildings have definite useful lives and they are amortized. An increase of the value of a land on which there is a building does not influence the determination of the useful life of that building.
Complementary to the financial life, the internal life of a building is based on the decision of the management according to: the fiscal burden of the enterprise; the liquidity state of the enterprise; the dimension of the accounting and fiscal result, the dimension of the enterprise’s equity.
The residual value and useful life of an asset shall be revised at the end of each fiscal year, at the least. If there are differences since the last assessments, these shall be accounted as modifications of the accounting policies, according to IAS 8 “Accounting policies, changes in accounting estimates and errors”.
Expenses with amortization are carried out even though the fair value of the asset surpasses its accounting value, unless its residual value is higher than its
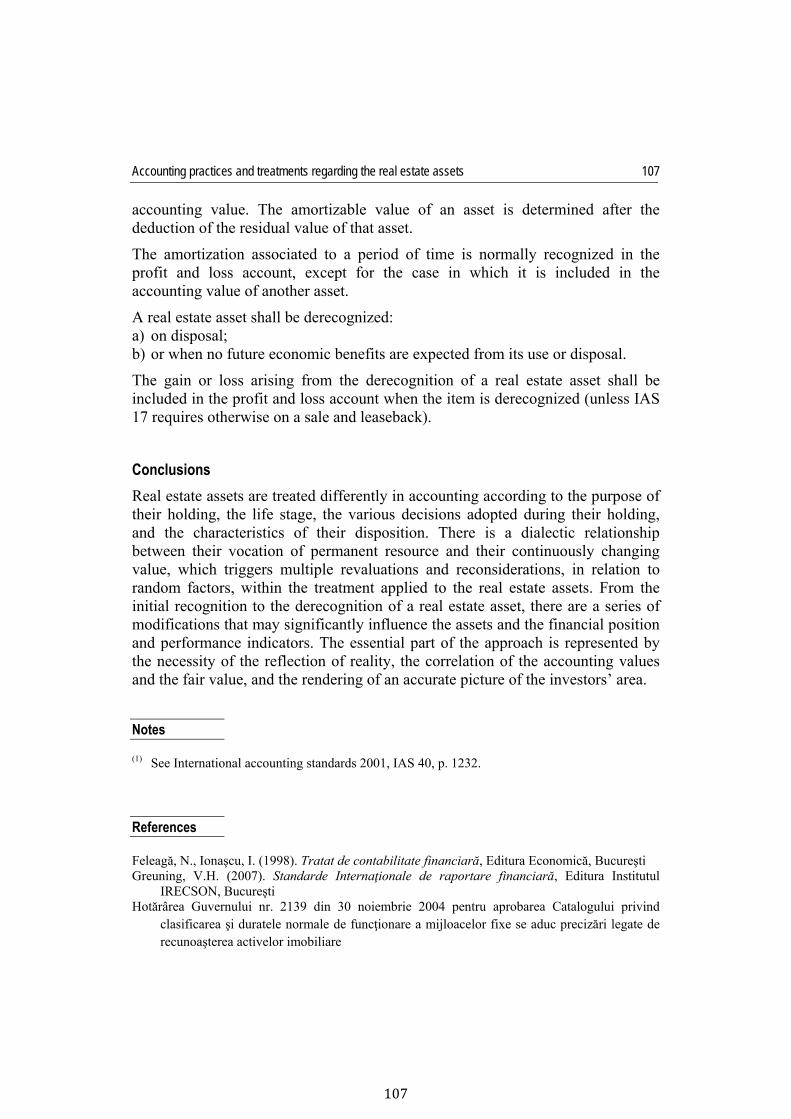
Accounting practices and treatments regarding the real estate assets
107
107
accounting value. The amortizable value of an asset is determined after the deduction of the residual value of that asset.
The amortization associated to a period of time is normally recognized in the profit and loss account, except for the case in which it is included in the accounting value of another asset.
A real estate asset shall be derecognized: a) on disposal; b) or when no future economic benefits are expected from its use or disposal.
The gain or loss arising from the derecognition of a real estate asset shall be included in the profit and loss account when the item is derecognized (unless IAS 17 requires otherwise on a sale and leaseback).
Conclusions
Real estate assets are treated differently in accounting according to the purpose of their holding, the life stage, the various decisions adopted during their holding, and the characteristics of their disposition. There is a dialectic relationship between their vocation of permanent resource and their continuously changing value, which triggers multiple revaluations and reconsiderations, in relation to random factors, within the treatment applied to the real estate assets. From the initial recognition to the derecognition of a real estate asset, there are a series of modifications that may significantly influence the assets and the financial position and performance indicators. The essential part of the approach is represented by the necessity of the reflection of reality, the correlation of the accounting values and the fair value, and the rendering of an accurate picture of the investors’ area.
Notes (1) See International accounting standards 2001, IAS 40, p. 1232.
References Feleagă, N., Ionaşcu, I. (1998). Tratat de contabilitate financiară, Editura Economică, Bucureşti Greuning, V.H. (2007). Standarde Internaţionale de raportare financiară, Editura Institutul
IRECSON, Bucureşti Hotărârea Guvernului nr. 2139 din 30 noiembrie 2004 pentru aprobarea Catalogului privind
clasificarea şi duratele normale de funcţionare a mijloacelor fixe se aduc precizări legate de recunoaşterea activelor imobiliare

Iulia David-Sobolevschi, Monica Aureliana Petcu, Ovidiu Bunget, Lăpuşte Marian 108
Legea nr. 259/2007 pentru modificarea şi completarea Legii contabilităţii nr. 82/1991 Legea nr. 571/2003 privind Codul fiscal Ordinul Ministrului Finanţelor Publice nr. 3055/2009 (OMFP 3055/2009) pentru aprobarea
Reglementărilor contabile conforme cu directivele europene Fundaţia Comitetului pentru Standarde Internaţionale de Contabilitate – IASB, 2001. Standarde
internaţionale de contabilitate 2001. Bucureşti: Editura CECCAR Fundaţia Comitetului pentru Standarde Internaţionale de Contabilitate – IASB, 2009. Standarde
Internaţionale de Raportare Financiară. IFRS-2009. Bucureşti: Editura CECCAR