Embed Size (px)
Citation preview
ECONOMIC GOVERNANCE AND POVERTYREDUCTION IN MALAYSIA
by
Jeffrey Henderson, David Hulme, Richard Phillips and Noorul Ainur M Nur
Jeffrey Henderson and Richard Phillips are respectively Professor of InternationalEconomic Sociology and Research Fellow in Economic Governance at theManchester Business School, University of Manchester, David Hulme is Professor ofDevelopment Studies in the Institute for Development Policy and Management,University of Manchester and Noorul Ainur M. Nur is Senior Project Co-ordinator inEconomics at the National Institute of Public Administration (INTAN), KualaLumpur.
The research on which this paper draws was funded by the Department forInternational Development (DFID) via its Globalisation and Poverty Programme(Grant R7861). We are grateful to DFID and the Programme's Director, JohnHumphrey, for their support and Jomo K.S. for his help with data and his advice onour analysis. Additionally we wish to thank our various respondents in Malaysia andelsewhere for their help.
May 2002
1
1. INTRODUCTION
Among all the factors that influence the rapidity and substance of economic growth, itis now clear that state institutional capacities (and related bureaucratic competence)for economic governance are among the more decisive (Evans and Rauch 1999,Rauch and Evans 2000). Among the countries that have sustained an impressiverecord of economic growth in recent decades, Malaysia occupies an unusual - andperhaps unique - position. It does so for three related reasons. Firstly, it is the onlyone of the dynamic economies of East Asia that is substantially multi-ethnic in socialcomposition 1; secondly, it is the first 'Muslim-majority' state from the developingworld to have industrialised 2; and thirdly it is one of the few - perhaps the only -capitalist society to have integrated commitments to poverty elimination andredistribution as central moments in its growth strategy. As a result of thiscombination, Malaysia warrants close investigation, both in its own right and in termsof what its experiences might have to 'say' about the relation of economic governanceto poverty and its reduction in equivalent societies.
We begin this report by examining Malaysia's record on poverty, particularly over thelast three decades. We then turn to an account of the country's anti-poverty policies,framed as they have been by the New Economic Policy and its successor, the NewDevelopment Policy. In section 4 we proceed to examine the structures and processesof economic governance in Malaysia, highlighting the important role of the EconomicPlanning Unit. In the penultimate section we present our analysis of the relation ofeconomic governance to poverty reduction and conclude by briefly underlining thecentral points in our analysis and what some of their policy implications appear to be.
2. POVERTY RECORD
Officially, poverty in Malaysia is measured only in absolute terms. The Poverty LineIndex (PLI) is based on the minimum requirements of a household for food, clothingand other non-food items such as rent, fuel and power.3 At present (2002) two of themost important agencies of economic governance - the National Economic ActionCouncil (NEAC) and the Economic Planning Unit (EPU) - revise the PLI periodicallyto account for new information from household surveys, or to adjust figures forinflation using the consumer price index (JBIC 2001). While the PLI does notdifferentiate between urban and rural areas, it is calculated to reflect the differences
1 Singapore also claims multi-ethnic status, but in its case it is demographically dominated by Chinesewho constitute about 78 percent of the population. This proportion is likely to continue to rise given thepro-Chinese bias in the country's immigration policies and the practical effects of its attempts to raisethe birth rate among the professional middle classes.2 Turkey is the only other 'Muslim-majority' state to come close in this sense.3 For the food component, the minimum requirement is calculated as a daily intake of 9,910 calories fora family of five, while the minimum requirements for clothing (including footwear) are based onstandards set by the Department of Social Welfare for welfare homes. The other non-food items arebased on the level of expenditure of the lower income households, as reported in the HouseholdExpenditure Survey (Rogayah 2002).
2
for three regions: peninsular Malaysia (in general the most industrialised andprosperous region) and Sabah and Sarawak (Malaysian Borneo).
The poor in Malaysia are concentrated largely in the Bumiputera 4 population ingeneral (Malays and indigenous - that is, aboriginal - minorities) and particularlyamong Bumiputeras living in the poorer regions (Kelantan, Terengganu, Kedah andPerlis, in Peninsular Malaysia, and Sabah, and Sarawak) and more especially in therural areas of those regions. Particular indigenous groups are also disproportionatelypoor. The Orang Asli, for instance, are the largest of peninsular Malaysia’sindigenous minorities and despite recent attempts to target specific groups of'hardcore poor', they consistently appear among the worst-off groups in terms ofpoverty and a number of other socio-economic indices. New forms of poverty arealso emerging in other vulnerable groups, including single female headed households,the rural elderly and among Malaysia's growing numbers of unskilled migrantworkers (Nair 2000).
In general, however, the incidence of poverty in Malaysia has dramatically declinedover the past three decades. While 49.3 percent of the population were officially poorin 1970, one estimate has put the size of the poor population in 2000 at 353,400households or about 5.5 percent of the population (Table 1) with a steady decline inthe intervening years and notwithstanding the effects of the economic crisis of the late1990s. As Table 2 indicates, poverty has disproportionately always tended to belargely a rural phenomenon. However, the disparity between the incidence of urbanand rural poverty has increased in the 1990s compared with what it was in the 1970sand 1980s (Table 2), underlining the increasingly uneven economic development thatimpacts on contemporary Malaysia.
Table 1: Incidence of Poverty (% of Population): Malaysia 1970 – 20001970 1975 1980 1985 1990 1993 1995 2000*
Incidence (%) 49.3 43.9 29.2 20.7 17.1 13.5 8.9 5.5Number of poorhouseholds (‘000)
1606 835.1 666.1 649.4 619.4 517.2 370.2 353.4
Source: Yusoff et al (2000)* Estimate
Table 2: Incidence of Rural and Urban Poverty (% of Pop): Malaysia1970-1999
1970 1976 1984 1987 19951 19971 1999Rural 58.7 47.8 24.7 19.3 15.6 11.8 13.2Urban 21.9 17.9 8.2 7.3 4.1 2.4 3.8Disparity 2.68 2.67 3.01 2.64 3.80 4.92 3.47Source: Yusoff et al (2000) and Rogayah (2002)1 Revision based on the latest household population data.
In spite of this very substantial improvement in the incidence of poverty, in terms ofincome distribution, Malaysia's record has been less impressive. While current levelsof income inequality as measured by the Gini coefficient, have improved comparedwith conditions in 1970, compared with those in the late 1950s and 1960s, they seem
4 Literally, 'sons of the soil'.
3
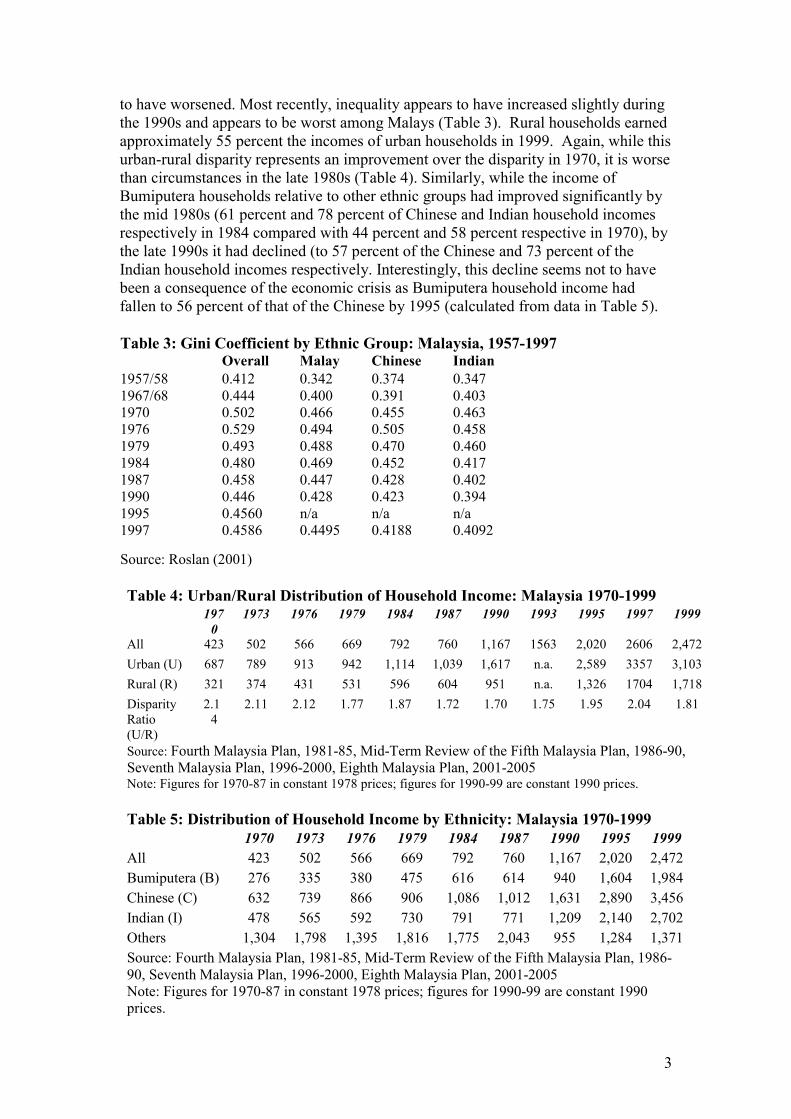
to have worsened. Most recently, inequality appears to have increased slightly duringthe 1990s and appears to be worst among Malays (Table 3). Rural households earnedapproximately 55 percent the incomes of urban households in 1999. Again, while thisurban-rural disparity represents an improvement over the disparity in 1970, it is worsethan circumstances in the late 1980s (Table 4). Similarly, while the income ofBumiputera households relative to other ethnic groups had improved significantly bythe mid 1980s (61 percent and 78 percent of Chinese and Indian household incomesrespectively in 1984 compared with 44 percent and 58 percent respective in 1970), bythe late 1990s it had declined (to 57 percent of the Chinese and 73 percent of theIndian household incomes respectively. Interestingly, this decline seems not to havebeen a consequence of the economic crisis as Bumiputera household income hadfallen to 56 percent of that of the Chinese by 1995 (calculated from data in Table 5).
Table 3: Gini Coefficient by Ethnic Group: Malaysia, 1957-1997Overall Malay Chinese Indian
1957/58 0.412 0.342 0.374 0.3471967/68 0.444 0.400 0.391 0.4031970 0.502 0.466 0.455 0.4631976 0.529 0.494 0.505 0.4581979 0.493 0.488 0.470 0.4601984 0.480 0.469 0.452 0.4171987 0.458 0.447 0.428 0.4021990 0.446 0.428 0.423 0.3941995 0.4560 n/a n/a n/a1997 0.4586 0.4495 0.4188 0.4092
Source: Roslan (2001)
Table 4: Urban/Rural Distribution of Household Income: Malaysia 1970-1999197
01973 1976 1979 1984 1987 1990 1993 1995 1997 1999
All 423 502 566 669 792 760 1,167 1563 2,020 2606 2,472Urban (U) 687 789 913 942 1,114 1,039 1,617 n.a. 2,589 3357 3,103Rural (R) 321 374 431 531 596 604 951 n.a. 1,326 1704 1,718DisparityRatio(U/R)
2.14
2.11 2.12 1.77 1.87 1.72 1.70 1.75 1.95 2.04 1.81
Source: Fourth Malaysia Plan, 1981-85, Mid-Term Review of the Fifth Malaysia Plan, 1986-90,Seventh Malaysia Plan, 1996-2000, Eighth Malaysia Plan, 2001-2005Note: Figures for 1970-87 in constant 1978 prices; figures for 1990-99 are constant 1990 prices.
Table 5: Distribution of Household Income by Ethnicity: Malaysia 1970-19991970 1973 1976 1979 1984 1987 1990 1995 1999
All 423 502 566 669 792 760 1,167 2,020 2,472Bumiputera (B) 276 335 380 475 616 614 940 1,604 1,984Chinese (C) 632 739 866 906 1,086 1,012 1,631 2,890 3,456Indian (I) 478 565 592 730 791 771 1,209 2,140 2,702Others 1,304 1,798 1,395 1,816 1,775 2,043 955 1,284 1,371Source: Fourth Malaysia Plan, 1981-85, Mid-Term Review of the Fifth Malaysia Plan, 1986-90, Seventh Malaysia Plan, 1996-2000, Eighth Malaysia Plan, 2001-2005Note: Figures for 1970-87 in constant 1978 prices; figures for 1990-99 are constant 1990prices.

4
5
3. ANTI-POVERTY POLICY IN MALAYSIA, 1970-2001
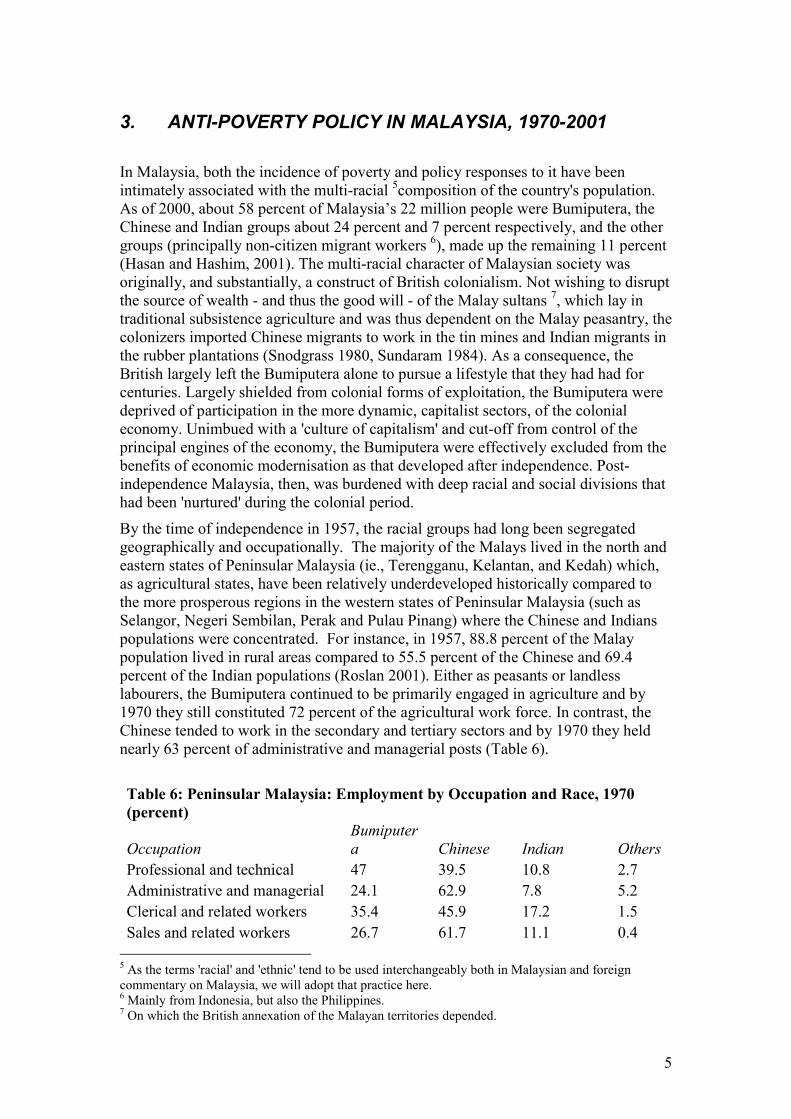
In Malaysia, both the incidence of poverty and policy responses to it have beenintimately associated with the multi-racial 5composition of the country's population.As of 2000, about 58 percent of Malaysia’s 22 million people were Bumiputera, theChinese and Indian groups about 24 percent and 7 percent respectively, and the othergroups (principally non-citizen migrant workers 6), made up the remaining 11 percent(Hasan and Hashim, 2001). The multi-racial character of Malaysian society wasoriginally, and substantially, a construct of British colonialism. Not wishing to disruptthe source of wealth - and thus the good will - of the Malay sultans 7, which lay intraditional subsistence agriculture and was thus dependent on the Malay peasantry, thecolonizers imported Chinese migrants to work in the tin mines and Indian migrants inthe rubber plantations (Snodgrass 1980, Sundaram 1984). As a consequence, theBritish largely left the Bumiputera alone to pursue a lifestyle that they had had forcenturies. Largely shielded from colonial forms of exploitation, the Bumiputera weredeprived of participation in the more dynamic, capitalist sectors, of the colonialeconomy. Unimbued with a 'culture of capitalism' and cut-off from control of theprincipal engines of the economy, the Bumiputera were effectively excluded from thebenefits of economic modernisation as that developed after independence. Post-independence Malaysia, then, was burdened with deep racial and social divisions thathad been 'nurtured' during the colonial period.
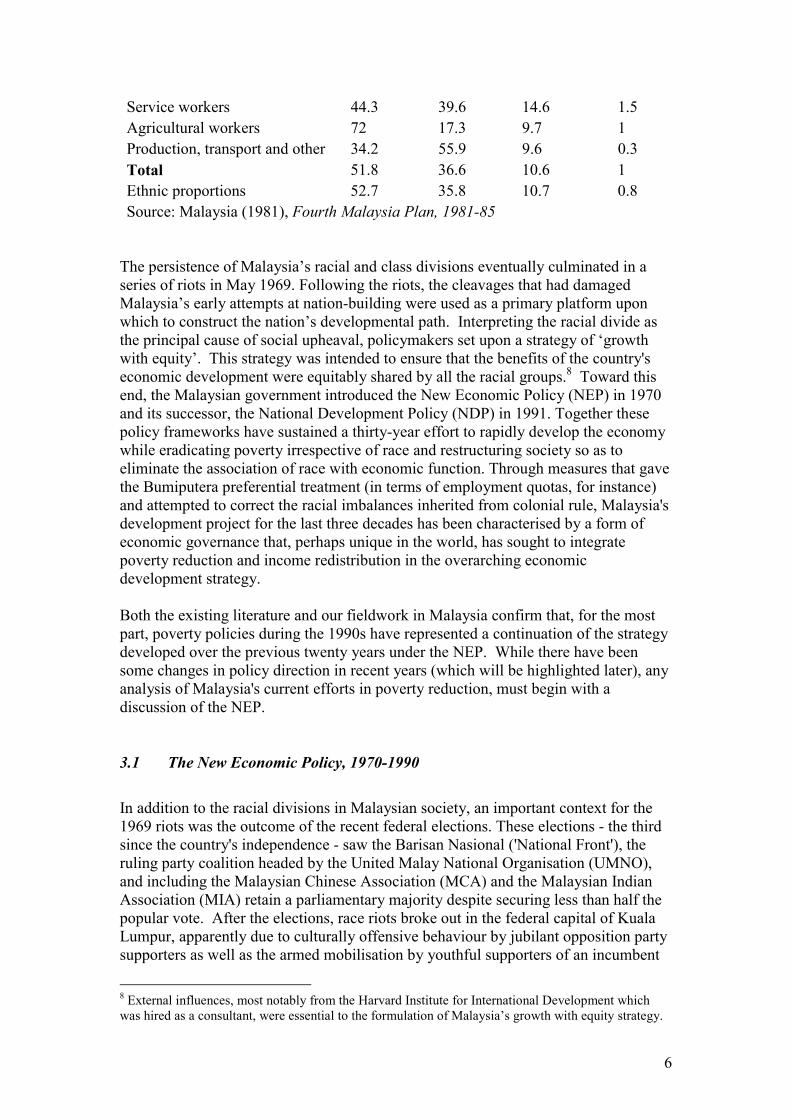
By the time of independence in 1957, the racial groups had long been segregatedgeographically and occupationally. The majority of the Malays lived in the north andeastern states of Peninsular Malaysia (ie., Terengganu, Kelantan, and Kedah) which,as agricultural states, have been relatively underdeveloped historically compared tothe more prosperous regions in the western states of Peninsular Malaysia (such asSelangor, Negeri Sembilan, Perak and Pulau Pinang) where the Chinese and Indianspopulations were concentrated. For instance, in 1957, 88.8 percent of the Malaypopulation lived in rural areas compared to 55.5 percent of the Chinese and 69.4percent of the Indian populations (Roslan 2001). Either as peasants or landlesslabourers, the Bumiputera continued to be primarily engaged in agriculture and by1970 they still constituted 72 percent of the agricultural work force. In contrast, theChinese tended to work in the secondary and tertiary sectors and by 1970 they heldnearly 63 percent of administrative and managerial posts (Table 6).
Table 6: Peninsular Malaysia: Employment by Occupation and Race, 1970(percent)
OccupationBumiputera Chinese Indian Others
Professional and technical 47 39.5 10.8 2.7Administrative and managerial 24.1 62.9 7.8 5.2Clerical and related workers 35.4 45.9 17.2 1.5Sales and related workers 26.7 61.7 11.1 0.4
5 As the terms 'racial' and 'ethnic' tend to be used interchangeably both in Malaysian and foreigncommentary on Malaysia, we will adopt that practice here.6 Mainly from Indonesia, but also the Philippines.7 On which the British annexation of the Malayan territories depended.
6
Service workers 44.3 39.6 14.6 1.5Agricultural workers 72 17.3 9.7 1Production, transport and other 34.2 55.9 9.6 0.3Total 51.8 36.6 10.6 1Ethnic proportions 52.7 35.8 10.7 0.8Source: Malaysia (1981), Fourth Malaysia Plan, 1981-85
The persistence of Malaysia’s racial and class divisions eventually culminated in aseries of riots in May 1969. Following the riots, the cleavages that had damagedMalaysia’s early attempts at nation-building were used as a primary platform uponwhich to construct the nation’s developmental path. Interpreting the racial divide asthe principal cause of social upheaval, policymakers set upon a strategy of ‘growthwith equity’. This strategy was intended to ensure that the benefits of the country'seconomic development were equitably shared by all the racial groups.8 Toward thisend, the Malaysian government introduced the New Economic Policy (NEP) in 1970and its successor, the National Development Policy (NDP) in 1991. Together thesepolicy frameworks have sustained a thirty-year effort to rapidly develop the economywhile eradicating poverty irrespective of race and restructuring society so as toeliminate the association of race with economic function. Through measures that gavethe Bumiputera preferential treatment (in terms of employment quotas, for instance)and attempted to correct the racial imbalances inherited from colonial rule, Malaysia'sdevelopment project for the last three decades has been characterised by a form ofeconomic governance that, perhaps unique in the world, has sought to integratepoverty reduction and income redistribution in the overarching economicdevelopment strategy.
Both the existing literature and our fieldwork in Malaysia confirm that, for the mostpart, poverty policies during the 1990s have represented a continuation of the strategydeveloped over the previous twenty years under the NEP. While there have beensome changes in policy direction in recent years (which will be highlighted later), anyanalysis of Malaysia's current efforts in poverty reduction, must begin with adiscussion of the NEP.
3.1 The New Economic Policy, 1970-1990
In addition to the racial divisions in Malaysian society, an important context for the1969 riots was the outcome of the recent federal elections. These elections - the thirdsince the country's independence - saw the Barisan Nasional ('National Front'), theruling party coalition headed by the United Malay National Organisation (UMNO),and including the Malaysian Chinese Association (MCA) and the Malaysian IndianAssociation (MIA) retain a parliamentary majority despite securing less than half thepopular vote. After the elections, race riots broke out in the federal capital of KualaLumpur, apparently due to culturally offensive behaviour by jubilant opposition partysupporters as well as the armed mobilisation by youthful supporters of an incumbent
8 External influences, most notably from the Harvard Institute for International Development whichwas hired as a consultant, were essential to the formulation of Malaysia’s growth with equity strategy.
7
chief minister who had not secured a majority in his state's legislative assembly.Military and police intervention in response to the riots enabled Tun Abdul Razak, thedeputy leader of UMNO and the coalition, to stage a ‘palace coup’ with the support ofcritics of the incumbent UMNO leader and prime minister, Tunku Abdul Rahman.
The New Economic Policy (NEP), announced soon after the riots, was ostensiblydesigned to create the socio-economic conditions for achieving ‘national unity’through redistributive policies. It had three principal objectives: to eradicate povertyregardless of race, but particular among the Malay peasantry; to restructure society toeliminate the identification of race with economic function 9; and to redistrubutewealth to the benefit of the Bumiputera. These objectives were to be pursued through:the improvement of services such as housing, health and public utilities to benefit thequality of life of the poor; the promotion and adoption of capital-efficient modernagricultural techniques, alongside marketing, credit, financial and technical assistancedesigned to improve agricultural productivity and thus the income of the poor; an'affirmative action' programme for Malays based on quotas in education, employmentand the receipt of government contracts; and a restructuring of corporate equitythrough state funding of Bumiputera 'trust agencies' that would purchase and holdshares for the benefit of the Bumiputera as a whole (Lubeck 1992, Shireen 1998).
The success of the NEP was predicated upon rapid economic growth. Like Singapore,but unlike South Korea, Taiwan and Hong Kong, growth was to be achieved byencouraging foreign direct investment, particularly to develop manufacturingindustry. 10 Malaysia’s planners assumed an average annual growth rate of 8 percentover the 1970-90 period. It was only by achieving these rates of growth that theirpoverty reduction and redistribution strategies (the latter designed to ensure thatredistribution did not take place by means of the reallocation of existing wealth butrather from new and expanded sources of wealth) could to be successful.Furthermore, growth was necessary if the economy was to provide increasedemployment and other new economic opportunities for the poor.
In the event the expected growth rates were not quite achieved. While the country didexperience average annual growth rates of 8.3 percent in the 1970s, in the 1980sgrowth rates declined to roughly 6 percent of GDP (largely due to the recession of themid-1980s), though they were to recover to nearly 9 percent in the first half of the1990s (Table 7).
9 It should be noted, however, that under the NEP there was no official commitment to reducingincome inequality per se. The focus was income inequality between ethnic groups and particularlybetween the Bumiputeras and non-Bumiputeras.10 Industrialisation in South Korea, Taiwan and Hong Kong was achieved largely by mobilisingdomestic, not foreign, capital. While Malaysia had an indigenous, if small, manufacturing sector by theearly 1970s, Jesudason (1989) argues that the government opted for a foreign rather than domestic-ledindustrialisation strategy because the latter, in practice, would have meant handing expandedopportunities for wealth creation to Chinese Malaysians.
8
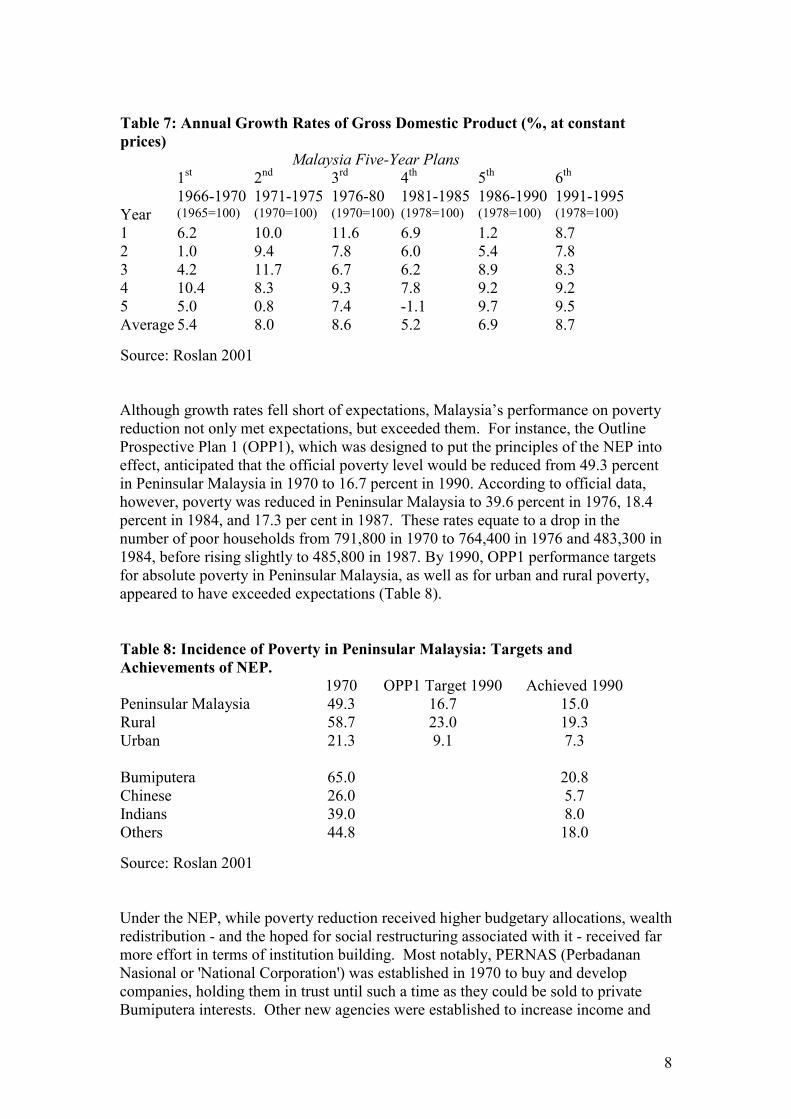
Table 7: Annual Growth Rates of Gross Domestic Product (%, at constantprices)
Malaysia Five-Year Plans1st 2nd 3rd 4th 5th 6th
1966-1970 1971-1975 1976-80 1981-1985 1986-1990 1991-1995Year (1965=100) (1970=100) (1970=100) (1978=100) (1978=100) (1978=100)1 6.2 10.0 11.6 6.9 1.2 8.72 1.0 9.4 7.8 6.0 5.4 7.83 4.2 11.7 6.7 6.2 8.9 8.34 10.4 8.3 9.3 7.8 9.2 9.25 5.0 0.8 7.4 -1.1 9.7 9.5Average 5.4 8.0 8.6 5.2 6.9 8.7
Source: Roslan 2001
Although growth rates fell short of expectations, Malaysia’s performance on povertyreduction not only met expectations, but exceeded them. For instance, the OutlineProspective Plan 1 (OPP1), which was designed to put the principles of the NEP intoeffect, anticipated that the official poverty level would be reduced from 49.3 percentin Peninsular Malaysia in 1970 to 16.7 percent in 1990. According to official data,however, poverty was reduced in Peninsular Malaysia to 39.6 percent in 1976, 18.4percent in 1984, and 17.3 per cent in 1987. These rates equate to a drop in thenumber of poor households from 791,800 in 1970 to 764,400 in 1976 and 483,300 in1984, before rising slightly to 485,800 in 1987. By 1990, OPP1 performance targetsfor absolute poverty in Peninsular Malaysia, as well as for urban and rural poverty,appeared to have exceeded expectations (Table 8).
Table 8: Incidence of Poverty in Peninsular Malaysia: Targets andAchievements of NEP.
1970 OPP1 Target 1990 Achieved 1990Peninsular Malaysia 49.3 16.7 15.0Rural 58.7 23.0 19.3Urban 21.3 9.1 7.3
Bumiputera 65.0 20.8Chinese 26.0 5.7Indians 39.0 8.0Others 44.8 18.0
Source: Roslan 2001
Under the NEP, while poverty reduction received higher budgetary allocations, wealthredistribution - and the hoped for social restructuring associated with it - received farmore effort in terms of institution building. Most notably, PERNAS (PerbadananNasional or 'National Corporation') was established in 1970 to buy and developcompanies, holding them in trust until such a time as they could be sold to privateBumiputera interests. Other new agencies were established to increase income and
9
productivity of the Bumiputera (eg., Rubber Industry Smallholders DevelopmentAuthority,) while agencies like the UDA (Urban Development Authority) and SEDCs(State Economic Development Corporations) were intended to carry out commercialand industrial projects aimed at attracting a greater participation of the Bumiputera.Direct state participation in the industrialisation project was effected with thefoundation of PETRONAS to develop, in association with foreign corporations, aMalaysian presence in oil and petro-chemicals, and the Heavy Industries Corporationof Malaysia (HICOM), which entered into joint-venture arrangements with Japaneseand other foreign corporations to develop steel, automobile and other industries.Furthermore, agencies such as MIDF (Malaysian Industrial DevelopmentFoundation), CGC (Credit Guarantee Corporation) and Bank Bumiputera werecreated to provide financial and infrastructure services to the Bumiputra (Roslan2001).
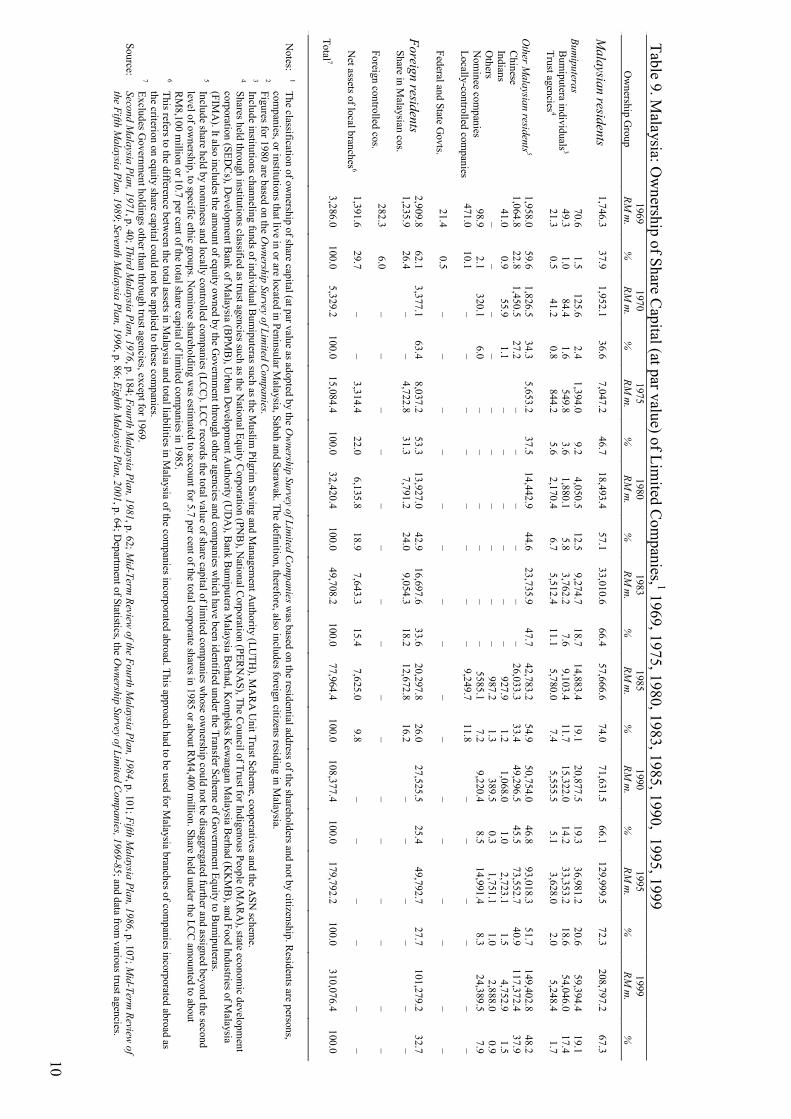
Ironically, however, given the relative lack of capacity-building for poverty reduction,and yet its admirable performance, the immense effort to develop redistributiveinstitutions - such as the 'trust agencies' indicated above - did not succeed inincreasing the Bumiputera share of capital ownership as significantly as had beenanticipated. From only a 2.4 percent ownership of share capital in 1970 it was hopedthat by 1990, 30 percent of the share capital in Malaysian hands, would be underBumiputera control. In the event, however, only 19.3 percent was, of which about 73percent was owned by individuals and the rest by the trust agencies (calculated fromdata in Table 9). 45.5 percent of share capital continued to be held by MalaysianChinese interests, while over a quarter (25.5 percent) was owned by foreign interests(Table 9).
10
Table 9. Malaysia: O
wnership of Share C
apital (at par value) of Limited C
ompanies, 1 1969, 1975, 1980, 1983, 1985, 1990, 1995, 1999
1969
1970
1975
1980
1983
1985
1990
1995
1999
O
wnership G
roup RM
m.
%
RM m
. %
RM
m.
%
RM m
. %
RM
m.
%
RM m
. %
RM
m.
%
RM m
. %
RM
m.
%
Malaysian residents
Bumiputeras
Bum
iputera individuals 3 Trust agencies 4
Other M
alaysian residents 5 C
hinese Indians O
thers N
ominee com
panies Locally-controlled com
panies Federal and State G
ovts. Foreign residents
Share in Malaysian cos.
Foreign controlled cos. N
et assets of local branches 6 Total 7
1,746.3
70.6 49.3 21.3
1,958.0 1,064.8
41.0 – 98.9
471.0 21.4
2,909.8 1,235.9
282.3 1,391.6 3,286.0
37.9
1.5 1.0 0.5
59.6 22.8
0.9 – 2.1
10.1 0.5
62.1 26.4
6.0 29.7
100.0
1,952.1
125.6 84.4 41.2
1,826.5 1,450.5
55.9 – 320.1 – –
3,377.1 – – – 5,329.2
36.6
2.4 1.6 0.8
34.3 27.2
1.1 – 6.0 – –
63.4 – – – 100.0
7,047.2 1,394.0
549.8 844.2
5,653.2 – – – – – – 8,037.2 4,722.8 – 3,314.4
15,084.4
46.7
9.2 3.6 5.6
37.5 – – – – – – 53.3 31.3 – 22.0
100.0
18,493.4 4,050.5 1,880.1 2,170.4
14,442.9 – – – – – – 13,927.0 7,791.2 – 6,135.8
32,420.4
57.1 12.5
5.8 6.7
44.6 – – – – – – 42.9 24.0 – 18.9
100.0
33,010.6 9,274.7 3,762.2 5,512.4
23,735.9 – – – – – –
16,697.6 9,054.3 – 7,643.3
49,708.2
66.4 18.7
7.6 11.1 47.7 – – – – – – 33.6 18.2 – 15.4
100.0
57,666.6 14,883.4 9,103.4 5,780.0
42,783.2 26,033.3
927.9 987.2
5585.1 9,249.7 –
20,297.8 12,672.8 – 7,625.0
77,964.4
74.0 19.1 11.7
7.4 54.9 33.4
1.2 1.3 7.2
11.8 – 26.0 16.2 –
9.8 100.0
71,631.5 20,877.5 15,322.0 5,555.5
50,754.0 49,296.5 1,068.0
389.5 9,220.4 – –
27,525.5 – – – 108,377.4
66.1 19.3 14.2
5.1 46.8 45.5
1.0 0.3 8.5 – –
25.4 – – – 100.0
129,999.5
36,981.2 33,353.2 3,628.0
93,018.3 73,552.7 2,723.1 1,751.1
14,991.4 – – 49,792.7 – – –
179,792.2
72.3 20.6 18.6
2.0 51.7 40.9
1.5 1.0 8.3 – –
27.7 – – – 100.0
208,797.2
59,394.4 54,046.0 5,248.4
149,402.8 117,372.4
4,752.9 2,888.0
24,389.5 – – 101,279.2 – – – 310,076.4
67.3 19.1 17.4
1.7 48.2 37.9
1.5 0.9 7.9 – –
32.7 – – – 100.0
Notes:
1 The classification of ownership of share capital (at par value as adopted by the O
wnership Survey of Lim
ited Com
panies was based on the residential address of the shareholders and not by citizenship. R
esidents are persons, com
panies, or institutions that live in or are located in Peninsular Malaysia, Sabah and Saraw
ak. The definition, therefore, also includes foreign citizens residing in Malaysia.
2 Figures for 1980 are based on the O
wnership Survey of Limited Com
panies.
3 Include institutions channeling funds of individual Bum
iputeras such as the Muslim
Pilgrim Saving and M
anagement A
uthority (LUTH
), MA
RA
Unit Trust Schem
e, cooperatives and the ASN
scheme.
4 Shares held through institutions classified as trust agencies such as the N
ational Equity Corporation (PN
B), N
ational Corporation (PER
NA
S), The Council of Trust for Indigenous People (M
AR
A), state econom
ic development
corporation (SEDC
s), Developm
ent Bank of M
alaysia (BPM
B), U
rban Developm
ent Authority (U
DA
), Bank B
umiputera M
alaysia Berhad, K
ompleks K
ewangan M
alaysia Berhad (K
KM
B), and Food Industries of M
alaysia (FIM
A). It also includes the am
ount of equity owned by the G
overnment through other agencies and com
panies which have been identified under the Transfer Schem
e of Governm
ent Equity to Bumiputeras.
5 Include share held by nom
inees and locally controlled companies (LC
C). LC
C records the total value of share capital of lim
ited companies w
hose ownership could not be disaggregated further and assigned beyond the second
level of ownership, to specific ethic groups. N
ominee shareholding w
as estimated to account for 5.7 per cent of the total corporate shares in 1985 or about R
M4,400 m
illion. Share held under the LCC
amounted to about
RM
8,100 million or 10.7 per cent of the total share capital of lim
ited companies in 1985.
6 This refers to the difference betw
een the total assets in Malaysia and total liabilities in M
alaysia of the companies incorporated abroad. This approach had to be used for M
alaysia branches of companies incorporated abroad as
the criterion on equity share capital could not be applied to these companies.
7 Excludes G
overnment holdings other than through trust agencies, except for 1969.
Source: Second M
alaysia Plan, 1971, p. 40; Third Malaysia Plan, 1976, p. 184; Fourth M
alaysia Plan, 1981, p. 62; Mid-Term
Review of the Fourth M
alaysia Plan, 1984, p. 101; Fifth Malaysia Plan, 1986, p. 107; M
id-Term Review
of the Fifth M
alaysia Plan, 1989; Seventh Malaysia Plan, 1996, p. 86; Eighth M
alaysia Plan, 2001, p. 64; Departm
ent of Statistics, the Ownership Survey of Lim
ited Com
panies, 1969-85; and data from various trust agencies.
11
3.2 The New Development Policy, 1990-2000
The New Development Policy (NDP) succeeded the NEP in 1990. The NDP includeda revision of the previous formula for balancing growth with equity.11 For instance, itemployed a shift in the focus of the anti-poverty strategy towards eradication of'hardcore' poverty. This was expressed through a special programme, the ProgramPembangunan Rakyat Termiskin (PPRT), which created a register of hard-core poorhouseholds, offering them interest-free loans and targeting projects tailored to theirneeds. Attempts to restructure society were also focussed more on employmentgeneration and developing the Bumiputera Commercial and Industrial Community(BCIC), an agency mandated to increase the participation of the Bumiputera in themodern sectors of the economy. The NDP also placed more emphasis on economicgrowth and income generation. In line with this orientation, the NDP introduced agreater reliance on the private sector as well as adopting the need for improvement inthe skills base as a primary instrument for generating growth.12 Yet notwithstandingthese differences in policy objectives, the NDP maintained the essence of the NEP,namely the pro-Bumiputera or 'ethnicity-oriented' form of economic policy (Roslan2001).
The NDP introduced a greater focus on growth and placed less emphasis on settingtargets for ethnic restructuring and income redistribution. In doing so, not only dideconomic growth maintain the improvements of the late 1980s (see Table 7), but thecountry's record on poverty reduction continued to be successful.
In terms of growth, a number of macroeconomic and sector targets were set under theNDP. Overall, Malaysia achieved its expected rate of 7 percent average annualgrowth in GDP over the 1990s. Export of goods and non-factor services greatlyexceeded the target of 6.3 average annual growth, reaching 12.4 percent for theperiod. However, the gains in exports were largely offset by an average annualgrowth in imports of 11.4 percent which the economic planners had hoped to reduceto about 6 percent by the end of the 1990s. Attesting to the relative strength of theMalaysian economy, however, unemployment rates in 2000 were officially down to3.1 percent, improving on the NDP target of 4 percent.
There were, however, a number of macroeconomic expectations that were not met.The most notable among these was the inability to boost private investment to levelsthat could relieve the financial burden on the state. Private investment which wasexpected to grow at an average annual rate of 8 percent over the 1990s, reached only 11 The policy reorientation introduced in the NDP, while undoubtedly influenced by the proclivities andpreferences of Prime Minister Mahathir with regard to private-sector led growth and the focus on thehardcore poor, may have also reflected UMNO's strategies to maintain its - and the ruling coalition's -popular support. If the landslide victory in the elections of 1995 were an indicator of intention, theshift in orientation towards economic growth (over ethnic restructuring and redistribution) enshrined inthe NDP seemed to win not only Malay, but also Chinese support as evidenced by the very good resultsposted by the Malaysian Chinese Association (MCA) - the second largest Party in the Barisan Nasional- in those elections (Trezzini 2001).12 NDP programmes include loan schemes for small scale agricultural and commercial developmentmodelled on the Grameen Bank, land consolidation and rehabilitation programmes, thecommercialisation of farms, agricultural productivity enhancement projects, provision andimprovement of services for the urban poor and efforts to promote employment opportunities inmanufacturing, construction and other urban-based industries (Makita 1998).
12
an average growth rate of under 3 percent. Similarly, the desire to reduce publicinvestment to a negative growth rate, proved unobtainable, as it continued to increaseby an average annual rate of 10.5 percent over the NDP period.
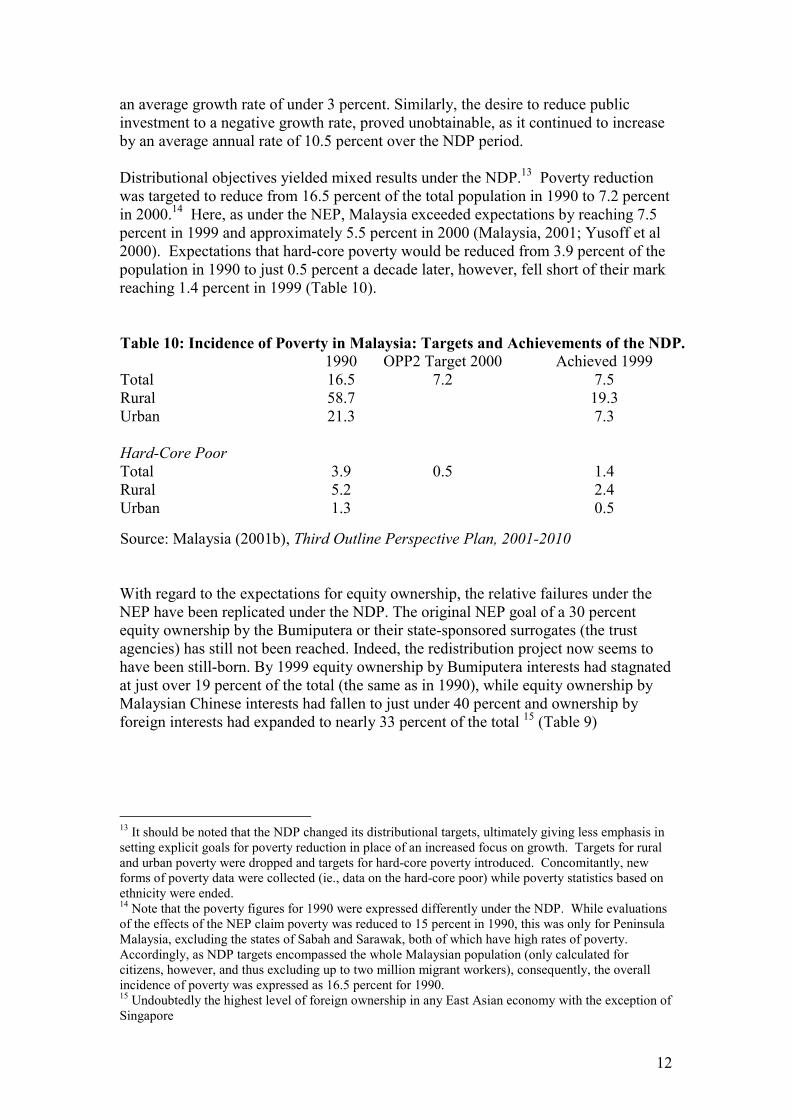
Distributional objectives yielded mixed results under the NDP.13 Poverty reductionwas targeted to reduce from 16.5 percent of the total population in 1990 to 7.2 percentin 2000.14 Here, as under the NEP, Malaysia exceeded expectations by reaching 7.5percent in 1999 and approximately 5.5 percent in 2000 (Malaysia, 2001; Yusoff et al2000). Expectations that hard-core poverty would be reduced from 3.9 percent of thepopulation in 1990 to just 0.5 percent a decade later, however, fell short of their markreaching 1.4 percent in 1999 (Table 10).
Table 10: Incidence of Poverty in Malaysia: Targets and Achievements of the NDP.1990 OPP2 Target 2000 Achieved 1999
Total 16.5 7.2 7.5Rural 58.7 19.3Urban 21.3 7.3
Hard-Core PoorTotal 3.9 0.5 1.4Rural 5.2 2.4Urban 1.3 0.5
Source: Malaysia (2001b), Third Outline Perspective Plan, 2001-2010
With regard to the expectations for equity ownership, the relative failures under theNEP have been replicated under the NDP. The original NEP goal of a 30 percentequity ownership by the Bumiputera or their state-sponsored surrogates (the trustagencies) has still not been reached. Indeed, the redistribution project now seems tohave been still-born. By 1999 equity ownership by Bumiputera interests had stagnatedat just over 19 percent of the total (the same as in 1990), while equity ownership byMalaysian Chinese interests had fallen to just under 40 percent and ownership byforeign interests had expanded to nearly 33 percent of the total 15 (Table 9)
13 It should be noted that the NDP changed its distributional targets, ultimately giving less emphasis insetting explicit goals for poverty reduction in place of an increased focus on growth. Targets for ruraland urban poverty were dropped and targets for hard-core poverty introduced. Concomitantly, newforms of poverty data were collected (ie., data on the hard-core poor) while poverty statistics based onethnicity were ended.14 Note that the poverty figures for 1990 were expressed differently under the NDP. While evaluationsof the effects of the NEP claim poverty was reduced to 15 percent in 1990, this was only for PeninsulaMalaysia, excluding the states of Sabah and Sarawak, both of which have high rates of poverty.Accordingly, as NDP targets encompassed the whole Malaysian population (only calculated forcitizens, however, and thus excluding up to two million migrant workers), consequently, the overallincidence of poverty was expressed as 16.5 percent for 1990.15 Undoubtedly the highest level of foreign ownership in any East Asian economy with the exception ofSingapore
13
3.3 Impact of Anti-Poverty Policies: Preliminary Observations
When evaluating the impact that anti-poverty policies may have had, this studyconcludes that much caution is in order. Despite the ostensible official concern aboutpoverty over the last thirty years, and the remarkable lifespan of NEP-inspiredpolicymaking, a number of problematic issues remain. For instance, there is stillrelatively little detailed information about the characteristics of the poor that couldhelp ascertain the reasons for their poverty (sometimes quite complex) and thusidentify what the appropriate and effective measures and to overcome poverty mightbe. Detailed, analytically grounded, poverty profiles are particularly necessary in viewof the increasingly recognised phenomenon of ‘hard-core' poverty which is oftenremarked-on as being relatively unaffected by existing poverty eradication measures.Furthermore, a great deal of expenditure on what is officially categorised as povertyeradication, actually refers to expenditure on rural and agricultural development,much of which does not directly help to raise the poor out of poverty. Given theconcerns raised later in this report about the shortfall and the effectiveness of publicexpenditure for development purposes, it is crucial that detailed information on theuse of anti-poverty funds (plentiful throughout the NEP period) be provided in orderto ascertain to what extent such expenditure actually benefited the poor. Suchinformation is also crucial in order to minimise the budgetary abuses that seem tohave been made in the name of poverty eradication.
The relative absence of data and thus of a clear understanding of the povertyphenomenon, represent worrying developments that threaten to dissociate policyformulation from the condition of the poor and directly challenge the efficacy ofpoverty eradication efforts. This situation also fuels existing concerns over the role ofpatronage and corruption in Malaysia. The suspicion that once certain policies areimplemented, certain companies or other interest groups (typically associated withUMNO) benefit from those policies, so ensuring their continuation irrespective oftheir effectiveness, is a common concern voiced among poverty experts in Malaysia.16
Given the weaknesses in both the basic information on poverty and, as will bediscussed later, the implementation of development policies (of which anti-povertypolicies have been an important part), this study concludes that it is difficult to tellwhether Malaysia’s significant performance in reducing poverty has been more aconsequence of the deliberate poverty eradication measures, than the outcome of aseries of extraneous growth factors (full employment together with increases inproductivity and rising wages).17
The suspicion that pro-poor policies may have played a lesser role in povertyreduction than the Government would like to believe accords with muchcircumstantial evidence. For instance, in the rural areas and especially among thepeasantry, poverty reduction seems to be largely attributable to increasingproductivity. However, rising productivity mainly benefits those who own their owneconomic resources, especially land. Inequalities in land distribution and otherresources - both in terms of ownership and access - means that such productivity gains
16 On the general issue of corruption and political rentierism in Malaysia, see Gomez (1990, 1991) andGomez and Jomo (1997).17 There has been no study done in Malaysia to assess the extent to which growth alone might havereduced absolute poverty.
14
as have been made, will have tended to have benefited the well-off rather than thepoor, per se. Furthermore, given that the official concern for poverty among Malaypeasants has emphasized productivity-enhancing efforts for self-employed producers,the bulk of rural Malays - who do not own the most crucial resources - haveeffectively been by-passed by the main thrust of official poverty eradication efforts.The same could be said of other rural workers – such as plantation workers, minersand contract labourers engaged in public works and on land development projects.They too seem have been largely ignored by NEP and subsequent initiatives.
Given the qualifications detailed above, and other matters that will be broached laterin this report, it seems that NEP and NDP policy initiatives were perhaps lesssignificant as sources of poverty reduction - in their own right - than the prevailingwisdom (in Malaysia and elsewhere) might have us believe. If they have been lesssignificant in this sense, then their contribution - for there certainly has been a majorone - may have been more to ensure that questions of poverty and inequality weremaintained at the forefront of government thinking about economic policy anddevelopment strategy. However, in as far as the NEP helped to ensure that ethnicinequality was the fulcrum on which poverty, and more generally development, policyturned, it made it inevitable that an ethnic (or perhaps more accurately, a Malay-national) agenda dominated political rhetoric and, as we shall see later, constrainedthe economic options that might otherwise have been available to policy-makers.
We now turn to examine the institutions and processes of economic governance inMalaysia. In so doing, our foregoing discussion of the country's poverty record andanti-poverty policies will be placed in the context of institutional, policy andeconomic development more generally.
4. ECONOMIC GOVERNANCE, 1970 - 2002
Over the last three decades economic governance in Malaysia has been marked by ahigh degree of centralised decision-making with at times authoritarian approaches topolicy formulation and implementation. The executive is insulated, to a significantdegree, from the legislature and as a number of interviewees attested (includingformer MPs), Parliament does little more than 'rubber stamp' executive decisions andhas only a minimal role in scrutinising and monitoring the activities of the ministriesand other executive branches.18
In this context it is unsurprising that economic governance has been authoritative andrelatively coherent. This situation had been enhanced by the stability in politicalleadership and development focus. In the Prime Minister, Dr Mahathir Mohamad,Malaysia currently has the longest standing political leadership (with over 20 years inoffice) of any country in the world. Additionally, at least at the level of the federalstate, there has been no effective opposition to the ruling coalition - the Barisan
18 The Malaysian Parliament has only one committee to monitor the activities of the executive. Whileit's remit is concerned with budgetary allocations, it has no powers to question members of theexecutive, nor is it even allowed to access all of the relevant data.
15
Nasional - or its leading political party, UMNO.19 There has, however, been limitedopposition to UMNO at the state level, with two of the thirteen states (Kelantan andTerengganu in eastern Peninsula Malaysia) now governed by the Islamic oppositionparty, PAS.
Alongside this stable (and for the most part semi-authoritarian) leadership, economicgovernance has remained relatively coherent due a relatively consistent definition ofthe country's development problem since the beginning of the NEP in 1970. Over thelast thirty years, Malaysian development planning has maintained its core aims ofboosting economic growth - largely by relying on foreign investment - whilefocussing on poverty reduction on the one hand, and social restructuring (and thusincome redistribution) on the other. Both of these have continued to embody the basicview that overcoming racial division and inequality, the perceived cause of the 1969race riots, was a principal challenges for Malaysia’s development project.
In addition to the consistency in defining and prioritising developmental problems,continuity has been reinforced by the maintenance of a longstanding institutionalarrangement concerning development issues. Firstly, financial support fordevelopment policies have been delimited as a distinct and separate aspect of thenational budget.20 Both the development budget and associated policy-makingresponsibilities are controlled by the Economic Planning Unit (EPU), the centralorgan of Malaysia’s 'semi-developmental' state apparatus. Created in the 1960s, theEPU, located in the Prime Minister’s Office, continues to take the lead in theformulation of Malaysia’s medium and long-term development strategies. The EPUalso controls the compilation of all the statistical data crucial to its planning function.In effect, this means that it also controls access to, and thus the dissemination of, suchinformation within the wider government bureaucracy and beyond.
While these continuities have undoubtedly been important for the effectiveness ofMalaysia's system of economic governance, there have also been a series ofdiscontinuities that have had important implications. These have arisen primarily interms of the configuration of the EPU and its overarching influence on policystrategy.
In terms of the relative strengths of the various agencies of economic governance,most of our respondents confirmed that prior to 1986, the EPU was indeed theprimary site for the formulation and implementation of all forms of economic policy.Other economic agencies such as the Treasury, the Central Bank and the Ministry ofTrade and Industry, each played their specific roles, but their function and power withregard to economic governance, in general, was circumscribed by the EPU. 21 Forinstance, the Treasury, which is effectively synonymous with the Ministry of Finance(MoF) in the Malaysian context (and will be used here interchangeably), wasprimarily an accounting and budgetary institution overseeing project implementation,
19 The only exception - and a limited one at that - has been the Party that developed around the formerFinance Minister and Deputy Prime Minister, Anwar Ibrahim.20 Malaysia is perhaps unique in the world for having done so.21 In this sense Malaysia's system of economic governance was similar to that of South Korea prior to1993, but very much unlike Anglo-American and other Western forms, where the Treasury/FinanceMinistry tends to set the tone, if not dominate, the economic policy-making process (see Henderson etal 2002a).
16
with little engagement in policy formulation. Bank Negara (the Central Bank),charged with monetary policy and the regulation of financial institutions and theMinistry of Trade and Industry, which focussed on foreign investment and industrialdevelopment, have remained institutional constants in their respective mandates andpositions in the structure of economic governance.
The recession of the mid-1980s seems to have provided the context for a change inboth the driving forces of economic governance and the orientation of economicpolicy. Strengthening its role in the formulation of economic policy, the Treasury,with Prime Minister Mahathir's support, began to drive economic governance. Inpolicy terms, increasing emphasis began to be placed on growth. Both of these wereconsistent with the neo-liberal template of the time and privatisation came to be seenas the primary way to re-invigorate the economy. It also seems to have been a meansto an end well suited to Mahathir's personal inclinations (Milne and Mauzy, 1999).Between the recession of 1986 and the economic crisis of 1997 Malaysia experienceda limited liberalisation of the economy. In no sense, however, did it succumb to thefull force of economic neo-liberalism (and certainly not social neo-liberalism)associated with many Western and former state-socialist societies at that time. 22
The enhanced role of the MoF in economic governance was particularly associatedwith Anwar Ibrahim's tenure as Minister of Finance (1988-1998) and, subsequently,as Deputy Prime Minister. Anwar seems to have turned the MoF into his personalpower base and during the early and mid-1990s it competed with the EPU - andindeed the Prime Minister's Office more generally - as the principal agency ofeconomic governance.
There may have been other reasons, however, for the increasing significance of theMoF at this time. Interviewees have suggested that enhancement of the MoF's role ineconomic governance may partly have been achieved by default. Their informationpoints to the effects of the gradual demise of an innovative policy-making mentality inthe economic bureaucracy, including the EPU. As early as the mid-1980s, it seemsthat those who had been responsible for the innovations associated with the NEP werealready beginning to give way to a new generation of 'operations-oriented' civilservants and with them came a bureaucratic ethos in which the emphasis on long-termstrategic thinking was progressively replaced by a short-term, narrowly technocratic,'project-mindedness'
While this 'operations-orientation' of the new generation of civil servants is consistentwith neo-liberal approaches to economic management - wherever they may appear -in Malaysia, it seems, in part, to have been a reflection of changes in education(particularly competence in English subsequent to Bahasa Malaysia becoming thelanguage of instruction) as well as in the structure of incentives and the increasingstatus of jobs dealing with project management vis-à-vis those concerned with macro-economic planning and analysis. The relative positioning of the Treasury/MoF as theseat of budgetary, tendering, and project control is at one and the same time atestament to, and a reflection of, these developments in the mindset and practices ofMalaysia’s newer breed of economic managers.
22 Hungary being a case in point. See Henderson et al (2002b)
17
In terms of the institutional development of Malaysia's system of economicgovernance, another reason for the gradual side into 'project-mindedness' seems tohave been the fact that, unlike the 'developmental states' of countries such as SouthKorea (itself an inspiration for Mahathir’s inaugural, but ineffective 'Look East'strategy), Malaysia failed to develop a significant research component within themachinery of government itself. This has meant that the bureaucracy’s policy-makershave been left to rely on the expertise embodied in a number of independent (butquasi-governmental) think tanks 23, the national universities, various foreigninstitutions 24 and private companies. For a variety of reasons (that will be discussedlater), most of the external sources of ideas, except those from the private sector, havewaned or, in extreme cases, have been effectively closed-off by the end of the 1990s.As a consequence, the economic bureaucracy now seems to be responsible forgenerating its own policy ideas (for which it does not have the institutional, or nowthe intellectual capacity) or is reliant on initiatives from the political leadership andperhaps Mahathir in particular.
Subsequent to the economic crisis of the late 1990s and its consequences for AnwarIbrahim as the principal opposition to Mahathir, from within the ruling circle, theinstitutions of economic governance again underwent a transformation. FollowingAnwar's downfall and imprisonment, the centralisation of economic decision-makingbecame even more pronounced when Mahathir extended his remit to become Ministerof Finance while retaining his post as Prime Minister. These developments seem tohave returned the control over economic policy-making to the Prime Minister'sOffice, though not necessarily to the EPU.
By the onset of the economic crisis in 1997, the EPU seems to have resumed itstraditional role as a medium and long-term planning agency. Though, as we havesuggested, with a reduced capacity to perform this function, it's 'gatekeeping' positionwith regard to the information needed for effective economic planning (especiallydata on poverty and income distribution) remained intact. With the Bank Negara andwhat had by now become the Ministry of International Trade and Industry continuingin their respective specialised roles, a new addition to the nexus of governinginstitutions emerged in the form of the National Economic Action Council (NEAC).
Formed in response to the economic crisis in late 1997, NEAC, like the EPU, is not adistinct government agency. Indeed, at present (early 2002) it only has five full-timedirectors and their accompanying secretarial staff. Rather, NEAC is a unique policyforum linked directly to the Prime Minister’s Office. Described by one official as asort of 'quick-decision mini-cabinet', the 24-member Council is chaired by the PrimeMinister and was originally established by the Cabinet to formulate policies toovercome the crisis. As a problem-solving and response forum, noted for its dailymeetings during the crisis and punishing deadlines for preparing policy responses, itwas endowed with special crisis-management powers which enabled its directors toaccess virtually all available information except for politically sensitive data such asthose concerning poverty and income distribution. NEAC has the power to requestmeetings with any public servant or private executive where they can help to identify 23 Of which the Institute for Strategic and International Studies (ISIS) and the Malaysian Institute forEconomic Research (MIER) are the most prominent.24 Of which the Harvard Institute of International Development has historically been the mostsignificant.
18
the problems brought on by the crisis (non-performing bank loans for example). Italso has special powers that allow it, for instance, to expedite budgetary approval(thus, for instance, by-passing the usual six months for tendering for projects aboveRM 200,000) and thus to initiate near-immediate implementation. While the effectsof the economic crisis are largely over in Malaysia, it is these special powers andcapabilities granted to NEAC that have caused the government to view it as a usefulpermanent institution in the structure of economic governance (even though some ofits founding members are opposed to this).25
With the prospect of becoming a permanent addition to the institutions of economicgovernance, NEAC has recently begun to move beyond its original crisis-managementmandate to engage in broader development planning. 26 While a permanent role forNEAC may help to counter the tendency towards a narrowly technocratic 'project-implementation' ethos in the bureaucracy, it is unlikely to do much to offsetweaknesses in the state's implementation capacities. If Malaysia’s record onimplementation is any guide to future prospects, then this is a serious problem.Whether the result of a lack of capacity or incompetence or both, the fact that thebureaucracy has consistently been unable to spend a significant amount of thedevelopment budget is not encouraging (see section 5.2).27
Ultimately, our analysis leads us to conclude that economic governance in Malaysiamay well face several significant challenges which the relevant agencies have notfully acknowledged nor, consequently, begun to resolve. Background factorsconcerning deficiencies in the country's university system (not merely with regard tothe language of instruction) and that system's seeming inability to provide an adequatetraining for current and future civil servants are undoubtedly part of the problem.28
Additionally, the lack of a robust civil society 29 able to participate in the formulation(and, where necessary, implementation) of policies and programmes, and theaforementioned lack of a significant research presence within the bureaucracy, allrepresent unsettling institutional characteristics that are likely to hamper the capacity-building needed for an effective system of economic governance capable ofresponding to future challenges.
5. ANALYSING ECONOMIC GOVERNANCE AND POVERTY
While Malaysia’s record on reducing poverty has been good by regional and worldstandards, arguably it could have been better were it not for particular instances where'wrong' economic policies have been pursued. Particularly at issue, in this sense, are
25 And one that would further render the Cabinet and Parliament redundant as contexts for thediscussion and formulation (or at least amendment) of economic policy.26 As with the RM 4.3 billion stimulus package initiated in September 2001.27 Admittedly, the shortfall in the budget has gradually declined over the 1990s and was reported to bedown to 13 percent in 2001.28 Prior to 1974, English was the medium of instruction in schools. Yet in 1974, the governmentpursued an education policy which revamped the total education system of the country, resulting intothe abolishment of substantial subjects once taught in English. This policy would deteriorate thecompetency of English among the Malaysians in the civil service. See Ainur (2001).29 Albeit squeezed by decades of authoritarianism.
19
the country's attempts at heavy industrialisation. Beginning in the early 1980s (theearly years of the Mahathir administration) and building on the foreign-owned,export-oriented industrialisation (largely in electronics) of the 1970s, it not onlycreated a series of ‘white elephants’ that soaked up government investment andremain relatively unproductive (eg., steel, cement, petrochemicals, Proton car), but itexacerbated uneven development, compounding pre-existing regional inequalities tothe detriment, in particular, of the rural states of the eastern peninsula and in Borneo.Arguably (and Malaysian commentators have argued this for many years) the fundspoured into heavy industrialisation would have been far better spent on: Chinese-stylerural industrialisation to increase agricultural productivity 30; and attending to thelong-standing and serious structural weakness in the economy's industrial base - theunderdevelopment of an SME sector capable of linking with the transnationals (in theelectronics industry, for instance) via the supply of high value products and services(Salih and Yusof 1989, Lubeck 1992, Jomo et al 1997) 31. Indeed, the diversion offunds from rural areas that the heavy industrialisation programme has implied hasbeen one of the principal material reasons for the rise of the PAS opposition in theeastern Peninsular states.
Malaysia’s record on poverty and inequality, however, may not only have beenconstrained by 'wrong' policies. Given that Malaysia is perhaps unique in the worldfor attempting to unite economic development with pro-poor policies, the implicationsof tying Malaysia’s development prospects to its project-minded, implementation-driven form of economic governance, make the operation of the institutions ofeconomic governance all the more central for understanding the country'sperformance on reducing poverty. As we suggest below, our analysis leads us to theconclusion that policy effectiveness and poverty performance may well be hamperedby institutional changes in the bureaucracy at large, as much as in the economicbureaucracy in particular.
5.1 Poverty and the Economic Bureaucracy
As we have indicated above, several interviews with senior civil servants raised aconcern that the Malaysian Government has allowed its core economic agencies to becaught up in the increasing project-mindedness and implementation-orientedemphasis that has developed in the civil service more widely. For instance, oneinsider’s view was that the core economic agencies have not been insulated in termsof their recruitment and training so as to instil in the new generation of economicmanagers both the specialised skills needed to analyse development issues at a macro-level, let alone the very motivation to do so. Rather, some felt that Malaysia’seconomic bureaucracy had been allowed to recruit a more technical, operationally-oriented economists and econometricians. This new generation of economists, in theview of a number of commentators, were intellectually unsuitable for the critical tasksof formulating strategic policy in departments such as the macro-economics division 30 Rural industries, often linked to the export-oriented sector, have been one of the most dynamic partsof the Chinese economy for the past twenty years. See Nee and Su, 1998.31 Given that it is largely Chinese Malaysians that have the necessary technical and managerial skills,then arguably one of the reasons why there has never been a concerted government effort to deal withthis structural weakness is that by encouraging the expansion of industrial SMEs, Chinese Malaysianbusiness would be given a further opportunity for expanding its wealth
20
of the Economic Planning Unit. This problem had been exacerbated, they thought, bythe fact that the higher status - and more powerful positions within the bureaucracyhad already shifted towards those in control of project implementation. Theconsequence of not insulating the economic bureaucracy from these broaderdevelopments in the civil service was therefore that the new breed of operationally-minded economic managers had neither the motivation, nor the training (nor theintellectual capacity), to provide innovative leadership in the medium and long-termplanning divisions. Thus, as elsewhere in the bureaucracy, the relative allure (and, itmust be said, ease of task) of 'project-minded' bureaucratic operations has beenallowed to infiltrate and weaken the capacity for innovative planning and policyformulation within the institutions of economic governance.
Another concern raised by interviewees was that the inspirational thinking andvibrancy of policy-making that had originally generated the NEP, seemed to havebeen exorcised from the bureaucracy over time (presumably by default, rather thandesign). As suggested earlier, this development may have transpired, in part, becauseMalaysia did not develop a vibrant research base within the government, thus leavingpolicy formulation with a serious deficiency in terms of institutional capacity.Additionally, the policy-making process appears to have been detached - perhaps eveninsulated - from contributions from relevant parties outside of the government. Whilea number of consultative mechanisms were instituted during the 1990s, in an attemptto enhance the flow of information and interaction between government, business andcivil society (Biddle 1999), anecdotal evidence suggests that consultation meetingswere often devoid of any substantial interaction and debate between policy-makersand relevant agencies of civil society. Similar responses from a number of sourceswithin and without the government can only lead us to conclude that ‘Malaysia Inc.’has not yet been able to break from the centralised and autocratic decision-makingstyle that has long characterised economic governance in Malaysia.
While a degree of state autonomy from civil society seems to have been essential tothe effective workings of a developmental state (Evans 1995), in the Malaysian case,and particularly following the crisis of the late 1990s, a degree of autonomy fromexternal influence seems to have been achieved which even some senior civil servantsfelt to be detrimental to the generation of new policy-making ideas. While open to theinfluence of external ideas prior to the crisis (eg., Malaysia adopted the IMF's'business restraining' policy in 1996), in the years following the crisis, the governmentbecame more sceptical about ideas flowing from the Bretton Woods institutions.32 Forinstance, unlike other countries in the region which accepted advice - and in somecases financial support - from the IMF, the government rejected the IMF’s assistanceand executed its own crisis-management policies. In place of IMF reforms, thegovernment initiated a strategy to partially detach the economy from internationalcapital markets. Capital controls over the foreign exchange markets were instituted inattempts to restrict the short-term capital might quickly flow out of the economy anddestabilise the Ringgit.
As it happened, the decision to reject foreign aid and insulate the economy appears tohave further closed off avenues by which foreign expertise and ideas might informMalaysia’s economic decision-makers. One senior official described conditions in
32 Arguably with some justification as things turned out (see Henderson 2001).
21
which foreign expertise from agencies like the IMF and the World Bank has beeneffectively 'off-limits' to the economic bureaucracy following the financial crisis. Atpresent it appears that of all the agencies comprising the economic bureaucracy, onlyNEAC engages in an open exchange with agencies such as the World Bank. As oneofficial explained, this is primarily because NEAC, as a relatively new agency with noestablished 'turf' to maintain, and one specifically charged with formulatingimmediate crisis-management responses, is the only economic agency whoseactivities require that they actively engage with international experiences in the courseof drafting their policy proposals.33
In terms of its implications for the attack on poverty, the autonomy and insulation ofMalaysian economic governance, with its bias towards operations andimplementation-oriented activities, seems to have reduced the capacity (perhaps eventhe inclination) of macro-economic managers to recognise and respond to the changesin the nature and composition of poverty in recent years. There are many signs thatpoverty policies have not kept in tune with changing circumstances despite the (rare)efforts by members of the academic community, as well as non-governmentalorganisations, to voice their concerns over new and emerging forms of poverty. Someof these concerns revolve around the continued use of simple ethnic divisions as aproxy for the delineation of poverty groups. While clearly a reasonable assumption inthe past, some have argued that it no longer constitutes a coherent basis of policy-making, given the new intra-ethnic divisions and inequalities within the Malaycommunity itself (for instance, Roslan 2001). Similarly, others have argued thatcompared with gains experienced during the 1970s, social expenditures in the 1980shave not as effective at reducing poverty, partly because racially-based policies wereno longer become an efficient means of targeting poverty expenditures (Hammer et al1995).
Another current concern is the growth in urban poverty and the government's limitedresponses to it. Part of the problem seems to be institutional in that the coreresponsibilities for poverty policy implementation continue to reside in the Ministryof Rural Development which tends to reinforce the idea that rural poverty remains theprincipal, if not exclusive, problem. While the EPU is about to establish a post 34 todeal specifically with urban poverty, the continued orientation of anti-povertyprogrammes around the small groups of hard-core poor, further reinforces the ideathat poverty is principally a rural issue.
In earlier sections we expressed our concern that the 'politics of poverty information',as practised by the EPU, may have inhibited the formulation of more appropriate andeffective anti-poverty policies. Given the 'implementation mind-set' of the economicbureaucracy and the shift in the centre of gravity of economic policy-making fromthe EPU to the Treasury from the mid 1980s to the late 1990s, some degree of 'turfprotection' appears to have ensued. Arguably, one of the most pernicious aspects ofthis organisational culture in regard to poverty reduction has been the restrictions onaccess to relevant and detailed statistics on poverty and income distribution. Several 33 Recourse to international experience was indeed essential to the operations of NEAC. One officialrecounted their experience of NEAC's operations during the crisis and described how their responseshad often to be formulated with deadlines as short as a week (an extremely short - and steep - learningcurve indeed!).34 As of January 2002.
22
respondents commented on the fact that the EPU, which is in possession of thedetailed statistics required to design effective poverty reduction strategies, continuesto gate-keep such information, releasing only the broadest of overview data to thepublic domain. Without access to detailed data, it is very difficult for independentresearchers, NGOs and indeed other government agencies, to monitor theeffectiveness of anti-poverty programmes and propose alternatives. Whether thissecrecy stems from an executive decision, or is part of an attempt by the EPU tomaintain its supremacy in this area of policy-making 35, can only be left tospeculation. Regardless of motive, this arrangement must result in a waste ofresources, given that it restricts the abilities of other agencies to accurately identifyand target the needs of specific poor populations.
One recent example where this 'informational politics' may have diminished povertyreduction efforts concerns the RM 4.3 billion stimulus package initiated by NEAC inSeptember 2001. The package encompassed numerous small projects below RM200,000 that were aimed at stimulating economic growth. While many of these mighthave been particularly effective in ameliorating poverty had they been appropriatelytargeted, this was effectively prevented by the EPU's control over data. Despite thefact that NEAC supposedly had the power to access all information necessary for itsoperation, it was unable to extract data in the necessary detail from the EPU. As aresult, the stimulus package was able to ensure only a more blanket disbursement offunds to more generally-oriented projects than might otherwise have been possible.
5.2 Poverty and the Broader Civil Service
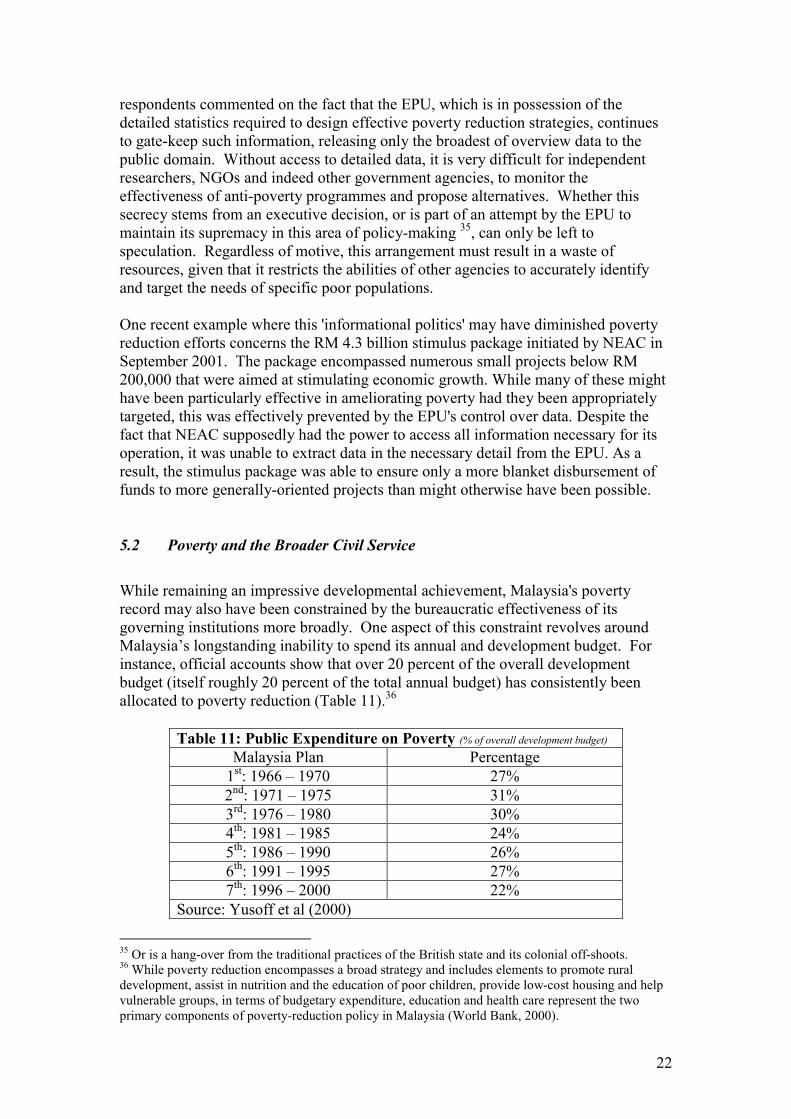
While remaining an impressive developmental achievement, Malaysia's povertyrecord may also have been constrained by the bureaucratic effectiveness of itsgoverning institutions more broadly. One aspect of this constraint revolves aroundMalaysia’s longstanding inability to spend its annual and development budget. Forinstance, official accounts show that over 20 percent of the overall developmentbudget (itself roughly 20 percent of the total annual budget) has consistently beenallocated to poverty reduction (Table 11).36
Table 11: Public Expenditure on Poverty (% of overall development budget)
Malaysia Plan Percentage1st: 1966 – 1970 27%2nd: 1971 – 1975 31%3rd: 1976 – 1980 30%4th: 1981 – 1985 24%5th: 1986 – 1990 26%6th: 1991 – 1995 27%7th: 1996 – 2000 22%
Source: Yusoff et al (2000)
35 Or is a hang-over from the traditional practices of the British state and its colonial off-shoots.36 While poverty reduction encompasses a broad strategy and includes elements to promote ruraldevelopment, assist in nutrition and the education of poor children, provide low-cost housing and helpvulnerable groups, in terms of budgetary expenditure, education and health care represent the twoprimary components of poverty-reduction policy in Malaysia (World Bank, 2000).
23
Yet available data, supported by interview responses, raise the concern that in alllikelihood, far less than this actually gets spent on poverty reduction projects.37
Several interview reports suggested that over most of Malaysia’s developmentexperience, there have been high levels of shortfall in development expenditure.While existing data confirms that development expenditure shortfalls were decliningover the 1990s, available data and interview responses confirm that shortfall rateswere substantial in the 1970s and 1980s. For instance, development expendituresunder the 5th Malaysia plan (1986-1990) ranged from a low of 68 percent in 1987 to ahigh of 71.9 percent in 1989 meaning that between 19.1 and 32 percent of thedevelopment budget remained unspent in any given year (Government of Malaysia,1990). In other words, if available data and field reports are correct, for most ofMalaysia’s development history, significant proportions of the development budget,roughly equivalent to the levels allocated for poverty reduction, have consistentlyfailed to be spent.
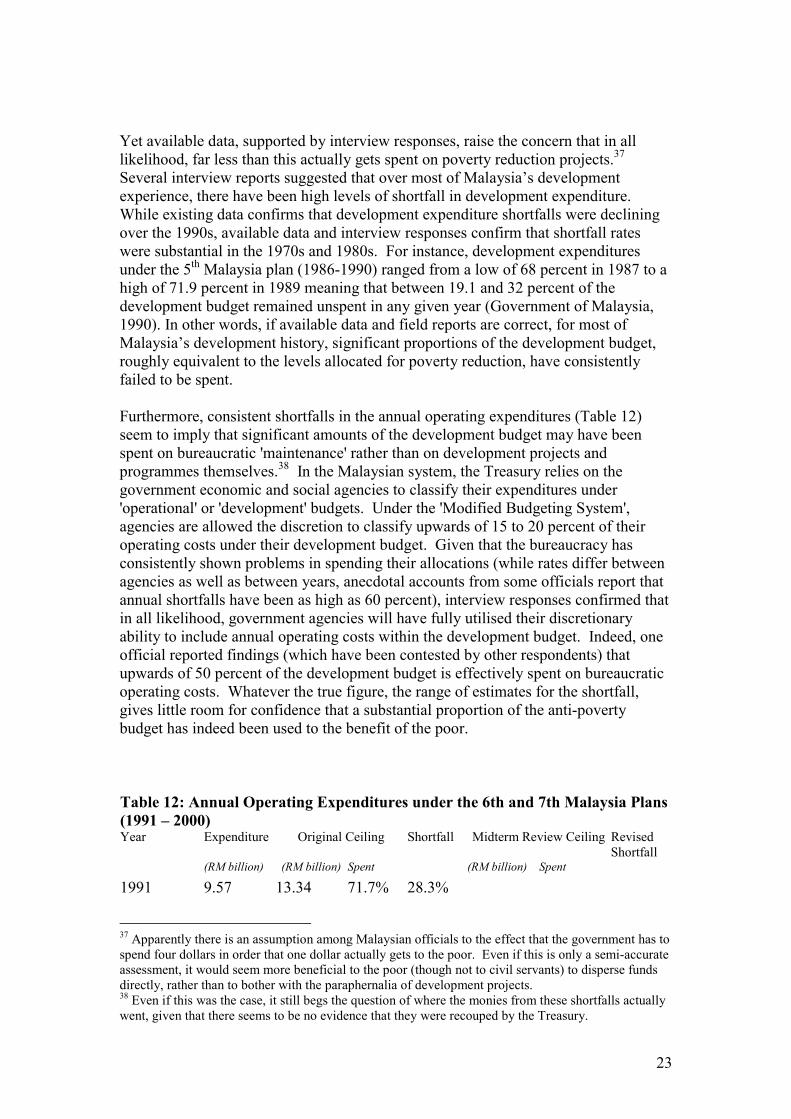
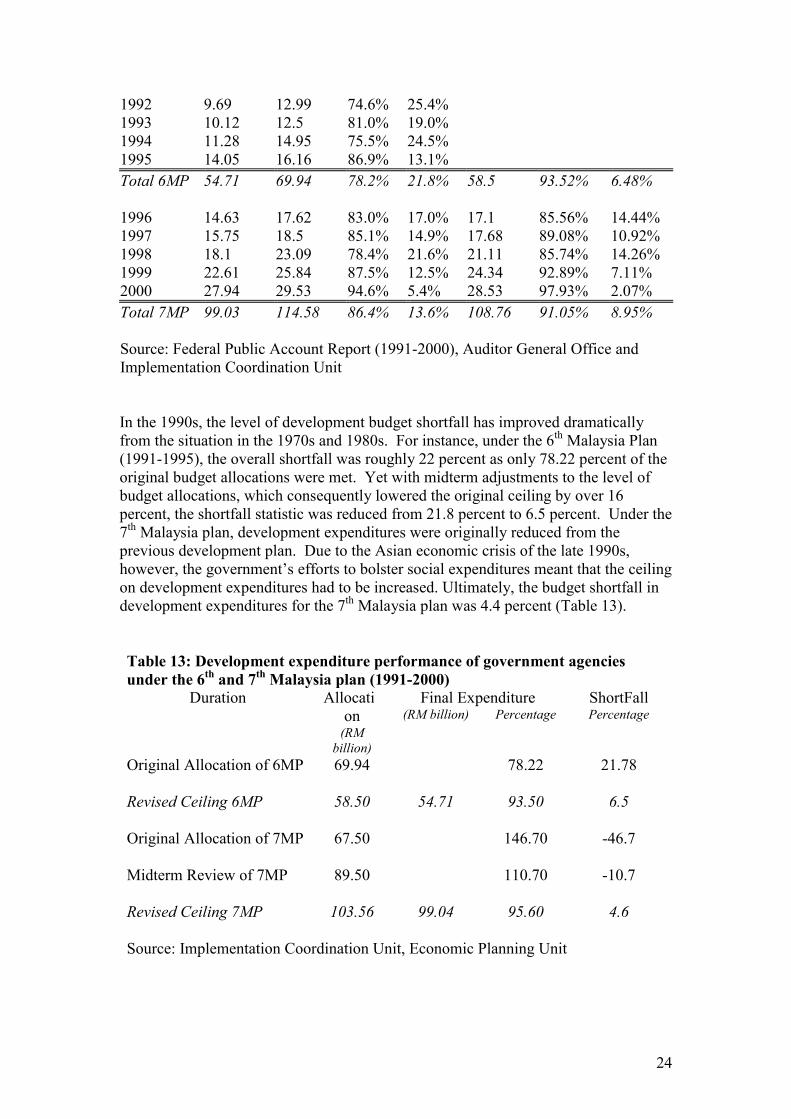
Furthermore, consistent shortfalls in the annual operating expenditures (Table 12)seem to imply that significant amounts of the development budget may have beenspent on bureaucratic 'maintenance' rather than on development projects andprogrammes themselves.38 In the Malaysian system, the Treasury relies on thegovernment economic and social agencies to classify their expenditures under'operational' or 'development' budgets. Under the 'Modified Budgeting System',agencies are allowed the discretion to classify upwards of 15 to 20 percent of theiroperating costs under their development budget. Given that the bureaucracy hasconsistently shown problems in spending their allocations (while rates differ betweenagencies as well as between years, anecdotal accounts from some officials report thatannual shortfalls have been as high as 60 percent), interview responses confirmed thatin all likelihood, government agencies will have fully utilised their discretionaryability to include annual operating costs within the development budget. Indeed, oneofficial reported findings (which have been contested by other respondents) thatupwards of 50 percent of the development budget is effectively spent on bureaucraticoperating costs. Whatever the true figure, the range of estimates for the shortfall,gives little room for confidence that a substantial proportion of the anti-povertybudget has indeed been used to the benefit of the poor.
Table 12: Annual Operating Expenditures under the 6th and 7th Malaysia Plans(1991 – 2000)Year Expenditure Original Ceiling Shortfall Midterm Review Ceiling Revised
Shortfall(RM billion) (RM billion) Spent (RM billion) Spent
1991 9.57 13.34 71.7% 28.3%
37 Apparently there is an assumption among Malaysian officials to the effect that the government has tospend four dollars in order that one dollar actually gets to the poor. Even if this is only a semi-accurateassessment, it would seem more beneficial to the poor (though not to civil servants) to disperse fundsdirectly, rather than to bother with the paraphernalia of development projects.38 Even if this was the case, it still begs the question of where the monies from these shortfalls actuallywent, given that there seems to be no evidence that they were recouped by the Treasury.
24
1992 9.69 12.99 74.6% 25.4%1993 10.12 12.5 81.0% 19.0%1994 11.28 14.95 75.5% 24.5%1995 14.05 16.16 86.9% 13.1% Total 6MP 54.71 69.94 78.2% 21.8% 58.5 93.52% 6.48%
1996 14.63 17.62 83.0% 17.0% 17.1 85.56% 14.44%1997 15.75 18.5 85.1% 14.9% 17.68 89.08% 10.92%1998 18.1 23.09 78.4% 21.6% 21.11 85.74% 14.26%1999 22.61 25.84 87.5% 12.5% 24.34 92.89% 7.11%2000 27.94 29.53 94.6% 5.4% 28.53 97.93% 2.07%Total 7MP 99.03 114.58 86.4% 13.6% 108.76 91.05% 8.95%
Source: Federal Public Account Report (1991-2000), Auditor General Office andImplementation Coordination Unit
In the 1990s, the level of development budget shortfall has improved dramaticallyfrom the situation in the 1970s and 1980s. For instance, under the 6th Malaysia Plan(1991-1995), the overall shortfall was roughly 22 percent as only 78.22 percent of theoriginal budget allocations were met. Yet with midterm adjustments to the level ofbudget allocations, which consequently lowered the original ceiling by over 16percent, the shortfall statistic was reduced from 21.8 percent to 6.5 percent. Under the7th Malaysia plan, development expenditures were originally reduced from theprevious development plan. Due to the Asian economic crisis of the late 1990s,however, the government’s efforts to bolster social expenditures meant that the ceilingon development expenditures had to be increased. Ultimately, the budget shortfall indevelopment expenditures for the 7th Malaysia plan was 4.4 percent (Table 13).
Table 13: Development expenditure performance of government agenciesunder the 6th and 7th Malaysia plan (1991-2000)
Final Expenditure ShortFallDuration Allocation
(RMbillion)
(RM billion) Percentage Percentage
Original Allocation of 6MP
Revised Ceiling 6MP
69.94
58.50 54.71
78.22
93.50
21.78
6.5
Original Allocation of 7MP
Midterm Review of 7MP
Revised Ceiling 7MP
67.50
89.50
103.56 99.04
146.70
110.70
95.60
-46.7
-10.7
4.6
Source: Implementation Coordination Unit, Economic Planning Unit
25
These improvements in development budget shortfalls appear to have come from thegovernment’s efforts to revise the allocation ceiling during the mid-term review of thefive-year development plan rather than from significant changes in the operation ofthe bureaucracy at large or in improvements in the implementation of developmentprojects. When considering the government’s own explanation for its persistentshortfall in expenditure, a number of substantial concerns about the planningcapacities and operation of the bureaucracy arise.
To account for the high levels of shortfall in the development budget in the 1970s and1980s, the government’s explanation was four-fold (Government of Malaysia 1990).Firstly, government agencies were recognised to have limited capabilities in regardsto the planning and management of development projects. Secondly, governmentagencies also lacked flexibility in financial management. Thirdly, one of the criticalproblems leading to shortfalls in development expenditures apparently stemmed fromproblems in arranging the acquisition of the land necessary for developmentprojects.39 Finally, the government also recognised that the level of budgetaryshortfalls was also due to the inability of private contractors to implementdevelopment projects on schedule.
Twelve years later, and on the basis of interviews (in March 2002) with members ofthe Implementation Coordination Unit (ICU), the division of the EPU which overseasthe implementation of budgetary expenditures, it seems that little has changed interms of the government’s official explanation for the shortfalls in the developmentbudget. Limitations in the ability of agencies to sufficiently plan projects is still amajor concern. As in 1990, a major factor limiting the ability of government agenciesto plan development projects effectively stems from problems in land acquisition.Agencies often have problems finding suitable project sites as well as experiencingdelays in finalising those sites (particularly, for instance, where they are 'brown field',ie., subject to previous development). Furthermore, negotiations with stategovernments over land rights are closed dialogues. Consequently as some agenciescrucial to project implementation may not have been in attendance, current practicessometimes lead to coordination problems between the various agencies involved. 40
The government’s concern over budget shortfalls has also revealed institutionalweaknesses in the monitoring of projects (a concern also raised by povertyspecialists). At present there is no system to ensure that agencies constantly monitorprojects throughout the stages of their life or any system to ensure that projectmanagers regularly visit project sites. Accordingly, there is no system to ensure thatproblems that arise at the initial stage are identified before they impact upon laterstages in the project.41 Alongside proposals to develop better planning practices, one
39 The federal government must negotiate with the respective state governments to acquire land and thiscan be both time-consuming and in states held by the PAS opposition, politically sensitive.40 There is currently a federal government proposal to open-up these state-federal developmentdialogues to interested parties. It seems unlikely, however, that the latter are likely to include 'thepublic'.41 Where civil engineering projects are concerned, there also appears to be no means of preventingcontractors increasing, by stages, the final cost of delivering the project. For instance, as a result ofconsistent price increases, Kuala Lumpur's new elevated highway, that runs for seven kilometers intothe city centre, at the time of it's completion was reputed to have cost RM 700 million (about £127million). By way of comparison, an equivalent elevated highway built in Britain would typically cost
26
proposal presently being advanced by the government is to at least institute themonitoring of expenditure performance, possibly tying performance to futurebudgetary allocations.
Many of these concerns identified by the government have been highlighted by ourresearch. But our analysis raises another dimension, namely the links between annualbudget shortfalls and the shortfall in the development budget. For instance,interviewees questioned both the effectiveness of current public expenditure fordevelopment purposes and the low propensity among agencies to pursue developmentprojects. For instance, several officials confirmed that agency expenditures are oftendone in haste and thus ineffectively. Among Malaysian civil servants, this practice isknown as 'Christmas shopping'. Given the fact that government agencies arepressured to spend their annual budget, from the agency’s perspective, if it is to bespent quickly before the end of the year, it will usually be spent under the categorieswhich give the agency the question autonomy to make its own decisions on how thefunds will utilised. In Malaysia, agency autonomy in this sense, extends only to itemscosting below RM 10,000 (sometimes referred to as the 'magic number'). Forexpenditures between RM 10,000 and RM 100,000 (the upper limit being a recentincrease from RM 50,000), agencies are required to put the project out to tender.Expenditures above RM 100,000 require a complicated tendering process which, ifrules are followed, effectively means a minimum of 6 months to complete thetendering process.
Shortfalls in the annual operating budget which lead to the practice of 'Christmasshopping' appears to be reinforced firstly by the fact that the Treasury does not alwaysallocate funds to the ministries or state governments at the start of the year(sometimes the delays seem to be a disciplinary tactic as in the case of state leveldisbursements of funds where some state governments frequently receive fundsmonths later than other states and sometimes not even in the same budget year); andsecondly, by logistical disincentives faced by government agencies. Specifically,while the tendering processes are already time consuming and labour intensive, someofficials reported concerns that development projects are even worse. The primaryreason appears to be that development expenditures do not just involve negotiationswith the Treasury, as they do in operational expenditures. For instance, a number ofagencies at both state and federal level are normally involved in development projects.At the federal level, tendering for development projects firstly requires thatgovernment agencies negotiate with the EPU to authorise the expenditure. Thennegotiations are made with the Treasury to acquire the budget. Finally, agencies mustmeet with the department of Public Services to authorise the release of the personnelnecessary to implement the project.
Given these additional and time consuming problems with development expenditures,interviewees felt that development projects had become the ones that governmentagencies least wanted to pursue. While the annual budget cycle only pertains tooperating expenditures (the development budget is on a five-year rolling system), thepressure to spend the development budget always seems to be of a less urgent -relative to the need to spend the operating budget - from the perspective of the
about £7 million. We are grateful to colleagues at the World Enterprise Institute, Kuala Lumpur, forthis information.
27
government agencies. Accordingly, it seems likely that problems underlying theannual shortfall in operating expenditures may directly affect the propensity of thegovernment agencies to make the substantial efforts needed to initiate, let aloneimplement, development projects.
5.3 Poverty, State Governments and Project Implementation
Issues concerning project implementation, then, seem to be one of the principalquestion marks about the effectiveness of Malaysia’s institutions of economicgovernance. This is particularly true when it comes to poverty reduction. Dependingon the project and the state concerned, the federal or state government agencies maybe responsible for the implementation of anti-poverty projects. Insofar as povertypolicies are targeted (on the hard core poor, for instance), many of Malaysia’s anti-poverty programmes are administered by the state-level agencies.42 Statebureaucracies, like federal ministries, follow the same rules for tendering projects.Due to the fact that state governments have their own tendering bodies, however, andthat these operate in close physical and social proximity to the states' own economicplanning units, interview responses suggest that more effective working relationshipsbetween the state bureaucrats and their tendering bodies ultimately translates intomore efficient disbursals of funds, and with it, project implementation. To the extentthat improved project tendering is now a feature of many state bureaucracies, it mightbe reasonable to conclude that the implementation of poverty projects is better left tothe state-level agencies.
Yet all states are not equivalents in terms of their poverty performance nor theirresponsibilities for implementing development projects. In Peninsular Malaysia,Kelantan and Terengganu continue to have the highest incidences of poverty (seefigure 1). While geographic and occupational factors may indeed predispose suchregions to higher poverty levels, Malaysian politics, which determines both theamount of federal support received by state governments and their role inimplementing anti-poverty projects, may also have played an important role in theirrespective performance. This may have been particularly the case subsequent to thecapture of the legislatures of both states by the opposition Party, PAS.
42 Note that state governments, as well as the federal government, formulate and fund poverty policies.
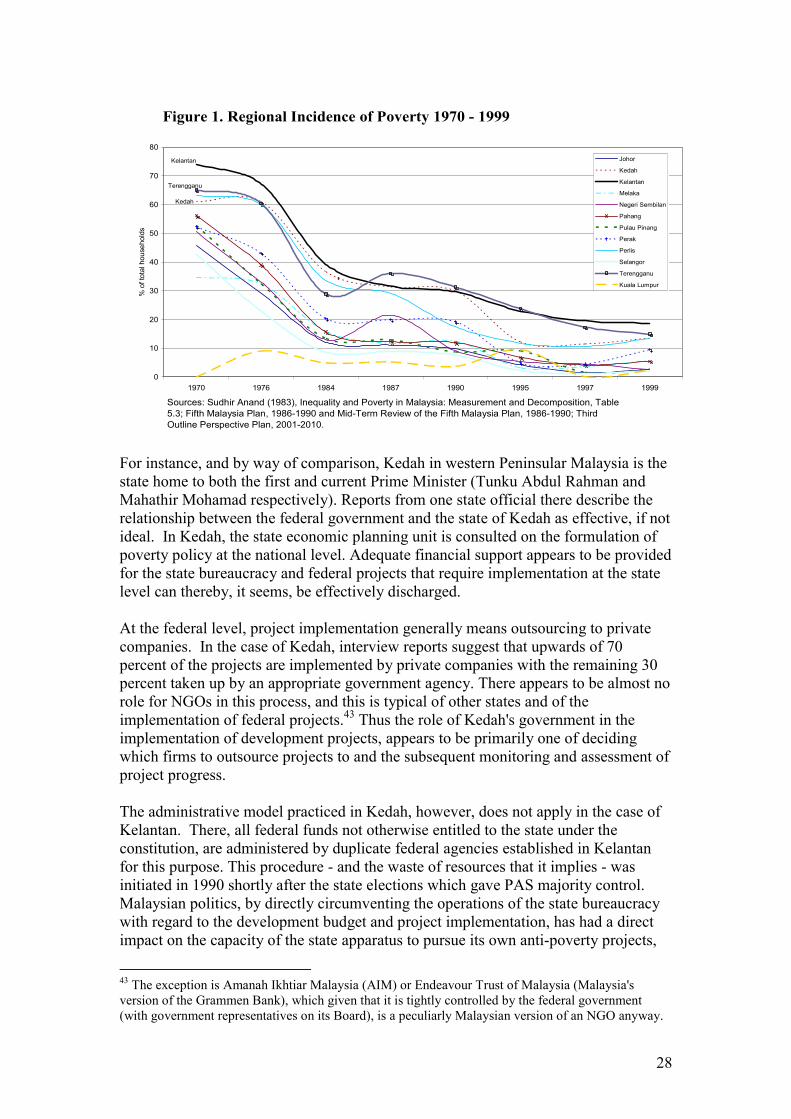
28
Figure 1. Regional Incidence of Poverty 1970 - 1999
Kedah
Kelantan
Terengganu
0
10
20
30
40
50
60
70
80
1970 1976 1984 1987 1990 1995 1997 1999
Sources: Sudhir Anand (1983), Inequality and Poverty in Malaysia: Measurement and Decomposition, Table 5.3; Fifth Malaysia Plan, 1986-1990 and Mid-Term Review of the Fifth Malaysia Plan, 1986-1990; Third Outline Perspective Plan, 2001-2010.
% o
f tot
al h
ouse
hold
s
Johor
Kedah
Kelantan
Melaka
Negeri Sembilan
Pahang
Pulau Pinang
Perak
Perlis
Selangor
Terengganu
Kuala Lumpur
For instance, and by way of comparison, Kedah in western Peninsular Malaysia is thestate home to both the first and current Prime Minister (Tunku Abdul Rahman andMahathir Mohamad respectively). Reports from one state official there describe therelationship between the federal government and the state of Kedah as effective, if notideal. In Kedah, the state economic planning unit is consulted on the formulation ofpoverty policy at the national level. Adequate financial support appears to be providedfor the state bureaucracy and federal projects that require implementation at the statelevel can thereby, it seems, be effectively discharged.
At the federal level, project implementation generally means outsourcing to privatecompanies. In the case of Kedah, interview reports suggest that upwards of 70percent of the projects are implemented by private companies with the remaining 30percent taken up by an appropriate government agency. There appears to be almost norole for NGOs in this process, and this is typical of other states and of theimplementation of federal projects.43 Thus the role of Kedah's government in theimplementation of development projects, appears to be primarily one of decidingwhich firms to outsource projects to and the subsequent monitoring and assessment ofproject progress.
The administrative model practiced in Kedah, however, does not apply in the case ofKelantan. There, all federal funds not otherwise entitled to the state under theconstitution, are administered by duplicate federal agencies established in Kelantanfor this purpose. This procedure - and the waste of resources that it implies - wasinitiated in 1990 shortly after the state elections which gave PAS majority control.Malaysian politics, by directly circumventing the operations of the state bureaucracywith regard to the development budget and project implementation, has had a directimpact on the capacity of the state apparatus to pursue its own anti-poverty projects,
43 The exception is Amanah Ikhtiar Malaysia (AIM) or Endeavour Trust of Malaysia (Malaysia'sversion of the Grammen Bank), which given that it is tightly controlled by the federal government(with government representatives on its Board), is a peculiarly Malaysian version of an NGO anyway.
29
let alone effectively engaging in federal ones. Interviews with state officials inKelantan raise concerns that Malaysian politics ultimately means that projectsimplemented by opposition-controlled states are likely to be problematic. Frequentdelays are experienced in receiving the federal subventions to the state’s budget.Interviewees described the normal experience as one where they would receiveconstitutionally-entitled federal funds months later than all the other stategovernments and sometime not even in the same budget year.44 The inability toanticipate when federal finances will arrive must significantly hinder the state’s abilityto plan, let alone implement, its own projects.
More directly related to poverty reduction, the impact of Malaysian politics on theeffectiveness of project implementation also appears to underline the demise of thejoint federal-state committee for the poor in Kelantan. The committee, created in1996, was a concession by the federal government to give Kelantan more input intothe formulation and implementation of the poverty projects within its jurisdiction. Inexchange for more formal engagement, the state made it easier for the federalgovernment to gain access to land permits (the first major hurdle in theimplementation of any federal projects in a state's territory and a significant - if notonly - bargaining chip held by states over the federal government). Five years later,the tension in state-federal relations in Kelantan has meant that no more new projectsare being formulated by the joint committee. Furthermore, even some of the projectsalready given funds have been halted. The lesson to be learned is that in terms ofregional poverty dynamics, Malaysian politics (namely whether the state is UMNO-friendly or not) is an ever present factor which determines whether funds allocated forpoverty reduction actually end-up being spent on poverty reduction.
6. CONCLUSIONS
There is no doubt that Malaysia has had a good record in terms of economic growth.While Malaysia’s record is not as successful as experiences in South Korea,Singapore and Hong Kong, Malaysia has been an admirable frontrunner in the effortto systematically integrate poverty reduction into an economic development strategy.Accordingly, Malaysia is arguably the ideal case through which to trace the linksbetween the operation and evolution of its institutions of economic governance on theone hand, and its poverty reduction efforts on the other.
Although Malaysia’s record on reducing poverty has been good by regional and worldstandards, it arguably could have been better. On the one hand, misdirecteddevelopment policies (e.g., heavy industrialisation in steel, cement, petrochemicals)were clearly a significant factor which stunted the nation’s poverty reduction effort bytaking up large amounts of government investment and exacerbating unevendevelopment in the rural states. Arguably, the development funds channelled intoheavy industrialisation would have been better spent on other pro-poor forms ofeconomic development (e.g., rural industrialisation, agricultural productivity, and
44 Terengganu, a PAS controlled state since 1999, is now, presumably, treated in a similar way.
30
SMEs). As indicated in this report, much of these limitations have been addressedelsewhere.
Rather, this research has found that alongside misguided choices and ‘wrong’ policies,the operation of the bureaucracy in general, and the economic bureaucracy inparticular, may also have worked to limit Malaysia’s developmental performance andpoverty reduction. Available evidence suggests that the competency of thebureaucracy in general may have become increasingly problematic in terms of itsability to successfully plan and implement its development strategy. This is worryinggiven the extent to which Malaysian development strategies emphasise ‘projects’ over‘policies’ – the latter having changed relatively little since the early innovations of theNew Economic Policy and the former representing the operationalisation oflongstanding policy tenets of the latter – thus making project implementation the coreelement of bureaucratic efforts. Equally, the operation of the economic bureaucracy,particularly concerning the accessibility of poverty related data within thebureaucracy and the relative exclusion of its agencies from external sources ofexpertise, represent disturbing bureaucratic features that clearly work againstMalaysia’s leading efforts to integrate poverty reduction into its economicdevelopment strategy.
If the account of the Malaysian experience as developed here is a reasonable one, thenour analysis point to the following policy conclusions. Capacity building effortsneeds to focus on building a significant research and policy-formulation institutionswithin the bureaucracy in tandem with efforts to promote staff accessibility to a widerrange of policy expertise and international dialogue. Furthermore, efforts to integratepoverty reduction into economic development strategies necessitate a greateraccessibility to detailed poverty data, at least amongst relevant federal and stateagencies if not equally to a wider academic and civil society community.
31
REFERENCES
Ainur, N. (2001). Proficiency in English: An agenda of the Malaysian civil service inthe era of globalisation. INTAN Working Paper, Kuala Lumpur.
Biddle, J. (1999). Consultative Mechanisms and Economic Governance in Malaysia.World Bank Private Sector Development Department Occassion Paper No. 38.
Evans, P. (1995). Embedded Autonomy: States and Industrial Transformation.Princeton, NJ: Princeton University Press.
Evans, P. and J. Rauch (1999), 'Bureaucracy and growth: a cross-national analysis ofthe effects of "Weberian" state structures on economic growth', AmericanSociological Review, 64(4): 748-65.
Gomez, E.T. (1990), Politics in Business: UMNO's Corporate Investments, KualaLumpur, Forum.
Gomez, E.T. (1991), Money Politics in the Barisan Nasional. Kuala Lumpur, Forum.
Gomez, E.T. and Jomo, K.S. (1997), Malaysia's Political Economy: Politics,Patronage and Profits. Cambridge, Cambridge University Press.
Hammer, J., Nabi, I.and Cercone, J. (1995). "Distributional Effects of Social SectorExpenditures in Malaysia, 1974 to 1989". In Dominique van de Walle and KimberlyNead (eds): Public Spending and the Poor: Theory and Evidence. Baltimore andLondon: Johns Hopkins University Press for the World Bank, pp 521-554.
Hasan, A.R. and Hashim, S. (2001). Poverty Statistics in Malaysia. Paper presented atthe World Bank/PIDS workshop on "Strengthening Poverty Data Collection andAnalysis", Manila, 30 April-3 May.
Henderson, J. (2000), 'The East Asian crisis and the future of national economicgovernance', Working Paper, Manchester Business School.
Henderson, J., Hulme, D., Phillips, R. and Kim, E.M. (2002a), 'Economic governanceand poverty reduction in South Korea', unpublished paper, Manchester BusinessSchool.
Henderson, J., Hulme, D., Phillips, R. and Andor, L. (2002b), 'Economic governanceand poverty in Hungary', Working Paper, Manchester Business School.
Japan Bank for International Cooperation (2001). Poverty Profile: ExecutiveSummary Malaysia. Japanese Bank for International Cooperation.
Jesudason, J. (1989), Ethnicity and the Economy: the State, Chinese Business andMultinationals in Malaysia. Singapore, Oxford University Press.
Jomo, K.S., Chen, Y.C., Folk, B.C., ul-Haque, I., Pasuk, P. Simatupang, B. andTateishi, M. (1997), Southeast Asia's Misunderstood Miracle: Industrial Policy and
32
Economic Development in Thailand, Malaysia and Indonesia. Boulder, WestviewPress.
Lubeck, P.M. (1992), 'Malaysian industrialization, ethnic divisions and the NICmodel: the limits to replication' in R.P. Appelbaum and J. Henderson (eds.), Statesand Development in the Asian Pacific Rim. Newbury Park, Sage Publications: 176-98.
Makita, R. (1998). "Rural Development Administration for Poverty Eradication inMalaysia". OECD Journal of Development Assistance 3(2): 245-323.
Malaysia, Government of (1971), Second Malaysia Plan, 1971-1976 Kuala Lumpur:National Printing Department.
Malaysia, Government of (1976), Third Malaysia Plan, 1976-1980, Kuala Lumpur:National Printing Department.
Malaysia, Government of (1981), Fourth Malaysia Plan, 1981-1985, Kuala Lumpur:National Printing Department.
Malaysia, Government of (1984), Mid-Term Review of the Fourth Malaysia Plan.Kuala Lumpur: National Printing Department.
Malaysia, Government of (1986), Fifth Malaysia Plan, 1986-1989, Kuala Lumpur:National Printing Department.
Malaysia, Government of (1989), Mid-Term Review of the Fifth Malaysia Plan. KualaLumpur: National Printing Department.
Malaysia, Government of (1990), Improvements and Development in the PublicService. Kuala Lumpur: National Printing Department.
Malaysia, Government of (1991), The Second Outline Perspective Plan, 1991-2000,Kuala Lumpur: National Printing Department.
Malaysia, Government of (1996), Seventh Malaysia Plan, 1996-2000, Kuala Lumpur:National Printing Department.
Malaysia, Government of (2001a), Eighth Malaysia Plan, 2001-2005, Kuala Lumpur:National Printing Department.
Malaysia, Government of (2001b), The Third Outline Perspective Plan, 2001-2010,Kuala Lumpur: National Printing Department.
Milne, R. and Mauzy, D.K. (1999). Malaysian Politics under Mahathir. London:Routledge.
Nair, S. (2000). "Poverty in the new millenium - challenges for Malaysia". Paperpresented at the second Biennial Aotearoa NZ International Development StudiesNetwork (DEVNET) Conference entitled "Prosperity, Poverty, Progress" held on 17-19 November, Victoria University of Wellington, Wellington, Aotearoa New Zealand.
33
Nee, V. and Su, S. (1998), “Institutional Foundation of Robust EconomicPerformance: Public-Sector Industrial Growth in China.” in J. Henderson (ed),Industrial Transformation in Eastern Europe in the Light of the East AsianExperience. London, Macmillan: 167-187.
Rauch, J. and Evans, P. (2000), "Bureaucractic structures and bureaucraticperformance in less developed countries". Journal of Public Economics 75(1): 49-71.
Rogayah, H. (2002). The Asian financial crisis and its impact on poverty andinequality in Malaysia. IKMAS Working Paper, Kuala Lumpur
Roslan, A. (2001). "Income Inequality, Poverty, and Development Policy inMalaysia". Paper presented at a conference on "Poverty and SustainableDevelopment" 22-23 November, Université Montesquieu-Bordeaux IV, France.
Salih, K. and Yusof, Z. (1989), 'Overview of the new economic policy and frameworkfor the post-1990 economic policy', Malaysian Management Review, 24(2): 13-61.
Shireen, M.H. (1998). Income Inequality and Poverty in Malaysia. Landham, MD:Rowman and Littlefield.
Snodgrass, D. (1980). Inequality and Economic Development in Malaysia. KualaLumpur: Oxford University Press.
Sundaram, J.K. (Jomo, K.S.) (1986), A Question of Class. Singapore, OxfordUniversity Press.
Trezzini, B. (2001). "Embedded state autonomy and legitimacy: piecing together theMalaysian development puzzle". Economy and Society 30(3): 324-353.
Yusoff, M., Hasan, F.A. and Jalil, S.A. (2000). "Globalisation, economic policy, andequity: the case of Malaysia". Paper presented at an OECD workshop on "Poverty andIncome Inequality in Developing Countries: A Policy Dialogue on the Effects ofGlobalisation", held on 30 Nov - 1 Dec, Paris.
World Bank (2000). Malaysia Public Expenditures: Managing the crisis; challengingthe future. Washington D.C.: World Bank.