Embed Size (px)
Citation preview

Economic Growth in a Cross Section of Countries
Robert J. Barro
The Quarterly Journal of Economics, Vol. 106, No. 2. (May, 1991), pp. 407-443.
Stable URL:
http://links.jstor.org/sici?sici=0033-5533%28199105%29106%3A2%3C407%3AEGIACS%3E2.0.CO%3B2-C
The Quarterly Journal of Economics is currently published by The MIT Press.
Your use of the JSTOR archive indicates your acceptance of JSTOR's Terms and Conditions of Use, available athttp://www.jstor.org/about/terms.html. JSTOR's Terms and Conditions of Use provides, in part, that unless you have obtainedprior permission, you may not download an entire issue of a journal or multiple copies of articles, and you may use content inthe JSTOR archive only for your personal, non-commercial use.
Please contact the publisher regarding any further use of this work. Publisher contact information may be obtained athttp://www.jstor.org/journals/mitpress.html.
Each copy of any part of a JSTOR transmission must contain the same copyright notice that appears on the screen or printedpage of such transmission.
The JSTOR Archive is a trusted digital repository providing for long-term preservation and access to leading academicjournals and scholarly literature from around the world. The Archive is supported by libraries, scholarly societies, publishers,and foundations. It is an initiative of JSTOR, a not-for-profit organization with a mission to help the scholarly community takeadvantage of advances in technology. For more information regarding JSTOR, please contact [email protected].
http://www.jstor.orgSun Aug 12 09:47:28 2007

ECONOMIC GROWTH IN A CROSS SECTION OF COUNTRIES"
For 98 countries in the period 1960-1985, the growth rate of real per capita GDP is positively related to initial human capital (proxied by 1960 school- enrollment rates) and negatively related to the initial (1960) level of real per capita GDP. Countries with higher human capital also have lower fertility rates and higher ratios of physical investment to GDP. Growth is inversely related to the share of government consumption in GDP, but insignificantly related to the share of public investment. Growth rates are positively related to measures of political stability and inversely related to a proxy for market distortions.
In neoclassical growth models, such as Solow [19561, Cass [19651, and Koopmans [1965], a country's per capita growth rate tends to be inversely related to its starting level of income per person. In particular, if countries are similar with respect to structural parameters for preferences and technology, then poor countries tend to grow faster than rich countries. Thus, there is a force that promotes convergence in levels of per capita income across countries.'
The main element behind the convergence result in neoclassi- cal growth models is diminishing returns to reproducible capital. Poor countries, with low ratios of capital to labor, have high marginal products of capital and thereby tend to grow at high rates.' This tendency for low-income countries to grow at high rates is reinforced in extensions of the neoclassical models that allow for international mobility of capital and technology.
The hypothesis that poor countries tend to grow faster than rich countries seems to be inconsistent with the cross-country evidence, which indicates that per capita growth rates have little
*Anearlier version of this paper was presented at the Institute for the Study of Free Enterprise Systems' Conference on Human Capital and Economic Growth, SUNY, Buffalo, May 1989. I am ateful for suggestions from Olivier Blanchard and for research assistance from ~ o g e r wolf and David Renelt.
1. Barro and Sala i Martin [1990] show that the tendency for poor countries to grow faster than rich countries, termed P-convergence, need not imply a reduction in the dispersion of income levels, termed u-convergence, if each country's level of income is continually subject to random disturbances. The present study deals only with P-convergence.
2. This property holds unambiguously for the capital stock in the Cass [1965]-Koopmans [I9651 model if the elasticity of marginal utility is constant. It also holds unambiguously for output if the production function is Cobb-Douglas. See Barro and Sala i Martin [1991].
o 1991 by the President and Fellows of Harvard College and the Massachusetts Institute of Technology. The Quarterly Journal of Economics, May 1991

408 QUARTERLY JOURNAL OF ECONOMICS
FIGUREI Per Capita Growth Rate Versus 1960 GDP per Capita
correlation with the starting level of per capita product. Figure I, which uses the data from the Summers and Heston [I9881 international comparison project, shows this type of relationship for 98 countries. The average growth rate of per capita real gross domestic product (GDP) from 1960 to 1985 (denoted GR6085) is not significantly related to the 1960 value of real per capita GDP (GDPGO); the correlation is 0.09.3 This finding accords with recent models, such as Lucas [I9881 and Rebelo [19901, that assume constant returns to a broad concept of reproducible capital, which includes human capital. In these models the growth rate of per capita product is independent of the starting level of per capita product.
Human capital plays a special role in a number of models of endogenous economic growth. In Romer [I9901 human capital is
3. I use throughout the values of GDP expressed in terms of prices for the base year, 1980.Results using chain-weighted values of GDP are not very different.
ECONOMIC GROWTH IN A CROSS SECTION OF COUNTRIES 409
the key input to the research sector, which generates the new products or ideas that underlie technological progress. Thus, countries with greater initial stocks of human capital experience a more rapid rate of introduction of new goods and thereby tend to grow faster. In multicountry models of technological change, the spread of new ideas across countries (or firms or industries) is also important. As Nelson and Phelps [I9661 suggested, a larger stock of human capital makes it easier for a country to absorb the new products or ideas that have been discovered elsewhere. Therefore, a follower country with more human capital tends to grow faster because it catches up more rapidly to the technological leader.
Becker, Murphy, and Tamura [I9901 assume that the rate of return on human capital increases over some range, an effect that could arise because of the spillover benefits from human capital that Lucas [19881 stresses. As an example, the return to some kinds of ability, such as talent in communications, is higher if other people are also more able. In this setting, increases in the quantity of human capital per person tend to lead to higher rates of investment in human and physical capital, and hence, to higher per capita growth. A supporting force is that more human capital per person reduces fertility rates, because human capital is more productive in producing goods and additional human capital rather than more children.
The empirical enalysis in this paper uses school-enrollment rates as proxies for human capital. For a given starting value of per capita GDP, a country's subsequent growth rate is positively related to these measures of initial human capital. Moreover, given the human-capital variables, subsequent growth is substantially negatively related to the initial level of per capita GDP. Thus, in this modified sense, the data support the convergence hypothesis of neoclassical growth models. A poor country tends to grow faster than a rich country, but only for a given quantity of human capital; that is, only if the poor country's human capital exceeds the amount that typically accompanies the low level of per capita income.
I. RESULTSFOR GROWTHRATESOF GDP
Basic Results
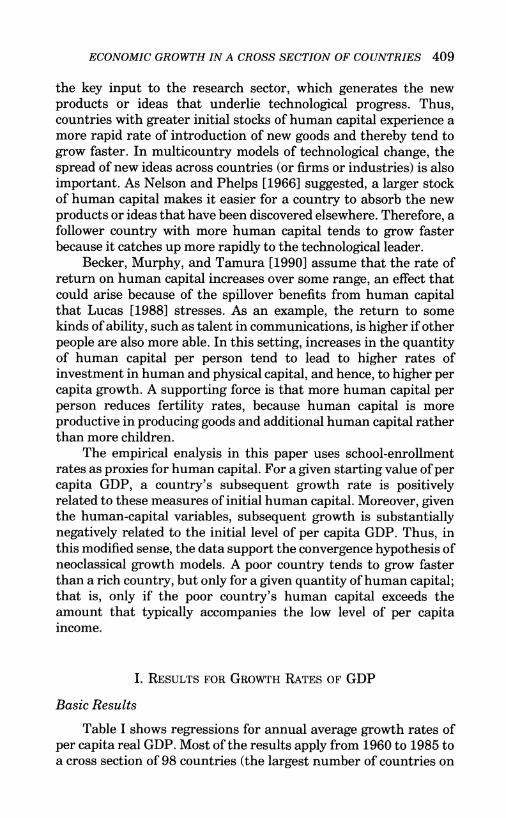
Table I shows regressions for annual average growth rates of per capita real GDP. Most of the results apply from 1960 to 1985 to a cross section of 98 countries (the largest number of countries on
QUARTERLY JOURNAL OF ECONOMICS
m w 6 m G w cow t-r l " 0 w c.10 0 0
cn 1 99 99 1 I7 s
m
-rl
A
% g !Z n 0 !2
m w
- 0 w
5 cnz
m- w s 3 g
*
m w
- 0 wd 2 cn 0
mi? O r -e o1 99
e G cnw c . 1 0 1 99
m sw r l 0 0 99 17 %
+-ism i ? t-e + m 0 0 0 099 99
*6 2 - U5
3g2 P: @ 2
0s 7 3 7 %
c.18 +-isI o w 4 m Im o 4 0
99 997 3
N S m G o w t-r l m o 0 01 99 99 1
7 %
+-i 9 m m m i i o i i 0 0 c.103 r-(0 o o m o c.10 1 1 99 99 990s 0s 0 %
m 8 05;O t - m m m o c.101 99 99 1 I 0 % 0s

ECONOMIC GROWTH IN A CROSS SECTION OF COUNTRIES 411
as w s d G G E 2 g % 2 z g w...&j
ge ge 7; 7; 219 99
lo$ d=i m G 2s 2 g :& 2 d N G- -9 99 99 99 L D * gs ye ge g =
N G N S t-sw 3 cnw m w
5j. O N 4 0 m + N O m G- -9 99 99 99 U ? t : gs ge ge ge Oe
+ s $ 9 5 2N G m a w m d o m + m + m...s 19 99 99 99 i 7' g"7" 7"
-u Q - +=i 0s * s
t-5j *t- Q ) w t-t-W Z * m N O * + d o 0c ' E z 19 99 99 99 LD $ 2- 7g ge ge gzE 8
N G w = i m s 4s mt- corn t - t -
i;j * m N O * d d o Q)...$ 2 7 % 9; 7; 2 /-.0s CnG w s
a m o w o m N N N O m d d o w- -9 99 997s 7" 7" 99 gg 9
m S m i 2 m i 2
s d m 2 g 22 2 z w-?9 99PgP' ;;7; 2
2 rn k0
e k % Z N hg tx
TABLE I (CONTINUED)
(9) (10) (11) (12) (13) (14)
Dep. var. GR7085 GR6085 GR6085 GR6085 GR6085 GR6085
No. obs. 98 98 88 98 98 98 a Const.
GDP60
0.0331 (0.0081)
-0.0092
0.0476 (0.0112)
-0.0082
0.0438 (0.0120)
-0.0078
0.0286 (0.0065)
-0.0069
0.0332 (0.0065)
-0.0075
0.0345 (0.0067)
-0.0068
E!2
(0.0017) (0.0009) (0.0009) (0.0011) (0.0010) (0.0009)
SEC6O 0.0142 0.0281 0.0233 0.0385 0.0303 0.0133 2
PRIM60
(0.0207)
0.0305
(0.0079)
0.0240
(0.0076)
0.0268
(0.0085)
0.0350
(0.0076)
0.0223
(0.0070)
0.0263 $ (0.0125) (0.0057) (0.0058) (0.0077) (0.0058) (0.0060)
SEC7O 0.0209 - - -% h
PRIM70
STTEAPRI
(0.0186)
-0.0096 (0.0097)
-
-
-0.00038 -0.0049
-
-
-
-
-
-
00 2 0
A 0,
(0.00020) (0.00022)
STTEASEC - - 0.00024 - - -(0.00022)
LIT60 - - - -0.0171 - -(0.0087)

ECONOMIC GROWTH IN A CROSS SECTION OF COUNTRIES 413

414 QUARTERLY JOURNAL OF ECONOMICS
which I have been able to assemble data on the variables em- ployed). Because heteroskedasticity could be important across countries, the standard errors for the coefficients are based on White's [I9801 heteroskedasticity-consistent covariance matrix. These standard errors do not differ greatly, however, from those obtained by ordinary least squares. The table also includes regres- sions in which the observations are weighted in accordance with the levels of per capita GDP or population.
The data are from Summers and Heston [1988], the United Nations, the World Bank, Banks's [I9791 data base, and some other sources. Barro and Wolf [I9891 provide details on the data set.4 Means and standard deviations appear in Appendix 1; defini- tions for all variables appear in Appendix 2; and a list of countries is in Appendix 3. For the moment, I shall concentrate on results related to the initial (1960) values of per capita GDP and the human capital proxies. The other variables, discussed later, are not strongly correlated with these variables.
The two main proxies for human capital are the 1960 values of school-enrollment rates at the secondary (SECGO) and primary levels (PRIM60).5 These variables, based on information from the United Nations, measure number of students enrolled in the designated grade levels relative to the total population of the corresponding age group. (Because of this definition it is possible for the values to exceed 1.0.) With these school-enrollment rates (and, less importantly, the other explanatory variables) held constant, the estimated coefficient on starting per capita product, GDPGO, in regression 1of Table I is negative and highly significant: -0.0075, s.e. = 0.0012. Because GDPGO is measured in thousands of 1980 U. S. dollars, the result means that an increase in per capita real GDP by $1,000 lowers the real per capita growth rate (GR6085) by 0.75 percentage points per year.
Figure I1 plots GR6085, net of the value predicted by all explanatory variables except GDPGO, versus GDPGO. That is, the figure shows the partial correlation between GR6085 and GDPGO. In contrast with Figure I, the relationship is now strongly negative:
4. To receive a description of the data set and a data diskette, write to Holger Wolf, National Bureau of Economic Research, 1050 Massachusetts Avenue, Cam- bridge, MA 02138.
5. It would be better to use proxies for the initial stock of human capital per person rather than variables that relate to the flow of investment in human capital. The stock of human capital derived from formal education depends on current and lagged values of school-enrollment rates. In the subsequent discussion I consider effects from lagged values of the school-enrollment variables.

ECONOMIC GROWTH IN A CROSS SECTION OF COUNTRIES 415
FIGUREI1 Partial Association Between per Capita Growth and 1960 GDP per Capita (from
regression 1of Table I)
the correlation is -0.74. Thus, the results indicate that-holding constant a set of variables that includes proxies for starting human capital-higher initial per capita GDP is substantially negatively related to subsequent per capita growth. The sample range of variation in GDPGO (in 1980 U. S. dollars) from $208 to $7,380 "explains" a spread in average per capita growth rates of about five percentage points. (The sample range in per capita growth rates is -0.017 to 0.074, with a mean of 0.022.)
Regression 2 in Table I adds the square of GDP6O; that is, instead of a linear form, the relation between GR6085 and GDPGO is now quadratic. The estimated coefficient of the square term is positive but only marginally significant (t-value = 1.41, and the coefficient on the linear term remains significantly negative (t- value = 3.6). A positive coefficient on the square term means that the force toward convergence (negative relation between growth

416 QUARTERLY JOURNAL OF ECONOMICS
and level) attenuates as per capita GDP rises. The point estimates imply that the relation between growth and level is negative (holding constant the other variables) only if real per capita GDP is less than $10,800. All values for GDPGO in the sample are below this figure, but values for several of the industrialized countries exceeded this amount after 1960. For example, the U. S. real per capita GDP surpassed $10,800 in 1977.=
In the basic neoclassical model-which incorporates diminish- ing returns to capital-the growth rate tends to be inversely related to the absolute level of initial per capita GDP. On the other hand, models that involve the spread of technology or the mobility of factors involve the level of per capita GDP in relation to the levels in other countries. The present cross-section results cannot distinguish between absolute and relative per capita GDP. This distinction would be feasible, in principle, in a study that also exploited the time-series variation in the data. However, one difficulty in this extension is that many of the variables, such as school-enrollment rates, are unavailable in a full time series.
Regressions 1and 2 of Table I indicate that per capita growth is positively related to the proxies for initial human capital, holding fixed GDP6O and the other variables. The estimated coefficients of SEC6O and PRIM60 are individually significantly different from zero, with t-values in regression 1of 3.8 and 4.4, respectively. A joint test for the significance of the two school-enrollment variables leads to the statistic, F2,, = 18.5.
Figure I11 shows the relationship between the per capita growth rate, net of the value predicted by the regressors other than the school-enrollment variables, and a linear combination of SEC6O and PRIMGO. (The variable on the horizontal axis is 0.0305 x SEC6O + 0.0250 x PRIMGO, corresponding to the coeffi- cients estimated in regression 1of Table I.) The partial correlation of GR6085 with the human capital proxy is 0.73, compared with a simple correlation of 0.43. Figure IV shows the simple relation between GR6805 and the human capital measure.
Figure I11 shows that the sample range of the human capital proxy "explains" a range of variation in per capita growth rates of about five percentage points; that is, roughly the same range as
6. For values of GDP6O above $10,800, the quadratic implies a positive relation between level and growth, but the true relation may remain close to zero. That is, the quadratic can be viewed as an approximation to a functional form that asymptotically approaches a zero relation between growth and level, with the relation coming close to zero when real GDP is above about $10,000.

ECONOMIC GROWTH IN A CROSS SECTION OF COUNTRIES 417
FIGUREI11 Partial Association Between per Capita Growth and School-Enrollment Variables
(from regression 1of Table I)
that related to GDPGO in Figure 11. Thus, given the strong positive correlation (0.77) between GDPGO and the human capital measure, the results are consistent with the lack of a simple correlation between GR6085 and GDPGO, as shown in Figure I. Increases in initial GDP per capita that are accompanied by the typical increase in human capital per person are not systematically related to subsequent growth. But increases in initial GDP per capita with human capital held fixed are strongly negatively related to subse- quent growth. Similarly, increases in human capital with GDPGO held fixed are strongly positively related to subsequent growth.
The results can be highlighted by noting three kinds of situations in which an imbalance between GDP per capita and human capital leads to significant effects on subsequent growth rates. Many of the Pacific rim countries have initial (1960) school-enrollment rates that are high relative to those typically

418 QUARTERLY JOURNAL OF ECONOMICS
Per Capita Growth Versus School-Enrollment Variables (0.0305*SEC60 + 0.0250*PRIM60)
associated with the initial value of real GDP per capita. For example, for Japan the value of SEC6O is 0.74, compared with the value of 0.31 that would be predicted from a regression of SECGO on a quadratic function of GDP6O. For Korea and Taiwan the values of PRIM60 are 0.94 and 0.96, respectively, compared with the corresponding predicted values of 0.61 and 0.66. According to regression 1 in Table I, the relatively high values for initial school-enrollment rates raised the estimated growth rates by 0.015 for Japan, 0.014 for Korea, and 0.012 for Taiwan. With this effect included, the fitted value of the growth rate for Japan, 0.057, is close to the actual value of 0.058. For Korea and Taiwan the adjustments are in the right direction but are insufficient to explain the high rates of growth: for Korea the fitted value is 0.037, and the actual is 0.060; whereas for Taiwan the fitted value is 0.041 and the actual is 0.057.
The typical country in sub-Saharan Africa has 1960 school-

ECONOMIC GROWTH IN A CROSS SECTION OF COUNTRIES 419
enrollment rates that are low relative to the values associated with 1960 per capita GDP in the full sample. This pattern likely reflects physical capital from the colonial era that is high in relation to the amount of initial human capital, as well as relatively high quanti- ties of natural resources. For example, the relatively low values for school enrollment reduced the estimated growth rates by 0.012 for Ethiopia (fitted value for growth of 0.001 versus an actual of 0.003), 0.01 1for Sudan (fitted value for growth of -0.003, actual of -0.008), and by 0.011 for Senegal (fitted value for growth of 0.004, actual of 0.000). Given the remaining explanatory power of a dummy variable for Africa, as discussed later, it may be that the present specification does not capture this effect fully.
Finally, the oil-exporting countries typically have high values of GDP6O relative to their 1960 school-enrollment rates. The sample includes six members of OPEC: Algeria, Gabon, Indonesia, Nigeria, Iran, and Vene~uela.~ For Gabon the school-enrollment rates are higher than would be predicted from GDPGO (which helps to explain Gabon's high growth rate), and for Indonesia the discrepancies are small. For the other four oil countries the shortfalls of the school-enrollment rates from the predicted values reduce the estimated growth rate by an average of 0.012. Except for Iran this effect improves the fit for growth rates.
B. Measurement Errors and Related Issues
Romer [I9891 notes that a result such as that shown in Figure I1 would be sensitive to measurement error in GDP. If there is temporary measurement error, future growth rates of GDP will automatically have a negative correlation with the starting level. For this effect to account for the findings, however, measurement error has to be very large, as well as temporary. For example, a 10 percent error in GDP that is corrected over the subsequent 25 years affects the computed annual average growth rate by only -0.004. This value contrasts with the range of variation of about 0.05 that GDPGO appears to explain. For analogous reasons, business-cycle fluctuations in GDP could not explain very much of the results.
If measurement error in GDP were short lived, no serious
7. My earlier study [Barro, 19891deleted the oil countries ,but the inclusion of measures of human capital makes it feasible to incorporate these countries into the sample. The human-capital variables indicate that the oil countries are typically less advanced than would be suggested by the level of per capital GDP.

420 QUARTERLY JOURNAL OF ECONOMICS
estimation problem would arise in the relation between the 1960 level of per capita GDP and, say, the average growth rate of per capita GDP from 1970 to 1985 (GR7085). Regression 3 in Table I shows that the estimated coefficients for GDPGO, SECGO, and PRIM60 are not much affected by this change in the dependent variable. Thus, measurement errors (or business-cycle effects) can be important for the results only if they persist in substantial magnitude over periods longer than ten years.
Regression 4 shows that the conclusions do not change greatly if GDP70 is added along with GDPGO (with the growth rate from 1970 to 1985 as the dependent variable). Although the high correlation (0.98) between GDPGO and GDP70 implies high stan- dard errors, the sum of the two coefficients is close to that for GDPGO in regression 3. The estimated relation between per capita growth and level of per capita GDP also looks similar if GDP70 is entered as a regressor with GDPGO used as an instrument.
Presumably, measurement error in GDP would be proportion- ately more important for the low-income countries. In fact, the squared residuals from regression 1of Table I have a correlation of -0.23 with GDPGO. Regression 5 shows that the estimated coeffi- cient of GDPGO changes little if the sample is restricted to the 54 countries for which GDPGO exceeds $1,000 per capita. Regression 6 shows that the results also do not change greatly if the observa- tions are weighted by the square root of GDPGO (which is appropri- ate if the variance of the error term is proportional to the reciprocal of GDPGO). Regression 7 indicates similar findings when the weight is the square root of population (where population is measured at the midpoint of the sample for each country). This standard weighting scheme is appropriate if the variance of the error term is proportional to the reciprocal of population.' The correlation of the square of the residuals from regression 1with population, however, is only -0.12.
C. Other Measures of Human Capital
One problem with the previous results is that the 1960 school-enrollment rates could be proxying for the flow of invest- ment in human capital, rather than for the initial stock. The
8. This weighting scheme would arise if the growth rate of per capita GDP were an average of independent values for each person in the population. As many people have noted, this view is an uninteresting theory of the error term, because the error would likely vanish in the mean of several million independent observations. If the error term relates to common aggregate forces or to model specification, then the error variance need not be closely related to population.

ECONOMIC GROWTH IN A CROSS SECTION OF COUNTRIES 421
positive effects of PRIM60 and SEC6O on GR6085 could then reflect a favorable situation that shows up in high investment in human capital as well as in rapid growth of GDP. That is, the causation need not be simply in the direction from a high initial stock of human capital to a high subsequent rate of growth of output.
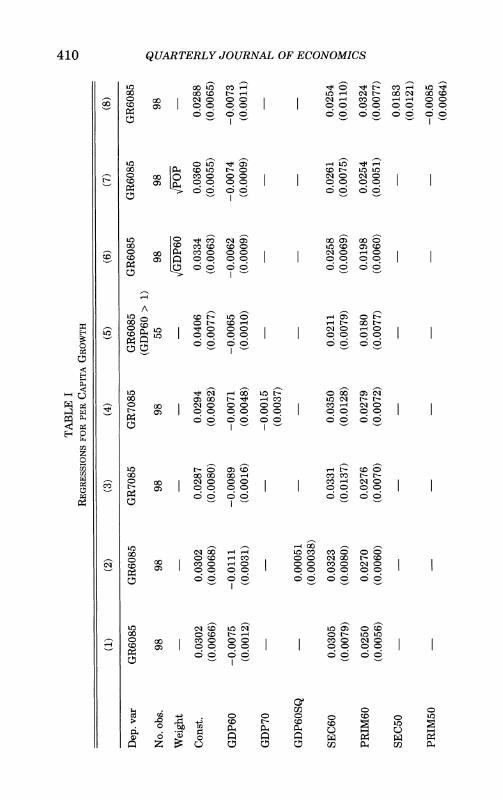
Regression 8 of Table I attempts to assess the direction of causation between human capital and economic growth by adding the 1950 values of the school-enrollment rates, SEC50 and PRIM50, to a regression for GR6085. Given the values of SEC6O and PRIMGO, the 1950 values would reflect differences in the stock of human capital in 1960. Although the point estimate for SEC50 in regression 8 is positive, neither of the 1950 schooling variables are statistically significant. Because the estimated coefficients for SEC6O and PRIM60 remain significantly positive, the results cannot be attributed to the high correlation (0.83 for secondary and 0.86 for primary) between the enrollment-rate variables for 1950 and 1960.
A possible explanation for the results is that the U. N. data for 1950 are less accurate than those for 1960 and later years. Some support for this view comes from regression 9, which includes enrollment rates for 1960 and 1970 in a regression for the growth rate from 1970 to 1985 (GR7085). For the primary-school vari- ables, PRIM60 is significantly positive, whereas PRIM70 is insignif- icant. This finding supports the idea that the primary-school enrollment rate (for 1960) is proxying for the initial stock of human capital (in 1970) rather than for the flow of investment in human capital. Neither of the secondary-school variables are separately significant in regression 9 because of the high correlation (0.94) between SEC6O and SEC70. (The correlation between PRIM60 and PRIM70 is only 0.84.)
As an attempt to measure differences in the quality of educa- tion across countries, I used data on student-teacher ratios in the initial year, 1960. Regression 10 shows that the ratio for primary schools (STTEAPRI) has a negative relation ( t - value = 1.9) with economic growth (GR6085). This finding accords with the idea that a higher student-teacher ratio signals lower quality education and hence, a lower initial stock of human capital. Student-teacher ratios for secondary schools in 1960 were available for only 88 of the 98 countries. Regression 11shows that the estimated coeffi- cient of this variable (STTEASEC) differs insignificantly from zero.
Regression 12 uses the human-capital proxy employed by Romer [19891-the 1960 adult literacy rate (LITGO). With the

422 QUARTERLY JOURNAL. OF ECONOMICS
school-enrollment rates entered, the estimated coefficient of LIT60 is negative (t - value = 2.0), a result that is difficult to interpret. (If the school-enrollment variables are excluded, the coefficient of LIT60 is significantly positive.) The literacy rate is attractive in that it relates to the stock of human capital rather than to the flow of investment. On the other hand, literacy rates appear to be measured in an inconsistent way across countries, and are particu- larly inaccurate for the less developed countries. The school- enrollment rates, although not immune to measurement problems, are likely to be more accurate and more consistent cross sectionally.
Some theories in which the initial values of human capital and per capita GDP matter for subsequent growth rates also suggest relations with physical investment and fertility. In endogenous- growth models, such as Rebelo [I9901 and Barro [1990], per capita growth and the investment ratio tend to move together. For example, an exogenous improvement in productivity tends to raise the growth rate and the investment ratio. In models that include human capital, such as Romer [I9901 and Becker, Murphy, and Tamura [19901, an increase in the initial stock of human capital tends to raise the ratio of physical investment to GDP.
In growth models with endogenous fertility, such as Barro and Becker [I9891 and Becker, Murphy, and Tamura [19901, per capita growth and net fertility tend to move inversely. For example, a higher initial stock of human capital leads to higher growth and lower fertility. The effect on fertility involves an increase in the value of parents' time and thereby a rise in the cost of raising children. More generally, any change that increases the cost of raising children tends to reduce fertility and to increase desired saving per person. In effect, people shift from saving in the form of children to saving in the form of physical and human capital. The increase in desired saving raises the per capita growth rate in models of endogenous g r ~ w t h . ~
Table I1 shows results for fertility. The variable FERT is the average of the 1965 and 1985 values of the World Bank's estimate
9. A shift in the degree of altruism tends to move fertility and desired saving in the same direction. Thus, this kind of disturbance generates a positive association between fertility and per capita growth. The overall association between fertility and growth would be negative if the parameters that govern altruism are stable relative to those that determine the costs of having children.

ECONOMIC GROWTH IN A CROSS SECTION OF COUNTRIES 423
TABLE I1 REGRESSIONSFOR FERTILITY
(15) (16) (17) (18) (19)
Dep. var. Const.
FERTNET 6.08
(0.35)
FERT 5.38
(0.62)
FERTNET 5.35
(0.56)
GPOP6085 0.0326
(0.0034)
FERTNET 5.92
(0.37)
REV -0.13 -0.31 -0.25 -0.0015 -0.24 (0.32) (0.34) (0.31) (0.0025) (0.33)
ASSASS 1.45 1.65 1.61 0.0065 0.95 (0.55) (0.57) (0.55) (0.0051) (0.60)
AFRICA - - - 0.43 (0.23)
LAT. AMER. - - - - 0.49) (0.21)
Notes. Each regression has 98 observations. See Appendix 2 for definitions of variables. See the notes to Table I for addit~ond ~nformation.
of the total fertility rate (the projected average number of live births for a typical woman over her lifetime). FERTNET is FERT x (1- MORT04)' where MORT04 is the average of the 1965 and 1985 values of the World Bank's figures on mortality rates for children aged zero through four. Thus, FERTNET is the per woman number of children who will live beyond the age of four.
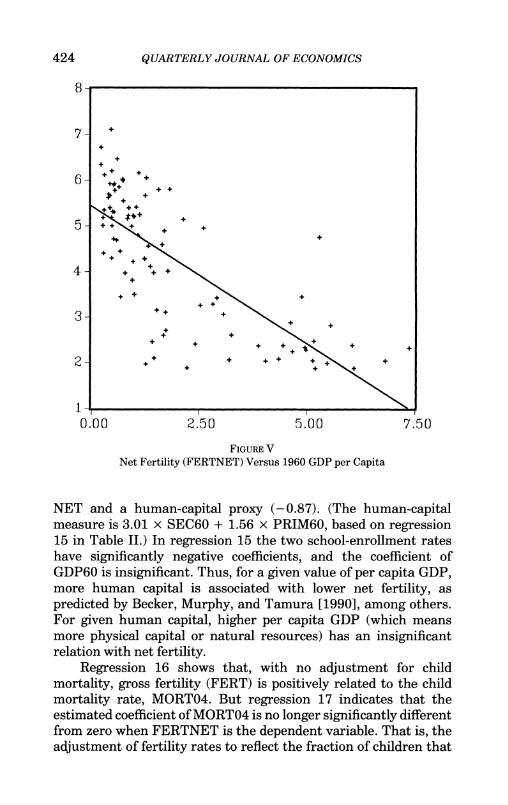
Figures V and VI show the strongly negative simple correla- tions between FERTNET and GDP6O (- 0.74) and between FERT-
424 QUARTERLY JOURNAL OF ECONOMICS
FIGUREV Net Fertility (FERTNET)Versus 1960 GDP per Capita
NET and a human-capital proxy (-0.87). (The human-capital measure is 3.01 x SEC6O + 1.56 x PRIMGO, based on regression 15 in Table 11.) In regression 15 the two school-enrollment rates have significantly negative coefficients, and the coefficient of GDP6O is insignificant. Thus, for a given value of per capita GDP, more human capital is associated with lower net fertility, as predicted by Becker, Murphy, and Tamura [19901, among others. For given human capital, higher per capita GDP (which means more physical capital or natural resources) has an insignificant relation with net fertility.
Regression 16 shows that, with no adjustment for child mortality, gross fertility (FERT) is positively related to the child mortality rate, MORT04. But regression 17 indicates that the estimated coefficient of MORT04 is no longer significantly different from zero when FERTNET is the dependent variable. That is, the adjustment of fertility rates to reflect the fraction of children that

ECONOMIC GROWTH IN A CROSS SECTION OF COUNTRIES 425
FIGUREVI Net Fertility (FERTNET) Versus School-Enrollment Variables
(3.01*SEC60 + 1.56*PRIM60)
do not survive past the age of four is sufficient to account for most of the positive relation between gross fertility and child mortality. (From the standpoint of the costs of raising surviving children, one would predict, if anything, a negative relation between MORT04 and FERTNET.) Regression 18 shows that the population growth rate (averaged for each country from 1960 to 1985) relates to GDP6O and the human capital variables in a way consistent with the findings for fertility rates.
Table I11 contains results for ratios of real physical investment to real GDP. Regressions 20 and 21 refer to private investment (i Privly), and regressions 22 and 23 to the total of private and public investment (ily). The figures on ily come from Summers and Heston [19881; note that these values reflect variations across countries in the ratio of the investment deflator to the GDP deflator. Values for iPTiVly equal ily less estimates of the ratio of real

426 QUARTERLY JOURNAL OF ECONOMICS
public investment to real GDP. (Figures on nominal public invest- ment were divided by the Summers and Heston deflators for total investment, and were then divided by real GDP; this procedure is appropriate if the deflators for total investment are reasonable approximations to the deflators for public investment.) Values for public investment at the level of consolidated general government (but excluding most government enterprises) were found only for the 1970-1985 period, and only for 76 countries. Therefore, zPTivlyis an average of values from 1970 to 1985 for this limited sample.
The simple correlations of iPTivlyare 0.42 with GDP6O and 0.64 with a human-capital proxy (0.131 x SEC6O + 0.079 x PRIMGO, based on regression 20 of Table 111); see Figures VII and VIII. With GDPGO and the school-enrollment variables entered together, as in
TABLE I11 REGRESSIONSFOR INVESTMENTRATIOS
Dep. var. ily No. obs. 98 Const. 0.158
(0.026) -0.0034 (0.0044) 0.139
(0.047) 0.104
(0.021) -0.04 (0.10)
REV -0.049 (0.020) 0.015
(0.042) 0.044
(0.025) -0.098 (0.021)
AFRICA 0.022 (0.017)
LAT. AMER. -0.020 (0.012) 0.65 0.049
Notes. See Appendix 2 for definitions of variables. See the notes to Table I for additional information

ECONOMIC GROWTH IN A CROSS SECTION OF COUNTRIES 427
regression 20 of Table 111, the estimated coefficients of SEC6O and PRIM60 are significantly positive, and that on GDPGO is signifi- cantly negative. The positive effect of initial human capital on physical investment accords with some theoretical results that were discussed before. The negative partial association between iP"'ly and GDP6O is consistent with the convergence implication of the neoclassical growth model.
Regression 22 shows results for ily. (This variable is measured over the period 1960 to 1985, but the main difference from regression 20 is the shift from private to total investment, and not the change in the averaging interval for the dependent variable.) The results for total investment are broadly similar to those for private investment, but the estimated coefficient on GDP6O is smaller in magnitude.
The results in Tables 1-111 treat per capita growth, fertility, and investment as endogenous variables that are jointly deter-
FIGUREVII Ratio of Private Investment to GDP Versus 1960 GDP per Capita

428 QUARTERLY JOURNAL OF ECONOMICS
FIGUREVIII Ratio of Private Investment to GDP Versus School-Enrollment Variables
(0.131*SEC60 + 0.079*PRIM60)
mined by the right-hand-side variables (although the exogeneity of some of the explanatory variables can surely be questioned). The theories of endogenous growth and fertility that were discussed before predict that the residuals from the equations for GR6085 and ily (or GR6085 and iP""ly) would be positively correlated, whereas those for GR6085 and FERTNET would be negatively correlated (however, see footnote 9). The results shown in Tables 1-111 accord with this pattern. For example, using regression 1for GR6085, regression 22 for ily, and regression 15 for FERTNET, the correlation of residuals is 0.32 between GR6085 and ily and -0.26 between GR6085 and FERTNET. Using regression 20 for iPTiVly,the correlation of the residuals for GR6085 and i P"vly (for 76 countries) is 0.40.
Another way to bring out these patterns is to consider regressions for per capita growth in which an investment ratio and

ECONOMIC GROWTH IN A CROSS SECTION OF COUNTRIES 429
TABLE IV INTERACTIONSBETWEENGROWTHAND INVESTMENT
(24) (25) (26) (27) (28) (29)
No. obs. Const.
GDP6O
SEC6O
PRIM60
g 'IY
REV
ASSASS
PPIGODEV
ily
ily (70-85) FERTNET
g'ly
g'li
AFRICA
LAT.AMER.
R" 6
net fertility are included as regressors. Regression 24 of Table IV shows that the estimated coefficient of ily is significantly positive: 0.068, s.e. = 0.032. With FERTNET added in regression 25, the estimated coefficient of ily is still significantly positive, and that for FERTNET is significantly negative: -0.0043, s.e. = 0.0014.
Even with ily and PERTNET held constant, the coefficient of GDP6O in regression 25 (-0.0077, s.e. = 0.0009) is about the same

430 QUARTERLY JOURNAL OF ECONOMICS
as that in regression 1of Table I. Therefore, the negative effect of the level of per capita GDP on the subsequent growth rate does not work very much through effects on investment and net fertility (see regressions 22 and 15). The main channel appears to be a lower rate of return on investment. On the other hand, the estimated coefficients on the school-enrollment variables in regression 25 are much smaller than those in regression 1.Thus, the positive effects of the school-enrollment rates on GR6085 in regression 1reflect partly the positive relation between school enrollment and ily (regression 22 in Table 111) and the negative relation between school enrollment and FERTNET (regression 15 in Table 11).
A. Government Expenditures
In previous analyses [Barro, 1989,19901 I found that the ratio of real government consumption expenditure to real GDP (gcly) had a negative association with growth and investment. The argument was that government consumption had no direct effect on private productivity (or private property rights), but lowered saving and growth through the distorting effects from taxation or government-expenditure programs. Government consumption is measured by the Summers and Heston 119881 figures on the ratio of real government consumption purchases to real GDP, less estimates of the ratio of nominal government spending on educa- tion and defense to nominal GDP. The idea is that expenditures on education and defense are more like public investment than public consumption; in particular, these expenditures are likely to affect private-sector productivity or property rights, which matter for private investment. I used nominal ratios for education and defense because deflators were unavailable. Because the numbers on education and defense are averages for 1970-1985, the data on gcly are averages over this period.
The results in Table I indicate a significantly negative associa- tion between gcly and growth; for example, in regression 1 the estimated coefficient is -0.12, s.e. = 0.03.1° Figure IX shows the
10. If entered separately, the ratios to GDP of government expenditures on education and defense are each insignificant in an equation for per capita growth. These types of results were discussed in Barro [1989].

ECONOMIC GROWTH IN A CROSS SECTION OF COUNTRIES 431
FIGUREM Partial Association Between per Capita Growth and gc/y
(from regression 1of Table I)
nature of this relationship: the variable on the vertical axis is the per capita growth rate net of the fitted value obtained from all regressors other than gcly. Table I11 shows that gcly also has a negative association with private investment; the estimated coeffi- cient in regression 20 is -0.24, s.e. = 0.12. Regression 22 shows, however, that the relation with total investment is insignificant (-0.02, s.e. = 0.11).
A negative effect of gcly on investment is one route whereby more government could reduce growth. Even with the investment ratio held constant, however, the relation between gcly and growth is significantly negative. For example, in regression 24 of Table IV, which holds constant ily, the estimated coefficient on g7y is -0.12, s.e. = 0.03.
Regression 26 of Table IV includes the public investment ratio

432 QUARTERLY JOURNAL OF ECONOMICS
gyy as an explanatory variable. The estimated coefficient, 0.13, s.e. = 0.10, is positive, but insignificantly different from zero. I discussed this variable in my earlier empirical study [Barro, 19891 and mentioned some difficulties in interpreting the estimated coefficient in terms of the marginal product of public services. In any event, regression 27 shows that public investment plays no special role if the total investment ratio ily (for 1970-1985) is also included as a regressor. Given ily, which includes public invest- ment one-to-one with private investment, the estimated coefficient on gily is essentially zero. Similarly, regression 28 shows that the estimated coefficient of the ratio of public to total investment, gili, differs insignificantly from zero.
B. Political Instability
I included two variables from Banks's [I9791 data set to measure political instability. The variable REV is the number of revolutions and coups per year, and the variable ASSASS is the number per million population of political assassinations per year. Each of these variables is significantly negative for growth in Table I. The variable REV is also significantly negative for the invest- ment ratios in Table 111, and ASSASS is significantly negative in regression 20 of that table."
I interpret the REV and ASSASS variables as adverse influ- ences on property rights, and thereby as negative influences on investment and growth. Regression 25 of Table IV shows, however, that the coefficients on REV and ASSASS are still negative for growth when ily and FERTNET are held constant. I t is possible that these results reflect a positive influence of growth on political stability, rather than (or in addition to) the effects of stability on growth. Londregan and Poole [I9891 do, in fact, attach this reverse interpretation to the negative association that they find between economic growth and the frequency of coups.
C. Economic System
Gastil [I9871 divided countries into economic systems with respect to the role of government. I used this breakdown to
11. With these political instability variables and the school-enrollment rates included, Gastil's [I9871 ordinal indices of political rights or civil liberties are insignificant for growth, fertility, or investment. My earlier study [Barro, 19891 included the index of political stability as an explanatory variable.

ECONOMIC GROWTH IN A CROSS SECTION OF COUNTRIES 433
construct a three-way division into primarily socialist, mixed between socialist and free enterprise, and primarily free enterprise. The estimated coefficient on the dummy variable for socialist (SOC) is negative on growth in regression 13 of Table I (t- value = 1.81, and that for mixed systems (MIXED) is essentially zero. Because the division of economic systems into groups is subjective and because there are only nine "socialist" countries in the sample (which excludes the eastern European countries), these results are not very reliable.
D. Market Distortions
It is often argued that distortions of market prices impact negatively on economic growth (see, for example, Agarwala [19831). Because of the intimate connection between investment and growth, such market interferences would be especially important if they apply to capital goods. As an attempt to quantify these types of market distortions for a large sample of countries, I considered the purchasing-power-parity (PPP) numbers for investment goods that were computed by Summers and Heston [19881.
It is well-known (for example, from Balassa [1964]) that PPP ratios calculated with broad price indices, such as GDP deflators or consumer price indices, are systematically related to the level of economic development and perhaps to the presence of natural resources and other variables. Figure X shows the significantly positive relation for the 98 countries between the 1960 PPP ratio based on the GDP deflator (PPPYGO) and GDPGO. This relation presumably reflects the relatively low prices of services and some other nontraded goods in low-income countries. On the other hand, Figure XI indicates the absence of a regular relationship between the 1960 PPP ratio based on the investment deflator (PPPIGO) and GDPGO. To proxy for market distortions, I would have filtered out the normal relation of PPPIGO to variables such as the level of income. But, given the absence of a systematic relation in Figure XI, I calculated just the magnitude of the deviation of PPPIGO from the sample mean. In this view, either artificially high investment prices or artificially low investment prices proxy for distortions.
The regressions in Table I indicate a significantly negative relation between growth and the magnitude of the PPPIGO devia- tion (denoted PPIGODEV); the estimated coefficient in regression 1 is -0.014, s.e. = 0.005. This result implies that a one-standard- error (0.25) increase in the magnitude of PPPIGO is associated with

434 QUARTERLY JOURNAL OF ECONOMICS
FIGURE X 1960 PPPRatio for GDP Deflator (U. S.= 1.0) Versus 1960 GDP per Capita
a reduction in the per capita growth rate by four tenths of a percentage point. On the other hand, the sign of the deviation does not seem to matter; if the algebraic value for purchasing-power parity, PPPIGO, is added to the equation, its estimated coefficient is insignificant (-0.001, s.e. = 0.005), and that on PPIGODEV re- mains significant (-0.014, s.e. = 0.007). Not surprisingly, the results in Table I11 indicate that the algebraic value, PPPIGO, matters negatively for the investment ratios. (This relationship could be induced, however, from measurement error in the invest- ment price deflators.)
These results on the relation of growth and investment to market distortions are preliminary. I plan to look further into alternative measures of price distortions, including the indices of effective protection in manufacturing and agriculture that Agar-wala [I9831 compiled for a limited sample of countries.

ECONOMIC GROWTH IN A CROSS SECTION OF COUNTRIES 435
FIGUREXI 1960 PPP Ratio for Investment Deflator (U.S. = 1.0) Versus 1960 GDP per Capita
E. Africa and Latin America
A common view is that countries in Africa or Latin America have poorer growth performances than other countries. Of course, if the nature of being in Africa or Latin America is already held constant by the other explanatory variables, continent dummies would be insignificant in equations for growth, fertility, and investment. Thus, the finding of significant coefficients on these dummies indicates that some regularities are missing from the model.
The dummy variable AFRICA equals one for countries in sub-Saharan Africa, and the dummy variable LAT.AMER. equals one for countries in South and Central America, including Mexico. The estimated coefficient on AFRICA is significantly negative for GR6085 (Table I, regression 14) and significantly positive for FERTNET (Table 11, regression 19). Although the point estimates

436 QUARTERLY JOURNAL OF ECONOMICS
are positive, the estimated coefficients for the investment ratios differ insignificantly from zero (Table 111, regressions 21 and 23). Holding fixed ily and FERTNET in regression 29 of Table IV, the estimated coefficient of AFRICA in a growth equation is still significantly negative, with a magnitude of about one percentage point per year. Thus, there appear to be adverse effects on growth from being in sub-Saharan Africa, and these effects do not result from the unexplained behavior of the investment ratio or fertility.
The variable LATAMER. is significantly negative for GR6085 (Table I, regression 14) and significantly positive for FERTNET (Table 11, regression 19). For the investment ratios the point estimates of the coefficients are negative, but not statistically significant a t the 5 percent level (t-value of 1.3 for iPri'ly in regression 21 of Table I11 and t-value of 1.6 for ily in regression 23). Again, the negative effect on growth-with a magnitude of about one percentage point per year-appears even when ily and FERT- NET are held constant (Table IV, regression 29). Thus, it appears that something is also missing to explain the typically weak growth performance in Latin America.
Note from a comparison of regressions 1and 14 of Table I that one effect from the inclusion of the AFRICA and LAT.AMER. dummies is a reduction in the estimated coefficient of SEC6O in the equation for GR6085 from 0.0305, s.e. = 0.0079, to 0.0133, s.e. =
0.0070 (see also regressions 25 and 29 in Table IV). The average value of SEC6O for sub-Saharan Africa is well below the sample mean (0.04 versus 0.23); whereas that for Latin America (0.19) is slightly below the sample mean.'' The variables SEC6O and PRIM60 are imperfect proxies for the level of human capital, which is especially low in Africa. But, since these proxies are imperfect, it may be that continent dummies-especially the one for Africa- retain some explanatory power for human capital and hence for the rate of economic growth. If this interpretation is correct, a better proxy for human capital would eliminate the AFRICA dummy as a significant influence on growth. However, the variables considered before-student-teacher ratios, prior values of school-enrollment rates, and the adult literacy rate--do not eliminate AFRICA as a significant variable.
12. For PRIMGO, the means are 0.50 for Africa, 0.85 for Latin America, and 0.78 for the overall sample.

ECONOMIC GROWTH IN A CROSS SECTION OF COUNTRIES 437
Using recent theories of economic growth as a guide, this study brings out some empirical regularities about growth, fertility, and investment for 98 countries in the period 1960-1985. Although the simple correlation between per capita growth (1960-1985) and the initial (1960) level of per capita GDP is close to zero, the correlation becomes substantially negative if measures of initial human capital (proxied by school-enrollment rates) are held constant. Moreover, given the level of initial per capita GDP, the growth rate is substantially positively related to the starting amount of human capital. Thus, poor countries tend to catch up with rich countries if the poor countries have high human capital per person (in relation to their level of per capita GDP), but not otherwise. As a related matter, countries with high human capital have low fertility rates and high ratios of physical investment to GDP.
Per capita growth and the ratio of private investment to GDP are negatively related to the ratio of government consumption expenditure to GDP. An interpretation is that government con- sumption introduces distortions, such as high tax rates, but does not provide an offsetting stimulus to investment and growth. On the other hand, there is little relation of growth to the quantity of public investment.
Measures of political instability (proxied by figures on revolu- tions, coups, and political assassinations) are inversely related to growth and investment. These relations could involve the adverse effects of political instability on property rights and the linkage between property rights and private investment. The correlation could, however, also reflect a political response to bad economic outcomes.
A proxy for price distortions (based on purchasing-power parity numbers for investment deflators) is negatively related to growth. These results are preliminary but do suggest a payoff to further research on the interplay between economic growth and government-induced distortions of markets.
Finally, the results leave unexplained a good deal of the relatively weak growth performances of countries in sub-Saharan Africa and Latin America. That is, the analysis does not fully capture the characteristics of the typical country on these conti- nents that lead to below-average economic growth.

- -
QUARTERLY JOURNAL OF ECONOMICS
APPENDIX1:MEANSAND STANDARD OF VARIABLESDEVIATIONS
98-country sample 76-country sample
Variable Mean u Mean u
GR6085 0.022 0.019 0.024 0.018 GR7085 0.016 0.023 0.019 0.022 GDP60 ($1,000) 1.92 1.81 2.21 1.89 GDP85 ($1,000) 3.74 3.59 4.34 3.69 i/y 0.190 0.078 0.205 0.076 ily (70-85) 0.196 0.078 0.209 0.076 ipr'""ly - - 0.176 0.069
g'ly - - 0.033 0.017
g 'li 0.164 0.076 g 'ly 0.107 0.053 0.106 0.053 FERT 4.70 1.80 4.39 1.79 MORT04 0.087 0.061 0.074 0.057 FERTNET 4.20 1.42 3.98 1.43 GPOP6085 0.0205 0.0098 0.0194 0.0100 POP (mill.) 24.6 63.8 26.2 70.5 SEC50" 0.10 0.14 0.13 0.15 SEC6O 0.23 0.21 0.27 0.22 SEC85b 0.53 0.29 0.59 0.28 PRIM50' 0.65 0.39 0.73 0.36 PRIM60 0.78 0.31 0.85 0.27 PRIM85 0.96 0.19 0.98 0.16 STTE APRI 36.5 9.4 34.9 8.4 STTEASECd 19.6 6.9 19.5 7.2 LIT60 0.56 0.33 0.63 0.30 REV 0.18 0.23 0.16 0.23 ASSASS 0.031 0.086 0.036 0.096 SOC (dummy) 0.092 0.290 0.039 0.196 MIXED (dummy) 0.480 0.502 0.500 0.503 PPPI60 0.75 0.34 0.74 0.37 PPIGODEV 0.23 0.25 0.24 0.28 PPPY60 0.57 0.18 0.60 0.18 AFRICA (dummy) 0.276 0.449 0.197 0.401 LAT. AMER. (dummy) 0.235 0.426 0.250 0.436
a Samples of 95 and 74 countries, respectively. b. Samples of 97 and 75 countries, respectively. c. Samples of 97 and 76 countries, respectively. d. Samples of 88 and 69 countries, respectively.

APPENDIX2: DEFINITIONS IN TABLES ANDOF VARIABLES I-IV APPENDIX1(see Barro and Wolf [I9891 for details)
GR6085 (GR7085): Growth rate of real per capita GDP from 1960 to 1985 (1970 to 1985).
GDPGO (GDP70, GDP85): 1960 (1970, 1985) value of real per capita GDP (1980 base year).
GDPGOSQ: Square of GDPGO. ily (ily, 70-85): Average from 1960 to 1985 (1970 to 1985) of the
ratio of real domestic investment (private plus public) to real GDP.
iP""/y: Average from 1970 to 1985 of the ratio of real private domestic investment to real GDP.
gl/y: Average from 1970 to 1985 of the ratio of real public domestic investment to real GDP.
g7i: Average from 1970 to 1985 of the ratio of real public domestic investment to real domestic investment (private plus public).
gc/y: Average from 1970 to 1985 of the ratio of real government consumption (exclusive of defense and education) to real GDP.
FERT: Total fertility rate (children per woman), average of 1965 and 1985.
MORT04: Mortality rate for age 0 through 4, average of 1965 and 1985.
FERTNET: FERT x (1- MORT04). GPOP6085: Growth rate of population from 1960 to 1985. POP: Population in millions (geometric average of values from
1960 and 1985). SEC50 (SECGO, SEC85): 1950 (1960, 1985) secondary-school
enrollment rate. PRIM50 (PRIMGO, PRIM85): 1950 (1960, 1985) primary-school
enrollment rate. STTEAPRI (STTEASEC): Student-teacher ratio in primary (sec-
ondary) schools in 1960. LITGO: Adult literacy rate in 1960. REV: Number of revolutions and coups per year (1960-1985 or
subsample). ASSASS: Number of assassinations per million population per year
(1960-1985 or subsample). SOC: Dummy variable for socialist economic system. MIXED: Dummy variable for mixed free enterprise/socialistic
economic system. PPPI6O: 1960 PPP value for the investment deflator (U. S. = 1.0). PPIGODEV: Magnitude of the deviation of PPPIGO from the sample
mean. PPPYGO: 1960 PPP value for the GDP deflator (U. S. = 1.0). AFRICA: Dummy variable for sub-Saharan Africa. LAT. AMER.: Dummy variable for Latin America.

QUARTERLY JOURNAL OF ECONOMICS
APPENDIX3: LISTOF COUNTRIESIN SAMPLES
Missing from ID number Country 76-country sample (*)
Algeria Botswana Burundi Cameroon Central African Republic
Egypt Ethiopia Gabon Ghana Ivory Coast
Kenya Liberia Madagascar Malawi Mauritius
Morocco Nigeria Rwanda Senegal Sierra Leone
South Africa Sudan Swaziland Tanzania Togo
Tunisia Uganda Zaire Zambia Zimbabwe
Bangladesh Burma Hong Kong India Iran

ECONOMIC GROWTH IN A CROSS SECTION OF COUNTRIES 441
APPENDIX3: (Continued)
ID number Country Missing from
76-country sample (*)
Israel Japan Jordan Korea (South) Malaysia
Nepal Pakistan Philippines Singapore Sri Lanka
Taiwan Thailand Austria Belgium Cyprus
Denmark Finland France Germany (West) Greece
Iceland Ireland Italy Luxembourg Malta
Netherlands Norway Portugal Spain Sweden
Switzerland Turkey United Kingdom Barbados Canada
Costa Rica Dominican Republic El Salvador Guatemala Haiti
QUARTERLY JOURNAL OF ECONOMICS
APPENDIX3: (Continued)
ID number Country Missing from
76-country sample (*)
Honduras Jamaica Mexico Nicaragua Panama
Trinidad and Tobago United States Argentina Bolivia Brazil
Chile Colombia Ecuador Guyana Paraguay
Peru Uruguay Venezuela Australia Fiji
New Zealand Papua New Guinea Indonesia
ECONOMIC GROWTH IN A CROSS SECTION OF COUNTRIES 443
REFERENCES Agarwala, Ramgopal, "Price Distortions and Growth in Developing Countries,"
World Bank staffworking papers, No. 575, July 1983. Balassa, Bela A,, "The Purchasing-Power Parity Doctrine: a Reappraisal," Journal
ofPolitical Economy, LXXII (19641, 584-96. Banks, Arthur S., "Cross-National Time-Series Data Archive," Center for Social
Analysis, State University of New York at Binghamton, September 1979. Barro, Robert J., "A Cross-Country Study of Growth, Saving, and Government,"
National Bureau of Economic Research, working paper No. 2855, February 1989.
, "Government Spending in a Simple Model of Endogenous Growth," Journal ofPolitical Economy, XCVIII (19901, S103-25.
, and Gary S. Becker, "Fertility Choice in a Model of Economic Growth," Econometrica, LVII (1989), 481-501.
, and Xavier Sala i Martin, "Economic Growth and Convergence across the United States," National Bureau of Economic Research, working paper, July 1990.
, and , "The Neoclassical Growth Model," Chapter 1 of unpublished manuscript, 1991.
, and Holger C. Wolf, "Data Appendix for Economic Growth in a Cross Section of Countries," unpublished, National Bureau of Economic Research, Novem- ber 1989.
Becker, Gary S, Kevin M. Murphy, and Robert Tamura, "Human Capital, Fertility, and Economic Growth," Journal ofPolitical Economy, XCVIII (1990),S12-37.
Cass, David, "Optimum Growth in an Aggregative Model of Capital Accumulation," Review of Economic Studies XXXII (19651,23340.
Gastil, Raymond D., Freedom in the World (Westport, CT: Greenwood Press, 1987). Koopmans, Tjalling C., "On the Concept of Optimal Economic Growth," in The
Econometric Approach to Development Planning (Amsterdam: North-Holland, 1 Qfi.5)&-"-,.
Londregan, John B., and Keith T. Poole, "Coups d'Etat and the Military Business Cycle," working paper No. 36-88-89, Carnegie Mellon University, March 1989.
Lucas, Robert E., Jr., "On the Mechanics of Development Planning," Journal of Monetary Economics, XXII (19881, 3-42.
Nelson, Richard R., and Edmund S. Phelps, "Investment in Humans, Technological Diffusion, and Economic Growth," American Economic Review Proceedings, LVI (1966), 69-75.
Rebelo, Sergio, "Long Run Policy Analysis and Long Run Growth," National Bureau of Economic Research, working paper No. 3325, April 1990.
Romer, Paul M., "Human Capital and Growth," presented at the Carnegie- Rochester Conference on Economic Policy, Rochester, NY, April 1989.
, "Endogenous Technological Change," Journal of Political Economy, XCVIII (1990), S71-S102.
Solow, Robert M., "A Contribution to the Theory of Economic Growth," Quarterly Journal of Economics, LXX (19561,65-94.
Summers, Robert, and Alan Heston, "A New Set of International Comparisons of Real Product and Price Levels: Estimates for 130 Countries," Review oflncome and Wealth, XXXIV (19881, 1-25.
White, Halbert L., "A Heteroskedasticity-Consistent Covariance Matrix Estimator and a Direct Test for Heteroskedasticity," Econometrica, XLVIII (1980), 817-38.

You have printed the following article:
Economic Growth in a Cross Section of CountriesRobert J. BarroThe Quarterly Journal of Economics, Vol. 106, No. 2. (May, 1991), pp. 407-443.Stable URL:
http://links.jstor.org/sici?sici=0033-5533%28199105%29106%3A2%3C407%3AEGIACS%3E2.0.CO%3B2-C
This article references the following linked citations. If you are trying to access articles from anoff-campus location, you may be required to first logon via your library web site to access JSTOR. Pleasevisit your library's website or contact a librarian to learn about options for remote access to JSTOR.
[Footnotes]
2 Optimum Growth in an Aggregative Model of Capital AccumulationDavid CassThe Review of Economic Studies, Vol. 32, No. 3. (Jul., 1965), pp. 233-240.Stable URL:
http://links.jstor.org/sici?sici=0034-6527%28196507%2932%3A3%3C233%3AOGIAAM%3E2.0.CO%3B2-H
References
The Purchasing-Power Parity Doctrine: A ReappraisalBela BalassaThe Journal of Political Economy, Vol. 72, No. 6. (Dec., 1964), pp. 584-596.Stable URL:
http://links.jstor.org/sici?sici=0022-3808%28196412%2972%3A6%3C584%3ATPPDAR%3E2.0.CO%3B2-T
Government Spending in a Simple Model of Endogeneous GrowthRobert J. BarroThe Journal of Political Economy, Vol. 98, No. 5, Part 2: The Problem of Development: AConference of the Institute for the Study of Free Enterprise Systems. (Oct., 1990), pp. S103-S125.Stable URL:
http://links.jstor.org/sici?sici=0022-3808%28199010%2998%3A5%3CS103%3AGSIASM%3E2.0.CO%3B2-T
http://www.jstor.org
LINKED CITATIONS- Page 1 of 2 -
NOTE: The reference numbering from the original has been maintained in this citation list.

Fertility Choice in a Model of Economic GrowthRobert J. Barro; Gary S. BeckerEconometrica, Vol. 57, No. 2. (Mar., 1989), pp. 481-501.Stable URL:
http://links.jstor.org/sici?sici=0012-9682%28198903%2957%3A2%3C481%3AFCIAMO%3E2.0.CO%3B2-F
Human Capital, Fertility, and Economic GrowthGary S. Becker; Kevin M. Murphy; Robert TamuraThe Journal of Political Economy, Vol. 98, No. 5, Part 2: The Problem of Development: AConference of the Institute for the Study of Free Enterprise Systems. (Oct., 1990), pp. S12-S37.Stable URL:
http://links.jstor.org/sici?sici=0022-3808%28199010%2998%3A5%3CS12%3AHCFAEG%3E2.0.CO%3B2-L
Optimum Growth in an Aggregative Model of Capital AccumulationDavid CassThe Review of Economic Studies, Vol. 32, No. 3. (Jul., 1965), pp. 233-240.Stable URL:
http://links.jstor.org/sici?sici=0034-6527%28196507%2932%3A3%3C233%3AOGIAAM%3E2.0.CO%3B2-H
Endogenous Technological ChangePaul M. RomerThe Journal of Political Economy, Vol. 98, No. 5, Part 2: The Problem of Development: AConference of the Institute for the Study of Free Enterprise Systems. (Oct., 1990), pp. S71-S102.Stable URL:
http://links.jstor.org/sici?sici=0022-3808%28199010%2998%3A5%3CS71%3AETC%3E2.0.CO%3B2-8
A Contribution to the Theory of Economic GrowthRobert M. SolowThe Quarterly Journal of Economics, Vol. 70, No. 1. (Feb., 1956), pp. 65-94.Stable URL:
http://links.jstor.org/sici?sici=0033-5533%28195602%2970%3A1%3C65%3AACTTTO%3E2.0.CO%3B2-M
A Heteroskedasticity-Consistent Covariance Matrix Estimator and a Direct Test forHeteroskedasticityHalbert WhiteEconometrica, Vol. 48, No. 4. (May, 1980), pp. 817-838.Stable URL:
http://links.jstor.org/sici?sici=0012-9682%28198005%2948%3A4%3C817%3AAHCMEA%3E2.0.CO%3B2-K
http://www.jstor.org
LINKED CITATIONS- Page 2 of 2 -
NOTE: The reference numbering from the original has been maintained in this citation list.