Embed Size (px)
Citation preview
Economic Growth V:Competitiveness
Gavin Cameron Lady Margaret Hall
Hilary Term 2004
competitiveness• ‘Most people who use the term “competitiveness” do so
without a second thought. It seems obvious to them that the analogy between a country and a corporation is reasonable and that to ask whether the United States is competitive in the world market is no different in principle from asking whether General Motors is competitive in the North American minivan market. In fact, however, trying to define the competitiveness of a nation is much more problematic than defining that of a corporation…So when we say that a corporation is uncompetitive, we mean that its market position is unsustainable - that unless it improves its performance, it will cease to exist. Countries, on the other hand, do not go out of business. They may be happy or unhappy with their economic performance, but they have no well defined bottom-line. As a result, the concept of national competitiveness is elusive.’ Paul Krugman, Pop Internationalism.
competitiveness and the terms of trade• The nominal exchange rate is EUK = £/$• The real exchange rate is the relative price of foreign
goods in terms of domestic goods, RUK = EUK* (Pw/PUK)• This can be thought of as the nominal exchange rate doubly
deflated by foreign and domestic goods prices. As long as goods prices (Pw and PUK) move closely together, the nominal and real exchange rate move together. If foreign prices rise faster than domestic prices, the real exchange rate will depreciate.
• The terms of trade is TUK = 1/RUK = (PUK/Pw)/EUK
• The real exchange rate (and hence the terms of trade) is determined in the long-run by relative inflation rates and by the relative supply and demand for tradeable goods. When relative Purchasing Power Parity holds, the nominal exchange rate will move to cancel out the effect of different inflation rates, leaving the real exchange rate unchanged.
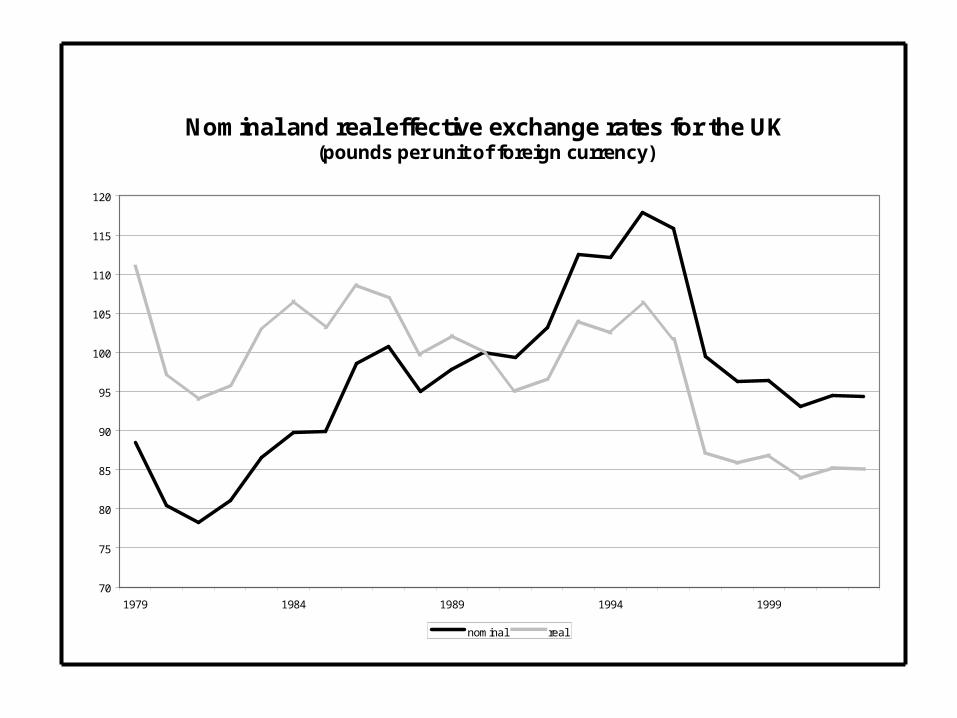
Nominal and real effective exchange rates for the UK(pounds per unit of foreign currency)
70
75
80
85
90
95
100
105
110
115
120
1979 1984 1989 1994 1999
nominal real
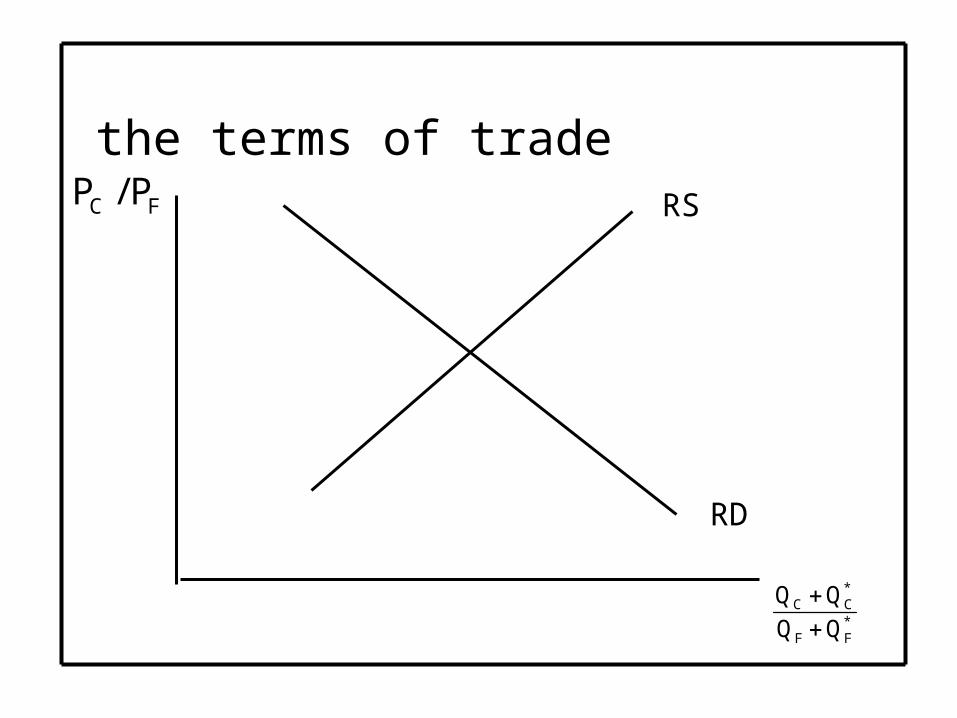
the terms of trade
*C C
*F F
Q Q
Q Q
C FP / P RS
RD
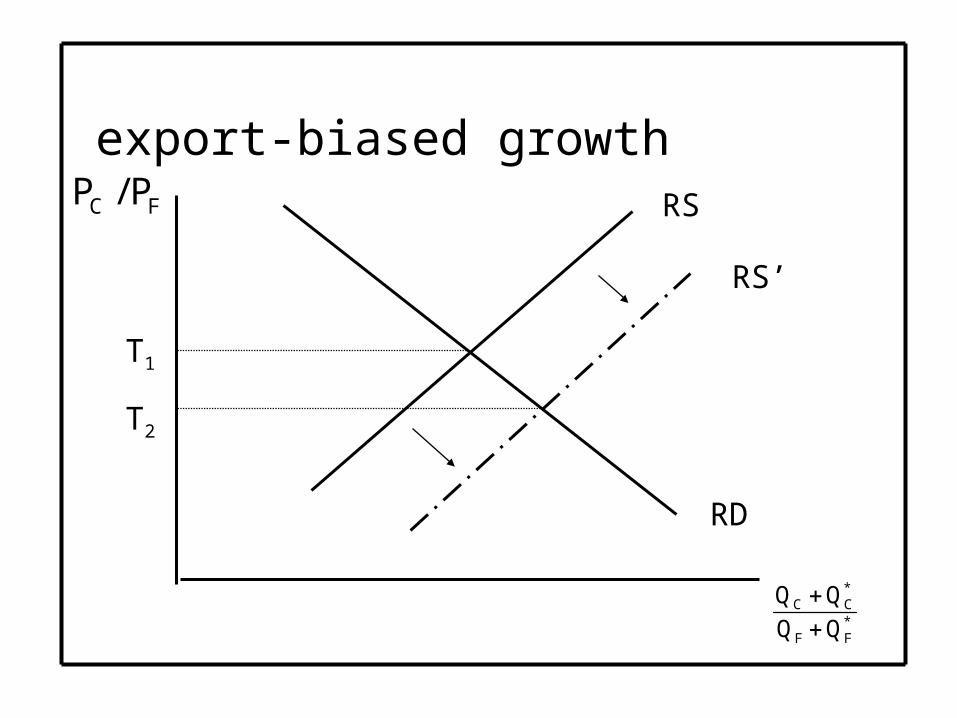
export-biased growth
*C C
*F F
Q Q
Q Q
C FP / P RS
RD
RS’
T1
T2
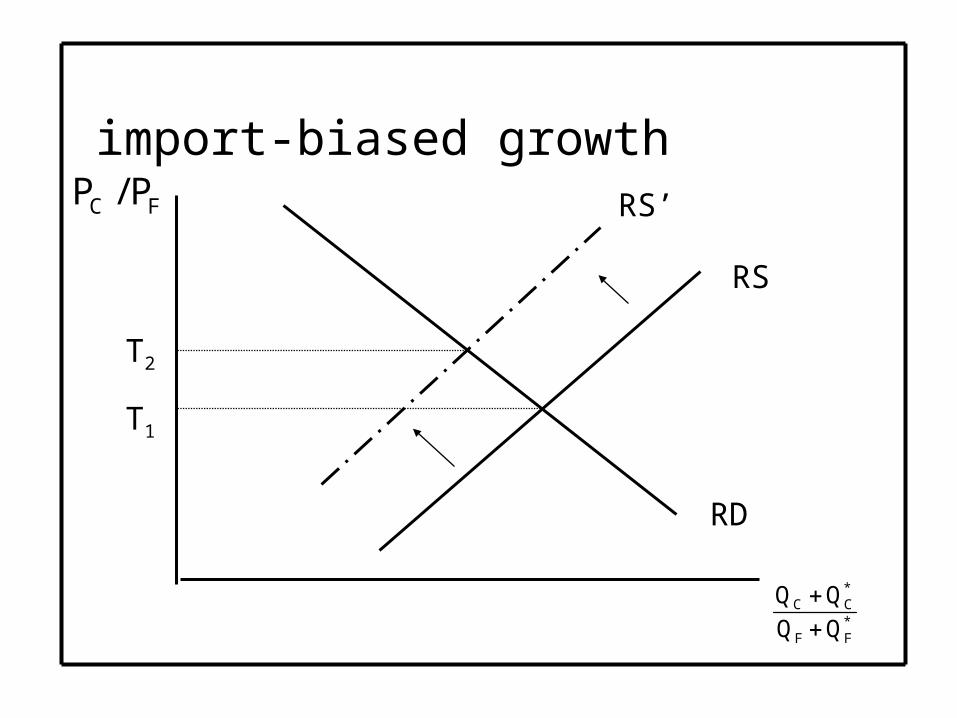
import-biased growth
*C C
*F F
Q Q
Q Q
C FP / P RS’
RD
RS
T2
T1
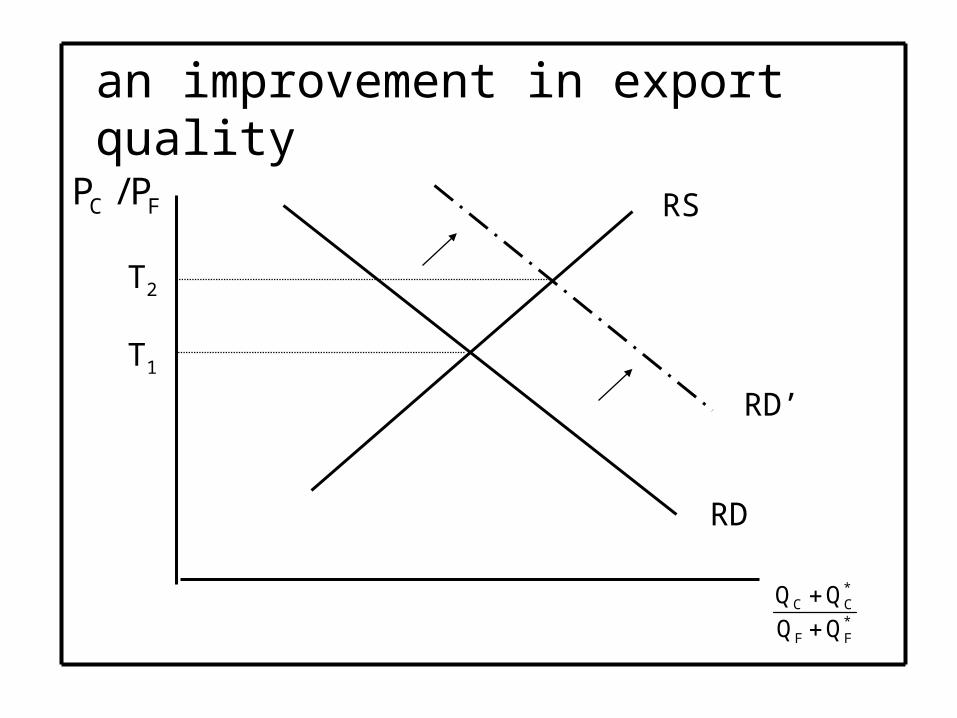
an improvement in export quality
*C C
*F F
Q Q
Q Q
C FP / P RS
RD
RD’
T2
T1
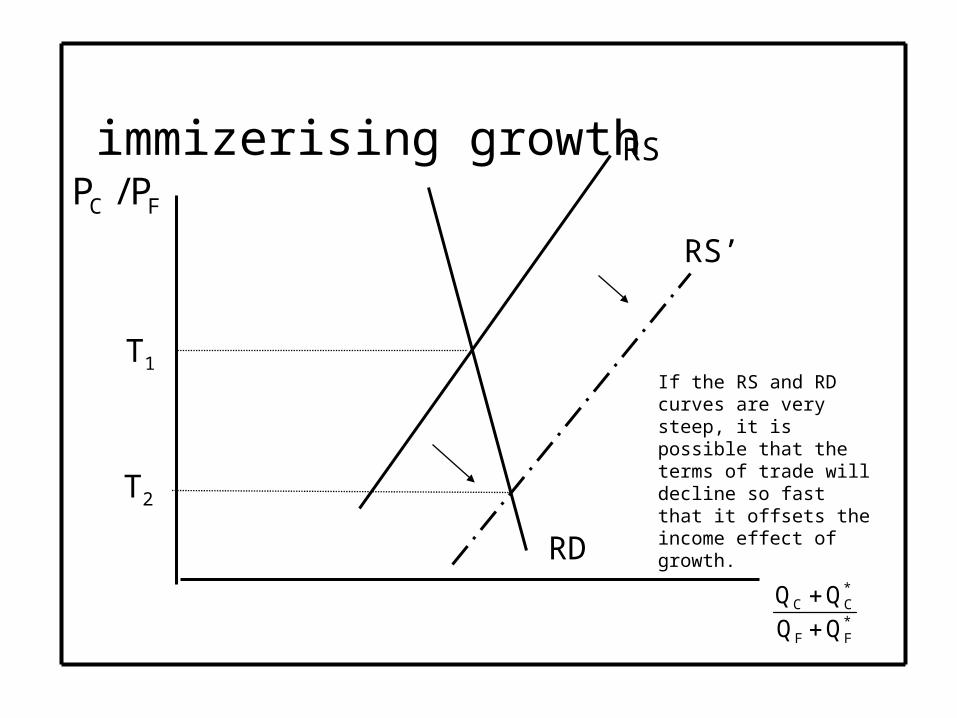
immizerising growth
*C C
*F F
Q Q
Q Q
C FP / PRS
RD
RS’
T1
T2
If the RS and RD curves are very steep, it is possible that the terms of trade will decline so fast that it offsets the income effect of growth.
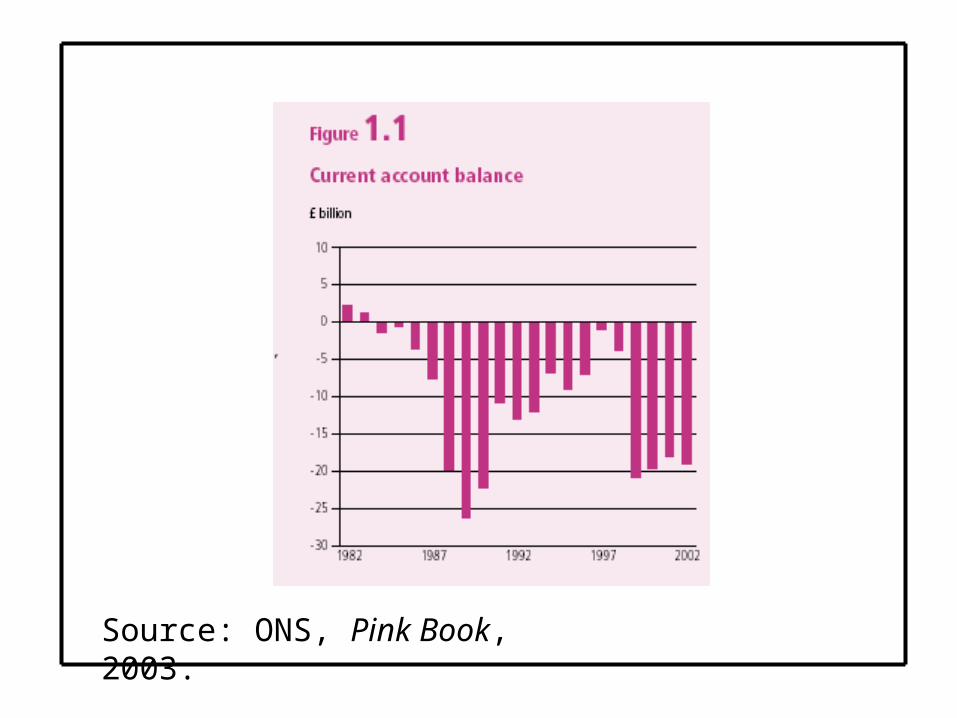
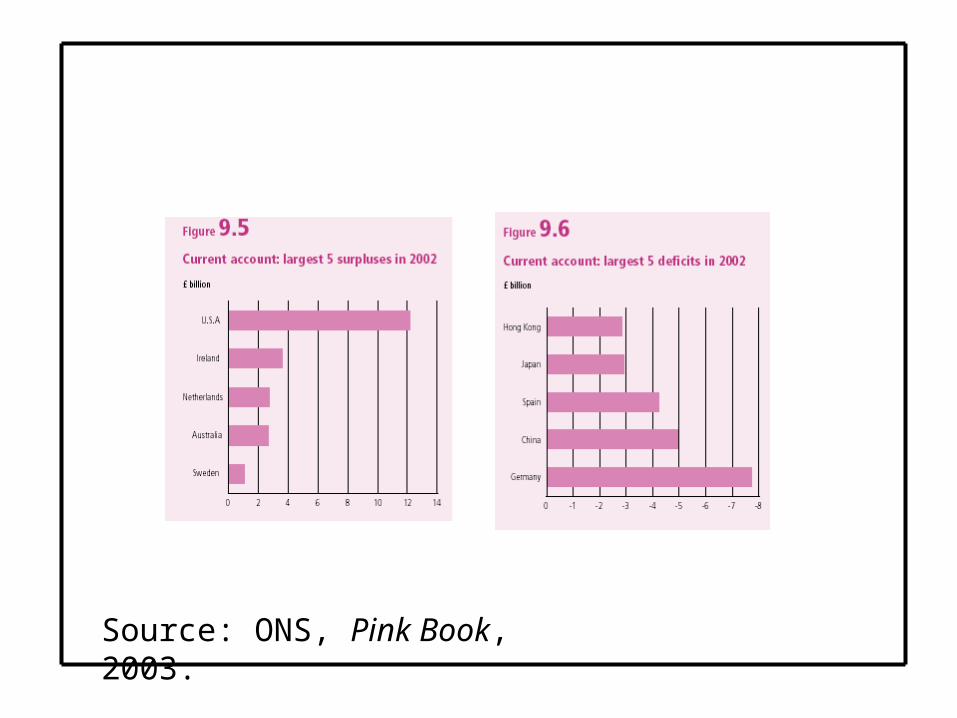
Source: ONS, Pink Book, 2003.
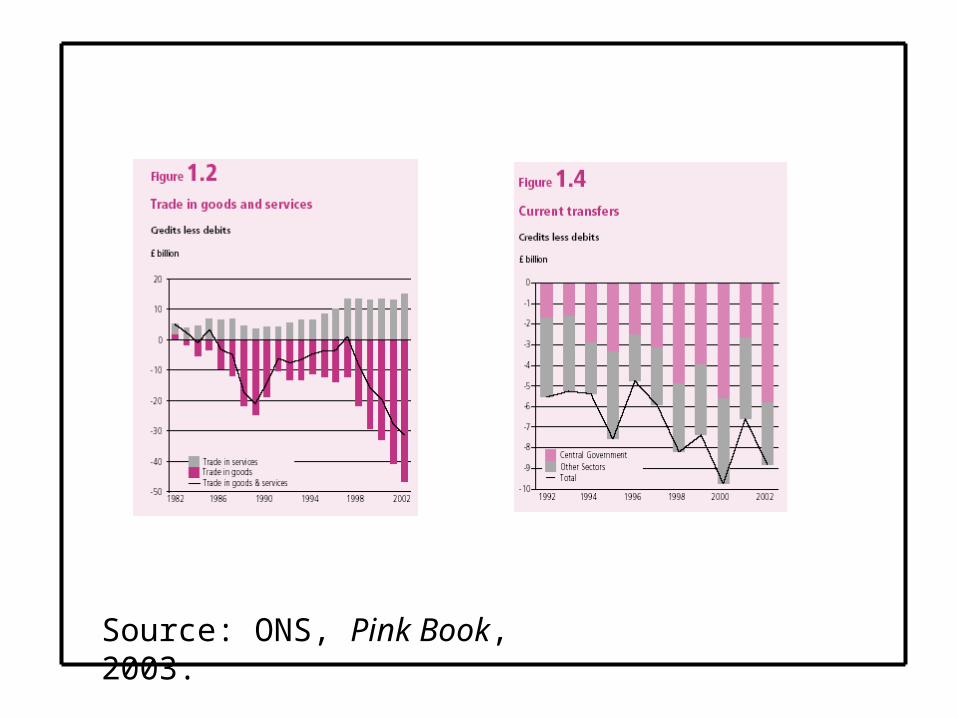
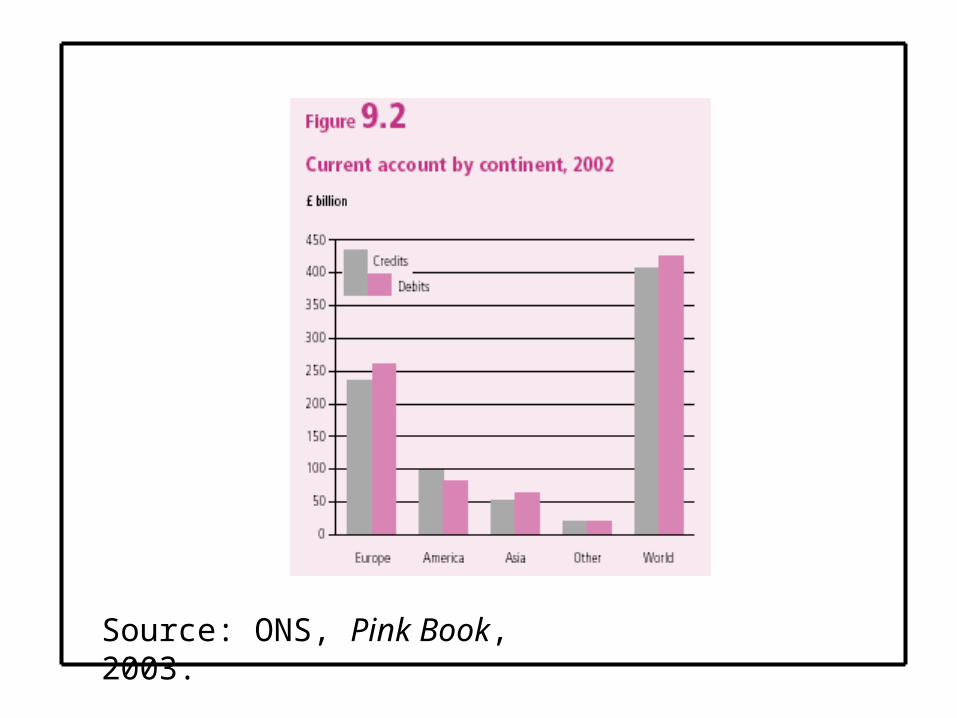
Source: ONS, Pink Book, 2003.
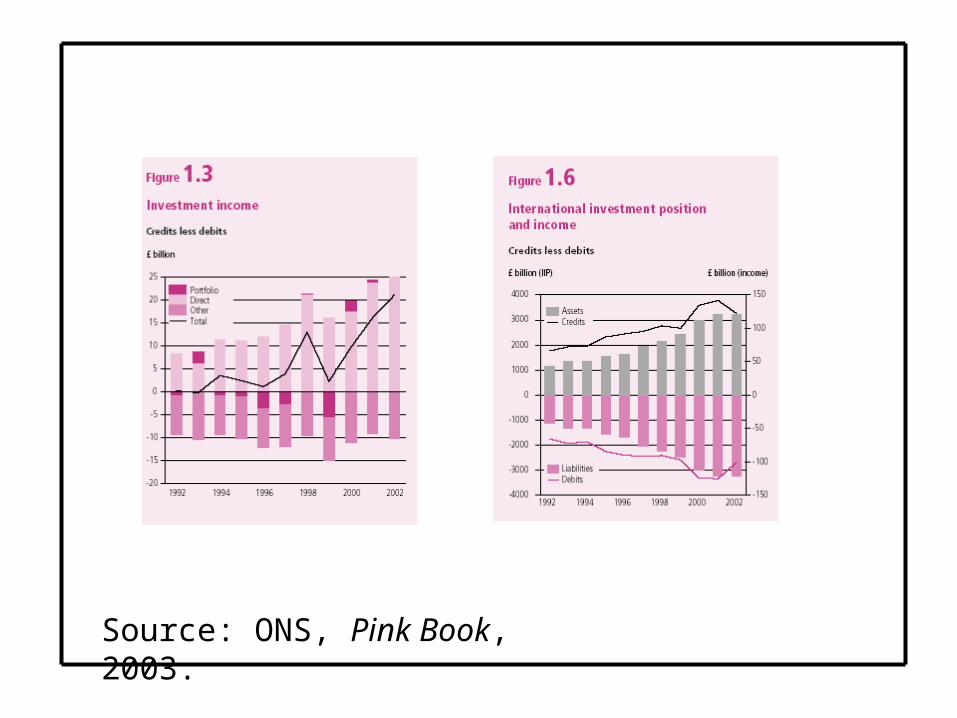
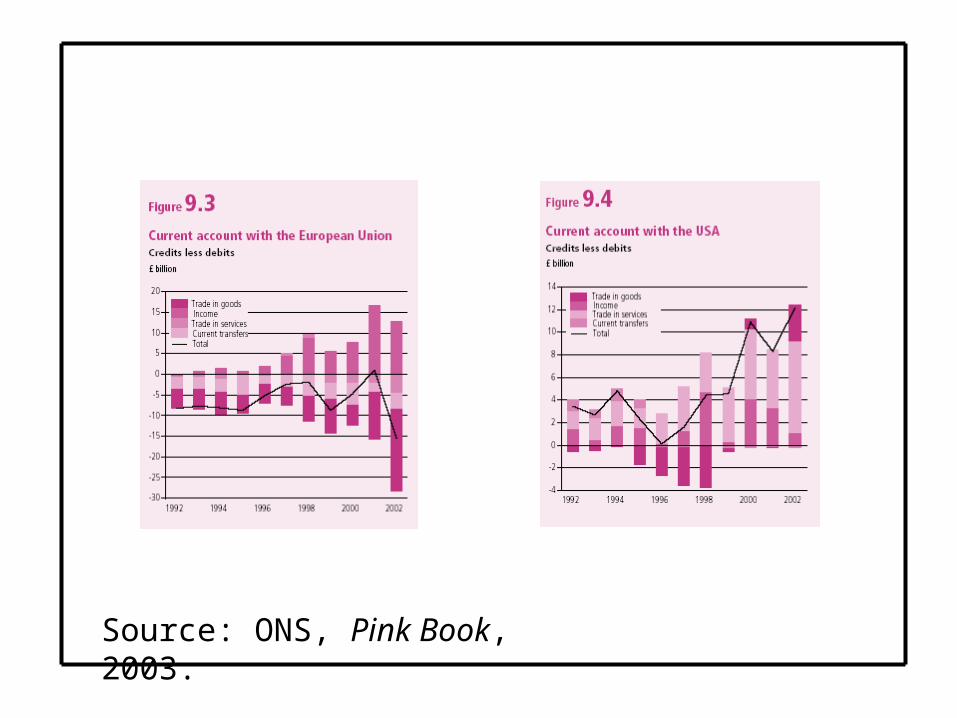
Source: ONS, Pink Book, 2003.
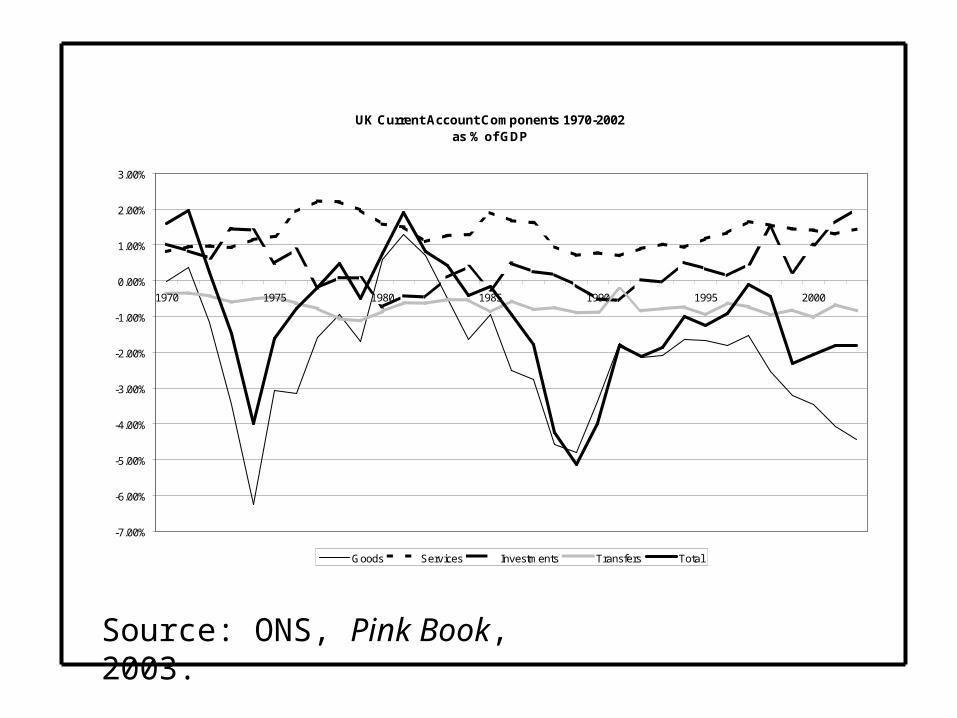
UK Current Account Components 1970-2002as % of GDP
-7.00%
-6.00%
-5.00%
-4.00%
-3.00%
-2.00%
-1.00%
0.00%
1.00%
2.00%
3.00%
1970 1975 1980 1985 1990 1995 2000
Goods Services Investments Transfers Total
Source: ONS, Pink Book, 2003.
Source: ONS, Pink Book, 2003.
Source: ONS, Pink Book, 2003.
Source: ONS, Pink Book, 2003.
Source: ONS, Pink Book, 2003.
Source: ONS, Pink Book, 2003.
Source: ONS, Pink Book, 2003.
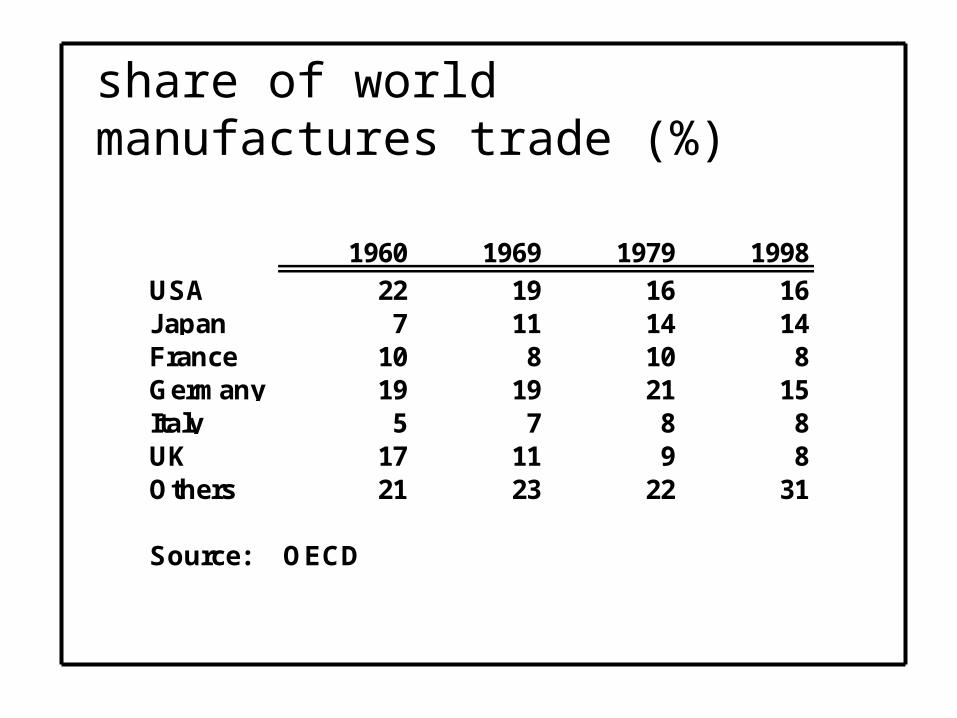
share of world manufactures trade (%)
1960 1969 1979 1998
USA 22 19 16 16Japan 7 11 14 14France 10 8 10 8Germany 19 19 21 15Italy 5 7 8 8UK 17 11 9 8Others 21 23 22 31
Source: OECD

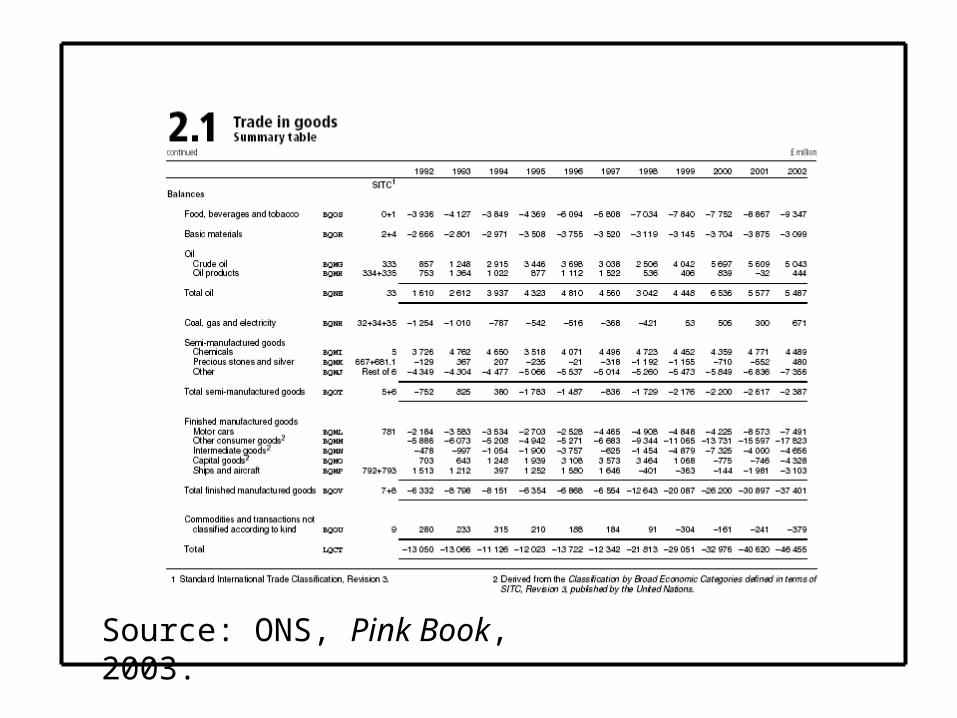
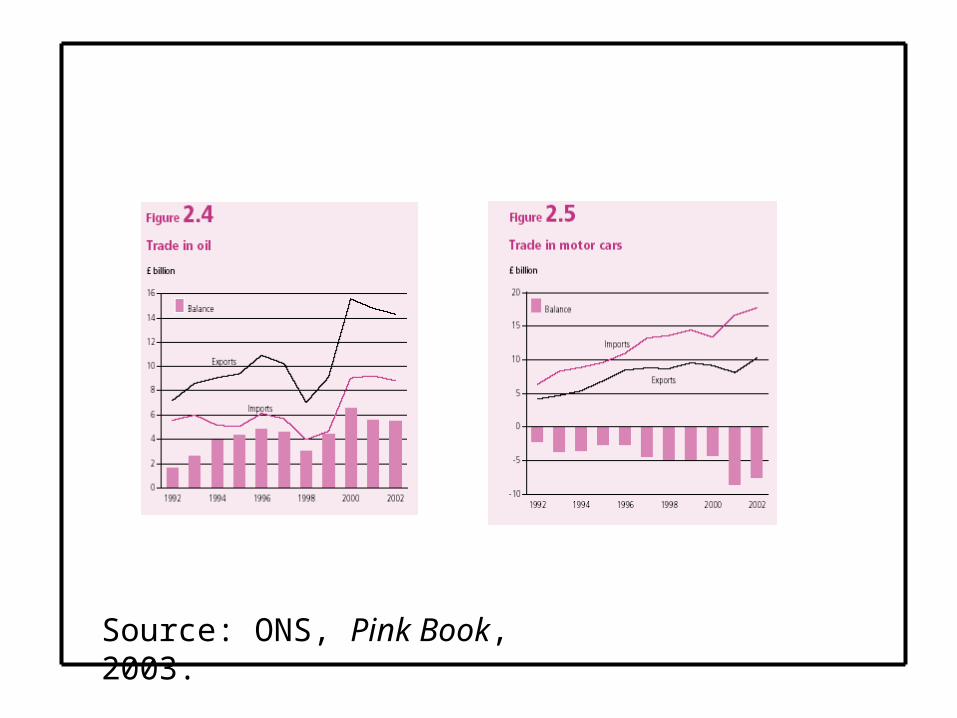
changing times...• The country composition of UK trade has moved
towards the EU and away from the rest of the OECD since the 1960s.
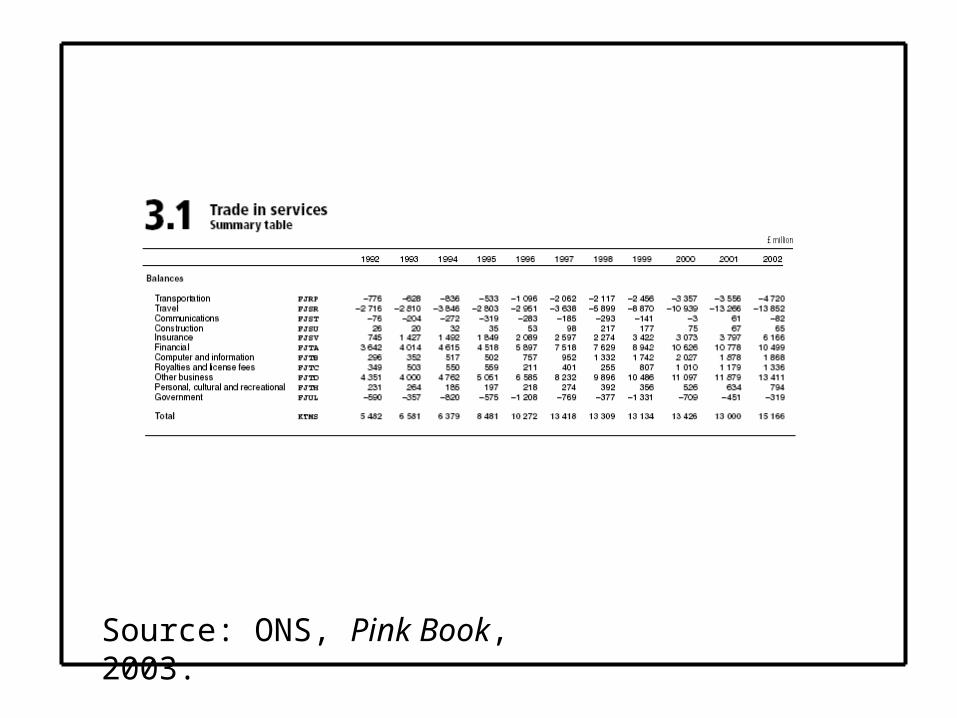
• The product composition of UK trade has moved away from foodstuffs and raw materials and towards manufactures, especially in terms of imports.
• The UK’s comparative advantage now lies in the following areas: oil, chemicals & pharmaceuticals, aerospace and medical technology, insurance, financial services, computer services & software, other business services, and entertainment.
• It does not lie in traditional industries such as coal, steel, textiles, shipbuilding…this has been clear since at least the 1920s.
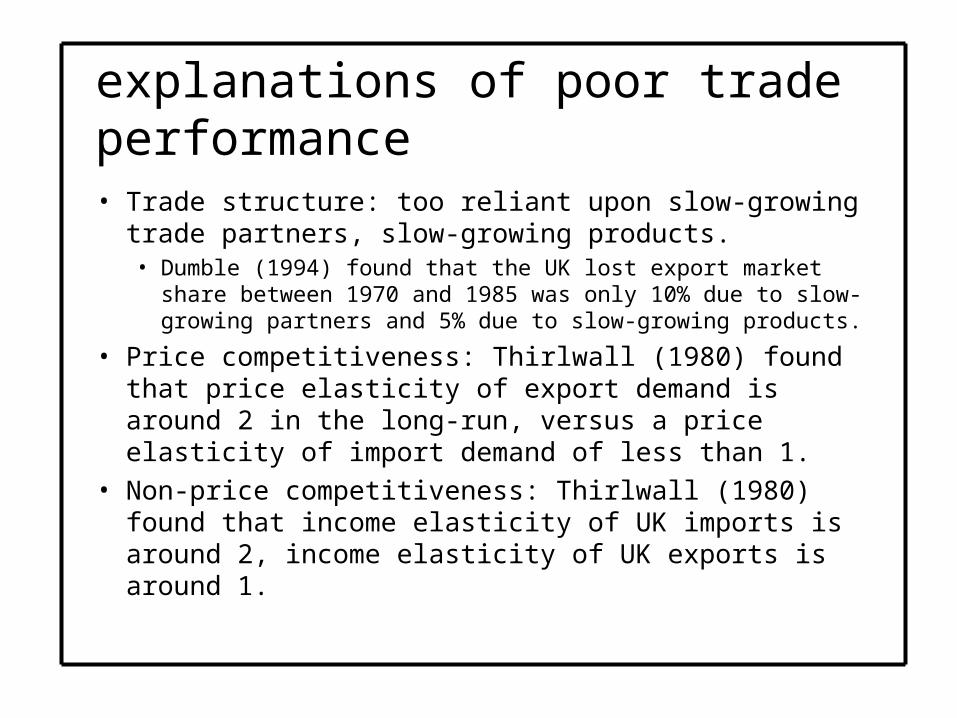
explanations of poor trade performance• Trade structure: too reliant upon slow-growing
trade partners, slow-growing products.• Dumble (1994) found that the UK lost export market share
between 1970 and 1985 was only 10% due to slow-growing partners and 5% due to slow-growing products.
• Price competitiveness: Thirlwall (1980) found that price elasticity of export demand is around 2 in the long-run, versus a price elasticity of import demand of less than 1.
• Non-price competitiveness: Thirlwall (1980) found that income elasticity of UK imports is around 2, income elasticity of UK exports is around 1.
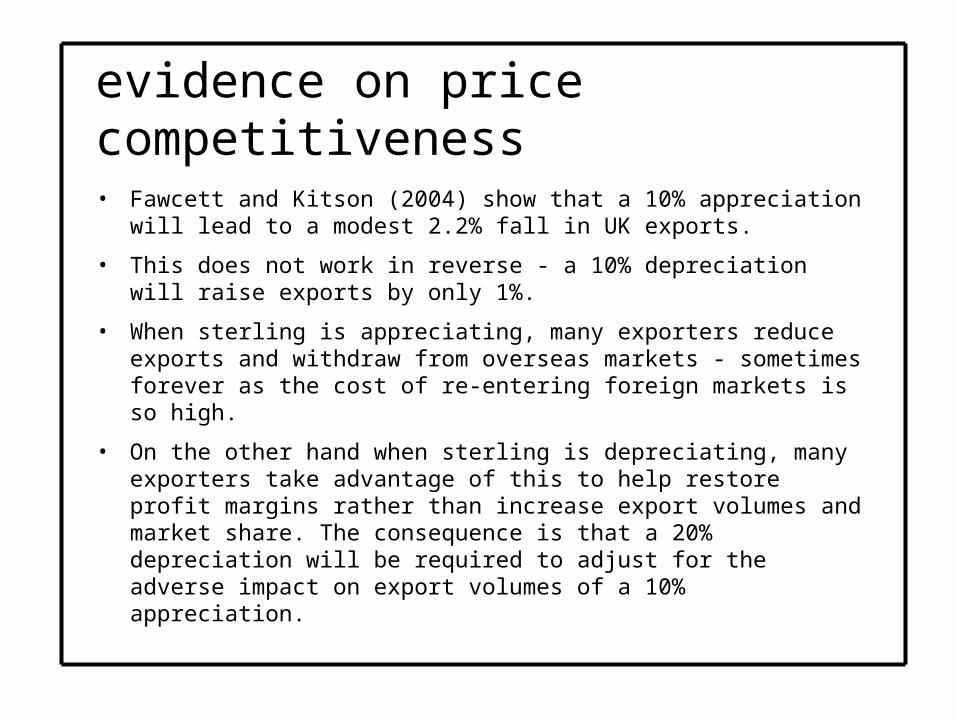
evidence on price competitiveness• Fawcett and Kitson (2004) show that a 10% appreciation
will lead to a modest 2.2% fall in UK exports.
• This does not work in reverse - a 10% depreciation will raise exports by only 1%.
• When sterling is appreciating, many exporters reduce exports and withdraw from overseas markets - sometimes forever as the cost of re-entering foreign markets is so high.
• On the other hand when sterling is depreciating, many exporters take advantage of this to help restore profit margins rather than increase export volumes and market share. The consequence is that a 20% depreciation will be required to adjust for the adverse impact on export volumes of a 10% appreciation.
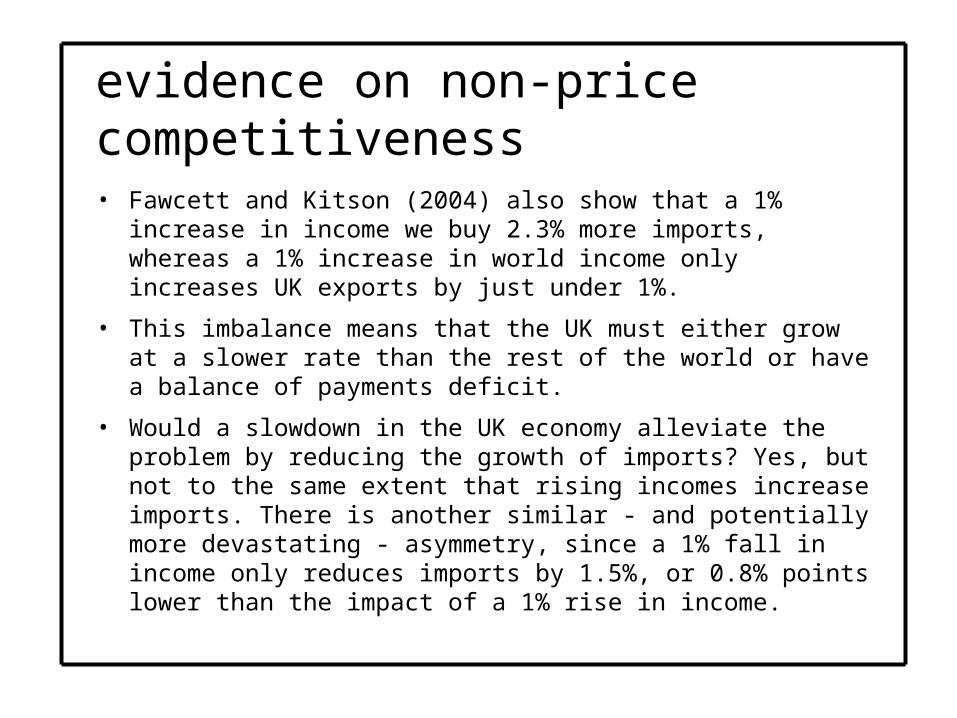
evidence on non-price competitiveness• Fawcett and Kitson (2004) also show that a 1% increase
in income we buy 2.3% more imports, whereas a 1% increase in world income only increases UK exports by just under 1%.
• This imbalance means that the UK must either grow at a slower rate than the rest of the world or have a balance of payments deficit.
• Would a slowdown in the UK economy alleviate the problem by reducing the growth of imports? Yes, but not to the same extent that rising incomes increase imports. There is another similar - and potentially more devastating - asymmetry, since a 1% fall in income only reduces imports by 1.5%, or 0.8% points lower than the impact of a 1% rise in income.
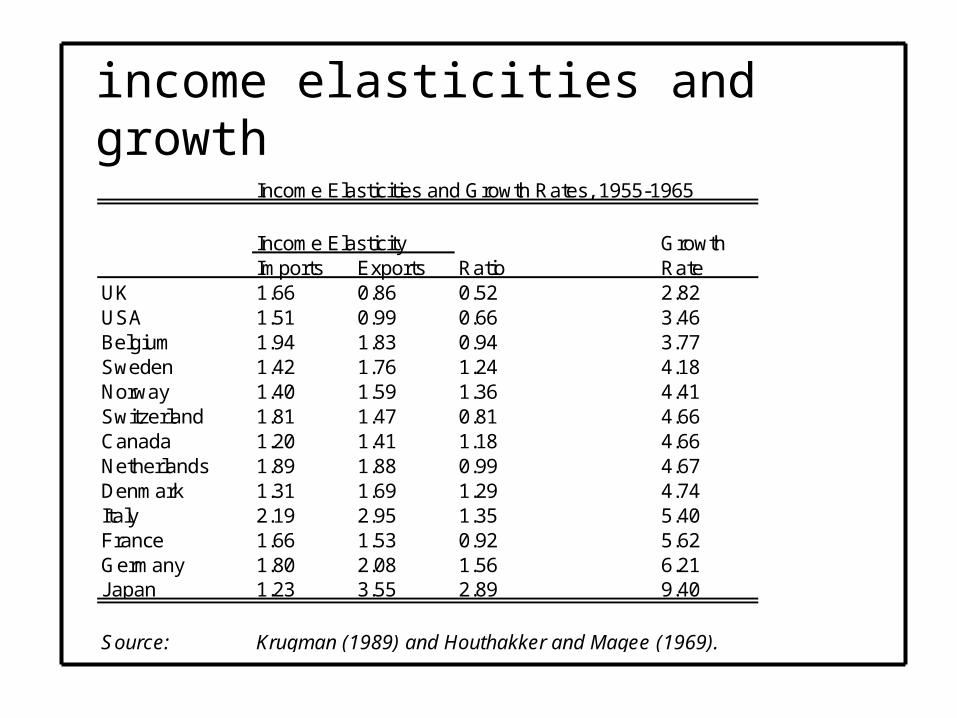
income elasticities and growthIncome Elasticities and Growth Rates, 1955-1965
Income Elasticity GrowthImports Exports Ratio Rate
UK 1.66 0.86 0.52 2.82USA 1.51 0.99 0.66 3.46Belgium 1.94 1.83 0.94 3.77Sweden 1.42 1.76 1.24 4.18Norway 1.40 1.59 1.36 4.41Switzerland 1.81 1.47 0.81 4.66Canada 1.20 1.41 1.18 4.66Netherlands 1.89 1.88 0.99 4.67Denmark 1.31 1.69 1.29 4.74Italy 2.19 2.95 1.35 5.40France 1.66 1.53 0.92 5.62Germany 1.80 2.08 1.56 6.21Japan 1.23 3.55 2.89 9.40
Source: Krugman (1989) and Houthakker and Magee (1969).
conventional wisdom• In general, fast-growing countries seem to face a high income
elasticity of demand for their exports, and a low income elasticity for their imports (Houthakker and Magee, 1969). This leads to a stable real exchange rate (a 45 degree relationship between elasticity and growth).
• This has led to a conventional wisdom that the UK has a competitiveness problem - that the balance of payments is a constraint on domestic expansion.
• “Although the UK has surpluses on oil, services and investment income, it would be a hazardous strategy to rely on these to ‘subsidize’ a progressive deterioration in trade in non-oil goods”, Griffiths and Wall, 2001.
• But, in the early 1960s many Japanese policymakers advocated import-substitution policies because export markets seemed too tight (q.v. ‘export pessimism’). It is also the case that the current account is the counterpart of the capital account, as part of the national budget constraint.
productivity matters• It would be wrong to think that it is the income elasticity
that is driving fast-growth (i.e. that countries with unfavourable elasticities keep running into balance of payments crises and therefore have low growth), see Krugman, 1989.
• Instead, causation runs from fast growth to favourable elasticities.
• For example, as European countries grew in the 1950s and 1960s they were actually becoming more similar to their trading partners, and therefore growth was actually biased against the kinds of goods that Europe was originally producing.
• Europe may have grown by expanding its share of world markets not by reducing relative prices of its goods but by expanding its range of goods. Therefore growth in the scale of the economy led to rising trade.
summary• In the short-run, changes in aggregate demand are
reflected in changes in the exchange rate and the balance of payments, as well as in output and inflation.
• In the long-run, when relative Purchasing Power Parity holds, movements in prices (at home and abroad) affect the nominal exchange rate but not the real exchange rate.
• In the long-run, the real exchange rate (and the terms of trade) are determined by relative supply and demand for tradeable goods and services.
• Changes in the relative supply and demand for tradeables is an outcome of changing comparative advantage… on this interpretation, if the UK has a problem it is because of productivity not because of competitiveness.
• Given the likely future growth of China and India, it is likely that the terms of world trade will move against the goods which China and India can produce and in favour of those goods which Chinese and Indian consumers want to buy.