Embed Size (px)
Citation preview
Economic History Association
American Neutrality and Prosperity, 1793-1808: A ReconsiderationAuthor(s): Donald R. Adams, Jr.Source: The Journal of Economic History, Vol. 40, No. 4 (Dec., 1980), pp. 713-737Published by: Cambridge University Press on behalf of the Economic History AssociationStable URL: http://www.jstor.org/stable/2119997Accessed: 14/05/2010 16:32
Your use of the JSTOR archive indicates your acceptance of JSTOR's Terms and Conditions of Use, available athttp://www.jstor.org/page/info/about/policies/terms.jsp. JSTOR's Terms and Conditions of Use provides, in part, that unlessyou have obtained prior permission, you may not download an entire issue of a journal or multiple copies of articles, and youmay use content in the JSTOR archive only for your personal, non-commercial use.
Please contact the publisher regarding any further use of this work. Publisher contact information may be obtained athttp://www.jstor.org/action/showPublisher?publisherCode=cup.
Each copy of any part of a JSTOR transmission must contain the same copyright notice that appears on the screen or printedpage of such transmission.
JSTOR is a not-for-profit service that helps scholars, researchers, and students discover, use, and build upon a wide range ofcontent in a trusted digital archive. We use information technology and tools to increase productivity and facilitate new formsof scholarship. For more information about JSTOR, please contact [email protected].
Economic History Association and Cambridge University Press are collaborating with JSTOR to digitize,preserve and extend access to The Journal of Economic History.
http://www.jstor.org
American Neutrality and Prosperity, 1 793-1808: A Reconsideration
DONALD R. ADAMS, JR.
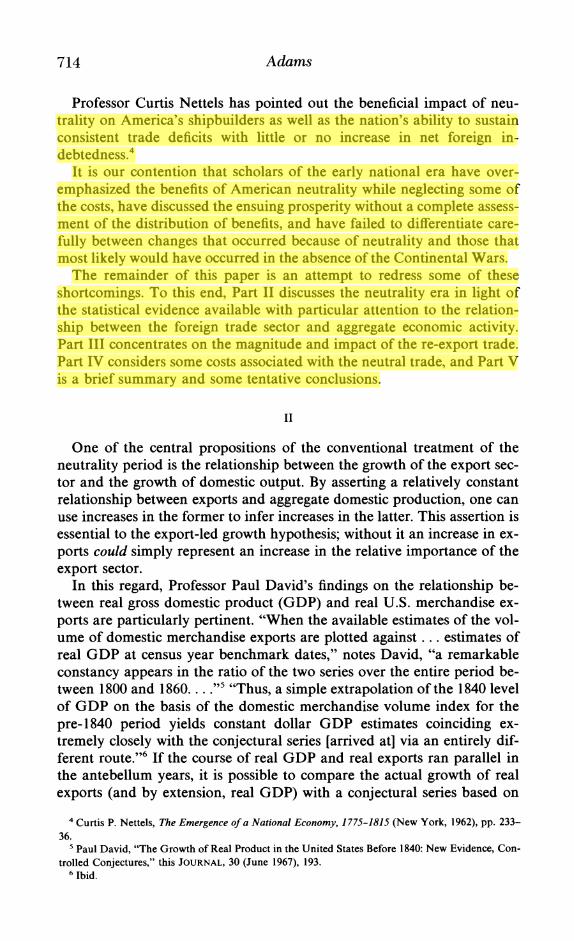
It is a widely held view that the era of American neutrality (1793-1807) during the Napoleonic Wars was one of general prosperity and brisk economic activity, espe- cially when compared to the years immediately following the Embargo. This paper argues that, aside from substantial increases in the re-export sector, domestic trade exhibited little deviation from the long-run, antebellum trend. The benefits that did result from neutrality were highly concentrated and must be balanced against the direct and indirect costs of wartime commerce.
I
Es UROPE'S misfortunes from 1790 to 1810 unquestionably re- bounded [sic] to America's benefit. In the absence of warfare
among the Europeans, American output and incomes would have been less."'
Nearly all textbooks in American Economic history concur in the de- scription of the "neutrality era" as one of brisk economic activity and widespread economic growth. One of the most avid proponents of the connection between America's neutral status and economic progress dur- ing the Napoleonic Wars, Professor Douglass North, asserts that these "were years of unparalleled prosperity." Although twice interrupted by the undeclared sea war with France (1797-1798) and the Peace of Amiens (1801-1803), "this period," contends North, "was a high water mark in in- dividual well being which was to stand for many years, and laid important foundations for the growth of the economy after 1815."2
The North hypothesis of export-led growth attributes the prosperity of the period to: (1) the importance of the export sector in the total economy, (2) the rapid and significant expansion of this sector during the years 1793-1808, (3) a large increase in imports for consumption at favorable import prices, and (4) the expansion of the domestic economy induced by the increase in income from the export sector.3 Increased shipping earn- ings and export income constitute only the most visible and direct effects of neutral trade. To these we might add an acceleration of urban growth with its favorable impact on the residential construction industry.
Journal of Economic History, Vol. XL, No. 4 (Dec. 1980). ? The Economic History Association. All rights reserved. ISSN 0022-0507.
The author is Professor of Economics at Southern Illinois University at Carbondale, Illinois 62901. ' Gerald Gunderson, A New Economic History of America (New York, 1976), p. 112. 2 Douglass C. North, The Economic Growth of the United States, 1790-1860 (New York, 1961), p.
53. 3Ibid.
713
714 Adams
Professor Curtis Nettels has pointed out the beneficial impact of neu- trality on America's shipbuilders as well as the nation's ability to sustain consistent trade deficits with little or no increase in net foreign in- debtedness.4
It is our contention that scholars of the early national era have over- emphasized the benefits of American neutrality while neglecting some of the costs, have discussed the ensuing prosperity without a complete assess- ment of the distribution of benefits, and have failed to differentiate care- fully between changes that occurred because of neutrality and those that most likely would have occurred in the absence of the Continental Wars.
The remainder of this paper is an attempt to redress some of these shortcomings. To this end, Part II discusses the neutrality era in light of the statistical evidence available with particular attention to the relation- ship between the foreign trade sector and aggregate economic activity. Part III concentrates on the magnitude and impact of the re-export trade. Part IV considers some costs associated with the neutral trade, and Part V is a brief summary and some tentative conclusions.
II
One of the central propositions of the conventional treatment of the neutrality period is the relationship between the growth of the export sec- tor and the growth of domestic output. By asserting a relatively constant relationship between exports and aggregate domestic production, one can use increases in the former to infer increases in the latter. This assertion is essential to the export-led growth hypothesis; without it an increase in ex- ports could simply represent an increase in the relative importance of the export sector.
In this regard, Professor Paul David's findings on the relationship be- tween real gross domestic product (GDP) and real U.S. merchandise ex- ports are particularly pertinent. "When the available estimates of the vol- ume of domestic merchandise exports are plotted against . . . estimates of real GDP at census year benchmark dates," notes David, "a remarkable constancy appears in the ratio of the two series over the entire period be- tween 1800 and 1860... ."5 "Thus, a simple extrapolation of the 1840 level of GDP on the basis of the domestic merchandise volume index for the pre-1840 period yields constant dollar GDP estimates coinciding ex- tremely closely with the conjectural series [arrived at] via an entirely dif- ferent route."6 If the course of real GDP and real exports ran parallel in the antebellum years, it is possible to compare the actual growth of real exports (and by extension, real GDP) with a conjectural series based on
4 Curtis P. Nettels, The Emergence of a National Economy, 1775-1815 (New York, 1962), pp. 233- 36.
5 Paul David, "The Growth of Real Product in the United States Before 1840: New Evidence, Con- trolled Conjectures," this JOURNAL, 30 (June 1967), 193.
6 Ibid.
American Neutrality and Prosperity 715
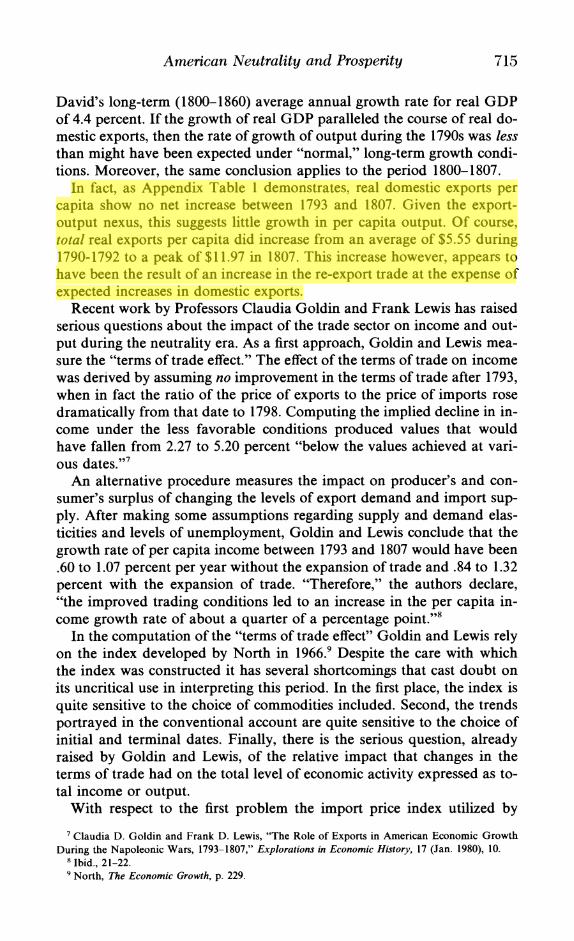
David's long-term (1800-1860) average annual growth rate for real GDP of 4.4 percent. If the growth of real GDP paralleled the course of real do- mestic exports, then the rate of growth of output during the 1790s was less than might have been expected under "normal," long-term growth condi- tions. Moreover, the same conclusion applies to the period 1800-1807.
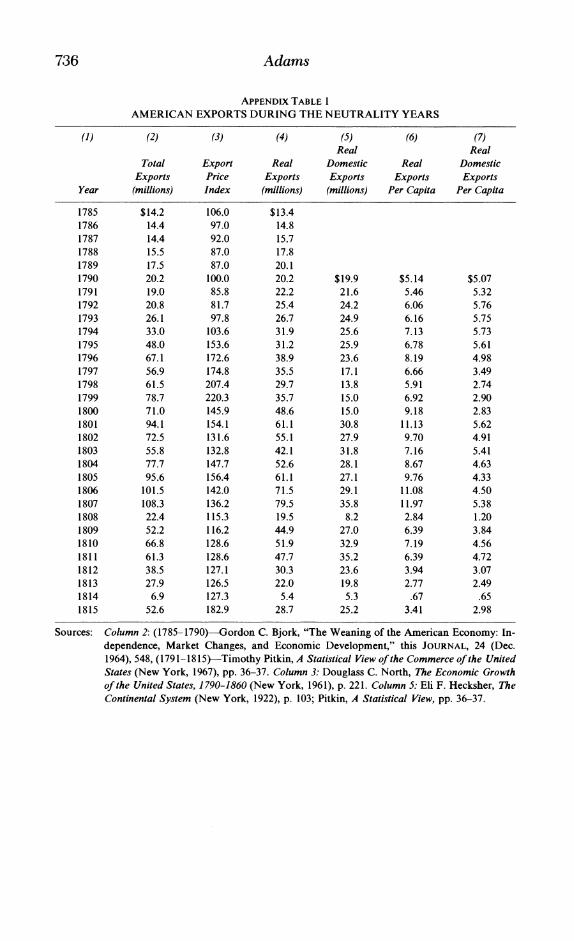
In fact, as Appendix Table 1 demonstrates, real domestic exports per capita show no net increase between 1793 and 1807. Given the export- output nexus, this suggests little growth in per capita output. Of course, total real exports per capita did increase from an average of $5.55 during 1790-1792 to a peak of $11.97 in 1807. This increase however, appears to have been the result of an increase in the re-export trade at the expense of expected increases in domestic exports.
Recent work by Professors Claudia Goldin and Frank Lewis has raised serious questions about the impact of the trade sector on income and out' put during the neutrality era. As a first approach, Goldin and Lewis mea- sure the "terms of trade effect." The effect of the terms of trade on income was derived by assuming no improvement in the terms of trade after 1793, when in fact the ratio of the price of exports to the price of imports rose dramatically from that date to 1798. Computing the implied decline in in- come under the less favorable conditions produced values that would have fallen from 2.27 to 5.20 percent "below the values achieved at vari- ous dates."7
An alternative procedure measures the impact on producer's and con- sumer's surplus of changing the levels of export demand and import sup- ply. After making some assumptions regarding supply and demand elas- ticities and levels of unemployment, Goldin and Lewis conclude that the growth rate of per capita income between 1793 and 1807 would have been .60 to 1.07 percent per year without the expansion of trade and .84 to 1.32 percent with the expansion of trade. "Therefore," the authors declare, "the improved trading conditions led to an increase in the per capita in- come growth rate of about a quarter of a percentage point."8
In the computation of the "terms of trade effect" Goldin and Lewis rely on the index developed by North in 1966.9 Despite the care with which the index was constructed it has several shortcomings that cast doubt on its uncritical use in interpreting this period. In the first place, the index is quite sensitive to the choice of commodities included. Second, the trends portrayed in the conventional account are quite sensitive to the choice of initial and terminal dates. Finally, there is the serious question, already raised by Goldin and Lewis, of the relative impact that changes in the terms of trade had on the total level of economic activity expressed as to- tal income or output.
With respect to the first problem the import price index utilized by
'Claudia D. Goldin and Frank D. Lewis, "The Role of Exports in American Economic Growth During the Napoleonic Wars, 1793-1807," Explorations in Economic History, 17 (Jan. 1980), 10.
8Ibid., 21-22. 9 North, The Economic Growth, p. 229.
716 Adams
North in calculating his terms-of-trade index gives a large weight to food- stuffs which, in the author's own words, "can hardly be considered repre- sentative of American imports."'" To help offset this bias three textile se- ries were added to the index and assigned a weight of 40 percent. Two of these three, however, are British series rather than c.i.f. prices in the United States and thus do not reflect the impact of rising insurance and freight rates during the neutrality era.
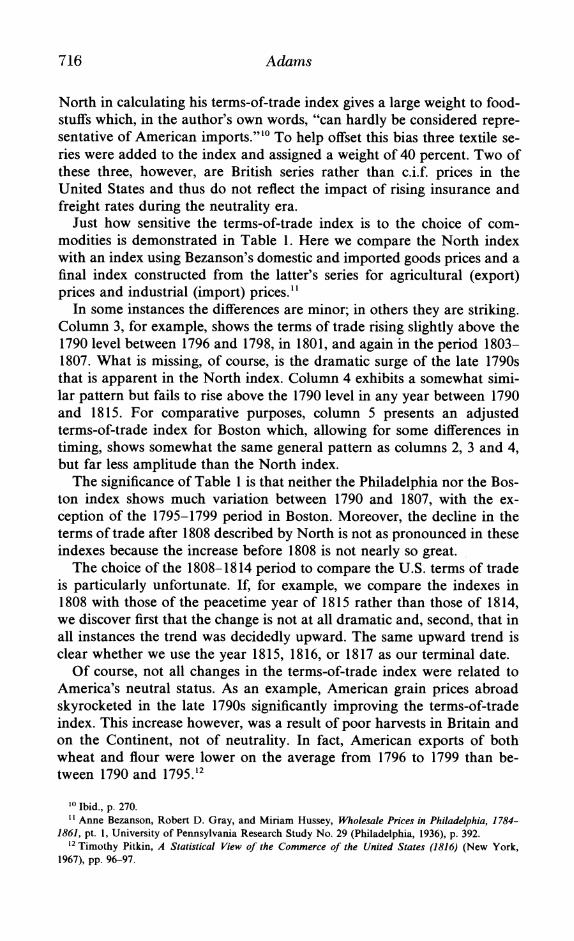
Just how sensitive the terms-of-trade index is to the choice of com- modities is demonstrated in Table 1. Here we compare the North index with an index using Bezanson's domestic and imported goods prices and a final index constructed from the latter's series for agricultural (export) prices and industrial (import) prices."
In some instances the differences are minor; in others they are striking. Column 3, for example, shows the terms of trade rising slightly above the 1790 level between 1796 and 1798, in 1801, and again in the period 1803- 1807. What is missing, of course, is the dramatic surge of the late 1790s that is apparent in the North index. Column 4 exhibits a somewhat simi- lar pattern but fails to rise above the 1790 level in any year between 1790 and 1815. For comparative purposes, column 5 presents an adjusted terms-of-trade index for Boston which, allowing for some differences in timing, shows somewhat the same general pattern as columns 2, 3 and 4, but far less amplitude than the North index.
The significance of Table 1 is that neither the Philadelphia nor the Bos- ton index shows much variation between 1790 and 1807, with the ex- ception of the 1795-1799 period in Boston. Moreover, the decline in the terms of trade after 1808 described by North is not as pronounced in these indexes because the increase before 1808 is not nearly so great.
The choice of the 1808-1814 period to compare the U.S. terms of trade is particularly unfortunate. If, for example, we compare the indexes in 1808 with those of the peacetime year of 1815 rather than those of 1814, we discover first that the change is not at all dramatic and, second, that in all instances the trend was decidedly upward. The same upward trend is clear whether we use the year 1815, 1816, or 1817 as our terminal date.
Of course, not all changes in the terms-of-trade index were related to America's neutral status. As an example, American grain prices abroad skyrocketed in the late 1790s significantly improving the terms-of-trade index. This increase however, was a result of poor harvests in Britain and on the Continent, not of neutrality. In fact, American exports of both wheat and flour were lower on the average from 1796 to 1799 than be- tween 1790 and 1795.12
'1 Ibid., p. 270. " Anne Bezanson, Robert D. Gray, and Miriam Hussey, Wholesale Prices in Philadelphia, 1784-
1861, pt. 1, University of Pennsylvania Research Study No. 29 (Philadelphia, 1936), p. 392. 12 Timothy Pitkin, A Statistical View of the Commerce of the United States (1816) (New York,
1967), pp. 96-97.
American Neutrality and Prosperity 717
TABLE I
TERMS OF TRADE SERIES FOR THE UNITED STATES, 1790-1815
(1) (2) (3) (4) (5) Bezanson Index Bezanson Index
North Domestic/ Agriculture! Boston Index Imported Industrial (Adjusted)
Year (1790=100) (1790=100) (1790=100) (1790=100)
1790 100.0 100.0 100.0 100.0 1791 78.1 94.7 92.7 1792 68.8 92.8 89.9 90.0 1793 90.2 95.5 96.2 90.1 1794 80.2 90.7 89.7 94.9 1795 123.6 95.5 90.8 126.3 1796 130.0 106.4 97.1 115.3 1797 124.9 106.8 95.5 113.2 1798 162.5 100.9 91.3 92.5 1799 162.6 87.6 84.4 102.8 1800 117.1 94.6 90.7 108.5 1801 128.5 101.6 99.8 103.3 1802 117.7 98.3 88.8 97.0 1803 112.5 100.0 85.1 91.7 1804 109.7 100.0 89.5 101.9 1805 112.1 108.5 98.4 101.8 1806 109.4 105.3 94.0 100.9 1807 109.2 106.2 89.6 100.0 1808 92.8 90.7 75.3 54.9 1809 90.0 87.0 74.7 80.8 1810 99.1 96.3 83.4 100.0 1811 106.2 103.7 83.4 77.4 1812 96.5 85.4 75.1 73.2 1813 70.4 77.8 69.3 79.2 1814 54.8 83.8 67.3 71.3 1815 95.6 93.0 84.0 111.2
Sources: Column 2: North, Economic Growth, p. 229. Columns 3, 4: Anne Bezanson, Robert D. Gray, and Miriam Hussey, Wholesale Prices in Philadelphia, 1784-1861, pt. 1, University of Pennsylvania Industrial Research Study No. 29 (Philadelphia, 1936), p. 392. Column 5: Walter B. Smith and Arthur H. Cole, Fluctuations in American Business, 1790-1860 (Cam- bridge, MA, 1935), pp. 146-47.
As we have seen, the impact of changes in the terms of trade on the level of national income was small. How great an effect should we then expect such changes to have had on the aggregate level of output? Paul David has noted that "the smaller the ratio of exports to aggregate domes- tic- production the smaller must have been the impact of any given per- centage shift in the terms of trade."'3 Since the antebellum export sector represented perhaps 15 percent of American GDP expressed in real terms, the terms-of-trade effect assumes less-than-monumental proportions. Note also that any impact is diminished still further if we utilize the alter- native terms-of-trade indexes from Table 1.
David has devised a relatively simple method of calculating the per-
1' David, "The Growth of Real Product," 190.
718 Adams
TABLE 2 TERMS-OF-TRADE IMPACT ON REAL GROSS DOMESTIC PRODUCT IN THE
UNITED STATES, 1790-1815
(1) (2) (3) (4) Domestic/ Agricultural!
North Index Imported Index Industrial Index Date (Percent Change) (Percent Change) (Percent Change)
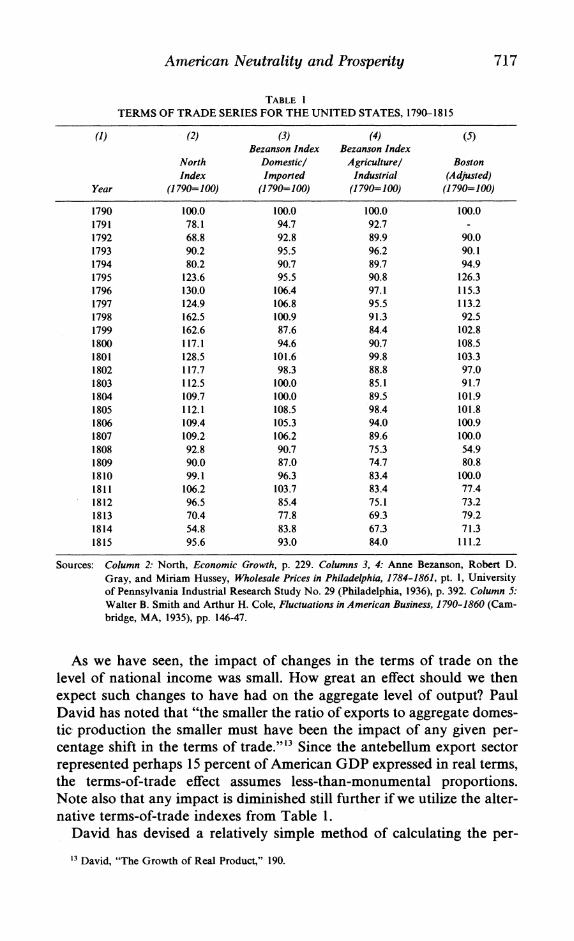
1790 - 1791 -3.09 -0.75 -1.03 1792 -4.04 -1.02 -1.42 1793 -1.38 -0.63 -0.54 1794 -2.79 -1.31 -1.45 1795 +3.32 -0.63 -1.30 1796 +4.23 +0.90 -0.41 1797 +3.51 +0.96 -0.63 1798 +8.81 +0.13 -1.23 1799 +8.83 -1.75 -2.20 1800 +2.41 -0.76 -1.31 1801 +4.02 +0.23 -0.03 1802 +2.50 -0.24 -1.58 1803 +1.76 +0.01 -2.10 1804 +1.37 +0.01 -1.48 1805 +1.71 +1.20 -0.23 1806 +1.33 +0.75 -0.85 1807 +1.30 +0.87 -1.47 1808 -1.02 -1.31 -3.48 1809 -1.41 -1.83 -3.57 1810 -0.18 -0.74 -3.34 1811 +1.25 +0.74 -3.34 1812 -0.70 -2.93 -5.00 1813 -5.95 -4.46 -6.17 1814 -9.09 -3.26 -6.57 1815 -8.84 -1.41 -3.22
Sources: For indexes see Table 1. For David's formulation see Paul David, "The Growth of Real Product in the United States before 1840: New Evidence, Controlled Conjectures," this JOURNAL, 30 (June 1967), 190-91.
centage change in real GDP attributable to changes in the terms of trade. The technique requires only an estimate of the ratio of total domestic ex- ports to gross domestic product in constant terms and the terms of trade for the year in question.'4 Accepting the estimate that domestic exports averaged approximately 14 percent of GDP in the 1790s, rising to perhaps 20 percent in the first decade of the nineteenth century, it is then possible to calculate the terms-of-trade impact on real GDP expressed in 1790 prices.
Table 2 presents our results, which vary considerably depending on the index utilized. The North index shows the greatest impact, both positive and negative, whereas the agricultural/industrial index registers negative results throughout. The more moderate changes reflected in the domestic/ imported index indicate no positive impact greater than 1.5 percent of real
14 Ibid., 190-9 1.
American Neutrality and Prosperity 719
gross domestic product and only three years in which the negative impact was greater than 2.5 percent. Even if we accept the North index, the posi- tive impact of the terms-of-trade effect on real GDP between 1793 and 1807 averaged only 2.73 percent per year. Thus, the impact on output was even less than the 3.4 percent per year impact on income estimated by Goldin and Lewis.'5 Of course, the use of the alternative indexes in Table 2 would diminish the impact to a still greater degree.
For the terms-of-trade effect to have been greater, the ratio of exports to gross domestic product would have to have been greater or to have risen. The latter assumption, however, is inconsistent with the assertion that ag- gregate growth followed pari passu the growth of trade.'6 In the absence of a fairly stable export-output ratio, the increased activity resulting from American neutrality could have represented a change in the relative share of economic activity attributable to the trade sector with little or no in- crease in total output. The redistribution of income attending such a change thus would have benefited the trade sector at the expense of other segments of the economy.
III
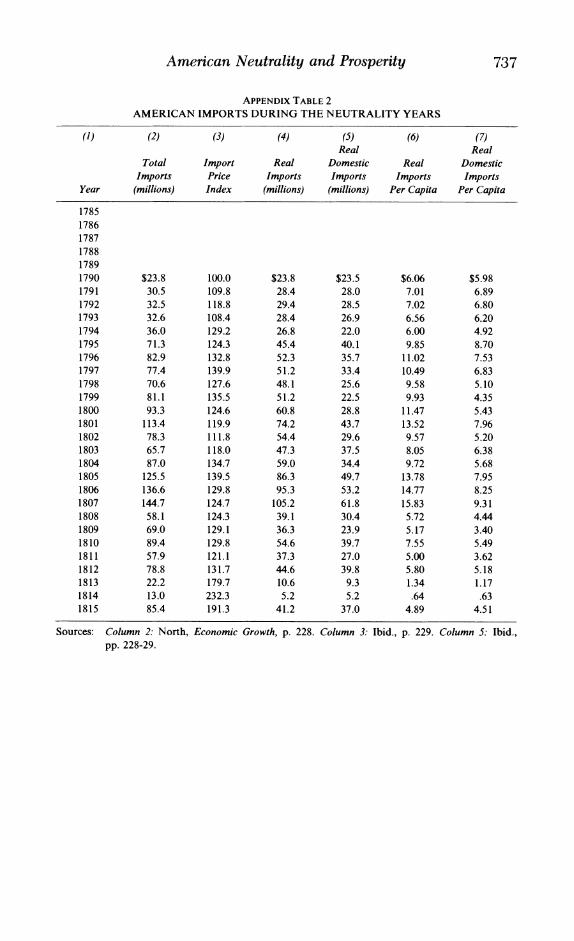
Changing our focus from the aggregate level of economic activity, a closer inspection of the foreign trade sector reveals some interesting trends and casts still more doubt on the hypothesis of neutrality prosperity. Ap- pendix Tables 1 and 2 provide the basic materials necessary for this anal- ysis.
By almost any measure it is evident that American foreign trade lan- guished from the end of the Revolutionary War until 1790. Exports aver- aged from $14 to 17 million annually during these years but experienced a sudden upsurge in 1793 and exceeded $100 million in both 1806 and 1807. Imports also grew rapidly during the early 1790s, declining in response to the quasi-war with France in 1798 and the Peace of Amiens, and achiev- ing peak levels in 1806-1807. Clearly, there is nothing in this pattern to contradict the conventional view of neutrality prosperity.
After adjusting for price changes, however, the pattern of exports be- comes less clear. The increase between 1790 and 1796, for example, ap- pears more gradual and the peaks in 1801 and 1806-1807 are less pro- nounced. Nonetheless, the trough of 1803 and the recovery of 1809-1810 are still clearly visible. On the import side, the real and adjusted data ex- hibit a similar pattern; however, changes in import prices were large in some years so that changes in total real imports varied substantially from the current dollar figures.
If we shift to columns 5 and 7 of Appendix Tables 1 and 2, some signifi-
15 Goldin and Lewis, "The Role of Exports," 10. 16 David, "The Growth of Real Product," 189.
720 Adams
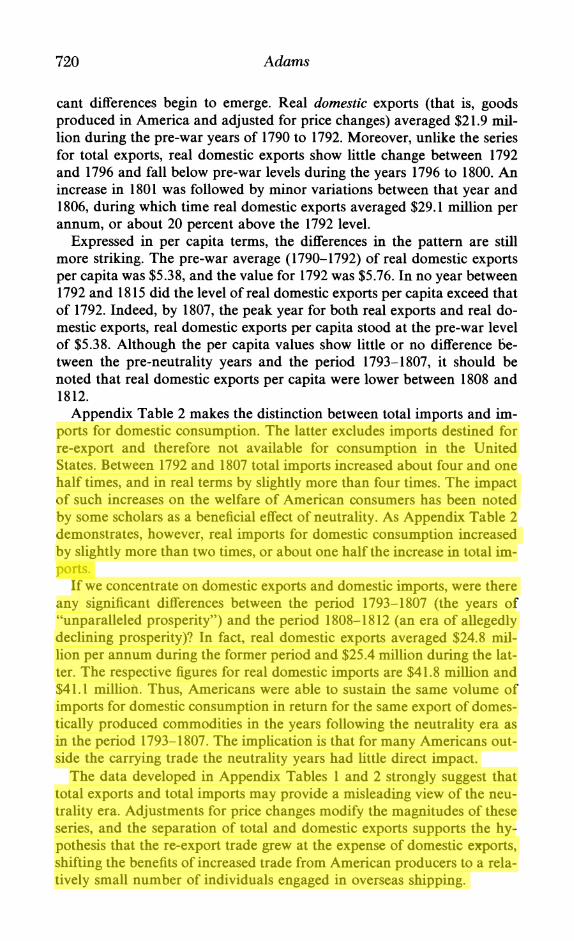
cant differences begin to emerge. Real domestic exports (that is, goods produced in America and adjusted for price changes) averaged $21.9 mil- lion during the pre-war years of 1790 to 1792. Moreover, unlike the series for total exports, real domestic exports show little change between 1792 and 1796 and fall below pre-war levels during the years 1796 to 1800. An increase in 1801 was followed by minor variations between that year and 1806, during which time real domestic exports averaged $29.1 million per annum, or about 20 percent above the 1792 level.
Expressed in per capita terms, the differences in the pattern are still more striking. The pre-war average (1790-1792) of real domestic exports per capita was $5.38, and the value for 1792 was $5.76. In no year between 1792 and 1815 did the level of real domestic exports per capita exceed that of 1792. Indeed, by 1807, the peak year for both real exports and real do- mestic exports, real domestic exports per capita stood at the pre-war level of $5.38. Although the per capita values show little or no difference be- tween the pre-neutrality years and the period 1793-1807, it should be noted that real domestic exports per capita were lower between 1808 and 1812.
Appendix Table 2 makes the distinction between total imports and im- ports for domestic consumption. The latter excludes imports destined for re-export and therefore not available for consumption in the United States. Between 1792 and 1807 total imports increased about four and one half times, and in real terms by slightly more than four times. The impact of such increases on the welfare of American consumers has been noted by some scholars as a beneficial effect of neutrality. As Appendix Table 2 demonstrates, however, real imports for domestic consumption increased by slightly more than two times, or about one half the increase in total im- ports.
If we concentrate on domestic exports and domestic imports, were there any significant differences between the period 1793-1807 (the years of "unparalleled prosperity") and the period 1808-1812 (an era of allegedly declining prosperity)? In fact, real domestic exports averaged $24.8 mil- lion per annum during the former period and $25.4 million during the lat- ter. The respective figures for real domestic imports are $41.8 million and $41.1 million. Thus, Americans were able to sustain the same volume of imports for domestic consumption in return for the same export of domes- tically produced commodities in the years following the neutrality era as in the period 1793-1807. The implication is that for many Americans out- side the carrying trade the neutrality years had little direct impact.
The data developed in Appendix Tables 1 and 2 strongly suggest that total exports and total imports may provide a misleading view of the neu- trality era. Adjustments for price changes modify the magnitudes of these series, and the separation of total and domestic exports supports the hy- pothesis that the re-export trade grew at the expense of domestic exports, shifting the benefits of increased trade from American producers to a rela- tively small number of individuals engaged in overseas shipping.
American Neutrality and Prosperity 721
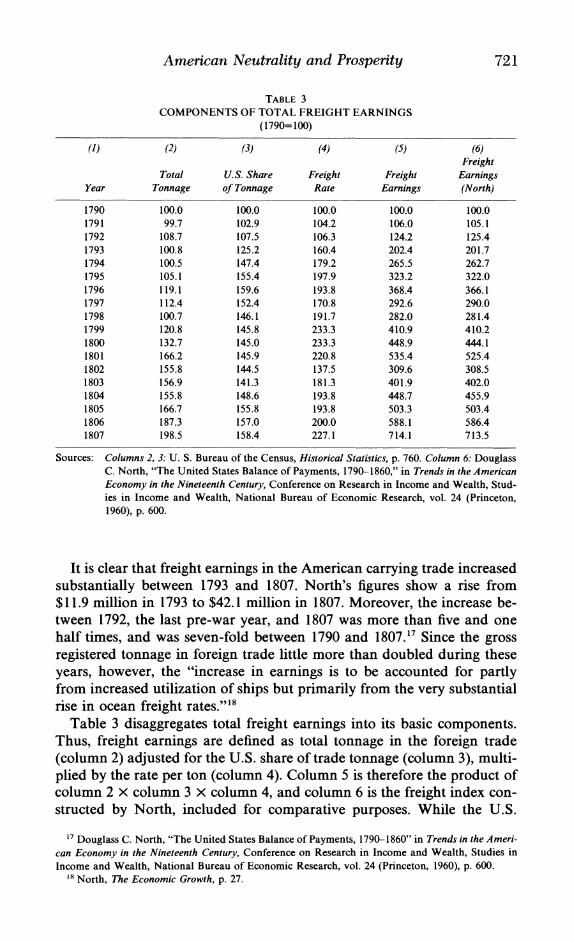
TABLE 3 COMPONENTS OF TOTAL FREIGHT EARNINGS
(1790=100)
(1) (2) (3) (4) (5) (6) Freight
Total U.S. Share Freight Freight Earnings Year Tonnage of Tonnage Rate Earnings (North)
1790 100.0 100.0 100.0 100.0 100.0 1791 99.7 102.9 104.2 106.0 105.1 1792 108.7 107.5 106.3 124.2 125.4 1793 100.8 125.2 160.4 202.4 201.7 1794 100.5 147.4 179.2 265.5 262.7 1795 105.1 155.4 197.9 323.2 322.0 1796 119.1 159.6 193.8 368.4 366.1 1797 112.4 152.4 170.8 292.6 290.0 1798 100.7 146.1 191.7 282.0 281.4 1799 120.8 145.8 233.3 410.9 410.2 1800 132.7 145.0 233.3 448.9 444.1 1801 166.2 145.9 220.8 535.4 525.4 1802 155.8 144.5 137.5 309.6 308.5 1803 156.9 141.3 181.3 401.9 402.0 1804 155.8 148.6 193.8 448.7 455.9 1805 166.7 155.8 193.8 503.3 503.4 1806 187.3 157.0 200.0 588.1 586.4 1807 198.5 158.4 227.1 714.1 713.5
Sources: Columns 2, 3: U. S. Bureau of the Census, Historical Statistics, p. 760. Column 6: Douglass C. North, "The United States Balance of Payments, 1790-1860," in Trends in the American Economy in the Nineteenth Century, Conference on Research in Income and Wealth, Stud- ies in Income and Wealth, National Bureau of Economic Research, vol. 24 (Princeton, 1960), p. 600.
It is clear that freight earnings in the American carrying trade increased substantially between 1793 and 1807. North's figures show a rise from $11.9 million in 1793 to $42.1 million in 1807. Moreover, the increase be- tween 1792, the last pre-war year, and 1807 was more than five and one half times, and was seven-fold between 1790 and 1807.1' Since the gross registered tonnage in foreign trade little more than doubled during these years, however, the "increase in earnings is to be accounted for partly from increased utilization of ships but primarily from the very substantial rise in ocean freight rates."' 8
Table 3 disaggregates total freight earnings into its basic components. Thus, freight earnings are defined as total tonnage in the foreign trade (column 2) adjusted for the U.S. share of trade tonnage (column 3), multi- plied by the rate per ton (column 4). Column 5 is therefore the product of column 2 X column 3 x column 4, and column 6 is the freight index con- structed by North, included for comparative purposes. While the U.S.
'7 Douglass C. North, "The United States Balance of Payments, 1790-1860" in Trends in the Ameri- can Economy in the Nineteenth Century, Conference on Research in Income and Wealth, Studies in Income and Wealth, National Bureau of Economic Research, vol. 24 (Princeton, 1960), p. 600.
18 North, The Economic Growth, p. 27.
722 Adams
share of tonnage in foreign trade increased by slightly more than 47 per- cent between 1792 and 1807, freight rates grew by nearly 114 percent.
Increases in freight rates operated in the same fashion as a tariff. On the one hand, higher rates increased the cost of imported goods, protecting less efficient domestic producers. On the other hand, higher freight rates had an impact similar to an export tax which encouraged import sub- stitution abroad. Higher freight rates worked a particular hardship on American exporters since they represented a larger percentage of the total cost of bulky, low-value exports of foodstuffs and raw materials than of the higher-value, lower-bulk imports of finished products.
If, as North contends, the American advantage in agricultural exports "was not sufficient to overcome high transport costs and assure an ex- panding market in Europe" in 1790, it is difficult to see how higher freight rates after 1793 could have improved this situation.'9 Indeed, as freight rates rose rapidly between 1792 and 1799, U.S. exports of wheat, flour, rice, corn, corn meal, and tobacco fell in real terms. The decline was dras- tic in the case of wheat, flour, and corn.20
Table 3 also indicates that there was a significant difference in the man- ner in which freight earnings grew between 1793 and 1798 on the one hand, and 1799 and 1807 on the other. In the former period the share of foreign trade tonnage registered to Americans grew by nearly 46 percent but total tonnage showed no net increase. During the 1799-1807 period, by contrast, the share of total tonnage registered to Americans grew only 8.6 percent while total tonnage increased nearly 89 percent.
In the earlier period (1793-1798) the "displacement effect" of the re-ex- port trade was most evident. Real domestic exports declined nearly 45 percent over this period. Increases after 1799 resulted in a level of $35.8 million by 1807, but this was short of the $36.3 million value that would be obtained by simply applying the 4.4 percent antebellum growth rate to the 1790-1792 average.
In short, a portion of the increased earnings that accrued to American shippers was obtained at the expense of American consumers who paid higher prices for imported goods and at the cost, at least initially, of a re- duction in the volume of American goods sold abroad. So drastic was the initial decline in domestic exports that their rapid expansion after 1799 was not sufficient, in real terms, to equal predicted values at normal growth rates by 1807.
The years 1793-1807 are portrayed as prosperous ones for American shipbuilders as well as shipowners. American shipwrights were widely ad- mired and although most ship sales were domestic, U.S. bottoms were also popular in many foreign markets. By 1795, U.S. construction reached 100,000 tons annually and by 1800 it is estimated that Americans owned about 669,000 tons of domestically built shipping.2' Average yearly con-
'9 Ibid., p. 20. 20 Pitkin, A Statistical View, pp. 96-97, 101-02, 180. 21 Nettels, The Emergence, p. 242.
American Neutrality and Prosperity 723
struction remained high during 1801-1807 at about 110,000 tons. Follow- ing a decline during the Embargo period, output once more increased in 1809 and 1810, reaching a peak of 146,000 tons in 1811.
Scholars are not in agreement on the magnitude of foreign ship sales. Hutchins, for example, estimates total foreign sales at over $7 million and 200,000 tons between 1798 and 1812. North estimates sales abroad during the same years at more than $12 million.22 This discrepancy can be ex- plained if the cost per ton rose from $35 to $60 during the years in ques- tion. Such an increase is not out of line with our independently derived cost estimates below.
These figures standing alone and out of context are of little value in es- timating the impact of neutrality on the shipbuilding industry. It is useful to keep in mind the fact that the growth of the American owned tonnage in the 1790s as well as the growth of total tonnage in the U.S. foreign trade was in large degree a recovery to levels that existed prior to the Rev- olution.
The proportion of foreign-built ships engaged in the North American trade increased between the Revolution and 1790. This trend was reversed when the new Congress approved the Tonnage Act of July 29, 1789 by which foreign-built, foreign-owned vessels were required to pay a duty of 50 cents per ton on entry rather than the 6 cents per ton charged on Amer- ican-built, American-owned bottoms.23 Partly as a result of this discrimi- natory legislation, the tonnage registered to Americans engaged in foreign trade increased more than two and one half times between 1789 and 1793 alone. By contrast, the years 1793-1807 witnessed an increase of less than one and one half times.24 The proportion of total tonnage in foreign trade owned by Americans increased by 35 percent between 1789 and 1793, compared to 26 percent between 1793 and 1807. Thus, the increasing mar- ket share of American shippers during the neutrality years was the contin- uation of a longer run trend that began as early as the late 1780s.
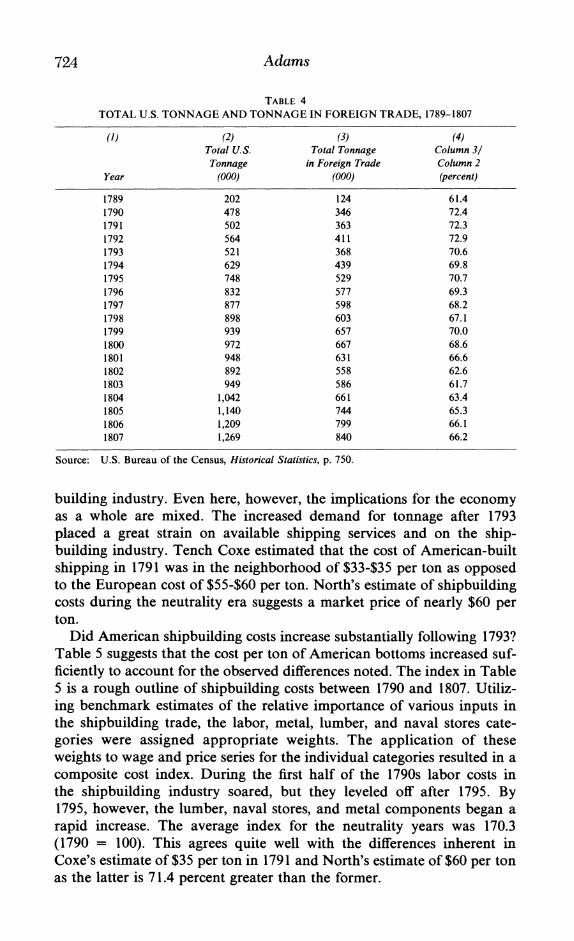
The growth of total tonnage in the American foreign trade was ex- tremely rapid between 1789 and 1792, increasing about 2.3 times. In con- trast, the net increase between 1793 and 1807 was little more than 1.3 times.25 As Table 4 indicates, both tonnage in the foreign trade and total U.S. tonnage increased between 1793 and 1807, but this increase had its roots in the years preceding 1793. It is also interesting to note that the per- centage of total tonnage employed in the foreign trade reached a peak of nearly 73 percent in 1792, averaged 67 percent between 1793 and 1807, and stood at 66 percent in 1807.
Another alleged beneficiary of America's neutral trade was the ship-
22 John G. B. Hutchins, The American Maritime Industries and Public Policy, 1789-1914 (Cam- bridge, MA, 1941), p. 171; North, "The United States Balance of Payments," p. 600.
23 Nettels, The Emergence, p. 111. 24 Emory Johnson et al., History of Domestic and Foreign Commerce of the United States, vol. 2
(Washington, D.C., 1915), p. 28. 25 U.S. Bureau of the Census, Historical Statistics of the United States (Washington, D.C., 1975), p.
445.
724 Adams
TABLE 4 TOTAL U.S. TONNAGE AND TONNAGE IN FOREIGN TRADE, 1789-1807
(1) (2) (3) (4) Total U.S. Total Tonnage Column 3/ Tonnage in Foreign Trade Column 2
Year (000) (000) (percent)
1789 202 124 61.4 1790 478 346 72.4 1791 502 363 72.3 1792 564 411 72.9 1793 521 368 70.6 1794 629 439 69.8 1795 748 529 70.7 1796 832 577 69.3 1797 877 598 68.2 1798 898 603 67.1 1799 939 657 70.0 1800 972 667 68.6 1801 948 631 66.6 1802 892 558 62.6 1803 949 586 61.7 1804 1,042 661 63.4 1805 1,140 744 65.3 1806 1,209 799 66.1 1807 1,269 840 66.2
Source: U.S. Bureau of the Census, Historical Statistics, p. 750.
building industry. Even here, however, the implications for the economy as a whole are mixed. The increased demand for tonnage after 1793 placed a great strain on available shipping services and on the ship- building industry. Tench Coxe estimated that the cost of American-built shipping in 1791 was in the neighborhood of $33-$35 per ton as opposed to the European cost of $55-$60 per ton. North's estimate of shipbuilding costs during the neutrality era suggests a market price of nearly $60 per ton.
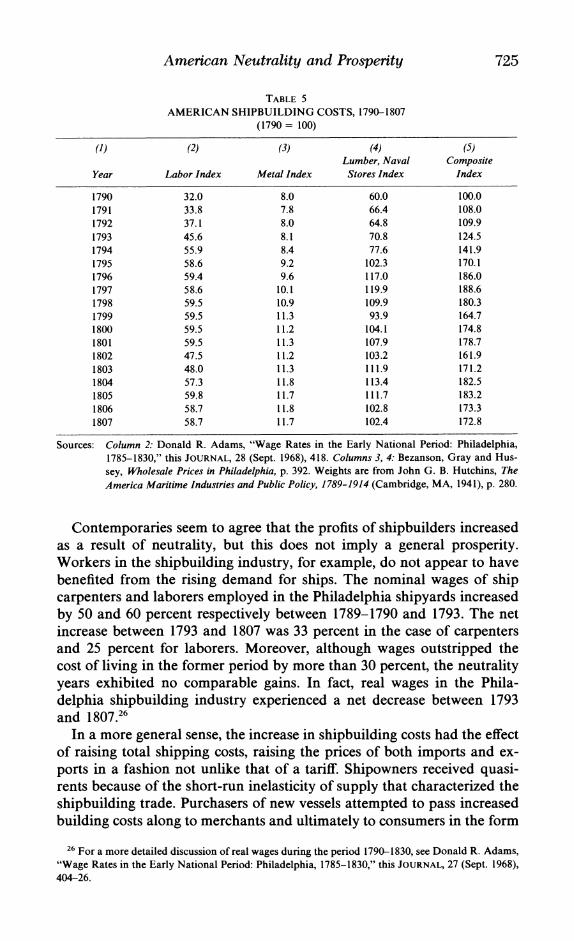
Did American shipbuilding costs increase substantially following 1793? Table 5 suggests that the cost per ton of American bottoms increased suf- ficiently to account for the observed differences noted. The index in Table 5 is a rough outline of shipbuilding costs between 1790 and 1807. Utiliz- ing benchmark estimates of the relative importance of various inputs in the shipbuilding trade, the labor, metal, lumber, and naval stores cate- gories were assigned appropriate weights. The application of these weights to wage and price series for the individual categories resulted in a composite cost index. During the first half of the 1790s labor costs in the shipbuilding industry soared, but they leveled off after 1795. By 1795, however, the lumber, naval stores, and metal components began a rapid increase. The average index for the neutrality years was 170.3 (1790 = 100). This agrees quite well with the differences inherent in Coxe's estimate of $35 per ton in 1791 and North's estimate of $60 per ton as the latter is 71.4 percent greater than the former.
American Neutrality and Prosperity 725
TABLE 5 AMERICAN SHIPBUILDING COSTS, 1790-1807
(1790 = 100)
(1) (2) (3) (4) (5) Lumber, Naval Composite
Year Labor Index Metal Index Stores Index Index
1790 32.0 8.0 60.0 100.0 1791 33.8 7.8 66.4 108.0 1792 37.1 8.0 64.8 109.9 1793 45.6 8.1 70.8 124.5 1794 55.9 8.4 77.6 141.9 1795 58.6 9.2 102.3 170.1 1796 59.4 9.6 117.0 186.0 1797 58.6 10.1 119.9 188.6 1798 59.5 10.9 109.9 180.3 1799 59.5 11.3 93.9 164.7 1800 59.5 11.2 104.1 174.8 1801 59.5 11.3 107.9 178.7 1802 47.5 11.2 103.2 161.9 1803 48.0 11.3 111.9 171.2 1804 57.3 11.8 113.4 182.5 1805 59.8 11.7 111.7 183.2 1806 58.7 11.8 102.8 173.3 1807 58.7 11.7 102.4 172.8
Sources: Column 2: Donald R. Adams, "Wage Rates in the Early National Period: Philadelphia, 1785-1830," this JOURNAL, 28 (Sept. 1968), 418. Columns 3, 4: Bezanson, Gray and Hus- sey, Wholesale Prices in Philadelphia, p. 392. Weights are from John G. B. Hutchins, The America Maritime Industries and Public Policy, 1 789-1914 (Cambridge, MA, 1941), p. 280.
Contemporaries seem to agree that the profits of shipbuilders increased as a result of neutrality, but this does not imply a general prosperity. Workers in the shipbuilding industry, for example, do not appear to have benefited from the rising demand for ships. The nominal wages of ship carpenters and laborers employed in the Philadelphia shipyards increased by 50 and 60 percent respectively between 1789-1790 and 1793. The net increase between 1793 and 1807 was 33 percent in the case of carpenters and 25 percent for laborers. Moreover, although wages outstripped the cost of living in the former period by more than 30 percent, the neutrality years exhibited no comparable gains. In fact, real wages in the Phila- delphia shipbuilding industry experienced a net decrease between 1793 and 1807.2
In a more general sense, the increase in shipbuilding costs had the effect of raising total shipping costs, raising the prices of both imports and ex- ports in a fashion not unlike that of a tariff. Shipowners received quasi- rents because of the short-run inelasticity of supply that characterized the shipbuilding trade. Purchasers of new vessels attempted to pass increased building costs along to merchants and ultimately to consumers in the form
26 For a more detailed discussion of real wages during the period 1790-1830, see Donald R. Adams, "Wage Rates in the Early National Period: Philadelphia, 1785-1830," this JOURNAL, 27 (Sept. 1968), 404-26.
726 Adams
of higher prices. Thus, upward pressure on freight rates came from both the supply and the demand sides of the market.
A rise in the cost of new tonnage was particularly hard on American merchant carriers since it struck a serious blow at their principal cost ad- vantage. As one scholar has noted, "despite the efficient organization of American shipping enterprises and the man driving of the shipmasters, the cost of operating American vessels was considerably above that of the nations of Western Europe throughout the period 1789 to 1914, if the dif- ferences in the prices of new ships are not taken into account."27
Another result of the rising demand for shipping services after 1793 was an increase in the wages of crews to man American vessels. Able-bodied seamen could be had for as little as $12-14 per month before the Napole- onic wars. These rates increased dramatically after 1793, and in Phila- delphia, for example, they varied from $20 to $30 per month between 1794 and 1807. Despite higher nominal wages, rising prices kept seamen's real wages from registering significant gains.28
The chief beneficiaries of the increased demand for American ships ap- pear to have been shipowners, whose quasi-rents increased substantially, and shipbuilders, who experienced increased profits as prices rose more rapidly than wages. Whatever gains accrued to the American shipping sector were highly concentrated among a small number of individuals.
Our analysis suggests that the shift from foreign to domestic carriers be- gan as early as 1789 following the new federal government's assumption of control over foreign commerce and the discriminatory Tonnage Act of 1789. This trend was continued but not accelerated during the years 1793- 1807.29
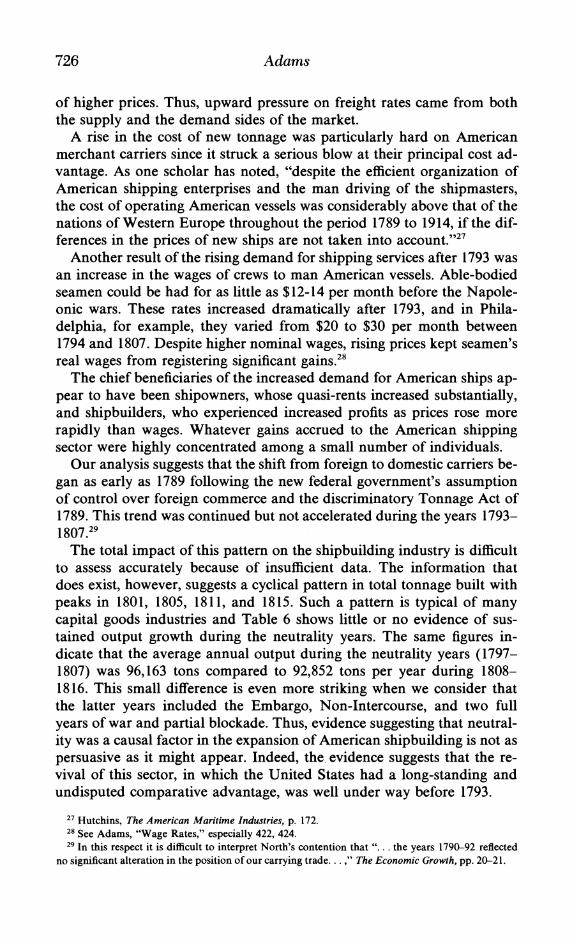
The total impact of this pattern on the shipbuilding industry is difficult to assess accurately because of insufficient data. The information that does exist, however, suggests a cyclical pattern in total tonnage built with peaks in 1801, 1805, 1811, and 1815. Such a pattern is typical of many capital goods industries and Table 6 shows little or no evidence of sus- tained output growth during the neutrality years. The same figures in- dicate that the average annual output during the neutrality years (1797- 1807) was 96,163 tons compared to 92,852 tons per year during 1808- 1816. This small difference is even more striking when we consider that the latter years included the Embargo, Non-Intercourse, and two full years of war and partial blockade. Thus, evidence suggesting that neutral- ity was a causal factor in the expansion of American shipbuilding is not as persuasive as it might appear. Indeed, the evidence suggests that the re- vival of this sector, in which the United States had a long-standing and undisputed comparative advantage, was well under way before 1793.
27 Hutchins, The American Maritime Industries, p. 172. 28 See Adams, "Wage Rates," especially 422, 424. 29 In this respect it is difficult to interpret North's contention that ". . . the years 1790-92 reflected
no significant alteration in the position of our carrying trade. .. ," The Economic Growth, pp. 20-21.
American Neutrality and Prosperity 727
TABLE 6 AMERICAN SHIPBUILDING ACTIVITY,
1797-1815
(1) (2) Total
Tonnage Year Built
1797 56,679 1798 49,435 1799 77,921 1800 106,261 1801 124,755 1802 1803 88,448 1804 103,753 1805 128,507 1806 126,093 1807 99,783 1808 31,755 1809 91,397 1810 127,575 1811 146,691 1812 85,148 1813 32,583 1814 29,751 1815 155,579
Source: U. S. Bureau of the Census, Historical Statistics, p. 751.
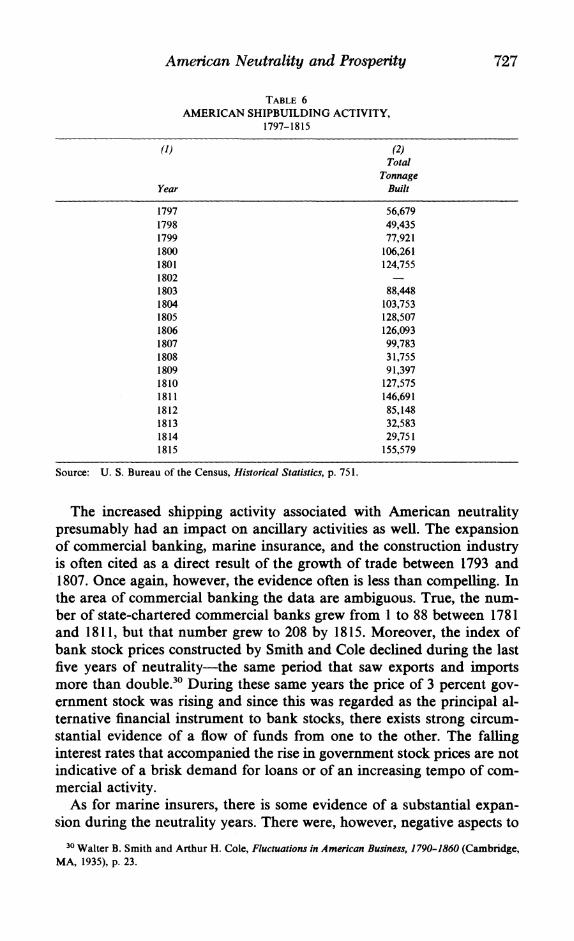
The increased shipping activity associated with American neutrality presumably had an impact on ancillary activities as well. The expansion of commercial banking, marine insurance, and the construction industry is often cited as a direct result of the growth of trade between 1793 and 1807. Once again, however, the evidence often is less than compelling. In the area of commercial banking the data are ambiguous. True, the num- ber of state-chartered commercial banks grew from 1 to 88 between 1781 and 1811, but that number grew to 208 by 1815. Moreover, the index of bank stock prices constructed by Smith and Cole declined during the last five years of neutrality-the same period that saw exports and imports more than double.30 During these same years the price of 3 percent gov- ernment stock was rising and since this was regarded as the principal al- ternative financial instrument to bank stocks, there exists strong circum- stantial evidence of a flow of funds from one to the other. The falling interest rates that accompanied the rise in government stock prices are not indicative of a brisk demand for loans or of an increasing tempo of com- mercial activity.
As for marine insurers, there is some evidence of a substantial expan- sion during the neutrality years. There were, however, negative aspects to
30 Walter B. Smith and Arthur H. Cole, Fluctuations in American Business, 1790-1860 (Cambridge, MA, 1935), p. 23.
728 Adams
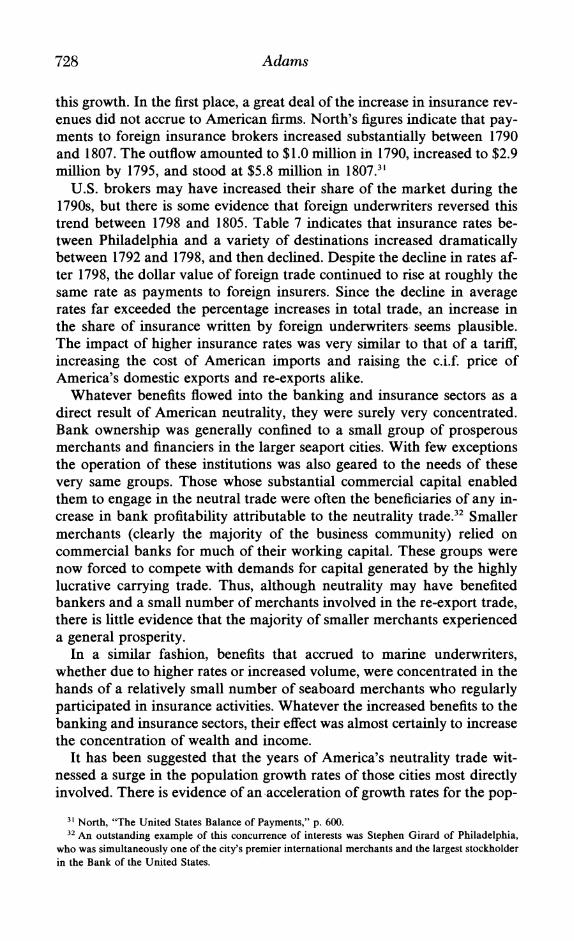
this growth. In the first place, a great deal of the increase in insurance rev- enues did not accrue to American firms. North's figures indicate that pay- ments to foreign insurance brokers increased substantially between 1790 and 1807. The outflow amounted to $1.0 million in 1790, increased to $2.9 million by 1795, and stood at $5.8 million in 1807.3'
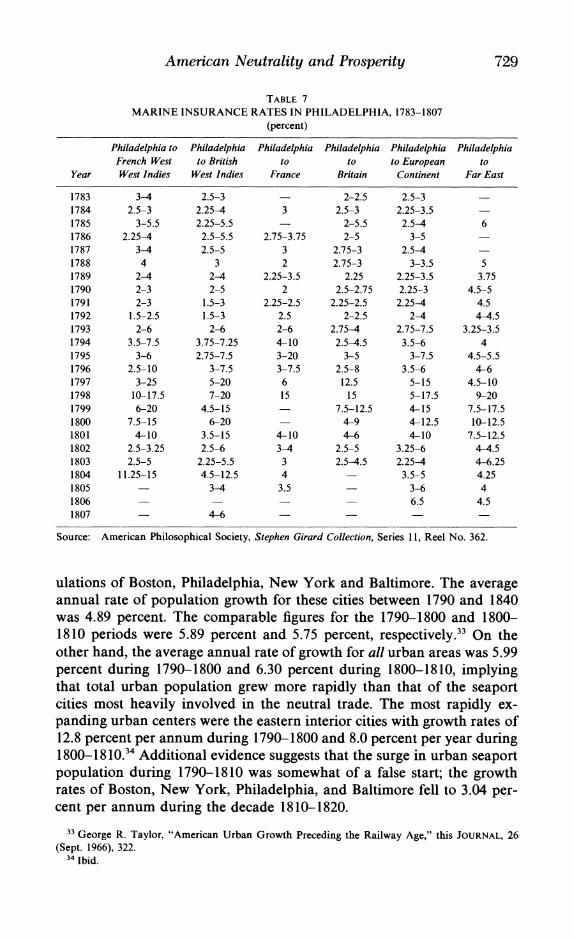
U.S. brokers may have increased their share of the market during the 1790s, but there is some evidence that foreign underwriters reversed this trend between 1798 and 1805. Table 7 indicates that insurance rates be- tween Philadelphia and a variety of destinations increased dramatically between 1792 and 1798, and then declined. Despite the decline in rates af- ter 1798, the dollar value of foreign trade continued to rise at roughly the same rate as payments to foreign insurers. Since the decline in average rates far exceeded the percentage increases in total trade, an increase in the share of insurance written by foreign underwriters seems plausible. The impact of higher insurance rates was very similar to that of a tariff, increasing the cost of American imports and raising the c.i.f. price of America's domestic exports and re-exports alike.
Whatever benefits flowed into the banking and insurance sectors as a direct result of American neutrality, they were surely very concentrated. Bank ownership was generally confined to a small group of prosperous merchants and financiers in the larger seaport cities. With few exceptions the operation of these institutions was also geared to the needs of these very same groups. Those whose substantial commercial capital enabled them to engage in the neutral trade were often the beneficiaries of any in- crease in bank profitability attributable to the neutrality trade.32 Smaller merchants (clearly the majority of the business community) relied on commercial banks for much of their working capital. These groups were now forced to compete with demands for capital generated by the highly lucrative carrying trade. Thus, although neutrality may have benefited bankers and a small number of merchants involved in the re-export trade, there is little evidence that the majority of smaller merchants experienced a general prosperity.
In a similar fashion, benefits that accrued to marine underwriters, whether due to higher rates or increased volume, were concentrated in the hands of a relatively small number of seaboard merchants who regularly participated in insurance activities. Whatever the increased benefits to the banking and insurance sectors, their effect was almost certainly to increase the concentration of wealth and income.
It has been suggested that the years of America's neutrality trade wit- nessed a surge in the population growth rates of those cities most directly involved. There is evidence of an acceleration of growth rates for the pop-
31 North, "The United States Balance of Payments," p. 600. 32 An outstanding example of this concurrence of interests was Stephen Girard of Philadelphia,
who was simultaneously one of the city's premier international merchants and the largest stockholder in the Bank of the United States.
American Neutrality and Prosperity 729
TABLE 7 MARINE INSURANCE RATES IN PHILADELPHIA, 1783-1807
(percent)
Philadelphia to Philadelphia Philadelphia Philadelphia Philadelphia Philadelphia French West to British to to to European to
Year West Indies West Indies France Britain Continent Far East
1783 3-4 2.5-3 2-2.5 2.5-3 1784 2.5-3 2.25-4 3 2.5-3 2.25-3.5 1785 3-5.5 2.25-5.5 2-5.5 2.5-4 6 1786 2.25-4 2.5-5.5 2.75-3.75 2-5 3-5 1787 3-4 2.5-5 3 2.75-3 2.5-4 1788 4 3 2 2.75-3 3-3.5 5 1789 2-4 2-4 2.25-3.5 2.25 2.25-3.5 3.75 1790 2-3 2-5 2 2.5-2.75 2.25-3 4.5-5 1791 2-3 1.5-3 2.25-2.5 2.25-2.5 2.25-4 4.5 1792 1.5-2.5 1.5-3 2.5 2-2.5 2-4 4-4.5 1793 2-6 2-6 2-6 2.75-4 2.75-7.5 3.25-3.5 1794 3.5-7.5 3.75-7.25 4-10 2.5-4.5 3.5-6 4 1795 3-6 2.75-7.5 3-20 3-5 3-7.5 4.5-5.5 1796 2.5-10 3-7.5 3-7.5 2.5-8 3.5-6 4-6 1797 3-25 5-20 6 12.5 5-15 4.5-10 1798 10-17.5 7-20 15 15 5-17.5 9-20 1799 6-20 4.5-15 7.5-12.5 4-15 7.5-17.5 1800 7.5-15 6-20 4-9 4-12.5 10-12.5 1801 4-10 3.5-15 4-10 4-6 4-10 7.5-12.5 1802 2.5-3.25 2.5-6 3-4 2.5-5 3.25-6 4-4.5 1803 2.5-5 2.25-5.5 3 2.5-4.5 2.25-4 4-6.25 1804 11.25-15 4.5-12.5 4 3.5-5 4.25 1805 3-4 3.5 3-6 4 1806 6.5 4.5 1807 4-6
Source: American Philosophical Society, Stephen Girard Collection, Series 11, Reel No. 362.
ulations of Boston, Philadelphia, New York and Baltimore. The average annual rate of population growth for these cities between 1790 and 1840 was 4.89 percent. The comparable figures for the 1790-1800 and 1800- 1810 periods were 5.89 percent and 5.75 percent, respectively.33 On the other hand, the average annual rate of growth for all urban areas was 5.99 percent during 1790-1800 and 6.30 percent during 1800-1810, implying that total urban population grew more rapidly than that of the seaport cities most heavily involved in the neutral trade. The most rapidly ex- panding urban centers were the eastern interior cities with growth rates of 12.8 percent per annum during 1790-1800 and 8.0 percent per year during 1800-1810.34 Additional evidence suggests that the surge in urban seaport population during 1790-1810 was somewhat of a false start; the growth rates of Boston, New York, Philadelphia, and Baltimore fell to 3.04 per- cent per annum during the decade 1810-1820.
33 George R. Taylor, "American Urban Growth Preceding the Railway Age," this JOURNAL, 26 (Sept. 1966), 322.
34 Ibid.
730 Adams
Care must be exercised in evaluating the impact of population growth on economic activity. Urbanization often has proceeded along with eco- nomic growth and development but no simple cause and effect relation- ship has gained general acceptance. History and the contemporary world provide ample evidence that urban centers can grow rapidly in a deterio- rating as well as an expanding economic environment.
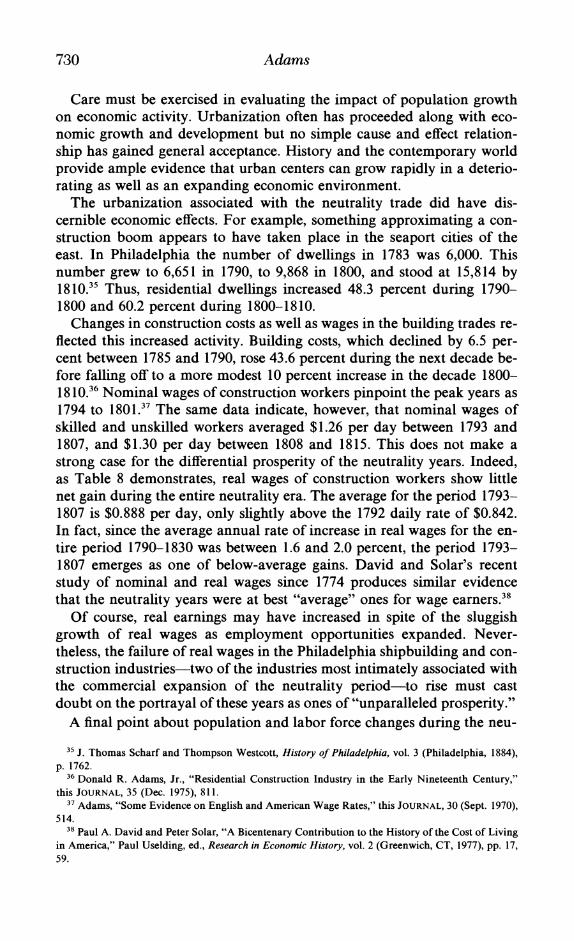
The urbanization associated with the neutrality trade did have dis- cernible economic effects. For example, something approximating a con- struction boom appears to have taken place in the seaport cities of the east. In Philadelphia the number of dwellings in 1783 was 6,000. This number grew to 6,651 in 1790, to 9,868 in 1800, and stood at 15,814 by 18 10.35 Thus, residential dwellings increased 48.3 percent during 1790- 1800 and 60.2 percent during 1800-1810.
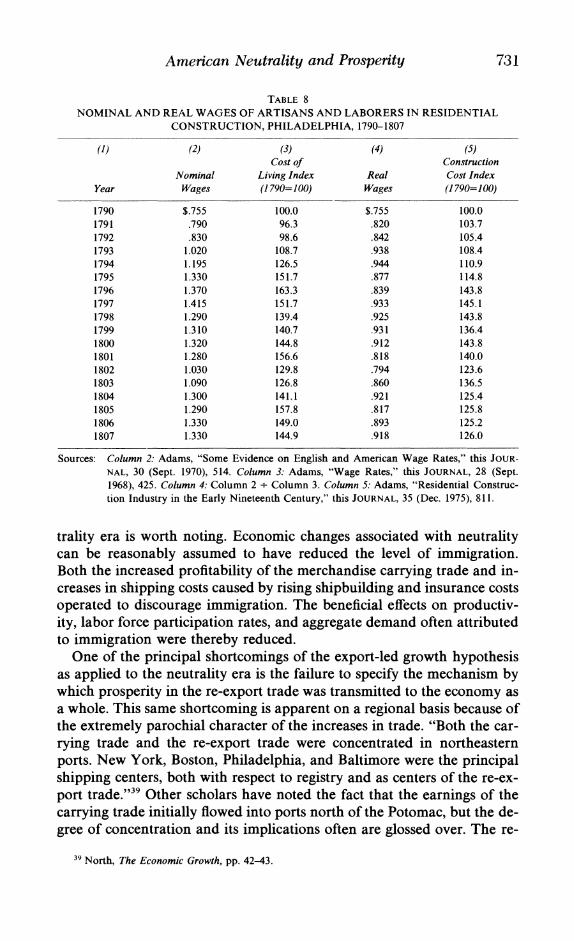
Changes in construction costs as well as wages in the building trades re- flected this increased activity. Building costs, which declined by 6.5 per- cent between 1785 and 1790, rose 43.6 percent during the next decade be- fore falling off to a more modest 10 percent increase in the decade 1800- 1810.36 Nominal wages of construction workers pinpoint the peak years as 1794 to 180 1.3 The same data indicate, however, that nominal wages of skilled and unskilled workers averaged $1.26 per day between 1793 and 1807, and $1.30 per day between 1808 and 1815. This does not make a strong case for the differential prosperity of the neutrality years. Indeed, as Table 8 demonstrates, real wages of construction workers show little net gain during the entire neutrality era. The average for the period 1793- 1807 is $0.888 per day, only slightly above the 1792 daily rate of $0.842. In fact, since the average annual rate of increase in real wages for the en- tire period 1790-1830 was between 1.6 and 2.0 percent, the period 1793- 1807 emerges as one of below-average gains. David and Solar's recent study of nominal and real wages since 1774 produces similar evidence that the neutrality years were at best "average" ones for wage earners.38
Of course, real earnings may have increased in spite of the sluggish growth of real wages as employment opportunities expanded. Never- theless, the failure of real wages in the Philadelphia shipbuilding and con- struction industries-two of the industries most intimately associated with the commercial expansion of the neutrality period-to rise must cast doubt on the portrayal of these years as ones of "unparalleled prosperity."
A final point about population and labor force changes during the neu-
3 J. Thomas Scharf and Thompson Westcott, History of Philadelphia, vol. 3 (Philadelphia, 1884), p. 1762.
36 Donald R. Adams, Jr., "Residential Construction Industry in the Early Nineteenth Century," this JOURNAL, 35 (Dec. 1975), 811.
37 Adams, "Some Evidence on English and American Wage Rates," this JOURNAL, 30 (Sept. 1970), 514.
38 Paul A. David and Peter Solar, "A Bicentenary Contribution to the History of the Cost of Living in America," Paul Uselding, ed., Research in Economic History, vol. 2 (Greenwich, CT, 1977), pp. 17, 59.
American Neutrality and Prosperity 731
TABLE 8 NOMINAL AND REAL WAGES OF ARTISANS AND LABORERS IN RESIDENTIAL
CONSTRUCTION, PHILADELPHIA, 1790-1807
(1) (2) (3) (4) (5) Cost of Construction
Nominal Living Index Real Cost Index Year Wages (1790=100) Wages (1790=100)
1790 $755 100.0 $755 100.0 1791 .790 96.3 .820 103.7 1792 .830 98.6 .842 105.4 1793 1.020 108.7 .938 108.4 1794 1.195 126.5 .944 110.9 1795 1.330 151.7 .877 114.8 1796 1.370 163.3 .839 143.8 1797 1.415 151.7 .933 145.1 1798 1.290 139.4 .925 143.8 1799 1.310 140.7 .931 136.4 1800 1.320 144.8 .912 143.8 1801 1.280 156.6 .818 140.0 1802 1.030 129.8 .794 123.6 1803 1.090 126.8 .860 136.5 1804 1.300 141.1 .921 125.4 1805 1.290 157.8 .817 125.8 1806 1.330 149.0 .893 125.2 1807 1.330 144.9 .918 126.0
Sources: Column 2: Adams, "Some Evidence on English and American Wage Rates," this JOUR-
NAL, 30 (Sept. 1970), 514. Column 3: Adams, "Wage Rates," this JOURNAL, 28 (Sept. 1968), 425. Column 4: Column 2 * Column 3. Column 5: Adams, "Residential Construc- tion Industry in the Early Nineteenth Century," this JOURNAL, 35 (Dec. 1975), 811.
trality era is worth noting. Economic changes associated with neutrality can be reasonably assumed to have reduced the level of immigration. Both the increased profitability of the merchandise carrying trade and in- creases in shipping costs caused by rising shipbuilding and insurance costs operated to discourage immigration. The beneficial effects on productiv- ity, labor force participation rates, and aggregate demand often attributed to immigration were thereby reduced.
One of the principal shortcomings of the export-led growth hypothesis as applied to the neutrality era is the failure to specify the mechanism by which prosperity in the re-export trade was transmitted to the economy as a whole. This same shortcoming is apparent on a regional basis because of the extremely parochial character of the increases in trade. "Both the car- rying trade and the re-export trade were concentrated in northeastern ports. New York, Boston, Philadelphia, and Baltimore were the principal shipping centers, both with respect to registry and as centers of the re-ex- port trade."39 Other scholars have noted the fact that the earnings of the carrying trade initially flowed into ports north of the Potomac, but the de- gree of concentration and its implications often are glossed over. The re-
3 North, The Economic Growth, pp. 42-43.
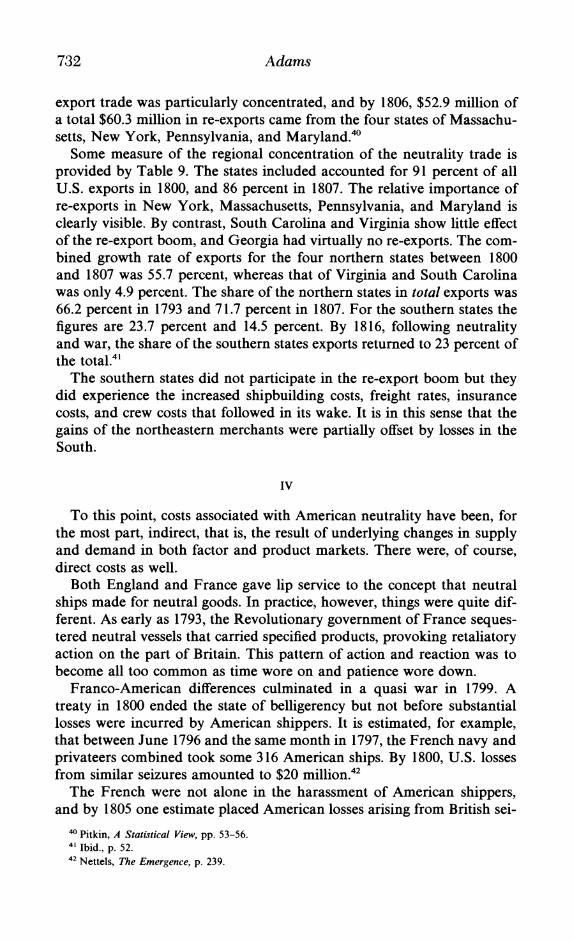
732 Adams
export trade was particularly concentrated, and by 1806, $52.9 million of a total $60.3 million in re-exports came from the four states of Massachu- setts, New York, Pennsylvania, and Maryland.40
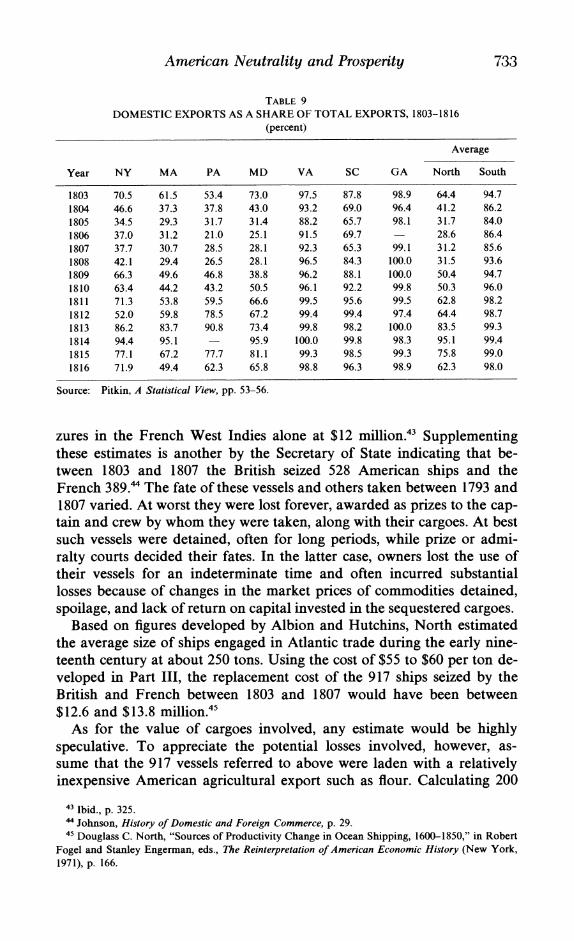
Some measure of the regional concentration of the neutrality trade is provided by Table 9. The states included accounted for 91 percent of all U.S. exports in 1800, and 86 percent in 1807. The relative importance of re-exports in New York, Massachusetts, Pennsylvania, and Maryland is clearly visible. By contrast, South Carolina and Virginia show little effect of the re-export boom, and Georgia had virtually no re-exports. The com- bined growth rate of exports for the four northern states between 1800 and 1807 was 55.7 percent, whereas that of Virginia and South Carolina was only 4.9 percent. The share of the northern states in total exports was 66.2 percent in 1793 and 71.7 percent in 1807. For the southern states the figures are 23.7 percent and 14.5 percent. By 1816, following neutrality and war, the share of the southern states exports returned to 23 percent of the total.4'
The southern states did not participate in the re-export boom but they did experience the increased shipbuilding costs, freight rates, insurance costs, and crew costs that followed in its wake. It is in this sense that the gains of the northeastern merchants were partially offset by losses in the South.
IV
To this point, costs associated with American neutrality have been, for the most part, indirect, that is, the result of underlying changes in supply and demand in both factor and product markets. There were, of course, direct costs as well.
Both England and France gave lip service to the concept that neutral ships made for neutral goods. In practice, however, things were quite dif- ferent. As early as 1793, the Revolutionary government of France seques- tered neutral vessels that carried specified products, provoking retaliatory action on the part of Britain. This pattern of action and reaction was to become all too common as time wore on and patience wore down.
Franco-American differences culminated in a quasi war in 1799. A treaty in 1800 ended the state of belligerency but not before substantial losses were incurred by American shippers. It is estimated, for example, that between June 1796 and the same month in 1797, the French navy and privateers combined took some 316 American ships. By 1800, U.S. losses from similar seizures amounted to $20 million.42
The French were not alone in the harassment of American shippers, and by 1805 one estimate placed American losses arising from British sei-
' Pitkin, A Statistical View, pp. 53-56. 4' Ibid., p. 52. 42 Nettels, The Emergence, p. 239.
American Neutrality and Prosperity 733
TABLE 9
DOMESTIC EXPORTS AS A SHARE OF TOTAL EXPORTS, 1803-1816
(percent)
Average
Year NY MA PA MD VA SC GA North South
1803 70.5 61.5 53.4 73.0 97.5 87.8 98.9 64.4 94.7
1804 46.6 37.3 37.8 43.0 93.2 69.0 96.4 41.2 86.2
1805 34.5 29.3 31.7 31.4 88.2 65.7 98.1 31.7 84.0
1806 37.0 31.2 21.0 25.1 91.5 69.7 28.6 86.4
1807 37.7 30.7 28.5 28.1 92.3 65.3 99.1 31.2 85.6
1808 42.1 29.4 26.5 28.1 96.5 84.3 100.0 31.5 93.6
1809 66.3 49.6 46.8 38.8 96.2 88.1 100.0 50.4 94.7
1810 63.4 44.2 43.2 50.5 96.1 92.2 99.8 50.3 96.0
1811 71.3 53.8 59.5 66.6 99.5 95.6 99.5 62.8 98.2
1812 52.0 59.8 78.5 67.2 99.4 99.4 97.4 64.4 98.7
1813 86.2 83.7 90.8 73.4 99.8 98.2 100.0 83.5 99.3
1814 94.4 95.1 95.9 100.0 99.8 98.3 95.1 99.4
1815 77.1 67.2 77.7 81.1 99.3 98.5 99.3 75.8 99.0
1816 71.9 49.4 62.3 65.8 98.8 96.3 98.9 62.3 98.0
Source: Pitkin, A Statistical View, pp. 53-56.
zures in the French West Indies alone at $12 million.43 Supplementing these estimates is another by the Secretary of State indicating that be- tween 1803 and 1807 the British seized 528 American ships and the French 389." The fate of these vessels and others taken between 1793 and 1807 varied. At worst they were lost forever, awarded as prizes to the cap- tain and crew by whom they were taken, along with their cargoes. At best such vessels were detained, often for long periods, while prize or admi- ralty courts decided their fates. In the latter case, owners lost the use of their vessels for an indeterminate time and often incurred substantial losses because of changes in the market prices of commodities detained, spoilage, and lack of return on capital invested in the sequestered cargoes.
Based on figures developed by Albion and Hutchins, North estimated the average size of ships engaged in Atlantic trade during the early nine- teenth century at about 250 tons. Using the cost of $55 to $60 per ton de- veloped in Part III, the replacement cost of the 917 ships seized by the British and French between 1803 and 1807 would have been between $12.6 and $13.8 million.45
As for the value of cargoes involved, any estimate would be highly speculative. To appreciate the potential losses involved, however, as- sume that the 917 vessels referred to above were laden with a relatively inexpensive American agricultural export such as flour. Calculating 200
4 Ibid., p. 325. 4 Johnson, History of Domestic and Foreign Commerce, p. 29. 4 Douglass C. North, "Sources of Productivity Change in Ocean Shipping, 1600-1850," in Robert
Fogel and Stanley Engerman, eds., The Reinterpretation of American Economic History (New York, 1971), p. 166.
734 Adams
tons, or about 2000 barrels, of flour per ship at the average price of flour between 1803 and 1807, we arrive at a total of $14.8 million. When we consider the fact that many of the cargoes seized or detained were rela- tively high-value commodities destined for re-export, that the figures in- clude only five years of the neutrality era, and that the estimates include only reported seizures, potential losses are significant.46
In additon to the direct cost of losses due to seizures we must also con- sider the increased expenditures made necessary by the increased tempo of American shipping and the increased risk of trade in a world at war. Consider the American naval establishment. Expenditures on the Depart- ment of the Navy between 1790 and 1793 were negligible; they increased to $411,000 in 1794, surpassed $1 million by 1798, and reached a pre-1807 peak of $3.4 million in 1800.47 Average expenditures between 1800 and 1807 were $1.7 million per annum.
Thus, an item that was insignificant in 1790 comprised 5.5 percent of government expenditures in 1795 and 32 percent by 1800. Clearly, naval expenditures would not have remained at the unrealistically low levels of 1790-1793, even in the absence of the Continental Wars. It is equally clear, however, that Britain's decision to stop patrols against the Algerian pirates and the increasing interdiction of America's neutral trade prompted an increase in naval appropriations. Between 1790 and 1795, America's total foreign trade increased by more than 170 percent at a cost of less than $500,000 in naval expenditures. By contrast, the 38 percent in- crease in trade between 1795 and 1800 was accompanied by total naval expenditures of more than $8 million.
V
It is not our contention in this paper that America's status as a neutral trader between 1793 and 1807 was unprofitable. On the contrary, with the British and French merchant marine otherwise occupied and subject to constant search and seizure, U.S. vessels and shipowners served a valu- able and lucrative function in the Atlantic trade network.
Instead, our work suggests the following points. (1) The benefits from neutrality were highly concentrated, accuring to a relatively affluent sub- set of the commercial and industrial community. (2) The overall perform- ance of the economy (in particular the foreign trade sector) during the neutrality era did not always differ significantly from what might have oc- curred in the absence of neutrality had long-term average growth rates prevailed. (3) The terms-of-trade argument is extremely sensitive to the commodity mix chosen and to the choice of initial and terminal dates. (4)
46Because of the profitability of illicit trade during this period it seems likely that some losses went unreported. For the same reason, total trade was no doubt greater than reflected in the official statis- tics.
47 U.S. Bureau of the Census, Historical Statistics, p. 719.
American Neutrality and Prosperity 735
The economic changes often cited as evidence of prosperity during the neutrality era in some cases represent trends that had their roots in the pre-war period. (5) Re-exports may have "crowded out" domestic exports to some degree by bidding up both freight rates and shipbuilding costs. (6) The benefits accruing to sectors affected by neutrality such as ship- building, banking, insurance, and construction were neither as great nor as widespread as some contend. (7) The benefits from neutrality were parochial in a geographic sense and were highly concentrated in the northeastern seaports. (3) The continental wars were disruptive and costly, not only to the belligerents, but also to those who sought to gain from Europe's protracted conflict. (9) The term "unparalleled prosperity" to describe the years from 1793 to 1807 is perhaps too strong a statement if applied to the United States as a whole.
As for contemporary accounts of prosperity, they cannot be denied. We, however, should not forget the narrowness of the observers' views or their ignorance of aggregate economic data. In the mercantile-oriented so- ciety of the early nineteenth century it was no doubt easy to confuse the good fortune of prominent merchants with general prosperity. The farm- ers and urban laborers who constituted the vast majority of the populace received little notice in the contemporary press, and statistical evidence bearing on their material condition was simply unavailable. Perhaps the image of "unparalleled prosperity" during the neutrality era was an early version of the now famous statement that "What's good for General Motors...."
736 Adams
APPENDIX TABLE 1 AMERICAN EXPORTS DURING THE NEUTRALITY YEARS
(1) (2) (3) (4) (5) (6) (7) Real Real
Total Export Real Domestic Real Domestic Exports Price Exports Exports Exports Exports
Year (millions) Index (millions) (millions) Per Capita Per Capita
1785 $14.2 106.0 $13.4 1786 14.4 97.0 14.8 1787 14.4 92.0 15.7 1788 15.5 87.0 17.8 1789 17.5 87.0 20.1 1790 20.2 100.0 20.2 $19.9 $5.14 $5.07 1791 19.0 85.8 22.2 21.6 5.46 5.32 1792 20.8 81.7 25.4 24.2 6.06 5.76 1793 26.1 97.8 26.7 24.9 6.16 5.75 1794 33.0 103.6 31.9 25.6 7.13 5.73 1795 48.0 153.6 31.2 25.9 6.78 5.61 1796 67.1 172.6 38.9 23.6 8.19 4.98 1797 56.9 174.8 35.5 17.1 6.66 3.49 1798 61.5 207.4 29.7 13.8 5.91 2.74 1799 78.7 220.3 35.7 15.0 6.92 2.90 1800 71.0 145.9 48.6 15.0 9.18 2.83 1801 94.1 154.1 61.1 30.8 11.13 5.62 1802 72.5 131.6 55.1 27.9 9.70 4.91 1803 55.8 132.8 42.1 31.8 7.16 5.41 1804 77.7 147.7 52.6 28.1 8.67 4.63 1805 95.6 156.4 61.1 27.1 9.76 4.33 1806 101.5 142.0 71.5 29.1 11.08 4.50 1807 108.3 136.2 79.5 35.8 11.97 5.38 1808 22.4 115.3 19.5 8.2 2.84 1.20 1809 52.2 116.2 44.9 27.0 6.39 3.84 1810 66.8 128.6 51.9 32.9 7.19 4.56 1811 61.3 128.6 47.7 35.2 6.39 4.72 1812 38.5 127.1 30.3 23.6 3.94 3.07 1813 27.9 126.5 22.0 19.8 2.77 2.49 1814 6.9 127.3 5.4 5.3 .67 .65 1815 52.6 182.9 28.7 25.2 3.41 2.98
Sources: Column 2: (1785-1790)--Gordon C. Bjork, "The Weaning of the American Economy: In- dependence, Market Changes, and Economic Development," this JOURNAL, 24 (Dec. 1964), 548, (1791-1815)-Timothy Pitkin, A Statistical View of the Commerce of the United States (New York, 1967), pp. 36-37. Column 3: Douglass C. North, The Economic Growth of the United States, 1790-1860 (New York, 1961), p. 221. Column 5: Eli F. Hecksher, The Continental System (New York, 1922), p. 103; Pitkin, A Statistical View, pp. 36-37.
American Neutrality and Prosperity 737
APPENDIX TABLE 2 AMERICAN IMPORTS DURING THE NEUTRALITY YEARS
(1) (2) (3) (4) (5) (6) (7) Real Real
Total Import Real Domestic Real Domestic Imports Price Imports Imports Imports Imports
Year (millions) Index (millions) (millions) Per Capita Per Capita
1785 1786 1787 1788 1789 1790 $23.8 100.0 $23.8 $23.5 $6.06 $5.98 1791 30.5 109.8 28.4 28.0 7.01 6.89 1792 32.5 118.8 29.4 28.5 7.02 6.80 1793 32.6 108.4 28.4 26.9 6.56 6.20 1794 36.0 129.2 26.8 22.0 6.00 4.92 1795 71.3 124.3 45.4 40.1 9.85 8.70 1796 82.9 132.8 52.3 35.7 11.02 7.53 1797 77.4 139.9 51.2 33.4 10.49 6.83 1798 70.6 127.6 48.1 25.6 9.58 5.10 1799 81.1 135.5 51.2 22.5 9.93 4.35 1800 93.3 124.6 60.8 28.8 11.47 5.43 1801 113.4 119.9 74.2 43.7 13.52 7.96 1802 78.3 111.8 54.4 29.6 9.57 5.20 1803 65.7 118.0 47.3 37.5 8.05 6.38 1804 87.0 134.7 59.0 34.4 9.72 5.68 1805 125.5 139.5 86.3 49.7 13.78 7.95 1806 136.6 129.8 95.3 53.2 14.77 8.25 1807 144.7 124.7 105.2 61.8 15.83 9.31 1808 58.1 124.3 39.1 30.4 5.72 4.44 1809 69.0 129.1 36.3 23.9 5.17 3.40 1810 89.4 129.8 54.6 39.7 7.55 5.49 1811 57.9 121.1 37.3 27.0 5.00 3.62 1812 78.8 131.7 44.6 39.8 5.80 5.18 1813 22.2 179.7 10.6 9.3 1.34 1.17 1814 13.0 232.3 5.2 5.2 .64 .63 1815 85.4 191.3 41.2 37.0 4.89 4.51
Sources: Column 2: North, Economic Growth, p. 228. Column 3: Ibid., p. 229. Column 5: Ibid., pp. 228-29.