Embed Size (px)
Citation preview
Economic Impact Assessment of Invasive Plant Pests
in the European Union
Tarek Soliman
Thesis committee
Thesis supervisor
Prof.dr.ir. A.G.J.M. Oude Lansink
Professor of Business Economics
Wageningen University
Thesis co-supervisor
Dr.ir. W. van der Werf
Associate professor, Crop and Weed Ecology Group
Wageningen University
Dr.ir. M.C.M. Mourits
Assistant professor, Business Economics Group
Wageningen University
Other members
Dr. ir. J. Bremmer, Agricultural Economics Research Institute (LEI), The Hague
Dr. ir. J. Schans, Netherlands Food and Consumer Product Safety Authority (NVWA),
Utrecht
Prof. dr. J. Mumford, Imperial College London, United Kingdom
Prof. dr. E.H. Bulte, Wageningen University
This research was conducted under the auspices of Wageningen Graduate School of Social
Sciences
Economic Impact Assessment of Invasive Plant Pests
in the European Union
Tarek Soliman
Thesis
submitted in fulfilment of the requirements for the degree of doctor
at Wageningen University
by the authority of the Rector Magnificus
Prof. dr. M.J. Kropff,
in the presence of the
Thesis Committee appointed by the Academic Board
to be defended in public
on Wednesday 5 September 2012
at 4 p.m. in the Aula.
Tarek Soliman
Economic Impact Assessment of Invasive Plant Pests in the European Union.
Thesis, Wageningen University, Wageningen, NL (2012)
With references, with summaries in Dutch and English
ISBN 978-94-6173-347-4
1
Abstract
International treaties require that phytosanitary measures against introduction and spread of
invasive plant pests are justified by a science-based pest risk analysis, including an
assessment of potential economic consequences. A quantitative economic impact assessment
of invasive species in the European Union requires spatial integration of information on the
potential for establishment, spread and impacts of the pest at the EU scale, which is a novel
and challenging area in pest risk assessment. A spatial bio-economic framework is needed to
enhance the objectivity and transparency of the European phytosanitary regulation decisions.
In this thesis, a bio-economic framework is developed to conduct quantitative economic
impact analyses of pests. Case studies were performed to explore the feasibility of making
quantitative impact studies at the European scale. Three case studies were made: Potato
Spindle Tuber Viroid, Pine Wood Nematode and Candidatus Liberibacter Solanacearum. The
effect of spatial resolution and economic assessment method on the results is analysed. The
bio-economic framework enables extending of the common practise of impact assessment
from a non-metric estimation of pest risk to true impacts in terms of losses in euros.
The main findings are, first, that partial budgeting and partial equilibrium modelling are
the methods of choice when assessing the economic impacts of pest invasion. Second, a fine
resolution analysis is more relevant than the coarse resolution analysis to risk managers as it
shows a refined geographical distribution of the expected impacts. Third, the potential
economic impacts of Potato Spindle Tuber Viroid into the European Union are demonstrably
of importance when considering market effects or export losses and questionable if only
accounting for the direct losses. Fourth, Pine Wood Nematode has large potential economic
consequences for the conifer forestry industry in the EU. Fifth, an invasion of Candidatus
Liberibacter Solanacearum is likely of ‘major’ economic impact to the European Union.
Therefore, the organism qualifies for the EU quarantine list.
The economic impact assessment framework developed in this thesis shows that it is
possible to quantify the direct and indirect impacts at several levels of detail, in terms of
output resolution and scope of economic impacts, given the availability of required data.
Utilization of this framework may enhance the policy and decision making by governments
and international bodies on managing plant health risks, by making quantitative economic
impact assessments.

2
3
Preface
The completion of this PhD thesis has been made possible due to the contribution and support
of many individuals. I will try to express my sincere gratitude in the next few lines.
First and foremost, I would like to thank my supervisors: Prof. Alfons Oude Lansink,
Dr. Wopke van der Werf and Dr. Monique Mourits. Thank you all for great discussions,
support and monitoring during these years. Alfons, I really appreciate that you gave me the
opportunity to conduct this interdisciplinary PhD research from the first place and to join the
EU project PRATIQUE. Your guidance has been essential over the whole course. Despite
your busy schedule, I have never experienced any delay in getting your feedback on any of
my questions. Wopke, I was very lucky to have you as co-promoter. Your critique was always
constructive and extremely helpful and your guidance in efficient writing has been invaluable.
I appreciate your care, hardworking and your invitations for work meetings at your home.
Monique, I cannot express how glad I am to have you as my daily supervisor. At each step of
my PhD work, I have learned a lot from your guidance, meticulous reviewing and
commenting of the manuscripts, and the discussions afterwards at the scientific and personal
level.
Special thanks go also to Geerten Hengeveld for introducing me to the world of
Geographical Information System, and Argyris Kanellopoulos and Sander Janssen to the
SEAMLESS database. Thanks to Christelle Robinet for allowing me to use the results of her
pest spread model in my thesis.
I would like to thank Richard Baker, Françoise Petter, Johan Bremmer, Jan Benninga,
Wil Hennen, John Mumford, Jan Schans, Alan Macloed, and Hella Kehlenbeck for the
cooperation, interaction, discussions, and helpful comments during the PRATIQUE meetings.
Furthermore, I would like to thank the EPPO experts and consultants. In particular, Neil
Giltrap and Dirk Jan Van der Gaag for helpful suggestions and discussion. Special thanks go
also to Annelien Roenhorst for helpful discussion on PSTVd.
I want also to thank all the colleagues from the Business Economics Group for creating
a great atmosphere for work. I am grateful to the secretaries of the department, Anne Houwers
and Sijlmans Karin, for all the administrative support during my PhD. I am particularly
thankful to my officemate Teo Skevas for the nice discussions we had during working hours
and for the basketball games with the Greek community in Wageningen. Also I want to thank
4
all friends I met in Wageningen during these four years and with whom I shared some good
moments.
My gratitude goes to Gitte Schober for giving me the opportunity to attend the
Entrepreneurial Boot Camp at the University of Wisconsin (USA). Many thanks to all the
colleagues I met during the business meetings in Wageningen and Wisconsin for the nice
times. It was a pleasure to meet you all.
I would like also to thank all the Egyptian people in Wageningen with whom I
communicated with during these years for nice times and a good feeling of being not so far
away from Egypt. In particular, my friends, Mohamed Salah and Ahmed Abdel Halim.
Lastly and most importantly, I wish to thank my parents, Abdellatif Soliman and Safaa
Helmy. I must mention here the immeasurable all rounded support I received from them. I am
also deeply grateful to my beloved brother Hatem for his constant advices, encouragement
and support.
Tarek Soliman
Wageningen, April 2012
5
Contents
Chapter 1 General Introduction 7
Chapter 2 Economic Impact Assessment in Pest Risk Analysis 17
Chapter 3 Quantitative Economic Impact Assessment of an Invasive Plant Disease
Under Uncertainty – a Case Study for PSTVd Invasion into the
European Union
41
Chapter 4 Framework for Modelling Economic Impacts of Invasive Species,
Applied to Pine Wood Nematode in Europe
63
Chapter 5 Economic Justification for Quarantine Status – the Case Study of
Candidatus Liberibacter Solanacearum in the European Union.
91
Chapter 6 Quantitative Economic Impact Assessment: When is it Worth the
Effort?
111
Chapter 7 General Discussion 135
Summary 145
Samenvatting (Summary in Dutch) 149
Publications 153
About the Author 155
Completed Training and Supervision Plan 157

6
7
Chapter 1
General Introduction
Chapter 1
8
1.1 Background
The worldwide increase of trade in plant material, the introduction of new crops and the
continued expansion of trade blocks (e.g. the EU) have resulted in increased threats of
introducing new plant pests (Enserink, 1999). The cost of non-native pests and diseases and
their control has been estimated at $120 billion per year in the USA (Pimentel et al., 2005),
and the estimated damage from invasive species worldwide is estimated at more than $1.4
trillion per year - five percent of the global economy (Pimentel et al., 2001). The damage
caused by non-native plant pests varies from impacts at producer level by reducing product
quality or quantity, to impacts at society level by creating food insecurity and economic
disruption, or large-scale environmental damage.
In the nineteenth century, Phytophthora infestans, the causal agent of potato late blight,
has demonstrated the enormous socio-economic impact that plant pests can have, by causing
the Irish potato famine. Currently, the annual economic impact from late blight is estimated at
€1 billion per year in Europe (Haverkort et al., 2008) and $5 billion per year worldwide
(Haldar et al, 2006; Haverkort et al. 2009). An example of an invasive pest species
responsible for economic and environmental impacts is the fungus Ophiostoma ulmi, causal
agent of Dutch elm disease (Brasier, 1991). It was first recognized as a new disease in the
Netherlands in 1919 and subsequently spread throughout most of Europe, western Asia and
North America. During the twenty century, up to 40% of the European elm population was
killed by O. ulmi (Brasier, 2001). Another pest example with economic and environmental
importance is the pine wood nematode, Bursaphelenchus xylophilus, which threatens the
European forestry industry since its introduction in Portugal in 1999.
Recently, in European agriculture, several pests were of main concern for potato
production such as Clavibacter michiganensis subsp. sepedonicus, a bacterial pathogen
causing potato ring rot, and Ralstonia solanacearum, a bacterium causing potato brown rot
(CABI/EPPO, 1997). Yield losses due to invertebrates in potatoes were estimated at €1,688
million per annum in the European Union (Inman, 2007). For instance, the Colorado potato
beetle, which was introduced in Europe from the USA, is considered one of the most
destructive pests in potatoes. New threats in other crops include Tuta absoluta, a serious
threat to tomato production in Mediterranean region (Desneux et al., 2010); and the western
corn rootworm (Diabrotica virgifera virgifera), one of the most important insect pests, whose
control costs and crop losses have been estimated at $1,000 million per annum in the USA
Chapter 1
9
(Metcalf, 1986). Diabrotica virgifera virgifera is spreading rapidly in the EU where its cost
has been estimated at €147 million per annum (Wesseler and Fall, 2010).
According to the International Plant Protection Convention (IPPC) and the World Trade
Organization Agreement on the Application of Sanitary and Phytosanitary measures (WTO-
SPS Agreement) (WTO, 2009), any measure aimed at preventing the introduction and spread
of new pests must be justified by a science-based pest risk analysis (PRA). This technical
justification is required to avoid any misuse of the measures for protectionist purposes.
PRA is a process that evaluates technical, scientific and economic evidence to
determine whether an organism shall be categorized as quarantine pest and, if so, how it
should be managed. It consists of three stages (1) initiation of the PRA through identification
of a pest or pathway, or review of the existing phytosanitary policy, (2) pest risk assessment,
and (3) pest risk management (FAO, 2011).
Historically, pest risk analyses are performed in individual countries for their own
territory. These are called national PRAs. PRAs at supra-national scales, such as the EU, are
needed to justify supra-national phytosanitary legislation and associated phytosanitary
recommendations. As a result, supra-national bodies such as the European and Mediterranean
Plant Protection Organization (EPPO) and the European Food Safety Authority (EFSA)
started to conduct PRA at regional (e.g. European and Mediterranean) or EU scale since 2006.
Conducting a PRA at supra-national scale could reduce costs and workload associated with
conducting PRAs for individual countries (Petter et al., 2010). EPPO is the Regional Plant
Protection Organization for Europe and Mediterranean region that was established under the
International Plant Protection Convention (IPPC). EPPO promotes inter-regional cooperation
in plant health without any legal force although their advisory powers can be strong (Mourits
et al., 2011). EFSA is an agency of the European Union that provides independent scientific
advice and communication on existing and emerging risks associated with plants and food
chain. PRAs carried out by these international organizations facilitate decisions regarding
plant health in the EU (Council Directive 2000/29/EC). To achieve a more effective and
efficient PRA at the EU level, the techniques already applied for assessing economic impacts
of plant pests need to be evaluated and enhanced (Baker et al., 2009).
Chapter 1
10
1.2 Problem statement
Usually, economic impact assessments within a PRA are made using a decision tree
framework with qualitative questions and no explicit quantification of costs (Sansford, 2002;
Brunel et al., 2009). Such a qualitative approach is usually structured according to the
International Standard for Phytosanitary Measures (ISPM) 11 developed by the International
Plant Protection Convention (IPPC) (EPPO, 2009). The qualitative scheme consists of a
sequence of questions that capture the expert opinion. These questions address the size of the
expected impact with and without control measures, the efficacy of the existing control
measures, expected increase in production costs if the pest is present, the expected change in
consumer demand and the expected losses in the export market. For each question, the expert
provides his answer by selecting a score (within five levels). The qualitative approach has low
costs and makes efficient use of expert knowledge, but suffers from lack of transparency and
repeatability (Sansford, 2002). A qualitative approach may be fit for purpose if data are
seriously lacking or time is limited. However, if quantitative data on distribution of hosts,
climate, and spread potential are available, a detailed quantitative impact assessment may be
preferable. A quantitative approach could provide policy makers with better information for
decision making (Carrasco, 2009) and provide a stronger position in trade disputes. However,
in many cases where the essential data are available, these quantitative analyses are not
performed (Leung et al., 2002).
ISPMs do not provide detailed guidance on how to conduct a quantitative risk
assessment in PRA (Baker, 1996). This assessment is particularly difficult when a large area,
such as Europe, with a wide variety of climatic zones and crop agro-ecosystems is being
studied. In the last decade, efforts have been made to introduce quantitative methods in the
pest risk assessment phase e.g. fundamental niche maps that integrate climate and host crops
(Guisan and Zimmermann, 2000; Kriticos and Randall, 2001; Elith et al., 2006) and models of
pest spread (Carrasco et al., 2010; Robinet et al., 2011). Limited efforts have been conducted
to evaluate and improve economic impacts modelling at the supra-national scale.
Advances in economic impact assessment require integration of disciplines such as
invasion biology, regulatory plant health, and economics, and are therefore difficult to
achieve. From a practical perspective, economic impact assessment requires substantial
biological, environmental and economic input data as well as multidisciplinary skills to
achieve integration, which provides a challenge for the teams conducting PRAs. The required
Chapter 1
11
biological data provide information on where the pest can establish (its fundamental niche),
how it spreads from an initial point of entry, and builds up a population capable of causing
damage. Economic data provide information on distribution and value of host crops, and
market data such as quantities of host crops supplied by producers and demanded by
consumers, quantities of host crop traded with the rest of the world and prices in relation to
supply and demand.
By necessity, these biological and economic data, such as spread, suitability of the
environment for establishment and assets at risk, are spatially explicit. Input data are rarely
available at a common resolution. Therefore, rescaling (up - and down scaling) to one
common resolution is usually required. The choice of resolution for data integration depends
on the resolutions of the original source data, on the formulation of the objectives, and on the
time available for making the analysis, taking into account that analyses at finer resolution
cost more time.
A wide array of economic techniques is available to assess impacts. Techniques can be
applied at several spatial resolutions (e.g. farm, national and continental level) and address
different impacts (e.g. producer, market/sector and the whole economy). Evaluation of the
performance of different techniques is needed to determine the most suitable method, given
the purpose of the analysis and the available data and resources. It is difficult to derive the
best method without considering practical examples. Case studies are needed in which the
outcomes of different techniques and approaches are contrasted, so these can act as “case in
point” and “reference cases” when choosing between techniques.
1.3 Research objectives
The overall aim of the research is to develop a bio-economic framework at the EU level to
assess the economic impacts of pest invasion, integrating relevant knowledge on fundamental
niche, spread, and direct and indirect economic effects. The framework combines niche and
spread models with economic impact models bridging differences in spatial resolution. The
framework is applied to pests that differ in terms of the scope of economic impacts, available
information, and assessment objective, to attest its feasibility. Four sub-objectives were
identified:
Review the economic techniques that can be used in economic impact assessments as
a part of a PRA.
Chapter 1
12
Develop a bio-economic framework that determines the direct and indirect economic
impacts and estimates either the dynamics of economic impacts over time from the
start of the invasion till the steady state situation, or the yearly impact at the steady
state situation.
Compare economic impact assessments based on coarse and fine projections of
economic impacts.
Explore the strengths and weaknesses of qualitative and quantitative assessment
approaches to estimate the economic impacts and to determine the data and model
requirements of quantitative economic impact assessments.
1.4 Case studies
Three case studies were conducted: Potato Spindle Tuber Viroid (PSTVd), Pine Wood
Nematode (PWN) and Candidatus Liberibacter Solanacearum (CLS).
PSTVd is a pest that is already present in the EU and listed as regulated pest.
Phytosanitary measures against PSTVd are already in place. However, a quantitative impact
assessment has never been conducted and a quantitative economic justification for the present
measures is therefore lacking. Although the pest has been present in the EU since 1976
(Scottish Plant Breeding Station, 1976), data and knowledge on pest biology are rather poor,
raising the question how to conduct a quantitative pest impact analysis under uncertainty.
PWN has been introduced recently into Portugal in 1999 (Mota et al., 1999) and
threatens to invade other parts of Europe. Although emergency measures have been applied to
prevent the further spread of PWN, recent inspections indicated that enforcement of the
control measures has been insufficient. A detailed economic assessment is made here to
evaluate the economic justification of the expected future intensification of control measures
and to provide decision support to spatially explicit targeting of management programs to
high risk areas (i.e. those areas where the expected economic impacts are the highest).
CLS is a bacterium that has been recently discovered in 2008 (Liefting, 2008), but has
not yet been introduced into the EU. There is a need to determine whether the bacterium poses
an important potential economic impact to the EU.
Chapter 1
13
1.5 Overview of the thesis
Chapter 2 evaluates the main techniques that could be selected for conducting quantitative
economic impact assessment: partial budgeting, partial equilibrium modelling, input output
analysis, and computable general equilibrium analysis. This evaluation process will support
the selection of the most appropriate technique to estimate the economic consequences of pest
invasion.
Chapter 3 develops a bio-economic framework that assesses the economic cost of
PSTVd in the EU. Direct impacts are estimated as well as the total change in welfare. These
estimated impacts are compared with the costs of the current phytosanitary measures in order
to verify whether the measures are economically justified. Uncertainty due to scarcity of data
on PSTVd spread and impact on yield is addressed.
Chapter 4 develops a bio-economic framework to estimate the dynamics of economic
impacts over time due to the expected spread of PWN in the EU. The bio-economic model
integrates a pest spread model with economic models. The case study clarifies the impact of
spatial resolution and economic assessment method on the results. Also, the requirements in
terms of effort and data are discussed in order to support the risk analyst in deciding the
selection of method.
Chapter 5 assesses the potential economic impacts of CLS in the EU. The bio-
economic model is based on a potential pest spread module elicited from experts and a
quantitative economic module. The economic analysis could be followed in similar cases
where it is difficult to make a reliable point estimate of the economic impact, but where it can
nevertheless be shown that the uncertain economic losses are with a high degree of certainty
greater than the threshold that identifies pests with major economic impacts.
Chapter 6 clarifies the data and models required to conduct a quantitative economic
impact assessment to make a decision on pest quarantine status or to justify management
measures. It compares the strengths and weaknesses of a qualitative versus quantitative
approach when conducting economic impact assessment.
Chapter 7 is devoted to a general discussion on the methodological contributions and
plant health policy implications derived from this research. The chapter finishes with the main
conclusions of the thesis.
Chapter 1
14
References
Baker R.H.A., 1996. Developing a European pest risk mapping system. Bulletin OEPP/EPPO Bulletin 26, 485 –
494.
Baker RHA., Battisti A, Bremmer J, Kenis M, Mumford J, Petter F, Schrader G, Bacher S, De Barro P, Hulme
PE, Karadjova O, Lansink AO, Pruvost O, Pysek P, Roques A, Baranchikov Y, Sun JH, 2009. PRATIQUE:
a research project to enhance pest risk analysis techniques in the European Union. EPPO/OEPP Bulletin 39,
87-93.
Brasier CM, 1991. Ophiostoma novo-ulmi sp. nov., causative agent of current Dutch elm disease pandemics.
Mycopathologia, 115(3):151-161
Brasier CM, 2001. Rapid evolution of introduced plant pathogens via interspecific hybridization. BioScience, 51,
123-133.
Brunel S, Petter F, Fernandez-Galiano E, Smith I, 2009. Approach of the European and Mediterranean plant
protection organization to the evaluation and management of risks presented by invasive alien plants. In:
Inderjit (Ed.), Management of Invasive Weeds. Springer, Netherlands, pp. 319–343.
CABI/EPPO, 1997. Quarantine Pests for Europe (2nd Ed). CAB International, Wallingford, Oxon, UK.
Carrasco LR, Harwood TD, Toepfer S, MacLeod A, Levay N, Kiss J, 2010. Dispersal kernels of the invasive
alien western corn rootworm and the effectiveness of buffer zones in eradication programmes in Europe,
Annual Applied Biology 156, 63–77.
Carrasco RL, 2009. Modelling for Pest Risk Analysis: Spread and Economic Impacts, Imperial College London,
Centre for Environmental Policy, UK
Desneux N, Wajnberg E, Wyckhuys KAG, Burgio G, Arpaia S, Narva´ez-Vasquez CA, lez-Cabrera JG, Catalan
Ruescas D, Tabone E, Frandon J, Pizzol J, Poncet C, Cabello T, Urbaneja A, 2010. Biological invasion of
European tomato crops by Tuta absoluta: ecology, geographic expansion and prospects for biological control,
Journal of Pest Science 83, 197–215
EFSA, 2010. Panel on Plant Health (PLH); Risk assessment of the oriental chestnut gall wasp, Dryocosmus
kuriphilus for the EU territory on request from the European Commission. EFSA Journal 8(6), 1619.
EFSA, 2011. Panel on Plant Health (PLH); Pest risk assessment of Monilinia fructicola for the EU territory and
identification and evaluation of risk management options. EFSA Journal 9(4), 2119.
Elith J, Graham CH, Anderson RP, Dudık M, Ferrier S, Guisan A, Hijmans RJ, Huettmann F, Leathwick JR,
Lehmann A, Li J, Lohmann LG, Loiselle BA, Manion G, Moritz C, Nakamura M, Nakazawa Y, Overton J
McC, Peterson AT, Phillips SJ, Richardson KS, Scachetti-Pereira R, Schapire RE, Soberon J, Williams S,
Wisz MS, Zimmermann NE, 2006. Novel Methods Improve Prediction of Species' Distributions From
Occurrence Data. Ecography 29, 129-151.
Enserink M, 1999. Predicting invasions: Biological invaders sweep in. Science 285, 1834-1836.
FAO, 2004. Pest Risk Analysis for Quarantine Pests Including Analysis of Environmental Risks. International
Standards for Phytosanitary Measures. Publication No. 11. Rev. 1. FAO, Rome (IT).
Guisan A, Zimmermann NE, 2000. Predictive habitat distribution models in ecology. Ecological Modelling 135,
147-186.
Haldar K., Kamoun S, Hiller NL, Bhattacharje S, van Ooij C, 2006. Common infection strategies of pathogenic
eukaryotes. Nature Reviews Microbiology 4, 922-931
Haverkort AJ, Boonekamp PM, Hutten R, Jacobsen E, Lotz LAP, Kessel GJT, Visser RGF, van der Vossen
EAG, 2008. Societal costs of late blight in potato and prospects of durable resistance through cisgenic
modification. Potato Research 51, 47–57.
Haverkort AJ, Struik PC, Visser RGF, Jacobsen E, 2009. Applied Biotechnology to combat late blight in potato
caused by Phytophthora infestans. Potato Research 52, 249—264.
Hulme PE, Pysek P, Nentwig W, Vila M, 2009. ECOLOGY: Will Threat of Biological Invasions Unite the
European Union? Science 324, 40-41.
Inman A, 2007. The importance of coordinating phytosanitary research in Europe. Plant science 44, 3-7.
IPPC, 2012. International plant protection convention. https://www.ippc.int/index.php?id=13399. Accessed
26.01.2012
Kriticos DJ, Randall RP, 2001. A comparison of systems to analyse potential weed distributions. Groves R. H.,
Panetta FD, Virtue JG, Eds. Weed Risk Assessment. Melbourne, Australia: CSIRO Publishing; pp. 61-79.
Chapter 1
15
Leung B, Lodge DM, Finnoff D, Shogren JF, Lewis MA, Lamberti G, 2002. An ounce of prevention or a pound
of cure: bioeconomic risk analysis of invasive species. Proceedings of the Royal Society B: Biological
Sciences 269, 2407-2413.
Liefting L. 2008. New 'Candidatus liberabacter' species infecting solanaceous crops. Biosecurity 85, 21.
Metcalf RL, 1986. Foreword. In J. L. Krysan and T. A. Miller [eds.], Methods for the study of pest Diabrotica.
Springer, New York.
Mota MM, Braasch H, Bravo MA, Penas AC, Burgermeister W, Metge K., Sousa E (1999) First report of
Bursaphelenchus xylophilus in Portugal and in Europe. Nematology 1(8): 727-734.
Mourits M, Schans J, Oude Lansink A, 2011. Plant health policy. Chapter 12 in EU policy for agriculture, food
and rural areas. Ed by Oskam A., Meester G., Silvis H., pp 225-247, Wageningen Academic publisher
Petter F., Brunel S., Suffert M., 2010. The role of plant pathology in food safety and food security, Plant
Pathology in the 21st Century 3, 137-150
Pimentel D, McNair S, Janecka J, Wightman J, Simmonds C, O'Connell C, Wong E, Russel L, Zern J, Aquino T,
Tsomondo T, 2001. Economic and environmental threats of alien plant, animal, and microbe invasions.
Agriculture, Ecosystems and Environment 84, 1-20
Pimentel D, Zuniga R, Morrison D, 2005. Update on the environmental and economic costs associated with
alien-invasive species in the United States. Ecological Economics 52, 273-288.
Robinet C, Van Opstal N, Baker R, Roques A, 2011. Applying a spread model to identify the entry points from
which the pine wood nematode, the vector of pine wilt disease, would spread most rapidly across Europe.
Biological Invasions. In press
Sansford C, 2002. Quantitative Versus Qualitative: Pest Risk Analysis in the UK and Europe including the
European and Mediterranean Plant Protection (EPPO) System. NAPPO International Symposium on Pest
Risk Analysis Puerto Vallarta, Mexico.
Scottish Plant Breeding Station, 1976. Report of the Scottish Plant Breeding Station for 1975-1976.
Pentlandfield, Roslin, Midlothian, UK, 86 pp.
Vila M, Basnou C, Pysek P, Josefsson M, Genovesi P, Gollasch S, Nentwig W, Olenin S, Roques A, Roy D,
Hulme PE, 2009. How well do we understand the impacts of alien species on ecosystem services? A pan-
European, cross-taxa assessment. Frontiers in Ecology and the Environment (in press).
Wesseler J, Fall EH, 2010. Potential damage costs of Diabrotica virgifera virgifera infestation in Europe – the
‘no control’ scenario, Journal of Applied Entomology 134, 385–394
WTO, World Trade Organization, 2009. http://www.wto.org/english/tratop_e/sps_e/spsagr_e.htm. Accessed
27.05.2009.

16
17
Chapter 2
Economic Impact Assessment in Pest Risk Analysis
Soliman T., Mourits M.C.M., Oude Lansink A.G.J.M., van der Werf W., 2010. Economic impact
assessment in pest risk analysis, Crop Protection 29, 517–524
Chapter 2
18
Abstract
According to international treaties, phytosanitary measures against introduction and
spread of invasive plant pests must be justified by a science-based pest risk analysis
(PRA). Part of the PRA consists of an assessment of potential economic consequences.
This paper evaluates the main available techniques for quantitative economic impact
assessment: partial budgeting, partial equilibrium analysis, input output analysis, and
computable general equilibrium analysis. These techniques differ in width of scope with
respect to market mechanisms (relationships between supply, demand, and prices), and
linkages between agriculture and other sectors of the economy. As a consequence,
techniques differ in their ability to assess direct and indirect (e.g. economy-wide) effects
of pest introduction. We provide an overview of traits of the available methods to
support the selection of the most appropriate technique for conducting a PRA.
Techniques with a wider scope require more elaborate data, and greater effort to
conduct the analysis. Uncertainties are compounded as methods with greater scope are
used. We propose that partial budgeting should be conducted in any risk assessment,
while more sophisticated techniques should be employed if the expected gains in insight
outweigh the costs and compounded uncertainties.
Keywords:
Pest risk analysis - economic methods – impact analysis – pest invasion – risk
assessment
Chapter 2
19
2.1 Introduction
The worldwide increase of trade in plant material, the introduction of new crops and the
continued expansion of trade blocks (e.g. the EU) result in increased threats of introduction of
new plant pests. According to the International Plant Protection Convention (IPPC) and the
World Trade Organisation Agreement on the Application of Sanitary and Phytosanitary
Measures (WTO SPS Agreement) (WTO, 2009), any measure against the introduction and
spread of new pests must be justified by a science-based pest risk analysis (PRA). As a result,
PRAs are an essential component of plant health policy, allowing trade to flow as freely as
possible, while minimizing to a reasonable and justifiable extent the risk of introduction of
plant pests.
FAO (2007a) defines a PRA as “the process of evaluating biological or other scientific
and economic evidence to determine whether an organism is a pest, whether it should be
regulated, and the strength of any phytosanitary measures to be taken against it”. As part of a
PRA, an “evaluation of the probability of the introduction and spread of a pest and the
magnitude of the associated potential economic consequences” is conducted. Estimation of
the potential economic consequences of pest invasions is thus a fundamental component of
every PRA. If the risk of introduction and spread is judged to be unacceptable, phytosanitary
measures can be imposed to reduce the risk to an acceptable level (FAO, 2004).
Two International Standards on Phytosanitary Measures (ISPMs), ISPM No. 2 (FAO,
2007b), “Guidelines for Pest Risk Analysis” and ISPM No. 11 (FAO, 2004) “Pest Risk
Analysis for quarantine pests” set out the procedures for conducting PRAs for quarantine
pests (IPPC, 2009). Standard No. 2 focuses on the initiation stage of a PRA while the
emphasis in standard No.11 is on the pest risk assessment and risk management components
of a PRA. In ISPM No.11, a distinction is made between qualitative and quantitative
approaches for economic analysis. Qualitative approaches use expert judgment measured in
non-metric terms (e.g. Likert scale), while quantitative approaches focus on information
expressed in metric terms (FAO, 2007a).
In practice, the economic assessment within most PRAs, including those undertaken in
Europe follow the PRA scheme and are based mostly on a qualitative approach, i.e. expert
judgment (Sansford 2002; Brunel et al., 2009). Expert judgment has enormous advantages in
terms of low cost and efficient use of qualitative expert knowledge, but it may suffer from
important drawbacks as lack of transparency and repeatability (Sansford, 2002). Qualitative
Chapter 2
20
approaches may be (ab)used for political or protectionist goals. To guard against this, many
plant protection agencies in the world, including the European Plant Protection Organization
(EPPO) have developed explicit decision schemes for making PRAs. The scheme provides
detailed instructions for the successive stages of PRA, providing a framework for organizing
biological and other scientific and economic information, and assessing risk. This leads to the
identification of management options to reduce risk to an acceptable level (Anonymous, 1997;
Brunel et al., 2009). Such a structured procedure makes a qualitative approach explicit and
transparent, but the underpinning of a decision during application of the scheme may still be
subjective, even if it is explicit. The need for quantitative and more objective approaches is
therefore keenly felt (Baker et al., 2009).
ISPM No.11 mentions in particular three techniques for quantitative economic
assessment: partial budgeting, partial equilibrium analysis and computable general
equilibrium analysis. Partial budgeting is a method that addresses the additional costs and lost
revenues that are incurred at the producer level when a pest invades. This method takes into
account the area attacked by the pest, the loss per unit area, and the price of the product, but it
does not include relationships between production volume and prices, or interlinkages
between markets. Partial equilibrium modelling does take into account the price effects of
changes in production volume in addition to those factors already taken into account by
partial budgeting. Partial equilibrium modelling techniques also address linkages to other
agricultural markets, e.g. due to substitution of one product by another. Computable general
equilibrium modelling techniques are the most comprehensive and complex tools to look at
effects of pest invasion on the whole economy. The techniques thus differ markedly in scope,
i.e. the extent to which the impacts for the economy at wide are addressed. As a result they
differ in data requirements, the level of expertise needed to conduct the analysis, and the time
investment required to complete an analysis. Partial budgeting is the easiest and fastest to
conduct, and computable general equilibrium modelling the most difficult and time
consuming. No guidance is given in ISPM No.11 as to the pros and cons of different
techniques for conducting economic impact assessment.
The limited use of quantitative economic techniques, and advanced economic
techniques in particular, may be due to limited familiarity with these techniques in the
professional field of regulatory plant protection. More generally, it is not clear whether the
greater scope of more advanced techniques justifies the extra effort required in terms of data
collection and human resources (Vose, 2001; Sansford, 2002). Also, it is felt that advanced
Chapter 2
21
techniques may require data that are impossible to obtain or characterize with sufficient
certainty. It is felt that the more comprehensive techniques may introduce more uncertainty in
the results than is justified by the extra insights they may provide (Vose, 2001; Sansford,
2002). The key question is: what added value does an advanced quantitative method for
assessing economic impacts bring to the PRA, and does this extra value justify the costs in
terms of data and resources?
In this paper we review the main quantitative methods that may be used for estimating
the economic impact of pest invasions. We evaluate characteristics of these methods in terms
of goals, founding principles, scope, and data requirements, and provide criteria that may be
used in selecting the most appropriate technique for conducting a PRA.
2.2 Quantitative economic techniques
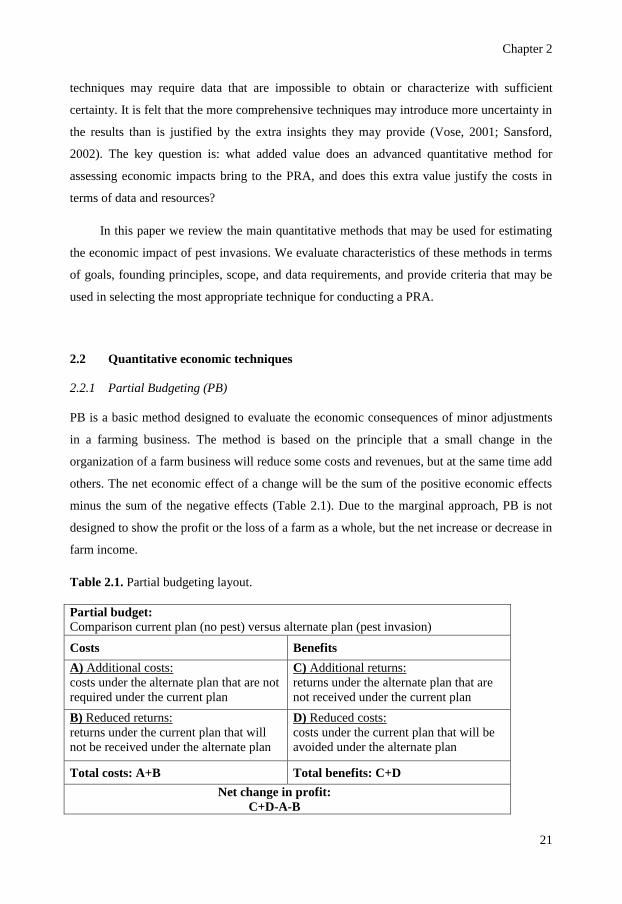
2.2.1 Partial Budgeting (PB)
PB is a basic method designed to evaluate the economic consequences of minor adjustments
in a farming business. The method is based on the principle that a small change in the
organization of a farm business will reduce some costs and revenues, but at the same time add
others. The net economic effect of a change will be the sum of the positive economic effects
minus the sum of the negative effects (Table 2.1). Due to the marginal approach, PB is not
designed to show the profit or the loss of a farm as a whole, but the net increase or decrease in
farm income.
Table 2.1. Partial budgeting layout.
Partial budget:
Comparison current plan (no pest) versus alternate plan (pest invasion)
Costs Benefits
A) Additional costs:
costs under the alternate plan that are not
required under the current plan
C) Additional returns:
returns under the alternate plan that are
not received under the current plan
B) Reduced returns:
returns under the current plan that will
not be received under the alternate plan
D) Reduced costs:
costs under the current plan that will be
avoided under the alternate plan
Total costs: A+B Total benefits: C+D
Net change in profit:
C+D-A-B
Chapter 2
22
With respect to plant production, various PB applications are known, primarily
assessing the profitability of management options such as irrigation, pesticide use and
fertilizer use (e.g. Arpaia et al., 1996; Donovan et al., 1999; Pemsl et al., 2004). Partial
budgeting is also a suitable tool for assessing the economic impact of pests (Macleod et al.,
2003; FAO, 2004).
The strength of PB in conducting a pest risk assessment is its simplicity and
transparency. PB has a low complexity level with respect to resource needs as it requires a
limited amount of data, skills, and time investment (Holland, 2007). Although the method is
designed to evaluate the direct impact at the producer level, PB can also be used at the
national or continental level by scaling up the budgetary impacts of the individual farms (Rich
et al., 2005). Macleod et al. (2003) and Breukers et al. (2008) used PB to assess economic
consequences of invasion of a quarantine pest or disease at the national level. However, PB is
not suited to measure long-term effects or impacts in other sectors of the economy due to its
reliance on fixed budgets with predetermined coefficients (i.e. price) to describe an isolated
activity. Any change in production caused by a pest invasion could have a long-term effect on
total market supply and prices, thereby affecting other producers and other sectors of the
economy such as transport and the processing industry (Macleod et al., 2003). Aggregation of
PB results from a representative farm to reflect costs at a higher scale will therefore only be
representative if price effects and interlinkages with other sectors are weak. These
shortcomings of PB can be counterbalanced by a complementary use of techniques that are
described below.
Box 1: An illustrative example on Partial budgeting.
The case study of Potato Spindle Tuber Viroid (PSTVd)
This example uses PB to evaluate the direct economic consequences (viz. yield and/or
quality losses and additional protection costs) of a PSTVd invasion in the EU. Initiation
steps within the evaluation consist of 1) identification of the endangered along with 2)
estimation of the potential for spread and 3) determination of the economic value of
susceptible assets within the endangered area. Regarding the second step, we assume for
simplicity, that PSTVd will invade the whole endangered area (worst case scenario).
Chapter 2
23
2.2.2 Partial Equilibrium Modelling (PE)
PE is a powerful tool to evaluate the welfare effects on participants in a market which is
affected by a shock like a policy intervention or an introduction of a pest. The approach is
based on defining functional relationships for supply and demand for the commodity of
interest to determine the market equilibrium or, in other words, the combination of prices and
quantities that maximizes social welfare (Mas-Colell, 1995). Maximum social welfare is
realized when consumers and producers - in aggregated terms - maximize their utilities and
profits as illustrated in Figure 1A.
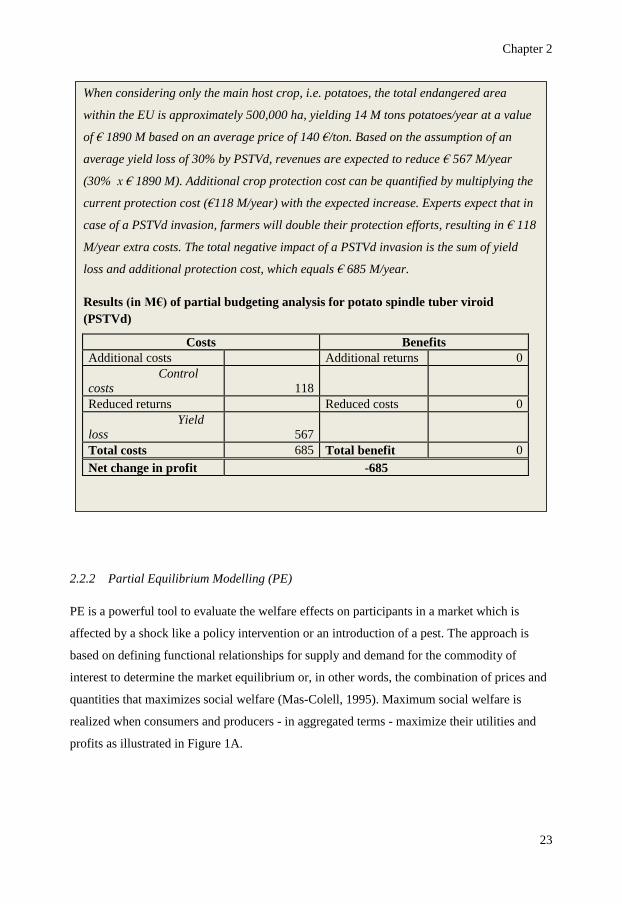
When considering only the main host crop, i.e. potatoes, the total endangered area
within the EU is approximately 500,000 ha, yielding 14 M tons potatoes/year at a value
of € 1890 M based on an average price of 140 €/ton. Based on the assumption of an
average yield loss of 30% by PSTVd, revenues are expected to reduce € 567 M/year
(30% x € 1890 M). Additional crop protection cost can be quantified by multiplying the
current protection cost (€118 M/year) with the expected increase. Experts expect that in
case of a PSTVd invasion, farmers will double their protection efforts, resulting in € 118
M/year extra costs. The total negative impact of a PSTVd invasion is the sum of yield
loss and additional protection cost, which equals € 685 M/year.
Results (in M€) of partial budgeting analysis for potato spindle tuber viroid
(PSTVd)
Costs Benefits
Additional costs Additional returns 0
Control
costs 118
Reduced returns Reduced costs 0
Yield
loss 567
Total costs 685 Total benefit 0
Net change in profit -685
Chapter 2
24
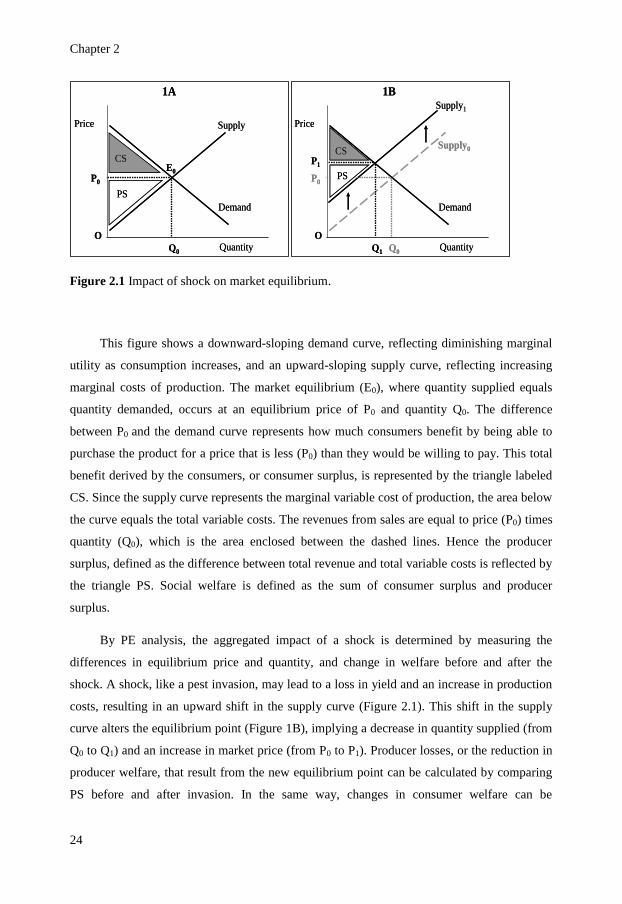
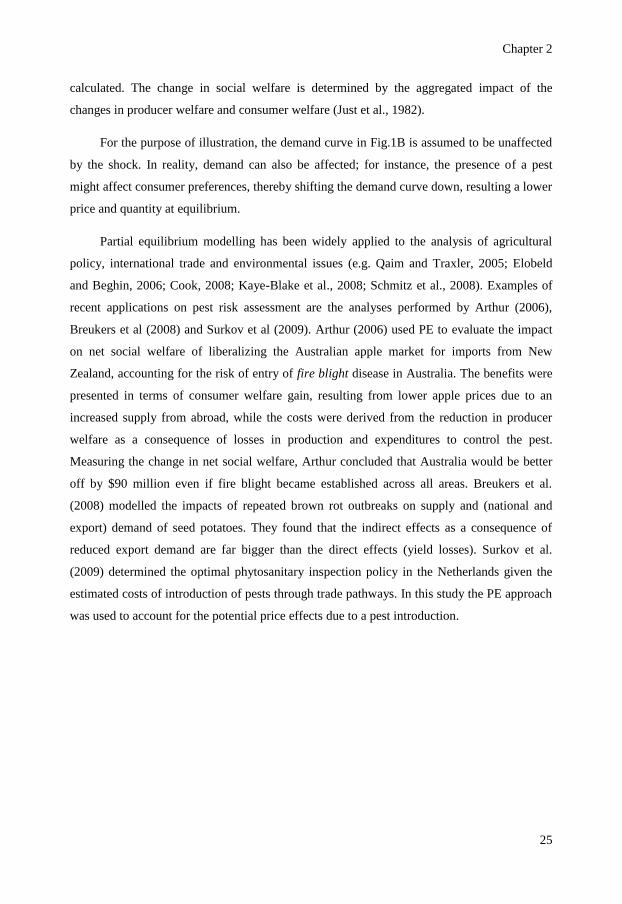
Figure 2.1 Impact of shock on market equilibrium.
This figure shows a downward-sloping demand curve, reflecting diminishing marginal
utility as consumption increases, and an upward-sloping supply curve, reflecting increasing
marginal costs of production. The market equilibrium (E0), where quantity supplied equals
quantity demanded, occurs at an equilibrium price of P0 and quantity Q0. The difference
between P0 and the demand curve represents how much consumers benefit by being able to
purchase the product for a price that is less (P0) than they would be willing to pay. This total
benefit derived by the consumers, or consumer surplus, is represented by the triangle labeled
CS. Since the supply curve represents the marginal variable cost of production, the area below
the curve equals the total variable costs. The revenues from sales are equal to price (P0) times
quantity (Q0), which is the area enclosed between the dashed lines. Hence the producer
surplus, defined as the difference between total revenue and total variable costs is reflected by
the triangle PS. Social welfare is defined as the sum of consumer surplus and producer
surplus.
By PE analysis, the aggregated impact of a shock is determined by measuring the
differences in equilibrium price and quantity, and change in welfare before and after the
shock. A shock, like a pest invasion, may lead to a loss in yield and an increase in production
costs, resulting in an upward shift in the supply curve (Figure 2.1). This shift in the supply
curve alters the equilibrium point (Figure 1B), implying a decrease in quantity supplied (from
Q0 to Q1) and an increase in market price (from P0 to P1). Producer losses, or the reduction in
producer welfare, that result from the new equilibrium point can be calculated by comparing
PS before and after invasion. In the same way, changes in consumer welfare can be
Quantity
Price
Demand
Supply
P0
CS
PS
O
Q0
E0
1A
Quantity
Price
Demand
Supply
P0
CS
PS
O
Q0
E0
1A
Quantity
Price
Demand
Supply1
P1
CS
PS
O
Q1
Supply0
P0
Q0
1B
Quantity
Price
Demand
Supply1
P1
CS
PS
O
Q1
Supply0
P0
Q0
1B
Chapter 2
25
calculated. The change in social welfare is determined by the aggregated impact of the
changes in producer welfare and consumer welfare (Just et al., 1982).
For the purpose of illustration, the demand curve in Fig.1B is assumed to be unaffected
by the shock. In reality, demand can also be affected; for instance, the presence of a pest
might affect consumer preferences, thereby shifting the demand curve down, resulting a lower
price and quantity at equilibrium.
Partial equilibrium modelling has been widely applied to the analysis of agricultural
policy, international trade and environmental issues (e.g. Qaim and Traxler, 2005; Elobeld
and Beghin, 2006; Cook, 2008; Kaye-Blake et al., 2008; Schmitz et al., 2008). Examples of
recent applications on pest risk assessment are the analyses performed by Arthur (2006),
Breukers et al (2008) and Surkov et al (2009). Arthur (2006) used PE to evaluate the impact
on net social welfare of liberalizing the Australian apple market for imports from New
Zealand, accounting for the risk of entry of fire blight disease in Australia. The benefits were
presented in terms of consumer welfare gain, resulting from lower apple prices due to an
increased supply from abroad, while the costs were derived from the reduction in producer
welfare as a consequence of losses in production and expenditures to control the pest.
Measuring the change in net social welfare, Arthur concluded that Australia would be better
off by $90 million even if fire blight became established across all areas. Breukers et al.
(2008) modelled the impacts of repeated brown rot outbreaks on supply and (national and
export) demand of seed potatoes. They found that the indirect effects as a consequence of
reduced export demand are far bigger than the direct effects (yield losses). Surkov et al.
(2009) determined the optimal phytosanitary inspection policy in the Netherlands given the
estimated costs of introduction of pests through trade pathways. In this study the PE approach
was used to account for the potential price effects due to a pest introduction.
Chapter 2
26
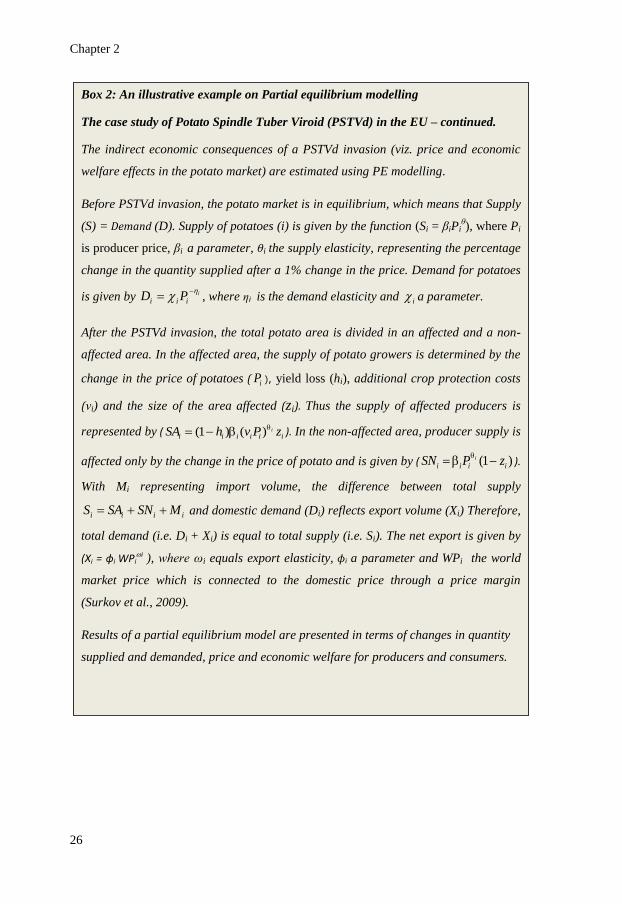
Box 2: An illustrative example on Partial equilibrium modelling
The case study of Potato Spindle Tuber Viroid (PSTVd) in the EU – continued.
The indirect economic consequences of a PSTVd invasion (viz. price and economic
welfare effects in the potato market) are estimated using PE modelling.
Before PSTVd invasion, the potato market is in equilibrium, which means that Supply
(S) = Demand (D). Supply of potatoes (i) is given by the function (Si = βiPiθ), where Pi
is producer price, βi a parameter, θi the supply elasticity, representing the percentage
change in the quantity supplied after a 1% change in the price. Demand for potatoes
is given by i
iii PD
, where ηi is the demand elasticity and i a parameter.
After the PSTVd invasion, the total potato area is divided in an affected and a non-
affected area. In the affected area, the supply of potato growers is determined by the
change in the price of potatoes ( iP ), yield loss (hi), additional crop protection costs
(νi) and the size of the area affected (zi). Thus the supply of affected producers is
represented by ( iiiiii zPvhSA i )()1( ). In the non-affected area, producer supply is
affected only by the change in the price of potato and is given by ( )1( iiii zPSN i
).
With Mi representing import volume, the difference between total supply
iiii MSNSAS and domestic demand (Di) reflects export volume (Xi) Therefore,
total demand (i.e. Di + Xi) is equal to total supply (i.e. Si). The net export is given by
(Xi = ϕi WPii ), where ωi equals export elasticity, ϕi a parameter and WPi the world
market price which is connected to the domestic price through a price margin
(Surkov et al., 2009).
Results of a partial equilibrium model are presented in terms of changes in quantity
supplied and demanded, price and economic welfare for producers and consumers.
Chapter 2
27
The use of PE within a pest risk assessment is appropriate when the pest impacts are
expected to change prices or social welfare significantly. PE analyses can be conducted with
respect to one sector (single-sector model) or multiple sectors (multi-market model). Multi-
market models link related markets and are, therefore, able to capture spillover effects
between main markets as, for example, the impact of a pest affecting wheat supply on supply
and demand of potential substitute crops like corn. The calculation of producer and consumer
surplus in multiple markets involves sequentially computing the effects in each of the affected
markets.
Within each PE model main assumptions needs to be made to define the structure of the
affected market(s) (e.g. perfect competition), the level of homogeneity for products from
exogenous markets and the influence of domestic producers on the world market. Data
requirements can be substantial (Mas-Colell, 1995; Rich et al., 2005; Backer et al., 2009) as
data are needed to reflect the affected markets, including data on prices, quantities, and price
elasticities of both supply and demand.
Despite its suitability for the evaluation of effects on markets of agricultural
commodities, PE is limited in its ability to account for economy-wide effects. PRA by PE is,
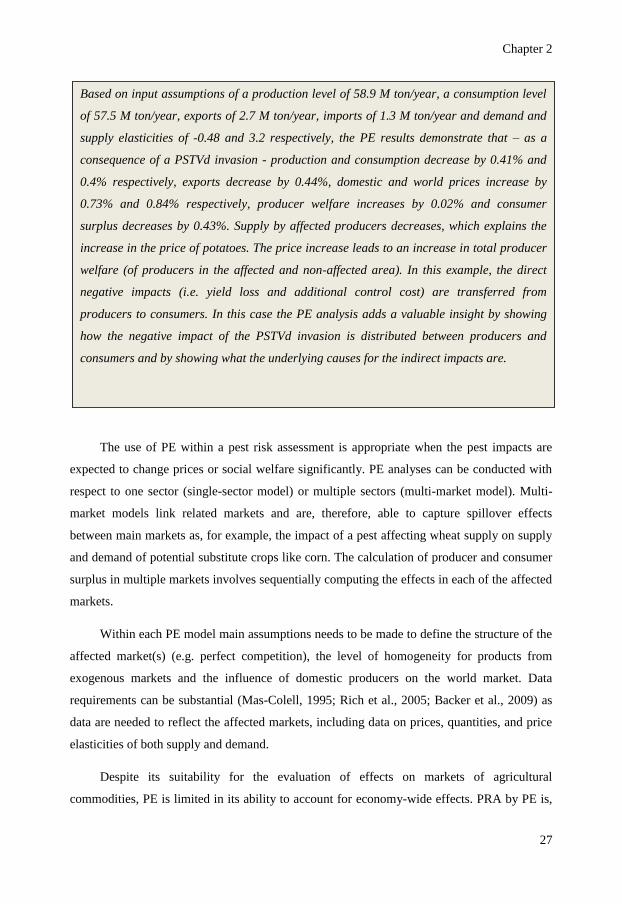
Based on input assumptions of a production level of 58.9 M ton/year, a consumption level
of 57.5 M ton/year, exports of 2.7 M ton/year, imports of 1.3 M ton/year and demand and
supply elasticities of -0.48 and 3.2 respectively, the PE results demonstrate that – as a
consequence of a PSTVd invasion - production and consumption decrease by 0.41% and
0.4% respectively, exports decrease by 0.44%, domestic and world prices increase by
0.73% and 0.84% respectively, producer welfare increases by 0.02% and consumer
surplus decreases by 0.43%. Supply by affected producers decreases, which explains the
increase in the price of potatoes. The price increase leads to an increase in total producer
welfare (of producers in the affected and non-affected area). In this example, the direct
negative impacts (i.e. yield loss and additional control cost) are transferred from
producers to consumers. In this case the PE analysis adds a valuable insight by showing
how the negative impact of the PSTVd invasion is distributed between producers and
consumers and by showing what the underlying causes for the indirect impacts are.
Chapter 2
28
therefore, only appropriate when the indirect impact of the pest is not expected to significantly
affect other non-agricultural markets or to generate measurable macroeconomic changes (e.g.
changes in income and employment). For applications that require an economy-wide scope
Input-Output analyses or Computable General Equilibrium modelling approaches may be
needed.
2.2.3 Input – Output Analysis (I-O)
The technique of I-O analysis focuses on the interdependencies of sectors in an
economy (regional or national), making it suitable to predict an economy-wide impact of
changes within a particular sector (Leontief, 1986). Central to an I-O analysis is the
specification of an I-O table to describe the monetary flows of inputs and outputs among the
productive sectors of an economy (Miller and Blair, 1985). In an I-O table, economic sectors
are aggregated into representative groups. Each sector-group is represented by a row and a
column. The rows of the table specify the distribution of total output of a specific sector sold
to other sectors (i.e., to intermediate demand) or to final demand (e.g. to final consumption,
investments and exports). The columns refer to the production side of a given sector, by
denoting the value of inputs of each sector required to produce output.
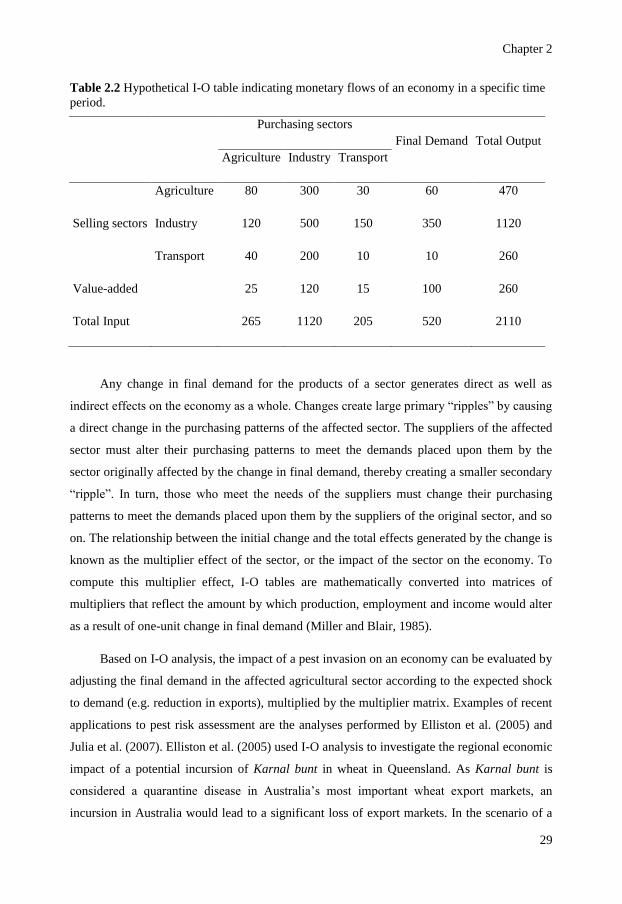
Table 2.2 represents a hypothetical I-O table with 3 productive sectors, viz. agriculture,
industry and transport. In this example, the agricultural sector sells a value of 80 of output
within agriculture, 300 of output to industry and 30 of output to transport, whereas a value of
60 is intended for the final demand. As denoted by the column accounts, the industrial sector
purchases for its production a value of 300 in intermediate products from the agricultural
sector, 500 of input within industry and 200 of input from transport, leading to a value added
of 120. The value added cell includes payments to employees, holders of capital, and
governments (e.g. wages and salaries, interest, dividends, and taxes) and represents the value
that a sector adds to the inputs it uses to produce output. The value added row measures each
sector’s contribution to wealth accumulation.
Chapter 2
29
Table 2.2 Hypothetical I-O table indicating monetary flows of an economy in a specific time
period.
Purchasing sectors
Final Demand Total Output
Agriculture Industry Transport
Selling sectors
Agriculture 80 300 30 60 470
Industry 120 500 150 350 1120
Transport 40 200 10 10 260
Value-added 25 120 15 100 260
Total Input 265 1120 205 520 2110
Any change in final demand for the products of a sector generates direct as well as
indirect effects on the economy as a whole. Changes create large primary “ripples” by causing
a direct change in the purchasing patterns of the affected sector. The suppliers of the affected
sector must alter their purchasing patterns to meet the demands placed upon them by the
sector originally affected by the change in final demand, thereby creating a smaller secondary
“ripple”. In turn, those who meet the needs of the suppliers must change their purchasing
patterns to meet the demands placed upon them by the suppliers of the original sector, and so
on. The relationship between the initial change and the total effects generated by the change is
known as the multiplier effect of the sector, or the impact of the sector on the economy. To
compute this multiplier effect, I-O tables are mathematically converted into matrices of
multipliers that reflect the amount by which production, employment and income would alter
as a result of one-unit change in final demand (Miller and Blair, 1985).
Based on I-O analysis, the impact of a pest invasion on an economy can be evaluated by
adjusting the final demand in the affected agricultural sector according to the expected shock
to demand (e.g. reduction in exports), multiplied by the multiplier matrix. Examples of recent
applications to pest risk assessment are the analyses performed by Elliston et al. (2005) and
Julia et al. (2007). Elliston et al. (2005) used I-O analysis to investigate the regional economic
impact of a potential incursion of Karnal bunt in wheat in Queensland. As Karnal bunt is
considered a quarantine disease in Australia’s most important wheat export markets, an
incursion in Australia would lead to a significant loss of export markets. In the scenario of a
Chapter 2
30
widespread incursion the direct effect in the wheat and other grains industries was estimated
as an $89 million decline in output over a fifteen year planning horizon and a loss of 400 full
time jobs. The indirect effects of the incursion in all other industries were estimated as a
decline of $38 million in output and a decline in employment of 200 full time jobs.
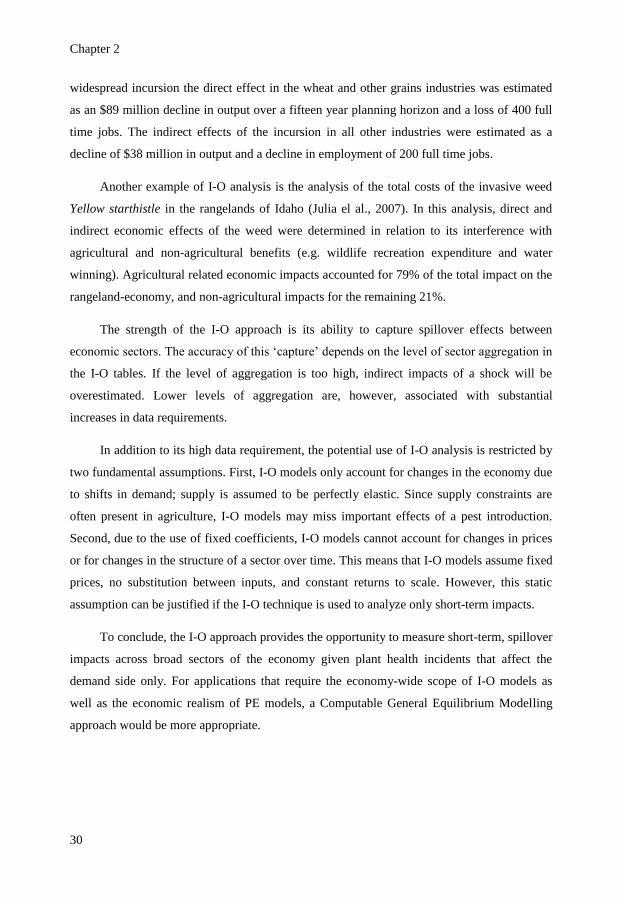
Another example of I-O analysis is the analysis of the total costs of the invasive weed
Yellow starthistle in the rangelands of Idaho (Julia el al., 2007). In this analysis, direct and
indirect economic effects of the weed were determined in relation to its interference with
agricultural and non-agricultural benefits (e.g. wildlife recreation expenditure and water
winning). Agricultural related economic impacts accounted for 79% of the total impact on the
rangeland-economy, and non-agricultural impacts for the remaining 21%.
The strength of the I-O approach is its ability to capture spillover effects between
economic sectors. The accuracy of this ‘capture’ depends on the level of sector aggregation in
the I-O tables. If the level of aggregation is too high, indirect impacts of a shock will be
overestimated. Lower levels of aggregation are, however, associated with substantial
increases in data requirements.
In addition to its high data requirement, the potential use of I-O analysis is restricted by
two fundamental assumptions. First, I-O models only account for changes in the economy due
to shifts in demand; supply is assumed to be perfectly elastic. Since supply constraints are
often present in agriculture, I-O models may miss important effects of a pest introduction.
Second, due to the use of fixed coefficients, I-O models cannot account for changes in prices
or for changes in the structure of a sector over time. This means that I-O models assume fixed
prices, no substitution between inputs, and constant returns to scale. However, this static
assumption can be justified if the I-O technique is used to analyze only short-term impacts.
To conclude, the I-O approach provides the opportunity to measure short-term, spillover
impacts across broad sectors of the economy given plant health incidents that affect the
demand side only. For applications that require the economy-wide scope of I-O models as
well as the economic realism of PE models, a Computable General Equilibrium Modelling
approach would be more appropriate.
Chapter 2
31
2.2.4 Computable General Equilibrium Modelling (CGE)
The CGE approach combines the strengths of I-O analyses and PE models to answer a
wide range of questions. It uses I-O tables to represent the entire economy with the inclusion
of functional relationships between actors in this economy as in a PE model. The basic
structure of a CGE model can be described in terms of “blocks” of equations that specify
demand relationships, production technologies, relationships between domestic and imported
goods, prices, household income and numerous equilibrium conditions. Such a framework
enables CGE models to address questions concerning impacts across sectors and employment
groups as well as price changes and longer-run impacts. This capacity, however, makes CGE
models highly complex, imposing high costs in the development of such a model as well as in
the interpretation of its results (Sadoulet and de Janvry, 1995; Dixon and Parmenter, 1996).
By nature CGE models are highly aggregated, making it difficult to analyze a change in
a sub sector of the economy. Many CGE models are disaggregated into only two agricultural
sub-sectors, such as tradable and non-tradable crops, or food crops and cash crops
(Bourguignon and Pereira da Silva, 2003). Applications of CGE models are, therefore, only
appropriate to address large-scale problems which are most likely to generate measurable
macroeconomic impacts. Pest invasion problems rarely generate such major effects as
changes in aggregate employment, income or inflation rate. As a consequence, there are few
applications of CGE applications in pest risk assessments. Recent applications are those of
Wittwer et al. (2005, 2006). In Wittwer et al. (2005) a CGE model was used in order to
quantify the impact of a hypothetical outbreak of the Tilletia indica fungus (the causal agent
of Karnal bunt) on the wheat crop in west Australia. In their analysis, the effects on output,
income, employment, wages, capital stocks and exports were estimated. In a second paper,
Wittwer et al. (2006) investigated by the use of CGE the economic consequences of
introducing Pierce’s disease of grapevine in South Australia. Special attention was given to
the adjustment in the labour market as a result of the disease outbreak.
2.3 Synthesis and implications
Plant import regulation is an indispensable tool for protecting agriculture and the environment
against pest invasions, but overly strict import restrictions can unnecessarily limit trade and
reduce welfare. Science-based pest risk assessment is needed to ensure that import regulations
Chapter 2
32
are commensurate with the risks they mitigate (WTO, 2009). Quantitative economic impact
assessment is a pivotal element of science-based pest risk assessment, and this paper has
addressed the four most important techniques that may be used for such assessments.
Techniques based on linear or dynamic programming were excluded from the
overview as these optimization methods are more suitable for risk management evaluations
than risk assessment analyses. With respect to plant health economics few applications are
known of which the majority focuses on the determination of an optimal pest control
management scheme (Hall and Hastings, 2007; Chalk-Haghighi et al., 2008).
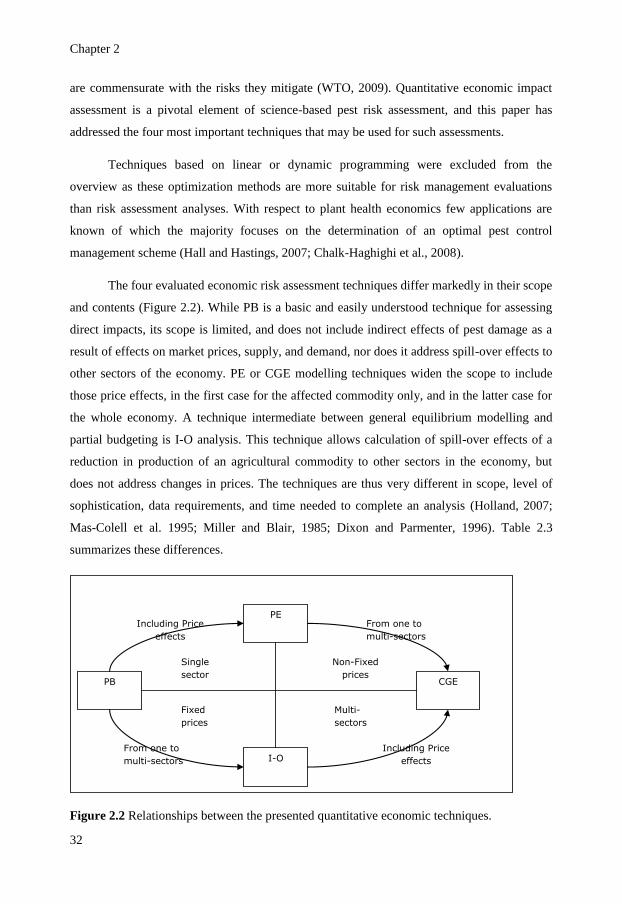
The four evaluated economic risk assessment techniques differ markedly in their scope
and contents (Figure 2.2). While PB is a basic and easily understood technique for assessing
direct impacts, its scope is limited, and does not include indirect effects of pest damage as a
result of effects on market prices, supply, and demand, nor does it address spill-over effects to
other sectors of the economy. PE or CGE modelling techniques widen the scope to include
those price effects, in the first case for the affected commodity only, and in the latter case for
the whole economy. A technique intermediate between general equilibrium modelling and
partial budgeting is I-O analysis. This technique allows calculation of spill-over effects of a
reduction in production of an agricultural commodity to other sectors in the economy, but
does not address changes in prices. The techniques are thus very different in scope, level of
sophistication, data requirements, and time needed to complete an analysis (Holland, 2007;
Mas-Colell et al. 1995; Miller and Blair, 1985; Dixon and Parmenter, 1996). Table 2.3
summarizes these differences.
Figure 2.2 Relationships between the presented quantitative economic techniques.
PB
CGE
I-O
PE
From one to
multi-sectors
Including Price
effects
Including Price
effects
From one to
multi-sectors
Fixed
prices
Multi-
sectors
Single
sector
Non-Fixed
prices
Chapter 2
33
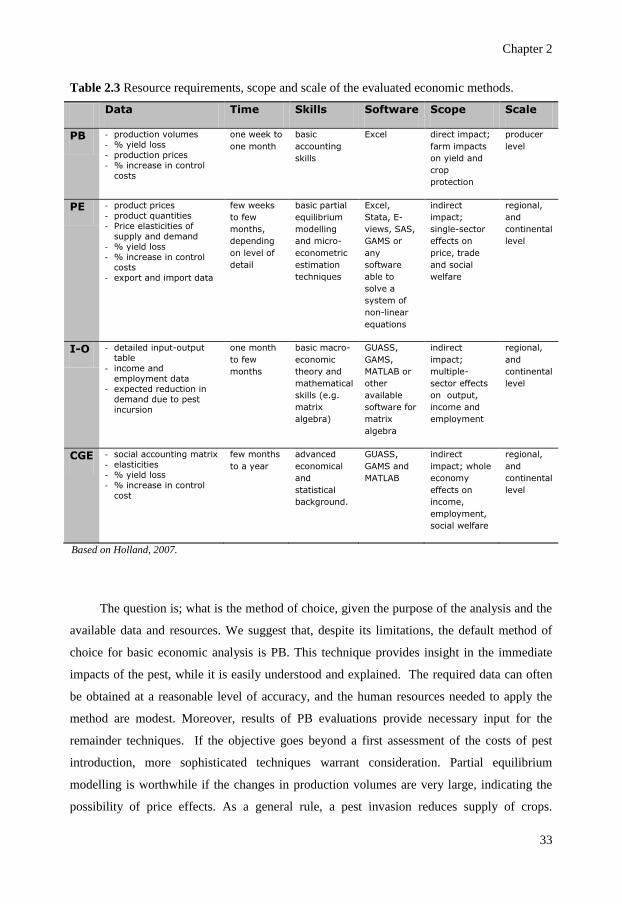
Table 2.3 Resource requirements, scope and scale of the evaluated economic methods.
Data Time Skills Software Scope Scale
PB - production volumes - % yield loss - production prices - % increase in control
costs
one week to
one month
basic
accounting
skills
Excel direct impact;
farm impacts
on yield and
crop
protection
producer
level
PE - product prices - product quantities - Price elasticities of
supply and demand - % yield loss - % increase in control
costs - export and import data
few weeks
to few
months,
depending
on level of
detail
basic partial
equilibrium
modelling
and micro-
econometric
estimation
techniques
Excel,
Stata, E-
views, SAS,
GAMS or
any
software
able to
solve a
system of
non-linear
equations
indirect
impact;
single-sector
effects on
price, trade
and social
welfare
regional,
and
continental
level
I-O - detailed input-output table
- income and employment data
- expected reduction in demand due to pest incursion
one month
to few
months
basic macro-
economic
theory and
mathematical
skills (e.g.
matrix
algebra)
GUASS,
GAMS,
MATLAB or
other
available
software for
matrix
algebra
indirect
impact;
multiple-
sector effects
on output,
income and
employment
regional,
and
continental
level
CGE - social accounting matrix - elasticities - % yield loss - % increase in control
cost
few months
to a year
advanced
economical
and
statistical
background.
GUASS,
GAMS and
MATLAB
indirect
impact; whole
economy
effects on
income,
employment,
social welfare
regional,
and
continental
level
Based on Holland, 2007.
The question is; what is the method of choice, given the purpose of the analysis and the
available data and resources. We suggest that, despite its limitations, the default method of
choice for basic economic analysis is PB. This technique provides insight in the immediate
impacts of the pest, while it is easily understood and explained. The required data can often
be obtained at a reasonable level of accuracy, and the human resources needed to apply the
method are modest. Moreover, results of PB evaluations provide necessary input for the
remainder techniques. If the objective goes beyond a first assessment of the costs of pest
introduction, more sophisticated techniques warrant consideration. Partial equilibrium
modelling is worthwhile if the changes in production volumes are very large, indicating the
possibility of price effects. As a general rule, a pest invasion reduces supply of crops.
Chapter 2
34
However, with the occurrence of price effects, part of these invasion costs is transferred from
producers to consumers who pay a higher price. As a result, the negative effect of pest
invasion on welfare is shared between producers and consumers. A more broad-based
economic technique like I-O analysis or CGE modelling may be considered if large spillover
effects to other sectors of the economy are expected, or even elimination of an entire industry,
along with its suppliers. In exceptional cases CGE modelling has indeed been used (Wittwer
et al., 2005). I-O and CGE techniques are fundamentally feasible to calculate pest impacts,
but they have been very little used in impact assessments, and are probably over the optimum
level of scope needed for a proper science-based impact assessment that is fit for purpose. The
ability of I-O analysis and CGE analysis to capture indirect impacts to the entire economy is
rarely needed in PRA since few pests have a wide economy impact. In most cases, a
combination of partial budgeting and partial equilibrium modelling can provide a sufficient
scope where both direct and indirect impacts occur (Rich et al., 2005).
An ironic aspect of the choice of method is that it is difficult to know ex ante whether a
more advanced technique is needed without actually applying the method in the first place.
The results of a partial budgeting exercise are not sufficient to judge whether a partial
equilibrium modelling technique would yield different results. This can only be assessed
when information on price elasticities of supply and demand has been gathered, i.e. when a
first exploration in the domain of partial equilibrium is attempted. There is a need for case
studies in which the outcomes of different techniques is contrasted, so these can act as “case
in point” and “reference cases” when choosing between techniques.
It is also important to take into account the possibilities of adaptations. Adaptation is
defined as ex-ante efforts aimed at reducing the severity of a pest invasion. Adaptation differs
from mitigation, which comprises ex-ante efforts to reduce the probability of pest invasion. A
direct negative impact on a producer could be countered by a substitution effect with a switch
to other crops that are not vulnerable to the pest. If producers can adapt by growing less
vulnerable crops, the total overall impact for all producers could be less severe than that
indicated if only direct impacts are evaluated. Another factor that needs to be taken into
account is management. Normally, if a pest invades, producers take measures to limit pest
damage. It is unrealistic to calculate pest damages, assuming that producer practices will
remain unchanged. Producers are profit maximizers and hence will adapt. Including issues of
adaptation and management into PRA to avoid overestimation of pest impacts, requires a high
Chapter 2
35
level of expertise of the PR-analyst. In order to avoid subjectivity, the PRA analyst should
explicitly report the extent to which adaptation and management have been accounted for.
Finally, uncertainty about model outcomes and model parameters is an important issue.
What matters in the end is not whether the impact assessment was accurate in its quantitative
outcome, but merely if the action justified by the assessment was correct. In other words, the
mathematical problem is not so much one of estimation, but of selection (Binns et al., 2000).
Thus analysis of the performance of impact assessments should not focus so much on the
quantitative outcomes, but on the error rates (e.g. Nyrop et al., 1999). Two types of errors are
relevant: type I errors, i.e. rejecting the null hypothesis (of no action needed) while it is true,
and type II errors, i.e. accepting the null hypothesis while it is false. Type I errors occur if the
impact assessment tool suggests the economic risks justify phytosanitary measures where in
reality the risks are too low to warrant measures. Type II errors occur when the tool does not
correctly detect risks where the actual size of the risks would warrant phytosanitary measures.
Uncertainty in PRA may lead to an overestimation of the economic impacts, particularly if the
precautionary principle (which is allowed under ISPM No.11) is applied, and will therefore
increase the occurrence of Type I errors. Use of the precautionary principle will, on the other
hand decrease the occurrence of Type II errors. The occurrence of Type I and Type II errors
may be reduced by using more advanced economic impact assessment techniques such as PE,
I-O and CGE, since these techniques capture a wider range of potential economic impacts.
However, the extent of this reduction will be hard to quantify. Receiving Operating
Characteristics (ROC) analysis could provide some insights in these error rates by providing
tools to select the optimal set of techniques and to discard suboptimal ones by indicating all
possible combinations of the relative frequencies of the various kinds of correct and incorrect
decisions given a defined threshold (Brown and Davis, 2006). Such an analysis would require
a retrospective evaluation of a sufficient large number of performed PRAs to obtain any
information on the relative distributions of the correctness of the decisions made.
Uncertainty about model parameters affects the reliability of outcomes of economic
impact assessment techniques in different ways. We think that the degree of belief in
economic models should decrease with level of sophistication, because the greater
sophistication entails making assumptions about processes that may work quite differently
from how they are modelled. Thus, PB has a greater potential of giving credible results, while
confidence is bolstered as anybody can check the assumptions and calculations using a basic
spread sheet. PE and CGE techniques give already more uncertain results, because
Chapter 2
36
mathematical statements are made on the relationships between prices, and supply and
demand of agricultural produce that may work out quite differently in practice than they are
modelled mathematically. This is not to say that the model is wrong. The models are
theoretically correct, but they are simplifications of economic reality, and it is very difficult to
know the parameters that apply to the producer and consumer behaviour in the future.
Therefore, such models should be interpreted as plausible trends, inferred from past
behaviour, and should be used to complement the results of a PB rather than replace them.
Results of PE modelling should be interpreted with caution as to the absolute magnitude of
the effects. The same applies to I-O and CGE modelling techniques. The parameters for these
models are usually based on historic data, augmented with theoretical arguments, and each of
these methods may not provide those parameter values that correctly model future economic
behaviour of producers and consumers.
Monte Carlo techniques or sensitivity analysis may help to assess uncertainty bounds
for model outcomes, but it should be remembered that these bounds are derived within the
chosen model framework and domain of data collection. Future behaviour needs not stay in
the confines of those bounds (e.g. Gilligan and van den Bosch, 2008). Although impact
assessments should as much as possible be supported and enriched by objective analyses, we
believe that there is no substitute for expertise, experience, caution and wisdom in the domain
of regulatory plant protection. The greatest strength can be found in the combination of
qualitative and quantitative approaches.
Chapter 2
37
Acknowledgments
We thank Richard Baker and Jan Schans for helpful comments on a previous draft of this
paper. The opinions expressed are those of the authors. Work on this paper was supported by
the European Commission under grant agreement number 212459, seventh framework
programme, project PRATIQUE: Enhancement of Pest Risk Analysis Techniques.
Chapter 2
38
References
Anonymous, 1997. Guidelines on Pest Risk Analysis. EPPO Pest risk assessment scheme. EPPO Bulletin, 27,
281-305.
Arpaia, M.L.U, Stottlemyer, D.E., Witney, G.W., 1996. Economic Analysis of Irrigation and Fertilization
Management of Avocados. Hortscience, 31 (1), 156-159 .
Arthur, M., 2006. An economic analysis of quarantine: The economics of Australian’s ban on New Zealand
apple imports. 2006 Conference, New Zealand Agricultural and Resource Economics Society, 31959,
Nelson, New Zealand.
Baker, R.H.A, Battisti, A., Bremmer, J., Kenis, M., Mumford, J., Pette,r F., Schrader, G., Bacher, S., De Barro,
P., Hulme, P.E., Karadjova, O., Oude Lansink, A., Pruvost, O., Pysek, P., Roques, A., Baranchikov, Y., Sun,
J-H., 2009. PRATIQUE: a research project to enhance pest risk analysis techniques in the European Union.
EPPO Bulletin 39, 87-93.
Binns, M.R., Nyrop, J.P., van der Werf, W., 2000. Sampling and Monitoring in Crop Protection: The Theoretical
Basis for Developing Practical Decision Guides, Wallingford, CABI Press, 284 pp.
Bourguignon, F., Pereira da Silva, L., 2003. The impact of economic policies on poverty and income
distribution, evaluation techniques and tools. Washington, D.C., The World Bank and Oxford University
Press.
Breukers, A., Mourits, M. , van der Werf, W. , Oude Lansink A., 2008. Costs and benefits of controlling
quarantine diseases: a bio-economic modeling approach. Agricultural Economics 38, 137 – 149.
Brown, C.D., Davis, H.T., 2006. Receiver operating characteristics curves and related decision measures: A
tutorial. Chemometrics and Intelligent Laboratory Systems, 80, 24–38.
Brunel, S., Petter, F., Fernandez-Galiano, E. and Smith, I., 2009. Approach of the European and Mediterranean
Plant Protection Organization to the Evaluation and Management of Risks Presented by Invasive Alien
Plants. In: Inderjit (ed.), Management of Invasive Weeds, Springer Netherlands, 319-343.
Chalak-Haghighi, M., Van Ierland, E.C., Bourdot, G.W., 2008. Management strategies for an invasive weed: a
dynamic programming approach for Californian thistle in New Zealand. New Zealand Journal of Agricultural
Research, 51 (4), 409-424.
Cook, D. C., 2008. Benefit cost analysis of an import access request. Food Policy, 33 (3), 277-285
Dixon, P.B., Parmenter, B.R., 1996. Computable general equilibrium modeling for policy analysis and
forecasting. In: Amman, H.M., Kendrick, D.A., Rust, J. (Eds.), Handbook of computational economics, Vol-
I, Elsevier science B.V.
Donovan, C., Wopereis, M.C.S., Guindo, D., Nebié, B., 1999. Soil fertility management in irrigated rice systems
in the Sahel and Savanna regions of West Africa: Part II. Profitability and risk analysis. Field Crops
Research. 61 (2), 147-162.
Elliston, L., Hinde R., Yainshet A., 2005. Plant Disease Incursion Management. Lecture Notes in Computer
Science, 3415, 225-235.
Elobeld, A., Beghin, J.,2006. Multilateral trade and agricultural policy reforms in sugar markets. Journal of
Agricultural Economics, 57 (1), 23-48.
FAO, 2004. Pest risk analysis for quarantine pests including analysis of environmental risks. International
Standards for Phytosanitary Measures. Publication No. 11. Rev. 1. FAO, Rome (IT).
FAO, 2007a. Glossary of phytosanitary terms. International standards for phytosanitary measures. Publication
No. 05. FAO, Rome (IT).
FAO, 2007b. Framework for Pest Risk Analysis. International standards for phytosanitary measures . Publication
No. 02. FAO, Rome (IT).
Gilligan, C.A., van den Bosch, F., 2008. Epidemiological models for invasion and persistence of pathogens.
Annual Review of Phytopathology 46, 385-418.
Hal, R.J., Hastings, A.,2007. Minimizing invader impacts: Striking the right balance between removal and
restoration. Journal of Theoretical Biology, 249 (3), 437-444.
Holland, J., 2007. Tools for Institutional, Political, and Social Analysis of Policy Reform. A source book for
Development practitioners. Washington, D.C., The World Bank and Oxford University Press.
IPPC, 2009. https://www.ippc.int/IPP/En/default.jsp; accessed 26 April 2009.
Juliá, R., Holland, D.W., Guenthner, J., 2007. Assessing the economic impact of invasive species: The case of
yellow starthistle (Centaurea solsitialis L.) in the rangelands of Idaho, USA. Journal of Environmental
Management. 85, 876-882.
Chapter 2
39
Just, R.E., Hueth, D.L., Schmitz, A., 1982. Applied Welfare Economics and Public Policy. Englewood Cliffs:
Prentice-Hall, Inc.
Kaye-Blake, W.H., Saunders, C.M., Cagatay, S.,2008. Genetic Modification Technology and Producer Returns:
The Impacts of Productivity, Preferences, and Technology Uptake. Review of Agricultural Economics, 30
(4), 692-710.
Leontief, W., 1986. Input-Output Economics, Oxford University Press, New York.
Macleod, A., Head, J., Gaunt, A., 2003. The assessment of the potential economic impact of Thrips palmi on
horticulture in England and the significance of a successful eradication campaign. Crop Protection 23, 601–
610.
Mas-Colell, A., Whinston, M.D., Green, J.R., 1995. Microeconomic Theory. New York, Oxford University
Press.
Miller, R., Blair, P., 1985. Input Output Analysis: Foundations and Extensions. Prentice-Hall, Englewood Cliffs,
N.J.
Nyrop, J.P., Binns, M.R., van der Werf, W., 1999. Sampling for IPM decision making: Where should we invest
time and resources? Phytopathology 89, 1104-1111.
Pemsl, D., Waibel, H., Orphal J., 2004. A methodology to assess the profitability of Bt-cotton: case study results
from the state of Karnataka, India. Crop Protection 23 (12), 1249-1257.
Qaim. M., Traxler, G.,2005. Roundup Ready soybeans in Argentina: farm level and aggregate welfare effects.
Agricultural Economics, 32 (1), 73-86.
Rich, K.M., Miller, G.Y., Winter-Nilson, A., 2005. A review of economic tools for the assessment of animal
disease outbreaks. Scientific and Technical Review of the Office International des Epizooties., 24, 833-845.
Sadoulet, E., de Janvry, A., 1995. Computable general equilibrium models. In: Quantitative development policy
analysis. The Johns Hopkins University Press, Baltimore, pp. 341-372.
Sansford, C. Quantitative versus Qualitative: Pest Risk Analysis in the UK and Europe including the European
and Mediterranean Plant Protection (EPPO) system. NAPPO International Symposium on Pest Risk Analysis
Puerto Vallarta, Mexico, 2002.
Schmitz, T.G., Giese, C.R., Shultz, C.J., 2008. Welfare Implications of EU Enlargement under the CAP.
Canadian Journal of Agricultural Economics, 56(4), 555-562.
Surkov, I.V., Oude Lansink, A.G.J.M., van der Werf, W., 2009. The optimal amount and allocation of sampling
effort for plant health inspection. European Review of Agricultural Economics, 36, 295-320.
Vose, 2001. “Risk analysis: A Quantitative Guide”; second edition (Wiley & Sons), UK.
Wittwer, G., McKirdy, S., Wilson, R., 2005. Regional economic impacts of a plant disease incursion using a
general equilibrium approach. Australian Journal of Agricultural Resource Economics 49, 75–89.
Wittwer G., McKirdy S., Wilson R., 2006. Analyzing a hypothetical Pierce’s disease outbreak in South Australia
using a dynamic CGE approch. Working Papers G-162, Monash University, Centre of Policy
Studies/IMPACT Centre.
WTO, 2009. http://www.wto.org/english/tratop_e/sps_e/spsagr_e.htm; accessed on 27 May 2009.

40
41
Chapter 3
Quantitative Economic Impact Assessment of an Invasive Plant
Disease Under Uncertainty – a Case Study for PSTVd Invasion into
the European Union
Soliman T., Mourits M.C.M., Oude Lansink A.G.J.M., van der Werf W., 2012. Quantitative economic
impact assessment of an invasive plant disease under uncertainty – a case study for PSTVd invasion
into the European Union, Crop Protection 40, 28-35.
Chapter 3
42
Abstract
International treaties require that phytosanitary measures against introduction and spread of
invasive plant pests are justified by a science-based pest risk analysis, including an
assessment of potential economic consequences. This study evaluates the economic
justification of the currently applied phytosanitary measures against Potato Spindle Tuber
viroid (PSTVd). It assesses the impact of an unregulated EU infestation, while accounting for
uncertainty due to scarcity of data. Expert opinions were elicited to describe the possible
range of PSTVd spread. Stochastic simulations, based on the assessments of separate experts,
indicated that the direct impacts exceed the costs of current phytosanitary measures (€5.6
M/year) with a probability of 44%, but with large differences between experts making it hard
to justify the measures solely by the expected savings in direct impacts. The direct impact on
potato producers was estimated with partial budgeting. This impact is 2.1 M€, based on an
assumed prevalence of PSTVd of 0.73%, while the direct impact on tomato producers was
estimated at 3.5 M€. The total economic impact, considering price changes and higher costs
for consumers, was estimated at 4.4 M€ for potatoes and 5.7 M€ for tomatoes. Consumers
bore 92% of the total costs of invasion in the case of potato and 77% in the case of tomato. If
the presence of PSTVd would imply export restrictions, resulting in an annual loss of more
than 1% of the total EU export value of potatoes and tomatoes, the cost of current
phytosanitary measures would also be justified. The potential economic impacts of PSTVd
into the European Union are therefore demonstrably of importance when considering market
effects or export losses but questionable if only accounting for the direct losses. The large
degree of uncertainty in the prevalence of disease contributes to the justifiability of measures
based on the precautionary principle. The assessment approach can be useful for assessing
the economic justification of phytosanitary measures.
Keywords
Economic impact assessment – uncertainty – pest risk analysis – risk management - PSTVd
Chapter 3
43
3.1 Introduction
Potato spindle tuber viroid (PSTVd) is a small, circular RNA molecule, that infects a variety
of species within the Solanaceae, including potato and tomato (Singh 1973; Singh & Slack
1984), pepino (Puchta et al., 1990), avocado (Querci et al., 1995) and compositae (Singh,
1973) as well plant species from other families (Singh, 1973; Matousek et al., 2007). PSTVd
has been registered and regulated as an EU-quarantine organism (listed in Annex IAI of
Council Directive 2000/29/EC) since 1993, because of its potential economic impact on
European potato and tomato production. Different strains of PSTVd exist and symptoms
range from mild to severe. Symptoms depend on environmental conditions and are most
severe in warm and dry regions (Singh, 1983 and 1989). PSTVd can spread by natural means
(i.e. seed and pollen transmission) (Singh et al., 1992) and by human assistance (i.e.
mechanical and vegetative propagation transmission) (Diener, 1987; Verhoeven et al., 2010).
Although still present in potato crops in some parts of Eastern Europe, PSTVd is
currently not cited as a major crop pest (EFSA, 2011a). However, recent findings of PSTVd
in ornamental plants, i.e. Brugmansia spp. and Solanum jasminoides, (Di Serio, 2007;
Verhoeven et al., 2008) have raised concern that these ornamentals may provide a new source
of the viroid that could increase exposure of potatoes and tomatoes. Consequently, the EU has
issued a provisional emergency measure (listed in Commission Decision 2007/410/EC4) to
mitigate this potential risk. By this emergency measure, import and movement of the specified
ornamentals plants within the Community have been regulated and need to comply with the
requirements laid down in the Directive 2000/29/EC. Furthermore, Member States need to
conduct official surveys, and where appropriate, test for the presence of PSTVd on these
symptomless host plants.
According to international treaties, phytosanitary measures against introduction and
spread of invasive plant pests must be justified by a science-based pest risk analysis, including
an assessment of potential economic consequences. However, data to make reliable
quantitative economic impact assessments are rarely available. Therefore economic impact
assessments are usually qualitative, weakening the justification of management measures. The
International Standard For Phytosanitary Measures (ISPM) No. 11 (FAO, 2004) states that
(paragraph 2.3) “it is necessary to examine economic factors in greater detail when the level
of economic consequences is in question, or when the level of economic consequences is
needed to evaluate the strength of measures used for risk management or in assessing the
Chapter 3
44
cost-benefit of exclusion or control”. The current program of phytosanitary measures against
PSTVd (2000/29/EC and 2007/410/EC4) has only been justified by a qualitative impact
assessment of their technical efficiency; no quantitative economic justification has been given
(EFSA, 2011a). A quantitative economic justification is hard to make due to the lack of
accurate, consistent data on potential pest prevalence and detailed spatially indexed
production values of host crops in the EU member states and to insufficient documented
knowledge of viroid biology. The considered change in the status of the provisional measure
from temporal to permanent (EFSA, 2011a) could, however, require a more sound scientific
justification to be accepted by stakeholders in Europe and the rest of the world.
This paper estimates the possible range of economic impacts of an unregulated PSTVd
infestation in Europe while accounting for the uncertainty and the data scarcity on PSTVd
spread and impact on yield, by stochastic simulations. We compare the simulated range of
economic impacts with the current costs of phytosanitary measures, to assess whether the
measures are economically justifiable.
3.2 Materials and Methods
The analytical model for economic impact assessment of an unregulated PSTVd outbreak in
European potato and tomato consists of four components, 1) a spread component to define the
level of potential pest spread, 2) a climate component to describe the climate suitability for
damage expression, 3) a host component to determine the spatial distribution and value of
hosts, and 4) an economic component to quantify the resulting impacts.
3.2.1 Potential pest spread
The potential spread (infestation level) is defined as the proportion of potato and tomato
plants that is infected with PSTVd. Accurate and consistent quantitative data is lacking due to
insufficient knowledge on pest biology and epidemiology. Therefore, we assessed the
potential for infestation by expert elicitation, assuming a scenario in which one percent of the
starting seed stock for the host plants within the EU is infected with PSTVd and current
phytosanitary regulations are lifted. As a result of spread within a crop and between crop
species, disease incidence changes over time until after some time a steady state situation is
Chapter 3
45
reached in which the rate of infestation with PSTVd stabilizes. We asked 30 experts by
written questionnaire to assess the likely infestation rate with PSTVd in the steady state.
The majority of experts, however, indicated that they were unable to estimate expected
incidence (proportion of infested plants) due to the high level of uncertainty involved and the
difficulty of allowing for spatial variation in incidence. Only four experts were confident
enough to provide an estimate. The first expert indicated that in the majority of the cases the
infestation level would be minimal. This expert distinguished three levels of incidence, viz.
0.5%, 5% and 10%, and estimated that these would occur with likelihoods of 96%, 3% and
1%, respectively. The average incidence is 0.73%. The second expert estimated uncertainty in
incidence in terms of a triangular distribution with a minimum incidence of 0.01%, a most
likely incidence of 0.25%, and a maximum incidence of 0.5%. Expert 2 thought that
mechanical transmission would cause only little spread, while greatest risk was to be expected
from seed transmission. Although only officially certified (and therefore PSTVD free) seed
potato can be marketed within the EU, some farmers, especially in eastern European
countries, use farm-saved seed for their own production. Such practice could increase the
incidence of PSTVd when no official action is taken. The third expert provided a semi-
quantitative estimate mentioning an incidence level of 0% as the lowest value, a value “close
to zero” as the most likely value and “close to 0.1%” as the upper level. The low values and
narrow range indicate low expected incidence as well as low uncertainty. The fourth expert,
on the other hand, provided a wide range, from 0.1% to 50%, indicating both a high expected
incidence and large uncertainty.
The impact of the level of uncertainty on the estimation of economic impacts will be
studied by a stochastic assessment based on the elicited distributions of the four experts as
well as the average distribution. The average distribution was obtained by using the linear
opinion pool method (Clemen and Winkler, 1999; Chambers, 2007).
3.2.2 Host and climate
Climatic and host data on potato and tomato are extracted from the SEAMLESS database
(Van Ittersum et al., 2008; Janssen et al., 2009). Within this database, data are available at
various levels of spatial resolution, which are (sorted from coarse to fine resolution) the levels
of environmental zones (EZ), climate zones and agri-environmental zones (AEZ) (Figure 3.1).
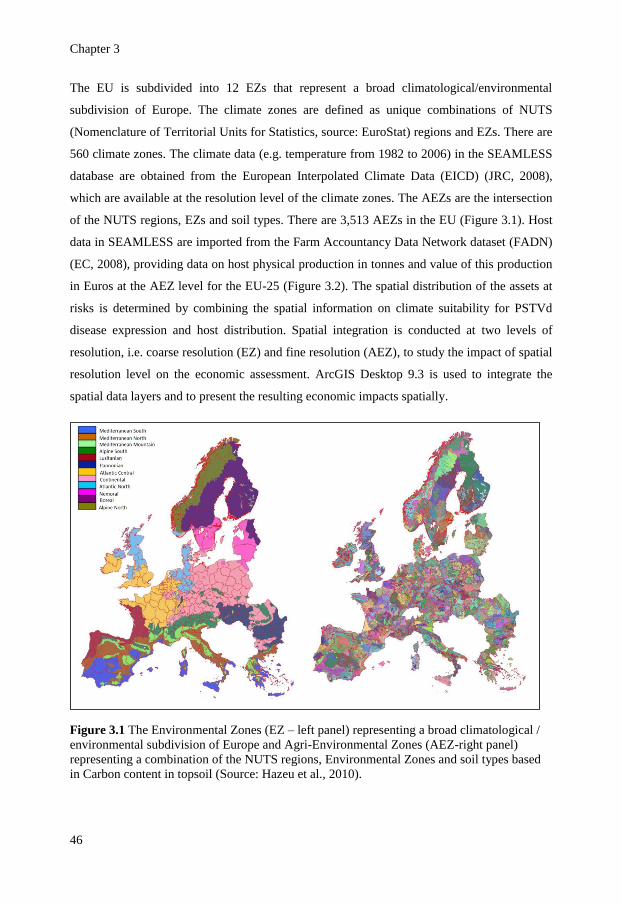
Chapter 3
46
The EU is subdivided into 12 EZs that represent a broad climatological/environmental
subdivision of Europe. The climate zones are defined as unique combinations of NUTS
(Nomenclature of Territorial Units for Statistics, source: EuroStat) regions and EZs. There are
560 climate zones. The climate data (e.g. temperature from 1982 to 2006) in the SEAMLESS
database are obtained from the European Interpolated Climate Data (EICD) (JRC, 2008),
which are available at the resolution level of the climate zones. The AEZs are the intersection
of the NUTS regions, EZs and soil types. There are 3,513 AEZs in the EU (Figure 3.1). Host
data in SEAMLESS are imported from the Farm Accountancy Data Network dataset (FADN)
(EC, 2008), providing data on host physical production in tonnes and value of this production
in Euros at the AEZ level for the EU-25 (Figure 3.2). The spatial distribution of the assets at
risks is determined by combining the spatial information on climate suitability for PSTVd
disease expression and host distribution. Spatial integration is conducted at two levels of
resolution, i.e. coarse resolution (EZ) and fine resolution (AEZ), to study the impact of spatial
resolution level on the economic assessment. ArcGIS Desktop 9.3 is used to integrate the
spatial data layers and to present the resulting economic impacts spatially.
Figure 3.1 The Environmental Zones (EZ – left panel) representing a broad climatological /
environmental subdivision of Europe and Agri-Environmental Zones (AEZ-right panel)
representing a combination of the NUTS regions, Environmental Zones and soil types based
in Carbon content in topsoil (Source: Hazeu et al., 2010).
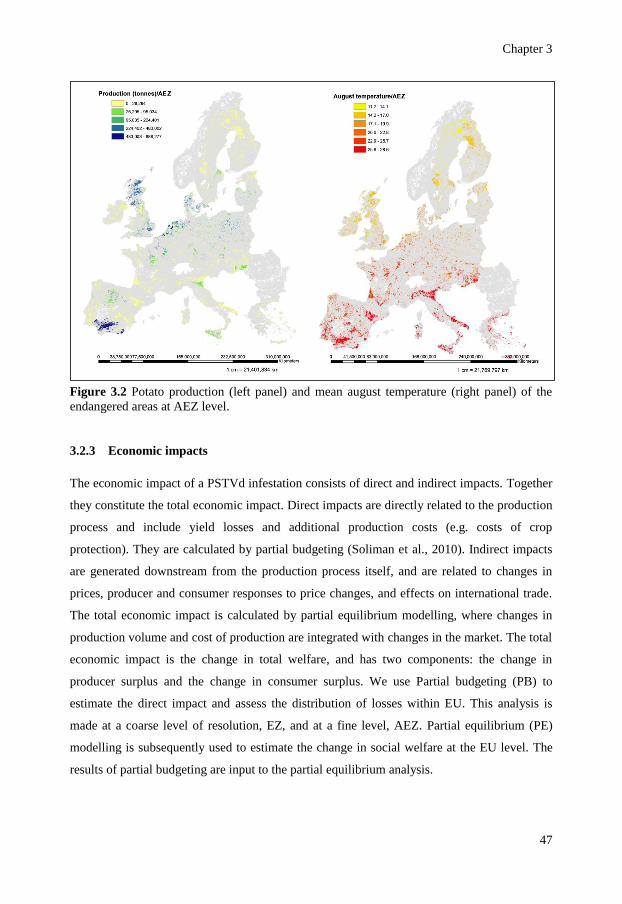
Chapter 3
47
Figure 3.2 Potato production (left panel) and mean august temperature (right panel) of the
endangered areas at AEZ level.
3.2.3 Economic impacts
The economic impact of a PSTVd infestation consists of direct and indirect impacts. Together
they constitute the total economic impact. Direct impacts are directly related to the production
process and include yield losses and additional production costs (e.g. costs of crop
protection). They are calculated by partial budgeting (Soliman et al., 2010). Indirect impacts
are generated downstream from the production process itself, and are related to changes in
prices, producer and consumer responses to price changes, and effects on international trade.
The total economic impact is calculated by partial equilibrium modelling, where changes in
production volume and cost of production are integrated with changes in the market. The total
economic impact is the change in total welfare, and has two components: the change in
producer surplus and the change in consumer surplus. We use Partial budgeting (PB) to
estimate the direct impact and assess the distribution of losses within EU. This analysis is
made at a coarse level of resolution, EZ, and at a fine level, AEZ. Partial equilibrium (PE)
modelling is subsequently used to estimate the change in social welfare at the EU level. The
results of partial budgeting are input to the partial equilibrium analysis.
Chapter 3
48
3.2.3.1 Direct impact
Yield loss due to PSTVd depends on temperature (Sanger and Ramm, 1975; Morris and
Smith, 1977; Harris and Browning, 1980) and the strain of PSTVd (Singh and Slack 1984;
Owens, 2007). Yield loss in potatoes and tomatoes is expected when summer temperature is
20oC or higher (Salazar et al., 1985; Singh, 1983 and 1989).
There is evidence in the literature that supports a positive relationship between
temperature and yield loss, but there is no literature that defines the shape of this relationship
precisely, e.g. as linear or logistic. For example, Singh (1983) indicated that “although viroid
diseases have been reported in both tropical and temperate regions of the world, they induce
more severe symptoms at high temperatures”. Furthermore, Morris and Smith (1977) stated
that “high air temperature not only exaggerates the symptoms on aerial parts, but it has been
shown to double the amount of viroid synthesized in potato tissues at 30°C as compared to
25°C”. A similar response to high temperature has been observed in tomato (Sanger and
Ramm, 1975; Morris and Smith, 1977; Harris and Browning, 1980). Goss (1930) observed
that “the tuber symptoms became more severe at high soil moisture content or temperature”.
Based on this information, we parameterized a linear relation between temperature and yield
loss due to PSTVd. Uncertainty within the temperature-yield loss relationship was accounted
for in the stochastic analysis (see section 3.2.4 below).
Based on Singh et al. (1971) and Cui et al. (1992), we assume, for potato and tomato, a
yield loss of 3% at 20oC and an increase of 3% with every degree increase in average August
temperature till a maximum yield loss of 27% at 28oC, the warmest summer temperature in
Europe. For potato we take the ambient mean August temperature to calculate yield loss. In
the case of tomato, we use at least 20oC as temperature because tomatoes are often grown as
protected crops in glasshouses with an average temperature of 20oC (Hurd and Graves, 1984),
and take the ambient mean August temperature for the zones where it is above 20oC. The 3%
yield loss per degree above 19oC represents a weighted average of loss rates reported for mild
and severe strains of PSTVd (Singh & Slack 1984; Singh et al. 1992; Owens, 2007), assuming
that yield loss of severe strains are three times as high as yield loss of mild strains (Singh et
al., 1971) and that the mild strains prevail over severe strains in a ratio of 11:1 (Singh et al.,
1970; Chrzanowska et al., 1984). Total damage per zone is obtained by multiplying the value
of production by the assigned relative yield loss. In addition to crop losses, presence of
PSTVd will result in higher costs of crop protection.
Chapter 3
49
Unlike potato viruses that may be controlled through the use of resistant cultivars
(Reeves et al., 1994) or chemicals (e.g. Potato yellowing virus) (Jeffries, 1998), PSTVd can
only be controlled by stricter surveillance. Indeed, observation of deformed potato tubers at
harvest is the most likely method of detecting PSTVd (PHA, 2010). As PSTVd surveillance
will usually be done through general surveillance of other potato pests, the additional
protection costs for PSTVd are estimated as a small increase (viz. 10%; Benninga, personal
communication 2011), on top of the regular crop protection cost obtained from SEAMLESS
database (Janssen et al., 2009).
Aggregation of the yield losses and additional protection costs over the spatial zones
provides insight in the total annual direct impact for tomato and potato producers at the EU
level.
3.2.3.2 Total economic impact
PE modelling is used to estimate the total economic impacts. PE extends the impact scope
from producer to the whole society by including impacts on consumers. This is determined by
measuring the differences in equilibrium price and quantity, and change in welfare before and
after pest outbreak (Soliman et al., 2010).
The model distinguishes two regions: the European Union (EU) and the rest of the
world (ROW). We assume that (1) crop products in the EU and in ROW are perfect
substitutes and their respective prices differ only in the transportation costs and tariffs, and (2)
the domestic market for the potentially affected commodity is perfectly competitive, implying
product homogeneity.
Within the PE model, the demand and supply in the EU are defined by equations 1a-1g
(Surkov et al., 2009). The first equation (1a) describes the demand (Di) in the domestic market
as a function of the domestic price (Pi).
i
iii PD
(1a)
Where i is the price elasticity of demand and i is scale parameter. The supply in the
domestic market has two components (equation 1b): supply by affected farmers (SAi) and
supply by non-affected farmers (SNi).
Chapter 3
50
iii SNSAS (1b)
The supply by non-affected farmers (SNi) depends on the price Pi, with supply elasticity
θi and scale parameter βi, and is also determined by the proportion of farmers that is not
affected by the pest (1-zi):
)1( iiii zPSN i
(1c)
The supply by affected farmers (SAi) depends furthermore on the proportional yield
loss, hi, caused by the disease, and by the reduced net price for the product that affected
farmers experience as a result of increased costs of production νi (e.g. for control or
sanitation) (1d):
iiiiii zPvhSA i )()1( (1d)
Prices in the domestic and world market are linearly related where µi represents, e.g.
transport costs or tariffs (1e):
iii WPP (1e)
The equilibrium condition for international trade is expressed by two equation, 1f and
1g. The first of these (1f) calculates exports or imports (Xi) as a difference between domestic
supply and demand.
iii DSX
(1f)
The second equation (1g) expresses the relationship between international trade and the
world price (WPi), where υi is a scale parameter, i is the proportion of the banned export and
ωi is export/import elasticity.
i
iiii WPX )( (1g)
Data for the potato and tomato market is obtained from FAO statistics (FAO, 2009).
The inputs for the partial equilibrium PSTVd analysis are presented in Table 3.1. The results
of the partial equilibrium analysis provide insight in the total economic costs on a yearly basis
on EU level.
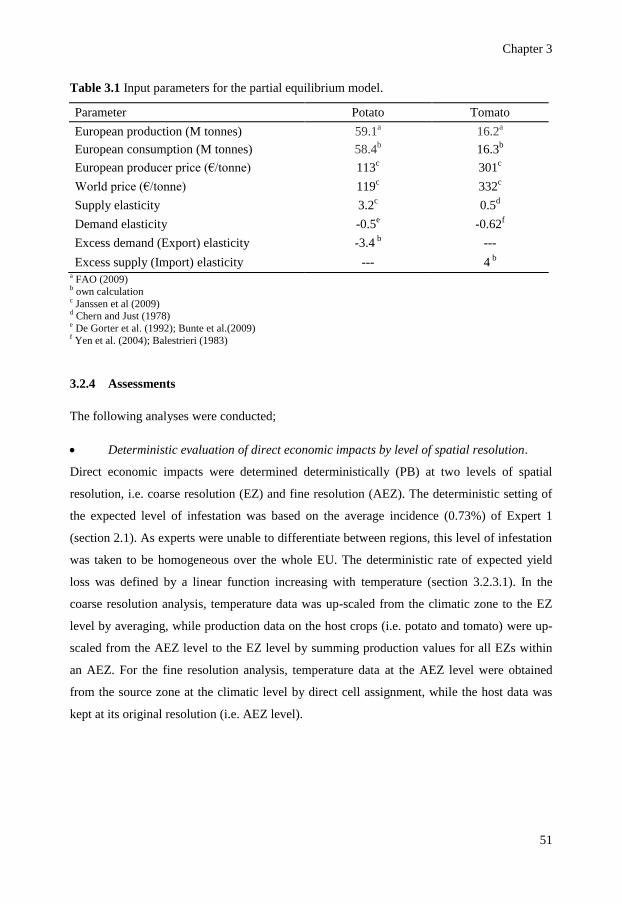
Chapter 3
51
Table 3.1 Input parameters for the partial equilibrium model.
Parameter Potato Tomato
European production (M tonnes) 59.1a 16.2
a
European consumption (M tonnes) 58.4b 16.3
b
European producer price (€/tonne) 113c 301
c
World price (€/tonne) 119c 332
c
Supply elasticity 3.2c 0.5
d
Demand elasticity -0.5e -0.62
f
Excess demand (Export) elasticity -3.4 b ---
Excess supply (Import) elasticity --- 4 b
a FAO (2009)
b own calculation
c Janssen et al (2009)
d Chern and Just (1978)
e De Gorter et al. (1992); Bunte et al.(2009)
f Yen et al. (2004); Balestrieri (1983)
3.2.4 Assessments
The following analyses were conducted;
Deterministic evaluation of direct economic impacts by level of spatial resolution.
Direct economic impacts were determined deterministically (PB) at two levels of spatial
resolution, i.e. coarse resolution (EZ) and fine resolution (AEZ). The deterministic setting of
the expected level of infestation was based on the average incidence (0.73%) of Expert 1
(section 2.1). As experts were unable to differentiate between regions, this level of infestation
was taken to be homogeneous over the whole EU. The deterministic rate of expected yield
loss was defined by a linear function increasing with temperature (section 3.2.3.1). In the
coarse resolution analysis, temperature data was up-scaled from the climatic zone to the EZ
level by averaging, while production data on the host crops (i.e. potato and tomato) were up-
scaled from the AEZ level to the EZ level by summing production values for all EZs within
an AEZ. For the fine resolution analysis, temperature data at the AEZ level were obtained
from the source zone at the climatic level by direct cell assignment, while the host data was
kept at its original resolution (i.e. AEZ level).
Chapter 3
52
Deterministic evaluation of total economic impacts on EU level.
Total economic impacts were estimated by the application of the PE model (section 3.2.3.2),
using the deterministic settings as presented by Table 3.1 and the same settings for expected
infestation level and yield loss as described above.
Stochastic evaluation of direct economic impacts.
The impact of uncertainty with respect to infestation level and yield loss relationship on the
resulting direct economic impacts was evaluated by the use of stochastic simulation (Monte
Carlo simulation by 1,000 replications) of the PB model at EZ level. To account for the
uncertainty in the level of infestation, direct economic impacts were stochastically determined
by each of the four elicited distributions of incidence, as well as their average (section 3.2.1).
The expert distributions within these 5 scenarios were defined by, successively, a trinomial
distribution with values 0.5%, 5% and 10% and corresponding probabilities of 96%, 3% and
1% (expert 1), a triangular distribution with a minimum incidence of 0.1%, a most likely
incidence of 0.25% and a maximum incidence of 0.5% (expert 2), a triangular distribution
with a minimum incidence of 0, a most likely incidence of 0.01% and a maximum incidence
of 0.1% (expert 3), and a uniform distribution between 0.1% and 50% (expert 4).
The uncertainty in yield loss was simulated by drawing the yield loss percentage from a
triangular distribution with a lower bound of 3%, an upper limit of 27%, and the most likely
value depending on temperature as described in the deterministic analysis (3.2.3.1), i.e. a 3%
change in yield loss percentage per degree increase in mean August temperature above 19oC.
Yield loss percentage was drawn from the triangular distribution independently for each EZ.
No yield loss is assumed if temperature is below 19oC.
3.3 Results
3.3.1 Deterministic analyses
The following paragraphs describe the economic impact based on a deterministic evaluation
of the expected steady state of an unregulated PSTVd infestation in the EU.
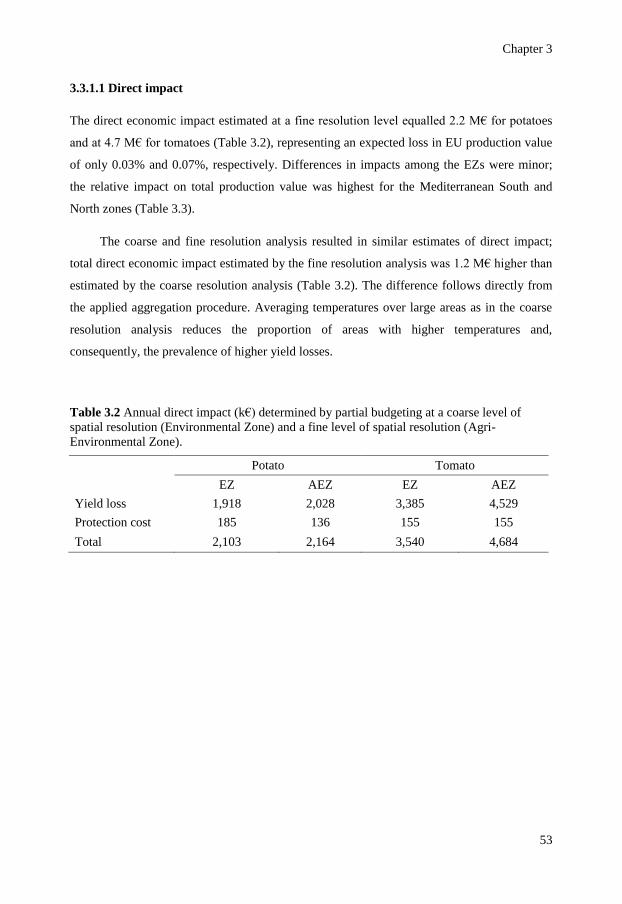
Chapter 3
53
3.3.1.1 Direct impact
The direct economic impact estimated at a fine resolution level equalled 2.2 M€ for potatoes
and at 4.7 M€ for tomatoes (Table 3.2), representing an expected loss in EU production value
of only 0.03% and 0.07%, respectively. Differences in impacts among the EZs were minor;
the relative impact on total production value was highest for the Mediterranean South and
North zones (Table 3.3).
The coarse and fine resolution analysis resulted in similar estimates of direct impact;
total direct economic impact estimated by the fine resolution analysis was 1.2 M€ higher than
estimated by the coarse resolution analysis (Table 3.2). The difference follows directly from
the applied aggregation procedure. Averaging temperatures over large areas as in the coarse
resolution analysis reduces the proportion of areas with higher temperatures and,
consequently, the prevalence of higher yield losses.
Table 3.2 Annual direct impact (k€) determined by partial budgeting at a coarse level of
spatial resolution (Environmental Zone) and a fine level of spatial resolution (Agri-
Environmental Zone).
Potato Tomato
EZ AEZ EZ AEZ
Yield loss 1,918 2,028 3,385 4,529
Protection cost 185 136 155 155
Total 2,103 2,164 3,540 4,684
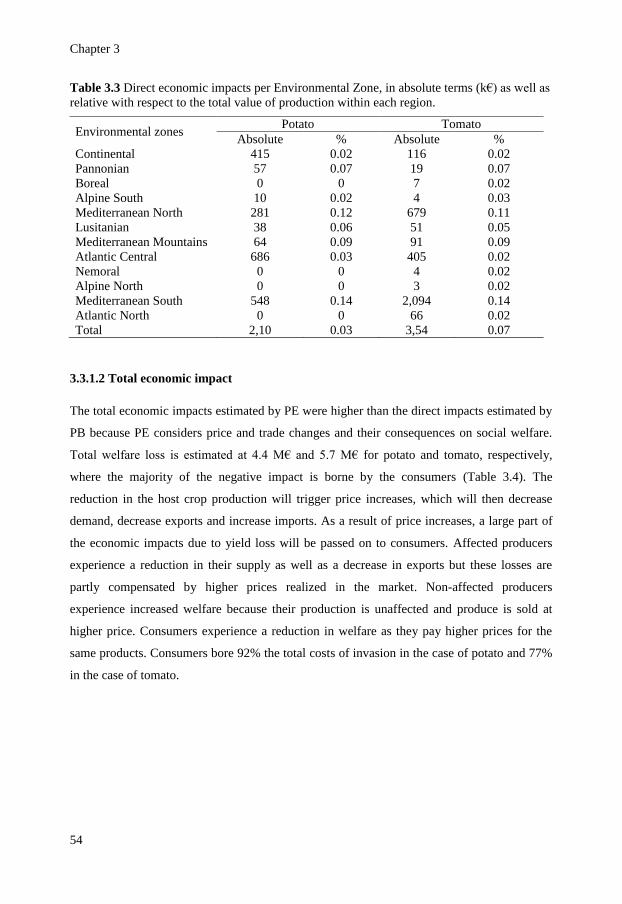
Chapter 3
54
Table 3.3 Direct economic impacts per Environmental Zone, in absolute terms (k€) as well as
relative with respect to the total value of production within each region.
Environmental zones Potato Tomato
Absolute % Absolute %
Continental 415 0.02 116 0.02
Pannonian 57 0.07 19 0.07
Boreal 0 0 7 0.02
Alpine South 10 0.02 4 0.03
Mediterranean North 281 0.12 679 0.11
Lusitanian 38 0.06 51 0.05
Mediterranean Mountains 64 0.09 91 0.09
Atlantic Central 686 0.03 405 0.02
Nemoral 0 0 4 0.02
Alpine North 0 0 3 0.02
Mediterranean South 548 0.14 2,094 0.14
Atlantic North 0 0 66 0.02
Total 2,10 0.03 3,54 0.07
3.3.1.2 Total economic impact
The total economic impacts estimated by PE were higher than the direct impacts estimated by
PB because PE considers price and trade changes and their consequences on social welfare.
Total welfare loss is estimated at 4.4 M€ and 5.7 M€ for potato and tomato, respectively,
where the majority of the negative impact is borne by the consumers (Table 3.4). The
reduction in the host crop production will trigger price increases, which will then decrease
demand, decrease exports and increase imports. As a result of price increases, a large part of
the economic impacts due to yield loss will be passed on to consumers. Affected producers
experience a reduction in their supply as well as a decrease in exports but these losses are
partly compensated by higher prices realized in the market. Non-affected producers
experience increased welfare because their production is unaffected and produce is sold at
higher price. Consumers experience a reduction in welfare as they pay higher prices for the
same products. Consumers bore 92% the total costs of invasion in the case of potato and 77%
in the case of tomato.
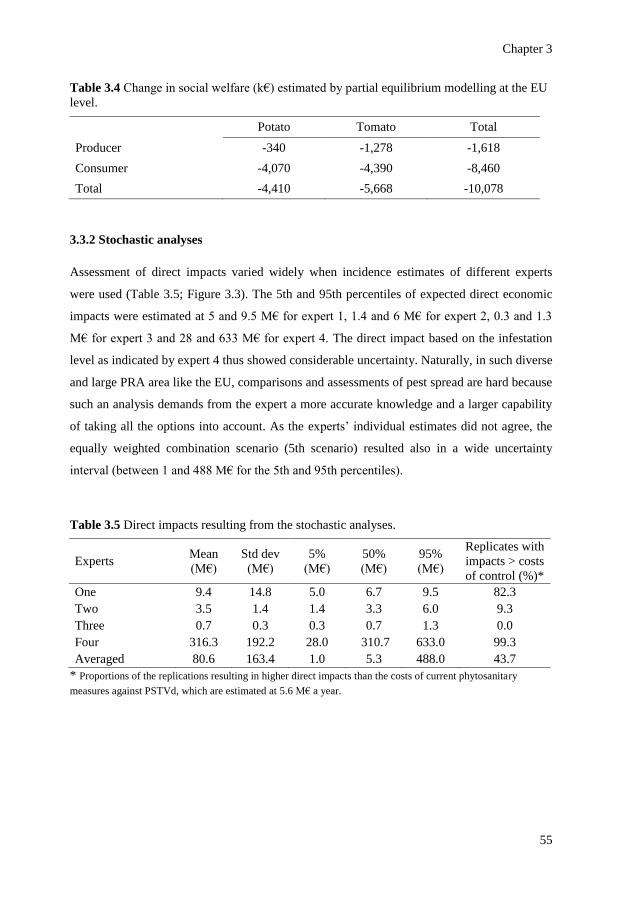
Chapter 3
55
Table 3.4 Change in social welfare (k€) estimated by partial equilibrium modelling at the EU
level.
Potato Tomato Total
Producer -340 -1,278 -1,618
Consumer -4,070 -4,390 -8,460
Total -4,410 -5,668 -10,078
3.3.2 Stochastic analyses
Assessment of direct impacts varied widely when incidence estimates of different experts
were used (Table 3.5; Figure 3.3). The 5th and 95th percentiles of expected direct economic
impacts were estimated at 5 and 9.5 M€ for expert 1, 1.4 and 6 M€ for expert 2, 0.3 and 1.3
M€ for expert 3 and 28 and 633 M€ for expert 4. The direct impact based on the infestation
level as indicated by expert 4 thus showed considerable uncertainty. Naturally, in such diverse
and large PRA area like the EU, comparisons and assessments of pest spread are hard because
such an analysis demands from the expert a more accurate knowledge and a larger capability
of taking all the options into account. As the experts’ individual estimates did not agree, the
equally weighted combination scenario (5th scenario) resulted also in a wide uncertainty
interval (between 1 and 488 M€ for the 5th and 95th percentiles).
Table 3.5 Direct impacts resulting from the stochastic analyses.
Experts Mean
(M€)
Std dev
(M€)
5%
(M€)
50%
(M€)
95%
(M€)
Replicates with
impacts > costs
of control (%)*
One 9.4 14.8 5.0 6.7 9.5 82.3
Two 3.5 1.4 1.4 3.3 6.0 9.3
Three 0.7 0.3 0.3 0.7 1.3 0.0
Four 316.3 192.2 28.0 310.7 633.0 99.3
Averaged 80.6 163.4 1.0 5.3 488.0 43.7
* Proportions of the replications resulting in higher direct impacts than the costs of current phytosanitary
measures against PSTVd, which are estimated at 5.6 M€ a year.
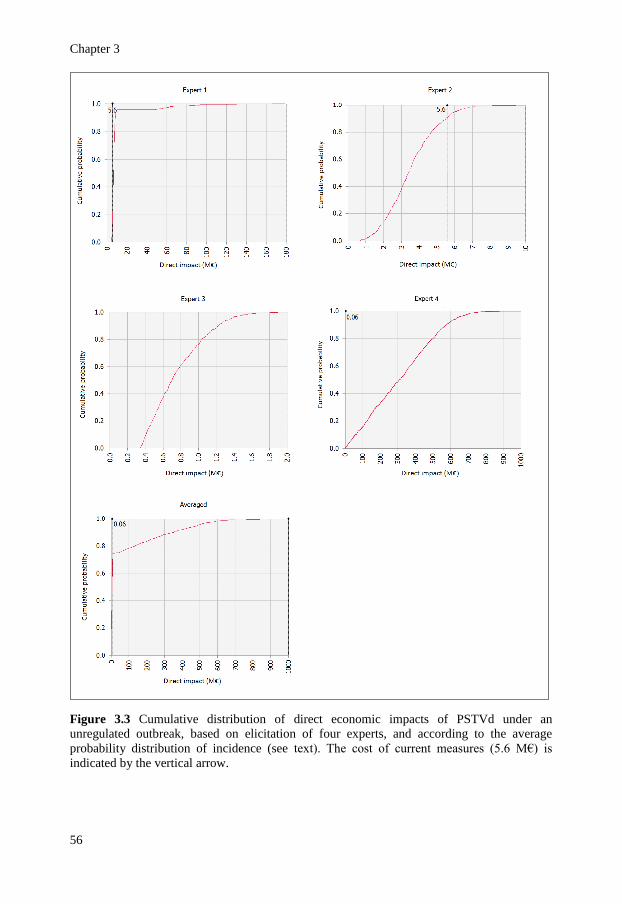
Chapter 3
56
Figure 3.3 Cumulative distribution of direct economic impacts of PSTVd under an
unregulated outbreak, based on elicitation of four experts, and according to the average
probability distribution of incidence (see text). The cost of current measures (5.6 M€) is
indicated by the vertical arrow.
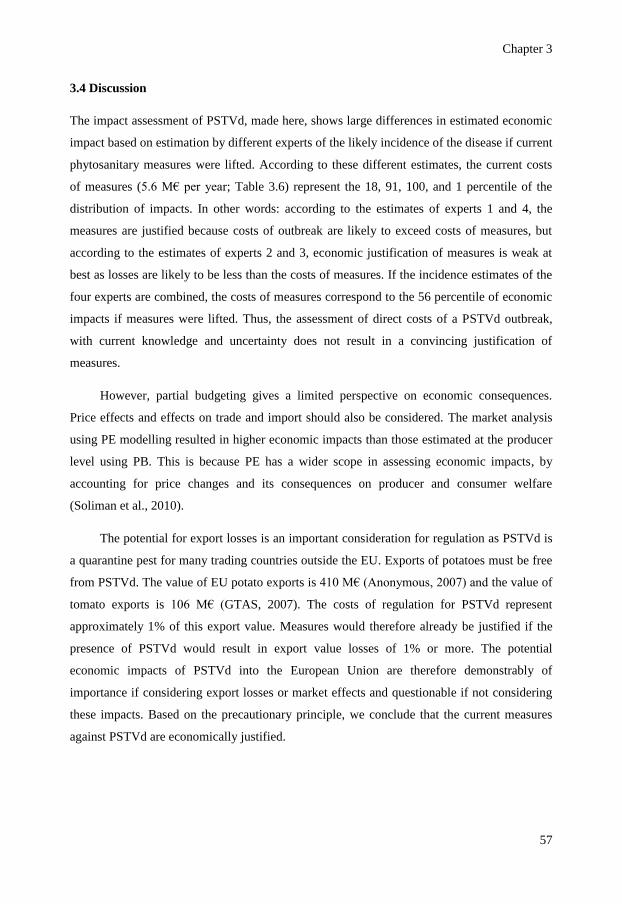
Chapter 3
57
3.4 Discussion
The impact assessment of PSTVd, made here, shows large differences in estimated economic
impact based on estimation by different experts of the likely incidence of the disease if current
phytosanitary measures were lifted. According to these different estimates, the current costs
of measures (5.6 M€ per year; Table 3.6) represent the 18, 91, 100, and 1 percentile of the
distribution of impacts. In other words: according to the estimates of experts 1 and 4, the
measures are justified because costs of outbreak are likely to exceed costs of measures, but
according to the estimates of experts 2 and 3, economic justification of measures is weak at
best as losses are likely to be less than the costs of measures. If the incidence estimates of the
four experts are combined, the costs of measures correspond to the 56 percentile of economic
impacts if measures were lifted. Thus, the assessment of direct costs of a PSTVd outbreak,
with current knowledge and uncertainty does not result in a convincing justification of
measures.
However, partial budgeting gives a limited perspective on economic consequences.
Price effects and effects on trade and import should also be considered. The market analysis
using PE modelling resulted in higher economic impacts than those estimated at the producer
level using PB. This is because PE has a wider scope in assessing economic impacts, by
accounting for price changes and its consequences on producer and consumer welfare
(Soliman et al., 2010).
The potential for export losses is an important consideration for regulation as PSTVd is
a quarantine pest for many trading countries outside the EU. Exports of potatoes must be free
from PSTVd. The value of EU potato exports is 410 M€ (Anonymous, 2007) and the value of
tomato exports is 106 M€ (GTAS, 2007). The costs of regulation for PSTVd represent
approximately 1% of this export value. Measures would therefore already be justified if the
presence of PSTVd would result in export value losses of 1% or more. The potential
economic impacts of PSTVd into the European Union are therefore demonstrably of
importance if considering export losses or market effects and questionable if not considering
these impacts. Based on the precautionary principle, we conclude that the current measures
against PSTVd are economically justified.
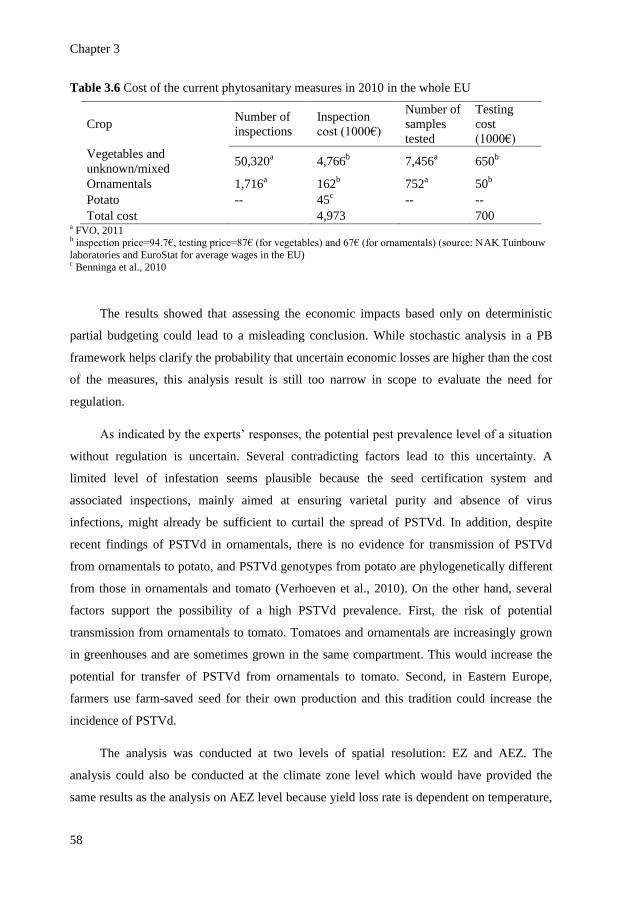
Chapter 3
58
Table 3.6 Cost of the current phytosanitary measures in 2010 in the whole EU
Crop Number of
inspections
Inspection
cost (1000€)
Number of
samples
tested
Testing
cost
(1000€)
Vegetables and
unknown/mixed 50,320
a 4,766
b 7,456
a 650
b
Ornamentals 1,716a 162
b 752
a 50
b
Potato -- 45c -- --
Total cost 4,973 700 a FVO, 2011
b inspection price=94.7€, testing price=87€ (for vegetables) and 67€ (for ornamentals) (source: NAK Tuinbouw
laboratories and EuroStat for average wages in the EU) c Benninga et al., 2010
The results showed that assessing the economic impacts based only on deterministic
partial budgeting could lead to a misleading conclusion. While stochastic analysis in a PB
framework helps clarify the probability that uncertain economic losses are higher than the cost
of the measures, this analysis result is still too narrow in scope to evaluate the need for
regulation.
As indicated by the experts’ responses, the potential pest prevalence level of a situation
without regulation is uncertain. Several contradicting factors lead to this uncertainty. A
limited level of infestation seems plausible because the seed certification system and
associated inspections, mainly aimed at ensuring varietal purity and absence of virus
infections, might already be sufficient to curtail the spread of PSTVd. In addition, despite
recent findings of PSTVd in ornamentals, there is no evidence for transmission of PSTVd
from ornamentals to potato, and PSTVd genotypes from potato are phylogenetically different
from those in ornamentals and tomato (Verhoeven et al., 2010). On the other hand, several
factors support the possibility of a high PSTVd prevalence. First, the risk of potential
transmission from ornamentals to tomato. Tomatoes and ornamentals are increasingly grown
in greenhouses and are sometimes grown in the same compartment. This would increase the
potential for transfer of PSTVd from ornamentals to tomato. Second, in Eastern Europe,
farmers use farm-saved seed for their own production and this tradition could increase the
incidence of PSTVd.
The analysis was conducted at two levels of spatial resolution: EZ and AEZ. The
analysis could also be conducted at the climate zone level which would have provided the
same results as the analysis on AEZ level because yield loss rate is dependent on temperature,
Chapter 3
59
data for which are available at the climate zone level. We chose the AEZ level for
representation and pragmatic purposes. The analyses on EZ and AEZ level yielded similar
results in terms of total impact across Europe. However, the finer analysis at the AEZ level
did not provide additional insight in the spatial distribution of the impacts because there was
no information on spread. Therefore, the gains in insight did not outweigh the additional
effort and time spent to conduct the analysis at the finer AEZ level.
ISPM No. 11 states that the implementation of phytosanitary measures should be
economically justifiable. However, to date, the impact assessment of PSTVd at the EU level
has been ad hoc and largely limited to documenting losses where pest outbreaks have
occurred (EFSA, 2011b, 2010a), and without the application of a quantitative assessment to
evaluate the economic justification of measures. As a matter of principle, the European Food
Safety Authority (EFSA) does not assess economic impacts in monetary terms (EFSA,
2010b). Limiting the PRA to only qualitative assessment could lead to a weaker position in
trade disputes with other countries. Furthermore, limiting the quantitative assessment only to
the cases where all relevant data are available will restrain the potential contribution that can
be provided by the quantitative approach to the economic justification of the measures. To be
relevant to real world situations, the challenge should be faced of making an analysis when
the quantitative evidence is scarce. This paper demonstrates that a quantitative analysis, based
on expert assessments, can provide management relevant insights in the economic
justification of the phytosanitary measures, despite uncertainties.
Chapter 3
60
Acknowledgments
The opinions expressed are those of the authors. Work on this paper was supported by the
European Commission under grant agreement number 212459, seventh framework
programme, project PRATIQUE: Enhancement of Pest Risk Analysis Techniques. We thank
Richard Baker, Johan Bremmer, Jan Benninga, Annelien Roenhorst, Neil Giltrap and Dirk Jan
Van der Gaag for helpful suggestions and discussion.
Chapter 3
61
References
Anonymous, 2007. The potato sector in the European Union. Commission staff working document, SEC-533.
Balestrieri G., 1983. An econometric analysis of wholesale market demand for fresh tomatoes using daily data.
Acta horticulture 135.
Benninga J., Hennen W., Schans J., 2010. Chain risk model for quantifying cost effectiveness of phytosanitary
measures. Report 2009-113, Project code 4061300, LEI Wageningen UR, The Hague.
Bunte F., Kuiper W.E., van Galen M.A., 2009. Consumer response when lowering organic food prices to non-
organic levels. 26èmes Journées de Microéconomie de Dijon, Tunisia.
Chambers C.P., 2007. An ordinal characterization of the linear opinion pool. Economic Theory 33(3), 457-474.
Chern W.S., Just R.E., 1978. Econometric Analysis of Supply Response and Demand for Processing Tomatoes
in California. Giannini Foundation Monograph Number 37.
Chrzanowska, M., Kowalska-Noordam, A., Zagorska, H., Skrzeczkowska, S., 1984. The response of Polish
potato varieties to the severe strain of the spindle tuber viroid. Biuletyn Instytutu Ziemniaka 31, 15-27.
Clemen R.T., Winkler R.L., 1999. Combining Probability Distributions From Experts in Risk Analysis. Risk
Analysis 19 (2), 187-203.
Cui R.C., Li Z.F., Li X.L. Wang G.X., 1992. Identification of potato spindle tuber viroid (PSTVd) and its
control. Acta Phytophylacica Sinica 19, 263-269.
De Gorter H., Hickey R., Wecksler D., 1992. Project effects of trade liberalization on US speciality crops. GATT
research paper, 92-GATT 18.
Di Serio F., 2007. Identification and characterization of Potato spindle tuber viroid infecting Solanum
jasminoides and S. rantonnetii in Italy. Journal of Plant Pathology 89, 297-300.
Diener T.O., 1987. Biological properties. In: Diener TO, Ed. The Viroids. Plenum Press, New York, 9-35.
EC, 2008. Farm Accountancy Data Network (FADN). Source: EU-FADN-DG, AGRI-G3
http://ec.europa.eu/agriculture/rica/
EFSA, 2010a. Panel on Plant Health (PLH); Risk assessment of the oriental chestnut gall wasp, Dryocosmus
kuriphilus for the EU territory on request from the European Commission. EFSA Journal 8(6), 1619.
EFSA, 2010b. Guidance on a harmonised framework for pest risk assessment and the identification and
evaluation of pest risk management options by EFSA. Panel on Plant Health (PLH), EFSA Journal 8(2),
1495.
EFSA, 2011a. Scientific Opinion on the assessment of the risk of solanaceous pospiviroids for the EU territory
and the identification and evaluation of risk management options. Panel on Plant Health (PLH), EFSA
Journal 9(8), 2330.
EFSA, 2011b. Panel on Plant Health (PLH); Pest risk assessment of Monilinia fructicola for the EU territory and
identification and evaluation of risk management options. EFSA Journal 9(4), 2119.
FAO, 2004. Pest risk analysis for quarantine pests including analysis of environmental risks. International
Standards for Phytosanitary Measures. Publication No. 11. Rev. 1. FAO, Rome.
FAO, 2009. Food and Agriculture organization of the United Nations, http://faostat.fao.org/default.aspx.
FVO, 2011. Food and Veterinary Office, DG SANCO, EC Commission.
GTAS, 2007. Global Trade Atlas statistics, Bureau of the Census, DOC.
Goss BW, 1930. The symptoms of spindle tuber and unmottled curly dwarf of the potato. Nebraska
Agricultural Experiment Station Research Bulletin, 47, pp.39 + 7 plates.
Harris P.S., Browning LA., 1980. The effect of temperature and light on the symptom expression and viroid
concentration in tomato of a severe strain of potato spindle tuber viroid. Potato Research 23, 85-93.
Hazeu G., Gerard E.B., Andersen E., Bettina B., van Diepen C.A., Metzger M.J., 2010. A biophysical typology
for a spatially-explicit agri-environmental modeling framework. In Environmental and agricultural
modelling: integrated approaches for policy impact assessment, eds. Floor Brouwer and M. K. van Ittersum:
Springer Academic Publishing.
Hurd R.G., Graves C.J., 1984. The influence of different temperature patterns having the same integral on the
earliness and yield of tomatoes. Acta horticulture 148, 547–554
Janssen S., Andersen E., Athanasiadis I.N., Van Ittersum M.K., 2009. A database for integrated assessment of
European agricultural systems. Environmental Science and Policy 12, 573 - 587.
Jeffries C.J., 1998. FAO/IPGRI Technical Guidelines for the Safe Movement of Germplasm. No. 19. Potato, No.
19:177 pp.
JRC, 2008. Meteorological data Source JRC/AGRIFISH Data Base – European Commission – Joint Research
Center.
Chapter 3
62
Matousek J., Orctova L., Ptacek J., Patzak J., Dedic P., 2007. Experimental transmission of pospiviroid
populations to weed species characteristic of potato and hop fields. Journal of Virology 81(11), 891–99
Morris T.J., Smith E.M., 1977. Potato spindle tuber disease: procedures for the detection of viroid RNA and
certification of disease-free potato tubers. Phytopathology 67, 145-1 50.
Owens R.A., 2007. Potato spindle tuber viroid: The simplicity paradox resolved?. Molecular Plant
Pathology 8(5), 549-560.
PHA, Plant Health Australia, 2010. Farm biosecurity manual for the Northern Adelaide Plains vegetable
growers.
Puchta H., Herold T., Verhoeven K., Roenhorst A., Ramm K., Schmidt-Puchta W., Sanger H.L., 1990. A new
strain of potato spindle tuber viroid (PSTVd-N) exhibits major sequence differences as compared to all other
PSTVd strains sequenced so far. Plant Molecular Biology 15(3), 509-511
Querci M., Owens R.A., Vargas C., Salazar L.F., 1995. Detection of Potato Spindle Tuber Viroid in Avocado
Growing in Peru. Plant Disease 79, 196-202.
Reeves A.F., Porter G.A., Cunningham C.E., Nickeson R.J., Manzer F.E., Work T.M., Davis A.A., Plissey E.S.,
1994. Prestile: a new round white potato variety. American Potato Journal 71(2), 89-97.
Salazar L.F., Schilde-Rentscheler L., Lizarraga R., 1985. Elimination of potato spindle tuber viroid from potato
by cold treatment and meristem culture. In: Maramorosch K, McKelvey Jr. JJ (ed.), subviral pathogens of
plants and animals: viroids and prions, Academic press, Inc., London, UK.
Sanger H.L., Ramm K., 1975. Radioactive labelling of viroid RNA. In Modification of the Information Content
of Plant Cells. Eds. R. Markham, D.R. Davies, D.A. Hapwood, and R.W. Horne, Amsterdam, North Holland,
pp. 230-253.
Singh R.P., 1973. Experimental host range of the potato spindle tuber ‘virus’. American Journal of Potato
Research 50 (4), 111-123.
Singh R.P., 1983. Viroids and their potential danger to potatoes in hot climate. Canadian Plant Disease Survey
63, 13-18.
Singh R.P., 1989. Techniques in the study of tropical and subtropical plants. Review tropical plant pathology 6,
81-118.
Singh R.P., Boucher A., Somerville T.H., 1992. Detection of potato spindle tuber viroid in the pollen and various
parts of potato plant pollinated with viroid-infected pollen. Plant Disease 76, 951-953.
Singh R.P., Finnie R.E., Bagnall R.H. , 1970. Relative prevalence of mild and severe strains of potato spindle
tuber virus in eastern Canada. American. Journal of Potato Research 47 (8), 289-293.
Singh R.P., Finnie R.E., Bagnall R.H., 1971. Losses due to the potato spindle tuber virus. American Potato
Journal 48, 262-267.
Singh R.P., Slack S.A., 1984. Reactions of Tuber-Bearing Solanum Species to Infection with Potato Spindle
Tuber Viroid. Plant Disease 68, 784-787.
Soliman T., Mourits M.C.M., Oude Lansink A.G.J.M., van der Werf W., 2010. Economic impact assessment in
pest risk analysis, Crop Protection 29, 517–524.
Surkov I.V., A.G.J.M. Oude Lansink, Van der Werf W., 2009. The optimal amount and allocation of sampling
effort for plant health inspection. European Review of Agricultural Economics 36 (3), 295-320.
Van Ittersum M.K., Ewert F., Heckelei T., Wery J., Alkan Olsson J., Andersen E., Bezlepkina I., Brouwer F.,
Donatelli M., Flichman G., Olsson L., Rizzoli A., Van der Wal T., Wien J.E., Wolf J., 2008. Integrated
assessment of agricultural systems – A component-based framework for the European Union (SEAMLESS).
Agricultural System 96, 150-165.
Verhoeven J.T.h.J., Botermans M., Jansen C.C.C., Roenhorst J.W., 2010. First report of Tomato apical stunt
viroid in the symptomless hosts Lycianthes rantonnetii and Streptosolen jamesonii in the Netherlands. Plant
Disease 94(6), 791.
Verhoeven J.Th.J., Jansen C.C.C., Roenhorst J.W., Steyer S., Schwind N., Wassenegger M., 2008. First Report
of Solanum jasminoides Infected by Citrus exocortis viroid in Germany and the Netherlands and Tomato
apical stunt viroid in Belgium and Germany. Plant Disease 92: 973.
Yen S.T., Lin B., Harris J.M., Ballenger N., 2004. Demand for Differentiated Vegetables, Selected Paper
prepared for presentation at the American Agricultural Economics Association Annual Meeting, Denver,
Colorado
63
Chapter 4
Framework for Modelling Economic Impacts of Invasive Species,
Applied to Pine Wood Nematode in Europe
Soliman T., Mourits M.C.M., van der Werf W., Hengeveld G.M., Robinet C., Oude Lansink A.G.J.M., 2012.
Framework for Modelling Economic Impacts of Invasive Species, Applied to Pine Wood Nematode in Europe,
submitted to PLoS ONE.
Chapter 4
64
Abstract
Economic impact assessment of invasive species requires integration of information on pest
entry, establishment and spread, valuation of assets at risk and market consequences at large
spatial scales. Here we develop such a framework and demonstrate its application to the
pinewood nematode, Bursaphelenchus xylophilus, which threatens the European forestry
industry. The effect of spatial resolution on the assessment result is analysed. Direct
economic impacts resulting from wood loss are computed using partial budgeting at regional
scale, while total (direct and indirect) impacts on the round wood market are computed using
partial equilibrium modelling at EU scale. Substantial impacts in terms of infested stock are
expected in Portugal, Spain, Southern France, and North West Italy but not elsewhere in EU
in the near future. The cumulative value of lost forestry stock over a period of 22 years (2008
– 2030), assuming no regulatory control measures, is estimated at €22 billion. The greatest
yearly loss of stock is expected to occur in the period 2014-2019, with a peak of three billion
euros in 2016, but stabilizing afterwards at 300–800 million euros/year. The reduction in
social welfare follows the loss of stock with considerable delay because the yearly harvest
from the forest is only 1.8%. The reduction in social welfare for the downstream round wood
market is estimated at €218 million in 2030, whereby consumers incur a welfare loss of €357
million, while producers experience a €139 million increase, due to higher wood prices. The
societal impact is expected to extend to well beyond the time horizon of the analysis, and long
after the invasion has stopped. PWN has large economic consequences for the conifer forestry
industry in the EU. A change in spatial resolution from fine to coarse affected the calculated
directed losses by 24%, but did not critically affect conclusions.
Keywords
Pest risk analysis – pine wood nematode – economic impact assessment – EU – spatial
resolution
Chapter 4
65
4.1 Introduction
A quantitative economic impact assessment of invasive species requires spatial integration of
information on the potential for establishment, spread and impacts of the pest, which is a
novel and challenging area in pest risk assessment (Baker et al., 2005). Difficulties of
integrating spread and economic impacts arise from unavailability of data on pest population
densities, lack of knowledge on the relationship between those densities and expected yield
reduction or quality loss, and difficulties in up-scaling the impacts from field to market level.
Several studies have been devoted to the development of biological spread models
(Heesterbeek and Zadoks, 1986; Carrasco et al., 2010; Robinet et al., 2011) or economic
evaluation models to estimate economic impacts (e.g. field and market scale) given
predefined pest infestation rates (Wesseler and Fall, 2010; Heikkila and Peltola, 2004;
Wittwer et al., 2005). Only few quantitative studies have integrated spread with impacts
(Haight et al., 2011; Yemshanov et al., 2011; Hodda and Cook, 2009), and none of them
accounted for the economic impacts at market level.
Wood production in forestry is vulnerable to invasive species, and enormous economic
consequences have been reported. In the US, annual losses of forest products caused by
invasive species exceed $4.2 billion (Pimentel et al., 2000) while in China these are estimated
at $2.2 billion (Higgins et al., 2000) and in Canada at $9.6 billion (Colautti et al., 2006).
Invasive forest pests could lead to similar massive economic impacts on the European
continent.
Pine wood nematode (Bursaphelenchus xylophilus) (Steiner and Buhrer, 1934; Nickle et
al., 1981) is recognized worldwide as a major forest pest (Evans et al., 1996). Originating in
the US, pine wood nematode (PWN) has spread to East Asia (OEPP/EPPO, 1986), Portugal
(Mota et al., 1999), and North West Spain (Anonymous (2010). The nematode can reproduce
quickly at high temperatures in summer. Huge populations of the nematode develop in
infested trees, impeding water transport and causing the symptoms of pine wilt disease
(PWD). Ultimately, PWD results in the death of the infested trees. PWN is vectored from
diseased to healthy trees by bark beetles in the genus Monochamus. Pines (Pinus spp.) are
favoured hosts but other genera of conifers (Abies, Picea, Larix, Cedrus and Pseudotsuga) are
also attacked (Evans et al., 1996).
Since May 2008, Portugal has been classified as a demarcated area for PWN and
subjected to emergency measures set out in Decision 2006/133/EC to prevent the further
Chapter 4
66
spread of PWN in the European Union (EU) (Anonymous, 2008). Despite an intensive
containment program (i.e. PROLUNG) (Rodrigues, 2008), recent inspections carried out by
the Food and Veterinary Office (FVO) of the European Commission indicated that the applied
emergency measures have been insufficient (FVO, 2008). Moreover, Sweden, Finland and
Spain notified PWN findings in pallets imported from Portugal (FVO, 2008). Intensification
of the control measures may thus be required to eradicate the pest in Portugal and prevent
further spread to the rest of the EU. However, the intensification of control measures must be
economically justifiable. It is therefore important to make an objective quantitative
assessment of the expected economic consequences on European forest production and
downstream markets that may result from a possible future spread of PWN from Portugal.
The objective of this paper is twofold. The first objective is problem oriented: to assess
the expected economic consequences after 22 years of an uncontrolled PWN infestation in the
EU by integrating information on climate, spread of PWN and value of forestry assets in
Europe. The results give insight in the distribution of losses among geographical regions and
show the impact on social welfare at pan-European level. The second objective is
methodological. As little information is available on the effect of spatial resolution on
economic impact assessments, this study compares the results of different spatial and
economic techniques to arrive at an evidence-based quantification of economic impacts. The
comparison clarifies how spatial resolution and economic assessment method affect the
results and the associated requirements in terms of effort and data.
4.2 Materials and Methods
4.2.1 Conceptual framework
The economic impact model consists of four modules, one for calculating the spatio-temporal
spread of the nematode, a second for climatic modelling to determine the areas where the
climate is suitable for disease expression in infested trees, a third for modelling the spatial
distribution and value of potential hosts or habitats and a fourth for calculation of economic
impacts (Figure 4.1). Data layers resulting from the spread, climate and host modules are
integrated in a geographic information system (GIS) to quantify and map economic losses. To
enable integration, the different data layers need to be at the same level of spatial resolution.
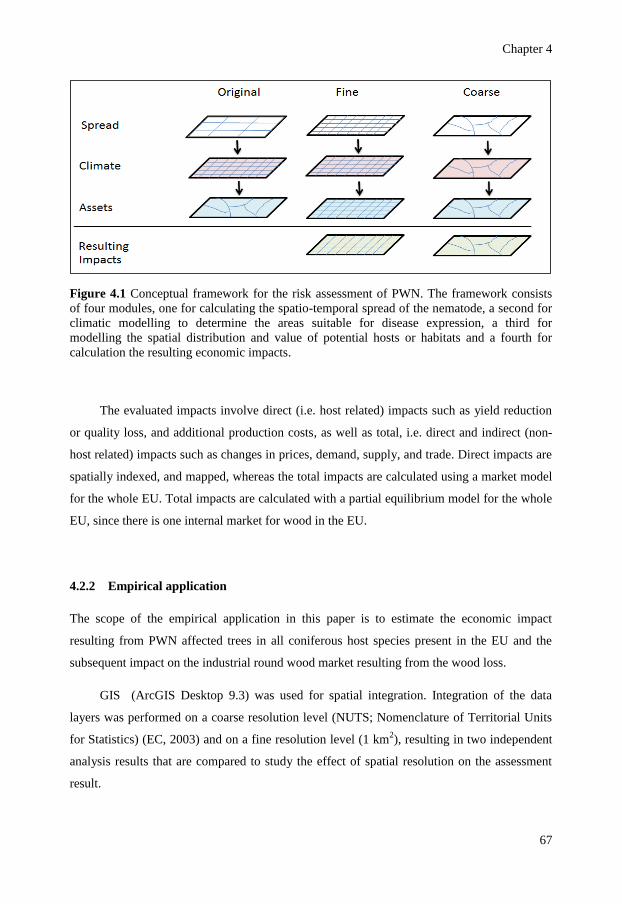
Chapter 4
67
Figure 4.1 Conceptual framework for the risk assessment of PWN. The framework consists
of four modules, one for calculating the spatio-temporal spread of the nematode, a second for
climatic modelling to determine the areas suitable for disease expression, a third for
modelling the spatial distribution and value of potential hosts or habitats and a fourth for
calculation the resulting economic impacts.
The evaluated impacts involve direct (i.e. host related) impacts such as yield reduction
or quality loss, and additional production costs, as well as total, i.e. direct and indirect (non-
host related) impacts such as changes in prices, demand, supply, and trade. Direct impacts are
spatially indexed, and mapped, whereas the total impacts are calculated using a market model
for the whole EU. Total impacts are calculated with a partial equilibrium model for the whole
EU, since there is one internal market for wood in the EU.
4.2.2 Empirical application
The scope of the empirical application in this paper is to estimate the economic impact
resulting from PWN affected trees in all coniferous host species present in the EU and the
subsequent impact on the industrial round wood market resulting from the wood loss.
GIS (ArcGIS Desktop 9.3) was used for spatial integration. Integration of the data
layers was performed on a coarse resolution level (NUTS; Nomenclature of Territorial Units
for Statistics) (EC, 2003) and on a fine resolution level (1 km2), resulting in two independent
analysis results that are compared to study the effect of spatial resolution on the assessment
result.
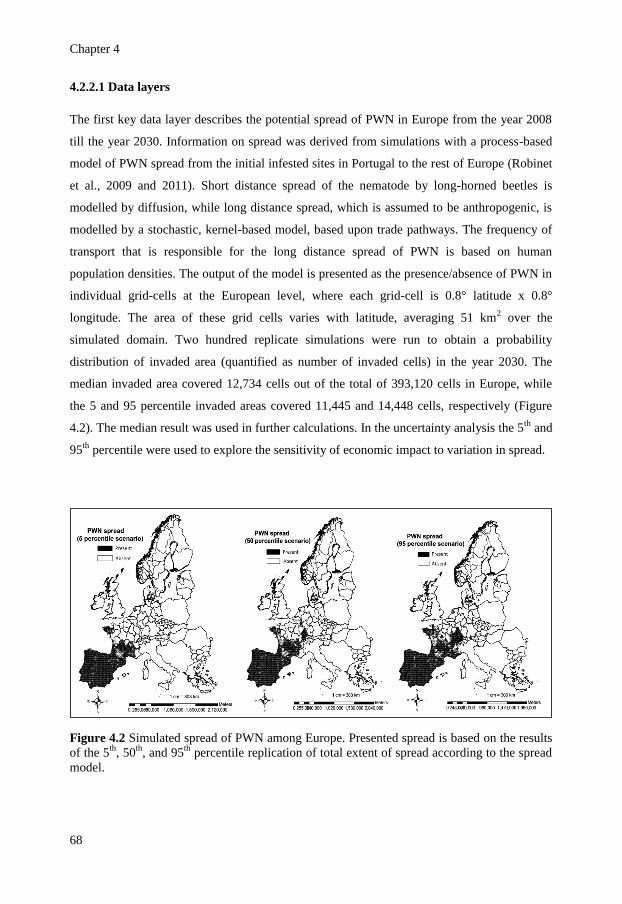
Chapter 4
68
4.2.2.1 Data layers
The first key data layer describes the potential spread of PWN in Europe from the year 2008
till the year 2030. Information on spread was derived from simulations with a process-based
model of PWN spread from the initial infested sites in Portugal to the rest of Europe (Robinet
et al., 2009 and 2011). Short distance spread of the nematode by long-horned beetles is
modelled by diffusion, while long distance spread, which is assumed to be anthropogenic, is
modelled by a stochastic, kernel-based model, based upon trade pathways. The frequency of
transport that is responsible for the long distance spread of PWN is based on human
population densities. The output of the model is presented as the presence/absence of PWN in
individual grid-cells at the European level, where each grid-cell is 0.8° latitude x 0.8°
longitude. The area of these grid cells varies with latitude, averaging 51 km2 over the
simulated domain. Two hundred replicate simulations were run to obtain a probability
distribution of invaded area (quantified as number of invaded cells) in the year 2030. The
median invaded area covered 12,734 cells out of the total of 393,120 cells in Europe, while
the 5 and 95 percentile invaded areas covered 11,445 and 14,448 cells, respectively (Figure
4.2). The median result was used in further calculations. In the uncertainty analysis the 5th
and
95th
percentile were used to explore the sensitivity of economic impact to variation in spread.
Figure 4.2 Simulated spread of PWN among Europe. Presented spread is based on the results
of the 5th
, 50th
, and 95th
percentile replication of total extent of spread according to the spread
model.
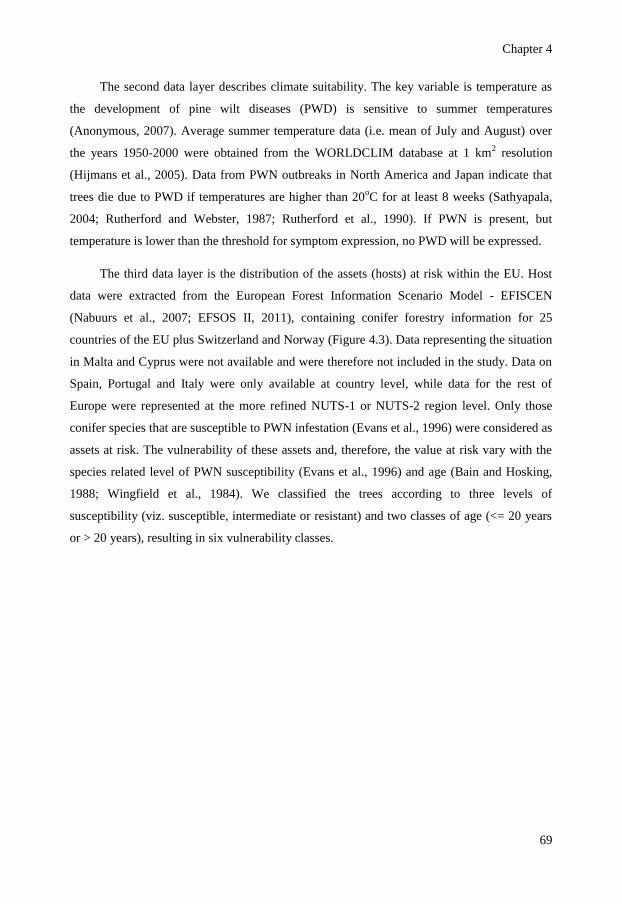
Chapter 4
69
The second data layer describes climate suitability. The key variable is temperature as
the development of pine wilt diseases (PWD) is sensitive to summer temperatures
(Anonymous, 2007). Average summer temperature data (i.e. mean of July and August) over
the years 1950-2000 were obtained from the WORLDCLIM database at 1 km2 resolution
(Hijmans et al., 2005). Data from PWN outbreaks in North America and Japan indicate that
trees die due to PWD if temperatures are higher than 20oC for at least 8 weeks (Sathyapala,
2004; Rutherford and Webster, 1987; Rutherford et al., 1990). If PWN is present, but
temperature is lower than the threshold for symptom expression, no PWD will be expressed.
The third data layer is the distribution of the assets (hosts) at risk within the EU. Host
data were extracted from the European Forest Information Scenario Model - EFISCEN
(Nabuurs et al., 2007; EFSOS II, 2011), containing conifer forestry information for 25
countries of the EU plus Switzerland and Norway (Figure 4.3). Data representing the situation
in Malta and Cyprus were not available and were therefore not included in the study. Data on
Spain, Portugal and Italy were only available at country level, while data for the rest of
Europe were represented at the more refined NUTS-1 or NUTS-2 region level. Only those
conifer species that are susceptible to PWN infestation (Evans et al., 1996) were considered as
assets at risk. The vulnerability of these assets and, therefore, the value at risk vary with the
species related level of PWN susceptibility (Evans et al., 1996) and age (Bain and Hosking,
1988; Wingfield et al., 1984). We classified the trees according to three levels of
susceptibility (viz. susceptible, intermediate or resistant) and two classes of age (<= 20 years
or > 20 years), resulting in six vulnerability classes.
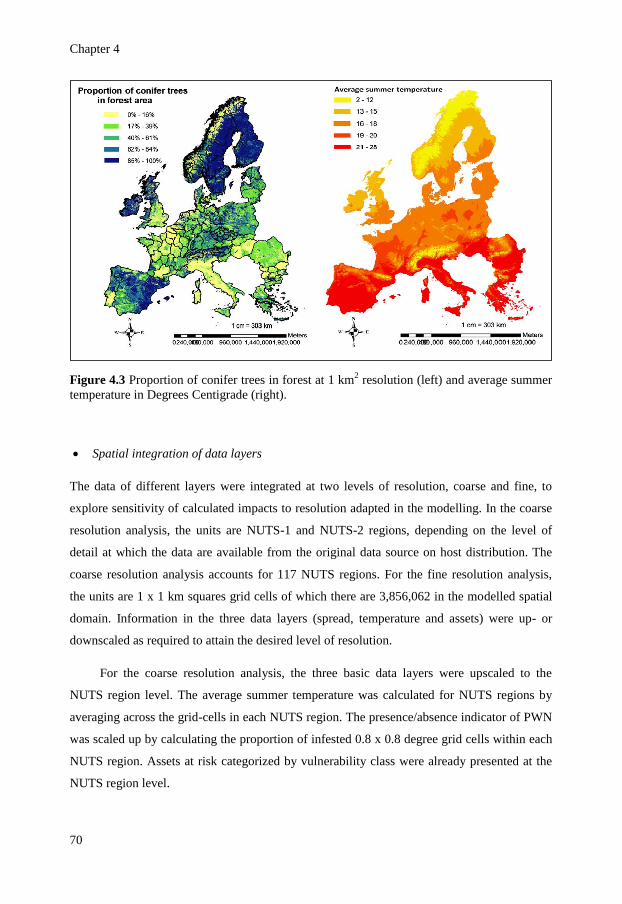
Chapter 4
70
Figure 4.3 Proportion of conifer trees in forest at 1 km2 resolution (left) and average summer
temperature in Degrees Centigrade (right).
Spatial integration of data layers
The data of different layers were integrated at two levels of resolution, coarse and fine, to
explore sensitivity of calculated impacts to resolution adapted in the modelling. In the coarse
resolution analysis, the units are NUTS-1 and NUTS-2 regions, depending on the level of
detail at which the data are available from the original data source on host distribution. The
coarse resolution analysis accounts for 117 NUTS regions. For the fine resolution analysis,
the units are 1 x 1 km squares grid cells of which there are 3,856,062 in the modelled spatial
domain. Information in the three data layers (spread, temperature and assets) were up- or
downscaled as required to attain the desired level of resolution.
For the coarse resolution analysis, the three basic data layers were upscaled to the
NUTS region level. The average summer temperature was calculated for NUTS regions by
averaging across the grid-cells in each NUTS region. The presence/absence indicator of PWN
was scaled up by calculating the proportion of infested 0.8 x 0.8 degree grid cells within each
NUTS region. Assets at risk categorized by vulnerability class were already presented at the
NUTS region level.
Chapter 4
71
In the fine resolution analysis, data were integrated at a 1 km2 resolution. Temperature
data were originally available at 1 km2 level but other variables needed to be downscaled. The
value of the spread indicator in each 1 km2
grid (presence/absence) was obtained from the
source cell of the spread model (0.8° x 0.8°), assuming that presence in the source cell
implied presence in each 1 km2 grid cell within it. Assets at risk were known by NUTS
region. Damage at NUTS level was obtained by multiplying the value at risk in the region by
the proportion of 1 km2 cells that met two criteria, 1) infested with PWN and 2) temperature
higher than the threshold value for expressing PWD (see direct impacts). This total impact in
a NUTS region was then distributed over the 1 km2 cells that met the two criteria for impact,
assuming a homogenous distribution of the production value within the NUTS region.
4.2.2.2 Economic impacts
A partial budget (PB) analysis was applied to calculate the loss of the standing stock available
for round wood production in the EU resulting from 22 years of uncontrolled PWN spread,
and to map the spatial distribution of direct losses over the EU. The economic impacts were
estimated up till year 2030 in line with the time horizon of the spread model. We consider
only the value of lost wood and ignore the costs of mitigation which can – in principle – be
included in PB analysis (Soliman et al., 2010).
Partial equilibrium analysis was conducted to estimate the annual change in social
welfare for the whole of the EU as a consequence of an affected wood supply destined for
round wood production. Partial equilibrium analysis accounts for the phenomenon that
changes in round wood production will trigger price changes that affect supply, demand,
imports and exports. Due to a reduction in production volume by producers, prices are likely
to increase, demand will decrease, exports will decrease and imports will increase. As a result
of increased prices, some of the economic impact may be passed on to consumers. While
results of partial budget analysis are local and therefore spatially indexed, the results of partial
equilibrium analysis are aggregated values over the whole EU.
Direct Impacts
The loss in standing stock available for round wood production was determined by the
expected mortality rates as a consequence of the occurrence of PWD. In the valuation of the
Chapter 4
72
loss, it is assumed that trees expressing PWD are completely worthless, whereas healthy or
symptomless trees retain their value.
Trees of 20 years or younger, and classified as ‘susceptible’, ‘intermediate’ or ‘resistant’
species were assigned default mortality rates of, respectively, 100% (Anonymous, 2007), 80%
(Bain and Hosking, 1988; Furuno, 1993) and 50% (Chai and Jiang, 2003). Trees older than
20 years in these same susceptibility classes were assigned slightly lower mortality rates of,
respectively, 90% (Sutherland et al., 1991; Mamiya, 1983), 70% (Anonymous, 2007;
Anonymous, 2008) and 40% (Chai and Jiang, 2003).
The direct impact assessment assumes that PWN spreads after an invasion in 2008,
assuming (1) the absence of any regulatory control measure, (2) no change in the structure of
the standing stock. The direct impact is expressed in terms of the total loss in production
volume. For the year 2030, i.e. after 22 years of spread this is equal to :
i
ijkijk
jk
ii smdrpImpactDirect (1)
where
ri = proportion infestation with PWN after 22 years in polygon i
di = indicator (0 or 1) for temperature above (1) or below (0) temperature threshold for
expression of pine wilt disease (PWD)
mi = mortality rates for trees of age class j and susceptibility class k in polygon i
si = standing stock available for wood production per age class j and susceptibility class k in
polygon i.
p = market price of round wood
The summation over age and susceptibility classes of trees is made for each polygon to
calculate the overall value of assets at risk in a polygon. The proportion of infestation is
calculated from the spread model for each polygon, while the indicator value for PWD
expression is calculated from the temperature model for each polygon. In the fine resolution
analysis, each polygon is a 1 x 1 km square, while in the coarse resolution analysis, each
polygon is a NUTS region.
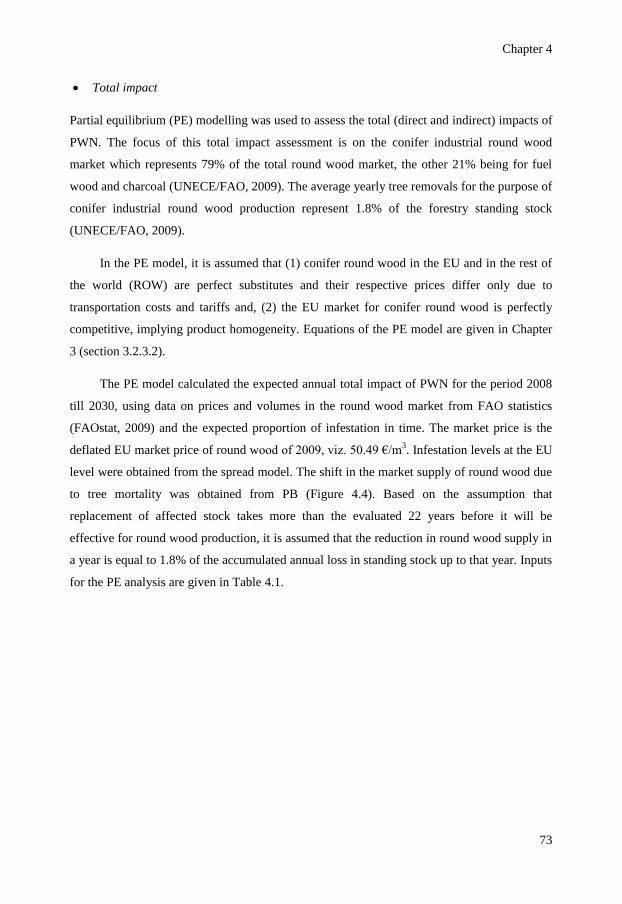
Chapter 4
73
Total impact
Partial equilibrium (PE) modelling was used to assess the total (direct and indirect) impacts of
PWN. The focus of this total impact assessment is on the conifer industrial round wood
market which represents 79% of the total round wood market, the other 21% being for fuel
wood and charcoal (UNECE/FAO, 2009). The average yearly tree removals for the purpose of
conifer industrial round wood production represent 1.8% of the forestry standing stock
(UNECE/FAO, 2009).
In the PE model, it is assumed that (1) conifer round wood in the EU and in the rest of
the world (ROW) are perfect substitutes and their respective prices differ only due to
transportation costs and tariffs and, (2) the EU market for conifer round wood is perfectly
competitive, implying product homogeneity. Equations of the PE model are given in Chapter
3 (section 3.2.3.2).
The PE model calculated the expected annual total impact of PWN for the period 2008
till 2030, using data on prices and volumes in the round wood market from FAO statistics
(FAOstat, 2009) and the expected proportion of infestation in time. The market price is the
deflated EU market price of round wood of 2009, viz. 50.49 €/m3. Infestation levels at the EU
level were obtained from the spread model. The shift in the market supply of round wood due
to tree mortality was obtained from PB (Figure 4.4). Based on the assumption that
replacement of affected stock takes more than the evaluated 22 years before it will be
effective for round wood production, it is assumed that the reduction in round wood supply in
a year is equal to 1.8% of the accumulated annual loss in standing stock up to that year. Inputs
for the PE analysis are given in Table 4.1.
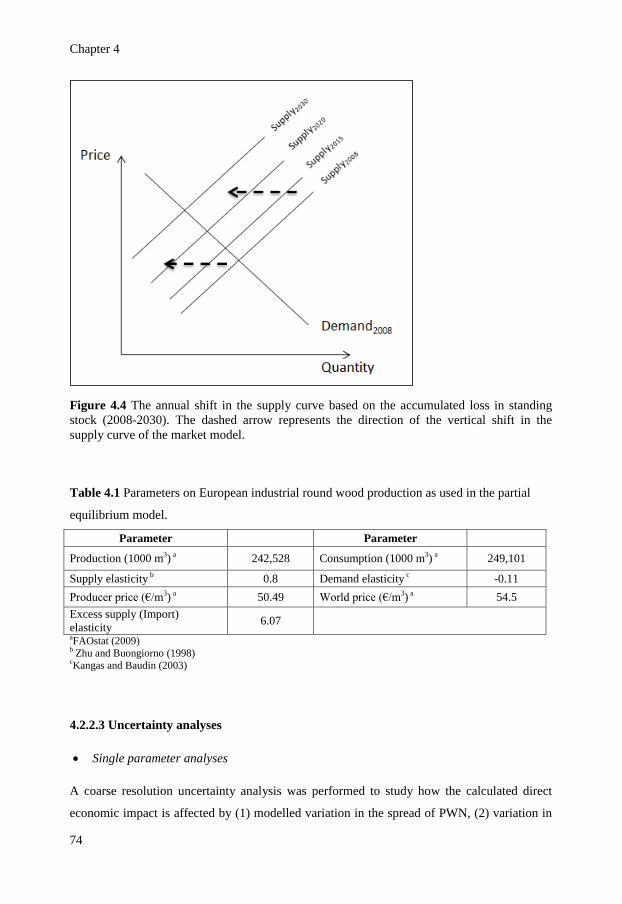
Chapter 4
74
Figure 4.4 The annual shift in the supply curve based on the accumulated loss in standing
stock (2008-2030). The dashed arrow represents the direction of the vertical shift in the
supply curve of the market model.
Table 4.1 Parameters on European industrial round wood production as used in the partial
equilibrium model.
Parameter Parameter
Production (1000 m3)
a 242,528 Consumption (1000 m
3)
a 249,101
Supply elasticity b 0.8 Demand elasticity
c -0.11
Producer price (€/m3)
a 50.49 World price (€/m
3)
a 54.5
Excess supply (Import)
elasticity 6.07
aFAOstat (2009)
b Zhu and Buongiorno (1998)
cKangas and Baudin (2003)
4.2.2.3 Uncertainty analyses
Single parameter analyses
A coarse resolution uncertainty analysis was performed to study how the calculated direct
economic impact is affected by (1) modelled variation in the spread of PWN, (2) variation in
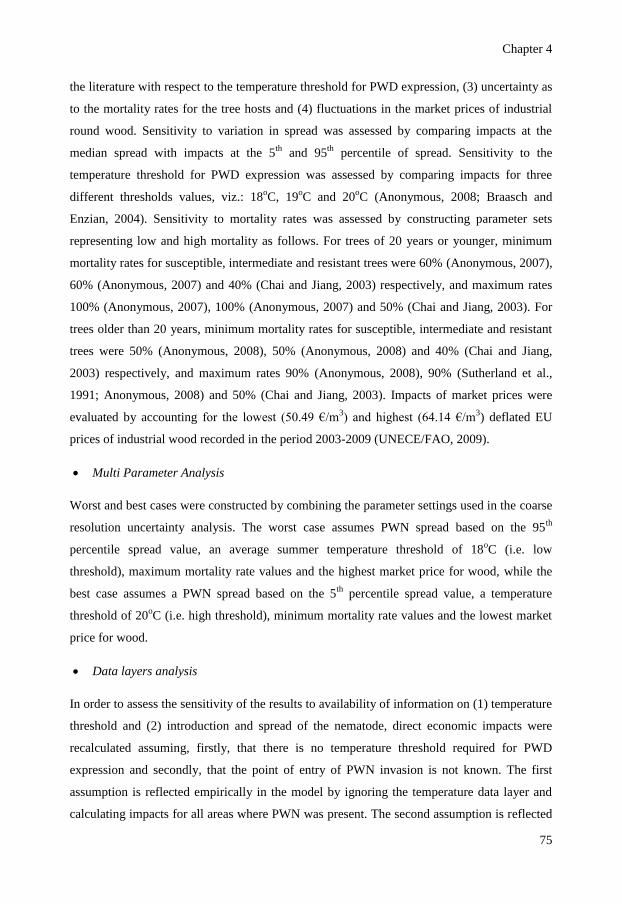
Chapter 4
75
the literature with respect to the temperature threshold for PWD expression, (3) uncertainty as
to the mortality rates for the tree hosts and (4) fluctuations in the market prices of industrial
round wood. Sensitivity to variation in spread was assessed by comparing impacts at the
median spread with impacts at the 5th
and 95th
percentile of spread. Sensitivity to the
temperature threshold for PWD expression was assessed by comparing impacts for three
different thresholds values, viz.: 18oC, 19
oC and 20
oC (Anonymous, 2008; Braasch and
Enzian, 2004). Sensitivity to mortality rates was assessed by constructing parameter sets
representing low and high mortality as follows. For trees of 20 years or younger, minimum
mortality rates for susceptible, intermediate and resistant trees were 60% (Anonymous, 2007),
60% (Anonymous, 2007) and 40% (Chai and Jiang, 2003) respectively, and maximum rates
100% (Anonymous, 2007), 100% (Anonymous, 2007) and 50% (Chai and Jiang, 2003). For
trees older than 20 years, minimum mortality rates for susceptible, intermediate and resistant
trees were 50% (Anonymous, 2008), 50% (Anonymous, 2008) and 40% (Chai and Jiang,
2003) respectively, and maximum rates 90% (Anonymous, 2008), 90% (Sutherland et al.,
1991; Anonymous, 2008) and 50% (Chai and Jiang, 2003). Impacts of market prices were
evaluated by accounting for the lowest (50.49 €/m3) and highest (64.14 €/m
3) deflated EU
prices of industrial wood recorded in the period 2003-2009 (UNECE/FAO, 2009).
Multi Parameter Analysis
Worst and best cases were constructed by combining the parameter settings used in the coarse
resolution uncertainty analysis. The worst case assumes PWN spread based on the 95th
percentile spread value, an average summer temperature threshold of 18oC (i.e. low
threshold), maximum mortality rate values and the highest market price for wood, while the
best case assumes a PWN spread based on the 5th
percentile spread value, a temperature
threshold of 20oC (i.e. high threshold), minimum mortality rate values and the lowest market
price for wood.
Data layers analysis
In order to assess the sensitivity of the results to availability of information on (1) temperature
threshold and (2) introduction and spread of the nematode, direct economic impacts were
recalculated assuming, firstly, that there is no temperature threshold required for PWD
expression and secondly, that the point of entry of PWN invasion is not known. The first
assumption is reflected empirically in the model by ignoring the temperature data layer and
calculating impacts for all areas where PWN was present. The second assumption is reflected
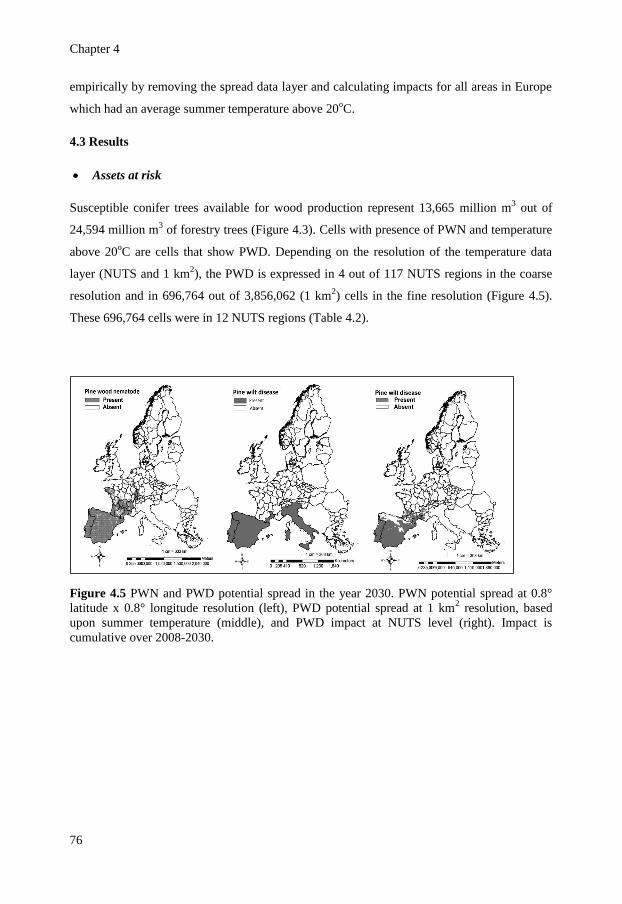
Chapter 4
76
empirically by removing the spread data layer and calculating impacts for all areas in Europe
which had an average summer temperature above 20oC.
4.3 Results
Assets at risk
Susceptible conifer trees available for wood production represent 13,665 million m3 out of
24,594 million m3 of forestry trees (Figure 4.3). Cells with presence of PWN and temperature
above 20oC are cells that show PWD. Depending on the resolution of the temperature data
layer (NUTS and 1 km2), the PWD is expressed in 4 out of 117 NUTS regions in the coarse
resolution and in 696,764 out of 3,856,062 (1 km2) cells in the fine resolution (Figure 4.5).
These 696,764 cells were in 12 NUTS regions (Table 4.2).
Figure 4.5 PWN and PWD potential spread in the year 2030. PWN potential spread at 0.8°
latitude x 0.8° longitude resolution (left), PWD potential spread at 1 km2 resolution, based
upon summer temperature (middle), and PWD impact at NUTS level (right). Impact is
cumulative over 2008-2030.
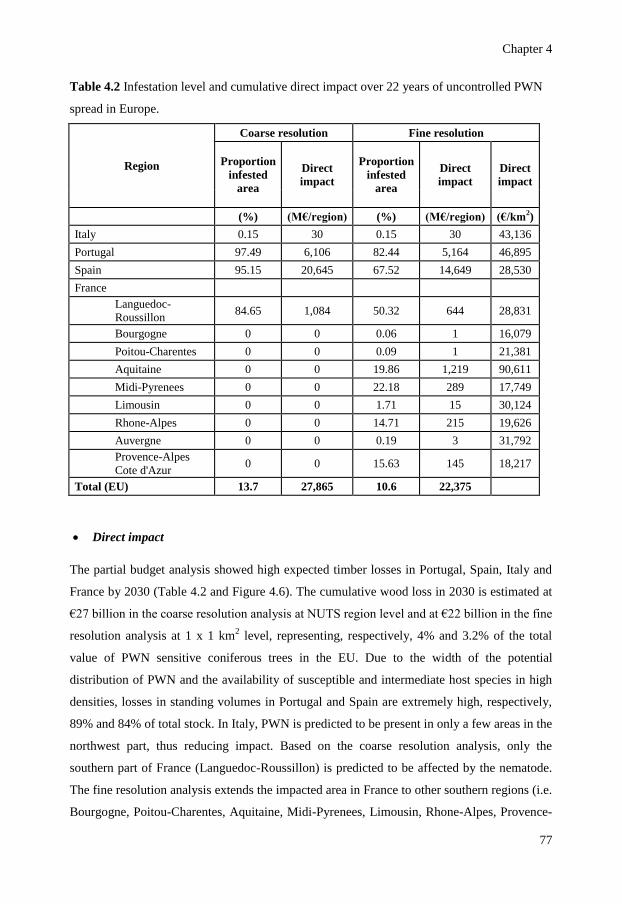
Chapter 4
77
Table 4.2 Infestation level and cumulative direct impact over 22 years of uncontrolled PWN
spread in Europe.
Region
Coarse resolution Fine resolution
Proportion
infested
area
Direct
impact
Proportion
infested
area
Direct
impact
Direct
impact
(%) (M€/region) (%) (M€/region) (€/km2)
Italy 0.15 30 0.15 30 43,136
Portugal 97.49 6,106 82.44 5,164 46,895
Spain 95.15 20,645 67.52 14,649 28,530
France
Languedoc-
Roussillon 84.65 1,084 50.32 644 28,831
Bourgogne 0 0 0.06 1 16,079
Poitou-Charentes 0 0 0.09 1 21,381
Aquitaine 0 0 19.86 1,219 90,611
Midi-Pyrenees 0 0 22.18 289 17,749
Limousin 0 0 1.71 15 30,124
Rhone-Alpes 0 0 14.71 215 19,626
Auvergne 0 0 0.19 3 31,792
Provence-Alpes
Cote d'Azur 0 0 15.63 145 18,217
Total (EU) 13.7 27,865 10.6 22,375
Direct impact
The partial budget analysis showed high expected timber losses in Portugal, Spain, Italy and
France by 2030 (Table 4.2 and Figure 4.6). The cumulative wood loss in 2030 is estimated at
€27 billion in the coarse resolution analysis at NUTS region level and at €22 billion in the fine
resolution analysis at 1 x 1 km2 level, representing, respectively, 4% and 3.2% of the total
value of PWN sensitive coniferous trees in the EU. Due to the width of the potential
distribution of PWN and the availability of susceptible and intermediate host species in high
densities, losses in standing volumes in Portugal and Spain are extremely high, respectively,
89% and 84% of total stock. In Italy, PWN is predicted to be present in only a few areas in the
northwest part, thus reducing impact. Based on the coarse resolution analysis, only the
southern part of France (Languedoc-Roussillon) is predicted to be affected by the nematode.
The fine resolution analysis extends the impacted area in France to other southern regions (i.e.
Bourgogne, Poitou-Charentes, Aquitaine, Midi-Pyrenees, Limousin, Rhone-Alpes, Provence-
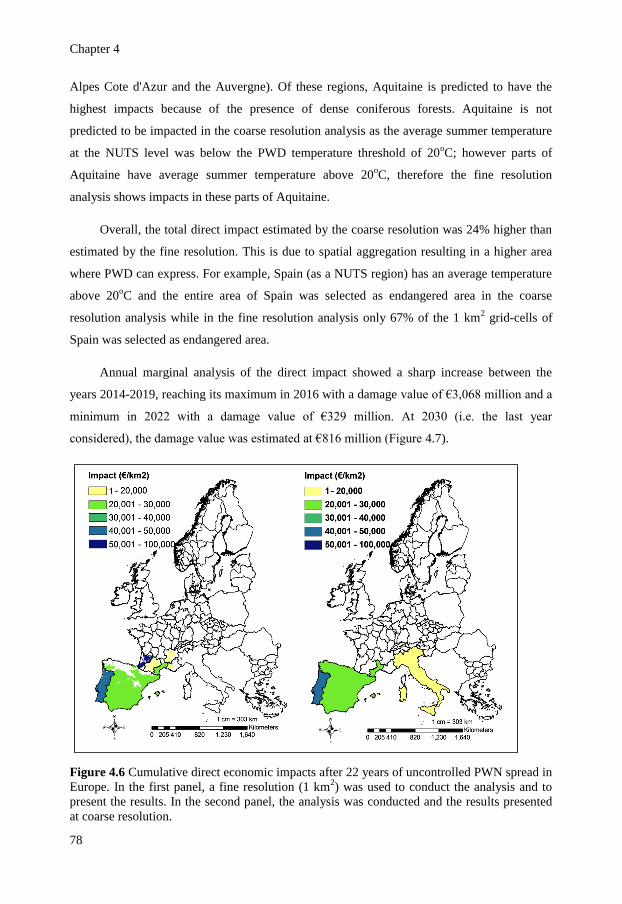
Chapter 4
78
Alpes Cote d'Azur and the Auvergne). Of these regions, Aquitaine is predicted to have the
highest impacts because of the presence of dense coniferous forests. Aquitaine is not
predicted to be impacted in the coarse resolution analysis as the average summer temperature
at the NUTS level was below the PWD temperature threshold of 20oC; however parts of
Aquitaine have average summer temperature above 20oC, therefore the fine resolution
analysis shows impacts in these parts of Aquitaine.
Overall, the total direct impact estimated by the coarse resolution was 24% higher than
estimated by the fine resolution. This is due to spatial aggregation resulting in a higher area
where PWD can express. For example, Spain (as a NUTS region) has an average temperature
above 20oC and the entire area of Spain was selected as endangered area in the coarse
resolution analysis while in the fine resolution analysis only 67% of the 1 km2 grid-cells of
Spain was selected as endangered area.
Annual marginal analysis of the direct impact showed a sharp increase between the
years 2014-2019, reaching its maximum in 2016 with a damage value of €3,068 million and a
minimum in 2022 with a damage value of €329 million. At 2030 (i.e. the last year
considered), the damage value was estimated at €816 million (Figure 4.7).
Figure 4.6 Cumulative direct economic impacts after 22 years of uncontrolled PWN spread in
Europe. In the first panel, a fine resolution (1 km2) was used to conduct the analysis and to
present the results. In the second panel, the analysis was conducted and the results presented
at coarse resolution.
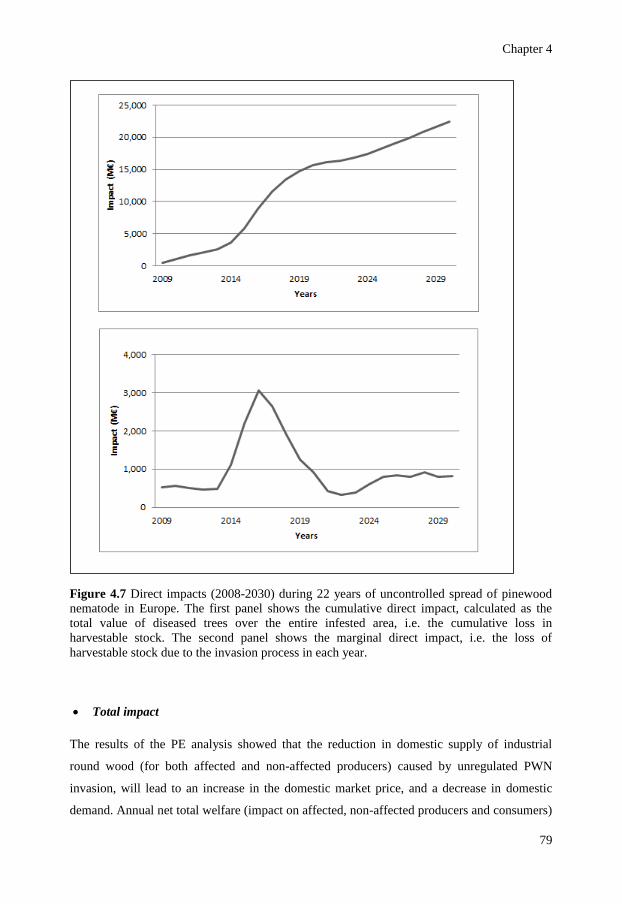
Chapter 4
79
Figure 4.7 Direct impacts (2008-2030) during 22 years of uncontrolled spread of pinewood
nematode in Europe. The first panel shows the cumulative direct impact, calculated as the
total value of diseased trees over the entire infested area, i.e. the cumulative loss in
harvestable stock. The second panel shows the marginal direct impact, i.e. the loss of
harvestable stock due to the invasion process in each year.
Total impact
The results of the PE analysis showed that the reduction in domestic supply of industrial
round wood (for both affected and non-affected producers) caused by unregulated PWN
invasion, will lead to an increase in the domestic market price, and a decrease in domestic
demand. Annual net total welfare (impact on affected, non-affected producers and consumers)
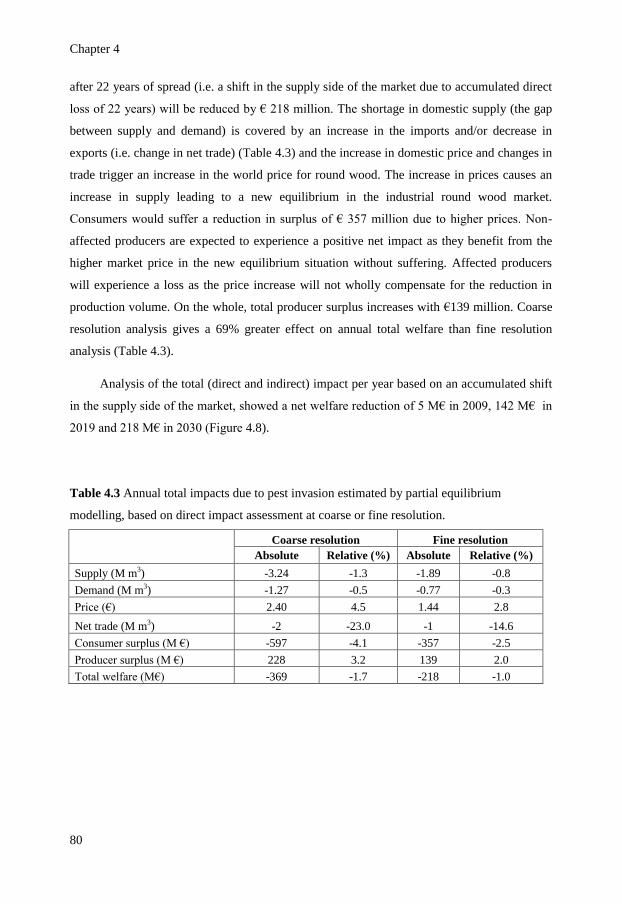
Chapter 4
80
after 22 years of spread (i.e. a shift in the supply side of the market due to accumulated direct
loss of 22 years) will be reduced by € 218 million. The shortage in domestic supply (the gap
between supply and demand) is covered by an increase in the imports and/or decrease in
exports (i.e. change in net trade) (Table 4.3) and the increase in domestic price and changes in
trade trigger an increase in the world price for round wood. The increase in prices causes an
increase in supply leading to a new equilibrium in the industrial round wood market.
Consumers would suffer a reduction in surplus of € 357 million due to higher prices. Non-
affected producers are expected to experience a positive net impact as they benefit from the
higher market price in the new equilibrium situation without suffering. Affected producers
will experience a loss as the price increase will not wholly compensate for the reduction in
production volume. On the whole, total producer surplus increases with €139 million. Coarse
resolution analysis gives a 69% greater effect on annual total welfare than fine resolution
analysis (Table 4.3).
Analysis of the total (direct and indirect) impact per year based on an accumulated shift
in the supply side of the market, showed a net welfare reduction of 5 M€ in 2009, 142 M€ in
2019 and 218 M€ in 2030 (Figure 4.8).
Table 4.3 Annual total impacts due to pest invasion estimated by partial equilibrium
modelling, based on direct impact assessment at coarse or fine resolution.
Coarse resolution Fine resolution
Absolute Relative (%) Absolute Relative (%)
Supply (M m3) -3.24 -1.3 -1.89 -0.8
Demand (M m3) -1.27 -0.5 -0.77 -0.3
Price (€) 2.40 4.5 1.44 2.8
Net trade (M m3) -2 -23.0 -1 -14.6
Consumer surplus (M €) -597 -4.1 -357 -2.5
Producer surplus (M €) 228 3.2 139 2.0
Total welfare (M€) -369 -1.7 -218 -1.0
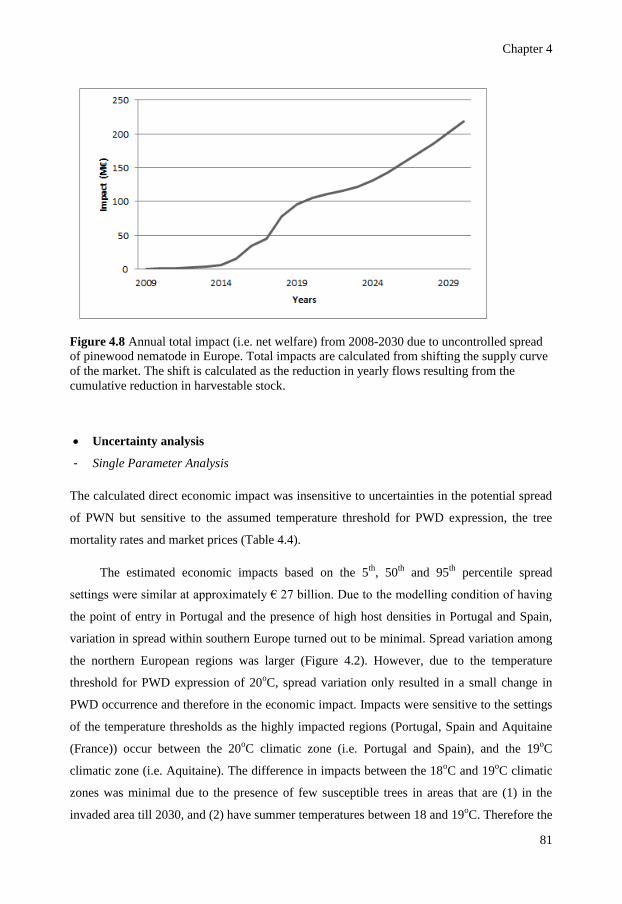
Chapter 4
81
Figure 4.8 Annual total impact (i.e. net welfare) from 2008-2030 due to uncontrolled spread
of pinewood nematode in Europe. Total impacts are calculated from shifting the supply curve
of the market. The shift is calculated as the reduction in yearly flows resulting from the
cumulative reduction in harvestable stock.
Uncertainty analysis
- Single Parameter Analysis
The calculated direct economic impact was insensitive to uncertainties in the potential spread
of PWN but sensitive to the assumed temperature threshold for PWD expression, the tree
mortality rates and market prices (Table 4.4).
The estimated economic impacts based on the 5th
, 50th
and 95th
percentile spread
settings were similar at approximately € 27 billion. Due to the modelling condition of having
the point of entry in Portugal and the presence of high host densities in Portugal and Spain,
variation in spread within southern Europe turned out to be minimal. Spread variation among
the northern European regions was larger (Figure 4.2). However, due to the temperature
threshold for PWD expression of 20oC, spread variation only resulted in a small change in
PWD occurrence and therefore in the economic impact. Impacts were sensitive to the settings
of the temperature thresholds as the highly impacted regions (Portugal, Spain and Aquitaine
(France)) occur between the 20oC climatic zone (i.e. Portugal and Spain), and the 19
oC
climatic zone (i.e. Aquitaine). The difference in impacts between the 18oC and 19
oC climatic
zones was minimal due to the presence of few susceptible trees in areas that are (1) in the
invaded area till 2030, and (2) have summer temperatures between 18 and 19oC. Therefore the
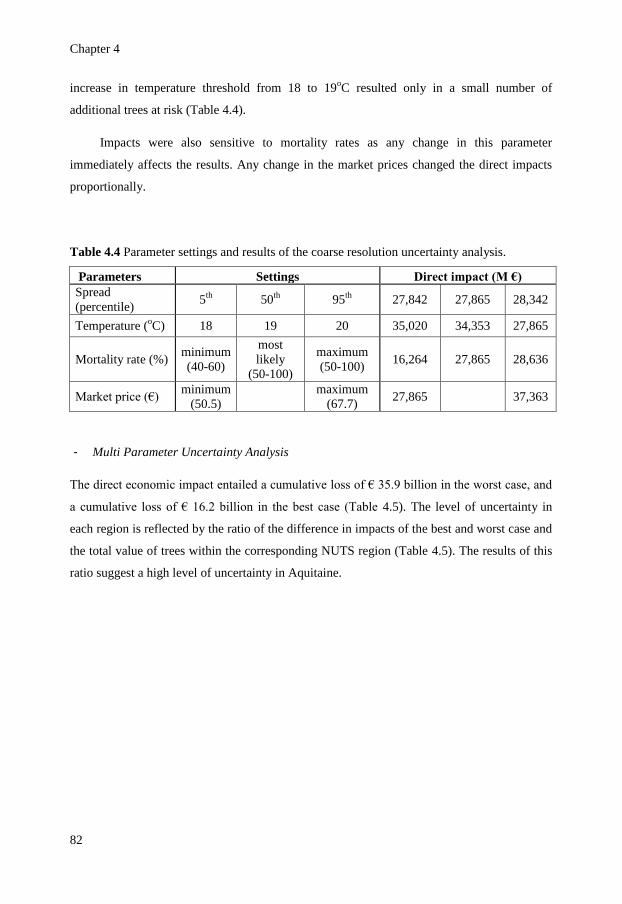
Chapter 4
82
increase in temperature threshold from 18 to 19oC resulted only in a small number of
additional trees at risk (Table 4.4).
Impacts were also sensitive to mortality rates as any change in this parameter
immediately affects the results. Any change in the market prices changed the direct impacts
proportionally.
Table 4.4 Parameter settings and results of the coarse resolution uncertainty analysis.
Parameters Settings Direct impact (M €)
Spread
(percentile) 5
th 50
th 95
th 27,842 27,865 28,342
Temperature (oC) 18 19 20 35,020 34,353 27,865
Mortality rate (%) minimum
(40-60)
most
likely
(50-100)
maximum
(50-100) 16,264 27,865 28,636
Market price (€) minimum
(50.5)
maximum
(67.7) 27,865 37,363
- Multi Parameter Uncertainty Analysis
The direct economic impact entailed a cumulative loss of € 35.9 billion in the worst case, and
a cumulative loss of € 16.2 billion in the best case (Table 4.5). The level of uncertainty in
each region is reflected by the ratio of the difference in impacts of the best and worst case and
the total value of trees within the corresponding NUTS region (Table 4.5). The results of this
ratio suggest a high level of uncertainty in Aquitaine.
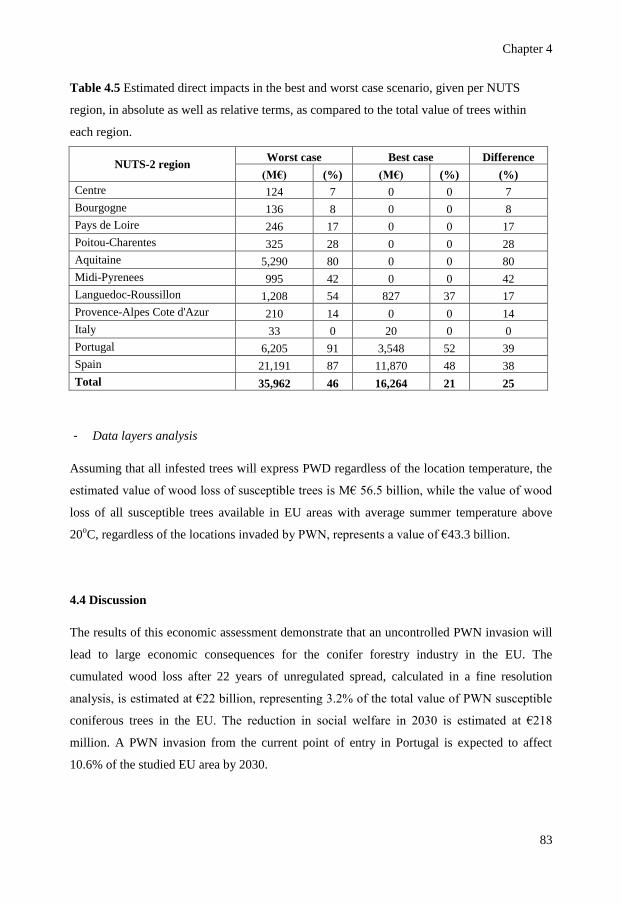
Chapter 4
83
Table 4.5 Estimated direct impacts in the best and worst case scenario, given per NUTS
region, in absolute as well as relative terms, as compared to the total value of trees within
each region.
NUTS-2 region Worst case Best case Difference
(M€) (%) (M€) (%) (%)
Centre 124 7 0 0 7
Bourgogne 136 8 0 0 8
Pays de Loire 246 17 0 0 17
Poitou-Charentes 325 28 0 0 28
Aquitaine 5,290 80 0 0 80
Midi-Pyrenees 995 42 0 0 42
Languedoc-Roussillon 1,208 54 827 37 17
Provence-Alpes Cote d'Azur 210 14 0 0 14
Italy 33 0 20 0 0
Portugal 6,205 91 3,548 52 39
Spain 21,191 87 11,870 48 38
Total 35,962 46 16,264 21 25
- Data layers analysis
Assuming that all infested trees will express PWD regardless of the location temperature, the
estimated value of wood loss of susceptible trees is M€ 56.5 billion, while the value of wood
loss of all susceptible trees available in EU areas with average summer temperature above
20oC, regardless of the locations invaded by PWN, represents a value of €43.3 billion.
4.4 Discussion
The results of this economic assessment demonstrate that an uncontrolled PWN invasion will
lead to large economic consequences for the conifer forestry industry in the EU. The
cumulated wood loss after 22 years of unregulated spread, calculated in a fine resolution
analysis, is estimated at €22 billion, representing 3.2% of the total value of PWN susceptible
coniferous trees in the EU. The reduction in social welfare in 2030 is estimated at €218
million. A PWN invasion from the current point of entry in Portugal is expected to affect
10.6% of the studied EU area by 2030.
Chapter 4
84
There is a large difference in the magnitude of the estimated direct and total (direct and
indirect) impacts. This is because the direct impacts represent the reduction in value of
standing forestry stock, while the total impacts refer to the changes yearly flow of wood to the
round wood market. These flows represent 1.8% on average of the standing stock
(UNECE/FAO, 2009). Therefore, losses in flow accumulate slowly and for a long period of
time after the standing stock should be considered as lost because of PWD. We do not
consider in this study the recovery of rest value by planting resistant trees, because these
would not be harvested within the time frame considered in this study (22 years). When the
spread of PWN stops, the annual direct loss will disappear while the total impact will continue
to increase until mitigation efforts become effective (i.e. replanted (resistant) trees flow to the
round wood market).
The fine resolution analysis provided more plausible results in terms of size and
distribution of the impacts, while requiring limited extra effort. The coarse resolution analysis
did not identify Southern France as an area at risk as a result of averaging temperature over a
large region, and therefore, it misrepresents the distribution of the impacts. Direct impacts
estimated at a coarse resolution level were 24% higher than those obtained at a fine resolution
level. The presented differences follow directly from the applied aggregation procedure on the
temperature data layer.
While the difference in direct impact as estimated by the coarse and fine resolution
analyses did not alter the assessment of the riskiness of the pest, the difference in the
geographical distribution of the impacts predicted by the two resolutions is quite critical and
management relevant. The fine resolution analysis is more relevant to EU risk managers as it
provides a more plausible assessment of the expected distribution of direct impacts within the
EU.
Economic impacts were on the basis of (1) the predictions of the spread model for the
presence/absence of the PWN and (2) a temperature threshold of 20oC for PWD. The
sensitivity of the results to these two data layers was assessed in the data layers uncertainty
analysis. The spread model was calibrated on the invasion history in China and should be
refined in the future to determine more precise the potential expansion in Europe (Robinet et
al., 2009 and 2011). Including no information on the potential spread implies that PWD
infests all areas where host trees are available and the climate is suitable for expressing
symptoms. This situation could arise if point(s) of entry other than Portugal are found.
Chapter 4
85
Absence of a temperature threshold means that PWD is assumed to infest all areas invaded by
PWN, regardless of their summer temperature. With global warming (+1.8 to +4° C predicted
between 1980-1999 and 2090-2099 (Meehl et al., 2007)), the temperature constraint will be
less restrictive in the future. When removing spread and temperature conditions, the
cumulative direct economic impacts are massive: € 56.5 billion when the point of entry is
unknown and €43.3 billion when there is no temperature restriction. Compared to the default
impact of €27.8 billion, the availability of information on spread and climate as such did not
critically influence the assessment of the risk posed by PWN. Nevertheless, the use of
information on spread and climate demonstrated the geographical distribution of the impacts
within the EU which is of value to EU risk managers. For instance, it allows a risk manager to
compare the effectiveness of alternative management plans in terms of its temporal and spatial
dimensions (e.g. early and late containment programs).
The economic impacts were estimated till the year 2030 conform the time horizon of the
spread model. The time horizon of 22 years was considered long enough to allow the pest to
show its invasion potential and short enough to have a reasonable technical processing time
and an acceptable uncertainty level in the results (Robinet et al., 2010).
Integrating spread and impacts is a challenging area in pest risk assessment (Baker et
al., 2005). The challenge arises from the fact that to quantify economic impacts, we need to
know the areas of significant economic loss. Significant losses occur when the pest population
densities exceed the economic injury level (EIL). The EIL is the population density at which
the cost to control the pest equals the amount of damage it is likely to cause (Pedigo and
Higley, 1992; Pedigo et al., 1986; Stern et al., 1959). To integrate spread and impact,
knowledge is required on: (1) the areas where pest population densities exceed the EIL and
(2) the relationship between pest population densities and the likely level of yield or quality
loss. A number of recent studies followed this approach (Carrasco et al., 2008; Margarey et
al., 2010) as they used pest population densities generated by a spread model and link it with
yield loss. In the absence of spread models which can be used to predict pest population
densities spatially, climate data (or other agro-ecological information such as soil type or
irrigation) can be used as a proxy (Robinet et al., 2009). As climate influences the growth rate
of the pest population, climate data can be used to indicate pest density levels. However,
climate cannot be used to reflect the change in the pest population density over time.
Chapter 4
86
Extending the economic assessment to market models with open economies (e.g. partial
equilibrium) rather than just stick at the field/producer level models (e.g. partial budgeting) is
essential as the market power of large areas like the EU in the world trade and the importance
of the resulting spill over effects cannot be ignored. However, the main obstacle is that partial
equilibrium models and invasion ecology models present different spatial and dynamic scales
(Janssen and Ostrom, 2006) in addition to the unknown producers supply responses which
play a critical role when scaling up impacts from field to market level.
The approach proposed in this study extends the risk mapping process from the
establishment and spread phase to the economic impacts phase. Accordingly, our approach
can be followed in PRAs where there is a need to represent impacts not only in relative pest
risk levels but also in terms of euros, in order to increase the transparency and objectivity of
evaluated plant health measures.
Chapter 4
87
Acknowledgments
We greatly acknowledge support for this work from the EU projects PRATIQUE KBBE-
2007-212459 (FP7 Project, Enhancements of pest risk analysis techniques;
https://secure.fera.defra.gov.uk/pratique/), MOTIVE (Models for adaptive forest management,
grant No. 226544), BACCARA (Biodiversity And Climate Change, A Risk Analysis, grant
No. 226299), ISEFOR (FP7 KBBE-2009-1-2-08, Increasing Sustainability of European
Forests : Modelling for Security Against Invasive Pests and Pathogens under Climate Change)
and REPHRAME (FP7 KBBE-2010-265483, Analysis of the potential of the pine wood
nematode (Bursaphelenchus xylophylus) to spread, survive and cause pine wilt in European
coniferous forests in support of EU plant health policy). The funders had no role in study
design, data collection and analysis, decision to publish, or preparation of the manuscript.
Chapter 4
88
References
Anonymous, 2007. Development of improved pest risk analysis techniques for quarantine pests, using
pinewood nematode, Bursaphelenchus xylophilus, in Portugal as a model system. PHRAME– Plant Health
Risk And Monitoring Evaluation, QLK5-CT-2002-00672.
Anonymous, 2008. Analysis of the socio-economic and environmental impacts of banning or not banning the
movement of susceptible wood products from Portugal for stopping the spread of pine wood nematode
(PWN). European Commission, DG SANCO.
Anonymous, 2010. Summary report of the meeting of the standing committee on plant health. Health and
consumer directorate-general, European Union. http://ec.europa.eu/food/fs/rc/scph/sum_2526112010_en.pdf
Bain J, Hosking GP, 1988. Are NZ Pinus radiata plantations threatened by pine wilt nematode Bursaphelenchus
xylophilus? New Zealand Forestry 32(4): 19-21.
Baker R, Cannon R, Bartlett P, Barker IA, 2005. Novel strategies for assessing and managing the risks posed by
invasive alien species to global crop production and biodiversity. Annals of Applied Biology, 146:177-191.
Braasch H, Enzian S, 2004. The pinewood nematode problem in Europe present situation and outlook.
Proceedings of International Workshop Portugal 20-22 August 2001: 77- 91.
Carrasco LR, Harwood TD, Toepfer S, MacLeod A, Levay N, Kiss J, 2010. Dispersal kernels of the invasive
alien western corn rootworm and the effectiveness of buffer zones in eradication programmes in Europe.
Annual Applied Biology 156: 63–77.
Carrasco LR, Macleod A, Knight JD, Baker R, Mumford JD, 2008. A bio-economic model for the uncertain
invader: linking spread and impacts for pest risk analysis. EURECO-GFOE. European Ecological Federation
Annual Meeting. Leipzig, Germany, 15-19 September.
Chai XM, Jiang P, 2003. Occurrence and control of pine wilt disease. Beijing: Chinese Agricultural Press 70–
88.
Colautti RI, Bailey AS, Van Overdijk CD, 2006. Characterised and projected costs of nonindigenous species in
Canada. Biological Invasions 8: 45–59.
EC, 2003. Regulation No 1059/2003 of the European parliament and of the council on the establishment of a
common classification of territorial units for statistics (NUTS). Official Journal of the European Union
L154/1-41.
EFSOS II, 2011. The European Forest Sector Outlook Study II. United Nations publication, Sales No
E.11.II.E.14, ISSN 1020-2269, http://www.unece.org/fileadmin/DAM/timber/publications/sp-28.pdf
Evans HF, Mc Namara DG, Braasch H, Chadoeuf J, Magnusson C, 1996. Pest Risk Analysis (PRA) for the
territories of the European Union (as PRA area) on Bursaphelenchus xylophilus and its vectors in the genus
Monochamus. Bulletin OEPP/EPPO Bulletin 26: 199-249.
FAOstat, 2009. http://faostat.fao.org/site/626/default.aspx#ancor. Accessed 27.05.2011.
Furuno T, Nakai I, Uenaka K, Haya K, 1993. The pine wilt upon the exotic pine species introduced in
Kamigamo and Shirahama Experiment Station of Kyoto University- Various resistances among genus pinus
to pinewood nematode, Bursaphelenchus xylophilus. Report of the Kyoto University Forests 25: 20-34.
FVO, Food and Veterinary Office, 2008. Final report of a mission carried out in Portugal from 02 June to 06
June 2008 in order to assess the implementation of Commission decision 2006/133/EC and the national
eradication programme for Bursaphelenchus xylophilus (Pine wood nematode). DG SANCO/2008/7991–
MR–Final.
Haight RG, Homans FR, Horie T, Mehta SV, Smith DJ, Venette RC, 2011. Assessing the Cost of an Invasive
Forest Pathogen: A Case Study with Oak Wilt. Environmental management 47(3): 506-517
Heesterbeek JA, Zadoks JC, 1986. Modelling pandemics of quarantine pests and diseases: problems and
perspectives. Crop protection 6 (4): 211-221
Heikkila J, Peltola J, 2004. Analysis of the Colorado potato beetle protection system in Finland. Agricultural
Economics 31: 343-352.
Higgins SI, Richardson DM, Cowling RM, 2000. Using a dynamic landscape model for planning the
management of alien plant invasions. Ecological Applications 10: 1833-1848.
Hijmans, RJ, Cameron SE, Parra JL, Jones PG, Jarvis A, 2005. Very high resolution interpolated climate
surfaces for global land areas. International Journal of Climatology 25: 1965-1978.
Hodda M, Cook DC, 2009. Economic impact from unrestricted spread of potato cyst nematodes in Australia.
Phytopathology 99:1387-1393.
Chapter 4
89
Janssen MA, Ostrom E, 2006. Governing Social-Ecological Systems. Handbook of Computational Economics
2: 1465-1509.
Kangas K, Baudin A, 2003. Modelling and projecting of forest products demand, supply and trade in Europe,
United Nations.
Mamiya Y, 1983. Pathology of the pine wilt disease caused by Bursaphelenchus Xylophilus. Annual Review of
Phytopathology 21: 201-220.
Margarey R, Garrett LJ, Vo T, Cook D, 2010. A framework for modelling and mapping economic impacts. IVth
International Pest Risk Modelling Workshop, Port Douglas, 23-25 August.
Meehl GA, Stocker TF, Collins WD, Friedlingstein P, Gaye AT, 2007. Global climate projections. In: Solomon
S, Qin D, Manning M, Chen Z, Marquis M, et al., editors. Climate change 2007: the physical science basis.
Contribution of Working Group I to the Fourth Assessment Report of the Intergovernmental Panel on
Climate Change, pp 747-845. Cambridge University Press.
Mota MM, Braasch H, Bravo MA, Penas AC, Burgermeister W, Metge K., Sousa E, 1999. First report of
Bursaphelenchus xylophilus in Portugal and in Europe. Nematology 1(8): 727-734.
Nabuurs GJ, Pussinen A, van Brusselen J, Schelhaas MJ, 2007. Future harvesting pressure on European forests.
European Journal of Forest Research 126: 391–400.
Nickle WR, Golden AM, Mamiya Y, Wergin WP, 1981. On the taxonomy and morphology of the pine wood
nematode, Bursaphelenchus xylophilus (Steiner & Buhrer 1934) Nickle 1971. Journal of Nematology 13,
385-392.
OEPP/EPPO, 1986. Data sheets on quarantine organisms, No.158, Bursaphelenchus xylophilus. Bulletin
OEPP/EPPO Bulletin 16: 55-60.
Pedigo KP, Higley LG, 1992. The economic injury level concept and environmental quality: a new perspective.
American Entomologist 38:12-21.
Pedigo LP, Hutchins SH, Higley LG, 1986. Economic injury levels in theory and practice. Annual Review of
Entomology 31, 341–368.
Pimentel D, Lach L, Zuniga R, Morrison D, 2000. Environmental and economic costs of nonindigenous species
in the United States. Bioscience 50: 53–65.
Robinet C, Roques A, Pan H, Fang G, Ye J, 2009. Role of Human-Mediated Dispersal in the Spread of the
Pinewood Nematode in China. PLoS ONE 4(2): e4646.doi:10.1371/ journal.pone. 0004646.
Robinet C, Van Opstal N, Baker R, Roques A, 2011. Applying a spread model to identify the entry points from
which the pine wood nematode, the vector of pine wilt disease, would spread most rapidly across Europe.
Biological Invasions 13: 2981–2995.
Rodrigues J, 2008. National eradication programme for the pinewood nematode in Portugal. In: Pine wilt
disease: a worldwide threat to forest ecosystems. Mota, M. & Vieira, P. (eds.). Springer, Dordrecht, NL: 5-
14.
Rutherford TA, Mamiya Y, Webster JM, 1990. Nematode-Induced Pine Wilt Disease: factors influencing its
occurrence and distribution. Forest Science 36: 145-155.
Rutherford TA, Webster JM, 1987. Distribution of pine wilt disease with respect to temperature in North
America, Japan and Europe. Canadian Journal of Forest Research 17: 1050-1059.
Sathyapala S, 2004. Pest Risk Analysis, Biosecurity Risk to New Zealand of Pinewood Nematode
(Bursaphelenchus xylophilus). Forest Biosecurity Authority, ministry of Agriculture and forestry, New
Zealand.
Soliman T, Mourits MCM., Oude Lansink AGJM, Van der Werf W, 2010. Economic impact assessment in pest
risk analysis. Crop Protection 29: 517–524.
Steiner G, Buhrer EM, 1934. Aphelenchoides xylophilus n. sp. A nematode associated with blue-stain and other
fungi in timber. Journal of Agricultural Research 48, 949-955.
Stern VM, Smith RF, Van Den Bosch R, Hagen KS, 1959. The integrated control concept. Hilgardia 29:81-101.
Surkov IV, Oude Lansink AGJM, Van der Werf W, 2009. The optimal amount and allocation of sampling effort
for plant health inspection. European Review of Agricultural economics, 36 (3): 295-320.
Sutherland JR, Ring FM, Seed JE, 1991. Canadian conifers as hosts of the pinewood nematode
(Bursaphelenchus xylophilus): results of seedling inoculations. Scandinavian Journal of Forest Research 6(2):
209-216.
UNECE/FAO Forest Products Statistics, 2009. http://live.unece.org/forests/fpm/onlinedata.html. Accessed
27.07.2011
Chapter 4
90
Wesseler J, Fall EH, 2010. Potential damage costs of Diabrotica virgifera virgifera infestation in Europe—the
‘no control’ scenario. Journal Applied Entomology 134: 385–394.
Wingfield MJ, Blanchette RA, Nicholls TH, 1984. Is the pine wood nematode an important pathogen in the
United States?. Journal of Forestry 82: 232-235.
Wittwer G, McKirdy S, Wilson R., 2005. Regional economic impacts of a plant disease incursion using a
general equilibrium approach. The Australian Journal of Agricultural and Resource Economics 49: 75-89.
Yemshanov D, McKenney DW, De Groot P, 2011. A harvest failure approach to assess the threat from an
invasive species. Journal of Environmental management 92 (1): 205-213
Zhu TD, Buongiorno J, 1998. Global forest products consumption, production, trade and prices: global forest
products model. Working Paper No: GFPOS/WP/01, Forestry Policy and Planning Division, Rome (IT).
91
Chapter 5
Economic Justification for Quarantine Status – the Case Study of
Candidatus Liberibacter Solanacearum in the European Union
Soliman T., Mourits M.C.M., Oude Lansink A.G.J.M., van der Werf W. 2012. Economic justification for
quarantine status – the case study of Candidatus Liberibacter Solanacearum in the European Union, submitted to
Plant Pathology.
Chapter 5
92
Abstract
International agreements on plant health and trade require that regulating a pest should be
justified by economic impact assessment. Economic impact assessments are usually
qualitative, weakening the objective and transparency of the regulation decision. Here, we
assess the potential economic impacts of the invasion of the plant pathogenic bacterium
Candidatus Liberibacter Solanacearum into the European Union in order to economically
justify a decision on the pest quarantine status. Direct economic impacts resulting from yield
loss in potato and tomato are computed using partial budgeting at regional scale, while total
economic impacts on the potato and tomato markets are computed using partial equilibrium
modelling at the EU scale. The annual direct impacts at the most likely infestation level on
infested potato and tomato producers are estimated at 222 million euros for the whole EU.
Uncertainty analysis showed a distribution of foreseeable annual impacts with a 5 percentile
of 192 million euros, and a 95 percentile of 512 million euros. Increased market prices of
potato and tomato that result from reduced supply increase profits for non-infested producers
and compensate in part for the production losses of infested producers. Consumers pay for
this mitigation of impacts on producers. The expected negative impact on societal welfare at
the most likely infestation level is less than the estimated direct impacts, viz. 114 million euros
per year. The potential economic impacts of Candidatus Liberibacter Solanacearum into the
European Union are demonstrably of major importance. Therefore, a decision to categorize
Candidatus Liberibacter Solanacearum as a quarantine pest is supported.
Keywords:
Economic impact assessment – quarantine status – pest risk analysis - Candidatus
Liberibacter Solanacearum
Chapter 5
93
5.1 Introduction
International agreements on plant health and trade require that regulating a pest should be
justified by economic impact assessment. European plant health regulations is organized
through the legislative act of the European Union (EU) Council Directive 2000/29/EC
(Anonymous, 2000). The Directive lays down measures designed to protect Member States
against the introduction and spread of organisms harmful to plants and plant products from
other Member States or third countries (EU, 2012). These protective measures can only be
taken against organisms listed in Annexes I and II in the directive. Annex I list the banned
organisms while Annex II list plants and plant products that could be contaminated by the
relevant harmful organisms listed in that part of the Annex (Anonymous, 2000). Currently,
110 harmful organisms in Annex I and 138 harmful organisms in Annex II are listed and
regulated to prevent introduction and spread within EU.
Candidatus Liberibacter Solanacearum (CLS) is a newly discovered species described
in 2008 within the genus ‘Candidatus Liberibacter’ (Liefting, 2008). CLS is phloem-limited,
Gram-negative, unculturable bacteria (Liefting et al., 2009b) that infects a variety of species
within the Solanaceae including potato (Solanum tuberosum), tomato (Solanum esculentum),
pepper (Capsicum spp.), tamarillo (Solanum betaceum), chilli (C. frutescens) and Cape
gooseberry (Physalis peruviana) (Hansen et al., 2008; Liefting et al., 2008a; Liefting, 2008;
Liefting et al., 2009a; Munyaneza et al., 2009b; Munyaneza et al., 2009a; Liefting et al.
2009b; Liefting et al., 2008b).
CLS causes severe damage, in terms of yield and quality losses in host crops in its
current area of distribution (i.e. USA, New Zealand, Mexico and central America)
(Munyaneza et al., 2007; Liefting et al., 2008a). CLS has been found associated with the
zebra chip disease in potatoes (Munyaneza et al., 2007). The disease is of great importance
and has been reported since 1994. CLS is also associated with other significant tomato,
Capsicum and tamarillo diseases (e.g. permanent yellow of tomato; Guttierez et al., 2009).
For instance, in Texas, the annual potato yield loss due to CLS was estimated at 33 million
dollars (equivalent to 25 million euros) (CNAS, 2009). In New Zealand, the annual potato
losses due to CLS was estimated at 50 million NZD (equivalent to 30 million euros) (Berry et
al., 2010).
CLS is transmitted by the leaf psyllid, Bactericera cockerelli (Hemiptera, Triozidae),
which feeds on Solanaceous plants, especially tomato and potato (Lin et al., 2009b;
Chapter 5
94
Munyaneza, 2009b). CLS has not been shown to be transmitted by seeds or mechanical means
(Henne et al. 2010a). To date, CLS has not been detected outside the area of distribution of
Bactericera cockerelli, indicating that the psyllid vector is the exclusive vector of the
bacterium (Morris et al., 2009).
The bacterium and its vector have not been detected yet in the EU. In 2010, a different
haplotype (i.e. a combination of DNA sequences at adjacent locations on the chromosome that
are transmitted together) of CLS was found on carrots in Finland, transmitted by the carrot
psyllid Trioza apicalis (Hemiptera, Triozidae) (Munyaneza et al., 2010, Nelson et al., 2011).
However, Trioza apicalis does not feed on solanaceous plants, limiting its impact for further
spread of CLS within the European community.
Based on International Standards on Phytosanitary Measures (ISPM), a procedure has
been set by the European Commission to notify findings of organisms not yet listed in the
Annexes of Council Directive 2000/29/EC. In case of a new notification of a harmful
organism, a risk assessment should be initiated to assess the risk of the new organism
(Knapic, 2007). If the evaluated risk is considered of major importance, phytosanitary
measures will be applied. The recent findings of CLS in America and New Zealand suggest
that the European Community may need to take action to prevent the introduction of the
complex, CLS and its vector Bactericera cockerelli, into the European community territory.
The objective of this paper is twofold. The first objective is problem oriented: to
estimate the economic impacts of CLS assuming a hypothetical introduction and spread of
CLS and its vector B. cockerelli to Europe in order to provide the economic basis for a
decision on the pest quarantine status. The second objective is methodological. As little
information is available on the effect of spatial resolution and economic assessment method
on the result of economic impact assessments, this study compares the results of different
spatial and economic techniques to arrive at an evidence-based quantification of economic
impacts.
5.2 Materials and Methods
The bio-economic model for assessing the impacts of CLS and its vector B. cockerelli to the
European potato and tomato integrates four types of information: (1) expected spatial
distribution of the disease, (2) effect of climate on yield loss, (3) distribution and value of
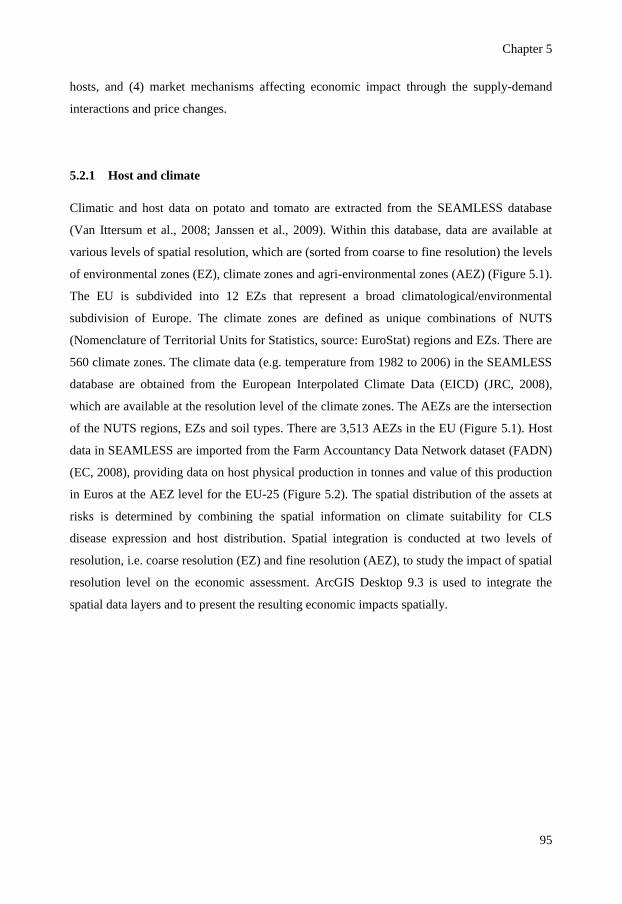
Chapter 5
95
hosts, and (4) market mechanisms affecting economic impact through the supply-demand
interactions and price changes.
5.2.1 Host and climate
Climatic and host data on potato and tomato are extracted from the SEAMLESS database
(Van Ittersum et al., 2008; Janssen et al., 2009). Within this database, data are available at
various levels of spatial resolution, which are (sorted from coarse to fine resolution) the levels
of environmental zones (EZ), climate zones and agri-environmental zones (AEZ) (Figure 5.1).
The EU is subdivided into 12 EZs that represent a broad climatological/environmental
subdivision of Europe. The climate zones are defined as unique combinations of NUTS
(Nomenclature of Territorial Units for Statistics, source: EuroStat) regions and EZs. There are
560 climate zones. The climate data (e.g. temperature from 1982 to 2006) in the SEAMLESS
database are obtained from the European Interpolated Climate Data (EICD) (JRC, 2008),
which are available at the resolution level of the climate zones. The AEZs are the intersection
of the NUTS regions, EZs and soil types. There are 3,513 AEZs in the EU (Figure 5.1). Host
data in SEAMLESS are imported from the Farm Accountancy Data Network dataset (FADN)
(EC, 2008), providing data on host physical production in tonnes and value of this production
in Euros at the AEZ level for the EU-25 (Figure 5.2). The spatial distribution of the assets at
risks is determined by combining the spatial information on climate suitability for CLS
disease expression and host distribution. Spatial integration is conducted at two levels of
resolution, i.e. coarse resolution (EZ) and fine resolution (AEZ), to study the impact of spatial
resolution level on the economic assessment. ArcGIS Desktop 9.3 is used to integrate the
spatial data layers and to present the resulting economic impacts spatially.
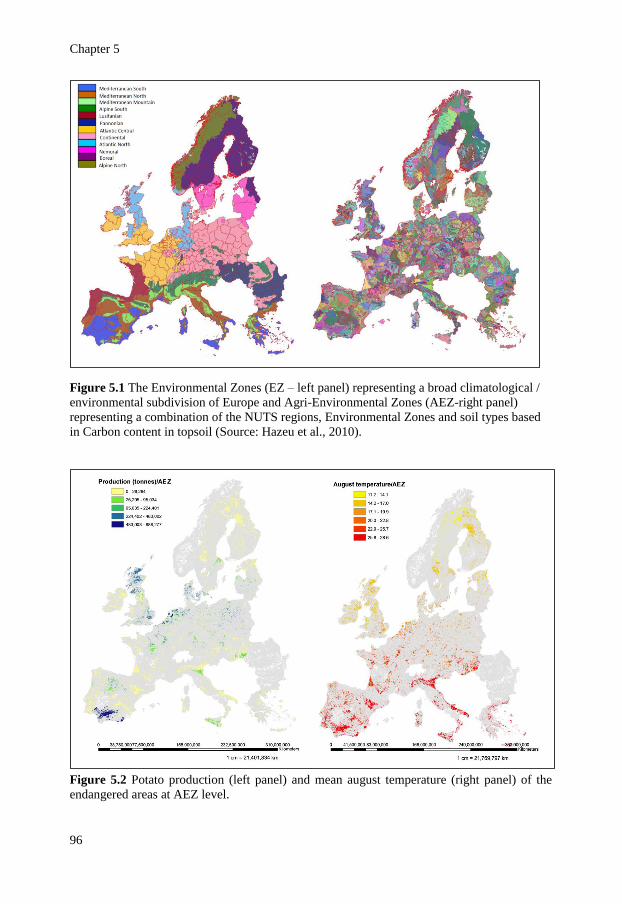
Chapter 5
96
Figure 5.1 The Environmental Zones (EZ – left panel) representing a broad climatological /
environmental subdivision of Europe and Agri-Environmental Zones (AEZ-right panel)
representing a combination of the NUTS regions, Environmental Zones and soil types based
in Carbon content in topsoil (Source: Hazeu et al., 2010).
Figure 5.2 Potato production (left panel) and mean august temperature (right panel) of the
endangered areas at AEZ level.
Chapter 5
97
5.2.2 Potential pest spread
The potential spatial distribution of CLS was determined by eliciting the expected infestation
level (proportion of infected potato and tomato plants) in each environmental zone in an
expert elicitation workshop (Table 5.1). The workshop was a part of the European and
Mediterranean Plant Protection Organization (EPPO) pest risk analysis (PRA). Eight experts,
representing the EPPO expert working group, were selected by EPPO to conduct the PRA.
During the workshop, there was opportunity for interaction among the experts so that they
fully understand and agree upon the problem at hand.
Table 5.1 Expected infestation level of Candidatus Liberibacter Solanacearum elicited from
experts
Scenario Environmental zone
Best case Most likely Worst case
Mediterranean South 1% 10% 40%
Mediterranean North 1% 10% 40%
Mediterranean Mountain 1% 10% 40%
Alpine South 0% 0.15% 0.70%
Lustanian 0% 0.15% 0.70%
Atlantic Central 0% 0.15% 0.70%
Atlantic North 0% 0.15% 0.70%
Panonian 0.15% 3.75% 15%
Nemoral 0.15% 3.75% 15%
Contenintal 0.15% 3.75% 15%
Boreal 0.15% 3.75% 15%
Alpine North 0.15% 3.75% 15%
The potential infestation level will depend on the ability of the bacterium and its vector
to establish in the European continent. During the PRA the experts concluded that the
bacterium can survive over a wide range of temperatures as shown from its current
distribution. For the vector, given its current distribution in the Americas and New Zealand, it
is thought that B. cockerelli would be able to establish and overwinter outdoors in Southern,
Weastern and Central Europe. It is unlikely that B. cockerelli would establish in the cold
northern regions of Europe (e.g. Scandinavian regions). However transient populations could
occur there after migration from southern Europe as indicated by the immigrant populations in
Canada originating from southern USA (Ferguson et al., 2003). Therefore, the Mediterranean
basin is expected to be the most suitable because of the climate and the cropping pattern (i.e.
Chapter 5
98
availability of hosts all year round). In the northern and eastern part of Europe, only transient
populations may occur in the field.
To elicit the infestation level, the experts assumed a hypothetical situation in which the
CLS and its vector are introduced into the EU through one of the possible pathways (i.c.
association of CLS and its vector with imported commodities such as plants for planting and
fruit of solanaceous plants). As a result of spread through the vector or by human activities
(e.g. vegetative reproduction), the infestation level is expected to increase over time. The
experts assumed a five years interval to reach a steady state situation where the infestation
level of CLS remains constant. The experts collectively quantified the uncertainty of the
future infestation level per EZ using a triangular distribution. Within this distribution, the
most likely value represents the most likely infestation level while minimum and maximum
values are those infestation level values that according to their expertise bracket the range of
possible outcomes of the hypothetical invasion. This distribution is used in stochastic analysis
(see below).
5.2.3 Economic impacts
The economic impact of CLS infestation consists of direct and indirect impacts. Together they
constitute the total economic impact. Direct impacts are directly related to the production
process and include yield losses and additional production costs (e.g. costs of crop
protection). They are calculated by partial budgeting (Soliman et al., 2010). In the partial
budgeting analysis, the spatial distribution of losses within EU is evaluated both at a coarse
(EZ) and fine level of resolution (AEZ). The two modelling results are compared to assess the
importance of spatial resolution in the analysis. Indirect impacts are generated downstream
from the production process itself, and are related to changes in prices, producer and
consumer responses to price changes, and effects on international trade. The total economic
impact is calculated by partial equilibrium modelling (PE), where changes in production
volume and cost of production are integrated with changes in the market. The total economic
impact is the change in social welfare, and has two components: i) the change in producer
surplus and ii) the change in consumer surplus (Soliman et al., 2010). In this study, the
applied partial equilibrium analysis estimates the change in social welfare at the EU level.
Chapter 5
99
5.2.3.1 Direct impact
CLS related yield loss depends on temperature (Munyaneza, 2010). Given Workneh et al.
(2010) yield loss is expected when mean August temperature is higher than 15oC. Yield loss
by CLS increases with temperature. For example, Workneh et al. (2010) observed that “tuber
symptoms develop at a much slower rate than at higher temperatures”. Furthermore, based on
laboratory experiments on potato, Munyaneza (2010) concluded that CLS is a heat sensitive
bacterium. A similar response to high temperature has been observed in tomato (Liefting et
al., 2009a). Based on this information, we parameterized a linear relation between
temperature and yield loss due to CLS. Uncertainty within the temperature-yield loss
relationship was accounted for in the stochastic analysis (see section 5.2.4 below).
Munyaneza (2010) stated that “the optimum temperature for CLS development in potato
plants was estimated at approximately 28°C”. The maximum yield loss is 93% (Munyaneza et
al., 2008). This high yield loss percentage is realized at 28oC which is the highest mean
August occurring in Europe. Based on the linear relationship assumption, maximum yield loss
and the threshold, an interpolation has been made to determine the potato yield loss per each
degree centigrade resulting into 7.15% increase for each degree of mean August temperature
above the threshold of 15oC.
For tomato we use the same relationship between temperature and yield loss as in
potato. We use the ambient mean August temperature if it is above 20oC but we still use a
temperature of at least 20oC for the damage calculation if mean August temperature is less
than 20oC because tomatoes are often grown as protected crops in glasshouses with an
average temperature of 20oC (Hurd & Graves, 1984). The yield loss for tomato is 32.5% at a
temperature of 20oC and will increase by 6.5% per degree increase in average temperature
above 20oC, reaching 84.5% (Hansen et al., 2008) at 28
oC. Damage in the infested area in
each zone is obtained by multiplying the value of production in infested areas with the
temperature dependent yield loss percentage and the incidence of CLS.
For the moment, there is little experience with disease control, and it is likely that it will
be essentially targeted against the psyllid vector or involves the use of resistant cultivars.
Therefore, an infestation by CLS will most likely result in an increase in cost of production.
However, due to lack of knowledge on expected additional control costs, we account only for
yield losses in the PB analysis.
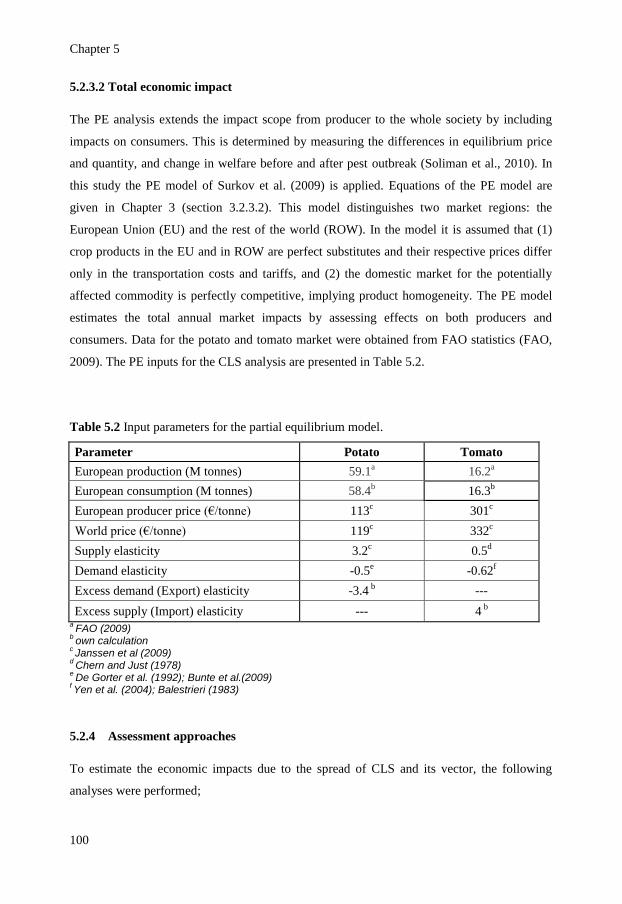
Chapter 5
100
5.2.3.2 Total economic impact
The PE analysis extends the impact scope from producer to the whole society by including
impacts on consumers. This is determined by measuring the differences in equilibrium price
and quantity, and change in welfare before and after pest outbreak (Soliman et al., 2010). In
this study the PE model of Surkov et al. (2009) is applied. Equations of the PE model are
given in Chapter 3 (section 3.2.3.2). This model distinguishes two market regions: the
European Union (EU) and the rest of the world (ROW). In the model it is assumed that (1)
crop products in the EU and in ROW are perfect substitutes and their respective prices differ
only in the transportation costs and tariffs, and (2) the domestic market for the potentially
affected commodity is perfectly competitive, implying product homogeneity. The PE model
estimates the total annual market impacts by assessing effects on both producers and
consumers. Data for the potato and tomato market were obtained from FAO statistics (FAO,
2009). The PE inputs for the CLS analysis are presented in Table 5.2.
Table 5.2 Input parameters for the partial equilibrium model.
Parameter Potato Tomato
European production (M tonnes) 59.1a 16.2
a
European consumption (M tonnes) 58.4b 16.3
b
European producer price (€/tonne) 113c 301
c
World price (€/tonne) 119c 332
c
Supply elasticity 3.2c 0.5
d
Demand elasticity -0.5e -0.62
f
Excess demand (Export) elasticity -3.4 b ---
Excess supply (Import) elasticity --- 4 b
a FAO (2009)
b own calculation
c Janssen et al (2009)
d Chern and Just (1978)
e De Gorter et al. (1992); Bunte et al.(2009)
f Yen et al. (2004); Balestrieri (1983)
5.2.4 Assessment approaches
To estimate the economic impacts due to the spread of CLS and its vector, the following
analyses were performed;
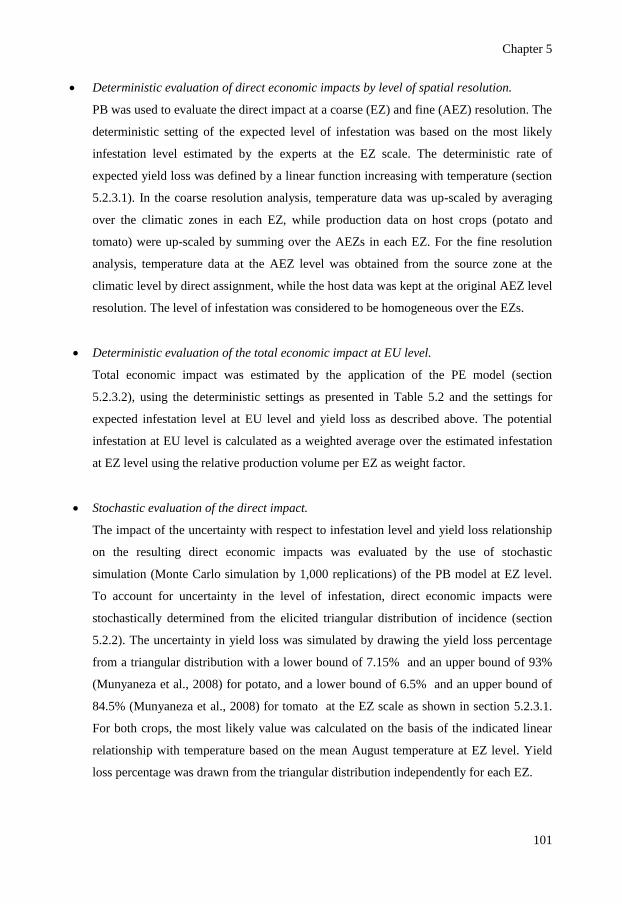
Chapter 5
101
Deterministic evaluation of direct economic impacts by level of spatial resolution.
PB was used to evaluate the direct impact at a coarse (EZ) and fine (AEZ) resolution. The
deterministic setting of the expected level of infestation was based on the most likely
infestation level estimated by the experts at the EZ scale. The deterministic rate of
expected yield loss was defined by a linear function increasing with temperature (section
5.2.3.1). In the coarse resolution analysis, temperature data was up-scaled by averaging
over the climatic zones in each EZ, while production data on host crops (potato and
tomato) were up-scaled by summing over the AEZs in each EZ. For the fine resolution
analysis, temperature data at the AEZ level was obtained from the source zone at the
climatic level by direct assignment, while the host data was kept at the original AEZ level
resolution. The level of infestation was considered to be homogeneous over the EZs.
Deterministic evaluation of the total economic impact at EU level.
Total economic impact was estimated by the application of the PE model (section
5.2.3.2), using the deterministic settings as presented in Table 5.2 and the settings for
expected infestation level at EU level and yield loss as described above. The potential
infestation at EU level is calculated as a weighted average over the estimated infestation
at EZ level using the relative production volume per EZ as weight factor.
Stochastic evaluation of the direct impact.
The impact of the uncertainty with respect to infestation level and yield loss relationship
on the resulting direct economic impacts was evaluated by the use of stochastic
simulation (Monte Carlo simulation by 1,000 replications) of the PB model at EZ level.
To account for uncertainty in the level of infestation, direct economic impacts were
stochastically determined from the elicited triangular distribution of incidence (section
5.2.2). The uncertainty in yield loss was simulated by drawing the yield loss percentage
from a triangular distribution with a lower bound of 7.15% and an upper bound of 93%
(Munyaneza et al., 2008) for potato, and a lower bound of 6.5% and an upper bound of
84.5% (Munyaneza et al., 2008) for tomato at the EZ scale as shown in section 5.2.3.1.
For both crops, the most likely value was calculated on the basis of the indicated linear
relationship with temperature based on the mean August temperature at EZ level. Yield
loss percentage was drawn from the triangular distribution independently for each EZ.
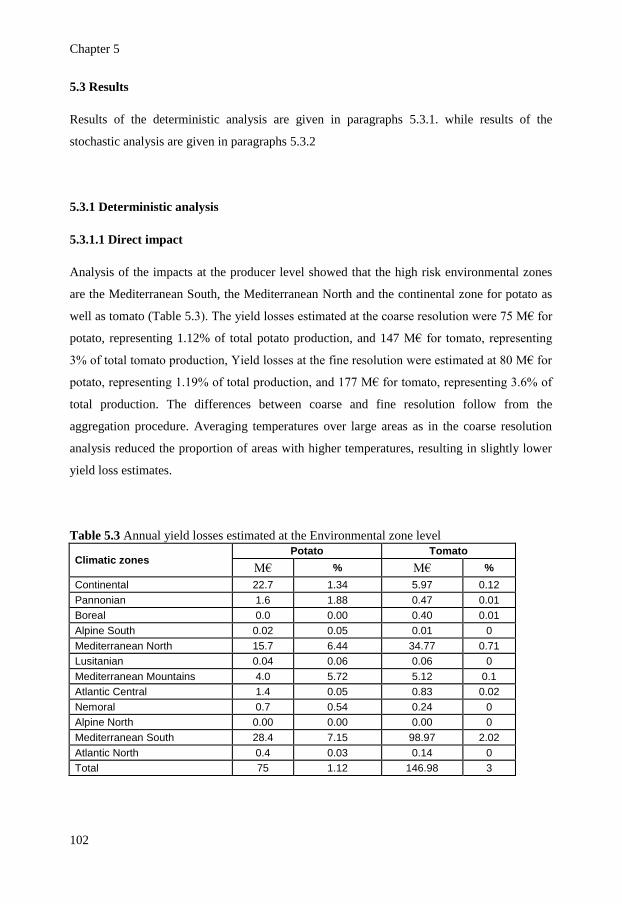
Chapter 5
102
5.3 Results
Results of the deterministic analysis are given in paragraphs 5.3.1. while results of the
stochastic analysis are given in paragraphs 5.3.2
5.3.1 Deterministic analysis
5.3.1.1 Direct impact
Analysis of the impacts at the producer level showed that the high risk environmental zones
are the Mediterranean South, the Mediterranean North and the continental zone for potato as
well as tomato (Table 5.3). The yield losses estimated at the coarse resolution were 75 M€ for
potato, representing 1.12% of total potato production, and 147 M€ for tomato, representing
3% of total tomato production, Yield losses at the fine resolution were estimated at 80 M€ for
potato, representing 1.19% of total production, and 177 M€ for tomato, representing 3.6% of
total production. The differences between coarse and fine resolution follow from the
aggregation procedure. Averaging temperatures over large areas as in the coarse resolution
analysis reduced the proportion of areas with higher temperatures, resulting in slightly lower
yield loss estimates.
Table 5.3 Annual yield losses estimated at the Environmental zone level
Climatic zones Potato Tomato
M€ % M€ %
Continental 22.7 1.34 5.97 0.12
Pannonian 1.6 1.88 0.47 0.01
Boreal 0.0 0.00 0.40 0.01
Alpine South 0.02 0.05 0.01 0
Mediterranean North 15.7 6.44 34.77 0.71
Lusitanian 0.04 0.06 0.06 0
Mediterranean Mountains 4.0 5.72 5.12 0.1
Atlantic Central 1.4 0.05 0.83 0.02
Nemoral 0.7 0.54 0.24 0
Alpine North 0.00 0.00 0.00 0
Mediterranean South 28.4 7.15 98.97 2.02
Atlantic North 0.4 0.03 0.14 0
Total 75 1.12 146.98 3
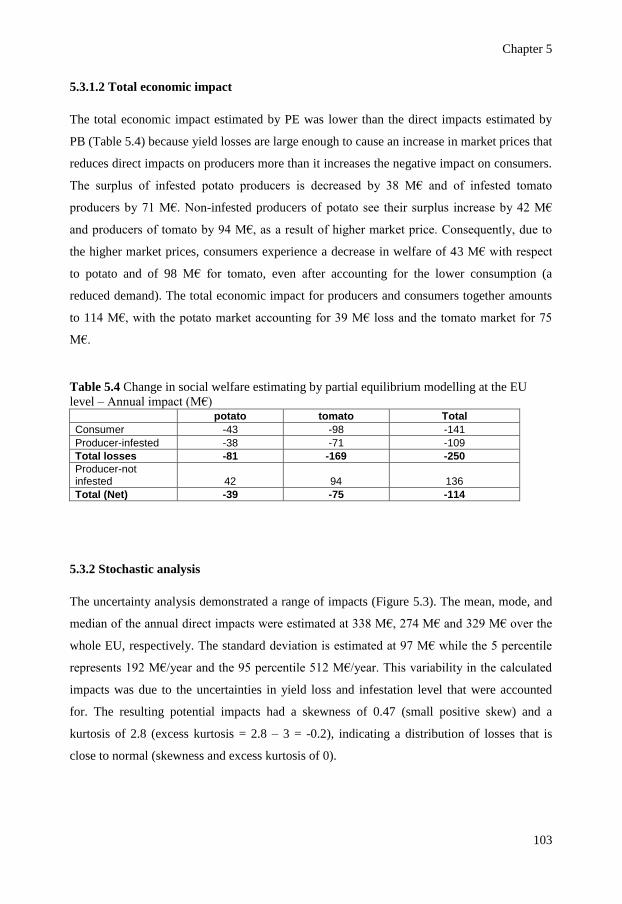
Chapter 5
103
5.3.1.2 Total economic impact
The total economic impact estimated by PE was lower than the direct impacts estimated by
PB (Table 5.4) because yield losses are large enough to cause an increase in market prices that
reduces direct impacts on producers more than it increases the negative impact on consumers.
The surplus of infested potato producers is decreased by 38 M€ and of infested tomato
producers by 71 M€. Non-infested producers of potato see their surplus increase by 42 M€
and producers of tomato by 94 M€, as a result of higher market price. Consequently, due to
the higher market prices, consumers experience a decrease in welfare of 43 M€ with respect
to potato and of 98 M€ for tomato, even after accounting for the lower consumption (a
reduced demand). The total economic impact for producers and consumers together amounts
to 114 M€, with the potato market accounting for 39 M€ loss and the tomato market for 75
M€.
Table 5.4 Change in social welfare estimating by partial equilibrium modelling at the EU
level – Annual impact (M€) potato tomato Total
Consumer -43 -98 -141
Producer-infested -38 -71 -109
Total losses -81 -169 -250
Producer-not infested 42 94 136
Total (Net) -39 -75 -114
5.3.2 Stochastic analysis
The uncertainty analysis demonstrated a range of impacts (Figure 5.3). The mean, mode, and
median of the annual direct impacts were estimated at 338 M€, 274 M€ and 329 M€ over the
whole EU, respectively. The standard deviation is estimated at 97 M€ while the 5 percentile
represents 192 M€/year and the 95 percentile 512 M€/year. This variability in the calculated
impacts was due to the uncertainties in yield loss and infestation level that were accounted
for. The resulting potential impacts had a skewness of 0.47 (small positive skew) and a
kurtosis of 2.8 (excess kurtosis = 2.8 – 3 = -0.2), indicating a distribution of losses that is
close to normal (skewness and excess kurtosis of 0).
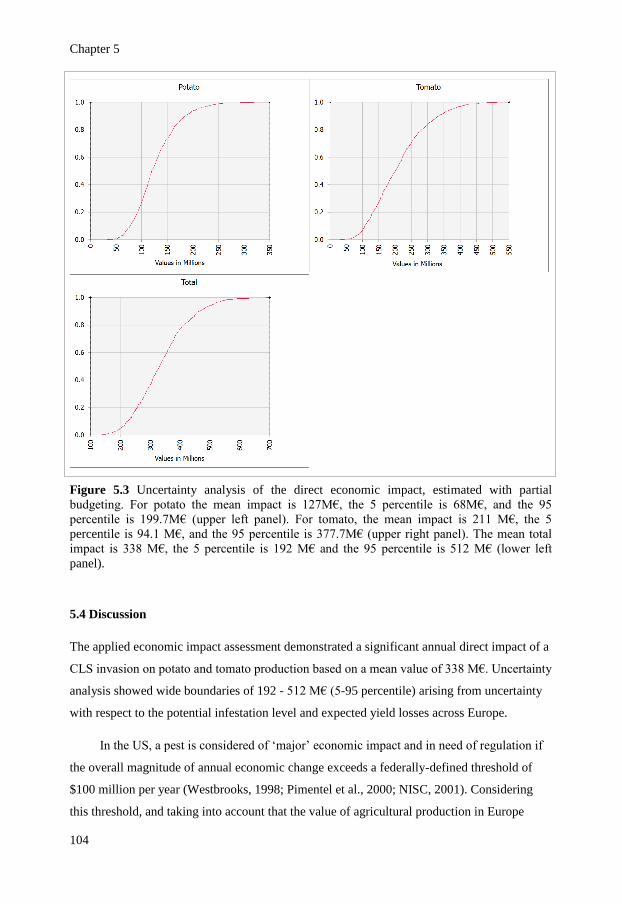
Chapter 5
104
Figure 5.3 Uncertainty analysis of the direct economic impact, estimated with partial
budgeting. For potato the mean impact is 127M€, the 5 percentile is 68M€, and the 95
percentile is 199.7M€ (upper left panel). For tomato, the mean impact is 211 M€, the 5
percentile is 94.1 M€, and the 95 percentile is 377.7M€ (upper right panel). The mean total
impact is 338 M€, the 5 percentile is 192 M€ and the 95 percentile is 512 M€ (lower left
panel).
5.4 Discussion
The applied economic impact assessment demonstrated a significant annual direct impact of a
CLS invasion on potato and tomato production based on a mean value of 338 M€. Uncertainty
analysis showed wide boundaries of 192 - 512 M€ (5-95 percentile) arising from uncertainty
with respect to the potential infestation level and expected yield losses across Europe.
In the US, a pest is considered of ‘major’ economic impact and in need of regulation if
the overall magnitude of annual economic change exceeds a federally-defined threshold of
$100 million per year (Westbrooks, 1998; Pimentel et al., 2000; NISC, 2001). Considering
this threshold, and taking into account that the value of agricultural production in Europe
Chapter 5
105
exceeds that of the US (360 billion euros as compared to 307 billion euros in 2007; Schnepf,
2010; Eurostat, 2012), the calculated direct economic impacts would justify CLS regulation.
The estimated indirect impact on consumers and infested producers evaluated by PE
was higher than the direct impact estimated by PB, but if we consider also the impact on the
non-infested producers, then the net impact is lower than that estimated by direct impact.
Nevertheless, the resulting net negative impact is still high enough (114 M€/year) to consider
CLS as a pest of major economic importance.
The economic direct impact assessment was conducted at two resolution levels, coarse
and fine. While there was a difference between the two resolutions in the resulting impacts (5
and 30 M€ for potato and tomato respectively), it does not affect the final decision on the
need for pest regulation. Therefore, conducting the analysis at a fine resolution or using
advanced economic techniques (e.g. PE) just for making a decision on the pest quarantine
status may not be justified (i.e. the additional insight in the impacts does not outweigh the
efforts and time spend). In addition, in case of economic assessment of novel pests,
uncertainty on the pest biology is quite high. It is uncertain whether using advanced
geographical and economic techniques would reduce the biological and economic
uncertainties. Therefore, a coarse level of analysis appears to be fit for purpose.
The common practice of economic impact assessment conducted to make a decision on
the quarantine status of new pests is usually limited to literature review of the documented
economic impacts of the pest in its current area of distribution (Macleod et al., 2002). Few
exceptions exist in which quantitative economic analysis was conducted at the EU level to
support the regulation decision. One such example is the analysis on Karnal Bunt (Tilletia
indica) (Sansford, 1996; Sansford et al., 2006; Brennan et al., 2004). The common practice of
qualitative assessments is sometimes sufficient to support the decision for the quarantine pest
status on a fit for purpose basis. Nonetheless, for certain cases, where the potential economic
impacts are ambiguous due to uncertainties, more detailed quantitative estimates may be
required. The quantitative assessment will show the range of the expected impacts and the
proportions of the replications resulting in higher impacts than the threshold that define the
pest as of major economic impact. This quantitative analysis will lead to more transparent and
objective justification of the quarantine status of the pest and accordingly a better position in
any trade dispute. Moreover, a decision on a pest status is most likely followed by a decision
on the most appropriate phytosanitary measure if the pest is classified to be of major
Chapter 5
106
importance. This stage usually requires a detailed quantitative analysis. As such, quantitative
assessment strengthens the scientific grounds for making decisions on the regulation of pests.
Chapter 5
107
Acknowledgments
We thank Neil Giltrap, Joseph Munyaneza, Anne Nissinen, Emilio Stefani, Leon Tjou-Tam-
Sin, Dirk Jan Van der Gaag, Leif Sundheim, Muriel Suffert, Fabienne Grousset for helpful
suggestions and discussion. The opinions expressed are those of the authors.
Chapter 5
108
References
Anonymous, 2000. Council Directive 2000/29/EC of 8 May 2000 on protective measures against the
introduction into the Community of organisms harmful to plants or plant products and against their spread
within the Community. Official Journal of the European Communities 43 L 169, 1–112
Balestrieri G, 1983. An econometric analysis of wholesale market demand for fresh tomatoes using daily data.
Acta horticulture 135.
Berry NA, Scott I, Thompson S, Beard D, 2010. Detection of Candidatus Liberibacter solanacearum in trapped
insects and non-crop plants in New Zealand. in Proceedings of the 10th annual 2010 zebra chip reporting
session (Workneh & Rush Editors). Hyatt DFW Airport, Dallas, TX, November 7-10,
Brennan JP, Kelly PW, Thorne F, 2004. Report on socio-economic costs of Karnal bunt in the European Union.
EU Karnal Bunt Risks Project. Deliverable Report 5.1
Bunte F, Kuiper WE, van Galen MA, 2009. Consumer response when lowering organic food prices to non-
organic levels. 26èmes Journées de Microéconomie de Dijon, Tunisia.
Chern WS, Just RE, 1978. Econometric Analysis of Supply Response and Demand for Processing Tomatoes in
California. Giannini Foundation Monograph, Number 37.
CNAS, 2009. Economic Impacts of Zebra Chip on Texas. Center for North American Studies, Department of
Agricultural Economics, Texas AgriLife Research*Texas AgriLife Extension Service, CNAS Issue Brief
2009-01.
De Gorter H., Hickey R., Wecksler D., 1992. Project effects of trade liberalization on US speciality crops. GATT
research paper, 92-GATT 18.
EC, 2008. Farm Accountancy Data Network (FADN) Source: EU-FADN-DG AGRI-G3
http://ec.europa.eu/agriculture/rica/
EU, 2012. Summaries of EU legislation. Accessed on 1.2.2012.
http://europa.eu/legislation_summaries/food_safety/plant_health_checks/f85001_en.htm.
Eurostat, accessed on 27.1.2012. http://epp.eurostat.ec.europa.eu/portal/page/portal/eurostat/home/
FAOstat, 2009. Food and Agriculture organization of the United Nations, http://faostat.fao.org/default.aspx.
Ferguson G, Banks E, Fraser H, 2003. B. cockerelli in Canada Potato Psyllid - A New Pest in Greenhouse
Tomatoes and Peppers. The Ontario Ministry of Agriculture, Food and Rural Affairs (OMAFRA),
http://www.omafra.gov.on.ca/english/crops/facts/potato_psyllid.htm.
Hansen AK, Trumble JT, Stouthamer R, Paine TD, 2008. A new huanglongbing species, "Candidatus
Liberibacter psyllaurous," found to infect tomato and potato, is vectored by the psyllid Bactencera
cockerelli (Sulc). Applied and Environmental Microbiology 74, 5862-5865
Hazeu G, Elbersen B, Andersen E, Baruth B, van Diepen CA, Metzger MJ, 2010. A biophysical typology for a
spatially-explicit agri-environmental modeling framework. In Environmental and agricultural modelling:
integrated approaches for policy impact assessment, eds. Floor Brouwer and M. K. van Ittersum: Springer
Academic Publishing.
Henne DC, Workneh F, Wen A., Price JA, Pasche JS, Gudmestad NC, Rush CM, 2010. Characterization and
Epidemiological Significance of Potato Plants Grown from Seed Tubers Affected by Zebra Chip Disease.
Plant disease 94, 659-665
Hurd RG, Graves CJ, 1984. The influence of different temperature patterns having the same integral on the
earliness and yield of tomatoes. Acta Horticulturae 148, 547-554.
Janssen S, Andersen E, Athanasiadis IN, Van Ittersum MK, 2009. A database for integrated assessment of
European agricultural systems. Environmental Science & Policy 12, 573 - 587.
Knapic V, 2007. Regulation of new organisms harmful to plants in the European Union. 8th Slovenian
Conference on Plant Protection, p. 355-360
Liefting L. 2008. New 'Candidatus liberabacter' species infecting solanaceous crops. Biosecurity 85, 21.
Liefting LW, Perez-Egusquiza ZC, Clover GRG, Anderson JAD, 2008a. A new 'Candidatus Liberibacter' species
in Solanum tuberosum in New Zealand. Plant Disease 92(10), 1474
Liefting LW, Sutherland PW, Ward LI, Paice KL, Weir BS, Clover GRG, 2009a. A new 'Candidatus
Liberibacter' species associated with diseases of solanaceous crops. Plant Disease 93(3), 208-214
Liefting LW, Ward LI, Shiller JB, Clover GRG, 2008b. A new 'Candidatus Liberibacter' species in Solanum
betaceum (Tamarillo) and Physalis peruviana (Cape Gooseberry) in New Zealand. Plant Disease 92, 1588
Liefting LW, Weir BS, Pennycook SR, Clover GRG, 2009b. 'Candidatus Liberibacter solanacearum', associated
with plants in the family Solanaceae. International Journal of Systematic and Evolutionary Microbiology
59, 2274-2276
Chapter 5
109
Lin H, Doddapaneni H, Munyaneza JE, Civerolo EL, Sengoda VG, Buchman JL, Stenger DC, 2009. Molecular
characterization and phylogenetic analysis of 16S rRNA from a new "Candidatus Liberibacter" strain
associated with zebra chip disease of potato (Solanum tuberosum L.) and the potato psyllid (Bactericera
cockerelli Sulc). Journal of Plant Pathology 91, 215-219
MacLeod A, Evans HF, Baker RHA, 2002. An analysis of pest risk from an Asian longhorn beetle (Anoplophora
glabripennis) to hardwood trees in the European community, Crop Protection 21, 635–645
Morris J., Reed P. and Sansford C., 2009. Candidatus Liberibacter solanacearum - a new bacterium associated
with a disease of tomatoes, capsicums, and potatoes in New Zealand, The Food and Environment Research
Agency (Fera) Information note, UK.
Munyaneza JE, 2010. Psyllids as Vectors of Emerging Bacterial Diseases of Annual Crops. Southwestern
Entomologist 35, 471-477
Munyaneza JE, Buchman JL, Upton JE, Goolsby JA, Crosslin JM, Bester G, Miles GP, Venkatesan G. Sengoda.
2008. Impact of Different Potato Psyllid Populations on Zebra Chip Disease Incidence, Severity, and Potato
Yield. Subtropical Plant Science 60, 27-37
Munyaneza JE, Crosslin JM, Buchman JL. 2009b. Seasonal Occurrence and Abundance of the Potato Psyllid,
Bactericera cockerelli, in South Central Washington. American Journal of Potato Research 86, 513–518
Munyaneza JE, Crosslin JM, Upton JE, 2007. Association of Bactericera cockerelli (Homoptera: Psyllidae) with
"zebra chip," a new potato disease in southwestern United States and Mexico. Journal of Economic
Entomology 100, 656-663.
Munyaneza JE, Fisher TW, Sengoda VG, Garczynski SF, Nissinen A, Lemmetty A. 2010. Association of
“Candidatus Liberibacter solanacearum” With the Psyllid, Trioza apicalis (Hemiptera: Triozidae) in
Europe. Journal of Economic Entomology 103, 1060-1070
Munyaneza JE, Sengoda VG, Crosslin JM, Garzon-Tiznado JA, Cardenas-Valenzuela OG, 2009a. First report of
"Candidatus Liberibacter solanacearum" in pepper plants in Mexico. Plant Disease 93, 1076
Munyaneza JE, Sengoda VG, Crosslin JM, Rosa-Lozano G, de la Sanchez A, 2009c. First report of 'Candidatus
Liberibacter psyllaurous' in potato tubers with zebra chip disease in Mexico. Plant Disease 93, 552
Nelson WR, Fisher TJ, Munyaneza JE, 2011. Haplotypes of “Candidatus Liberibacter solanacearum” suggest
long-standing separation. European Journal of Plant Pathology 130, 5-12.
NISC, National Invasive Species Council, 2001. National Management Plan: Meeting the Invasive Species
Challenge. Washington , DC : NISC
Pimentel D, Lach L, Zuniga R, Morrison D, 2000. Environmental and economic costs of nonindigenous species
in the United States. Bioscience 50, 53–65.
Sansford C, Baker R, Brennan J, 2006. Pest Risk Analysis for Tilletia indica for the European Union. EU Karnal
Bunt Risks Project. Deliverable Report 6·1 and 6·5. [http://karnalpublic.pestrisk.net/]
Sansford CE, 1996. Karnal Bunt (Tilletia indica): An Assessment of the Current Situation in the USA and the
Potential Risk to the European Community. York, UK: Central Science Laboratory. CSL internal
document.
Schnepf R, 2010. Agriculture in the WTO: Limits on Domestic Support, Congressional Research Service, 7-
5700, RS20840
Soliman T, Mourits MCM, Oude Lansink AGJM, van der Werf W, 2010. Economic impact assessment in pest
risk analysis. Crop Protection 29, 517–524.
Surkov IV, Oude Lansink AGJM, Van der Werf W, 2009. The optimal amount and allocation of sampling effort
for plant health inspection. European Review of Agricultural economics 36, 295-320.
Van Ittersum MK, Ewert F, Heckelei T, Wery J, Alkan Olsson J, Andersen E, Bezlepkina I, Brouwer F,
Donatelli M, Flichman G, Olsson L, Rizzoli A, Van der Wal T, Wien JE, Wolf J, 2008. Integrated
assessment of agricultural systems – A component-based framework for the European Union
(SEAMLESS). Agricultural Systems 96, 150-165.
Westbrooks R, 1998. Invasive Plants, Changing the Landscape of America: Fact Book. Washington , DC:
Federal Interagency Committee for the Management of Noxious and Exotic Weeds.
Workneh F, Henne DC, Paetzold L, Harveson RM, Bradshaw JD, and Rush CM, 2010. Status of regional zebra
chip incidence in 2010 and temperature effect under controlled conditions in Proceedings of the 10th
annual 2010 zebra chip reporting session (Workneh & Rush Editors). Hyatt DFW Airport, Dallas, TX.
Yen ST, Lin B, Harris JM, Ballenger N, 2004. Demand for Differentiated Vegetables, Selected Paper prepared
for presentation at the American Agricultural Economics Association Annual Meeting, Denver, Colorado.

110
111
Chapter 6
Quantitative Economic Impact Assessment: When is it Worth the Effort?
Soliman T., Mourits M.C.M., Oude Lansink A.G.J.M., van der Werf W., 2012. Quantitative economic impact
assessment: When is it worth the effort?, submitted to Journal of Applied Ecology.
Chapter 6
112
Abstract
According to the International Plant Protection Convention and the World Trade
Organization Agreement on the Application of Sanitary and Phytosanitary measures, any
measure against the introduction and spread of new pests must be justified by a science-based
pest risk analysis. Economic impact assessment is usually made using a qualitative approach,
based on classifying the size of impact into five categories, from “minimal” to “massive”.
Whilst the qualitative approach may be adequate in many instances, it may lack transparency
and demonstrable objectivity. A quantitative approach for economic impact assessment may
improve transparency and strengthen the justification for measures, if taken, but requires
additional work, and it requires specific data and models. This paper, first, clarifies the data
and models needed to conduct a quantitative economic impact assessment in support of a
decision on pest quarantine status or to justify management measures. Second, it compares
the strengths and weaknesses of the qualitative and quantitative approach. It is concluded
that a quantitative approach is preferable if the expected economic impact is ambiguous when
using a qualitative approach, and when there are sufficient resources to conduct the analysis.
Keywords
Quantitative impact assessment - Qualitative impact assessment – Pest invasion - Data
requirements – Economic modelling.
Chapter 6
113
6.1 Introduction
According to the International Plant Protection Convention and the World Trade Organization
Agreement on the Application of Sanitary and Phytosanitary measures, plant health regulation
is only to be used where technically justified and not to protect an industry from competition
(FAO, 1995). Plant health regulations thus have to be applied in a transparent and non-
discriminatory manner. A science-based pest risk analysis (PRA) provides the rationale for
determining appropriate plant health regulation for a specified PRA area. Economic impact
assessment plays a key role within the PRA process. A PRA could be initiated upon finding a
new harmful organism either within or outwith the PRA area to determine whether the
organism qualifies as a quarantine pest or whether measures for eradication or containment
are required, respectively. If it is verified that the pest has a potential to pose unacceptable
impacts, the most appropriate phytosanitary measure have to be defined based on the expected
cost and technical effectiveness of the available measures.
The International Standard for Phytosanitary Measures (ISPM) 11 states that “Pest risk
assessment needs to be only as complex as is technically justified by the circumstances”
(FAO, 2004). This rule is critical because it gives the risk analyst the freedom to choose the
complexity level of his assessment according to the level of uncertainty and the available
resources.
Economic impact assessments are usually made using a qualitative approach (EPPO,
2011; EFSA, 2010). The qualitative approach is following a decision support scheme
according to ISPM 11 developed by the International Plant Protection Convention (IPPC)
(EPPO, 2011). The qualitative scheme consists of a logical sequence of questions that can
capture the expert opinion. For each question the expert provides his answer by selecting a
score (within five levels). The questions concern the size of the impact without control, the
efficacy of control, the costs of control, and the costs of pest invasion, including the potential
effects on international trade (EPPO, 2011; ACIA-CFIA, 2008; USDA, 2000; Biosecurity
Australia, 2007). Although this qualitative approach, based on classification, is helpful to
classify impacts, the status of the outcome is quantitatively not well defined. It has therefore
some shortcomings in justifying measures, and entails weakness in case of trade disputes.
There is a growing awareness that quantitative economic impact assessment is essential
to provide a better transparency and objectivity of the quarantine regulation (Sansford, 2002).
Conducting quantitative economic impact assessment with the aim of supporting a decision
Chapter 6
114
on pest quarantine status or management measures requires subject specific information in
terms of data and models. ISPM no. 11 requires general guidelines on the impacts that have to
be taken into account (i.e. direct and indirect impacts) and analytical techniques for a
quantitative economic impact assessment (i.e. partial budgeting, partial equilibrium modelling
and computable general equilibrium modelling). However, risk analysts are usually not
trained as economists, and they need guidance with respect to the required data and economic
models for conducting economic impact assessment. This paper fills this gap in the literature.
The objective of the paper is twofold: first, to compare the strengths and weaknesses of a
qualitative and quantitative approach when conducting an economic impact assessment.
Second, to clarify the data and models needed to conduct a quantitative economic impact
assessment in support of a decision on pest quarantine status or management measures.
The remainder of the paper is structured as follows. First, this paper describes how the
qualitative approach is applied to assess the economic impacts in PRA. This is followed by a
presentation of the quantitative approach and its data requirements and economic models. The
final section discusses the strengths and weaknesses of quantitative and qualitative approaches
and presents the implications for practitioners.
6.2 Qualitative economic impact assessment
In Europe the EPPO PRA scheme is used to perform a qualitative assessment of the pest risk
(EPPO, 2011). It provides a decision support scheme based on ISPM 11 developed by the
International Plant Protection Convention. Similar schemes are used in other parts of the
world. For instance, in the UK (DEFRA, 2005), Canada (ACIA-CFIA, 2008), the USA
(USDA, 2000), Australia (Biosecurity Australia, 2007) and New Zealand (Biosecurity New
Zealand, 2006).
The EPPO scheme consists of a logical sequence of questions addressing all elements of
ISPM 11. The scheme is designed as a binary decision tree to eliminate quickly organisms
that do not qualify as potential quarantine pests. The PRA section dealing with the economic
impact assessment consists of 6 questions. The first two questions concern the size of the
expected impact with and without control measures. The third question addresses the efficacy
of the existing control measures (excluding the phytosanitary measures). The fourth question
addresses the expected increase in production costs (including control costs), and the last two
Chapter 6
115
questions deal with the expected change in consumer demand and the expected losses in the
export market. In the EPPO scheme, impacts are assessed on a five-point ordinal scale
(minimal, minor, moderate, major or massive) based on the evidence and expert’s experience.
These qualitative assessments are justified by detailed text. Due to the difficulty of creating
generic rating guidance for the ordinal scale, clarifying notes are attached to the questions.
These notes explain how the risk analyst can select the proper score with regard to the
magnitude of the impact. The notes, for instance, provide examples which the risk analyst can
use as a reference when making his assessment.
For example, in 2004, a PRA has been conducted on Tomato chlorosis virus (ToCV). In
the economic impact assessment section, it was concluded that significant damage (i.e. high
impact) in tomato fields and glasshouses is expected and that severity of symptoms and
damage will vary according to the cultivar. Furthermore, the experts expected that ToCV
would increase the price of tomatoes in case substantial losses occur causing potential
changes in producer supply and subsequently consumer demand. Regarding potential trade,
they concluded that the extent to which this would affect export markets from or within the
EPPO region is unclear (i.e. highly uncertain) (EPPO, 2012a).
Since 2006, the starting year of conducting PRA at the EPPO scale, 11 PRAs were
conducted for insects and mites, two for nematodes, one for a fungus, one for a bacterium,
one for a virus and five for invasive plants. Eight PRAs are currently under development. A
list of the finalized PRAs conducted by EPPO can be found on their website (EPPO, 2012b).
The qualitative schemes used in other parts of the world (mentioned above) are similar
to the EPPO scheme. In general, all these schemes are targeting all types of plant pests except
for the Australian and New Zealand schemes. The generic Biosecurity Australia and
Biosecurity New Zealand schemes are generally not used for pest plants because these
countries have built specific risk assessment schemes for weeds.
6.3 Quantitative economic impact assessment
To perform a quantitative economic impact assessment, a calculation framework is required to
integrate information on assets at risk with information on the potential area of establishment,
the spread, the potential damage, and the economic consequences to producers, consumers,
and import and export. Soliman et al. (2012a) developed a generic bio-economic framework
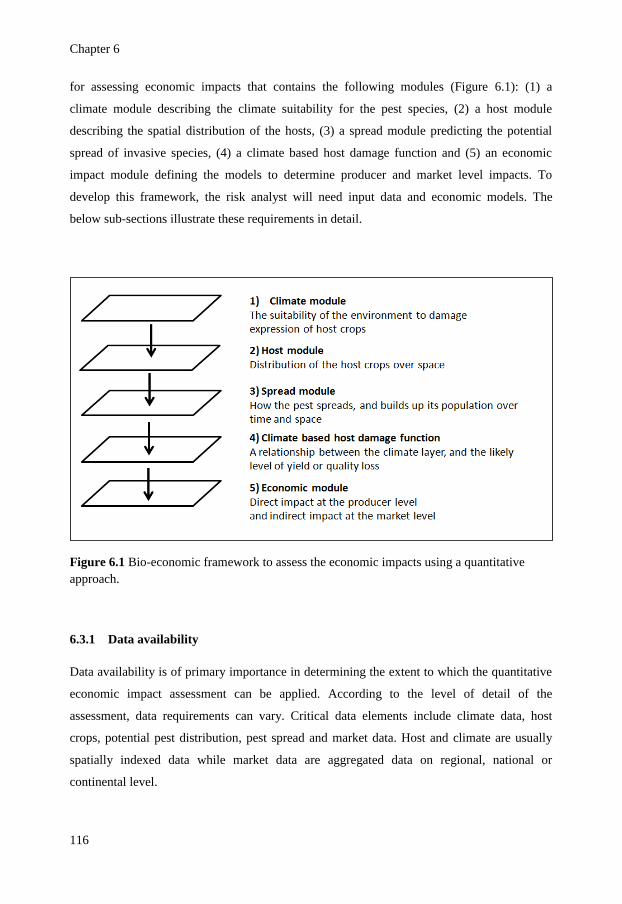
Chapter 6
116
for assessing economic impacts that contains the following modules (Figure 6.1): (1) a
climate module describing the climate suitability for the pest species, (2) a host module
describing the spatial distribution of the hosts, (3) a spread module predicting the potential
spread of invasive species, (4) a climate based host damage function and (5) an economic
impact module defining the models to determine producer and market level impacts. To
develop this framework, the risk analyst will need input data and economic models. The
below sub-sections illustrate these requirements in detail.
Figure 6.1 Bio-economic framework to assess the economic impacts using a quantitative
approach.
6.3.1 Data availability
Data availability is of primary importance in determining the extent to which the quantitative
economic impact assessment can be applied. According to the level of detail of the
assessment, data requirements can vary. Critical data elements include climate data, host
crops, potential pest distribution, pest spread and market data. Host and climate are usually
spatially indexed data while market data are aggregated data on regional, national or
continental level.
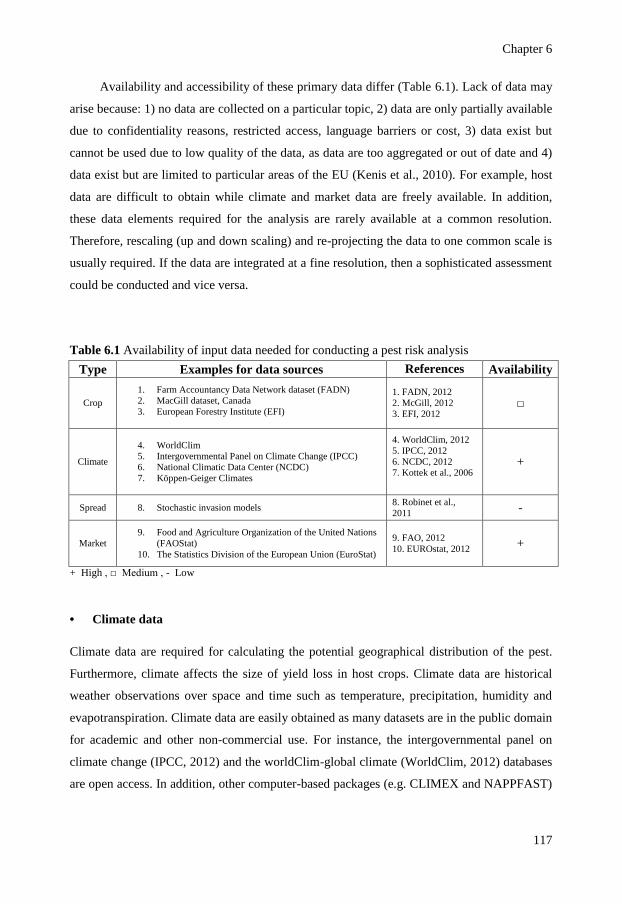
Chapter 6
117
Availability and accessibility of these primary data differ (Table 6.1). Lack of data may
arise because: 1) no data are collected on a particular topic, 2) data are only partially available
due to confidentiality reasons, restricted access, language barriers or cost, 3) data exist but
cannot be used due to low quality of the data, as data are too aggregated or out of date and 4)
data exist but are limited to particular areas of the EU (Kenis et al., 2010). For example, host
data are difficult to obtain while climate and market data are freely available. In addition,
these data elements required for the analysis are rarely available at a common resolution.
Therefore, rescaling (up and down scaling) and re-projecting the data to one common scale is
usually required. If the data are integrated at a fine resolution, then a sophisticated assessment
could be conducted and vice versa.
Table 6.1 Availability of input data needed for conducting a pest risk analysis
Type Examples for data sources References Availability
Crop
1. Farm Accountancy Data Network dataset (FADN)
2. MacGill dataset, Canada
3. European Forestry Institute (EFI)
1. FADN, 2012
2. McGill, 2012
3. EFI, 2012 □
Climate
4. WorldClim
5. Intergovernmental Panel on Climate Change (IPCC)
6. National Climatic Data Center (NCDC)
7. Köppen-Geiger Climates
4. WorldClim, 2012
5. IPCC, 2012
6. NCDC, 2012
7. Kottek et al., 2006
+
Spread 8. Stochastic invasion models 8. Robinet et al.,
2011 -
Market
9. Food and Agriculture Organization of the United Nations
(FAOStat)
10. The Statistics Division of the European Union (EuroStat)
9. FAO, 2012
10. EUROstat, 2012 +
+ High , □ Medium , - Low
• Climate data
Climate data are required for calculating the potential geographical distribution of the pest.
Furthermore, climate affects the size of yield loss in host crops. Climate data are historical
weather observations over space and time such as temperature, precipitation, humidity and
evapotranspiration. Climate data are easily obtained as many datasets are in the public domain
for academic and other non-commercial use. For instance, the intergovernmental panel on
climate change (IPCC, 2012) and the worldClim-global climate (WorldClim, 2012) databases
are open access. In addition, other computer-based packages (e.g. CLIMEX and NAPPFAST)
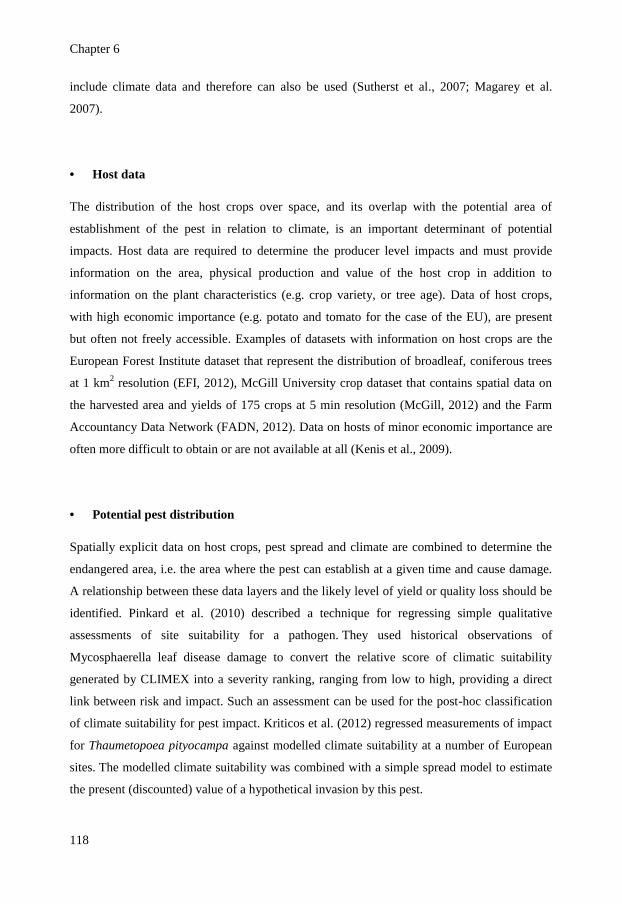
Chapter 6
118
include climate data and therefore can also be used (Sutherst et al., 2007; Magarey et al.
2007).
• Host data
The distribution of the host crops over space, and its overlap with the potential area of
establishment of the pest in relation to climate, is an important determinant of potential
impacts. Host data are required to determine the producer level impacts and must provide
information on the area, physical production and value of the host crop in addition to
information on the plant characteristics (e.g. crop variety, or tree age). Data of host crops,
with high economic importance (e.g. potato and tomato for the case of the EU), are present
but often not freely accessible. Examples of datasets with information on host crops are the
European Forest Institute dataset that represent the distribution of broadleaf, coniferous trees
at 1 km2 resolution (EFI, 2012), McGill University crop dataset that contains spatial data on
the harvested area and yields of 175 crops at 5 min resolution (McGill, 2012) and the Farm
Accountancy Data Network (FADN, 2012). Data on hosts of minor economic importance are
often more difficult to obtain or are not available at all (Kenis et al., 2009).
• Potential pest distribution
Spatially explicit data on host crops, pest spread and climate are combined to determine the
endangered area, i.e. the area where the pest can establish at a given time and cause damage.
A relationship between these data layers and the likely level of yield or quality loss should be
identified. Pinkard et al. (2010) described a technique for regressing simple qualitative
assessments of site suitability for a pathogen. They used historical observations of
Mycosphaerella leaf disease damage to convert the relative score of climatic suitability
generated by CLIMEX into a severity ranking, ranging from low to high, providing a direct
link between risk and impact. Such an assessment can be used for the post-hoc classification
of climate suitability for pest impact. Kriticos et al. (2012) regressed measurements of impact
for Thaumetopoea pityocampa against modelled climate suitability at a number of European
sites. The modelled climate suitability was combined with a simple spread model to estimate
the present (discounted) value of a hypothetical invasion by this pest.
Chapter 6
119
Pest establishment occurs in the area where the climate is suitable and hosts are present.
Combining the host distribution and climate suitable for pest species modules will point to the
locations in the PRA area that may harbour the invader. Climatic mapping could be done
through programs that model fundamental niche maps (Venette et al., 2010). Examples are
CLIMEX (Sutherst et al., 2007; Sutherst and Maywald, 1985) , MaxEnt (Phillips et al., 2006),
Artificial Neural Networks (Gevrey and Worner, 2006), NAPPFAST (Magarey et el., 2007),
BIOCLIM/ANUCLIM (Nix, 1986; Busby, 1991; Hutchinson et al., 1996) and Environmental
Niche Factor Analysis (Hirzel et al., 2002). Based on such available information and
programs that model fundamental niche maps, a worst case scenario can be estimated by
assuming that the pest is present throughout the whole area of potential establishment.
However, to provide more realistic estimates, risk assessors need to take into account the time
it takes a pest to invade these areas by using the spread module. For instance, Macleod et al.
(2002) assess the potential establishment of the Asian longhorn beetle (Anoplophora
glabripennis) to hardwood trees in the European community.
Establishment and spread modules can indicate only the endangered areas with relative
pest risk. Economic impacts are generated as a result of the spread of the invasive pest and,
therefore, the climate based host damage function can relate the abundance of pest to the
expected level of damage.
• Pest spread
Modelling pest spread in space and time is needed to provide realistic estimates of the
materialization of potential economic impacts over time. A spread model provides
information on how the pest spreads, and builds up its population over time and space. This
information is used in the economic module to determine the yield loss in the impacted area.
A spread model could be developed by the risk analyst or data on spread can be elicited from
experts. For example, Soliman et al. (2012a) estimated the potential spread of potato spindle
tuber viroid at the EU level using expert elicitation. The experts opinion in the quantitative
context differ from the qualitative one as they identify distributions of the potential incidence
level instead of providing a scale (e.g. low, medium, high) of the incidence level. Both spread
modelling and expert elicitation, require substantial time and efforts.
Chapter 6
120
The most commonly used spread models are temporal process models (e.g. population
dynamics and temporal spread over cells integrated with impact models). For example,
Rebaudo and Dangles (2011) developed an innovative approach through an agent-based
model (ABM) combining social (diffusion theory) and biological (pest population dynamics)
models to study the role of cooperation among small-scale farmers to share IPM information
for controlling an invasive pest. A second group of approaches are spatial process models
(e.g. radial range expansion, hybrid of logistic growth and radial rate expansion, and dispersal
kernel models) (Robinet et al., 2012). For instance, Liebhold and Tobin (2006) model the
spread of gypsy moth in North America using radial expansion to compare the behavior of
these models with historical data. Robinet et al. (2011) developed a spread model for pine
wood nematode on the European continent using a kernel-based approach. This model was
used by Soliman et al. (2012c) to estimate the potential economic impacts of PWN. Moreover,
Carrasco et al. (2010) modelled the invasion of the maize pest western corn rootworm in
Europe using dispersal kernels and gravity models.
It is usually very difficult or impossible to reliably model the density of a pest
population, leading to a spread model that generates only spatial data on presence-absence of
the pest. However, population density may be an essential element for determining the level
of yield loss. For instance, Carrasco et al. (2012) estimated the yield losses due to a western
corn rootworm (WCR) invasion in the UK by calculating the density of WCR in the field and
the level of control applied. Pest presence-absence data can only be used to delimit the
endangered area. If pest density data cannot be obtained, as is often the case, another data
layer is needed as a surrogate for the missing population density data (e.g. climate or any
other ecological or cultural factors that are highly correlated with the population density such
as irrigation, rotations, and type of soil).
• Market data
Market data are required to estimate the market level economic impacts (i.e. changes in social
welfare). These data are the domestically produced quantities, the domestically consumed
quantities, the traded quantities with the rest of the world, and the corresponding prices of
these quantities (i.e. domestic and world prices). These data are freely available in public
datasets such as FAOstat (FAOstat, 2012) or EUROstat (EUROstat, 2012). However, these
data are often only available at a coarse resolution (i.e. aggregated at the national or regional
Chapter 6
121
level) and, comparable to the available host data, only for those hosts which are economically
important. Data are also not available for all countries and not for all years. In addition,
detailed market information that might be needed in PRA such as production, consumption
and the trade of different crop varieties are not available.
6.3.2 Modelling Impacts
The economic impact of a pest infestation consists of direct and indirect impacts. Together
they constitute the total economic impact. Direct impacts are directly related to the production
process and include yield losses and additional production costs (e.g. costs of crop
protection). They are calculated by partial budgeting (Soliman et al., 2010). Indirect impacts
are generated downstream from the production process itself, and are related to changes in
prices, producer and consumer responses to price changes, and effects on international trade.
The total economic impact is calculated by partial equilibrium modelling, where changes in
production volume and cost of production are integrated with changes in the market,
particularly the feedbacks between prices and supply and demand for product. The total
economic impact is the change in total welfare, and has two components: the change in
producer surplus and the change in consumer surplus.
The time lines of the spread model and the economic model should be the same, unless
it is clear from the first few years of the pest spread that the generated economic impact is
high enough to categorize the organism as a quarantine pest. The time line of the spread
model will depend on the pest type. The spread model should be long enough to show the
potential of the pest to spread and at the same time should be short enough to have a
reasonable technical processing time. Soliman et al. (2012c) choose a time period of 20 years
for PWN spread in the EU. This time period was sufficient to show the potential spread and to
capture a large part of expected economic impacts in order to support decision making.
Partial budgeting
Direct economic impacts are assessed by partial budgeting (PB). The net economic effect of a
change will be the sum of the positive economic effects minus the sum of the negative effects
(Soliman et al., 2010). To apply this technique, the risk analyst needs to determine first the
Chapter 6
122
endangered area, i.e. the areas where hosts can show yield loss, in terms of quantity or quality,
and the severity of the yield losses in the endangered area. Direct impacts are the producer
level impacts that can be estimated at the farm, field, regional or continental scale. Choice of
the most appropriate scale for PB will depend on the resolution of the input data and the
expected uncertainty regarding the results. In addition to the yield loss estimation, the risk
analyst need to estimate the additional protection costs that the growers will make to mitigate
the losses, and whether this mitigation efforts will impact the level of yield loss estimated
before. For instance, Macleod et al. (2003) used partial budgeting to estimate the impacts of
Thrips palmi in England. In Australia, Sinden et al. (2004) estimated the economic impact of
weeds using partial budgeting.
Partial equilibrium modelling
Partial equilibrium modelling (PE) is a technique to estimate the total (direct and indirect)
economic impacts. PE is based on defining functional relationships for supply and demand for
the commodity of interest to determine the market equilibrium or, in other words, the
combination of prices and quantities that maximizes social welfare (Mas-Colell et al., 1995)
(Figure 6.2). This figure shows a downward-sloping demand curve, reflecting diminishing
marginal utility as consumption increases, and an upward-sloping supply curve, reflecting
increasing marginal costs of production. The market equilibrium, where quantity supplied
equals quantity demanded, occurs at an equilibrium price of P1 and quantity Q1. The
difference between P1 and the demand curve represents how much consumers benefit by
being able to purchase the product for a price that is less than they would be willing to pay.
This total benefit derived by the consumers, or consumer surplus, is represented by the
triangle labelled CS. Since the supply curve represents the marginal variable cost of
production, the area below the curve equals the total variable costs. The revenues from sales
are equal to price times quantity. Hence the producer surplus, defined as the difference
between total revenue and total variable costs is reflected by the triangle PS. Social welfare is
defined as the sum of consumer surplus and producer surplus.
PE is used if there are changes in production volumes due to pest establishment,
indicating the possibility of indirect impacts. For instance, Hoddle et al. (2003) used the
partial equilibrium model to estimate the impact of Scirtothrips perseae Nakahara
(Thysanoptera: Thripidae) in Californian avocado orchards.
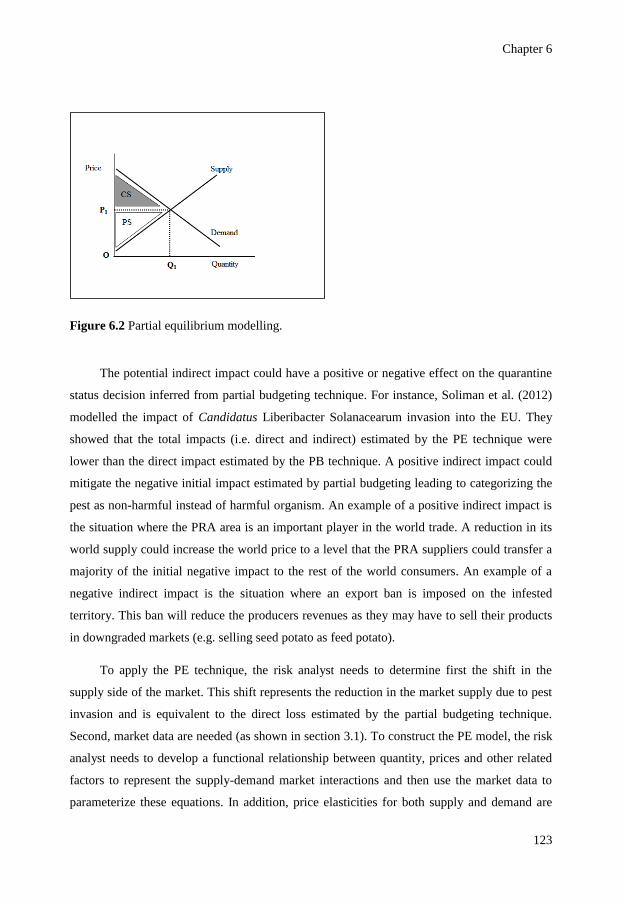
Chapter 6
123
Figure 6.2 Partial equilibrium modelling.
The potential indirect impact could have a positive or negative effect on the quarantine
status decision inferred from partial budgeting technique. For instance, Soliman et al. (2012)
modelled the impact of Candidatus Liberibacter Solanacearum invasion into the EU. They
showed that the total impacts (i.e. direct and indirect) estimated by the PE technique were
lower than the direct impact estimated by the PB technique. A positive indirect impact could
mitigate the negative initial impact estimated by partial budgeting leading to categorizing the
pest as non-harmful instead of harmful organism. An example of a positive indirect impact is
the situation where the PRA area is an important player in the world trade. A reduction in its
world supply could increase the world price to a level that the PRA suppliers could transfer a
majority of the initial negative impact to the rest of the world consumers. An example of a
negative indirect impact is the situation where an export ban is imposed on the infested
territory. This ban will reduce the producers revenues as they may have to sell their products
in downgraded markets (e.g. selling seed potato as feed potato).
To apply the PE technique, the risk analyst needs to determine first the shift in the
supply side of the market. This shift represents the reduction in the market supply due to pest
invasion and is equivalent to the direct loss estimated by the partial budgeting technique.
Second, market data are needed (as shown in section 3.1). To construct the PE model, the risk
analyst needs to develop a functional relationship between quantity, prices and other related
factors to represent the supply-demand market interactions and then use the market data to
parameterize these equations. In addition, price elasticities for both supply and demand are
Chapter 6
124
needed to estimate the market level impacts. Elasticities are the percentage change in quantity
demanded or supplied caused by a one percent change in price (Mas-Colell et al., 1995).
Elasticities can be obtained from literature or estimated econometrically (Padilla-Bernal and
Thilmany, 2000; Malaga et al., 2001). For example, Richards et al. (2009) conducted a trade-
volume and welfare analysis of relaxing SPS regulations on the import of fresh U.S. potatoes
into Mexico. The econometric model used in the analysis provides estimates of the elasticities
of supply and demand parameters. Russo et al. (2008) estimated domestic own-price, cross-
price and income elasticities of demand and estimated price elasticities of supply for various
California commodities
The complexity of the partial equilibrium model can vary regarding its spatial scale,
number of sectors considered, functional specification of the supply and demand equations,
one or multi-level chains and the market structure. Concerning the spatial scale, Binfield et
al. (2009), Tabeau and Van Leeuwen (2008) and Gracia et al. (2008) developed a PE model at
the country scale (i.e. Ireland, Netherlands and Spain respectively), while Agrosynergie
(2008), Garcia-Alvarez Coque et al. (2009), and Guyomard and Le Mouel (2003) developed a
PE model at the continental level (i.e. EU). Concerning the numbers of sectors considered in
the model, multi-market models offer more accurate ex-ante impact analysis than single-
market models by including possible indirect effects such as substitution and complementarity
between commodities. Breukers et al. (2008) used a single market partial equilibrium model
to quantify export losses resulting from potato brown rot, while Gohin and Guyomard (2000),
Sexton and Zhang (2001) and Moro et al. (2002) assumed a multi-market specification for
their PE model. Concerning functional specifications , the use of model equations is limited as
not all functional forms can be used within the PE model. Commonly used functional forms
are the Cobb-Douglas and the Constant Elasticity of Substitution (CES), even though these
functional forms impose constraints on the production technology and consumer preferences
(Oude Lansink and Thijssen, 1998). In a market-oriented environment, any significant supply
change, such as reduction in firm supply due to high pest incidence, will be transmitted to
consumers, and a complete picture of an impact assessment, therefore, calls for modelling
multiple levels of the chain. Another major sophistication of PE model is to account for
market structure across the chain. Market structure affects the ability of stakeholders in the
chain to exercise market power and is reflected in the slopes of the supply and demand curves.
Failing to model the correct market structure may lead to a wrong estimation of the size of the
potential economic impact and its distribution among producers and consumers. For example,
Chapter 6
125
the market power of food retailers (e.g. monopoly or oligopoly) can lead to an increased
ability of the producers to transfer the impacts to the consumers. Several examples exist for
modelling market structure in PE. Requiliart et al. (2008) assumed an oligopoly-oligopsony
market structure in their comparative static PE model of the fresh tomato sector in France.
Sckokai and Soregaroli (2008) assumed a monopoly and perfect competition for their
dynamic PE model of the cereal sector in two fictive countries.
6.4 Synthesis and implications
PRAs including economic impact assessment are an essential component of plant health
policy, aiming to allow plants and plant products to flow as freely as possible, while
minimizing to a reasonable and justifiable extent the risk of introduction of plant pests.
Although the commonly used qualitative economic impact assessment is adequate to apply in
some situations, there is a growing awareness to use more quantitative economic impact
assessment to ensure that decision makers are properly informed. The foregoing section
clarified the essential data and models needed to conduct a quantitative economic impact
assessment in order to support a decision on the pest quarantine status.
On conducting an economic impact assessment, the risk analyst has to make choices
regarding the most appropriate technique to apply (Figure 6.3). The appropriate technique will
provide an acceptable estimate of the economic impacts while minimising uncertainty with
respect to conclusion. In addition, the technique should use the minimum possible resources
in terms of data, skills and time. The first step in selecting the most appropriate technique is to
make a decision on the need of a quantitative approach. Generally the qualitative approach is
the default method to use. A quantitative approach is subsequently recommended when the
qualitative approach does not give a clear indication of the importance of the potential
economic impacts or when a metric estimation of the impacts is needed to justify or to support
a management measure. Quantitative impact assessment can be conducted at various levels of
complexity (i.e. less or more detailed analysis). Depending on the objective of the study and
the available resources, the appropriate level of complexity can be chosen. An assessment in
support of a decision on the quarantine status of an organism will require a less detailed
analysis than an assessment that aims to assess the justification of management measures. A
more detailed analysis could involve, for instance, finer resolution analysis, gathering of more
detailed data, and using advanced economic techniques with wider scope.
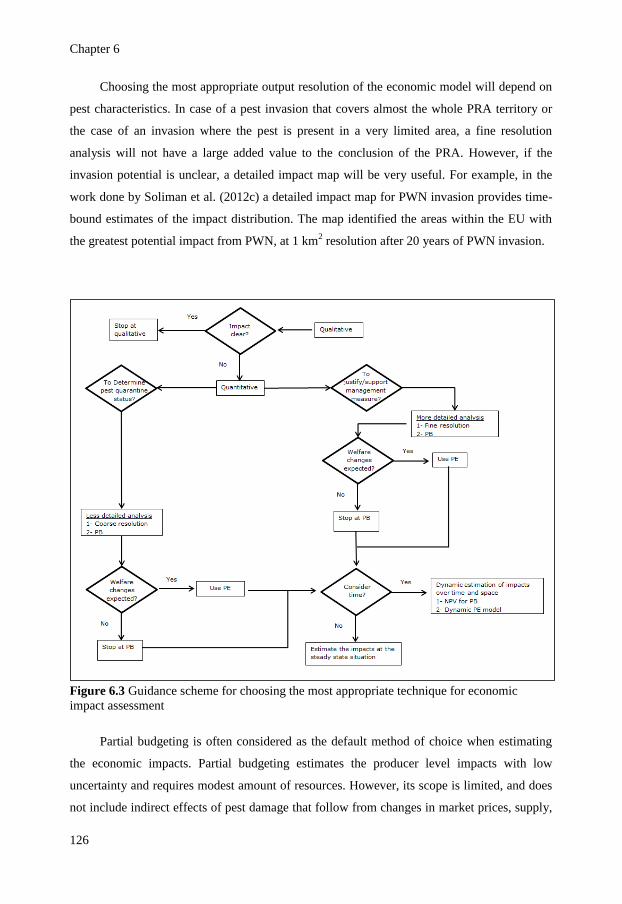
Chapter 6
126
Choosing the most appropriate output resolution of the economic model will depend on
pest characteristics. In case of a pest invasion that covers almost the whole PRA territory or
the case of an invasion where the pest is present in a very limited area, a fine resolution
analysis will not have a large added value to the conclusion of the PRA. However, if the
invasion potential is unclear, a detailed impact map will be very useful. For example, in the
work done by Soliman et al. (2012c) a detailed impact map for PWN invasion provides time-
bound estimates of the impact distribution. The map identified the areas within the EU with
the greatest potential impact from PWN, at 1 km2 resolution after 20 years of PWN invasion.
Figure 6.3 Guidance scheme for choosing the most appropriate technique for economic
impact assessment
Partial budgeting is often considered as the default method of choice when estimating
the economic impacts. Partial budgeting estimates the producer level impacts with low
uncertainty and requires modest amount of resources. However, its scope is limited, and does
not include indirect effects of pest damage that follow from changes in market prices, supply,
Chapter 6
127
and demand. Resource requirements for partial equilibrium modelling are higher than
requirements for partial budgeting (Soliman et al., 2010). Partial equilibrium modelling could
be used when a significant change in social welfare is expected, e.g. for economically
important crops. This economic importance can be determined by: 1) the percentage of gross
domestic product (GDP) the production of this host crop present and 2) whether the PRA area
is an important player of the world trade. Soliman et al. (2012a) and (2012b) assessed the
economic impacts of potato which is a host crop of economic importance for the EU and
therefore it was essential to model the market indirect impacts using PE.
Another important element that needs to be defined within the economic impact
assessment framework is the timeline of the assessment. The economic impacts could be
estimated over time and space from the start of the invasion till a steady state situation or
other arbitrary end point, or only at the steady state situation. Modelling the dynamics of the
economic impacts (from the start of the invasion till the steady state situation) requires a
detailed modelling of spread, and use of an economic methodology that considers the impact
dynamics (e.g. net present value (NPV) for partial budgeting or dynamic partial equilibrium
modelling).
The NPV will calculate the present value of the future impacts posed by the pest using a
discount rate such as the interest rate. NPV provides a more accurate estimation of the future
impacts than a simple summation of impacts over time.
A dynamic comparative PE modelling would constitute a step up in complexity, tracing
the path of the equilibrium values of prices and quantities over time, which shows the short
and long-term impacts of the pest invasion. In the short term, a significant reduction in supply
could be anticipated (leading to large reduction in quantity and increase in price), while in the
long term, producers are likely to adapt and take measures to increase supply.
Two elements can define the time line of the assessment. First, the pest characteristics
(e.g. how fast it can spread) will play a role in defining the time line of the economic model.
For instance, the rate of spread per year can provide an estimation of the expected period
required by the pest to show its potential for invasion. Second, for perennial host plants, there
is a possibility that the harvest impacts are accrued over the host life cycle after the time of
first invasion and therefore the time frame of the assessment should account for this
prolonged impact. However, the risk analyst needs to account for the increased uncertainty
associated with a prolongation of the time horizon.
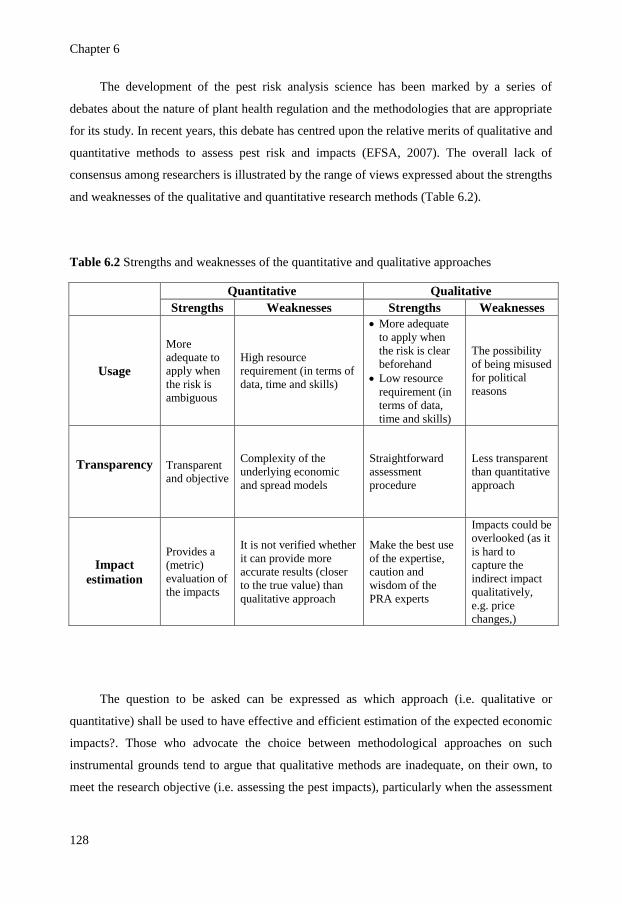
Chapter 6
128
The development of the pest risk analysis science has been marked by a series of
debates about the nature of plant health regulation and the methodologies that are appropriate
for its study. In recent years, this debate has centred upon the relative merits of qualitative and
quantitative methods to assess pest risk and impacts (EFSA, 2007). The overall lack of
consensus among researchers is illustrated by the range of views expressed about the strengths
and weaknesses of the qualitative and quantitative research methods (Table 6.2).
Table 6.2 Strengths and weaknesses of the quantitative and qualitative approaches
Quantitative Qualitative
Strengths Weaknesses Strengths Weaknesses
Usage
More
adequate to
apply when
the risk is
ambiguous
High resource
requirement (in terms of
data, time and skills)
More adequate
to apply when
the risk is clear
beforehand
Low resource
requirement (in
terms of data,
time and skills)
The possibility
of being misused
for political
reasons
Transparency
Transparent
and objective
Complexity of the
underlying economic
and spread models
Straightforward
assessment
procedure
Less transparent
than quantitative
approach
Impact
estimation
Provides a
(metric)
evaluation of
the impacts
It is not verified whether
it can provide more
accurate results (closer
to the true value) than
qualitative approach
Make the best use
of the expertise,
caution and
wisdom of the
PRA experts
Impacts could be
overlooked (as it
is hard to
capture the
indirect impact
qualitatively,
e.g. price
changes,)
The question to be asked can be expressed as which approach (i.e. qualitative or
quantitative) shall be used to have effective and efficient estimation of the expected economic
impacts?. Those who advocate the choice between methodological approaches on such
instrumental grounds tend to argue that qualitative methods are inadequate, on their own, to
meet the research objective (i.e. assessing the pest impacts), particularly when the assessment
Chapter 6
129
involves large areas such as European Union which has heterogeneous ecological and
agricultural zones (Baker et al., 2005).
A quantitative approach provides a more transparent and objective assessment than a
qualitative approach (Soliman et al., 2010). This transparency can prevent the misuse of the
pest risk assessment for protectionist purposes. Moreover, the more transparent evaluation of
the impacts in a quantitative approach will lead to a stronger position in trade dispute with
other countries. For example, the quantitative approach can estimate a metric value of
potential impacts and the distribution of the impacts instead of a scale (e.g. low or high
impact) provided by the qualitative approach. A quantitative approach is more adequate when
the risk is ambiguous. This ambiguity can occur when potential pest spread, effect of climate
on yield loss, distribution and value of hosts or market mechanisms that affect the economic
impact is unclear. Market mechanisms usually mitigate impacts on producers and transfer
them to consumers.
Although the quantitative approach provides additional insights, and a metric estimate
of the impact, it is impossible to verify whether the results provided by the quantitative
approach are more accurate (i.e. close to the true impact) than results provided by qualitative
one (EFSA, 2007). In addition, these results are only applicable under the predefined model
assumptions. For instance, Soliman et al. (2012a) concluded that a quantitative assessment of
direct costs of a PSTVd outbreak, with current knowledge and uncertainty does not result in a
convincing justification of the current phytosanitary measures. However, a qualitative
assessment of direct impact suggested that direct impacts are substantial enough to justify the
current measures (EFSA, 2011). Although the quantitative approach provides a metric and
transparent assessment of the direct impact against the cost of the current phytosanitary
measures, we are not sure whether this conclusion is more accurate than the qualitative
conclusion, due to the very large differences between experts on the estimated levels of
spread. The quantitative approach made this variability explicit, increasing transparency, but
not necessarily strengthening the justification of measures. The quantitative assessment still
supported the measures because it indicated a critical lack of knowledge on pest spread,
justifying a precautionary approach.
In cases where there are limited resources in terms of time, data and skills, a qualitative
approach can be more adequate to use than a quantitative approach. It is generally agreed that
when the default qualitative analysis (Figure 6.3) gives a clear indication of the importance of
Chapter 6
130
the economic impacts, the quantitative approach is redundant, given the objective of the PRA.
That was stated in the ISPM 11: “Detailed analysis of the estimated economic consequences
is not necessary if there is sufficient evidence or it is widely agreed that the introduction of a
pest will have unacceptable economic consequences. It will, however, be necessary to
examine economic factors in greater detail when the level of economic consequences is in
question, or when the level of economic consequences is needed to evaluate the strength of
measures used for risk management or in assessing the cost-benefit of exclusion or control”.
However, a main drawback of the qualitative approach is that some potential impacts could be
overlooked by ignoring mitigation responses of producers. This mitigation response could
reduce initial direct impact and therefore, this could lead to inclusion of organisms in the
quarantine list that do not cause significant harm.
PRAs are heavily reliant on a range of evidences, many of them are qualitative and
therefore may not be appropriate for quantification. These evidences should not be ignored or
categorized as inaccurate or biased. On the other hand, whether pest impacts can be quantified
should not prevent a careful consideration of its strength as evidence and therefore its
usefulness in justifying a quarantine decision or a management measure. For instance, the
Bayesian approach can make use of a priori knowledge elicited from expert in order to
improve the estimate of the model parameters drawn from data. We believe that by adapting a
valid conceptual framework that applies relevant qualitative and quantitative methods that
support each other, we will be able to achieve a sound prediction of the pest economic
impacts.
Chapter 6
131
References
ACIA-CFIA, 2008. Plant Health Risk Assessment. Plant Health Risk Assessment Unit, Science Advice Division,
Ottawa, Ontario, Canada.
Baker R, Cannon R, Bartlett P, Barker IA, 2005. Novel strategies for assessing and managing the risks posed by
invasive alien species to global crop production and biodiversity. Annals of Applied Biology, 146, 177-191.
Binfield JCR, Donnelan T, Hanrahan K, Westhoff P, 2009. WTO Doha Round: impact of an Agreement on
Agriculture and the Importance of Sensitive Product Status. Paper presented at the 83rd annual conference of
the Agricultural Economics Society, 30 March–Apr. 1, Dublin, Ireland.
Biosecurity Australia, 2007. Import Risk Analysis 2007. Biosecurity Australia, Canberra, Australia.
Biosecurity New Zealand, 2006. Risk Analysis Procedures, Version 1. Biosecurity New Zealand.
Breukers A, Mourits M , van der Werf W , Oude Lansink A, 2008. Costs and benefits of controlling quarantine
diseases: a bio-economic modelling approach. Agricultural Economics 38, 137 – 149.
Busby JR, 1991. BIOCLIM - a bioclimatic analysis and prediction tool. Plant Protection Quarterly 6, 8-9.
Carrasco LR, Cook DC, Mumford JD, MacLeod A, Knight JD, Baker RHA, 2012. Towards the integration of
spread and economic impacts of biological invasions in a landscape of learning and imitating agents.
Ecological Economics 76, 95-103.
Carrasco LR, Mumford JD, MacLeod A, Harwood TD, Grabenweger G, Leach AW, Knight JD, Baker RHA,
2010. Unveiling human-assisted dispersal mechanisms in invasive alien insects: integration of spatial
stochastic simulation and phenology models. Ecological Modelling 221, 2068–2075.
DEFRA, 2005. UK Non-native organism risk assessment scheme, user manual.
EFI, 2012. European forestry institute. Accessed on 31.3.2012.
http://www.efi.int/portal/virtual_library/databases/
EFSA, 2007. Summary Report EFSA Scientific Colloquium 10, 06-07 December - Parma, Italy
EFSA, 2011. Scientific Opinion on the assessment of the risk of solanaceous pospiviroids for the EU territory
and the identification and evaluation of risk management options. Panel on Plant Health (PLH), EFSA J.
9(8), 2330.
EFSA, 2010. Guidance on a harmonised framework for pest risk assessment and the identification and evaluation
of pest risk management options by EFSA, Panel on Plant Health (PLH), EFSA Journal 8(2):1495.
EPPO, 2011. The European and Mediterranean Plant Protection Organization (EPPO) pest risk analysis (PRA)
scheme. http://archives.eppo.int/EPPOStandards/PM5_PRA/PRA_scheme_2011.doc
EPPO, 2012a. Pest risk analysis on Tomato infectious chlorosis virus. Accessed on 1.4.2012
http://www.eppo.int/QUARANTINE/Pest_Risk_Analysis/PRAdocs_virus/02-9161%20PRA%20ToC.doc
EPPO, 2012b. PRAs conducted by EPPO Expert Working Groups. Accessed on 1.4.2012.
http://www.eppo.int/QUARANTINE/Pest_Risk_Analysis/PRA_intro.htm
Eurostat, 2012. European statistics. Accessed on 1.4.2012.
http://epp.eurostat.ec.europa.eu/portal/page/portal/eurostat/home/
FADN, 2012. The Farm Accountancy Data Network. Accessed on 29.3.2012.
http://ec.europa.eu/agriculture/rica/
FAO, 1992. International Plant Protection Convention. Rome, Italy: Food and Agricultural Organisation of the
United Nations.
FAO, 1995. Phytosanitary principles for the protection of plants and the application of phytosanitary measures in
international trade, Publication No. 1. Rev. 1. FAO, Rome (IT).
FAO, 2002. The use of integrated measures in a systems approach for pest risk management, International
Standards for Phytosanitary Measures. Publication No. 14. Rev. 1. FAO, Rome (IT).
FAO, 2004. Pest Risk Analysis for Quarantine Pests Including Analysis of Environmental Risks. International
Standards for Phytosanitary Measures. Publication No. 11. Rev. 1. FAO, Rome (IT).
FAOstat, 2012. Food and Agriculture Organization of the United Nations statistics Accessed on 1.4.2012.
http://faostat.fao.org/default.aspx
Garcia-Alvarez Coque JM, Martinez-Gomez V, Villanueva M, 2009. A trade model to evaluate the impact of
trade liberalization on EU tomato imports. Spanish Journal of Agricultural Research 7, 235–247.
Gervey M, Worner SP, 2006. Prediction of global distribution of insect pest species in relation to climate by
using an ecological informatics method. Journal of Economic Entomology 93, 979-986.
Chapter 6
132
Gohin A, Guyomard H, 2000. Measuring market power to food retail activities: French evidence. Journal of
Agricultural Economics 51, 181–195.
Gracia A, De Magistris T, Casado JM, 2008. The effect of the new single farm payment in irrigated agriculture:
the case of Spain. Paper presented at 107th seminar of European Association of Agricultural Economics, Jan.
29–Feb. 1, Seville, Spain.
Guyomard H, Le Mouel C, 2003. The new banana import regime in the European Union: A quantitative
assessment. Estey Centre Journal of International Law and Trade Policy 4, 143–161.
Hirzel AH, Hirzel,LJ, Hausser LD. Chessel W, Perrin N, 2002. Ecological-niche factor analysis: how to compute
Habitat-suitability maps without absence data? Ecology 83, 2027–2036.
Hoddle M, Jetter K, Morse J, 2003. The economic impact of Scirtothrips perseae Nakahara (Thysanoptera:
Thripidae) on California avocado production. Crop Protection 22, 485-493
Hutchinson MF, Houlder D, Nix HA, McMahon P, 1996. ANUCLIM Version 1.6.
http://cres.anu.edu.au/software/anuclim.html. Canberra, CRES, ANU.
IPCC, 2012. Intergovernmental panel on climate change. Accessed on 29.3.2012. http://www.ipcc-
data.org/obs/cru_ts2_1.html
James S, Anderson K,1998. On the need for more economic assessment of quarantine policies. The Australian
Journal of Agriculture and Resource Economics 41, 425-444.
Kenis M, Petter F, Mourits M, Anderson H, Eyre D, Kehlenbeck H, 2009. Report on the gaps in key data
required to undertake PRAs. PD no. 1.4, Enhancements of Pest Risk Analysis Techniques (PRATIQUE), EU
Framework 7 Research Project.
Kottek, M., J. Grieser, C. Beck, B. Rudolf, and F. Rubel, 2006: World Map of the Köppen-Geiger climate
classification updated. Meteorol. Z., 15, 259-263. http://koeppen-geiger.vu-wien.ac.at/
Kriticos DJ, Watt MS, Potter KJB and Leriche A, 2012. Modelling growth rates of invasive alien plant species
using a climatic habitat suitability model. PLoS ONE, Submitted.
Liebhold AM, Tobin PC, 2006. Growth of newly established alien populations: comparison of North American
gypsy moth colonies with invasion theory. Population Ecology 48, 253–262
MacLeod A, Evans HF, Baker RHA, 2002. An analysis of pest risk from an Asian longhorn beetle
(Anoplophora glabripennis) to hardwood trees in the European community. Crop Protection 21, 635–64.
Macleod, A., Head, J., Gaunt, A., 2003. The assessment of the potential economic impact of Thrips palmi on
horticulture in England and the significance of a successful eradication campaign. Crop Prot. 23, 601–610.
Magarey RD et al., 2007. NAPPFAST an internet system for the weather-based mapping of plant pathogens.
Plant Disease 91, 336-345.
Magarey RD, et al. 2007. NAPPFAST an internet system for the weather-based mapping of plant pathogens.
Plant Disease 91, 336-345.
Malaga JE, Williams GW, Fuller SW, 2001. US-Mexico fresh vegetable trade: the effects of trade liberalization
and economic growth. Agricultural Economics 26, 45–55.
Mas-Colell A, Whinston MD, Green JR, 1995. Microeconomic Theory. Oxford University Press, New York.
McGill, 2012. McGill University crop database. Accessed on 31.3.2012.
http://www.geog.mcgill.ca/~nramankutty/Datasets/Datasets.html
Moro D, Sckkokai P, Soregarolic C, 2002. A partial equilibrium model of the beef and dairy sector in Italy under
imperfect competition. Paper presented at 10th congress European Association, Aug. 28–31, Zaragoza,
Spain.
NCDC, 2012. National Climatic Data Center. Accessed on 1.4.2012.
http://www.ncdc.noaa.gov/oa/mpp/freedata.html
Nix HA, 1986. A biogeographic analysis of Australian Elapid snakes. In Atlas of Australian Elapid Snakes.
Australian Flora and Fauna Series 8, ed. R. Longmore, pp. 4-15.
O'Leary RA, Low Choy S, Kynn M, Denham R, Martin T, Murray J, Mengersen K, 2008. Comparison of three
expert elicitation methods for logistic regression on predicting the presence of the threatened brush-tailed
rock-wallaby Petrogale penicillata. Environmetrics 20, 379-398
Oude Lansink A, Thijssen G, 1998. Testing among functional forms: an extension of the Generalized Box-Cox
formulation. Applied Economics 30, 1001-1010
Padilla-Bernal L., Thilmany D, 2000. Mexican-U.S. Fresh Tomato trade: An analysis of volume, prices and
transactions costs. Paper presented at the WAEA meeting, Vancouver,
Chapter 6
133
Phillips SJ, Anderson RP, Schapire RE, 2006. Maximum entropy modeling of species geographic distributions.
Ecological Modelling 190, 231-259.
Pinkard EA, Kriticos DJ, Wardlaw TJ and Carnegie AJ (2010) Estimating the spatio-temporal risk of disease
epidemics using a bioclimatic niche model. Ecological Modelling 221: 2828-2838
Rebaudo F, Dangles O, 2011. Coupled Information Diffusion–Pest Dynamics Models Predict Delayed Benefits
of Farmer Cooperation in Pest Management Programs. PLoS Computational Biology 7(10): e1002222
Requiliart V., S. Michel S., Luis V.I.X. , 2008. Imperfect competition in the fresh tomato industry. Paper
presented at 12th congress of European Association of Agricultural Economics,
Robinet C, Kehlenbeck H, Van der Werf W, 2012. A report comparing the advantages and disadvantages of
different approaches for creating a generic integrated model for pest spread and impacts. Enhancements of
Pest Risk Analysis Techniques, EU Framework 7 Research Project, PD No. D2.6
Robinet C, Van Opstal N, Baker R, Roques A, 2011. Applying a spread model to identify the entry points from
which the pine wood nematode, the vector of pine wilt disease, would spread most rapidly across Europe.
Biological Invasions 13, 2981–2995.
Roura-Pascual N, Brotons LI, Peterson AT, Thuiller W, 2009. Consensual predictions of potential distributional
areas for invasive species: a case study of Argentine ants in the Iberian Peninsula. Biological Invasions 11,
1017-1031.
Russo C, Green R, Howitt R, 2008. Estimation of supply and demand elasticities of California commodities.
Working Paper No. 08-001
Sansford C, 2002. Quantitative Versus Qualitative: Pest Risk Analysis in the UK and Europe including the
European and Mediterranean Plant Protection (EPPO) System. NAPPO International Symposium on Pest
Risk Analysis Puerto Vallarta, Mexico, 2002.
Sckokai P, Soregarolic C, 2008. Imperfect Competition in International Cereal Markets. Paper prepared for XLV
Congress SIDEA, Sep. 25–27, Portici, Italy.
Sexton RJ, Zhang M, 2001. An assessment of the impact of food industry market power on U.S. consumers.
Agribusiness 17, 59–79.
Soliman T, Mourits MCM, Oude Lansink AGJM, van der Werf W, 2010. Economic impact assessment in pest
risk analysis. Crop Protection 29, 517–524.
Soliman T, Mourits MCM, Oude Lansink AGJM, van der Werf W, 2012a. Quantitative economic impact
assessment of an invasive plant disease under uncertainty – a case study for PSTVd invasion into the
European Union. Crop Protection, under revision.
Soliman T, Mourits MCM, Oude Lansink AGJM, van der Werf W, 2012b. Economic justification for quarantine
status – the case study of Candidatus Liberibacter Solanacearum in the European Union. Plant pathology,
submitted
Soliman T, Mourits MCM, Van der Werf W, Hengeveld GM, Robinet C, Oude Lansink AGJM, 2012c.
Framework for modelling economic impacts of invasive species, applied to Pine Wood Nematode in Europe.
PLoS ONE, submitted.
Sutherst RW, Maywald GF, Kriticos DJ, 2007. CLIMEX Version 3: User's Guide. Http:www.Hearne.com.au:
Hearne Scientific Software Pty Ltd; 2007. 131pp.
Sutherst RW, Maywald GF., 1985. A computerised system for matching climates in ecology. Agriculture,
Ecosystems and Environment 13: 281–299.
Sutherst, R. W.; Maywald, G. F., and Kriticos, D. J. 2007. CLIMEX Version 3: User's Guide.
Http:www.Hearne.com.au, Hearne Scientific Software Pty Ltd; 2007. 131pp.
Tabeau A., Van Leeuwen M, 2008. Importance of CAP reforms for the Dutch Agricultural sector in 2000–2020.
Paper presented at 109th seminar of European Association of Agricultural Economics, Nov. 20–21, Viterbo,
Italy.
Vaclavik T, Meentemeyer RK, 2009. Invasive species distribution modelling (iSDM): Are absence data and
dispersal constraints needed to predict actual distribution? Ecological modelling 220, 3248-3258.
Venette RC, Kriticos DJ, Magarey R, Koch F, Baker RHA, Worner S, et al., 2010. Pest risk maps for invasive
alien species: A roadmap for improvement. Bioscience, 80:349–362.
Wittwer, G, McKirdy S, Wilson R, 2005. Regional economic impacts of a plant disease incursion using a general
equilibrium approach. Australian Agricultural and Resource Economics 49, 75–89.
WorldClim, 2012. WorldClim-global climate data. Accessed on 29.3.2012. http://www.worldclim.org/

134
135
Chapter 7
General Discussion
Chapter 7
136
7.1 Introduction
A pest risk analysis is a process that evaluates technical, scientific and economic evidence to
determine whether an organism needs to be categorized as quarantine pest and, if so, how it
should be managed. The economic impact assessments within a pest risk analysis are
currently based on a framework with qualitative questions and not on an explicit
quantification of costs (Sansford, 2002; Brunel et al., 2009). Available quantitative
methodologies to assess plant health risks, and in particular economic impacts, are currently
insufficiently applied in the assessment of plant health risks for the EU, restricting the
economic justification of plant health policies (Baker et al., 2009).
This research aimed to develop a bio-economic framework at the EU level to quantify
the economic impacts of pest invasions, by the integration of relevant knowledge on
fundamental niche, spread, and direct and indirect economic effects, while accounting for
differences in spatial resolution. The framework is applied to pests that differ in terms of the
scope of economic impacts, available information, and assessment objective, to attest its
feasibility
Chapter 2 evaluates the main available techniques for quantitative economic impact
assessment: partial budgeting, partial equilibrium analysis, input output analysis, and
computable general equilibrium analysis. These techniques differ in width of scope with
respect to market mechanisms (relationships between supply, demand, and prices), and
linkages between agriculture and other sectors of the economy. As a consequence, techniques
differ in their ability to assess direct and indirect (e.g. economy-wide) effects of pest
introduction. Chapters 3, 4 and 5 apply a bio-economic framework to three case studies:
Potato Spindle Tuber Viroid (PSTVd), Pine Wood Nematode (PWN) and Candidatus
Liberibacter Solanacearum (CLS). Each chapter adapts the bio-economic framework in a way
that addresses the objective of the study and fits the available input data. Chapter 3 assesses
the economic impacts of PSTVd into the EU in order to determine whether there is sufficient
economic evidence to justify the current phytosanitary measures against PSTVd. Chapter 4
assesses the economic impacts of PWN in order to assess the economic justification of the
expected future intensification of control measures. Chapter 5 assesses the economic impacts
of CLS in order to provide the economic justification for its quarantine status. Chapter 6
clarifies the essential data and models needed to conduct a quantitative economic impact
Chapter 7
137
assessment and compares the strengths and weaknesses of the qualitative and quantitative
approach.
Here, the main findings of the research and their implications from a broader
perspective are stated. This chapter first reviews the methodological contribution and insights,
subsequently discusses the plant health policy implications derived from the results, and then
discusses the research implications. The chapter ends with the main conclusions.
7.2 Methodological aspects
The application of economic impact assessment methods is part of the pest risk analysis that
aims to derive a correct conclusion regarding the quarantine status of an organism. Moreover
it provides satisfactory economic information to support the selection of appropriate
management measures if the pest is categorized as quarantine pest. To achieve this objective,
the bio-economic framework developed in this thesis applies techniques that can estimate the
expected economic impacts and its range. A good understanding of the characteristics (i.e.
strengths and weaknesses) of the different methods is required to select the most appropriate
one for the PRA at hand. A trade-off has to be made between capabilities of the framework to
capture the economic impacts and the resources consumed to apply the framework in the light
of the objective of the PRA.
Economic technique
After reviewing all available techniques for economic impact assessment (i.e. partial
budgeting, partial equilibrium modelling, input-output analysis (I-O) and computable general
equilibrium modelling (CGE)), it was concluded that partial budgeting and partial equilibrium
modelling are the most suitable techniques (Chapter 2). Partial budgeting is the default
method when conducting economic impact assessment. Its required data can often be obtained
at a reasonable level of accuracy, and the human resources needed to apply the method are
modest. Furthermore, results of partial budgeting evaluations provide necessary input for the
more sophisticated techniques, like partial equilibrium modelling. The use of partial
equilibrium modelling within a pest risk assessment is appropriate when the pest impacts are
expected to change prices or social welfare significantly, while not affecting other non-
Chapter 7
138
agricultural markets nor generating measurable macroeconomic changes. Partial equilibrium
modelling requires more advanced skills compared to partial budgeting. The technique is
more complex and involves modelling producer and consumer reactions to price changes,
which may result in more uncertain results, compared to partial budgeting. Partial equilibrium
modelling provides policy makers insight in the distribution of the costs of a pest invasion
across producers and consumers. It also shows whether the indirect market impacts will
increase or decrease the initial direct impact of pest invasion. These additional insights are
relevant to support policy responses, e.g. compensation policies. An economic technique like
I–O analysis or CGE modelling needs to be considered if large spill-overs to other sectors of
the economy are expected. These techniques require substantial data input and skills. The
ability of I–O analysis and CGE analyses to capture indirect impacts to the entire economy is
rarely needed in PRA since few pests have a wide economy impact (Soliman et al., 2010). In
most cases, a combination of partial budgeting and partial equilibrium modelling can provide
a sufficient scope where both direct and indirect impacts occur (Rich et al., 2005). Indirect
impacts are important in determine the conclusion of the PRA as it can mitigate or increase
the direct impact.
A quantitative approach provides a more transparent and objective assessment than a
qualitative approach (Soliman et al., 2010). This transparency can prevent the misuse of the
pest risk assessment for protectionist purposes. Moreover, the more precise evaluation of the
impacts will lead to a stronger position in trade dispute with other countries. A quantitative
approach is preferred if the expected economic impact is uncertain and when there are
sufficient resources to conduct the analysis.
A critical element that the risk analyst needs to consider is the time line of the analysis.
The economic impacts could be estimated over time and space from the start of the invasion
till a steady state situation or other arbitrary end point (Chapter 4), or only at the steady state
situation (Chapters 3 and 5). Modelling the dynamics of the economic impacts (e.g. from the
start of the invasion till the steady state) requires spread modelling, and an economic
methodology that considers the impact dynamics (e.g. net present value (NPV) for partial
budgeting or dynamic partial equilibrium modelling).
Two elements define the time line of the assessment; the pest characteristics (e.g. how
fast it can spread) and the type of the host (e.g. whether it is annual or perennial such as
woody plants). For instance, the rate of spread per year can provide an estimation of the
Chapter 7
139
expected period required by the pest to show its potential for invasion. For the non-annual
host plants case (Chapter 4), there is a possibility that the harvest impacts are accrued over the
host life cycle after the time of first invasion and therefore the time frame of the assessment
should account for this prolonged impact. The risk analyst, however, needs to account for the
increased associated uncertainty upon prolonging the time horizon.
The time lines of the spread model and the economic model should be the same.
Performed simulations of spread should cover a time period long enough to show the potential
of the pest to spread and should at the same time be short enough to have reasonable technical
processing time, and to keep uncertainties about future developments within reasonable
bounds. For instance, economic market models are not recommended to have a long time line
otherwise the resulting parameters (e.g. prices) will involve a high level of uncertainty.
Output resolution
A framework for estimating economic impacts requires input on three data layers: climate,
spread and hosts. These data layers could be integrated at a coarse or fine resolution. A fine
resolution is more relevant to risk managers as it shows a refined geographical distribution of
the expected impacts. Such insight will ensure plant health management measures that are
targeted to the places where they are most effective (Baker et al., 2005).
However, it may be difficult to get this type of detailed data for the three input data
layers, and it is costly in terms of time and money. In this thesis, one climatic variable (i.e.
temperature) was considered to reflect the suitability of environment for causing damage to
host crops. However, considering only temperature may be too simplistic as other variables
such as dry and wet stress could play a role as well (Sutherst, 1985). A more sophisticated
climatic mapping could be done through programs that model fundamental niche maps
(Venette et al., 2010). For instance, CLIMEX (Sutherst et al., 2007; Sutherst and Maywald,
1985), MaxEnt (Phillips et al., 2006), Artificial Neural Networks (Gevrey and Worner, 2006),
NAPPFAST (Magarey et el., 2007), BIOCLIM/ANUCLIM (Nix, 1986; Busby, 1991;
Hutchinson et al., 1996) and Environmental Niche Factor Analysis (Hirzel et al., 2002).
Chapter 7
140
7.3 Plant health policy implications
In Chapter 3, it is shown that assessment of direct economic consequences of PSTVd does not
result in a convincing justification of measures. However, independent of the level of direct
impacts, the cost of the measures would be economically justified if the presence of PSTVd
would result in export losses representing more than 1% of the total value of the EU exports
or market effects. The potential economic impacts of PSTVd into the European Union are
therefore demonstrably of importance if considering export losses or market effects and
questionable if not considering these impacts. Based on the precautionary principle, we
concluded that the current measures against PSTVd are economically justified.
In Chapter 4, the economic assessment demonstrates that an uncontrolled PWN invasion
will lead to large economic consequences for the conifer forestry industry in the EU. A PWN
invasion from the current point of entry in Portugal is expected to affect 10.6% of the studied
EU area by 2030 leading to cumulated wood loss of €22 billion, representing 3.2% of the total
value of PWN susceptible coniferous trees in the EU.
In Chapter 5, economic impact assessment shows that CLS may have a significant
impact on potato and tomato of 222 M€ per annum. Uncertainty analysis showed a wide
boundaries of 192 - 512 M€ (5-95 percentile). The economic impact assessment suggests the
pest is a ‘major’ risk and therefore needs to be regulated.
The current quarantine lists (i.e. EPPO A1/A2 list and Council Directive 2000/29/EC)
include many organisms which are listed in the past based on a qualitative assessment only. In
addition, the agro-ecological, cultural and economic aspects are changing over time, thereby
changing the risk posed by a quarantine pest. Therefore, the listed quarantine pests should be
revaluated, e.g. using the quantitative approach developed in this thesis to verify whether they
still pose an unacceptable risk. Cleaning the quarantine list will help concentrating the
available resources to pests that pose realistic risks and will increase the acceptance of
measures by stakeholders.
Economic impact assessment at the EU scale can be used to show how the impacts are
geographically distributed between countries and how they are distributed among, and within,
producers and consumers. For instance, distribution of impacts within producers could be
shown among large and small producers while distribution of impacts within consumers could
Chapter 7
141
be shown among high and low income consumers. This information could improve plant
health management (e.g. compensation policies).
Although the objective of the bio-economic framework developed in this thesis was to
assess the economic impact of invasive plant pests in the European Union, it is still possible to
apply the framework to other continents (e.g. South America) or supra-national regions (e.g.
Middle east region). This will result in more uniform quantitative impact assessment practices
across the globe. However, the main issue that may arise is the data availability such as
climate, spread and host distribution for these continents and regions.
7.4 Research implications
This thesis modelled the economic impacts of pest invasion. A partial budgeting technique
was used to estimate the direct impacts. Subsequently, partial equilibrium modelling was used
to estimate total impact including indirect impacts. Although partial equilibrium modelling is
an adequate technique to model the market impacts, its results rely on the assumption of
perfect competition for the host crop market. Therefore, if there is evidence that the market
structure of the host crop is not perfectly competitive, the PE technique should properly
account for the differences in market power across food supply chain (e.g. farmers, processors
and retailers) by assuming the proper market structure (e,g, oligopoly).
Modelling the dynamics of economic impacts is one of the most complex areas in risk
assessment. This complexity arises from necessity to account for the feedback mechanisms
between pest spread, economic impacts and control efforts executed by producers (Finnoff et
al., 2005). For instance, farmer’s behaviour towards disease spread and the political and
institutional environment of the invaded territory could influence the degree of social
acceptability and technical feasibility of disease control measures and programmes. In
addition, further challenges are encountered when assessing the economic impacts because
the vulnerability of the agroecosystem (i.e. host, climate, cultural practices) to the invasion is
changing over time. However, including such dynamic factors into an economic impact
assessment framework would result in an explosion of data needs as well as model
complexity.
Chapter 7
142
7.5 Main conclusions
The key findings of the thesis are, first, that partial budgeting and partial equilibrium
modelling are the methods of choice when assessing the economic impacts of pest invasion
(Chapter 2). Second, a fine resolution analysis is relevant to risk managers as it shows a
refined geographical distribution of the expected impacts, while a coarse level analysis may
be sufficient for determining whether an organism classifies as a quarantine organism
(Chapter 4). Third, the potential economic impacts of potato spindle tuber viroid into the
European Union are demonstrably of importance when considering market effects or export
losses and questionable if only accounting for the direct losses (Chapter 3). Fourth, pine wood
nematode has large economic consequences for the conifer forestry industry in the EU, and
therefore justifies the potential intensification of the current control measures (Chapter 4).
Fifth, Candidatus Liberibacter Solanacearum is considered of a ‘major’ economic impact to
the European Union, and is recommended to be added to the quarantine list (Chapter 5). A
quantitative approach is preferred if the expected economic impact is uncertain when based on
qualitative approach, and when there are sufficient resources to conduct the analysis (Chapter
6). The economic impact assessment framework developed in this thesis shows that it is
possible to quantify the direct and indirect impacts at various levels of detail, in terms of
output resolution and scope of economic impacts, given the common available data, time and
skills. Application of this framework can enhance the policy and decision making by
governments and international bodies on managing plant health risks.
Chapter 7
143
References
Baker R, Cannon R A Y, Bartlett P and Barker I A N., 2005. Novel strategies for assessing and managing the
risks posed by invasive alien species to global crop production and biodiversity. Annals of Applied Biology,
146:177-191.
Baker RHA, Battisti A, Bremmer J et al., 2009. PRATIQUE: a research project to enhance pest risk analysis
techniques in the European Union. EPPO Bulletin 39, 87–93.
Busby JR, 1991. BIOCLIM - a bioclimatic analysis and prediction tool. Plant Protection Quarterly 6, 8-9.
Finnoff D, Shogren J F, Leung B, Lodge D, 2005. The importance of bioeconomic feedback in invasive species
management. Ecological Economics, 52, 367-381.
Gervey M, Worner SP, 2006. Prediction of global distribution of insect pest species in relation to climate by
using an ecological informatics method. Journal of Economic Entomology 93, 979-986.
Hirzel AH, Hirzel,LJ, Hausser LD. Chessel W, Perrin N, 2002. Ecological-niche factor analysis: how to compute
Habitat-suitability maps without absence data? Ecology 83, 2027–2036.
Hutchinson MF, Houlder D, Nix HA, McMahon P, 1996. ANUCLIM Version 1.6.
http://cres.anu.edu.au/software/anuclim.html. Canberra, CRES, ANU.
Macleod A, Head J, Gaunt A, 2003. The assessment of the potential economic impact of Thrips palmi on
horticulture in England and the significance of a successful eradication campaign. Crop Protection 23, 601–
610.
Magarey RD, et al. 2007. NAPPFAST an internet system for the weather-based mapping of plant pathogens.
Plant Disease 91, 336-345.
Nix HA, 1986. A biogeographic analysis of Australian Elapid snakes. In Atlas of Australian Elapid Snakes.
Australian Flora and Fauna Series 8, ed. R. Longmore, pp. 4-15.
Phillips SJ, Anderson RP, Schapire RE, 2006. Maximum entropy modeling of species geographic distributions.
Ecological Modelling 190, 231-259.
Rich, K.M., Miller, G.Y., Winter-Nilson, A., 2005. A review of economic tools for the assessment of animal
disease outbreaks. Revue Scientifique et Technique de l’Office International des Epizooties 24, 833–845.
Soliman T., Mourits M.C.M., Oude Lansink A.G.J.M., van der Werf W., 2010. Economic impact assessment in
pest risk analysis, Crop Prot. 29, 517–524.
Sutherst RW, Maywald GF., 1985. A computerised system for matching climates in ecology. Agriculture,
Ecosystems and Environment 13: 281–299.
Sutherst, R. W.; Maywald, G. F., and Kriticos, D. J. 2007. CLIMEX Version 3: User's Guide.
Http:www.Hearne.com.au, Hearne Scientific Software Pty Ltd; 2007. 131pp.
Venette RC, Kriticos DJ, Magarey R, Koch F, Baker RHA, Worner S, et al., 2010. Pest risk maps for invasive
alien species: A roadmap for improvement. Bioscience, 80:349–362.
Wittwer, G., McKirdy, S., Wilson, R., 2005. Regional economic impacts of a plant disease incursion using a
general equilibrium approach. Australian Journal of Agricultural and Resource Economics 49, 75–89.

144
Summary
145
Summary
According to the International Plant Protection Convention (IPPC) and the Agreement on the
Application of Sanitary and Phytosanitary measures (SPS Agreement) of the World Trade
Organization (WTO), phytosanitary measures should be economically justifiable. The
economic impact assessments within a pest risk analysis are currently based on a framework
with qualitative questions and not on an explicit quantification of costs (Sansford, 2002;
Brunel et al., 2009). Available quantitative methodologies to assess plant health risks, and in
particular economic impacts, are currently hardly applied in the assessment of plant health
risks for the EU, restricting the economic justification of plant health policies.
This research aimed to develop a bio-economic framework at the EU level to quantify
the economic impacts of pest invasions, by the integration of relevant knowledge on
fundamental niche, spread, and direct and indirect economic effects, while accounting for
differences in spatial resolution. The framework is applied to pests that differ in terms of the
scope of economic impacts, available information, and assessment objective, to attest its
feasibility.
Chapter 2 evaluates the main available techniques for quantitative economic impact
assessment: partial budgeting, partial equilibrium analysis, input output analysis, and
computable general equilibrium analysis. These techniques differ in width of scope with
respect to market mechanisms (relationships between supply, demand, and prices), and
linkages between agriculture and other sectors of the economy. As a consequence, techniques
differ in their ability to assess direct and indirect (e.g. economy-wide) effects of pest
introduction. An overview of traits of the available methods is provided to support the
selection of the most appropriate technique for conducting a PRA. It was concluded that
partial budgeting and partial equilibrium modelling are the most suitable techniques. Partial
budgeting is the default method when conducting economic impact assessment. Its required
data can often be obtained at a reasonable level of accuracy, and the human resources needed
to apply the method are modest. Furthermore, results of partial budgeting evaluations provide
necessary input for the more sophisticated techniques, like partial equilibrium modelling. The
use of partial equilibrium modelling within a pest risk assessment is appropriate when the pest
impacts are expected to change prices or social welfare significantly, while not affecting other
non-agricultural markets nor generating measurable macroeconomic changes. Partial
equilibrium modelling requires some advanced skills comparing to partial budgeting. The
Summary
146
technique is more complex and involves modelling producer and consumer reactions to price
changes, which may resulted in more uncertain results, compared to partial budgeting. Partial
equilibrium modelling provides policy makers insight in the distribution of the costs of a pest
invasion across producers and consumers. It also shows whether the indirect market impacts
will increase or decrease the initial direct impact of pest invasion. These additional insights
are relevant to support policy responses, e.g. compensation policies.
Chapter 3 assesses the economic impacts posed by Potato Spindle Tuber Viroid
(PSTVd) in the EU. These estimated impacts are compared with the costs of the current
phytosanitary measures in order to verify if the measures are economically justified. The bio-
economic framework integrates a potential pest spread model elicited from experts and an
economic model to quantify the resulting impacts. The assessment of direct costs of a PSTVd
outbreak, with current knowledge and uncertainty, suggests that the costs of the measures and
their benefit (€5.6 M/year) are of the same order of magnitude. Therefore, an assessment of
direct economic consequences does not result in a convincing justification of measures. The
total economic impact, considering price changes and higher costs for consumers, was
estimated at 4.4 M€ for potatoes and 5.7 M€ for tomatoes. Consumers bore 92% of the total
costs of invasion in the case of potato and 77% in the case of tomato. If the presence of
PSTVd would imply export restrictions, resulting in an annual loss of more than 1% of the
total EU export value of potatoes and tomatoes, the cost of current phytosanitary measures
would also be justified. The potential economic impacts of PSTVd into the European Union
are therefore demonstrably of importance when considering market effects or export losses
but questionable if only accounting for the direct losses. The large degree of uncertainty in the
prevalence of disease contributes to the justifiability of measures based on the precautionary
principle.
Chapter 4 estimates the dynamics of economic impacts over time due to the expected
spread of Pine Wood Nematode (PWN) in the EU. The bio-economic framework integrates a
biological invasion spread and economic models. The results of this economic assessment
demonstrate that an uncontrolled PWN invasion will lead to large economic consequences for
the conifer forestry industry in the EU. A PWN invasion from the current point of entry in
Portugal is expected to affect 10.6% of the studied EU area by 2030 leading to cumulated
wood loss of €22 billion, representing 3.2% of the total value of PWN susceptible coniferous
trees in the EU. The economic impact assessment identifies Portugal, Spain, North West Italy
and France (i.e. Languedoc-Roussillon, Bourgogne, Poitou-Charentes, Aquitaine, Midi-
Summary
147
Pyrenees, Limousin, Rhone-Alpes, Provence-Alpes Cote d'Azur and the Auvergne) as
endangered area. Of these French regions, Aquitaine is predicted to have the highest impacts
because of the presence of dense coniferous forests. Expected future intensification of control
measures are economically justified.
Chapter 5 assesses the economic impacts posed by Candidatus Liberibacter
Solanacearum (CLS) in the EU in order to economically justify a decision on the pest
quarantine status. The bio-economic framework is based on potential pest spread model
elicited from experts and a quantitative economic model. Economic impact assessment
showed that at the most likely infestation level CLS may have a significant direct impact on
potato and tomato producers of 222 M€ per annum. Uncertainty analysis showed wide
boundaries of 192 - 512 M€ (5-95 percentile). The expected negative impact on societal
welfare at the most likely infestation level is less than the estimated direct impacts, viz. 114
million euros per year. The potential economic impacts of CLS into the European Union are
demonstrably of major importance. Therefore, a decision to categorize CLS as a quarantine
pest is supported..
Chapter 6 clarifies the essential data and models needed to conduct a quantitative
economic impact assessment and compares the strengths and weaknesses of the qualitative
and quantitative approach and presents the implications for PRA-practitioners. Whilst the
qualitative approach may be adequate in many instances, it may lack transparency and
demonstrable objectivity. A quantitative approach for economic impact assessment may
improve transparency and strengthen the justification for measures, if taken, but requires
additional work, and it requires specific data and models. It is concluded that a quantitative
approach is preferable if the expected economic impact is ambiguous when using a qualitative
approach, and when there are sufficient resources to conduct the analysis.

148
Samenvatting (Summary in Dutch)
149
Samenvatting (Summary in Dutch)
Volgens de richtlijnen van de International Plant Protection Convention (IPPC) en de
Agreement on the Application of Sanitary and Phytosanitary measures (SPS-overeenkomst)
van de World Trade Organization (WTO), dienen fytosanitaire maatregelen enkel toegepast te
worden indien ze economisch verantwoord zijn. Binnen de huidige pest risico analyses is de
evaluatie van de economische gevolgen voornamelijk gebaseerd op een kader met
kwalitatieve vragen en niet op een expliciete kwantificering ervan (Sansford, 2002; Brunel et
al., 2009). Beschikbare kwantitatieve methodieken ter beoordeling van plantenziekterisico's,
en met name de economische gevolgen, worden momenteel nauwelijks toegepast bij de
beoordeling van de fytosanitaire risico's voor de EU, hetgeen de economische rechtvaardiging
van het toegepaste plantgezondheidsbeleid beperkt.
Dit onderzoek is gericht op de ontwikkeling van een bio-economisch kader om op EU-
niveau de economische gevolgen van pest invasies te kwantificeren. Een dergelijk kader
vereist een integratie op ruimtelijk niveau van relevante kennis omtrent de pest op het gebied
van de fundamentele niche, de verspreiding en de economische effecten. Om de haalbaarheid
van een dergelijk kwantitatieve integratie te bepalen, is het kader toegepast in een drietal
risicoanalyses die onderling verschillen in termen van de beschikbaarheid van relevante
invoergegevens, de gestelde doelfunctie en dekking van economische impacts.
In hoofdstuk 2 zijn de beschikbare kwantitatieve analyse technieken nader geëvalueerd
om te komen tot de selectie van de meest geschikte techniek ter bepaling van de economische
gevolgen van een pest-invasie. De geëvalueerde technieken bestaan uit de partial budgeting
techniek, de partial equilibrium analyse, de input-output analyse en de computable general
equilibrium analyse. Deze technieken verschillen in de mate waarin rekening kan worden
gehouden met veranderingen in de marktmechanismen (relaties tussen aanbod, vraag en
marktprijzen), en eventuele verbanden tussen landbouw en andere sectoren van de economie.
Dientengevolge verschillen de technieken in hun vermogen om de directe (o.a.
productieverliezen) en indirecte (o.a. prijswijzigingen) effecten van een pestintroductie te
evalueren. Geconcludeerd wordt dat de partial budgeting methode en de partial equilibrium
analyse de meest geschikte technieken zijn. Partial budgeting is daarbij de basale techniek die
standaard bij elke economische analyse toegepast kan worden om de directe kosten van een
invasie te berekenen. De toepassing vereist invoergegevens die vaak op een redelijk niveau
van nauwkeurigheid te verkregen zijn, terwijl de benodigde personele middelen beperkt zijn.
150
Daarnaast leveren de resultaten van de partial budgeting evaluaties, de benodigde input op
voor de meer geavanceerde technieken, zoals de partial equilibrium modellering.
Het gebruik van de partial equilibrium modellering binnen een pest risico assessment is
geschikt wanneer verwacht wordt dat de pestinvasie resulteert in aanzienlijke wijzigingen in
marktprijzen of economische welvaart, zonder daarbij een invloed te hebben op andere niet-
agrarische markten of te resulteren in meetbare macro-economische veranderingen. De partial
equilibrium techniek omvat de modellering van de reacties van producenten en consumenten
op prijswijzigingen, hetgeen - vergelijken met partial budgetting – kan resulteren in meer
onzekere resultaten (= grotere spreiding in de resultaten). Partial equilibrium modellering
biedt beleidsmakers inzicht in de verdeling van de kosten van een pestinvasie over de
betrokken producenten en consumenten. Het toont ook of de indirecte markteffecten de
directe kosten van de pest invasie zullen vergroten of verkleinen. Deze aanvullende inzichten
zijn relevant voor beleidsvorming, zoals bijvoorbeeld bij de ontwikkeling van een
compensatie beleid.
Hoofdstuk 3 beoordeelt de economische gevolgen van een niet-gereguleerde Potato
Spindle Tuber viroid (PSTVd) uitbraak in de EU. De geschatte economische impact wordt
vergeleken met de kosten van de huidige fytosanitaire maatregelen, om na te gaan of deze
maatregelen economisch gerechtvaardigd zijn. Door het ontbreken van relevante
verspreidingsgegevens, is de verspreiding binnen de EU gebaseerd op de verwachtingen van
experts. Gegeven de onzekerheid omtrent de verwachte verspreiding, lijken de directe kosten
van een PSTVd-uitbraak van dezelfde orde van grootte te zijn als de kosten van de huidige
maatregelen (€5,6 miljoen/jaar). De evaluatie van de directe economische gevolgen leidt
zodoende niet tot een overtuigende rechtvaardiging van de huidige maatregelen. De totale
directe en indirecte kosten worden geschat op 4.4 M€ in de aardappelketen en 5.7 M€ in de
tomatenketen, hetgeen de huidige fytosanitaire kosten wel overtreft. Consumenten dragen
92% van deze totale kosten in het geval van aardappelen en 77% in het geval van tomaten.
Daarnaast zijn de kosten van de maatregelen economisch gerechtvaardigd indien de
aanwezigheid van PSTVd, onafhankelijk van het niveau van de directe effecten, resulteert in
exportverliezen van meer dan 1% van de totale waarde van de uitvoer uit de EU. De
potentiële, economische impact van PSTVd in de Europese Unie is daarom van aantoonbaar
belang indien rekening gehouden wordt met de marktgevolgen of mogelijke exportverliezen,
maar van twijfelachtig belang indien deze gevolgen niet in ogenschouw worden genomen. Op
Samenvatting (Summary in Dutch)
151
basis van het voorzorgsbeginsel, concluderen we dat de huidige fytosanitaire maatregelen
tegen PSTVd economisch gerechtvaardigd zijn.
Hoofdstuk 4 schat de dynamiek van de economische effecten gerelateerd aan de
verwachte verspreiding van het Pine Wood Nematode (PWN) dennenaaltje in de EU. In deze
analyse wordt op ruimtelijk niveau de output van een stochastisch verspreidingsmodel
geïntegreerd met de partial budgeting en partial equilibrium modellen, ter berekening van de
directe en indirecte gevolgen. De resultaten tonen aan dat een ongecontroleerde PWN invasie
zal leiden tot grote economische gevolgen voor de conifeer houtverwerkende industrie in de
EU. Zonder regulering zal het aaltje vanuit de huidig geïnfecteerde locaties in Portugal naar
verwachting in 2030 zodanig verspreid zijn dat het de houtopbrengst in 10,6% van het EU
gebied zal beïnvloeden. T.a.v. het geanalyseerde tijdsbestek komt dit overeen met een
gecumuleerd houtverlies van €22 miljard, hetgeen 3,2% van de totale waarde van PWN
gevoelige coniferen in de EU vertegenwoordigt. De economische assessment identificeert
Portugal, Spanje, Noord West Italië en Frankrijk (d.w.z. Bourgogne, Languedoc-Roussillon,
Poitou-Charentes, Aquitaine, Midi-Pyrenees, Limousin, Rhone-Alpes, Provence-Alpes-Cote
d'Azur en de Auvergne) als het bedreigde gebied. Van alle Franse regio’s, zijn de
economische gevolgen het grootst voor Aquitanië vanwege de aanwezige, hoge dichtheid aan
naaldbossen. Op basis van de uitgevoerde analyse wordt geconcludeerd dat de verwachte,
toekomstige intensivering van controle maatregelen gericht tegen PWN economisch
gerechtvaardigd zijn.
Hoofdstuk 5 beoordeelt de economische effecten van de pest Candidatus Liberibacter
Solanacearum (CLS) in de EU, om een eventueel besluit omtrent zijn quarantainestatus
economisch te rechtvaardigen. Inschattingen voor de verspreiding van de pest binnen de EU
zijn verkregen van experts. Uitgaande van het meest waarschijnlijke besmettingsniveau,
resulteert een introductie en verspreiding van CLS in de EU, in aanzienlijke directe
economische gevolgen voor de aardappel- en tomatenproducenten van zo’n € 222 miljoen per
jaar. Gevoeligheidsanalyses tonen een grote spreiding in de directe kosten, variërend van zo’n
€192 tot €512 miljoen per jaar (5-95-percentiel). De totale economische impact ofwel de
verwachte negatieve impact op de maatschappelijke welvaart van €114 miljoen euro per jaar
ligt uiteindelijk lager dan de geschatte directe impact. De potentiële economische impact van
CLS in de Europese Unie is aantoonbaar van groot belang, hetgeen een besluit om CLS te
categoriseren als een quarantaine pest ondersteunt.
152
Hoofdstuk 6 verduidelijkt de benodigde gegevens en modellen voor het uitvoeren van
een kwantitatieve economische assessment, vergelijkt de sterke en zwakke punten van de
kwalitatieve en kwantitatieve benadering en presenteert de implicaties voor PRA-analisten.
Hoewel de kwalitatieve benadering van de economische gevolgen in veel gevallen voldoende
kan zijn kan, mist het transparantie en aantoonbare objectiviteit. Een kwantitatieve benadering
van de economische gevolgen op basis van het ontwikkelde kader kan de transparantie
verbeteren en de rechtvaardiging van genomen maatregelen versterken, maar vereist meer
vaardigheden en specifieke gegevens en modellen. Een kwantitatieve benadering is zodoende
met name wenselijk in situaties waarin de verwachte economische impact op basis van een
kwalitatieve analyse niet eenduidig is (o.a. bij de evaluatie van controle alternatieven) en er
voldoende middelen aanwezig zijn.
Publications
153
Publications
Peer-reviewed publications
Soliman T., Mourits M.C.M., Oude Lansink A.G.J.M., van der Werf W., 2012. Quantitative
economic impact assessment of an invasive plant disease under uncertainty – a case
study for PSTVd invasion into the European Union, Crop Protection 40, 28-35.
Soliman T., Mourits M.C.M., Oude Lansink A.G.J.M., van der Werf W., 2010. Economic
impact assessment in pest risk analysis, Crop Protection 29, 517–524.
Other Scientific publications
Baker RHA, Benninga J, Bremmer J, Brunel S, Dupin M, Eyre D, Ilieva Z, Jarošík ,
Kehlenbeck H, Kriticos DJ, Makowski D, Pergl J, Reynaud P, Robinet C, Soliman T,
van der Werf W, Worner S., 2012. A decision support scheme for mapping endangered
areas in pest risk analysis. EPPO Bulletin/Bulletin OEPP 42, 65–73.

154
About the author
155
About the author
Tarek Soliman was born on December 21st 1979 in Cairo, Egypt. He accomplished his high
school in the scientific specialization in 1997. In the same year, he started his bachelor degree
at Cairo University with a specialization in ‘Economics’. He graduated from Cairo University
in 2001. After graduation, he worked at the Egyptian-American Bank till 2004. In 2004, he
was granted a scholarship by the International Centre for Advanced Mediterranean
Agronomic Studies (CIHEAM) to study a Master of Science program in Agricultural
Economics at the Mediterranean Agronomic Institute of Chania (MAICh) in Crete, Greece.
The M.Sc. thesis has been elaborated within the framework of the EU-funded project “Market
and Trade Policies for Mediterranean Agriculture: The case of fruit, vegetable and olive oil
(MEDFROL)”. In 2006, he obtained his Master of Science degree with distinction. From
September 2006 till June 2007, Tarek was working at Credit Agricole Bank in Egypt. In 2007,
Tarek was awarded a scholarship for the Ph.D. program in economics at CERGE-EI, Charles
University of Prague in Czech Republic, where he attended the course work of the American
style Ph.D. program. In May 2008, he was accepted for an (AIO) Ph.D. position at
Wageningen University. From May 2008 until May 2012, he was working on his Ph.D. thesis
entitled “Economic impact assessment of invasive plant pests in the European Union”. The
Ph.D. thesis has been elaborated within the framework of the EU-funded project
“Enhancement of Pest Risk Analysis Techniques (PRATIQUE)”. During his Ph.D. program,
Tarek provided an ad-hoc consultancy and advisory work to the European and Mediterranean
Plant Protection Organization (EPPO) in Paris, France. In addition, he was awarded a
scholarship to attend an intensive entrepreneurship course at University of Wisconsin in USA.
eMail: [email protected]

156
About the author
157
Tarek Soliman
PhD candidate, Wageningen School of Social Sciences (WASS)
Completed Training and Supervision Plan
Name of the activity Department/Institute Year ECTS*
Project related competences
Agri-food Industrial Organisation BEC, WUR 2008 4
Advanced Industrial Organization
(Empirical)
The Netherlands network of
Economics (NAKE)
2011 3
Advanced Econometrics AEP 50806 WUR 2009 6
Nonparametric Static Approaches WASS 2008 4
Dynamic Efficiency Approaches WASS 2008 1.5
The Bayesian Approach in theory &
practice
WASS 2008 1.5
Plant pathogens, Insects and Weeds I PE&RC 2009 3
Pest Risk Analysis European and Mediterranean plant
protection organization (EPPO),
Cyprus
2008 1.5
Integrated Assessment of Agriculture and
Sustainable Development (SEAMLESS)
Wageningen Centre for
Agroecology and Systems
Analysis (WaCASA)
2008 1.5
General research related competences
Introduction course WASS 2009 1
Academic writing II Wageningen University 2010 1.5
PhD discussion Group BEC, WUR 2008-2012 4
Using voice in presentations WUR 2011 1
Economic impact assessment of pine wood
nematode in the EU
EAAE congress, Switzerland 2011 1
Quantitative economic impact assessment
model of pest invasion
PRATIQUE conference on pest
risk analysis (PRA), UK
2011 1
Economic impact assessment of PSTVd in
the EU
19th Meeting of the Expert Panel
on PRA Development, France
2010 1
Career related competences/personal development
Entrepreneurship Boot camp University of Wisconsin, USA 2009 3
Total (minimum 30 ECTS) 39.5
*One ECTS on average is equivalent to 28 hours of course work
158
Colophon
The research described in this thesis was financially supported by the EU project PRATIQUE,
KBBE-2007-212459 (FP7 Project, Enhancements of pest risk analysis techniques;
https://secure.fera.defra.gov.uk/pratique/)