Embed Size (px)
Citation preview

113
CHAPTER- 4
ECONOMIC IMPACT ASSESSMENT
ON SHG MEMBERS
4.1 Introduction
4.2 Impact Assessment (IA) Methodologies for Microfinance
4.3 Economic Impact on SHG Members
4.4 Summary of Findings
4.5. Conclusion
114
Chapter-4
Economic Impact Assessment on SHG Members
4.1. Introduction
Poverty reduction has been the main agenda of most developing countries.
As a measure of reducing poverty, most of the developing countries have
adopted the system of empowering the individual to be self-reliant. To help
the individuals become self-reliant, Non-Governmental Organizations
(NGOs) lent them some amount of capital to start some income generating
activities so that they can come out from poverty. On the contrary, it is
equally important to constantly monitor the potential negative impacts,
such as over-indebtedness of clients or risk of corruption and illegal use of
credit. At the same time, it is to be understood that microfinance is not the
solution to all problems in developing countries, but should be focused on
economically active poor, who can afford to borrow and repay money as
part of their normal budget and who are not living in an emergency
situation.
NGOs being non-profit organizations with an objective of social
development have been an important player as facilitator or intermediary in
microfinance movement in India. NGO-MFIs play significant roles in
115
supporting and nurturing SHGs by not only extending credit or other
financial services to SHGs but also in many other ways. This chapter
describes about research findings on economic impact on SHG members.
4.2. Impact Assessment (IA) Methodologies for Microfinance
Impact Assessment is the structured study, which measures the impact on
employment, income generation, nutrition, education, health, consumption,
business development (micro entrepreneurship) and gender equity on
MFI‟s clients.41
Impact assessment refers to the assessment of “how
financial products and services affected the lives of the poor. It is also the
measurement of income growth, assets growth and vulnerability reduction
of the poor by the microfinance programme. The indicators for such
assessment are not limited to economic development but extended to
development growth like health, education, empowerment, gender etc.
Impact assessment can be done through using qualitative as well as
quantitative data. The qualitative data are collected using the tools like
Participatory Rural Assessment (PRA), Rapid Rural Appraisal (RRA),
personal discussions, observations etc. Qualitative impact assessment
provides a broad idea, mostly open-ended, on the impact of microfinance
41
Debadutta K . Panda (2009), “ Understanding Microfinance”, Wiley India

116
programmes. The quantitative data collection tools are the schedule and
structured questionnaires for household survey. Data from secondary
sources complement the primary data. Quantitative impact assessment
requires various mathematical, statistical and econometric models for
analysis of data. In many microfinance programmes, both qualitative and
quantitative methods are jointly used for overall impact assessment.
Different levels and methodologies of impact assessment of microfinance
are briefly discussed here in this section.
4.2.1. AIMS’s Core Impact Assessment Method
According to Dunn (2002)42
, Impact Assessment (IA) for microfinance can
be carried out at three different level i.e. household level, enterprise level
and individual level.
Fig.4.1. Impact of microfinance in different levels43
42
Dunn, E. (2002). “Research Strategy for the AIMS Core Impact Assessment”, AIMS, ,
University of Manchester
Impact of
Micro-finance
Household Level
Individual Level Enterprise Level

117
Household Level: The impact assessment programmes should capture the
changes in the household level due to microfinance programme. The
household economic positions like income, expenditure, asset position and
livelihood portfolio may change over time due to the increase in access by
households to microfinance products and services. The socio-psycho
changes can be experienced at the household level due to reasons such as
increase in the level of household income, greater diversification in the
sources of household income, increase in household assets including
improvements in housing, increase in major household appliances and
transport vehicles, increase in microenterprise fixed assets, increase in
expenditures on children‟s education, increase in expenditures on food
especially among the very poor and increase in the household‟s
effectiveness in coping with shocks.
Individual Level: In general, effective microfinance programmes bring a
positive change in individual level. It develops managerial ability among
the beneficiaries and increases status and position not only in the society
but also in the house/family. The increase in capacity development due to
microfinance programmes leads to a change in individual income level,
43
Cohen, M. and Bourjorjee, D. (2003), “Impact of Microfinance”, Donor Brief No. 13, CGAP,
Washington, D.C.
118
expenditure pattern, living condition, literacy position, awareness,
accessibility, equity and equality to the household and community assets.
The programme results to increase in the client‟s control over resources
and income within the household economic portfolio, increase in self-
esteem and respect from others, increase in personal savings, gives better
position to deal with the future through more proactive behavior and
increase in confidence level.
Enterprise Level: Microfinance programmes influence microenterprise
operations i.e. change in profits, scale of operations, diversifications and
leads to increase in microenterprise revenue, increase in enterprise fixed
assets especially among repeat borrowers, increase in the paid and unpaid
employment generated by the enterprise and improvements in the
transactional relationships of the enterprise
4.2.2. Impact Assessment Method: Before and After Intervention
Under this method, the status of the sample units (person/household/village
etc) before microfinance intervention is compared with that of the after
microfinance intervention; taking the various parameters or variables. This
method is good for assessment of the actual impact; but this method has a
limitation. It becomes difficult to get the data (related to various variables)
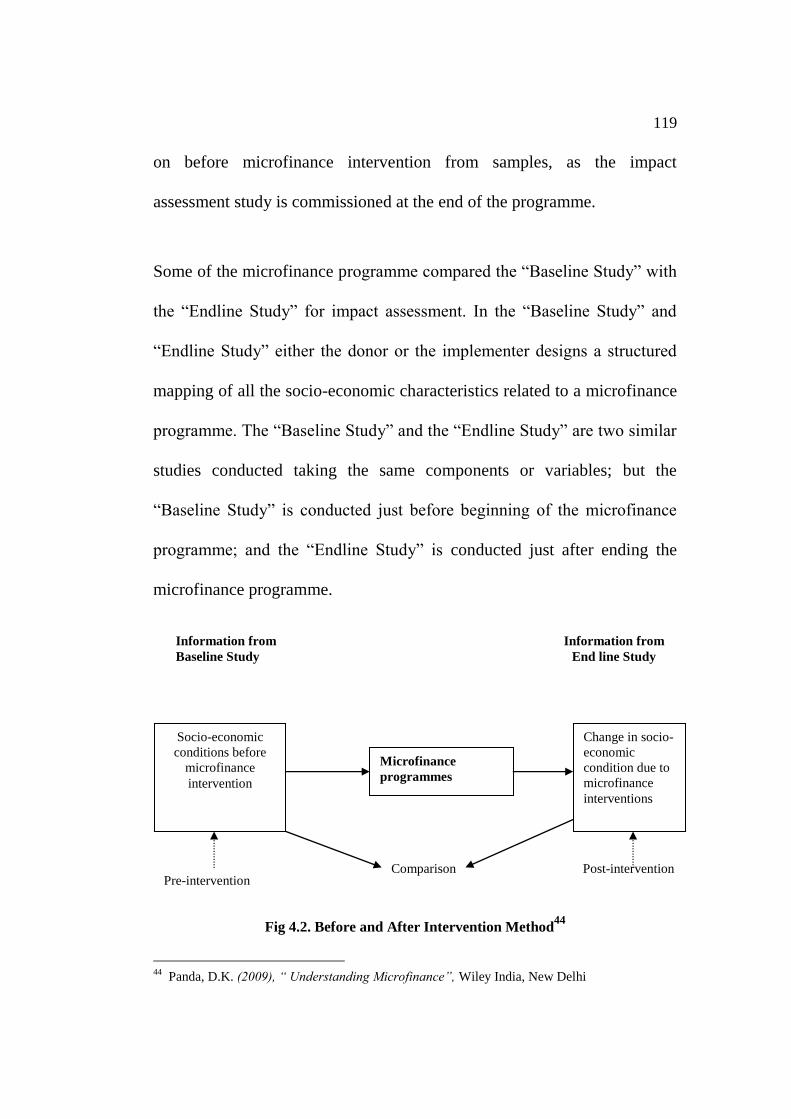
119
on before microfinance intervention from samples, as the impact
assessment study is commissioned at the end of the programme.
Some of the microfinance programme compared the “Baseline Study” with
the “Endline Study” for impact assessment. In the “Baseline Study” and
“Endline Study” either the donor or the implementer designs a structured
mapping of all the socio-economic characteristics related to a microfinance
programme. The “Baseline Study” and the “Endline Study” are two similar
studies conducted taking the same components or variables; but the
“Baseline Study” is conducted just before beginning of the microfinance
programme; and the “Endline Study” is conducted just after ending the
microfinance programme.
Fig 4.2. Before and After Intervention Method
44
44
Panda, D.K. (2009), “ Understanding Microfinance”, Wiley India, New Delhi
Socio-economic
conditions before
microfinance
intervention
Change in socio-
economic
condition due to
microfinance
interventions
Microfinance
programmes
Comparison Pre-intervention
Post-intervention
Information from
Baseline Study
Information from
End line Study
120
Barnes, Morris and Gaile (1998)45
have taken following broad four
parameters for their baseline study in Uganda i.e. 1) improvements in the
economic welfare of households; 2) enterprise growth or stability; 3)
increases in empowerment, especially among women; and 4) strengthened
social and rural networks.
Cohen and Chen (1997)46
explained their framework for core hypothesis
for measuring impact of microfinance at individual level. The framework
was based on following broad parameters: material change (income,
earning capacity, resources control, basic needs etc), cognitive change
(knowledge, skills, and awareness), perceptual change (self esteem, self
confidence, future vision, respect), relational change (decision making,
bargaining power, participation, self reliance, organizational strength)
4.3. Economic impact on SHG Members
Microfinance movement is comparatively new in the state of Manipur. But,
it is becoming popular in the rural areas of the State. Formation of SHGs
has become a movement in rural areas. It was found that microfinance
45
Barnes, C., Morris, G. and Gaile, G. (1998), “An assessment of impact of microfinance services
in Uganda, Basline findings”, AIMS, USAIDS, Washington, D.C.
46
Cohen, M. and Chen,M.A. (1997), “A Guide for assessing the microenterprise services at the
individual level”‟ AIMS, USAID, Washington, D.C.
121
activities of NGO-MFIs had direct impact on economic status of most of
the SHG members in terms of personal income, household income,
household assets, household expenditure, household saving, access to
credit and micro insurance products etc. The researcher used the recall
method for getting information related to economic activities before and
after joining the microfinance programme. To minimize the response bias,
cross questions were asked for verification and consistency of the answers
given by the respondents. Pair-t test was used to analyze the impact of
microfinance by comparing pre and post situations. Since most of the SHG
members did not avail any benefits from other programmes such as Govt‟s
schemes like SGSY, PMRY, etc, it was assumed that any change in
economic status was considered mainly due to microfinance programme.
The major findings of economic impact of SHG members are presented in
the following sections.
4.3.1. Impact on personal income of SHG members
In the context of research study, personal income of SHG members means
income of SHG members from their income generating activities for which
micro loans are given by the NGO-MFIs. Microfinance basically means
providing credit to SHG members for taking up income generating

122
activities or micro-enterprises. Therefore, it was considered relevant and
important to know whether there was any improvement in the personal
income of SHG members after joining microfinance programme. Recall
method was used to capture personal income of SHG members before and
after joining the microfinance programme. To minimize the respondent‟s
biasness, personal income was cross checked with the other members
having similar business activities as well as the same verified with the
records of SHG members maintained with NGO-MFIs. This is shown in
table 4.1 below.
Table 4.1: Average monthly personal income of SHG Member
Average Monthly
Income
Number of sample SHG Members
Before joining MFIs After joining MFIs
N % N %
Below Rs.1,000 99 82.5 38 31.67
Rs.1,000-Rs1,500 13 10.8 42 35.00
Rs.1,500-Rs.2,000 3 2.5 18 15.00
Rs.2,000-Rs.2,500 3 2.5 11 9.17
Rs.2,500-Rs.3,000 1 .8 8 6.67
Above Rs.3,000 1 .8 3 2.50
Total 120 100 120 100
Source: Primary data
It was found that majority of about 82.5 per cent of sample SHGs had
average monthly personal income below Rs.1000 before joining MFIs.
After joining MFIs, only 31.67 percent sample SHGs had average monthly
income below Rs.1000. It is observed that nos. of SHGs members
123
belonging to lower income groups had declined because of increase in
personal income after joining MFIs.
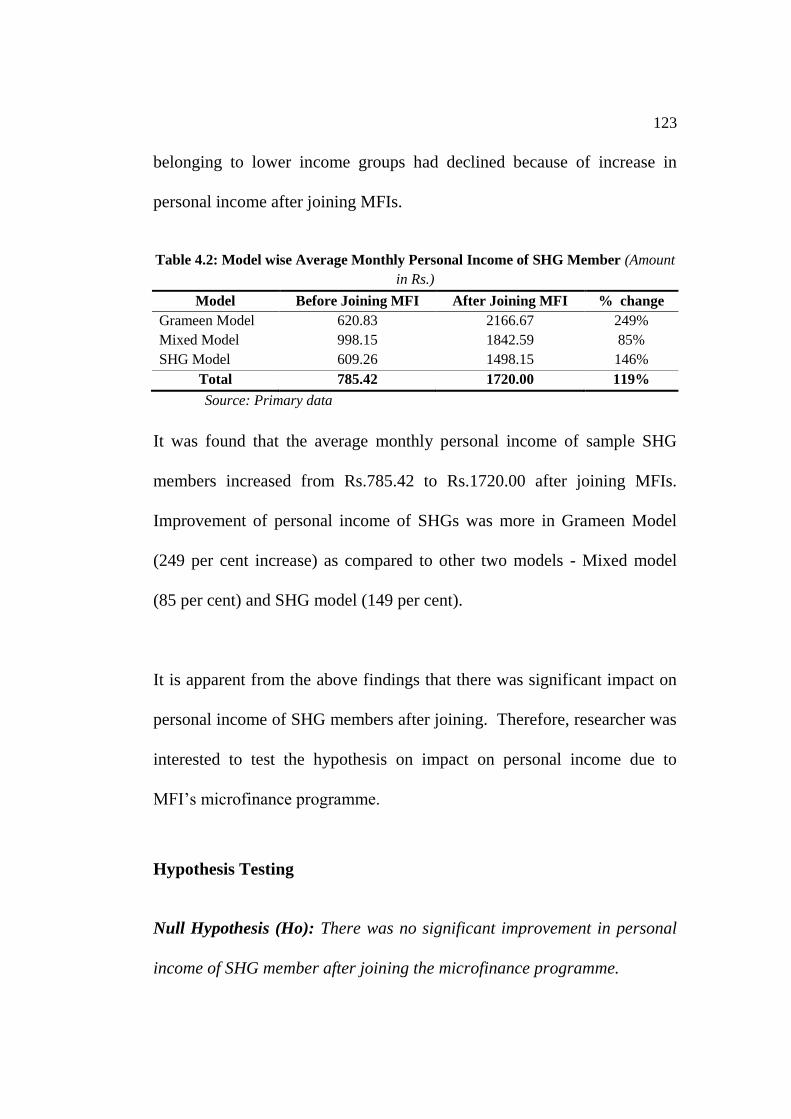
Table 4.2: Model wise Average Monthly Personal Income of SHG Member (Amount
in Rs.)
Model Before Joining MFI After Joining MFI % change
Grameen Model 620.83 2166.67 249%
Mixed Model 998.15 1842.59 85%
SHG Model 609.26 1498.15 146%
Total 785.42 1720.00 119%
Source: Primary data
It was found that the average monthly personal income of sample SHG
members increased from Rs.785.42 to Rs.1720.00 after joining MFIs.
Improvement of personal income of SHGs was more in Grameen Model
(249 per cent increase) as compared to other two models - Mixed model
(85 per cent) and SHG model (149 per cent).
It is apparent from the above findings that there was significant impact on
personal income of SHG members after joining. Therefore, researcher was
interested to test the hypothesis on impact on personal income due to
MFI‟s microfinance programme.
Hypothesis Testing
Null Hypothesis (Ho): There was no significant improvement in personal
income of SHG member after joining the microfinance programme.

124
Alternative Hypothesis (Ha): There was significant improvement in
personal income of SHG member after joining the microfinance
programme
For pre and post situation analysis of dependent samples, paired samples t-
test is generally used for testing hypothesis. The result of paired samples t-
test is given below:
Table 4.3: Paired Sample T-Test on Personal Income of SHG Member
Avg. Monthly
Personal
Income of
SHG Member
Paired Differences
t
df
Sig.
(2-
taile
d)
Mean
Std.
Deviat
ion
Std.
Error
Mean
95% Confidence
Interval of the
Difference
Lower Upper
After – Before
934.58 520.89 47.55 840.42 1028.73 19.65 119 .000
Statistical tool used: SPSS for Window (v.10.0.5)
Since t value is significant at = 0.05 level since p value (=0.00) <0.05,
Ho is rejected and Ha is accepted. It is seen that there was significant
improvement in personal income of MFI‟s SHG members after joining
MFI‟s microfinance programme. Therefore, it can be concluded that there
was positive impact on personal income of SHG members due to
microfinance programme.
125
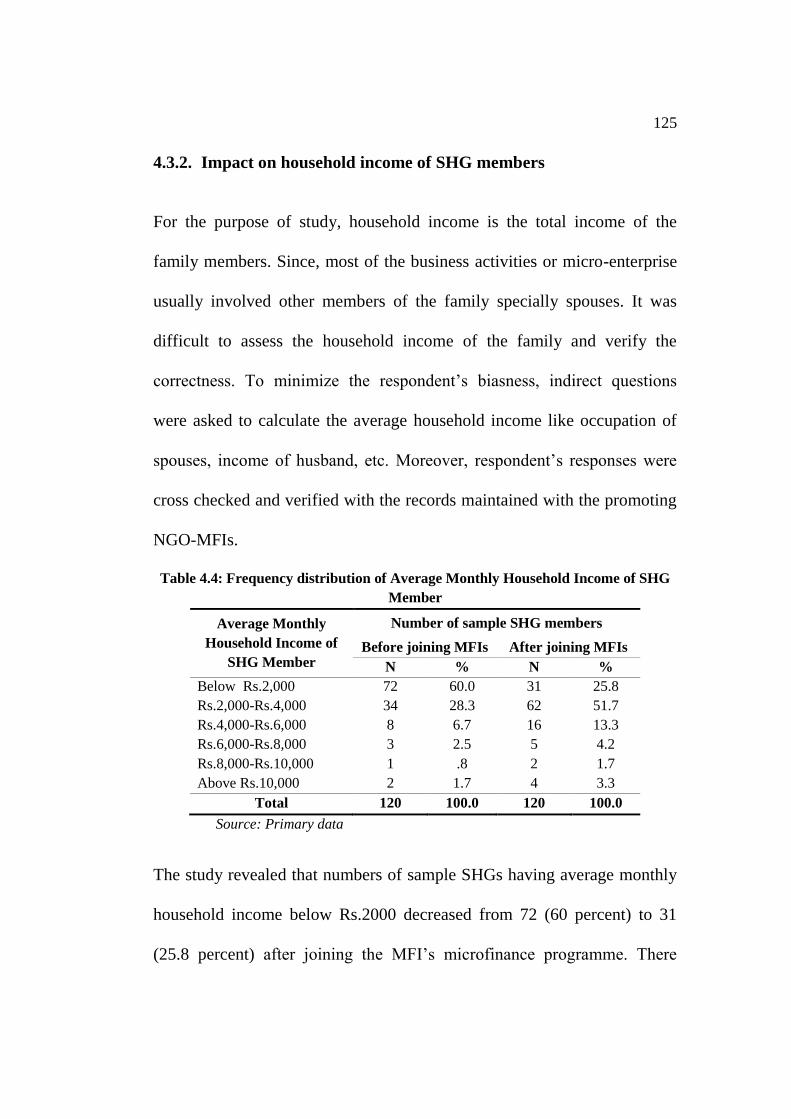
4.3.2. Impact on household income of SHG members
For the purpose of study, household income is the total income of the
family members. Since, most of the business activities or micro-enterprise
usually involved other members of the family specially spouses. It was
difficult to assess the household income of the family and verify the
correctness. To minimize the respondent‟s biasness, indirect questions
were asked to calculate the average household income like occupation of
spouses, income of husband, etc. Moreover, respondent‟s responses were
cross checked and verified with the records maintained with the promoting
NGO-MFIs.
Table 4.4: Frequency distribution of Average Monthly Household Income of SHG
Member
Average Monthly
Household Income of
SHG Member
Number of sample SHG members
Before joining MFIs After joining MFIs
N % N %
Below Rs.2,000 72 60.0 31 25.8
Rs.2,000-Rs.4,000 34 28.3 62 51.7
Rs.4,000-Rs.6,000 8 6.7 16 13.3
Rs.6,000-Rs.8,000 3 2.5 5 4.2
Rs.8,000-Rs.10,000 1 .8 2 1.7
Above Rs.10,000 2 1.7 4 3.3
Total 120 100.0 120 100.0
Source: Primary data
The study revealed that numbers of sample SHGs having average monthly
household income below Rs.2000 decreased from 72 (60 percent) to 31
(25.8 percent) after joining the MFI‟s microfinance programme. There
126
were also some instances where member‟s husband stopped drinking
alcohol, gambling, etc. and started contributing to the family income due to
motivation by SHG members.
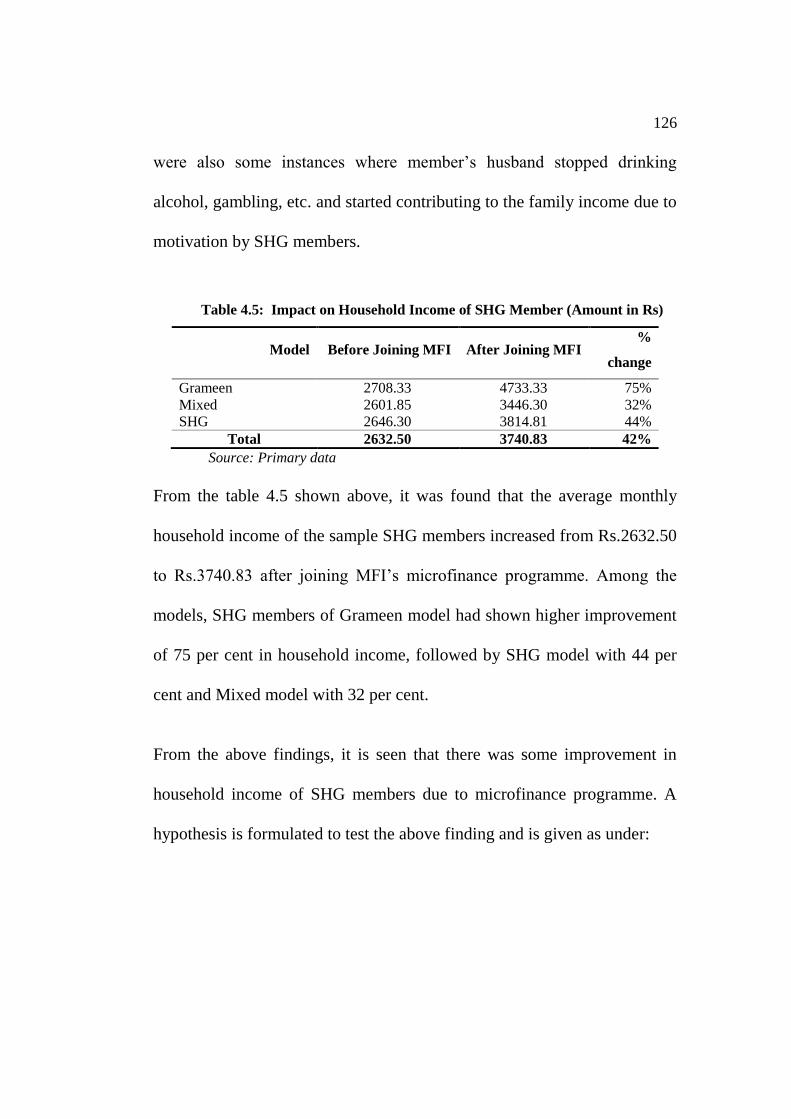
Table 4.5: Impact on Household Income of SHG Member (Amount in Rs)
Model Before Joining MFI After Joining MFI %
change
Grameen 2708.33 4733.33 75%
Mixed 2601.85 3446.30 32%
SHG 2646.30 3814.81 44%
Total 2632.50 3740.83 42%
Source: Primary data
From the table 4.5 shown above, it was found that the average monthly
household income of the sample SHG members increased from Rs.2632.50
to Rs.3740.83 after joining MFI‟s microfinance programme. Among the
models, SHG members of Grameen model had shown higher improvement
of 75 per cent in household income, followed by SHG model with 44 per
cent and Mixed model with 32 per cent.
From the above findings, it is seen that there was some improvement in
household income of SHG members due to microfinance programme. A
hypothesis is formulated to test the above finding and is given as under:

127
Hypothesis testing:
Null Hypothesis (Ho): There was no significant improvement in household
income of MFI’s SHG Members after joining the microfinance programme.
Alternative Hypothesis (Ha): There was significant improvement in
household income of MFI’s SHG Members after joining the microfinance
programme.
Paired sample t-test was used for testing the above hypothesis and the test
result is given as below:
Table 4.6: Paired Sample Test on Average Monthly Household Income of SHG
Member
Avg.
Monthly
Household
Income of
SHG
Member
Paired Differences
t
df
Sig.
(2-
tailed)
Mean
Std.
Deviat
ion
Std.
Error
Mean
95% Confidence
Interval of the
Difference
Lower Upper
After –
Before
1108.33 865.64 79.02 951.86 1264.80 14.02 119 .000*
Statistical tool used: SPSS * Significant at 0.01 level
It is observed from the above table that t value (14.02) is found significant
at = 0.05 level since p value (=0.00) <0.05. Therefore, Ho is rejected
and Ha is accepted. Thus, it can be concluded that there was significant
improvement in household income of MFI‟s SHG Members after joining
128
the microfinance programme. In other words, microfinance had significant
impact on household income of the SHG members.
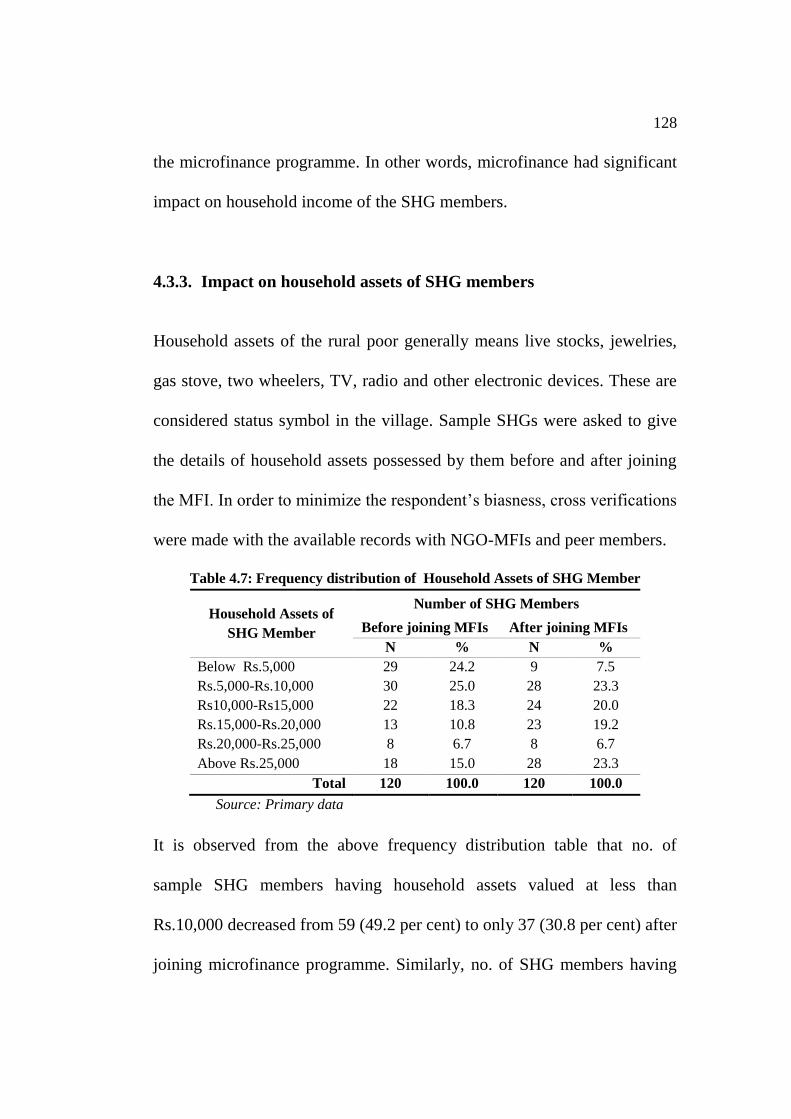
4.3.3. Impact on household assets of SHG members
Household assets of the rural poor generally means live stocks, jewelries,
gas stove, two wheelers, TV, radio and other electronic devices. These are
considered status symbol in the village. Sample SHGs were asked to give
the details of household assets possessed by them before and after joining
the MFI. In order to minimize the respondent‟s biasness, cross verifications
were made with the available records with NGO-MFIs and peer members.
Table 4.7: Frequency distribution of Household Assets of SHG Member
Household Assets of
SHG Member
Number of SHG Members
Before joining MFIs After joining MFIs
N % N %
Below Rs.5,000 29 24.2 9 7.5
Rs.5,000-Rs.10,000 30 25.0 28 23.3
Rs10,000-Rs15,000 22 18.3 24 20.0
Rs.15,000-Rs.20,000 13 10.8 23 19.2
Rs.20,000-Rs.25,000 8 6.7 8 6.7
Above Rs.25,000 18 15.0 28 23.3
Total 120 100.0 120 100.0
Source: Primary data
It is observed from the above frequency distribution table that no. of
sample SHG members having household assets valued at less than
Rs.10,000 decreased from 59 (49.2 per cent) to only 37 (30.8 per cent) after
joining microfinance programme. Similarly, no. of SHG members having
129
household assets valued at more than Rs.25,000 increased from 18 (15 per
cent) to 28 (23.33 per cent) after joining the microfinance. It is seen that
household assets of majority of the SHG members increased after joining
the microfinance.
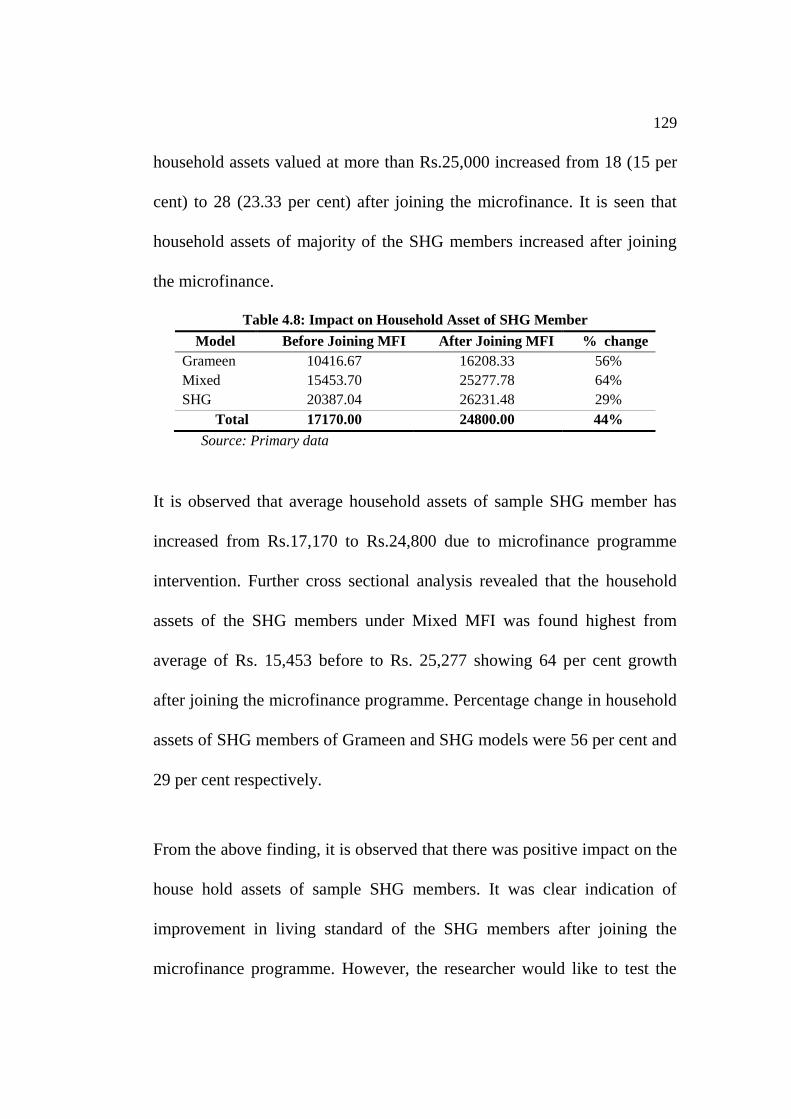
Table 4.8: Impact on Household Asset of SHG Member
Model Before Joining MFI After Joining MFI % change
Grameen 10416.67 16208.33 56%
Mixed 15453.70 25277.78 64%
SHG 20387.04 26231.48 29%
Total 17170.00 24800.00 44%
Source: Primary data
It is observed that average household assets of sample SHG member has
increased from Rs.17,170 to Rs.24,800 due to microfinance programme
intervention. Further cross sectional analysis revealed that the household
assets of the SHG members under Mixed MFI was found highest from
average of Rs. 15,453 before to Rs. 25,277 showing 64 per cent growth
after joining the microfinance programme. Percentage change in household
assets of SHG members of Grameen and SHG models were 56 per cent and
29 per cent respectively.
From the above finding, it is observed that there was positive impact on the
house hold assets of sample SHG members. It was clear indication of
improvement in living standard of the SHG members after joining the
microfinance programme. However, the researcher would like to test the
130
hypothesis before finally concluding the above finding. Therefore,
following hypothesis was formulated for testing impact on household
assets and the test result is shown below.
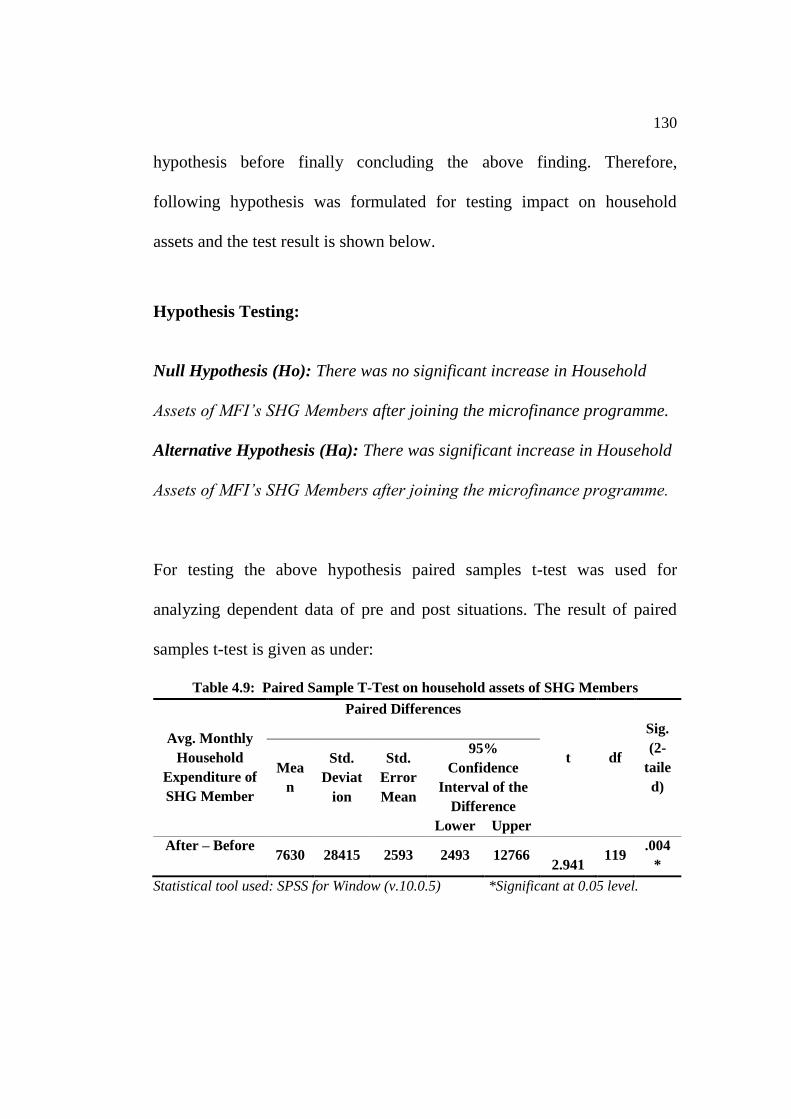
Hypothesis Testing:
Null Hypothesis (Ho): There was no significant increase in Household
Assets of MFI’s SHG Members after joining the microfinance programme.
Alternative Hypothesis (Ha): There was significant increase in Household
Assets of MFI’s SHG Members after joining the microfinance programme.
For testing the above hypothesis paired samples t-test was used for
analyzing dependent data of pre and post situations. The result of paired
samples t-test is given as under:
Table 4.9: Paired Sample T-Test on household assets of SHG Members
Avg. Monthly
Household
Expenditure of
SHG Member
Paired Differences
t
df
Sig.
(2-
taile
d)
Mea
n
Std.
Deviat
ion
Std.
Error
Mean
95%
Confidence
Interval of the
Difference
Lower Upper
After – Before
7630 28415 2593 2493 12766
2.941 119
.004
*
Statistical tool used: SPSS for Window (v.10.0.5) *Significant at 0.05 level.
131
Since t value of 2.941 is significant at = 0.05 level since p value (=0.00)
<0.05. Therefore, Ho is rejected and Ha is accepted. It can be concluded
that there was significant increase in household asset of MFI‟s SHG
Members after joining the microfinance programme. In other words, there
was significant impact of microfinance programme of NGO-MFIs on the
living standard of SHG members (indicated by household assets) of SHG
member.
4.3.4. Impact on household expenditure of SHG members
It is generally understood that household expenditure increases with the
increase in disposable income. Increase in household expenditure such as
food, clothing, children education, health care etc are also one of the
indicators of increase in household income. The analysis of basic
consumption and expenditure patterns of poor people is necessary for MFIs
while extending credit facilities. To minimize the respondents‟ biasness,
household expenditure of the SHG members were cross verified with nos.
of family members and household income as well as with similar peer
members.
132
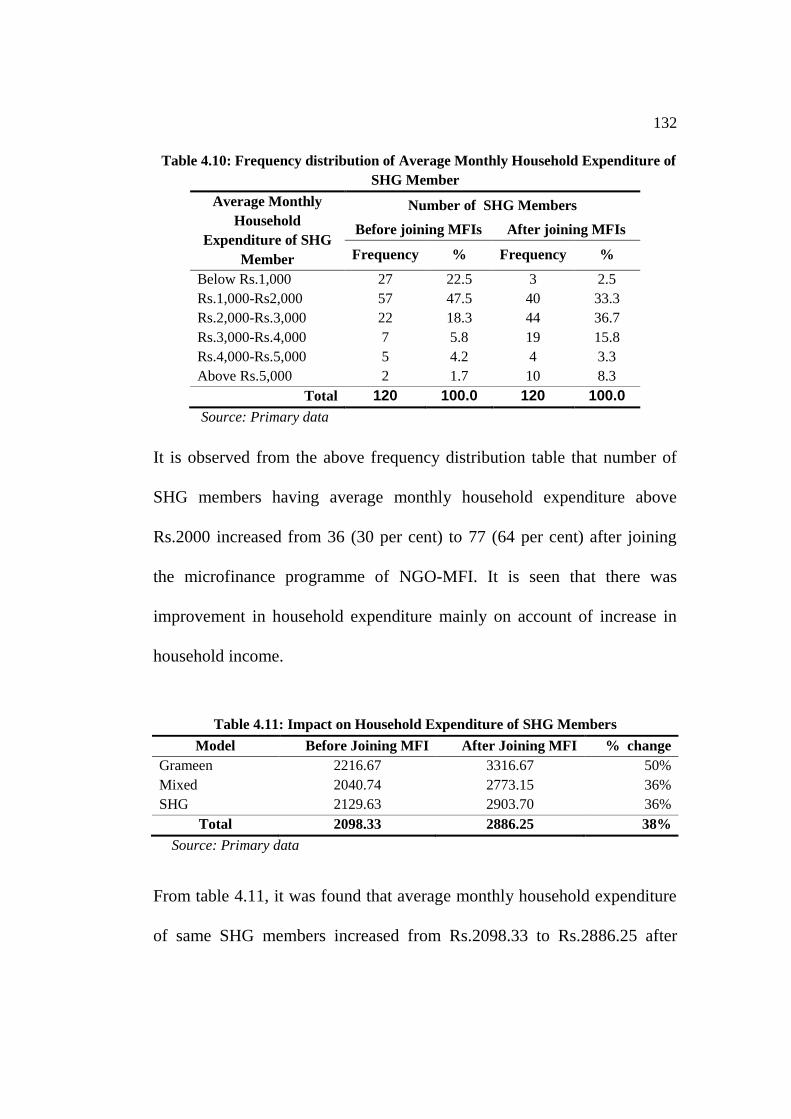
Table 4.10: Frequency distribution of Average Monthly Household Expenditure of
SHG Member
Average Monthly
Household
Expenditure of SHG
Member
Number of SHG Members
Before joining MFIs After joining MFIs
Frequency % Frequency %
Below Rs.1,000 27 22.5 3 2.5
Rs.1,000-Rs2,000 57 47.5 40 33.3
Rs.2,000-Rs.3,000 22 18.3 44 36.7
Rs.3,000-Rs.4,000 7 5.8 19 15.8
Rs.4,000-Rs.5,000 5 4.2 4 3.3
Above Rs.5,000 2 1.7 10 8.3
Total 120 100.0 120 100.0
Source: Primary data
It is observed from the above frequency distribution table that number of
SHG members having average monthly household expenditure above
Rs.2000 increased from 36 (30 per cent) to 77 (64 per cent) after joining
the microfinance programme of NGO-MFI. It is seen that there was
improvement in household expenditure mainly on account of increase in
household income.
Table 4.11: Impact on Household Expenditure of SHG Members
Model Before Joining MFI After Joining MFI % change
Grameen 2216.67 3316.67 50%
Mixed 2040.74 2773.15 36%
SHG 2129.63 2903.70 36%
Total 2098.33 2886.25 38%
Source: Primary data
From table 4.11, it was found that average monthly household expenditure
of same SHG members increased from Rs.2098.33 to Rs.2886.25 after

133
joining the microfinance programmes of MFI. Further, model wise analysis
reveals that change in the household expenditure was more in Grameen
model with 50 per cent, followed by Mixed and SHG model with 36 per
cent each.
From the above analysis, it appears that there was positive impact on the
household expenditure pattern of SHG members after joining microfinance
programme. However, to validate this finding, hypothesis testing was
carried out and the test result is described below.
Hypothesis Testing:
Null Hypothesis (Ho): There was no significant increase in household
expenditure of MFI’s SHG Members after joining the microfinance
programme.
Alternative Hypothesis (Ha): There was significant increase in household
expenditure of MFI’s SHG Members after joining the microfinance
programme.
For the pre and post situation analysis Paired samples t-test was used and
the result of the paired samples t-test is given below:
134
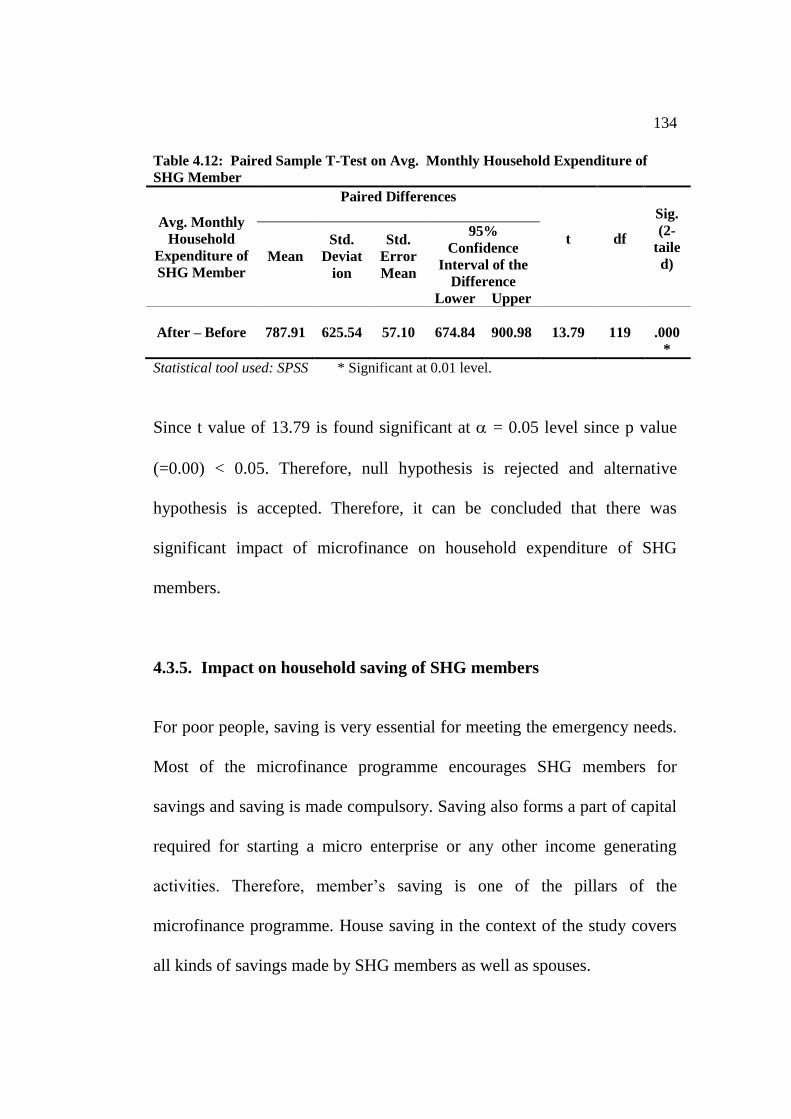
Table 4.12: Paired Sample T-Test on Avg. Monthly Household Expenditure of
SHG Member
Avg. Monthly
Household
Expenditure of
SHG Member
Paired Differences
t
df
Sig.
(2-
taile
d)
Mean
Std.
Deviat
ion
Std.
Error
Mean
95%
Confidence
Interval of the
Difference
Lower Upper
After – Before
787.91
625.54
57.10
674.84
900.98
13.79
119
.000
*
Statistical tool used: SPSS * Significant at 0.01 level.
Since t value of 13.79 is found significant at = 0.05 level since p value
(=0.00) < 0.05. Therefore, null hypothesis is rejected and alternative
hypothesis is accepted. Therefore, it can be concluded that there was
significant impact of microfinance on household expenditure of SHG
members.
4.3.5. Impact on household saving of SHG members
For poor people, saving is very essential for meeting the emergency needs.
Most of the microfinance programme encourages SHG members for
savings and saving is made compulsory. Saving also forms a part of capital
required for starting a micro enterprise or any other income generating
activities. Therefore, member‟s saving is one of the pillars of the
microfinance programme. House saving in the context of the study covers
all kinds of savings made by SHG members as well as spouses.
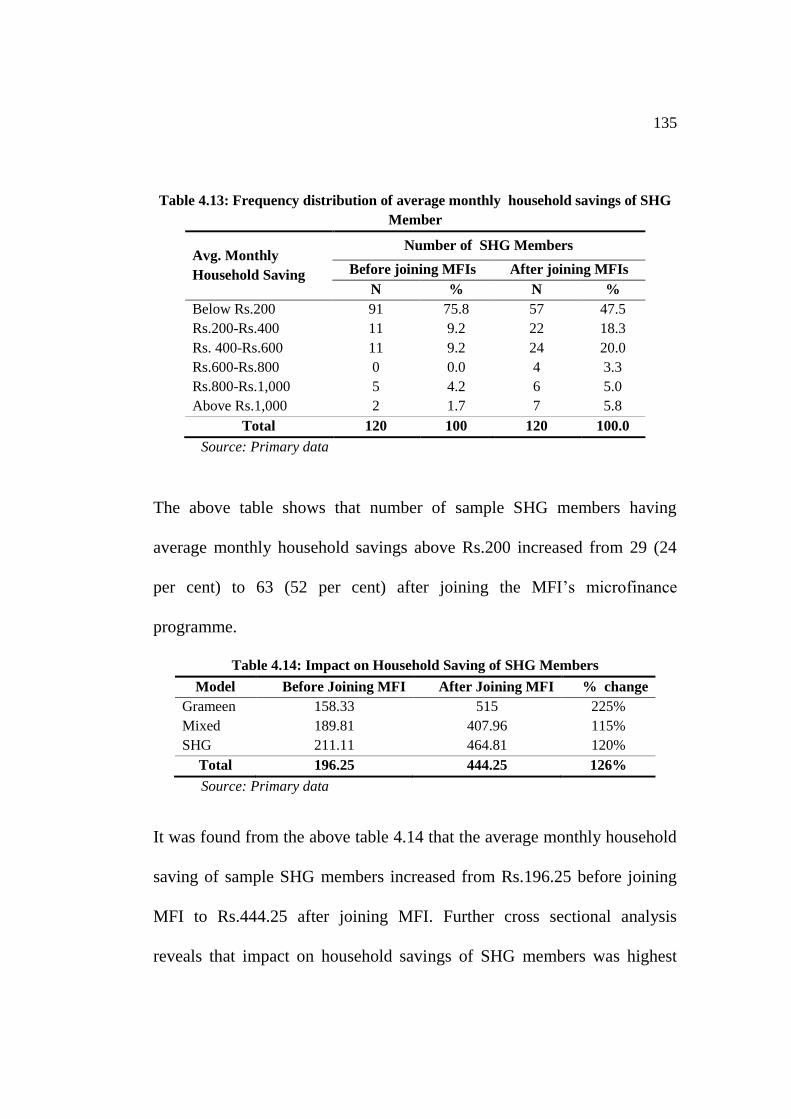
135
Table 4.13: Frequency distribution of average monthly household savings of SHG
Member
Avg. Monthly
Household Saving
Number of SHG Members
Before joining MFIs After joining MFIs
N % N %
Below Rs.200 91 75.8 57 47.5
Rs.200-Rs.400 11 9.2 22 18.3
Rs. 400-Rs.600 11 9.2 24 20.0
Rs.600-Rs.800 0 0.0 4 3.3
Rs.800-Rs.1,000 5 4.2 6 5.0
Above Rs.1,000 2 1.7 7 5.8
Total 120 100 120 100.0
Source: Primary data
The above table shows that number of sample SHG members having
average monthly household savings above Rs.200 increased from 29 (24
per cent) to 63 (52 per cent) after joining the MFI‟s microfinance
programme.
Table 4.14: Impact on Household Saving of SHG Members
Model Before Joining MFI After Joining MFI % change
Grameen 158.33 515 225%
Mixed 189.81 407.96 115%
SHG 211.11 464.81 120%
Total 196.25 444.25 126%
Source: Primary data
It was found from the above table 4.14 that the average monthly household
saving of sample SHG members increased from Rs.196.25 before joining
MFI to Rs.444.25 after joining MFI. Further cross sectional analysis
reveals that impact on household savings of SHG members was highest
136
with 225 per cent improvement, followed by SHG model with 120 percent
and Mixed model with 115 per cent. This was mainly because of
compulsory weekly savings of Grameen model.
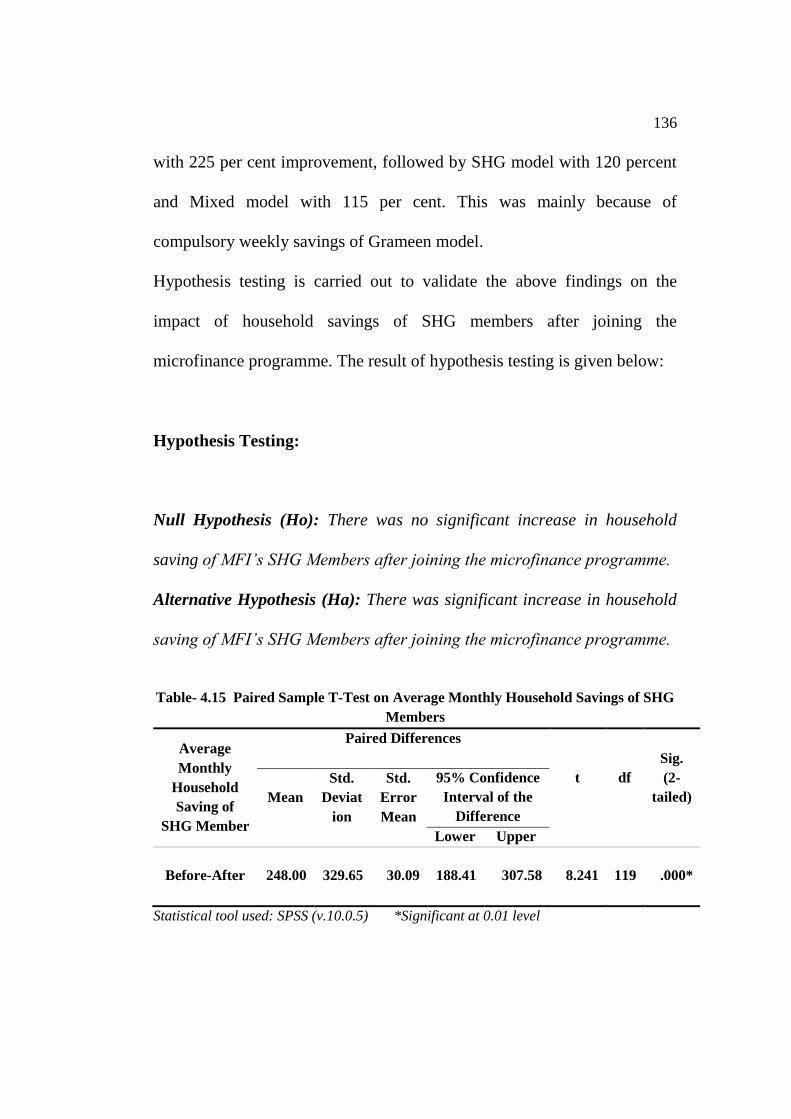
Hypothesis testing is carried out to validate the above findings on the
impact of household savings of SHG members after joining the
microfinance programme. The result of hypothesis testing is given below:
Hypothesis Testing:
Null Hypothesis (Ho): There was no significant increase in household
saving of MFI’s SHG Members after joining the microfinance programme.
Alternative Hypothesis (Ha): There was significant increase in household
saving of MFI’s SHG Members after joining the microfinance programme.
Table- 4.15 Paired Sample T-Test on Average Monthly Household Savings of SHG
Members
Average
Monthly
Household
Saving of
SHG Member
Paired Differences
t
df
Sig.
(2-
tailed)
Mean
Std.
Deviat
ion
Std.
Error
Mean
95% Confidence
Interval of the
Difference
Lower Upper
Before-After
248.00
329.65
30.09
188.41
307.58
8.241
119
.000*
Statistical tool used: SPSS (v.10.0.5) *Significant at 0.01 level
137
Paired samples t-test result shows that t value of 8.241 is significant at =
0.05 level since p value (=0.00) < 0.05. Therefore, it can be concluded that
there was significant increase in household saving of sample SHG
members after joining the microfinance programme. In other words, there
was significant impact of microfinance programme on average monthly
household saving of SHG members.
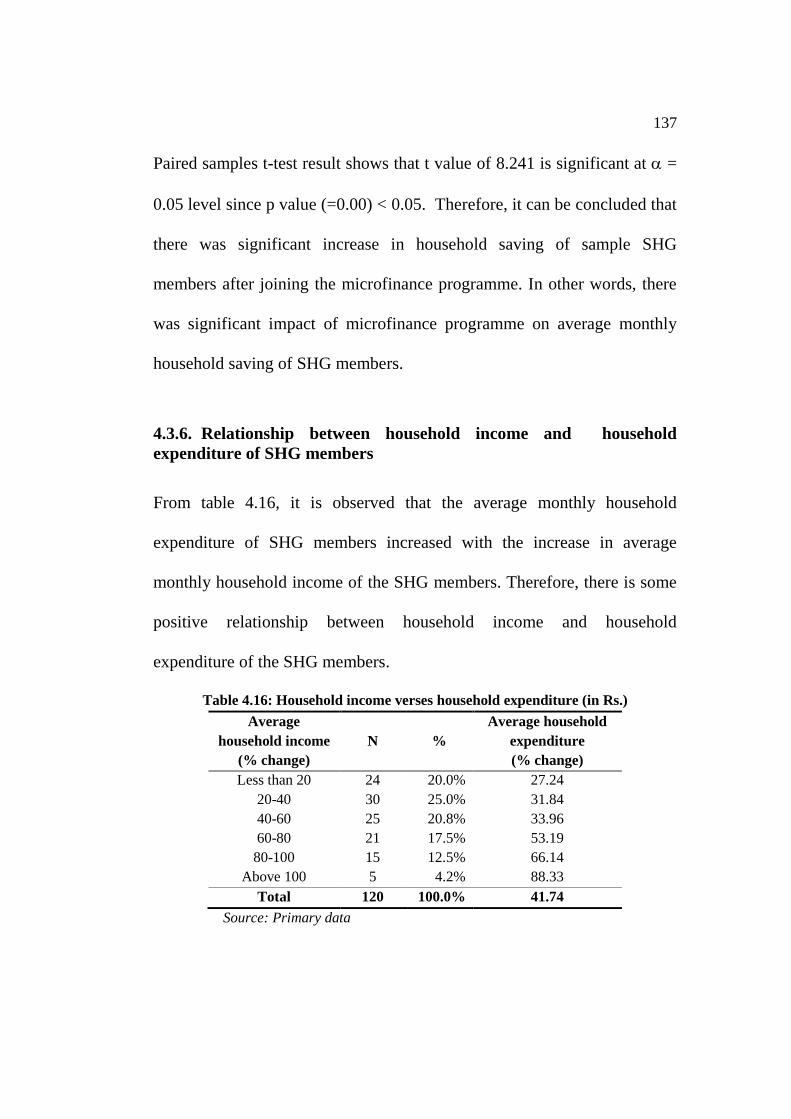
4.3.6. Relationship between household income and household
expenditure of SHG members
From table 4.16, it is observed that the average monthly household
expenditure of SHG members increased with the increase in average
monthly household income of the SHG members. Therefore, there is some
positive relationship between household income and household
expenditure of the SHG members.
Table 4.16: Household income verses household expenditure (in Rs.)
Average
household income
(% change)
N %
Average household
expenditure
(% change)
Less than 20 24 20.0% 27.24
20-40 30 25.0% 31.84
40-60 25 20.8% 33.96
60-80 21 17.5% 53.19
80-100 15 12.5% 66.14
Above 100 5 4.2% 88.33
Total 120 100.0% 41.74
Source: Primary data

138
33.9648
53.1933
66.1433
88.334
31.84327.2475
0
10
20
30
40
50
60
70
80
90
100
Less
than 20
20-40 40-60 60-80 80-100 Above
100
% increase in household income
% in
cre
se in
ho
useh
old
exp
en
dit
ure
Fig. 4.3. Household income verses household expenditure
However, in order to validate the above finding, a hypothesis testing was
carried out the result of which is given below.
Hypothesis testing:
Null Hypothesis (Ho): There was no significant relationship between
household income and household expenditure of SHG Members.
Alternative Hypothesis (Ha): There was significant relationship between
household income and household expenditure of SHG Members.
Karl Pearson Coefficient of correlation was used to examine the degree of
association between the household income and household expenditure of
SHG members. The result of the correlation analysis using SPSS software
is given under:

139
Pearson Co-efficient of
correlation
0.728
Significance (2-tailed) 0.01
The Pearson co-efficient of correlation (r) is 0.728 and is found significant
at = 0.05 level since p value (=0.01) <0.05. Therefore, Ho is rejected and
Ha is accepted. It can be concluded that that there was significant positive
co-relationship between household income and household expenditure of
SHG member. In other words increase in household income will result in
increase in household expenditure.
4.3.7. Relationship between household income and household saving
of SHG members
Usually, savings are made out of surplus income. It is difficult to increase
the savings without substantial increase in income. An attempt was made in
this study to examine the correlation between household income and
household savings of SHG members.
Table 4.17: Household income verses Household savings
(Amount in Rs)
Increase in
household income N %
Increase in household
saving
Less than 500 41 34.2% 119.51
500-1000 45 37.5% 191.77
1000-1500 17 14.2% 319.41
1500-2000 12 10.0% 633.33
2000-2500 1 .8% 300.00

140
Above 2500 4 3.3% 725.00
Total 120 100.0% 248.00
Source: Primary data
300
725
633.33
119.51
191.77
319.41
0
100
200
300
400
500
600
700
800
Less than
500
500-1000 1000-1500 1500-2000 2000-2500 Above
2500
Increase in monthly household income
Incre
ase i
n m
on
thly
ho
useh
old
savin
g
Fig 4.4. Household income verses household savings
From the analysis of the above table and graph, it is observed that with the
increase in household income of sample SHG members, their respective
household saving also increased. Thus, there was positive relationship
between household income and household savings of SHG members.
In order to supplement the above findings, hypothesis testing was carried
out the result of which is presented below.
Hypothesis testing:
Null Hypothesis (Ho): There was no significant relationship between
household income and household saving of SHG members.

141
Alternative Hypothesis (Ha): There was significant relationship between
household income and household saving of SHG members.
Pearson Co-efficient of
correlation (r)
0.485
Significance (2-tailed) 0.01
The Pearson co-efficient of correlation (r) between household income and
household saving is 0.485 and is found significant at = 0.05 level since p
value (=0.01) <0.05. Therefore, it can be concluded that there was
significant positive co-relation between household income and household
saving of SHG members. In other words, household saving of SHG
members increased with the increase in their household income.
4.3.8. Access to formal credit by SHG members
Providing micro credit to the poor people for taking up income generating
activities is the basic principle of microfinance as poor people find it
difficult to access credit from formal banking system. Poor people
generally depend on local money lenders who charge high interest rates.
With the SHG-bank linkage programme or directly financing by MFIs,
most of the SHG members could avail formal or institutional credit
facilities after joining the microfinance programme. Therefore, it was
considered relevant to find out the impact on ability to access the formal or
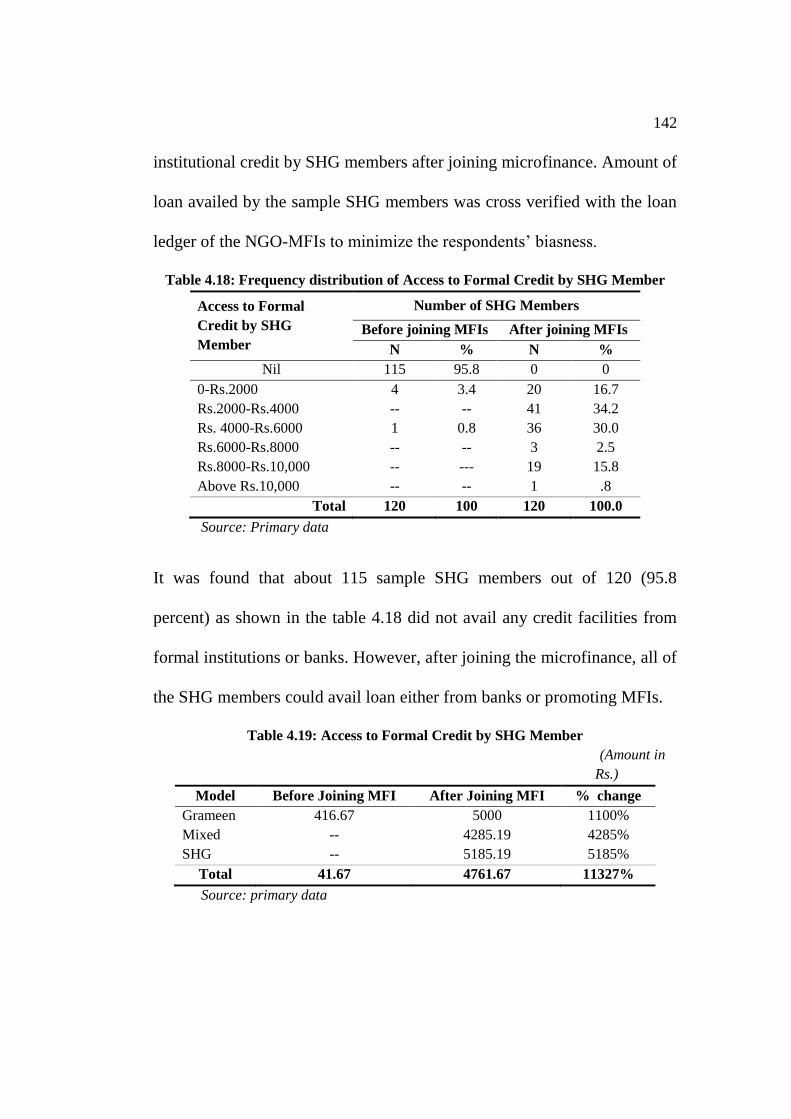
142
institutional credit by SHG members after joining microfinance. Amount of
loan availed by the sample SHG members was cross verified with the loan
ledger of the NGO-MFIs to minimize the respondents‟ biasness.
Table 4.18: Frequency distribution of Access to Formal Credit by SHG Member
Access to Formal
Credit by SHG
Member
Number of SHG Members
Before joining MFIs After joining MFIs
N % N %
Nil 115 95.8 0 0
0-Rs.2000 4 3.4 20 16.7
Rs.2000-Rs.4000 -- -- 41 34.2
Rs. 4000-Rs.6000 1 0.8 36 30.0
Rs.6000-Rs.8000 -- -- 3 2.5
Rs.8000-Rs.10,000 -- --- 19 15.8
Above Rs.10,000 -- -- 1 .8
Total 120 100 120 100.0
Source: Primary data
It was found that about 115 sample SHG members out of 120 (95.8
percent) as shown in the table 4.18 did not avail any credit facilities from
formal institutions or banks. However, after joining the microfinance, all of
the SHG members could avail loan either from banks or promoting MFIs.
Table 4.19: Access to Formal Credit by SHG Member
(Amount in
Rs.)
Model Before Joining MFI After Joining MFI % change
Grameen 416.67 5000 1100%
Mixed -- 4285.19 4285%
SHG -- 5185.19 5185%
Total 41.67 4761.67 11327%
Source: primary data
143
From table 4.19 it was observed that the average size of loan availed from
the formal institutions or banks increased from Rs.41.67 to Rs.4761.67
after joining microfinance programme of NGO-MFIs. Among the models,
increase in access to formal credit was found highest in Grameen model as
compared to Grameen and Mixed model due to active support of Banks
under SHG-bank linkage programme. It was evident from the above
finding that access to formal or institutional credit increased after joining
after microfinance programme. However, for concluding the finding, a
hypothesis testing was carried out to test the significant improvement in
access to formal credit by SHG members the result of which is given as:
Hypothesis testing:
Null Hypothesis (Ho): There was no significant increase in access to
formal credit by MFI’s SHG Members after joining the microfinance
programme.
Alternative Hypothesis (Ha): There was significant increase in access to
formal credit by MFI’s SHG Members after joining the microfinance
programme.
Since it was the comparison of pre and post situation of the sample, paired
t-test was used.
144
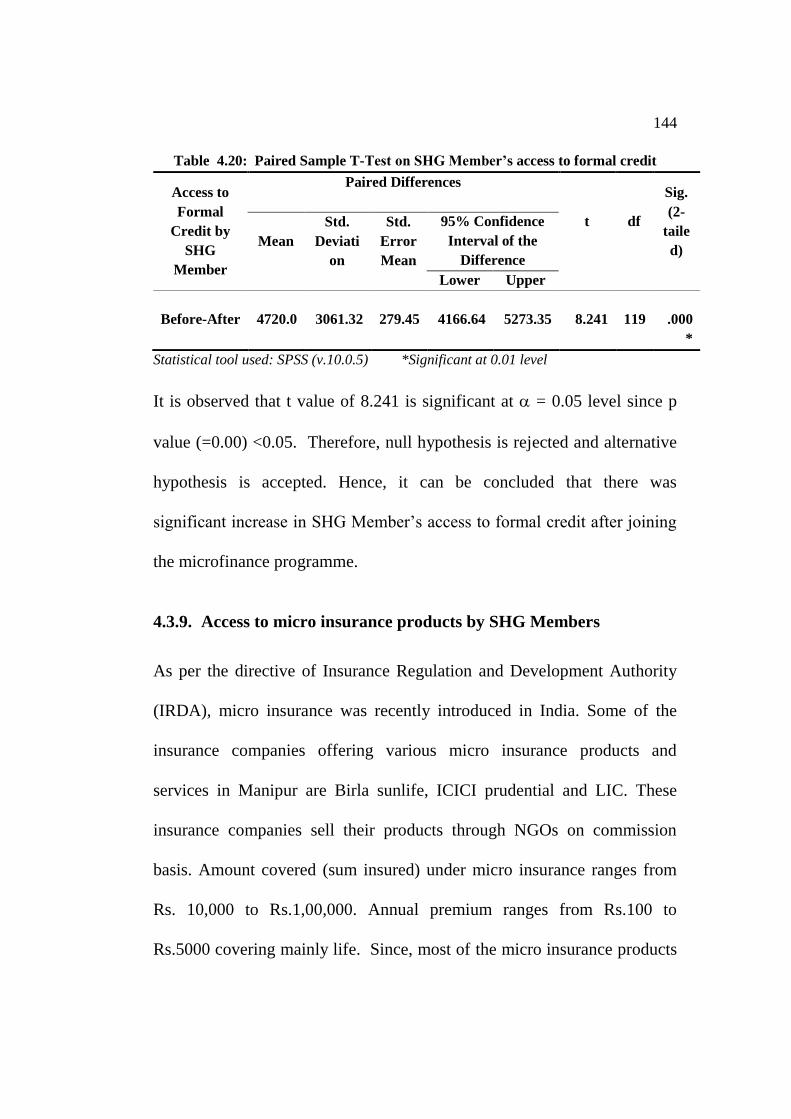
Table 4.20: Paired Sample T-Test on SHG Member’s access to formal credit
Access to
Formal
Credit by
SHG
Member
Paired Differences
t
df
Sig.
(2-
taile
d)
Mean
Std.
Deviati
on
Std.
Error
Mean
95% Confidence
Interval of the
Difference
Lower Upper
Before-After
4720.0
3061.32
279.45
4166.64
5273.35
8.241
119
.000
*
Statistical tool used: SPSS (v.10.0.5) *Significant at 0.01 level
It is observed that t value of 8.241 is significant at = 0.05 level since p
value (=0.00) <0.05. Therefore, null hypothesis is rejected and alternative
hypothesis is accepted. Hence, it can be concluded that there was
significant increase in SHG Member‟s access to formal credit after joining
the microfinance programme.
4.3.9. Access to micro insurance products by SHG Members
As per the directive of Insurance Regulation and Development Authority
(IRDA), micro insurance was recently introduced in India. Some of the
insurance companies offering various micro insurance products and
services in Manipur are Birla sunlife, ICICI prudential and LIC. These
insurance companies sell their products through NGOs on commission
basis. Amount covered (sum insured) under micro insurance ranges from
Rs. 10,000 to Rs.1,00,000. Annual premium ranges from Rs.100 to
Rs.5000 covering mainly life. Since, most of the micro insurance products

145
were routed through NGO-MFIs and was closely associated with micro
loans and saving, it was considered important to know whether there was
any significant increase in access to micro insurance product by SHG
members after joining the microfinance programme.
Table 4.21: Frequency distribution of Access to Micro Insurance Products
Access to Micro
Insurance Products by
SHG Member
Number of SHG Members
Before joining MFIs After joining MFIs
N % N %
No insurance coverage 102 85.0 51 42.5
Below Rs.25,00 -- -- 31 25.8
Rs. 25,000-Rs.50,000 6 5.0 16 13.3
Rs.50,000-Rs.75,000 -- -- -- --
Rs.75,000-Rs.1,00,000 7 5.8 14 11.7
Above Rs.1,00,000 5 4.2 8 6.7
Total 120 100 120 100.0
Source: primary data
From the above frequency distribution table, it is observed that number of
sample who did not have any insurance coverage reduced from 102 (85 per
cent) to 51 (42.5 per cent). Moreover, sum insured varied from Rs.25,000
to Rs.1,00,000. It was also found that majority (42.5 per cent) of sample
SHG members did not have insurance coverage. Therefore, there is lot of
scope for insurance products in the near future.
Table 4.22: SHG Member’s Access to Micro insurance products
Model Before Joining MFI After Joining MFI %
change
Grameen 20833.33 42727.27 105%
Mixed 18518.52 38555.56 108%
SHG 19444.44 46388.89 139%
Total 19166.67 42495.8 122%
Source: Primary data
146
Further cross sectional analysis revealed that access to insurance products
was more in SHG model with 139 per cent improvement in insurance
coverage, followed by Mixed and SHG model with 108 per cent and 105
per cent respectively.
The study also revealed that the average amount of insurance coverage of
the members of the SHG members increased from Rs.19166.66 to
Rs.42495.79 after joining the microfinance. Therefore, it was imperative to
test the hypothesis to confirm this change. Accordingly, the hypothesis
testing was carried out and the test result is summarized below.
Hypothesis testing:
Null Hypothesis (Ho): There was no significant increase in access to
micro insurance products by MFI’s SHG Members after joining the
microfinance programme.
Alternative Hypothesis (Ha): There was significant increase in access to
micro insurance products by MFI’s SHG Members after joining the
microfinance programme.
147
Paired samples t-test was used to test the above hypothesis as it was the
testing pre-post situation comparison of the same samples. The result of
hypothesis testing is presented in the table 4.23.
Table 4.23: Paired Sample T-Test on SHG Member’s access to Micro Insurance
Access to
Formal
Credit by
SHG
Member
Paired Differences
t
df
Sig.
(2-
tailed)
Mean
Std.
Deviati
on
Std.
Error
Mean
95% Confidence
Interval of the
Difference
Lower Upper
Before-After
23168.06
50711.43
4648.71
13962.35
32373.77
4.984
119
.000*
Statistical tool used: SPSS (v.10.0.5) * Significant at 0.01 level.
Since t value of 4.984 is significant at = 0.05 level since p value (=0.00)
<0.05.Therefore, the above mentioned null hypothesis can be rejected and
alternative hypothesis can be accepted. Therefore, it can be concluded that
there was significant increase in SHG members‟ access to micro insurance
products after joining the microfinance programme.
4.3.10. Relationship between loan size and number of years in
Microfinance programme
It is the common practice of many MFIs to increase the loan size over the
period of years. Amount of loan generally increases in the subsequent cycle
of loan considering repayment track record of the clients. Therefore, an
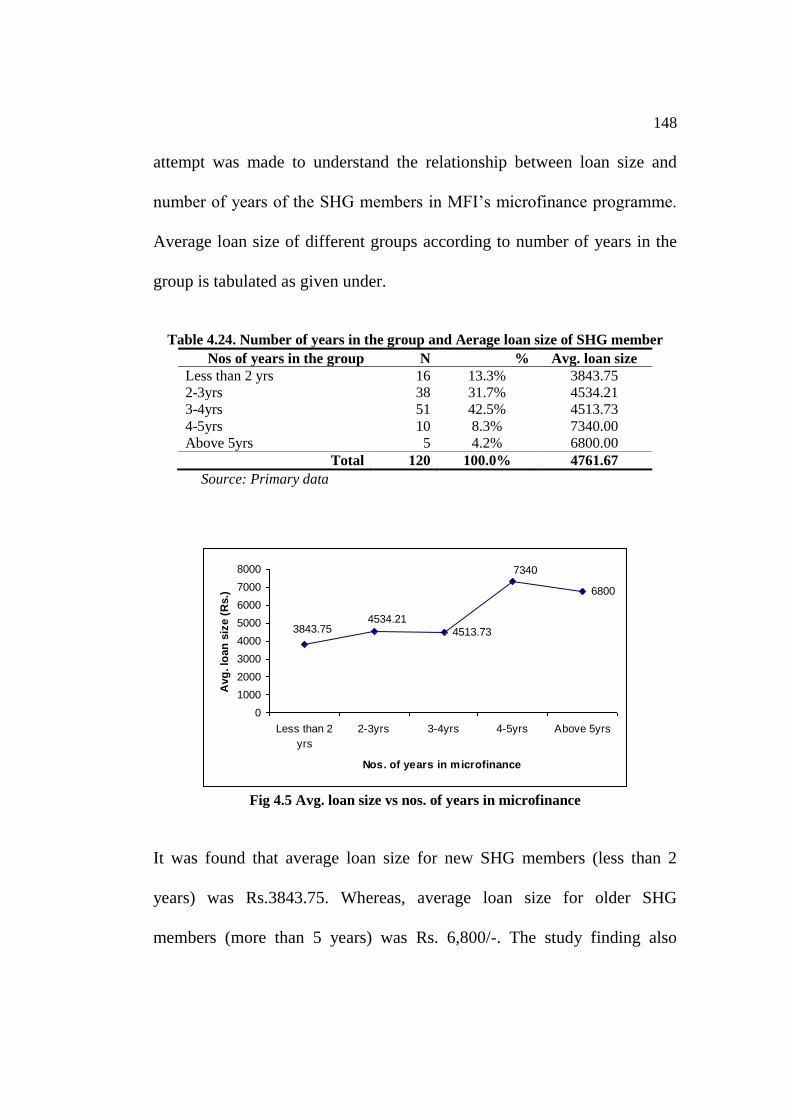
148
attempt was made to understand the relationship between loan size and
number of years of the SHG members in MFI‟s microfinance programme.
Average loan size of different groups according to number of years in the
group is tabulated as given under.
Table 4.24. Number of years in the group and Aerage loan size of SHG member
Nos of years in the group N % Avg. loan size
Less than 2 yrs 16 13.3% 3843.75
2-3yrs 38 31.7% 4534.21
3-4yrs 51 42.5% 4513.73
4-5yrs 10 8.3% 7340.00
Above 5yrs 5 4.2% 6800.00
Total 120 100.0% 4761.67
Source: Primary data
4513.73
6800
7340
3843.754534.21
0
1000
2000
3000
4000
5000
6000
7000
8000
Less than 2
yrs
2-3yrs 3-4yrs 4-5yrs Above 5yrs
Nos. of years in microfinance
Avg
. lo
an
siz
e (
Rs.)
Fig 4.5 Avg. loan size vs nos. of years in microfinance
It was found that average loan size for new SHG members (less than 2
years) was Rs.3843.75. Whereas, average loan size for older SHG
members (more than 5 years) was Rs. 6,800/-. The study finding also
149
supplemented the general assumption of positive relationship between loan
size and age of SHG members in the group. However, to confirm the
relationship between loan and age of SHG members, a hypothesis was
formulated to test the validity of this relationship. The inference drawn
from the hypothesis testing is narrated below.
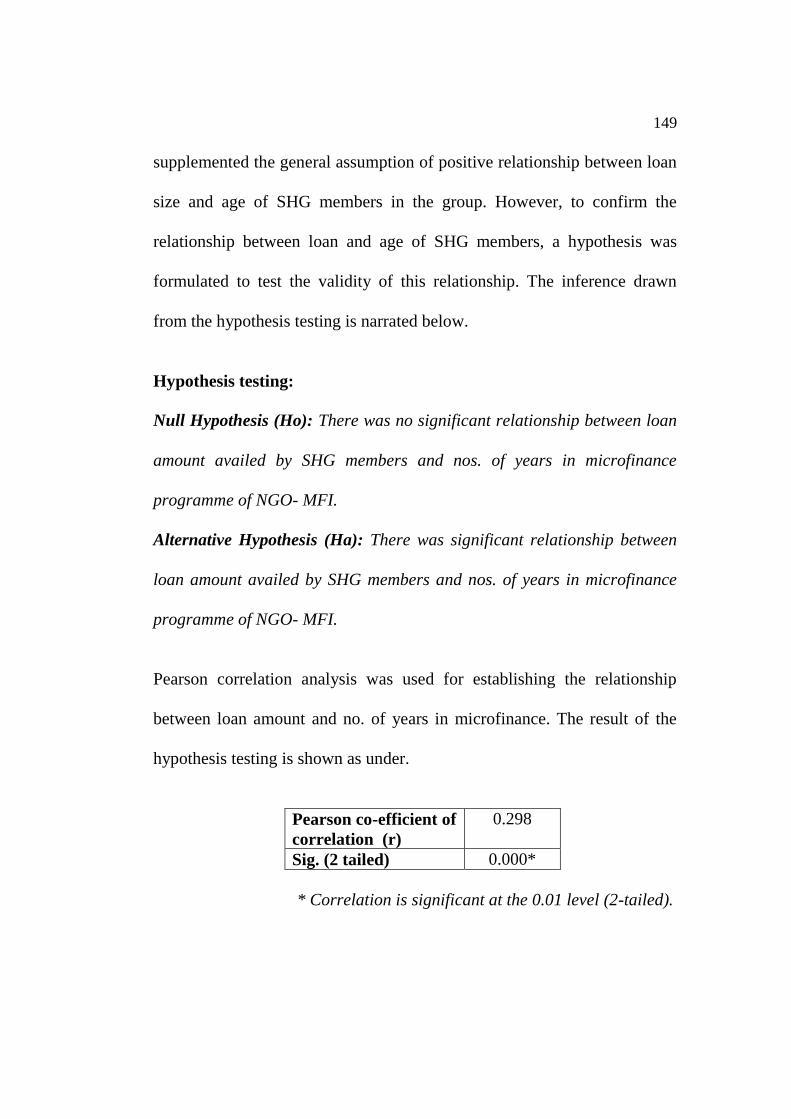
Hypothesis testing:
Null Hypothesis (Ho): There was no significant relationship between loan
amount availed by SHG members and nos. of years in microfinance
programme of NGO- MFI.
Alternative Hypothesis (Ha): There was significant relationship between
loan amount availed by SHG members and nos. of years in microfinance
programme of NGO- MFI.
Pearson correlation analysis was used for establishing the relationship
between loan amount and no. of years in microfinance. The result of the
hypothesis testing is shown as under.
Pearson co-efficient of
correlation (r)
0.298
Sig. (2 tailed) 0.000*
* Correlation is significant at the 0.01 level (2-tailed).
150
It is observed from the above that Pearson‟s co-efficient of correlation(r) is
0.298 (positive) and is significant at = 0.05 level since p value (=0.00)
<0.05. Therefore, null hypothesis is rejected and alternative hypothesis is
accepted. It can be concluded that there was significant positive
relationship between no. of years in MFIs and loan amount availed by
MFI‟s SHG Members.
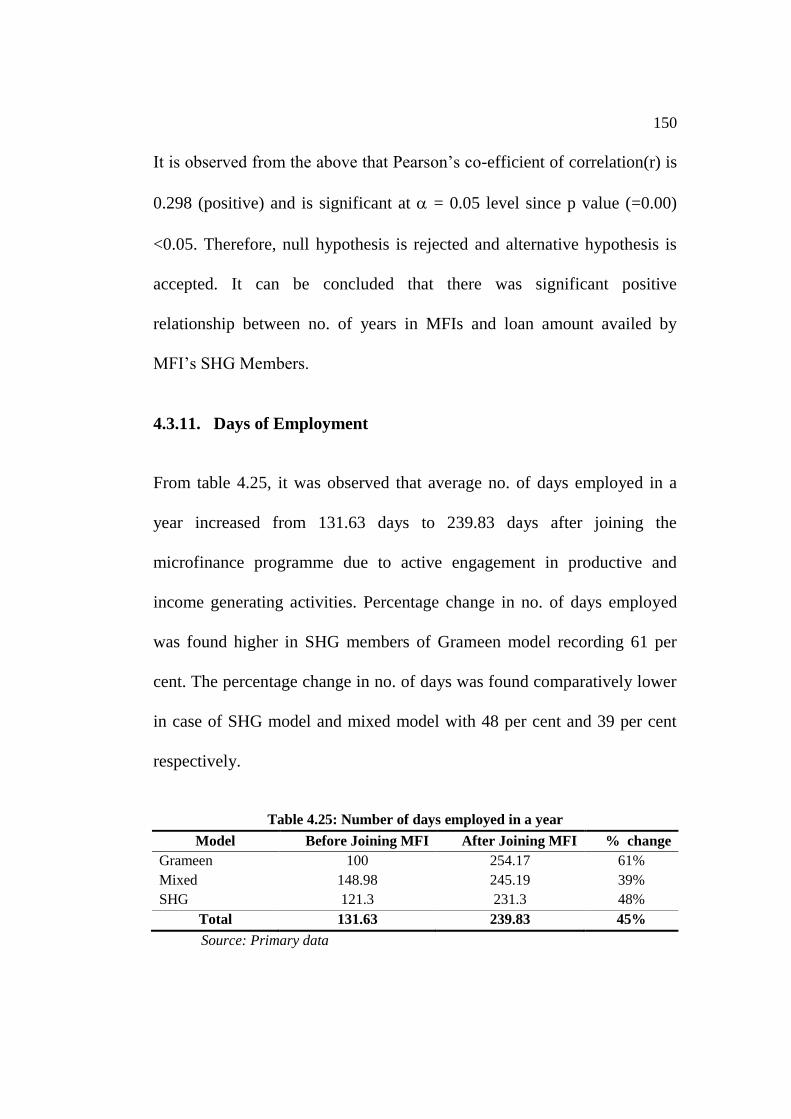
4.3.11. Days of Employment
From table 4.25, it was observed that average no. of days employed in a
year increased from 131.63 days to 239.83 days after joining the
microfinance programme due to active engagement in productive and
income generating activities. Percentage change in no. of days employed
was found higher in SHG members of Grameen model recording 61 per
cent. The percentage change in no. of days was found comparatively lower
in case of SHG model and mixed model with 48 per cent and 39 per cent
respectively.
Table 4.25: Number of days employed in a year
Model Before Joining MFI After Joining MFI % change
Grameen 100 254.17 61%
Mixed 148.98 245.19 39%
SHG 121.3 231.3 48%
Total 131.63 239.83 45%
Source: Primary data
151
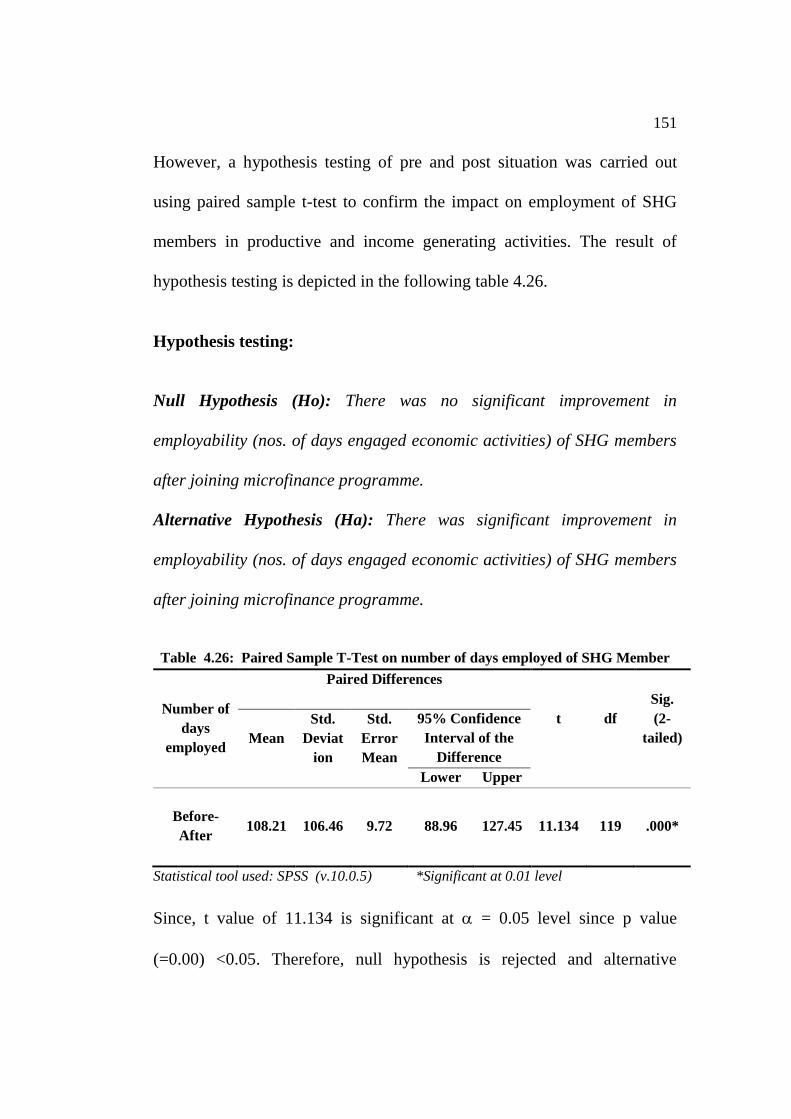
However, a hypothesis testing of pre and post situation was carried out
using paired sample t-test to confirm the impact on employment of SHG
members in productive and income generating activities. The result of
hypothesis testing is depicted in the following table 4.26.
Hypothesis testing:
Null Hypothesis (Ho): There was no significant improvement in
employability (nos. of days engaged economic activities) of SHG members
after joining microfinance programme.
Alternative Hypothesis (Ha): There was significant improvement in
employability (nos. of days engaged economic activities) of SHG members
after joining microfinance programme.
Table 4.26: Paired Sample T-Test on number of days employed of SHG Member
Number of
days
employed
Paired Differences
t
df
Sig.
(2-
tailed)
Mean
Std.
Deviat
ion
Std.
Error
Mean
95% Confidence
Interval of the
Difference
Lower Upper
Before-
After
108.21 106.46 9.72 88.96 127.45 11.134 119 .000*
Statistical tool used: SPSS (v.10.0.5) *Significant at 0.01 level
Since, t value of 11.134 is significant at = 0.05 level since p value
(=0.00) <0.05. Therefore, null hypothesis is rejected and alternative
152
hypothesis is accepted. Therefore, it can be concluded that there was
significant improvement in employability (number of days engaged in
economic activities) of SHG members after joining the microfinance
programme.
4.4. Summary of Findings
4.4.1. Economic Impact on SHG members
Personal income: There was significant improvement in personal
monthly income of the SHG members after joining the microfinance
programme. The average monthly personal income increased from
Rs.785.41 to Rs.1720.00.
Household income: There was significant improvement in
household income of the SHG members after joining the
microfinance programme. The average monthly household income
increased from Rs.2632 to Rs.3740.
Household assets: There was significant improvement in household
assets of the SHG members after joining the microfinance. The
average value of household assets increased from Rs.17,170 to
Rs.24,800.
Household expenditure: There was significant increase in household
expenditure of the SHG members after joining the microfinance.
153
The monthly household expenditure increased from Rs.2098.33
toRs.2886.25.
Household saving: There was significant improvement in household
saving of the SHG members after joining the microfinance
programme. The monthly household saving increased from
Rs.196.25 to Rs.444.25.
Access to Credit: There was significant increase in access to formal
credit by members of SHGs after joining the microfinance
programme. The maximum limit of the credit increased from
Rs.5000 to Rs.15000. And the average amount of the credit
increased from Rs.41.66 to Rs.4761.66.
Access to Micro insurance: There was significant increase in access
to micro insurance products by members of SHGs after joining the
microfinance programme. The average amount of insurance
coverage of the members of the SHGs increased from Rs.19166.66
to Rs.42495.79.
4.5. Conclusions
From the above analysis most of the NGO-MFIs were found to have
changed their roles from social intermediary to financial intermediary by

154
providing various financial services to SHGs such as loan, savings, micro-
insurance etc. It was found that there was significant economic impact on
SHG members due to NGO-MFIs‟ intervention programme. It has been
witnessed that there has been significant improvement of personal income
and household income, household savings, access to insurance products
after joining the micro finance programmes of the NGO-MFIs.