Embed Size (px)
Citation preview
8/4/2019 Economic Impact of Cultural Tourists in Australia
http://slidepdf.com/reader/full/economic-impact-of-cultural-tourists-in-australia 1/33
in Australia
Economic Impact of CulturalTourists
Report by the Bureau of Tourism Research for the
Cultural Ministers’ Council Statistics Working Group June 2003 Authors: Lee Heaney and Umme Salma
8/4/2019 Economic Impact of Cultural Tourists in Australia
http://slidepdf.com/reader/full/economic-impact-of-cultural-tourists-in-australia 2/33
Economic Impact of Cultural Tourists in Australiaii
AcknowledgementsThe Cultural Ministers’ Council Statistics Working Group commissioned and funded the
research contained in this report.
Statistics Working Group Secretariat
Department of Communications, Information Technology and the Arts
GPO Box 2154 Canberra ACT 2601Telephone: (02) 6271 1051
Bureau of Tourism Research GPO Box 1545 Canberra ACT 2601
Telephone: (02) 6213 6940 Facsimile: (02) 6213 6983
Web address: http://www.btr.gov.au
E-mail: [email protected]
The information in this publication is presented in good faith and on the basis that
neither the Commonwealth or BTR, nor agents or employees, are liable (whether by
reason of error, omission, negligence, lack of care or otherwise) to any person for any damage or loss whatsoever which has occurred or may occur in relation to that
person taking or not taking (as the case may be) action in respect of any statement,
information or advice given in the publication.
ISBN 0 642 28549 7
This work is copyright. Apart from any use as permitted under the Copyright
Act, 1968, no part may be produced without the written permission of the Bureau
of Tourism Research or the Cultural Ministers’ Council Statistics Working Group.
This work should be referenced as:
Heaney, L. and Salma, U. (2003 ), Economic Impact of Cultural Tourists in Australia,
Bureau of Tourism Research, Canberra.
© Copyright, Commonwealth of Australia, 2003
8/4/2019 Economic Impact of Cultural Tourists in Australia
http://slidepdf.com/reader/full/economic-impact-of-cultural-tourists-in-australia 3/33
iiiEconomic Impact of Cultural Tourists in Australia
Contents
Acknowledgements ii
Summary v
1. Cultural Tourism Trends 1
1.1 Definition of a cultural visitor 1
1.2 International cultural visitors in Australia 1
1.3 Domestic cultural visitors in Australia 2
2. Methodology 4
3. Itemised Cultural Visitor Expenditure 6
3.1 Itemised expenditure by international cultural visitors 6
3.2 Itemised expenditure by domestic overnight cultural visitors 7
3.3 Itemised expenditure by domestic day cultural visitors 9
4. Cultural Visitorsʼ Economic Contribution 12
4.1 Gross domestic product (GDP) and gross value added (GVA) 12
4.2 Tourism consumption 14
4.3 Employment and wages 14
5. Conclusion 16
6. References 17
Appendix A:Itemised Expenditure by Cultural Visitors 1997/98 – 2000/01 18
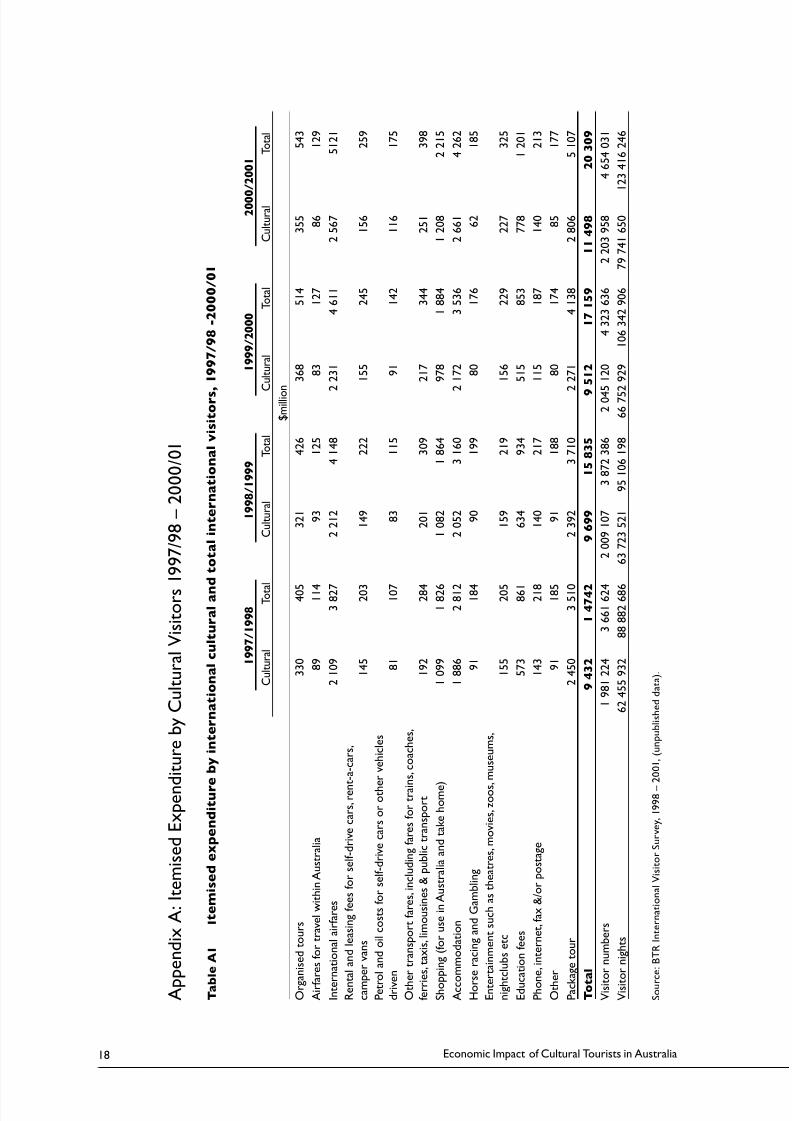
A1 Itemised expenditure by international cultural and total 18
international visitors, 1997/98 -2000/01
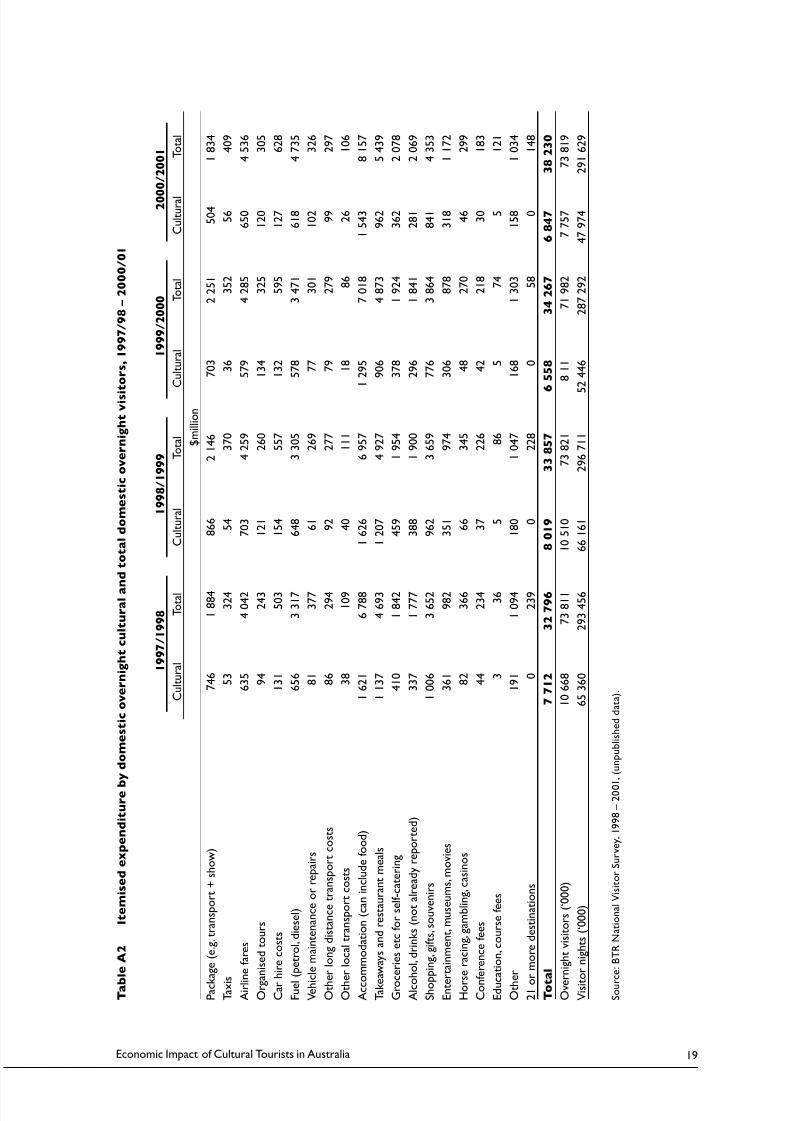
A2 Itemised expenditure by domestic overnight cultural and 19
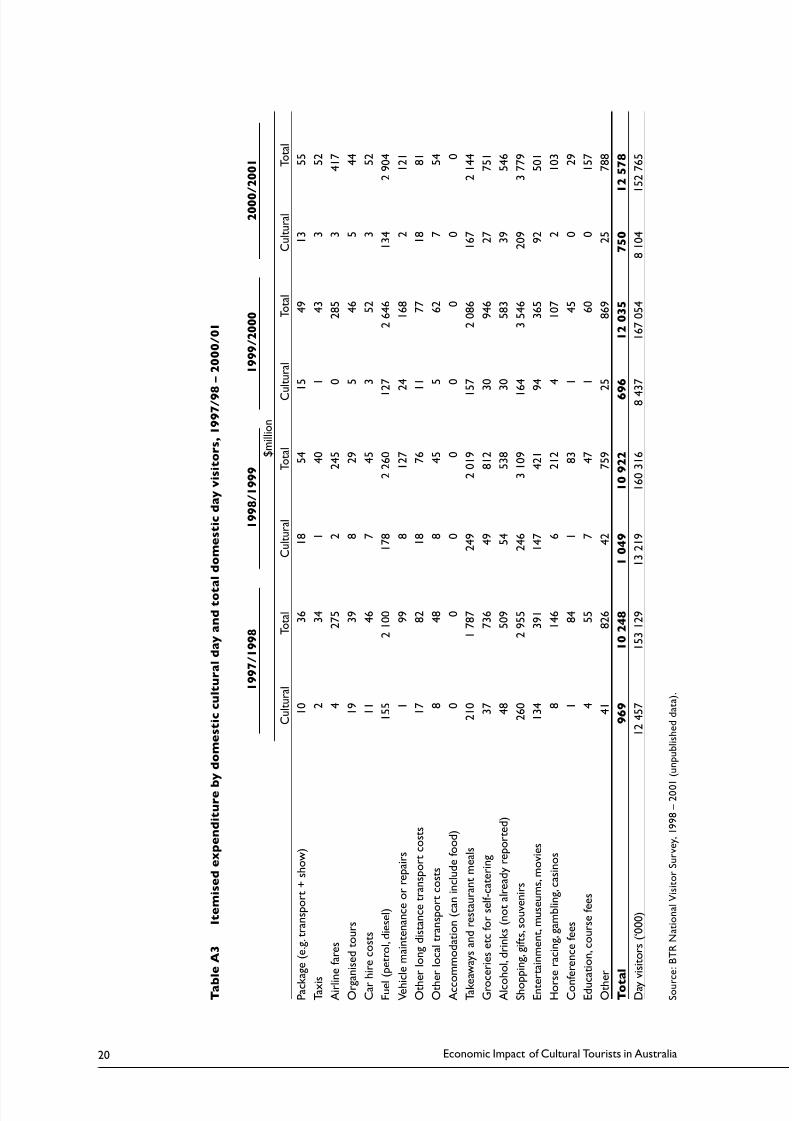
total domestic overnight visitors, 1997/98 – 2000/01A3 Itemised expenditure by domestic cultural day and total 20
domestic day visitors, 1997/98 – 2000/01
Appendix B: Cultural Tourismʼs Economic Contribution 21
B1 Gross value added (GVA) 21
B2 Tourism consumption 22
B3 Employment 23
B4 Wages and supplements 24
Appendix C: Tourism GVA and tourism GDP 25
Appendix D: Tourism Consumption 26

8/4/2019 Economic Impact of Cultural Tourists in Australia
http://slidepdf.com/reader/full/economic-impact-of-cultural-tourists-in-australia 4/33
8/4/2019 Economic Impact of Cultural Tourists in Australia
http://slidepdf.com/reader/full/economic-impact-of-cultural-tourists-in-australia 5/33
vEconomic Impact of Cultural Tourists in Australia
Summary
Over the years 1997/98 to 2000/01 cultural visitors spent around $18.2 billion per annum
on goods and services while travelling in Australia. Cultural visitors accounted for
2.1 million international visitors, 9.3 million domestic overnight visitors and 10.6 millionday visitors annually and contributed approximately $7 billion to Australia’s Gross
Value Added (GVA) over the period 1997/98 – 2000/01. This was in effect 28.1 per cent
of tourism’s total contribution to GVA or 1.2 per cent of Australia’s GVA. International
cultural visitors contributed $8.7 billion to export earnings in 2000/01. Cultural visitors
also supported the employment of 146 200 Australians and contributed $4.3 billion per
annum to Australia’s wages over the years 1997/98 to 2000/01. It is also interesting to
note that compared to all visitors, on average, cultural visitors tended to consume goods
and services in industries which generated higher levels of gross value added.
Both domestic and international cultural visitors tended to take longer trips (in terms
of visitor nights) than their non cultural counterparts and as a result had a higher than
average trip expenditure. Accommodation and food was the main item of expenditurefor domestic cultural visitors and the second highest item for international cultural
visitors after international airfares. Expenditure on entertainment (such as theatre) and
package tours (which often included cultural activities) also featured more highly for
cultural visitors than non cultural visitors.
This report examines the expenditure habits of both international and domestic cultural
visitors over the four year period 1997/98 – 2000/01. It then estimates the economic
contribution of cultural visitors at the national level, examining their impact on
employment, wages and supplements, gross value added and tourism consumption by
industry.

8/4/2019 Economic Impact of Cultural Tourists in Australia
http://slidepdf.com/reader/full/economic-impact-of-cultural-tourists-in-australia 6/33
8/4/2019 Economic Impact of Cultural Tourists in Australia
http://slidepdf.com/reader/full/economic-impact-of-cultural-tourists-in-australia 7/33
1Economic Impact of Cultural Tourists in Australia
1. Cultural Tourism Trends
Australia is increasingly recognised as an exciting, unique, diverse, and sophisticated
tourist destination which has much to interest visitors beyond its world-renowned
natural attractions. Australia has a wide range of cultural assets including museums, art
galleries, historic and indigenous sites, performing arts and live concerts designed toenrich, educate and entertain visitors (Foo et al 1998).
Identifying the spending patterns and economic contribution of cultural visitors
highlights the economic role of arts and culture in the community. Not only do arts and
culture develop our sense of identity and knowledge as a community, but also contribute
significantly to local economies across Australia.
On average over the four year period there were a total of 21.8 million international,
domestic overnight and domestic day visitors per annum who engaged in a cultural
activity while travelling in Australia. These cultural visitors spent on average a total
of $18.2 billion per annum, or 29 per cent of total tourism expenditure in Australia.
International cultural visitors accounted for an average of $10 billion or 59 per cent of this total cultural visitor expenditure and consistently had higher levels of expenditure
than domestic cultural visitors.
1.1 Denition of a cultural visitorFor the purpose of this report, a cultural visitor is defined as a visitor who attends
one or more cultural attractions in Australia including: (1) Theatre, concerts or other
performing arts, (2) Museums or art galleries, (3) Art/craft workshops/ studios, (4)
Festivals/fairs or cultural events, (5) Aboriginal art/craft and cultural displays, (6) An
Aboriginal site/community, and (7) History/heritage buildings, sites or monuments.
This definition reflects data collected through the International Visitor Survey and
National Visitor Survey conducted by the Bureau of Tourism Research.
This approach defines cultural visitors according to activities they undertook while
travelling. It does not focus on the participant’s motivation for travelling. In adopting
this definition it is recognised that many visitors engage in cultural activities as part of
a wider tourism experience and do not travel exclusively to experience cultural tourism.
It follows that their expenditure and consequently their economic contribution to the
Australian economy are not solely related to their cultural activity.
1.2 International cultural visitors in AustraliaIn recent years the number of international visitors who engaged in cultural activities
has followed a similar trend to that of all international visitors to Australia, increasing
every year between 1998/99 and 2000/01 and resulting in a 16 per cent increase over
the period. Although this increase in international cultural visitors is significant it is
not as great as the increase in total international visitor arrivals, which increased by
27 per cent over the same period. This resulted in the proportion of cultural visitors in
the international visitor market decreasing from 54 per cent in 1997/98 to 47 per cent in
2000/01.
International cultural visitor nights have followed a similar trend to visitor arrivals,
showing significant annual increases to 2000/01. The average length of stay for cultural
visitors increased over the period, from 31 nights in 1997/98 to 36 nights in 2000/01.
While the average length of stay for all visitors also increased over the period, theincrease was proportionately less, from 24 to 27 nights.
8/4/2019 Economic Impact of Cultural Tourists in Australia
http://slidepdf.com/reader/full/economic-impact-of-cultural-tourists-in-australia 8/33
Economic Impact of Cultural Tourists in Australia2
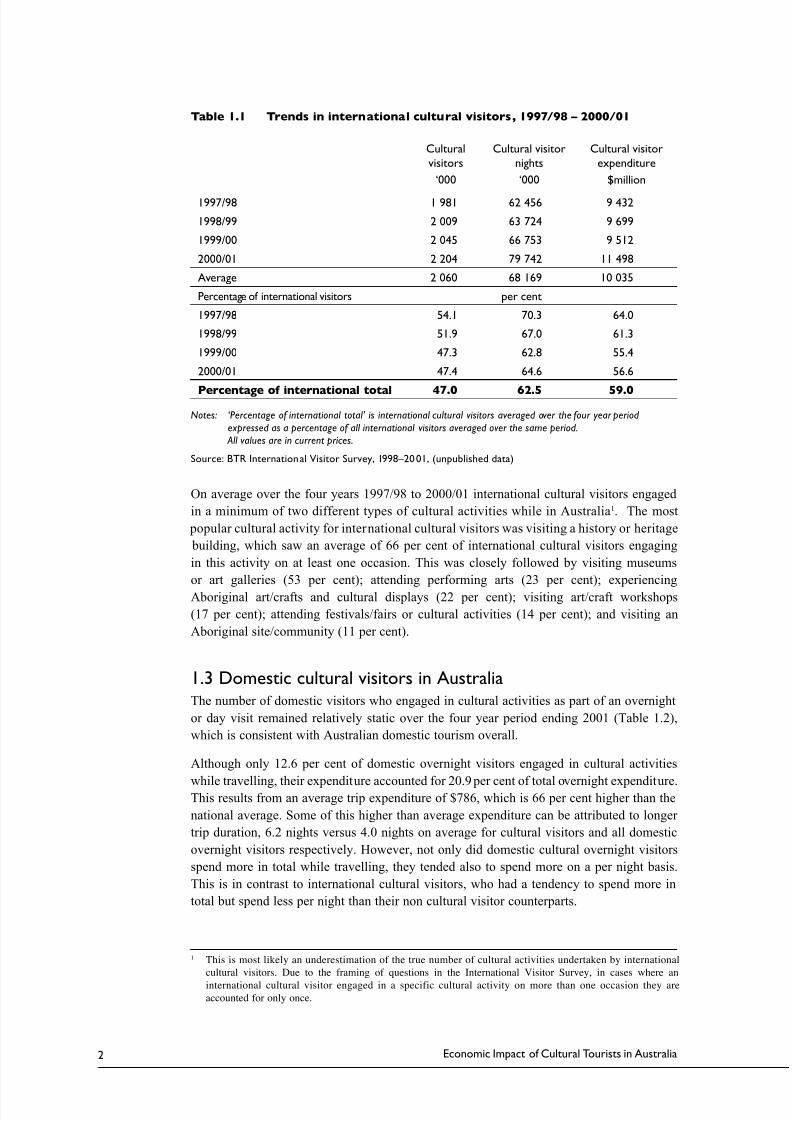
Table 1.1 Trends in international cultural visitors, 1997/98 – 2000/01
Cultural
visitors
Cultural visitor
nights
Cultural visitor
expenditure
‘000 ‘000 $million
1997/98 1 981 62 456 9 432
1998/99 2 009 63 724 9 699
1999/00 2 045 66 753 9 512
2000/01 2 204 79 742 11 498
Average 2 060 68 169 10 035
Percentage of international visitors per cent
1997/98 54.1 70.3 64.0
1998/99 51.9 67.0 61.3
1999/00 47.3 62.8 55.4
2000/01 47.4 64.6 56.6
Percentage of international total 47.0 62.5 59.0
Notes: ‘Percentage of international total’ is international cultural visitors averaged over the four year period
expressed as a percentage of all international visitors averaged over the same period.
All values are in current prices.
Source: BTR International Visitor Survey, 1998–2001, (unpublished data)
On average over the four years 1997/98 to 2000/01 international cultural visitors engaged
in a minimum of two different types of cultural activities while in Australia1. The most
popular cultural activity for international cultural visitors was visiting a history or heritage
building, which saw an average of 66 per cent of international cultural visitors engaging
in this activity on at least one occasion. This was closely followed by visiting museums
or art galleries (53 per cent); attending performing arts (23 per cent); experiencing
Aboriginal art/crafts and cultural displays (22 per cent); visiting art/craft workshops
(17 per cent); attending festivals/fairs or cultural activities (14 per cent); and visiting an
Aboriginal site/community (11 per cent).
1.3 Domestic cultural visitors in AustraliaThe number of domestic visitors who engaged in cultural activities as part of an overnight
or day visit remained relatively static over the four year period ending 2001 (Table 1.2),
which is consistent with Australian domestic tourism overall.
Although only 12.6 per cent of domestic overnight visitors engaged in cultural activities
while travelling, their expenditure accounted for 20.9 per cent of total overnight expenditure.This results from an average trip expenditure of $786, which is 66 per cent higher than the
national average. Some of this higher than average expenditure can be attributed to longer
trip duration, 6.2 nights versus 4.0 nights on average for cultural visitors and all domestic
overnight visitors respectively. However, not only did domestic cultural overnight visitors
spend more in total while travelling, they tended also to spend more on a per night basis.
This is in contrast to international cultural visitors, who had a tendency to spend more in
total but spend less per night than their non cultural visitor counterparts.
1 This is most likely an underestimation of the true number of cultural activities undertaken by international
cultural visitors. Due to the framing of questions in the International Visitor Survey, in cases where an
international cultural visitor engaged in a specific cultural activity on more than one occasion they areaccounted for only once.
8/4/2019 Economic Impact of Cultural Tourists in Australia
http://slidepdf.com/reader/full/economic-impact-of-cultural-tourists-in-australia 9/33
3Economic Impact of Cultural Tourists in Australia
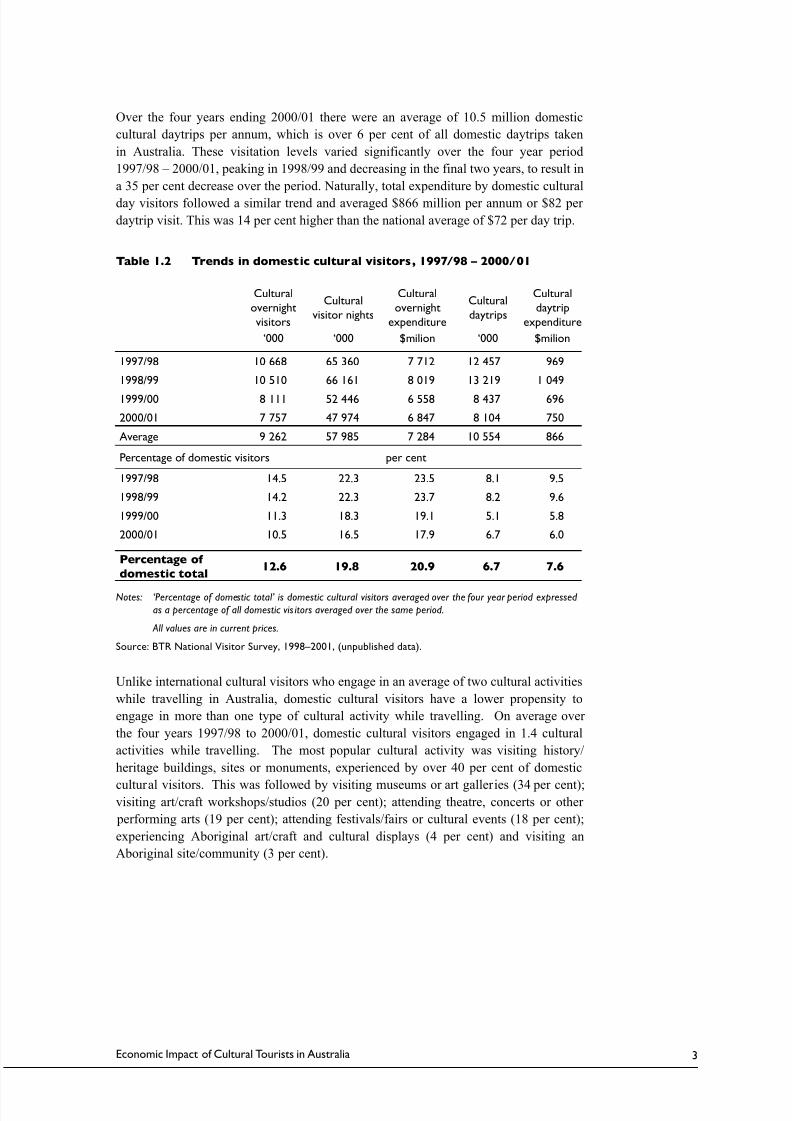
Over the four years ending 2000/01 there were an average of 10.5 million domestic
cultural daytrips per annum, which is over 6 per cent of all domestic daytrips taken
in Australia. These visitation levels varied significantly over the four year period
1997/98 – 2000/01, peaking in 1998/99 and decreasing in the final two years, to result in
a 35 per cent decrease over the period. Naturally, total expenditure by domestic cultural
day visitors followed a similar trend and averaged $866 million per annum or $82 per
daytrip visit. This was 14 per cent higher than the national average of $72 per day trip.
Table 1.2 Trends in domestic cultural visitors, 1997/98 – 2000/01
Cultural
overnight
visitors
Cultural
visitor nights
Cultural
overnight
expenditure
Cultural
daytrips
Cultural
daytrip
expenditure
‘000 ‘000 $milion ‘000 $milion
1997/98 10 668 65 360 7 712 12 457 969
1998/99 10 510 66 161 8 019 13 219 1 049
1999/00 8 111 52 446 6 558 8 437 696
2000/01 7 757 47 974 6 847 8 104 750
Average 9 262 57 985 7 284 10 554 866
Percentage of domestic visitors per cent
1997/98 14.5 22.3 23.5 8.1 9.5
1998/99 14.2 22.3 23.7 8.2 9.6
1999/00 11.3 18.3 19.1 5.1 5.8
2000/01 10.5 16.5 17.9 6.7 6.0
Percentage of
domestic total12.6 19.8 20.9 6.7 7.6
Notes: ‘Percentage of domestic total’ is domestic cultural visitors averaged over the four year period expressed
as a percentage of all domestic vis itors averaged over the same period.
All values are in current prices.
Source: BTR National Visitor Survey, 1998–2001, (unpublished data).
Unlike international cultural visitors who engage in an average of two cultural activities
while travelling in Australia, domestic cultural visitors have a lower propensity to
engage in more than one type of cultural activity while travelling. On average over
the four years 1997/98 to 2000/01, domestic cultural visitors engaged in 1.4 cultural
activities while travelling. The most popular cultural activity was visiting history/
heritage buildings, sites or monuments, experienced by over 40 per cent of domestic
cultural visitors. This was followed by visiting museums or art galleries (34 per cent);visiting art/craft workshops/studios (20 per cent); attending theatre, concerts or other
performing arts (19 per cent); attending festivals/fairs or cultural events (18 per cent);
experiencing Aboriginal art/craft and cultural displays (4 per cent) and visiting an
Aboriginal site/community (3 per cent).
8/4/2019 Economic Impact of Cultural Tourists in Australia
http://slidepdf.com/reader/full/economic-impact-of-cultural-tourists-in-australia 10/33
8/4/2019 Economic Impact of Cultural Tourists in Australia
http://slidepdf.com/reader/full/economic-impact-of-cultural-tourists-in-australia 11/33
5Economic Impact of Cultural Tourists in Australia
It should be noted that due to differing definitions used by the ABS and the BTR, there
are differences in tourism consumption and tourism expenditure as used in Section 3 and
4 of this report. ‘Tourism expenditure’ which is discussed in section 3, is defined by the
BTR as total expenditure by visitors in Australia. As tourism expenditure is defined by
the visitor, it includes all expenditure in Australia as well as some expenditure on itemswhere part of the income accrues outside Australia, such as expenditure on international
airfares to non Australian airlines and expenditure on package tours which includes non
Australian components. In section 4 of this report ‘tourism consumption’ as defined
by the ABS excludes the part of these items of expenditure where the income does not
accrue within Australia while other items, discussed in Appendix D, are included.
8/4/2019 Economic Impact of Cultural Tourists in Australia
http://slidepdf.com/reader/full/economic-impact-of-cultural-tourists-in-australia 12/33
Economic Impact of Cultural Tourists in Australia6
3. Itemised Cultural Visitor Expenditure
The itemised expenditure of international, domestic overnight and domestic day cultural
and all visitors is discussed in this section. The results are presented as an average over
the four year period 1997/98 – 2000/01, and a proportion of cultural visitors’ expenditure,against total visitors, is provided to assist in identifying important expenditure items.
Annual results for the four years are given in Appendix A.
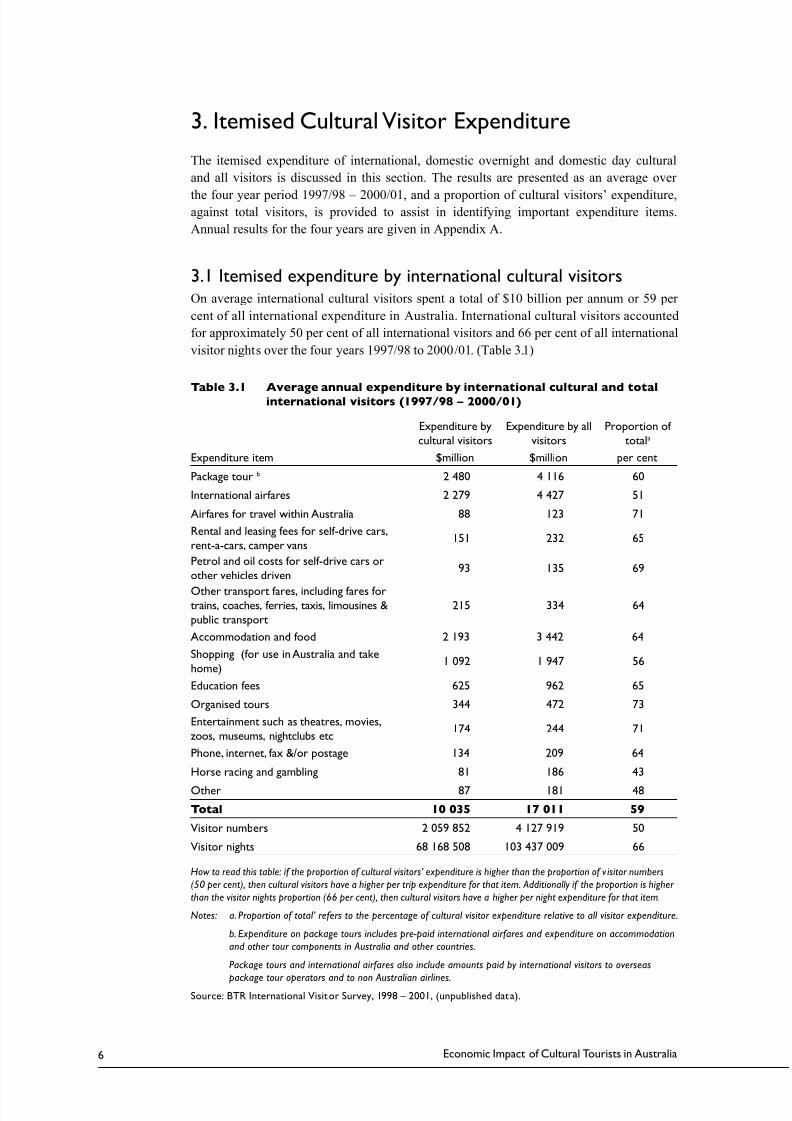
3.1 Itemised expenditure by international cultural visitorsOn average international cultural visitors spent a total of $10 billion per annum or 59 per
cent of all international expenditure in Australia. International cultural visitors accounted
for approximately 50 per cent of all international visitors and 66 per cent of all international
visitor nights over the four years 1997/98 to 2000/01. (Table 3.1)
Table 3.1 Average annual expenditure by international cultural and totalinternational visitors (1997/98 – 2000/01)
Expenditure by
cultural visitors
Expenditure by all
visitors
Proportion of
totala
Expenditure item $million $million per cent
Package tour b 2 480 4 116 60
International airfares 2 279 4 427 51
Airfares for travel within Australia 88 123 71
Rental and leasing fees for self-drive cars,
rent-a-cars, camper vans151 232 65
Petrol and oil costs for self-drive cars or
other vehicles driven93 135 69
Other transport fares, including fares fortrains, coaches, ferries, taxis, limousines &
public transport
215 334 64
Accommodation and food 2 193 3 442 64
Shopping (for use in Australia and take
home)1 092 1 947 56
Education fees 625 962 65
Organised tours 344 472 73
Entertainment such as theatres, movies,
zoos, museums, nightclubs etc174 244 71
Phone, internet, fax &/or postage 134 209 64
Horse racing and gambling 81 186 43
Other 87 181 48
Total 10 035 17 011 59
Visitor numbers 2 059 852 4 127 919 50
Visitor nights 68 168 508 103 437 009 66
How to read this table: if the proportion of cultural visitors’ expenditure is higher than the proportion of v isitor numbers
(50 per cent), then cultural visitors have a higher per trip expenditure for that item. Additionally if the proportion is higher
than the visitor nights proportion (66 per cent), then cultural visitors have a higher per night expenditure for that item.
Notes: a. Proportion of total’ refers to the percentage of cultural visitor expenditure relative to all visitor expenditure.
b. Expenditure on package tours includes pre-paid international airfares and expenditure on accommodation
and other tour components in Australia and other countries.
Package tours and international airfares also include amounts paid by international visitors to overseas
package tour operators and to non Australian airlines.Source: BTR International Visitor Survey, 1998 – 2001, (unpublished data).
8/4/2019 Economic Impact of Cultural Tourists in Australia
http://slidepdf.com/reader/full/economic-impact-of-cultural-tourists-in-australia 13/33
7Economic Impact of Cultural Tourists in Australia
On average, each international cultural visitor spent $4 872 during their stay in Australia.
This was approximately 18 per cent more than the average expenditure by each inbound
visitor ($4 121). On a per night basis however, cultural visitors spent slightly less ($147 per
night) than the average for all international visitors ($164 per night).
Given that cultural visitors tend to take longer trips (in terms of visitor nights) thanall inbound visitors it is not surprising that they have a higher per trip expenditure on
accommodation and food than all international visitors. Accommodation and food is
cultural visitors’ third greatest expense in Australia, accounting for over 22 per cent of their
trip expenditure in Australia.
International cultural visitors also tend to have a higher than average expenditure on both
land and air transport while in Australia spending a total of $459 million and $88 million
per annum respectively. Expenditure on ‘entertainment’ also features as an item with higher
than average expenditure by cultural visitors, accounting for $174 million per annum or
71 per cent of all international visitor expenditure on entertainment.
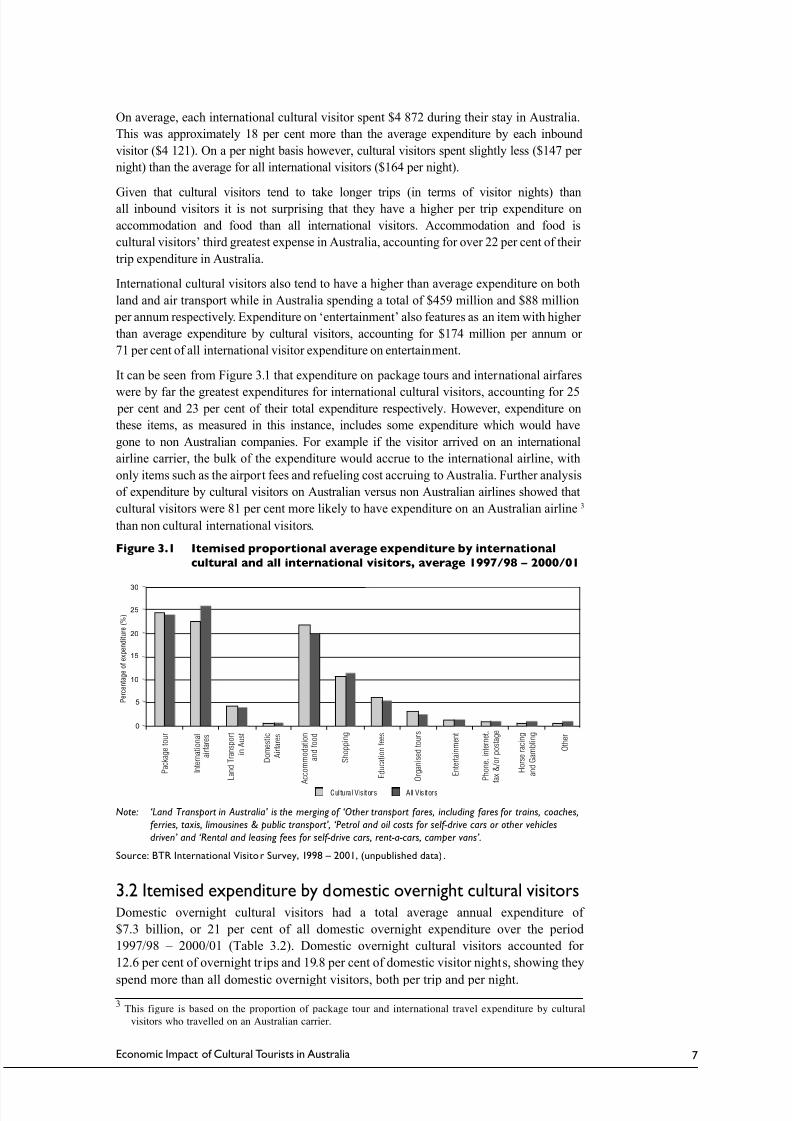
It can be seen from Figure 3.1 that expenditure on package tours and international airfares
were by far the greatest expenditures for international cultural visitors, accounting for 25 per cent and 23 per cent of their total expenditure respectively. However, expenditure on
these items, as measured in this instance, includes some expenditure which would have
gone to non Australian companies. For example if the visitor arrived on an international
airline carrier, the bulk of the expenditure would accrue to the international airline, with
only items such as the airport fees and refueling cost accruing to Australia. Further analysis
of expenditure by cultural visitors on Australian versus non Australian airlines showed that
cultural visitors were 81 per cent more likely to have expenditure on an Australian airline3
than non cultural international visitors.
Figure 3.1 Itemised proportional average expenditure by international
cultural and all international visitors, average 1997/98 – 2000/01
Note: ‘Land Transport in Australia’ is the merging of ‘Other transport fares, including fares for trains, coaches,
ferries, taxis, limousines & public transport’, ‘Petrol and oil costs for self-drive cars or other vehicles
driven’ and ‘Rental and leasing fees for self-drive cars, rent-a-cars, camper vans’.
Source: BTR International Visitor Survey, 1998 – 2001, (unpublished data) .
3.2 Itemised expenditure by domestic overnight cultural visitorsDomestic overnight cultural visitors had a total average annual expenditure of
$7.3 billion, or 21 per cent of all domestic overnight expenditure over the period
1997/98 – 2000/01 (Table 3.2). Domestic overnight cultural visitors accounted for
12.6 per cent of overnight trips and 19.8 per cent of domestic visitor nights, showing they
spend more than all domestic overnight visitors, both per trip and per night.
0
5
10
15
20
25
30
�
�
�
3This figure is based on the proportion of package tour and international travel expenditure by cultural
visitors who travelled on an Australian carrier.
8/4/2019 Economic Impact of Cultural Tourists in Australia
http://slidepdf.com/reader/full/economic-impact-of-cultural-tourists-in-australia 14/33
Economic Impact of Cultural Tourists in Australia8
Table 3.2 Average annual expenditure by domestic overnight cultural
visitors and all domestic overnight visitors (1997/98 – 2000/01)
Expenditure by cultural
visitors
Expenditure by all
visitors
Proportion of
totala
Expenditure item $million $million per cent
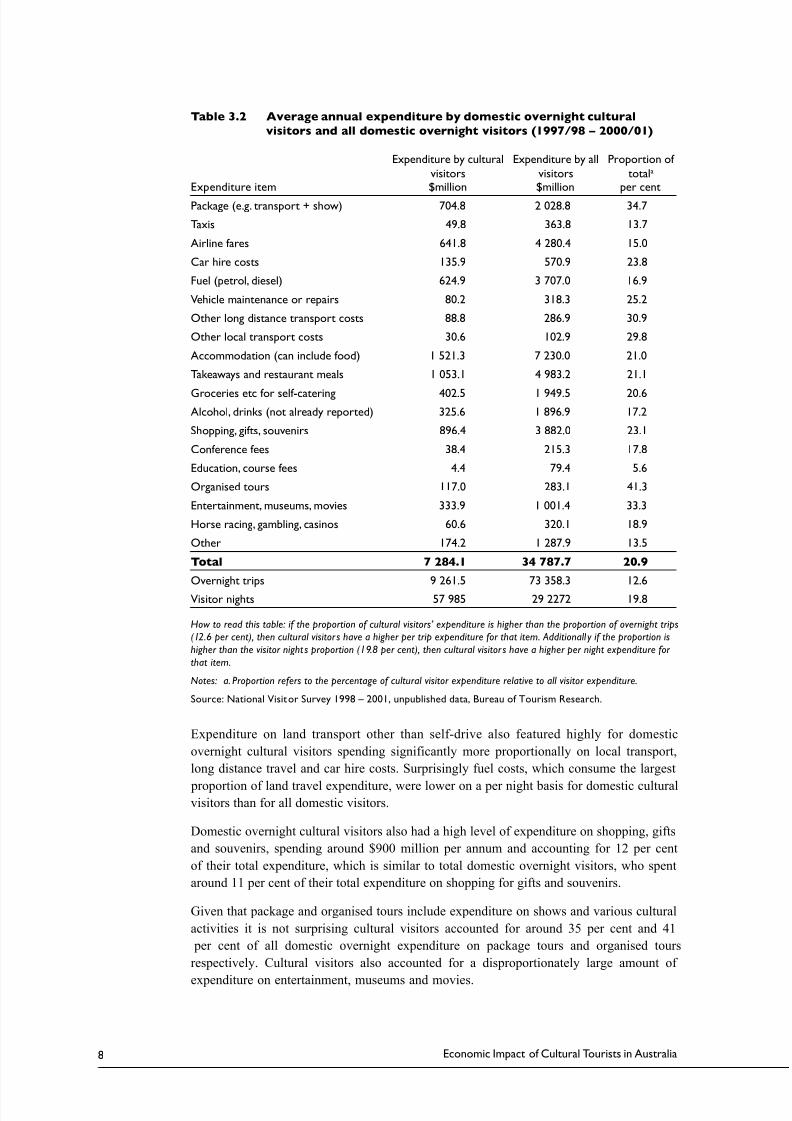
Package (e.g. transport + show) 704.8 2 028.8 34.7
Taxis 49.8 363.8 13.7
Airline fares 641.8 4 280.4 15.0
Car hire costs 135.9 570.9 23.8
Fuel (petrol, diesel) 624.9 3 707.0 16.9
Vehicle maintenance or repairs 80.2 318.3 25.2
Other long distance transport costs 88.8 286.9 30.9
Other local transport costs 30.6 102.9 29.8
Accommodation (can include food) 1 521.3 7 230.0 21.0
Takeaways and restaurant meals 1 053.1 4 983.2 21.1
Groceries etc for self-catering 402.5 1 949.5 20.6
Alcohol, drinks (not already reported) 325.6 1 896.9 17.2
Shopping, gifts, souvenirs 896.4 3 882.0 23.1
Conference fees 38.4 215.3 17.8
Education, course fees 4.4 79.4 5.6
Organised tours 117.0 283.1 41.3
Entertainment, museums, movies 333.9 1 001.4 33.3
Horse racing, gambling, casinos 60.6 320.1 18.9
Other 174.2 1 287.9 13.5
Total 7 284.1 34 787.7 20.9
Overnight trips 9 261.5 73 358.3 12.6
Visitor nights 57 985 29 2272 19.8
How to read this table: if the proportion of cultural visitors’ expenditure is higher than the proportion of overnight trips
(12.6 per cent), then cultural visitor s have a higher per trip expenditure for that item. Additionall y if the proportion is
higher than the visitor night s proportion (19.8 per cent), then cultural visitor s have a higher per night expenditure for
that item.
Notes: a. Proportion refers to the percentage of cultural visitor expenditure relative to all visitor expenditure.
Source: National Visitor Survey 1998 – 2001, unpublished data, Bureau of Tourism Research.
Expenditure on land transport other than self-drive also featured highly for domestic
overnight cultural visitors spending significantly more proportionally on local transport,
long distance travel and car hire costs. Surprisingly fuel costs, which consume the largest
proportion of land travel expenditure, were lower on a per night basis for domestic culturalvisitors than for all domestic visitors.
Domestic overnight cultural visitors also had a high level of expenditure on shopping, gifts
and souvenirs, spending around $900 million per annum and accounting for 12 per cent
of their total expenditure, which is similar to total domestic overnight visitors, who spent
around 11 per cent of their total expenditure on shopping for gifts and souvenirs.
Given that package and organised tours include expenditure on shows and various cultural
activities it is not surprising cultural visitors accounted for around 35 per cent and 41
per cent of all domestic overnight expenditure on package tours and organised tours
respectively. Cultural visitors also accounted for a disproportionately large amount of
expenditure on entertainment, museums and movies.
8/4/2019 Economic Impact of Cultural Tourists in Australia
http://slidepdf.com/reader/full/economic-impact-of-cultural-tourists-in-australia 15/33
9Economic Impact of Cultural Tourists in Australia
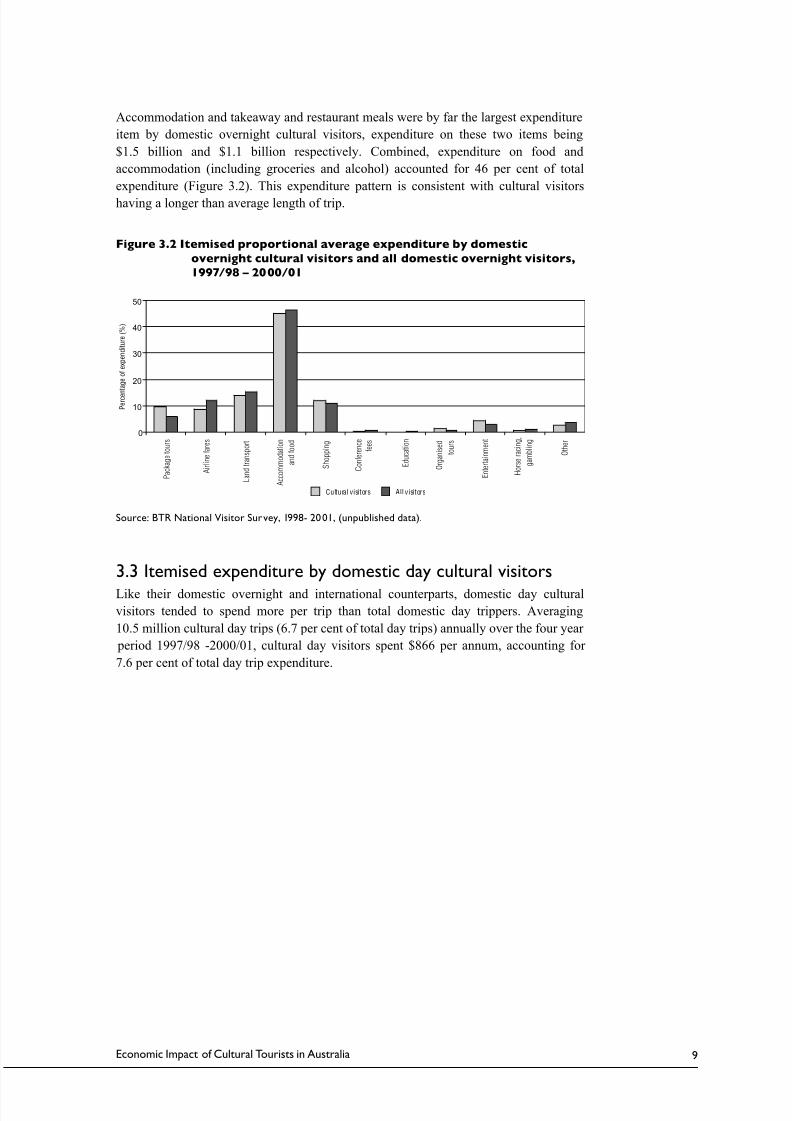
Accommodation and takeaway and restaurant meals were by far the largest expenditure
item by domestic overnight cultural visitors, expenditure on these two items being
$1.5 billion and $1.1 billion respectively. Combined, expenditure on food and
accommodation (including groceries and alcohol) accounted for 46 per cent of total
expenditure (Figure 3.2). This expenditure pattern is consistent with cultural visitors
having a longer than average length of trip.
Figure 3.2 Itemised proportional average expenditure by domestic
overnight cultural visitors and all domestic overnight visitors,1997/98 – 2000/01
Source: BTR National Visitor Survey, 1998- 2001, (unpublished data).
3.3 Itemised expenditure by domestic day cultural visitors
Like their domestic overnight and international counterparts, domestic day cultural
visitors tended to spend more per trip than total domestic day trippers. Averaging
10.5 million cultural day trips (6.7 per cent of total day trips) annually over the four year
period 1997/98 -2000/01, cultural day visitors spent $866 per annum, accounting for
7.6 per cent of total day trip expenditure.
0
10
20
30
40
50
�
�
�
8/4/2019 Economic Impact of Cultural Tourists in Australia
http://slidepdf.com/reader/full/economic-impact-of-cultural-tourists-in-australia 16/33
Economic Impact of Cultural Tourists in Australia10
Table 3.3 Average annual expenditure by domestic day cultural visitors and
all domestic day visitors (1997/98 – 2000/01)
Expenditure by
cultural visitors
Expenditure by all
visitors
Proportion of
totala
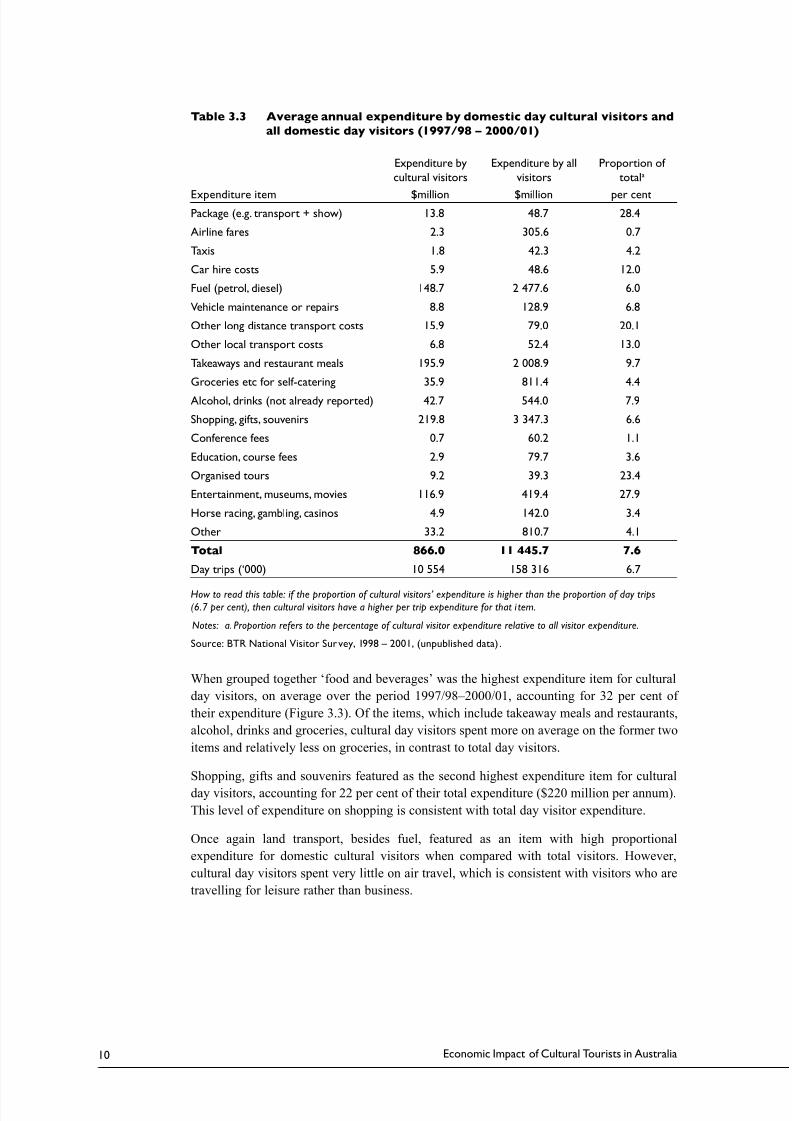
Expenditure item $million $million per centPackage (e.g. transport + show) 13.8 48.7 28.4
Airline fares 2.3 305.6 0.7
Taxis 1.8 42.3 4.2
Car hire costs 5.9 48.6 12.0
Fuel (petrol, diesel) 148.7 2 477.6 6.0
Vehicle maintenance or repairs 8.8 128.9 6.8
Other long distance transport costs 15.9 79.0 20.1
Other local transport costs 6.8 52.4 13.0
Takeaways and restaurant meals 195.9 2 008.9 9.7
Groceries etc for self-catering 35.9 811.4 4.4
Alcohol, drinks (not already reported) 42.7 544.0 7.9
Shopping, gifts, souvenirs 219.8 3 347.3 6.6
Conference fees 0.7 60.2 1.1
Education, course fees 2.9 79.7 3.6
Organised tours 9.2 39.3 23.4
Entertainment, museums, movies 116.9 419.4 27.9
Horse racing, gambling, casinos 4.9 142.0 3.4
Other 33.2 810.7 4.1
Total 866.0 11 445.7 7.6
Day trips (‘000) 10 554 158 316 6.7
How to read this table: if the proportion of cultural visitors’ expenditure is higher than the proportion of day trips
(6.7 per cent), then cultural visitors have a higher per trip expenditure for that i tem.
Notes: a. Proportion refers to the percentage of cultural visitor expenditure relative to all visitor expenditure.
Source: BTR National Visitor Sur vey, 1998 – 2001, (unpublished data) .
When grouped together ‘food and beverages’ was the highest expenditure item for cultural
day visitors, on average over the period 1997/98–2000/01, accounting for 32 per cent of
their expenditure (Figure 3.3). Of the items, which include takeaway meals and restaurants,
alcohol, drinks and groceries, cultural day visitors spent more on average on the former two
items and relatively less on groceries, in contrast to total day visitors.
Shopping, gifts and souvenirs featured as the second highest expenditure item for cultural
day visitors, accounting for 22 per cent of their total expenditure ($220 million per annum).
This level of expenditure on shopping is consistent with total day visitor expenditure.
Once again land transport, besides fuel, featured as an item with high proportional
expenditure for domestic cultural visitors when compared with total visitors. However,
cultural day visitors spent very little on air travel, which is consistent with visitors who are
travelling for leisure rather than business.
8/4/2019 Economic Impact of Cultural Tourists in Australia
http://slidepdf.com/reader/full/economic-impact-of-cultural-tourists-in-australia 17/33
11Economic Impact of Cultural Tourists in Australia
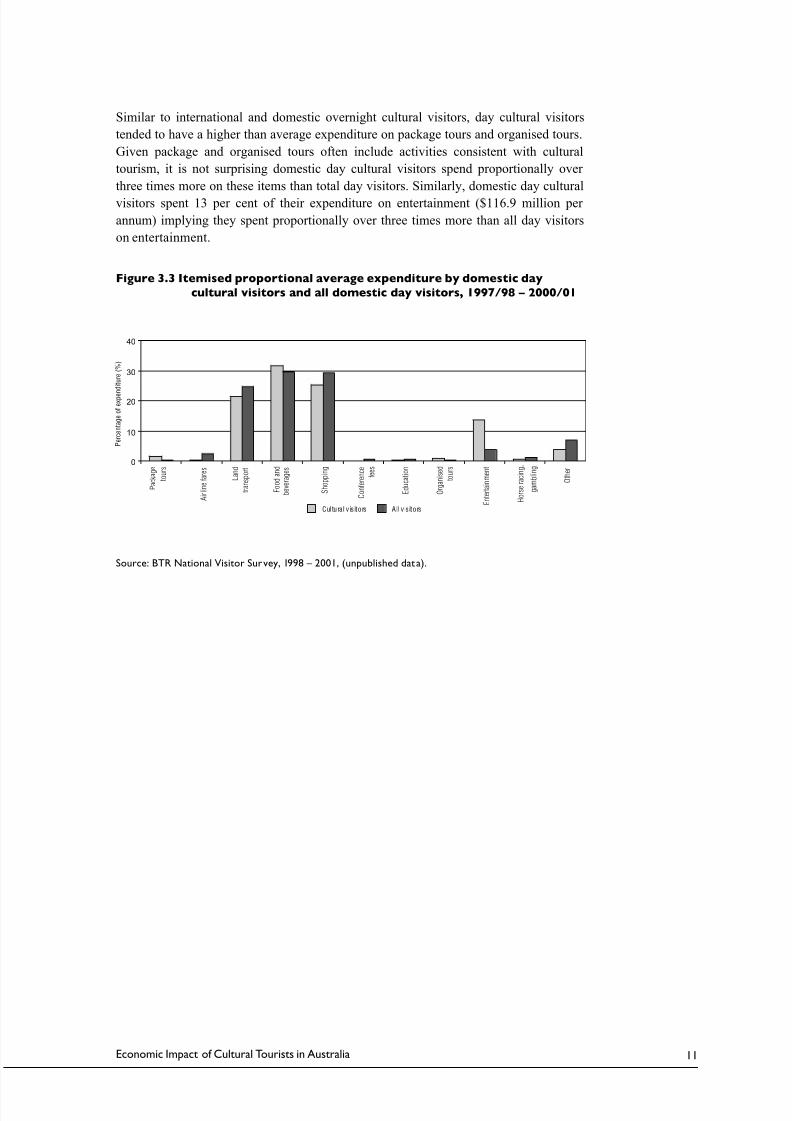
Similar to international and domestic overnight cultural visitors, day cultural visitors
tended to have a higher than average expenditure on package tours and organised tours.
Given package and organised tours often include activities consistent with cultural
tourism, it is not surprising domestic day cultural visitors spend proportionally over
three times more on these items than total day visitors. Similarly, domestic day cultural
visitors spent 13 per cent of their expenditure on entertainment ($116.9 million per
annum) implying they spent proportionally over three times more than all day visitors
on entertainment.
Figure 3.3 Itemised proportional average expenditure by domestic day
cultural visitors and all domestic day visitors, 1997/98 – 2000/01
Source: BTR National Visitor Survey, 1998 – 2001, (unpublished data).
0
10
20
30
40
�
�
�
8/4/2019 Economic Impact of Cultural Tourists in Australia
http://slidepdf.com/reader/full/economic-impact-of-cultural-tourists-in-australia 18/33
Economic Impact of Cultural Tourists in Australia12
4. Cultural Visitors’ Economic Contribution
Cultural visitors contributed $7.0 billion to total Gross Value Added (GVA) in 2000/01.
This represented 1.3 per cent of Australia’s total Gross Domestic Product (GDP) and 26.4
per cent of tourism’s contribution to GDP. However, cultural visitors’ economic contributionvaried over 1997/98 – 2000/01 as domestic and international cultural visitors’ expenditure
patterns shifted in amount and across industries.
In this section of the report the expenditure items detailed in Section 3 are used in
conjunction with BTR models and ATSA data to develop cultural tourism’s economic
contribution, in terms of GDP, GVA, consumption, employment and wages.
4.1 Gross domestic product (GDP) and gross value added (GVA)Tourism GDP is the share of the total market value of Australian produced goods and
services consumed by visitors after deducting the cost of goods and services used in
the process of production. Cultural tourism accounted for $8.4 billion of total GDP in2000/01. This represented 1.3 per cent of Australia’s total GDP and 27.7 per cent of tourism’s
contribution to GDP when averaged over the four years (Table 4.1).
Both tourism’s and cultural visitors’ share of GDP increased significantly in 2000/01,
largely due to a price increase in tourism services resulting from introduction of the Goods
and Services Tax (GST) in that year. Given that services comprise more than half of tourism
consumption, product taxes were levied on a substantial component of tourism for the first
time in 2000/01, so that taxes paid by visitors grew at a faster rate than overall product taxes
collected for the whole economy4.
Industry gross value added measures the value of production exclusive of product taxes
such as the GST, making it free from distortions in prices caused by changes in tax ratesor the introduction of new taxes over time5. In nominal terms over the years 1997/98 to
2000/01 cultural tourism contributed between $6.4 billion and $7.0 billion to GVA, which
was between 1.3 and 1.1 per cent of total industry GVA or 26.5 per cent of tourism’s total
contribution in 2000/01. Cultural visitors’ proportional contribution to total tourism GVA
varied over the period, with their greatest contribution in 1997/98 (30.8 per cent) before
declining to 25.8 per cent in 1999/00, and increasing again in 2000/01 to 26.6 per cent.
Almost $4 billion (57 per cent) of cultural tourism’s GVA in 2000/01 was generated from
international cultural visitors. This is in contrast to overall tourism, where international
visitors generated 24 per cent of GVA in 2000/01.
Interestingly, on average a dollar consumed by an international cultural visitor generates
more GVA ($0.45) than consumption by a domestic cultural visitor ($0.42), implying higher
levels of consumption by international cultural visitors of goods and services produced by
industries which generate higher levels of GVA. GVA is a measure of the ‘value’ which a
producer adds to the raw material goods and services purchased in the process of producing
its output. Industries that generate higher than average levels of GVA are industries that are
highly service orientated, such as accommodation, cultural and recreational services and
education, or generate high levels of profit such as education and transport and storage.
4 Tourism Satellite Account, Australian National Accounts 2000/01, Australian Bureau of Statistics,
Catalogue No 5249.0, Canberra 2002.5 Further discussion by the ABS of the definition and difference between GDP and GVA can be found
in Appendix C.

8/4/2019 Economic Impact of Cultural Tourists in Australia
http://slidepdf.com/reader/full/economic-impact-of-cultural-tourists-in-australia 19/33
8/4/2019 Economic Impact of Cultural Tourists in Australia
http://slidepdf.com/reader/full/economic-impact-of-cultural-tourists-in-australia 20/33
Economic Impact of Cultural Tourists in Australia14
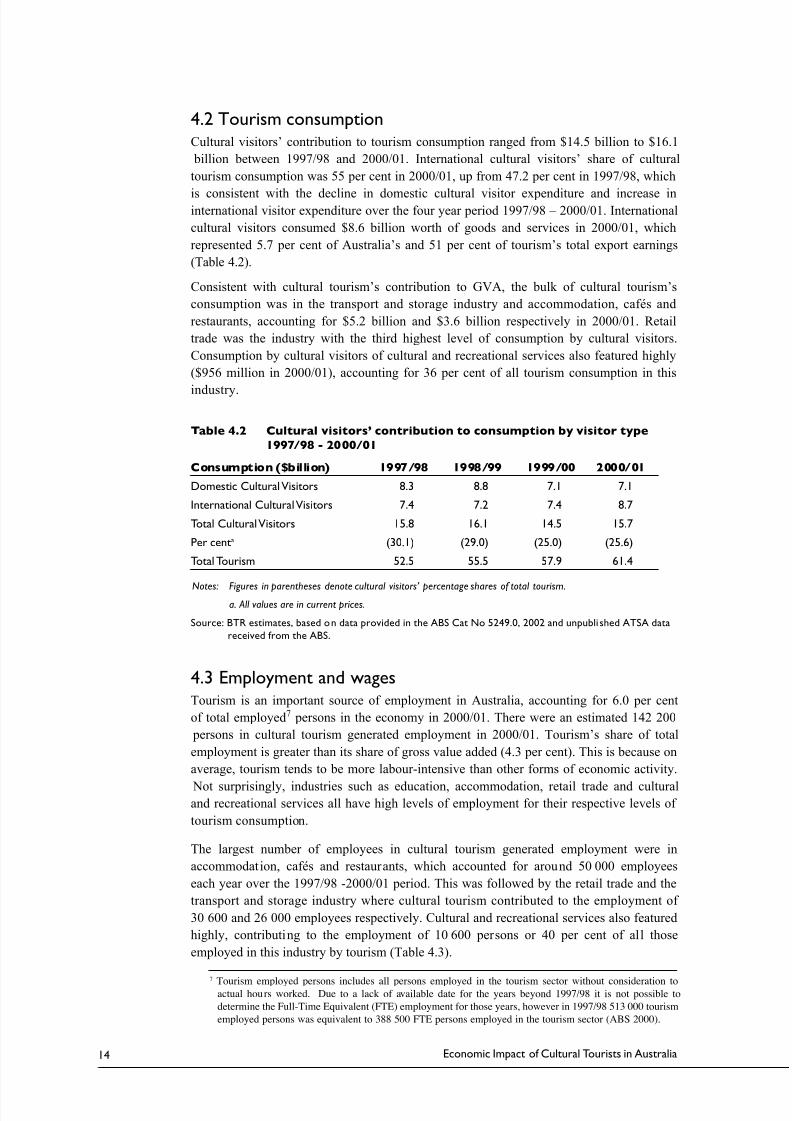
4.2 Tourism consumptionCultural visitors’ contribution to tourism consumption ranged from $14.5 billion to $16.1
billion between 1997/98 and 2000/01. International cultural visitors’ share of cultural
tourism consumption was 55 per cent in 2000/01, up from 47.2 per cent in 1997/98, which
is consistent with the decline in domestic cultural visitor expenditure and increase ininternational visitor expenditure over the four year period 1997/98 – 2000/01. International
cultural visitors consumed $8.6 billion worth of goods and services in 2000/01, which
represented 5.7 per cent of Australia’s and 51 per cent of tourism’s total export earnings
(Table 4.2).
Consistent with cultural tourism’s contribution to GVA, the bulk of cultural tourism’s
consumption was in the transport and storage industry and accommodation, cafés and
restaurants, accounting for $5.2 billion and $3.6 billion respectively in 2000/01. Retail
trade was the industry with the third highest level of consumption by cultural visitors.
Consumption by cultural visitors of cultural and recreational services also featured highly
($956 million in 2000/01), accounting for 36 per cent of all tourism consumption in this
industry.
Table 4.2 Cultural visitors’ contribution to consumption by visitor type
1997/98 - 2000/01
Consumption ($billion) 1997/98 1998/99 1999/00 2000/01
Domestic Cultural Visitors 8.3 8.8 7.1 7.1
International Cultural Visitors 7.4 7.2 7.4 8.7
Total Cultural Visitors 15.8 16.1 14.5 15.7
Per centa (30.1) (29.0) (25.0) (25.6)
Total Tourism 52.5 55.5 57.9 61.4
Notes: Figures in parentheses denote cultural visitors’ percentage shares of total tourism.a. All values are in current prices.
Source: BTR estimates, based on data provided in the ABS Cat No 5249.0, 2002 and unpubli shed ATSA data
received from the ABS.
4.3 Employment and wagesTourism is an important source of employment in Australia, accounting for 6.0 per cent
of total employed7 persons in the economy in 2000/01. There were an estimated 142 200
persons in cultural tourism generated employment in 2000/01. Tourism’s share of total
employment is greater than its share of gross value added (4.3 per cent). This is because on
average, tourism tends to be more labour-intensive than other forms of economic activity.
Not surprisingly, industries such as education, accommodation, retail trade and culturaland recreational services all have high levels of employment for their respective levels of
tourism consumption.
The largest number of employees in cultural tourism generated employment were in
accommodation, cafés and restaurants, which accounted for around 50 000 employees
each year over the 1997/98 -2000/01 period. This was followed by the retail trade and the
transport and storage industry where cultural tourism contributed to the employment of
30 600 and 26 000 employees respectively. Cultural and recreational services also featured
highly, contributing to the employment of 10 600 persons or 40 per cent of all those
employed in this industry by tourism (Table 4.3).
7
Tourism employed persons includes all persons employed in the tourism sector without consideration toactual hours worked. Due to a lack of available date for the years beyond 1997/98 it is not possible to
determine the Full-Time Equivalent (FTE) employment for those years, however in 1997/98 513 000 tourism
employed persons was equivalent to 388 500 FTE persons employed in the tourism sector (ABS 2000).
8/4/2019 Economic Impact of Cultural Tourists in Australia
http://slidepdf.com/reader/full/economic-impact-of-cultural-tourists-in-australia 21/33
15Economic Impact of Cultural Tourists in Australia
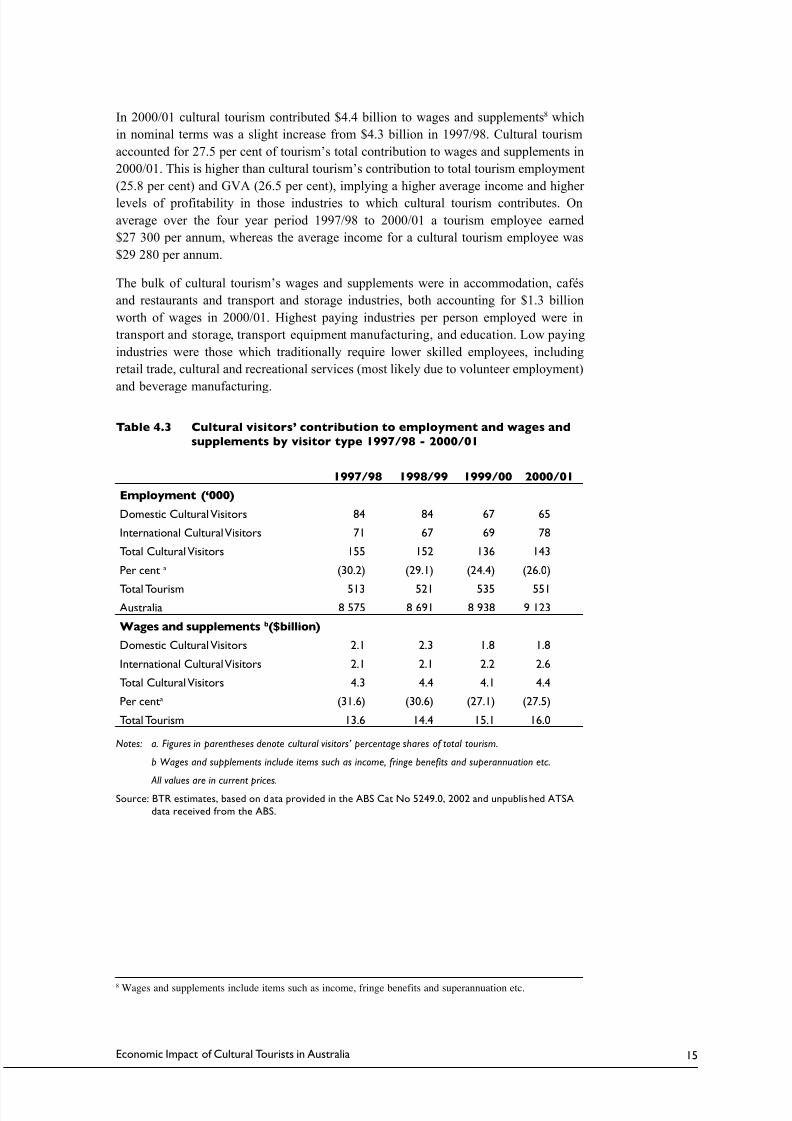
In 2000/01 cultural tourism contributed $4.4 billion to wages and supplements8 which
in nominal terms was a slight increase from $4.3 billion in 1997/98. Cultural tourism
accounted for 27.5 per cent of tourism’s total contribution to wages and supplements in
2000/01. This is higher than cultural tourism’s contribution to total tourism employment
(25.8 per cent) and GVA (26.5 per cent), implying a higher average income and higher
levels of profitability in those industries to which cultural tourism contributes. On
average over the four year period 1997/98 to 2000/01 a tourism employee earned
$27 300 per annum, whereas the average income for a cultural tourism employee was
$29 280 per annum.
The bulk of cultural tourism’s wages and supplements were in accommodation, cafés
and restaurants and transport and storage industries, both accounting for $1.3 billion
worth of wages in 2000/01. Highest paying industries per person employed were in
transport and storage, transport equipment manufacturing, and education. Low paying
industries were those which traditionally require lower skilled employees, including
retail trade, cultural and recreational services (most likely due to volunteer employment)
and beverage manufacturing.
Table 4.3 Cultural visitors’ contribution to employment and wages and
supplements by visitor type 1997/98 - 2000/01
1997/98 1998/99 1999/00 2000/01
Employment (‘000)
Domestic Cultural Visitors 84 84 67 65
International Cultural Visitors 71 67 69 78
Total Cultural Visitors 155 152 136 143
Per cent a (30.2) (29.1) (24.4) (26.0)
Total Tourism 513 521 535 551
Australia 8 575 8 691 8 938 9 123
Wages and supplements b($billion)
Domestic Cultural Visitors 2.1 2.3 1.8 1.8
International Cultural Visitors 2.1 2.1 2.2 2.6
Total Cultural Visitors 4.3 4.4 4.1 4.4
Per centa (31.6) (30.6) (27.1) (27.5)
Total Tourism 13.6 14.4 15.1 16.0
Notes: a. Figures in parentheses denote cultural visitors’ percentage shares of total tourism.
b Wages and supplements include items such as income, fringe benefits and superannuation etc.
All values are in current prices.Source: BTR estimates, based on data provided in the ABS Cat No 5249.0, 2002 and unpublished ATSA
data received from the ABS.
8 Wages and supplements include items such as income, fringe benefits and superannuation etc.
8/4/2019 Economic Impact of Cultural Tourists in Australia
http://slidepdf.com/reader/full/economic-impact-of-cultural-tourists-in-australia 22/33
Economic Impact of Cultural Tourists in Australia16
5. Conclusion
Cultural visitors represent an important part of the tourism sector. On average over the four
year period 1997/98 to 2000/01 there were a total of 21.8 million international, domestic
overnight and domestic day visitors per annum who engaged in a cultural activity whiletravelling in Australia. This on average translated into 47 per cent of all international
visitors, 12.6 per cent of all domestic overnight visitors and 6.7 per cent of all domestic
day visitors. These cultural visitors spent on average a total of $18.2 billion per annum, or
29 per cent of total tourism expenditure in Australia over the period. International cultural
visitors accounted for $10 billion or 59 per cent of this total cultural visitor expenditure.
Cultural visitors contributed proportionally more to the Australian economy in terms
of GVA, GDP, employment, wages and consumption than their non cultural visitor
counterparts. Both international and domestic cultural visitors on average travelled for
more nights than all visitors and spent more while travelling in Australia than all visitors.
In 2000/01 cultural visitors in Australia contributed 26.4 per cent to tourisms’ total GDP or
1.3 per cent of Australia’s total GDP. Research has shown that in 2000/01 cultural visitorscontributed:
• $8.4 billion to GDP,
• $7.0 billion to GVA,
• 143 000 to tourism persons employed,
• $4.4 billion to wages and supplements,
• $15.7 billion to consumption, and
• $8.7 billion to export earnings.
In 1997/98 and 1998/99, international cultural visitors although spent more on their trip to
Australia they contributed less to the Australian economy than domestic cultural visitors.This was due to a portion of international cultural visitors’ expenditure accruing overseas.
However, in 1999/00 and 2000/01 the decrease in domestic cultural visitors and the increase
in international cultural visitors saw international cultural visitors’ economic contribution
outstrip that of domestic cultural visitors.
8/4/2019 Economic Impact of Cultural Tourists in Australia
http://slidepdf.com/reader/full/economic-impact-of-cultural-tourists-in-australia 23/33
17Economic Impact of Cultural Tourists in Australia
6. References
Australian Bureau of Statistics 2000, Tourism Satellite Account 1997/98 Australian
National Accounts, Cat No 5249.0, ABS, Canberra.
Australian Bureau of Statistics 2002, Tourism Satellite Account 2000/01 Australian
National Accounts, Cat No 5249.0, ABS, Canberra.
Buchanan, I. 1999, Tourism’s Economic Contribution 1996/97 BTR Research Paper ,
BTR Canberra.
Bureau of Tourism Research various years, Travel by Australians; Annual Results of the
National Visitor Survey, BTR, Canberra.
Bureau of Tourism Research various years, International Visitors in Australia; Annual
Results of the International Visitor Survey, BTR, Canberra.
Foo, L. M. & Rossetto, A. 1998, Cultural Tourism in Australia Characteristics and Motivations, Occasional Paper No 27 , BTR, Canberra.
Lound, M. 1999, Measuring International Visitor Expenditure, Tourism Research
Report, Volume 1 Number 2 Spring 1999, BTR, Canberra.
Salma, U. 2001, Tourism’s Indirect Economic Effects 1997-98, Research Paper No. 6 ,
BTR, Canberra.
Salma, U. 2002, Indirect economic contribution of tourism to Australia, 1997/98 to
2000/01, Tourism Research Report , Volume 4 Number 2 Spring 2002, BTR, Canberra.
8/4/2019 Economic Impact of Cultural Tourists in Australia
http://slidepdf.com/reader/full/economic-impact-of-cultural-tourists-in-australia 24/33
Economic Impact of Cultural Tourists in Australia18
A p
p e n d i x A : I t e m i s e d E x p e n d i t u r e b y C u l t u r a l V i s i t o r s
1 9 9 7 / 9 8 – 2 0 0 0 / 0 1
T a b
l e A 1
I t e m i s e d e x p e n d i t u r e b y i n t e r n a t i o n a l c u l t u r a l a n
d t o t a l i n t e r n a t i o n a l v i s i t o r s ,
1 9 9 7 / 9 8 - 2 0 0 0 / 0 1
1 9 9 7 / 1 9 9 8
1 9 9 8 / 1 9 9 9
1 9 9 9 / 2 0 0 0
2 0 0 0 / 2 0 0 1
C u l t u r a l
T o t a
l
C u l t u r a l
T o t a l
C u l t u r a l
T o t a l
C u l t u r a l
T o t a l
$ m i l l i o
n
O r g a n i s e d t o u r s
3 3 0
4 0 5
3 2 1
4 2 6
3 6 8
5 1 4
3 5 5
5 4 3
A i r f a r e s f o r t r a v e l w i t h i n A u s t r a l i a
8 9
1 1 4
9 3
1 2 5
8 3
1 2 7
8 6
1 2 9
I n t e r n a t i o n a l a i r f a r e s
2 1 0 9
3 8 2 7
2 2 1 2
4 1 4 8
2 2 3 1
4 6 1 1
2 5 6 7
5 1 2 1
R e n t a l a n d l e a s i n g f e e s f o r s e l f - d r i v e c a r s , r e n t - a - c a r s ,
c a m p e r v a n s
1 4 5
2 0 3
1 4 9
2 2 2
1 5 5
2 4 5
1 5 6
2 5 9
P e t r o l a n d o i l c o s t s f o r s e l f - d r i v e c a r s o r o t h e
r v e h i c l e s
d r i v e n
8 1
1 0 7
8 3
1 1 5
9 1
1 4 2
1 1 6
1 7 5
O t h e r t r a n s p o r t f a r e s , i n c l u d i n g f a r e s f o r t r a i n s , c o a c h e s ,
f e r r i e s , t a x i s ,
l i m o u s i n e s & p u b l i c t r a n s p o r t
1 9 2
2 8 4
2 0 1
3 0 9
2 1 7
3 4 4
2 5 1
3 9 8
S h o p
p i n g ( f o r u s e i n A u s t r a l i a a n d t a k e h o m e )
1 0 9 9
1 8 2 6
1 0 8 2
1 8 6 4
9 7 8
1 8 8 4
1 2 0 8
2 2 1 5
A c c o m m o d a t i o n
1 8 8 6
2 8 1 2
2 0 5 2
3 1 6 0
2 1 7 2
3 5 3 6
2 6 6 1
4 2 6 2
H o r s e r a c i n g a n d G a m b l i n g
9 1
1 8 4
9 0
1 9 9
8 0
1 7 6
6 2
1 8 5
E n t e
r t a i n m e n t s u c h a s t h e a t r e s , m o v i e s , z o o s , m u s e u m s ,
n i g h t c l u b s e t c
1 5 5
2 0 5
1 5 9
2 1 9
1 5 6
2 2 9
2 2 7
3 2 5
E d u c
a t i o n f e e s
5 7 3
8 6 1
6 3 4
9 3 4
5 1 5
8 5 3
7 7 8
1 2 0 1
P h o n e ,
i n t e r n e t , f a x & / o r p o s t a g e
1 4 3
2 1 8
1 4 0
2 1 7
1 1 5
1 8 7
1 4 0
2 1 3
O t h e r
9 1
1 8 5
9 1
1 8 8
8 0
1 7 4
8 5
1 7 7
P a c k
a g e t o u r
2 4 5 0
3 5 1 0
2 3 9 2
3 7 1 0
2 2 7 1
4 1 3 8
2 8 0 6
5 1 0 7
T o t
a l
9 4 3 2
1 4 7 4 2
9 6 9 9
1 5 8 3 5
9
5 1 2
1 7 1 5 9
1 1 4 9 8
2 0 3 0 9
V i s i t
o r n u m b e r s
1 9 8 1 2 2 4
3 6 6 1 6 2 4
2 0 0 9 1 0 7
3 8 7 2 3 8 6
2 0 4 5 1 2 0
4 3 2 3 6 3 6
2 2 0 3 9 5 8
4 6 5 4 0 3 1
V i s i t
o r n i g h t s
6 2 4 5 5 9 3 2
8 8 8 8 2 6 8 6
6 3 7 2 3 5 2 1
9 5 1 0 6 1 9 8
6 6 7 5 2 9 2 9
1 0 6 3 4 2 9 0 6
7 9 7 4 1 6 5 0
1 2 3 4 1 6 2 4 6
S o u r
c e : B T R I n t e r n a t i o n a l V i s i t o r S u r v e y ,
1 9 9 8 –
2 0 0 1 ,
( u n p u b l i s h e d d a t a ) .
8/4/2019 Economic Impact of Cultural Tourists in Australia
http://slidepdf.com/reader/full/economic-impact-of-cultural-tourists-in-australia 25/33
19Economic Impact of Cultural Tourists in Australia
T a b
l e A 2
I t e m i s e d e x p e n d i t u r e b
y d o m e s t i c o v e r n i g h t c u l t u r a l a n d t o t a l d o m e s t i c o v e r n i g h t v i s i t o r s ,
1 9 9 7 / 9 8 – 2 0 0 0 / 0 1
1 9 9 7 / 1 9 9 8
1 9 9 8 / 1 9 9 9
1 9 9 9 / 2 0 0 0
2 0 0 0 / 2 0 0 1
C u l t u r a l
T o t a l
C u l t u r a l
T o t a l
C u l t u r a l
T o t a l
C u l t u r a l
T o t a l
$ m i l l i o n
P a c k
a g e ( e . g . t r a n s p o r t + s h o w )
7 4 6
1 8 8 4
8 6 6
2 1 4 6
7 0 3
2 2 5 1
5 0 4
1 8 3 4
T a x i s
5 3
3 2 4
5 4
3 7 0
3 6
3 5 2
5 6
4 0 9
A i r l i n e f a r e s
6 3 5
4 0 4 2
7 0 3
4 2 5 9
5 7 9
4 2 8 5
6 5 0
4 5 3 6
O r g a n i s e d t o u r s
9 4
2 4 3
1 2 1
2 6 0
1 3 4
3 2 5
1 2 0
3 0 5
C a r
h i r e c o s t s
1 3 1
5 0 3
1 5 4
5 5 7
1 3 2
5 9 5
1 2 7
6 2 8
F u e l
( p e t r o l , d i e s e l )
6 5 6
3 3 1 7
6 4 8
3 3 0 5
5 7 8
3 4 7 1
6 1 8
4 7 3 5
V e h i c l e m a i n t e n a n c e o r r e p a i r s
8 1
3 7 7
6 1
2 6 9
7 7
3 0 1
1 0 2
3 2 6
O t h e r l o n g d i s t a n c e t r a n s p o r t c o s t s
8 6
2 9 4
9 2
2 7 7
7 9
2 7 9
9 9
2 9 7
O t h e r l o c a l t r a n s p o r t c o s t s
3 8
1 0 9
4 0
1 1 1
1 8
8 6
2 6
1 0 6
A c c o m m o d a t i o n ( c a n i n c l u d e f o o d )
1 6 2 1
6 7 8 8
1 6 2 6
6 9 5 7
1 2 9 5
7 0 1 8
1 5 4 3
8 1 5 7
T a k e
a w a y s a n d r e s t a u r a n t m e a l s
1 1 3 7
4 6 9 3
1 2 0 7
4 9 2 7
9 0 6
4 8 7 3
9 6 2
5 4 3 9
G r o c e r i e s e t c f o r s e l f - c a t e r i n g
4 1 0
1 8 4 2
4 5 9
1 9 5 4
3 7 8
1 9 2 4
3 6 2
2 0 7 8
A l c o
h o l , d r i n k s ( n o t a l r e a d y r e p o r t e d )
3 3 7
1 7 7 7
3 8 8
1 9 0 0
2 9 6
1 8 4 1
2 8 1
2 0 6 9
S h o p
p i n g , g i f t s , s o u v e n i r s
1 0 0 6
3 6 5 2
9 6 2
3 6 5 9
7 7 6
3 8 6 4
8 4 1
4 3 5 3
E n t e
r t a i n m e n t , m u s e u m s , m o v i e s
3 6 1
9 8 2
3 5 1
9 7 4
3 0 6
8 7 8
3 1 8
1 1 7 2
H o r s e r a c i n g , g a m b l i n g , c a s i n o s
8 2
3 6 6
6 6
3 4 5
4 8
2 7 0
4 6
2 9 9
C o n
f e r e n c e f e e s
4 4
2 3 4
3 7
2 2 6
4 2
2 1 8
3 0
1 8 3
E d u c
a t i o n , c o u r s e f e e s
3
3 6
5
8 6
5
7 4
5
1 2 1
O t h e r
1 9 1
1 0 9 4
1 8 0
1 0 4 7
1 6 8
1 3 0 3
1 5 8
1 0 3 4
2 1 o
r m o r e d e s t i n a t i o n s
0
2 3 9
0
2 2 8
0
5 8
0
1 4 8
T o t
a l
7 7 1 2
3 2 7 9 6
8 0 1 9
3 3 8 5 7
6 5 5 8
3 4 2 6 7
6 8 4 7
3 8 2 3 0
O v e r n i g h t v i s i t o r s ( ‘ 0 0 0 )
1 0 6 6 8
7 3 8 1 1
1 0 5 1 0
7 3 8 2 1
8 1 1
7 1 9 8 2
7 7 5 7
7 3 8 1 9
V i s i t
o r n i g h t s ( ‘ 0 0 0 )
6 5 3 6 0
2 9 3 4 5 6
6 6 1 6 1
2 9 6 7 1 1
5
2 4 4 6
2 8 7 2 9 2
4 7 9 7 4
2 9 1 6 2 9
S o u r
c e : B T R N a t i o n a l V i s i t o r S u r v e y ,
1 9 9 8 – 2 0 0 1 ,
( u n p u b l i s h e d d a t a ) .
8/4/2019 Economic Impact of Cultural Tourists in Australia
http://slidepdf.com/reader/full/economic-impact-of-cultural-tourists-in-australia 26/33
Economic Impact of Cultural Tourists in Australia20
T a b
l e A 3
I t e m i s e d e x p e n d i t u r e b
y d o m e s t i c c u l t u r a l d a y a n d t o t a l d o m e s t i c d a y v i s i t o r s ,
1 9 9 7 / 9 8
– 2 0 0 0 / 0 1
1 9 9 7 / 1 9 9 8
1 9 9 8 / 1 9 9 9
1 9 9 9 / 2 0 0 0
2 0 0 0
/ 2 0 0 1
$ m i l l i o n
C u l t u r a l
T o t a l
C u l t u r a l
T o t a l
C u l t u r a l
T o t a l
C u l t u r a l
T o t a l
P a c k
a g e ( e . g . t r a n s p o r t + s h o w )
1 0
3 6
1 8
5 4
1 5
4 9
1 3
5 5
T a x i s
2
3 4
1
4 0
1
4 3
3
5 2
A i r l i n e f a r e s
4
2 7 5
2
2 4 5
0
2 8 5
3
4 1 7
O r g a n i s e d t o u r s
1 9
3 9
8
2 9
5
4 6
5
4 4
C a r
h i r e c o s t s
1 1
4 6
7
4 5
3
5 2
3
5 2
F u e l
( p e t r o l , d i e s e l )
1 5 5
2 1 0 0
1 7 8
2 2 6 0
1 2 7
2 6 4 6
1 3 4
2 9 0 4
V e h i c l e m a i n t e n a n c e o r r e p a i r s
1
9 9
8
1 2 7
2 4
1 6 8
2
1 2 1
O t h e r l o n g d i s t a n c e t r a n s p o r t c o s t s
1 7
8 2
1 8
7 6
1 1
7 7
1 8
8 1
O t h e r l o c a l t r a n s p o r t c o s t s
8
4 8
8
4 5
5
6 2
7
5 4
A c c o m m o d a t i o n ( c a n i n c l u d e f o o d )
0
0
0
0
0
0
0
0
T a k e
a w a y s a n d r e s t a u r a n t m e a l s
2 1 0
1 7 8 7
2 4 9
2 0 1 9
1 5 7
2 0 8 6
1 6 7
2 1 4 4
G r o c e r i e s e t c f o r s e l f - c a t e r i n g
3 7
7 3 6
4 9
8 1 2
3 0
9 4 6
2 7
7 5 1
A l c o
h o l , d r i n k s ( n o t a l r e a d y r e p o r t e d )
4 8
5 0 9
5 4
5 3 8
3 0
5 8 3
3 9
5 4 6
S h o p
p i n g , g i f t s , s o u v e n i r s
2 6 0
2 9 5 5
2 4 6
3 1 0 9
1 6 4
3 5 4 6
2 0 9
3 7 7 9
E n t e
r t a i n m e n t , m u s e u m s , m o v i e s
1 3 4
3 9 1
1 4 7
4 2 1
9 4
3 6 5
9 2
5 0 1
H o r s e r a c i n g , g a m b l i n g , c a s i n o s
8
1 4 6
6
2 1 2
4
1 0 7
2
1 0 3
C o n
f e r e n c e f e e s
1
8 4
1
8 3
1
4 5
0
2 9
E d u c
a t i o n , c o u r s e f e e s
4
5 5
7
4 7
1
6 0
0
1 5 7
O t h e r
4 1
8 2 6
4 2
7 5 9
2 5
8 6 9
2 5
7 8 8
T o t
a l
9 6 9
1 0 2 4 8
1 0 4 9
1 0 9 2 2
6 9 6
1 2 0 3 5
7 5 0
1 2 5 7 8
D a y
v i s i t o r s ( ‘ 0 0 0 )
1 2 4 5 7
1 5 3 1 2 9
1 3 2 1 9
1 6 0 3 1 6
8 4 3 7
1 6 7 0 5 4
8 1 0 4
1 5 2 7 6 5
S o u r
c e : B T R N a t i o n a l V i s i t o r S u r v e y ,
1 9 9 8 – 2 0 0 1 ( u n p u b l i s h e d d a t a ) .
8/4/2019 Economic Impact of Cultural Tourists in Australia
http://slidepdf.com/reader/full/economic-impact-of-cultural-tourists-in-australia 27/33
21Economic Impact of Cultural Tourists in Australia
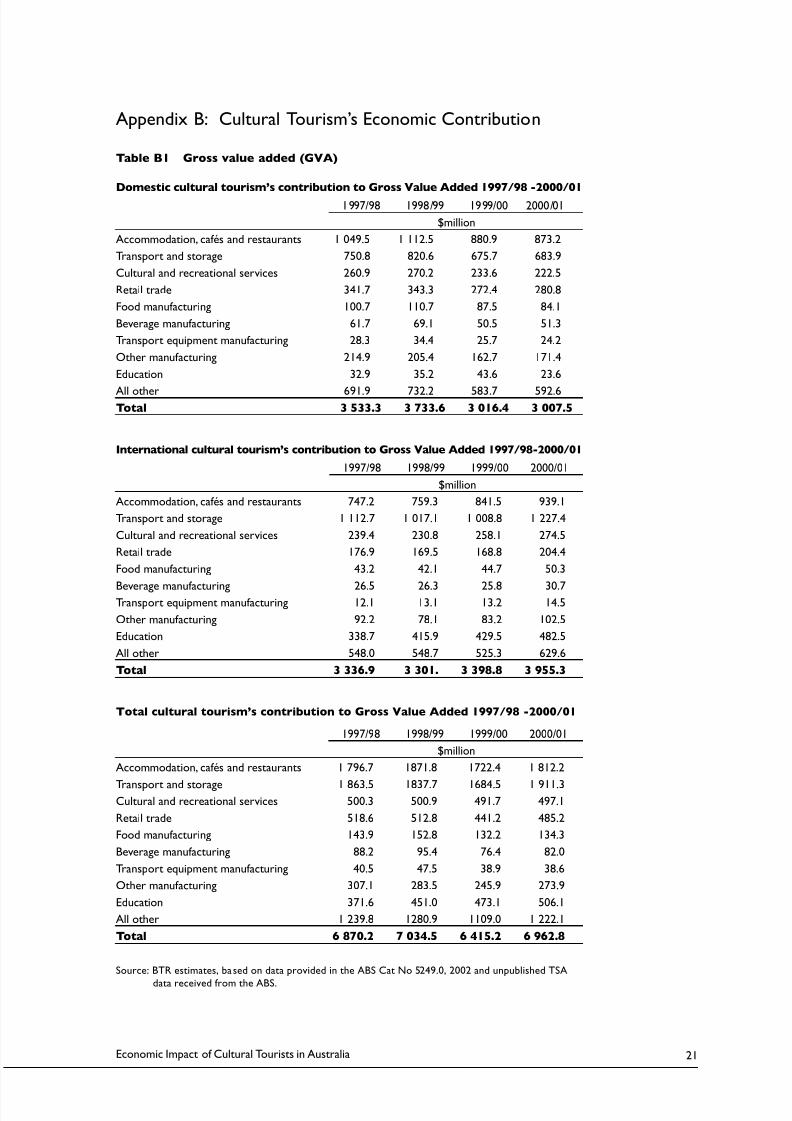
Appendix B: Cultural Tourism’s Economic Contribution
Table B1 Gross value added (GVA)
Domestic cultural tourism’s contribution to Gross Value Added 1997/98 -2000/01
1997/98 1998/99 1999/00 2000/01
$million
Accommodation, cafés and restaurants 1 049.5 1 112.5 880.9 873.2
Transport and storage 750.8 820.6 675.7 683.9
Cultural and recreational services 260.9 270.2 233.6 222.5
Retail trade 341.7 343.3 272.4 280.8
Food manufacturing 100.7 110.7 87.5 84.1
Beverage manufacturing 61.7 69.1 50.5 51.3
Transport equipment manufacturing 28.3 34.4 25.7 24.2
Other manufacturing 214.9 205.4 162.7 171.4
Education 32.9 35.2 43.6 23.6
All other 691.9 732.2 583.7 592.6Total 3 533.3 3 733.6 3 016.4 3 007.5
International cultural tourism’s contribution to Gross Value Added 1997/98-2000/01
1997/98 1998/99 1999/00 2000/01
$million
Accommodation, cafés and restaurants 747.2 759.3 841.5 939.1
Transport and storage 1 112.7 1 017.1 1 008.8 1 227.4
Cultural and recreational services 239.4 230.8 258.1 274.5
Retail trade 176.9 169.5 168.8 204.4
Food manufacturing 43.2 42.1 44.7 50.3
Beverage manufacturing 26.5 26.3 25.8 30.7Transport equipment manufacturing 12.1 13.1 13.2 14.5
Other manufacturing 92.2 78.1 83.2 102.5
Education 338.7 415.9 429.5 482.5
All other 548.0 548.7 525.3 629.6
Total 3 336.9 3 301. 3 398.8 3 955.3
Total cultural tourism’s contribution to Gross Value Added 1997/98 -2000/01
1997/98 1998/99 1999/00 2000/01
$million
Accommodation, cafés and restaurants 1 796.7 1871.8 1722.4 1 812.2
Transport and storage 1 863.5 1837.7 1684.5 1 911.3Cultural and recreational services 500.3 500.9 491.7 497.1
Retail trade 518.6 512.8 441.2 485.2
Food manufacturing 143.9 152.8 132.2 134.3
Beverage manufacturing 88.2 95.4 76.4 82.0
Transport equipment manufacturing 40.5 47.5 38.9 38.6
Other manufacturing 307.1 283.5 245.9 273.9
Education 371.6 451.0 473.1 506.1
All other 1 239.8 1280.9 1109.0 1 222.1
Total 6 870.2 7 034.5 6 415.2 6 962.8
Source: BTR estimates, based on data provided in the ABS Cat No 5249.0, 2002 and unpublished TSA
data received from the ABS.
8/4/2019 Economic Impact of Cultural Tourists in Australia
http://slidepdf.com/reader/full/economic-impact-of-cultural-tourists-in-australia 28/33
Economic Impact of Cultural Tourists in Australia22
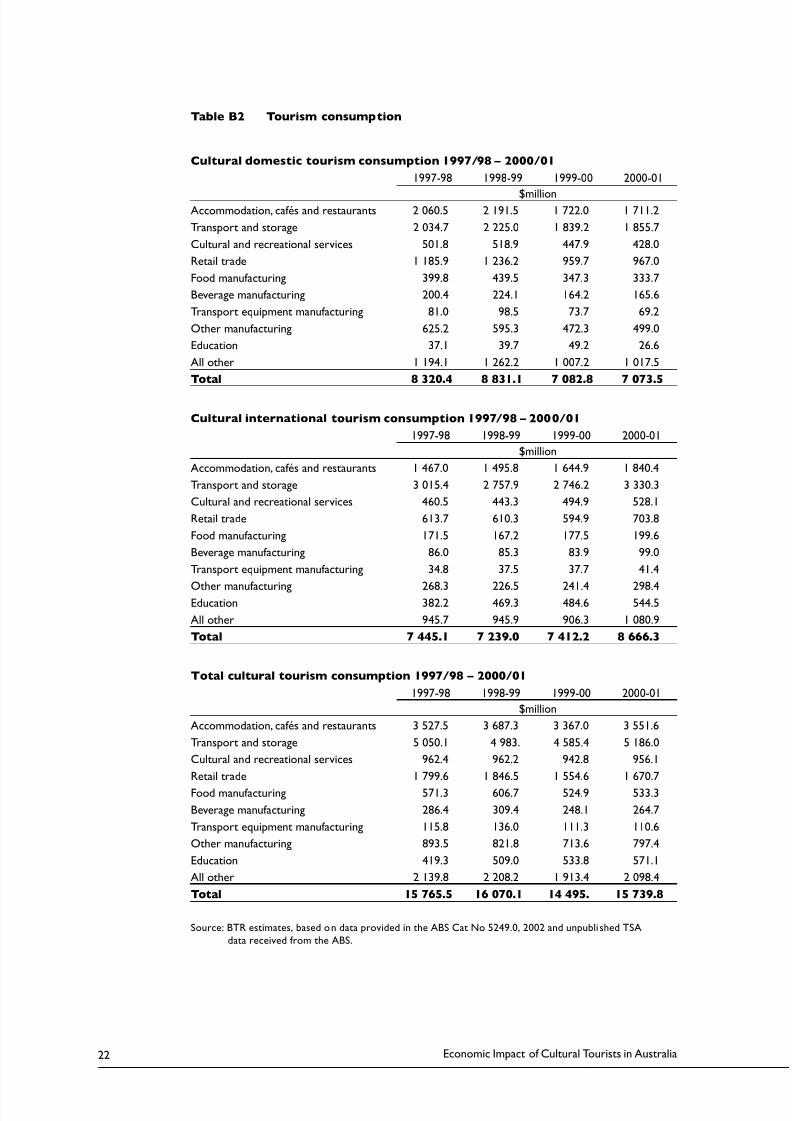
Table B2 Tourism consumption
Cultural domestic tourism consumption 1997/98 – 2000/01
1997-98 1998-99 1999-00 2000-01
$millionAccommodation, cafés and restaurants 2 060.5 2 191.5 1 722.0 1 711.2
Transport and storage 2 034.7 2 225.0 1 839.2 1 855.7
Cultural and recreational services 501.8 518.9 447.9 428.0
Retail trade 1 185.9 1 236.2 959.7 967.0
Food manufacturing 399.8 439.5 347.3 333.7
Beverage manufacturing 200.4 224.1 164.2 165.6
Transport equipment manufacturing 81.0 98.5 73.7 69.2
Other manufacturing 625.2 595.3 472.3 499.0
Education 37.1 39.7 49.2 26.6
All other 1 194.1 1 262.2 1 007.2 1 017.5
Total 8 320.4 8 831.1 7 082.8 7 073.5
Cultural international tourism consumption 1997/98 – 2000/01
1997-98 1998-99 1999-00 2000-01
$million
Accommodation, cafés and restaurants 1 467.0 1 495.8 1 644.9 1 840.4
Transport and storage 3 015.4 2 757.9 2 746.2 3 330.3
Cultural and recreational services 460.5 443.3 494.9 528.1
Retail trade 613.7 610.3 594.9 703.8
Food manufacturing 171.5 167.2 177.5 199.6
Beverage manufacturing 86.0 85.3 83.9 99.0
Transport equipment manufacturing 34.8 37.5 37.7 41.4
Other manufacturing 268.3 226.5 241.4 298.4Education 382.2 469.3 484.6 544.5
All other 945.7 945.9 906.3 1 080.9
Total 7 445.1 7 239.0 7 412.2 8 666.3
Total cultural tourism consumption 1997/98 – 2000/01
1997-98 1998-99 1999-00 2000-01
$million
Accommodation, cafés and restaurants 3 527.5 3 687.3 3 367.0 3 551.6
Transport and storage 5 050.1 4 983. 4 585.4 5 186.0
Cultural and recreational services 962.4 962.2 942.8 956.1
Retail trade 1 799.6 1 846.5 1 554.6 1 670.7
Food manufacturing 571.3 606.7 524.9 533.3
Beverage manufacturing 286.4 309.4 248.1 264.7
Transport equipment manufacturing 115.8 136.0 111.3 110.6
Other manufacturing 893.5 821.8 713.6 797.4
Education 419.3 509.0 533.8 571.1
All other 2 139.8 2 208.2 1 913.4 2 098.4
Total 15 765.5 16 070.1 14 495. 15 739.8
Source: BTR estimates, based on data provided in the ABS Cat No 5249.0, 2002 and unpubli shed TSA
data received from the ABS.
8/4/2019 Economic Impact of Cultural Tourists in Australia
http://slidepdf.com/reader/full/economic-impact-of-cultural-tourists-in-australia 29/33
23Economic Impact of Cultural Tourists in Australia
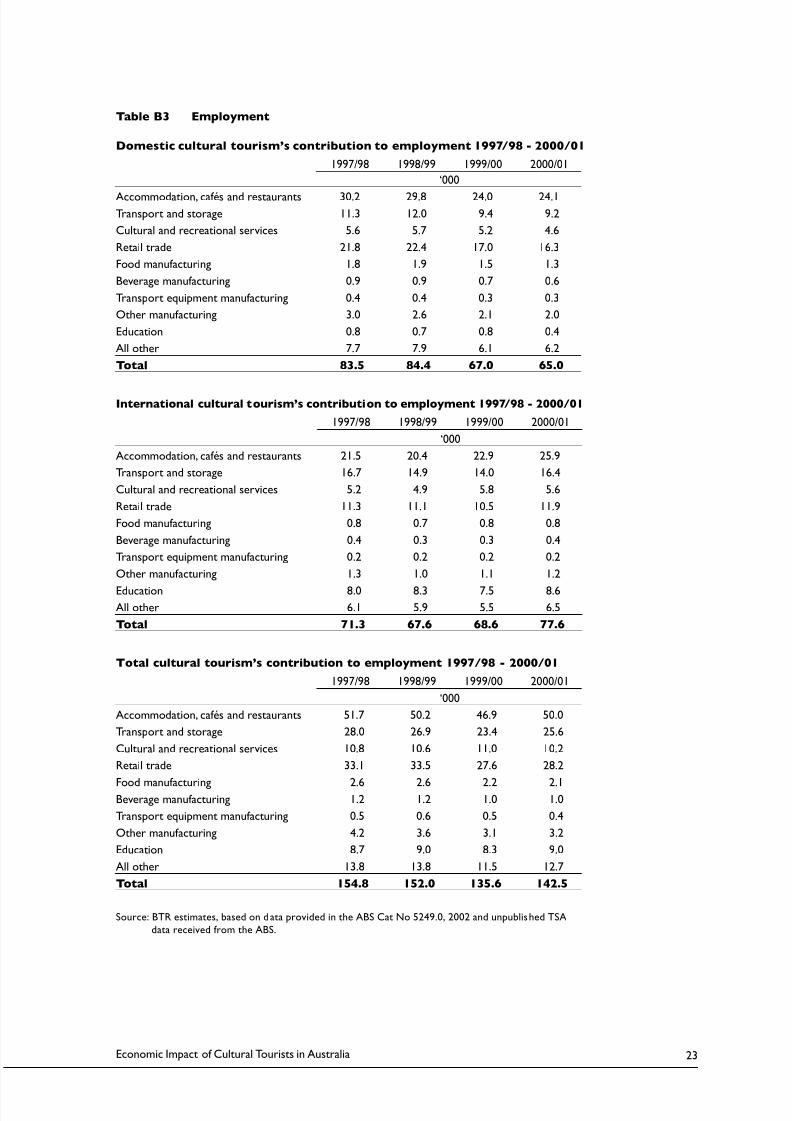
Table B3 Employment
Domestic cultural tourism’s contribution to employment 1997/98 - 2000/01
1997/98 1998/99 1999/00 2000/01
‘000
Accommodation, cafés and restaurants 30.2 29.8 24.0 24.1Transport and storage 11.3 12.0 9.4 9.2
Cultural and recreational services 5.6 5.7 5.2 4.6
Retail trade 21.8 22.4 17.0 16.3
Food manufacturing 1.8 1.9 1.5 1.3
Beverage manufacturing 0.9 0.9 0.7 0.6
Transport equipment manufacturing 0.4 0.4 0.3 0.3
Other manufacturing 3.0 2.6 2.1 2.0
Education 0.8 0.7 0.8 0.4
All other 7.7 7.9 6.1 6.2
Total 83.5 84.4 67.0 65.0
International cultural tourism’s contribution to employment 1997/98 - 2000/01
1997/98 1998/99 1999/00 2000/01
‘000
Accommodation, cafés and restaurants 21.5 20.4 22.9 25.9
Transport and storage 16.7 14.9 14.0 16.4
Cultural and recreational services 5.2 4.9 5.8 5.6
Retail trade 11.3 11.1 10.5 11.9
Food manufacturing 0.8 0.7 0.8 0.8
Beverage manufacturing 0.4 0.3 0.3 0.4
Transport equipment manufacturing 0.2 0.2 0.2 0.2
Other manufacturing 1.3 1.0 1.1 1.2
Education 8.0 8.3 7.5 8.6
All other 6.1 5.9 5.5 6.5
Total 71.3 67.6 68.6 77.6
Total cultural tourism’s contribution to employment 1997/98 - 2000/01
1997/98 1998/99 1999/00 2000/01
‘000
Accommodation, cafés and restaurants 51.7 50.2 46.9 50.0
Transport and storage 28.0 26.9 23.4 25.6
Cultural and recreational services 10.8 10.6 11.0 10.2
Retail trade 33.1 33.5 27.6 28.2
Food manufacturing 2.6 2.6 2.2 2.1Beverage manufacturing 1.2 1.2 1.0 1.0
Transport equipment manufacturing 0.5 0.6 0.5 0.4
Other manufacturing 4.2 3.6 3.1 3.2
Education 8.7 9.0 8.3 9.0
All other 13.8 13.8 11.5 12.7
Total 154.8 152.0 135.6 142.5
Source: BTR estimates, based on data provided in the ABS Cat No 5249.0, 2002 and unpublished TSA
data received from the ABS.
8/4/2019 Economic Impact of Cultural Tourists in Australia
http://slidepdf.com/reader/full/economic-impact-of-cultural-tourists-in-australia 30/33
Economic Impact of Cultural Tourists in Australia24
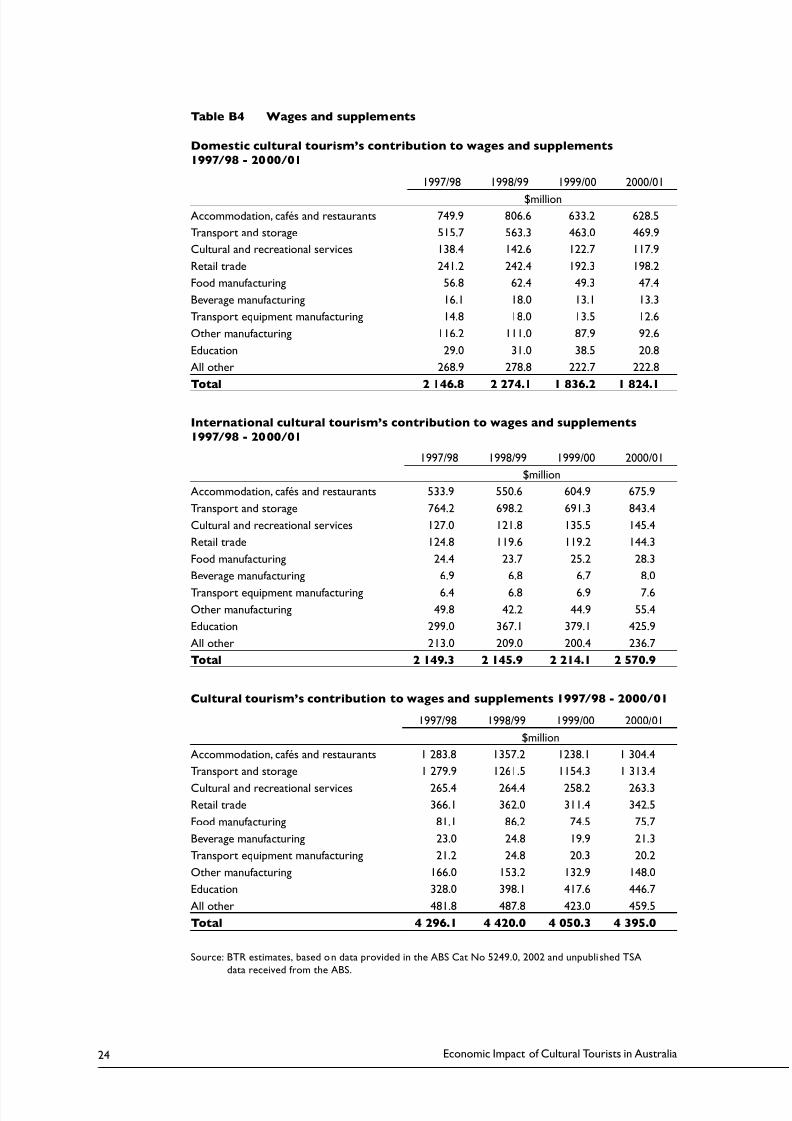
Table B4 Wages and supplements
Domestic cultural tourism’s contribution to wages and supplements
1997/98 - 2000/01
1997/98 1998/99 1999/00 2000/01
$million
Accommodation, cafés and restaurants 749.9 806.6 633.2 628.5
Transport and storage 515.7 563.3 463.0 469.9
Cultural and recreational services 138.4 142.6 122.7 117.9
Retail trade 241.2 242.4 192.3 198.2
Food manufacturing 56.8 62.4 49.3 47.4
Beverage manufacturing 16.1 18.0 13.1 13.3
Transport equipment manufacturing 14.8 18.0 13.5 12.6
Other manufacturing 116.2 111.0 87.9 92.6
Education 29.0 31.0 38.5 20.8
All other 268.9 278.8 222.7 222.8
Total 2 146.8 2 274.1 1 836.2 1 824.1
International cultural tourism’s contribution to wages and supplements
1997/98 - 2000/01
1997/98 1998/99 1999/00 2000/01
$million
Accommodation, cafés and restaurants 533.9 550.6 604.9 675.9
Transport and storage 764.2 698.2 691.3 843.4
Cultural and recreational services 127.0 121.8 135.5 145.4
Retail trade 124.8 119.6 119.2 144.3
Food manufacturing 24.4 23.7 25.2 28.3
Beverage manufacturing 6.9 6.8 6.7 8.0
Transport equipment manufacturing 6.4 6.8 6.9 7.6
Other manufacturing 49.8 42.2 44.9 55.4
Education 299.0 367.1 379.1 425.9
All other 213.0 209.0 200.4 236.7
Total 2 149.3 2 145.9 2 214.1 2 570.9
Cultural tourism’s contribution to wages and supplements 1997/98 - 2000/01
1997/98 1998/99 1999/00 2000/01
$million
Accommodation, cafés and restaurants 1 283.8 1357.2 1238.1 1 304.4
Transport and storage 1 279.9 1261.5 1154.3 1 313.4
Cultural and recreational services 265.4 264.4 258.2 263.3
Retail trade 366.1 362.0 311.4 342.5
Food manufacturing 81.1 86.2 74.5 75.7
Beverage manufacturing 23.0 24.8 19.9 21.3
Transport equipment manufacturing 21.2 24.8 20.3 20.2
Other manufacturing 166.0 153.2 132.9 148.0
Education 328.0 398.1 417.6 446.7
All other 481.8 487.8 423.0 459.5
Total 4 296.1 4 420.0 4 050.3 4 395.0
Source: BTR estimates, based on data provided in the ABS Cat No 5249.0, 2002 and unpubli shed TSA
data received from the ABS.
8/4/2019 Economic Impact of Cultural Tourists in Australia
http://slidepdf.com/reader/full/economic-impact-of-cultural-tourists-in-australia 31/33
25Economic Impact of Cultural Tourists in Australia
Appendix C: Tourism GVA and tourism GDP
“Tourism gross value added (GVA) and tourism gross domestic product (GDP) are the
major economic aggregates derived in the Australian Tourism Satellite Account (ATSA).
The two concepts are not the same and it is important to define the two measures and tooutline the difference between them.
Tourism gross value added measures the value of the output of tourism products
by industries less the value of the inputs used in producing these tourism products.
Output is measured at ‘basic prices’, that is before any taxes on tourism products are
added (or any subsidies on tourism products are deducted). Taxes on tourism products
include wholesale sales taxes and excise duties on goods supplied to visitors. Tourism
gross value added is directly comparable with estimates of the gross value added of
‘conventional’ industries such as mining and manufacturing that are presented in the
national accounts.
Basic price measures are to be used for comparisons between industries and acrosscountries because they are free of the effects of taxes and subsidies on products
which can vary between industries (and countries) and over time. The tax and subsidy
component of a product’s sale price does not represent value added by the industry
producing that product.
Tourism GDP, on the other hand, is a demand side concept. It therefore includes taxes
paid less subsidies received on tourism related products as these are reflected in prices
that visitors actually pay. Tourism GDP will generally have a higher value than tourism
value added. Tourism GDP is a satellite account construct to enable a direct comparison
with the most widely recognised national accounting aggregate, GDP. While it is useful
in this context, the tourism gross value added measure should be used when making
comparisons with other industries or between countries.
Similarly, it is important to distinguish between two related concepts: tourism
consumption and tourism gross value added. The two are not the same and differ both
in concept and scope.
Tourism gross value added shows only the ‘value’ which a producer adds to the raw
material goods and services purchased in the process of producing an output.
This measure is consistent with gross value added measured for other industries
in the national accounts. Tourism consumption is much broader and includes the
total expenditure on goods and services by visitors. Tourism consumption includes
(indirectly) the contribution of other industries that supply goods and services to the
tourism industry as well as imports. Tourism consumption also includes the value of
taxes paid on tourism products (less any subsidies received).”9
9 Source: Tourism Satellite Account, Austral ian National Accounts, Cat No 5249.0, 2000/01, Canber ra,
2002.
8/4/2019 Economic Impact of Cultural Tourists in Australia
http://slidepdf.com/reader/full/economic-impact-of-cultural-tourists-in-australia 32/33
Economic Impact of Cultural Tourists in Australia26
Appendix D: Tourism Consumption
Tourism consumption is defined by the ABS as ‘the total consumption made by a visitor
or on behalf of a visitor for and during his/her trip and stay at the destination.’ Included in
this definition are both actual expenditure and imputation for the consumption by visitorsof certain services for which they do not make payment. For example, tourism consumption
includes an imputation for the value of non-market services provided directly to visitors,
e.g. Museums and libraries, even though these may be provided free or at a price which is
not economically significant. This is consistent with the treatment in the national accounts
of non-market services provided by general government and non-profit institutions. From
the ABS definition of ‘tourism consumption’ it is possible to determine the economic
contribution.

8/4/2019 Economic Impact of Cultural Tourists in Australia
http://slidepdf.com/reader/full/economic-impact-of-cultural-tourists-in-australia 33/33