Embed Size (px)
Citation preview
Economic Impact of Proposed Tax and
Spending Reductions in Kansas
Final Report
Prepared by:
John D. Wong, J.D., Ph.D.
For
Kansas Economic Progress Council
212 SW 8th Avenue, Suite 200
Topeka, KS 66612
http://ksepc.org
Background • During its 2011 session the Kansas Legislature
considered House Substitute for Senate Bill No. 1,
the March to Economic Growth Act (MEGA).
• House Sub. for SB 1 would provide for reductions in
individual and corporation income tax rates
beginning in tax year 2012 based on the extent to
which a certain specified group of State General
Fund (SGF) tax sources have increased over the
base year of FY 2010.
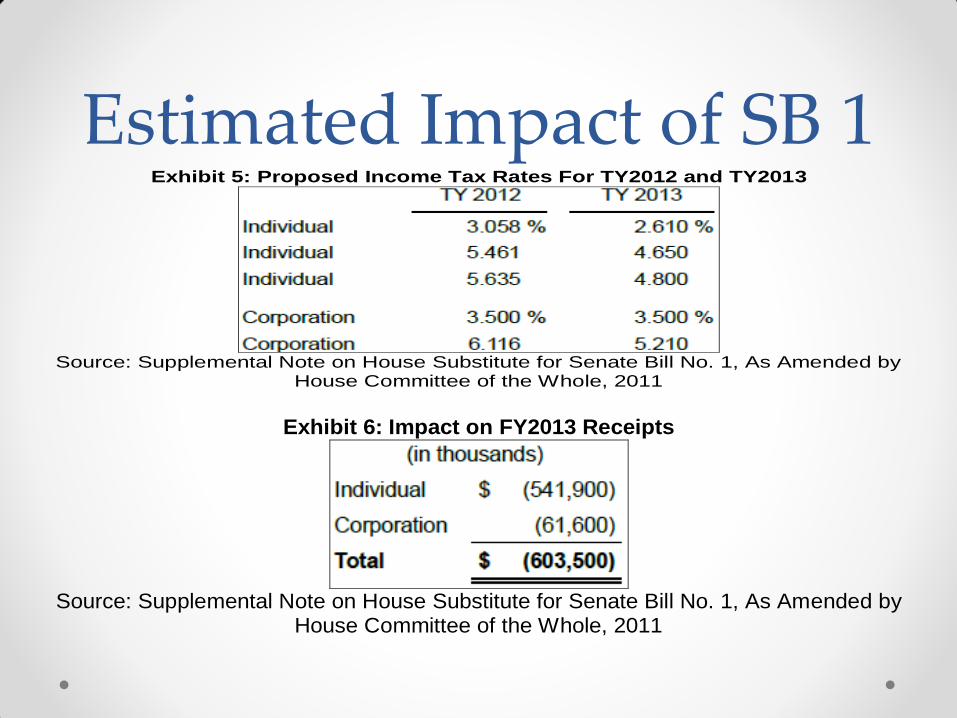
Estimated Impact of SB 1 Exhibit 5: Proposed Income Tax Rates For TY2012 and TY2013
Source: Supplemental Note on House Substitute for Senate Bill No. 1, As Amended by
House Committee of the Whole, 2011
Exhibit 6: Impact on FY2013 Receipts
Source: Supplemental Note on House Substitute for Senate Bill No. 1, As Amended by
House Committee of the Whole, 2011
Objective • The objective of this research is to analyze the
economic impact and tax incidence implications of
proposed tax reductions on the Kansas economy.
• This study was conducted at the request of and
funded by the Kansas Economic Progress Council.
• The overall purpose of the study was to provide
public officials, businesses, and the general public
with information on the economic impact of such
tax reductions and resulting state spending cuts.
Methods • This study employs economic impact analysis (EIA)
and tax incidence analysis to assess the effects of proposed tax reductions on the Kansas economy. o EIA traces changes in economic activity resulting from an initial change.
o EIA identifies which industries benefit or lose from a change in economic activity and estimates resulting changes in income and employment in the region.
o The economic impact of proposed reductions in individual and corporation income tax rates and reductions in state spending were estimated using IMPLAN 3.
• The tax incidence implications of proposed reductions in individual and corporation income tax rates were evaluated using the Kansas Tax Incidence Model.
Economic Impact • The total economic impact of an initial change in economic activity is the sum
of direct, indirect, and induced effects within a region. Indirect and induced effects are sometimes collectively called secondary effects. Any of these impacts may be measured as gross output or sales, income, employment, or value added (Stynes, 1997: 5). o Direct effects are production changes associated with the immediate effects of changes in economic activity (Stynes,
1997: 5).
o Indirect effects are changes in economic activity resulting from various rounds of re-spending of the initial receipts in other backward-linked industries (Stynes, 1997: 5).
o Induced effects are the changes in economic activity resulting from household spending of income earned directly or indirectly as a result of the initial change in economic activity. Induced effects are the result of sales, income, and jobs from household spending of added wage, salary, or proprietor’s income (Stynes, 1997: 6).
• The magnitude of secondary effects depends on the propensity of businesses and households in the region to purchase goods and services from local suppliers. Induced effects may also occur when local consumers purchase goods or services outside of the local area resulting in a leakage of employment and income from the area. Not only are supporting industries (indirect effects) affected, but the entire local economy suffers due to the leakage of jobs and household income from the region. Similar effects occur in the opposite direction when there is a significant increase in jobs and household income (Stynes, 1997: 6).
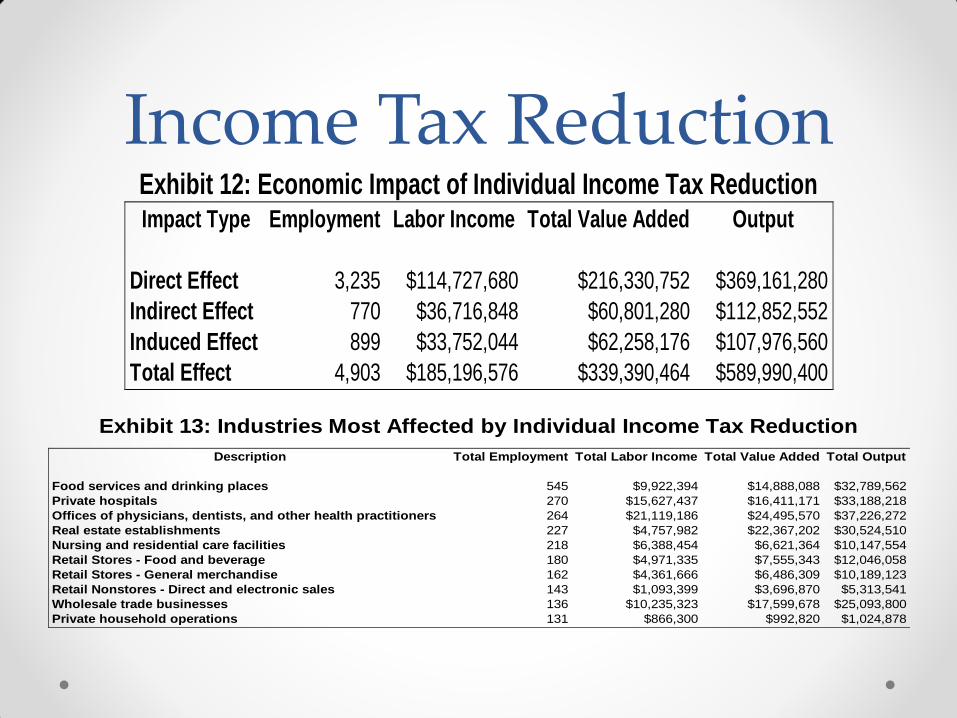
Income Tax Reduction Exhibit 12: Economic Impact of Individual Income Tax Reduction Impact Type Employment Labor Income Total Value Added Output
Direct Effect 3,235 $114,727,680 $216,330,752 $369,161,280
Indirect Effect 770 $36,716,848 $60,801,280 $112,852,552
Induced Effect 899 $33,752,044 $62,258,176 $107,976,560
Total Effect 4,903 $185,196,576 $339,390,464 $589,990,400
Exhibit 13: Industries Most Affected by Individual Income Tax Reduction
Description Total Employment Total Labor Income Total Value Added Total Output
Food services and drinking places 545 $9,922,394 $14,888,088 $32,789,562
Private hospitals 270 $15,627,437 $16,411,171 $33,188,218
Offices of physicians, dentists, and other health practitioners 264 $21,119,186 $24,495,570 $37,226,272
Real estate establishments 227 $4,757,982 $22,367,202 $30,524,510
Nursing and residential care facilities 218 $6,388,454 $6,621,364 $10,147,554
Retail Stores - Food and beverage 180 $4,971,335 $7,555,343 $12,046,058
Retail Stores - General merchandise 162 $4,361,666 $6,486,309 $10,189,123
Retail Nonstores - Direct and electronic sales 143 $1,093,399 $3,696,870 $5,313,541
Wholesale trade businesses 136 $10,235,323 $17,599,678 $25,093,800
Private household operations 131 $866,300 $992,820 $1,024,878
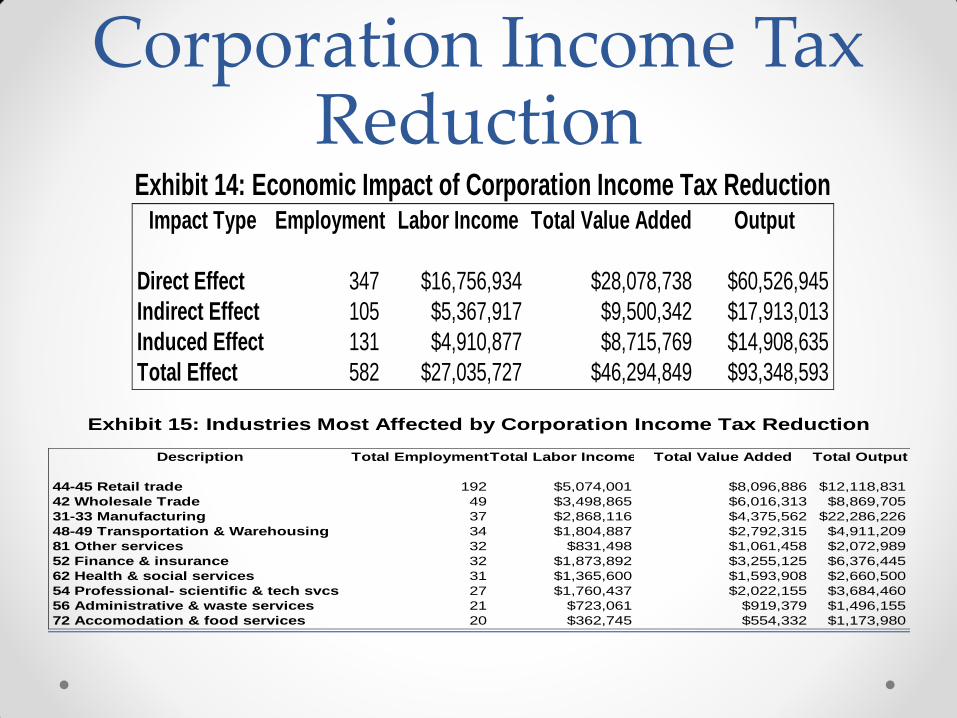
Corporation Income Tax Reduction
Exhibit 14: Economic Impact of Corporation Income Tax Reduction Impact Type Employment Labor Income Total Value Added Output
Direct Effect 347 $16,756,934 $28,078,738 $60,526,945
Indirect Effect 105 $5,367,917 $9,500,342 $17,913,013
Induced Effect 131 $4,910,877 $8,715,769 $14,908,635
Total Effect 582 $27,035,727 $46,294,849 $93,348,593
Exhibit 15: Industries Most Affected by Corporation Income Tax Reduction
Description Total EmploymentTotal Labor Income Total Value Added Total Output
44-45 Retail trade 192 $5,074,001 $8,096,886 $12,118,831
42 Wholesale Trade 49 $3,498,865 $6,016,313 $8,869,705
31-33 Manufacturing 37 $2,868,116 $4,375,562 $22,286,226
48-49 Transportation & Warehousing 34 $1,804,887 $2,792,315 $4,911,209
81 Other services 32 $831,498 $1,061,458 $2,072,989
52 Finance & insurance 32 $1,873,892 $3,255,125 $6,376,445
62 Health & social services 31 $1,365,600 $1,593,908 $2,660,500
54 Professional- scientific & tech svcs 27 $1,760,437 $2,022,155 $3,684,460
56 Administrative & waste services 21 $723,061 $919,379 $1,496,155
72 Accomodation & food services 20 $362,745 $554,332 $1,173,980
State Spending Reduction
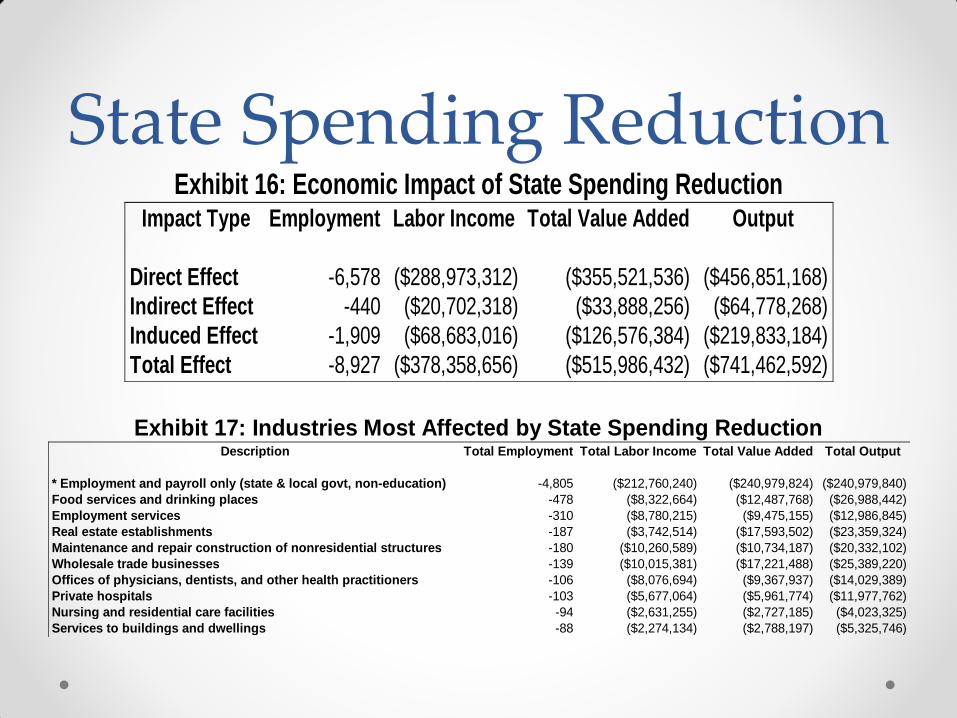
Exhibit 16: Economic Impact of State Spending Reduction Impact Type Employment Labor Income Total Value Added Output
Direct Effect -6,578 ($288,973,312) ($355,521,536) ($456,851,168)
Indirect Effect -440 ($20,702,318) ($33,888,256) ($64,778,268)
Induced Effect -1,909 ($68,683,016) ($126,576,384) ($219,833,184)
Total Effect -8,927 ($378,358,656) ($515,986,432) ($741,462,592)
Exhibit 17: Industries Most Affected by State Spending Reduction Description Total Employment Total Labor Income Total Value Added Total Output
* Employment and payroll only (state & local govt, non-education) -4,805 ($212,760,240) ($240,979,824) ($240,979,840)
Food services and drinking places -478 ($8,322,664) ($12,487,768) ($26,988,442)
Employment services -310 ($8,780,215) ($9,475,155) ($12,986,845)
Real estate establishments -187 ($3,742,514) ($17,593,502) ($23,359,324)
Maintenance and repair construction of nonresidential structures -180 ($10,260,589) ($10,734,187) ($20,332,102)
Wholesale trade businesses -139 ($10,015,381) ($17,221,488) ($25,389,220)
Offices of physicians, dentists, and other health practitioners -106 ($8,076,694) ($9,367,937) ($14,029,389)
Private hospitals -103 ($5,677,064) ($5,961,774) ($11,977,762)
Nursing and residential care facilities -94 ($2,631,255) ($2,727,185) ($4,023,325)
Services to buildings and dwellings -88 ($2,274,134) ($2,788,197) ($5,325,746)
Combined Impact of Tax and Spending Reductions
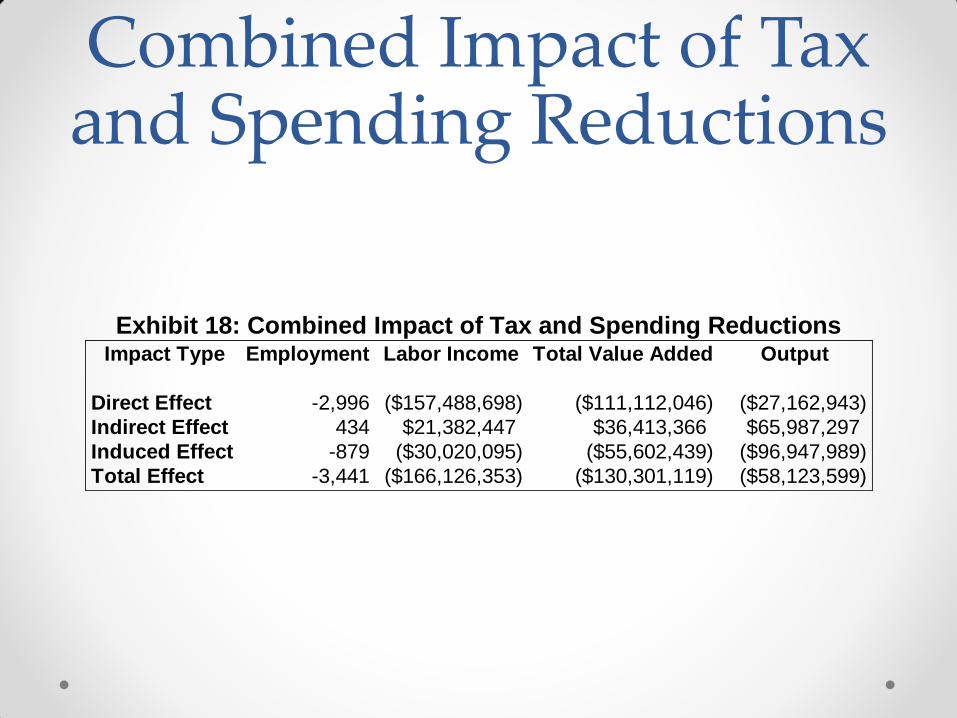
Exhibit 18: Combined Impact of Tax and Spending Reductions Impact Type Employment Labor Income Total Value Added Output
Direct Effect -2,996 ($157,488,698) ($111,112,046) ($27,162,943)
Indirect Effect 434 $21,382,447 $36,413,366 $65,987,297
Induced Effect -879 ($30,020,095) ($55,602,439) ($96,947,989)
Total Effect -3,441 ($166,126,353) ($130,301,119) ($58,123,599)
Findings—Economic Impact
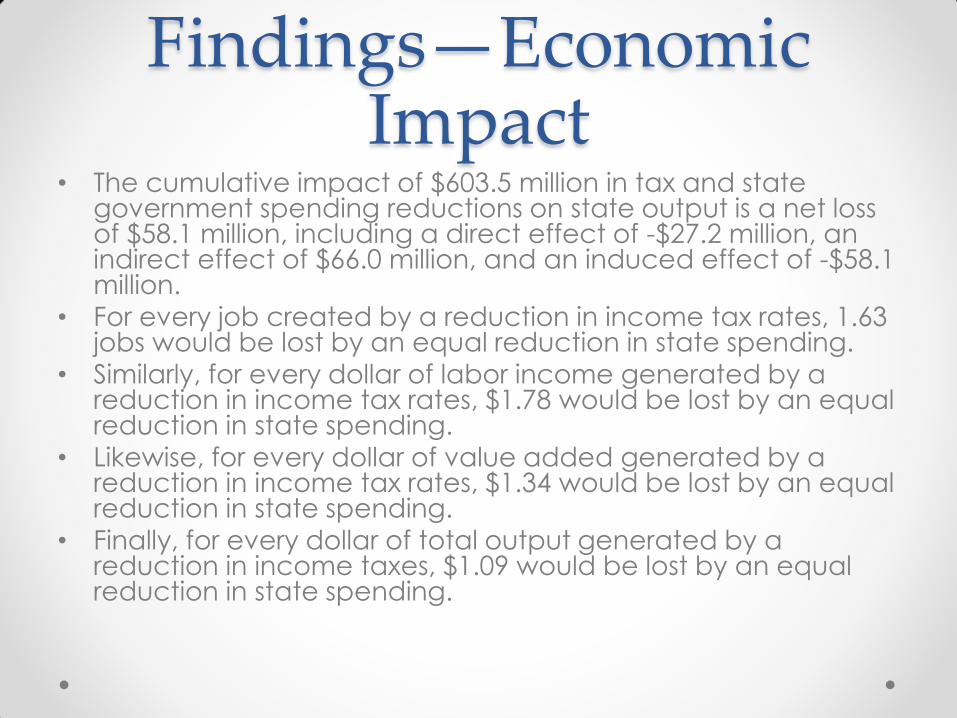
• The cumulative impact of $603.5 million in tax and state government spending reductions on state output is a net loss of $58.1 million, including a direct effect of -$27.2 million, an indirect effect of $66.0 million, and an induced effect of -$58.1 million.
• For every job created by a reduction in income tax rates, 1.63 jobs would be lost by an equal reduction in state spending.
• Similarly, for every dollar of labor income generated by a reduction in income tax rates, $1.78 would be lost by an equal reduction in state spending.
• Likewise, for every dollar of value added generated by a reduction in income tax rates, $1.34 would be lost by an equal reduction in state spending.
• Finally, for every dollar of total output generated by a reduction in income taxes, $1.09 would be lost by an equal reduction in state spending.
Conclusions—Economic Impact
• There are at least two reasons why a reduction in state spending would have a greater negative impact than an equal reduction in state taxes.
• First, a high percentage of government expenditures initially stay within the state’s economy, going either to employees (state residents) in the form of salaries or to local businesses for the purchase of goods and services. In contrast, though most spending by Kansas residents takes place within Kansas, much of those monies quickly leave the state’s economy, particularly since so few manufactured goods are built within the state.
• Second, a tax reduction disperses the benefits throughout the state, both geographically and across residents. The effect on any individual and on any business is minor. In contrast, the spending reduction scenario severely affects a small number of state residents and businesses—state employees and those private-sector businesses that serve state employees and state government directly. The likelihood of a business failing under this scenario is much greater than in the tax increase scenario. A business failure will have a ripple effect across the economy.
Tax Incidence • Former Senator Russell Long of Louisiana had a succinct
definition of tax reform: “Tax reform means ‘don’t tax you,
don’t tax me, tax that fellow behind the tree.’”
• Tax incidence is the study of who ultimately bears the
economic burden of a tax. Broadly speaking tax incidence
analysis examines the impact of taxes on the distribution of
income within a society.
• A tax is regarded as being progressive if the proportion of
income paid as tax increases as income increases, a tax is
proportional if the proportion of income paid as tax remains
constant regardless of income, and a tax is considered to be
regressive if the proportion of income paid as tax decreases as income increases.
Findings—Tax Incidence (Current)
• Combined individual income, residential property,
and retail sales taxes in Kansas are proportional to
slightly regressive under existing individual income
tax rates.
• Out of the ten income groupings the highest
effective tax rate paid is by households that earn
less than $10,000 (24.5 percent) while the lowest
effective rate paid is for households with $200,000 or
more of income (5.3 percent).
• The average effective tax rate for the state as a
whole is 6.1 percent.
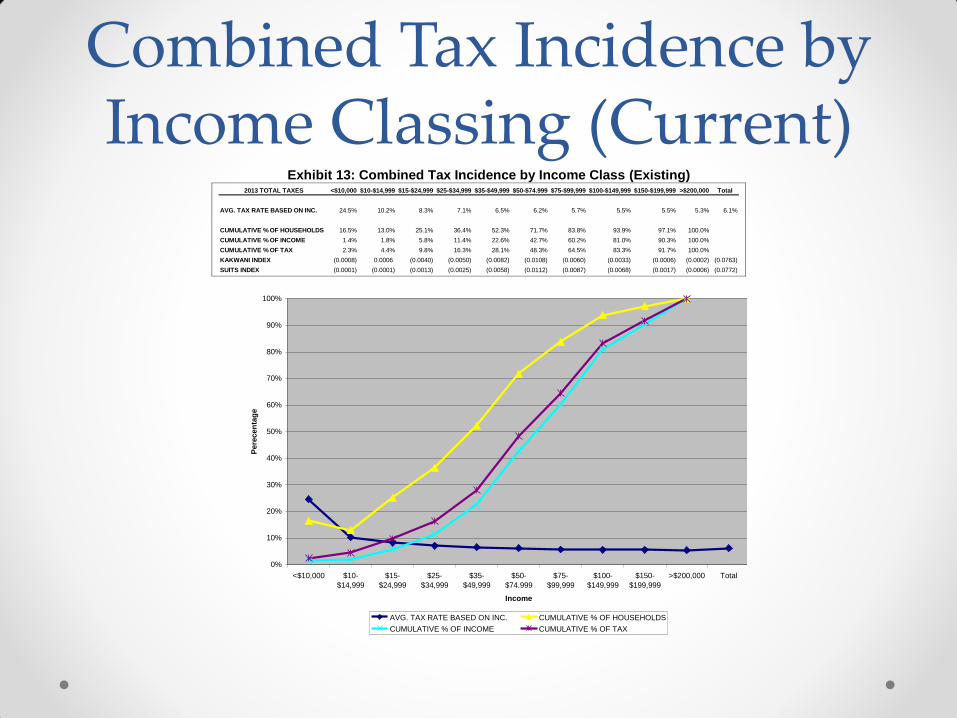
Combined Tax Incidence by Income Classing (Current)
Exhibit 13: Combined Tax Incidence by Income Class (Existing) 2013 TOTAL TAXES <$10,000 $10-$14,999 $15-$24,999 $25-$34,999 $35-$49,999 $50-$74.999 $75-$99,999 $100-$149,999 $150-$199,999 >$200,000 Total
AVG. TAX RATE BASED ON INC. 24.5% 10.2% 8.3% 7.1% 6.5% 6.2% 5.7% 5.5% 5.5% 5.3% 6.1%
CUMULATIVE % OF HOUSEHOLDS 16.5% 13.0% 25.1% 36.4% 52.3% 71.7% 83.8% 93.9% 97.1% 100.0%
CUMULATIVE % OF INCOME 1.4% 1.8% 5.8% 11.4% 22.6% 42.7% 60.2% 81.0% 90.3% 100.0%
CUMULATIVE % OF TAX 2.3% 4.4% 9.8% 16.3% 28.1% 48.3% 64.5% 83.3% 91.7% 100.0%
KAKWANI INDEX (0.0008) 0.0006 (0.0040) (0.0050) (0.0082) (0.0108) (0.0060) (0.0033) (0.0006) (0.0002) (0.0763)
SUITS INDEX (0.0001) (0.0001) (0.0013) (0.0025) (0.0058) (0.0112) (0.0087) (0.0068) (0.0017) (0.0006) (0.0772)
0%
10%
20%
30%
40%
50%
60%
70%
80%
90%
100%
<$10,000 $10-
$14,999
$15-
$24,999
$25-
$34,999
$35-
$49,999
$50-
$74.999
$75-
$99,999
$100-
$149,999
$150-
$199,999
>$200,000 Total
Income
Pere
cen
tag
e
AVG. TAX RATE BASED ON INC. CUMULATIVE % OF HOUSEHOLDS
CUMULATIVE % OF INCOME CUMULATIVE % OF TAX

Findings—Tax Incidence (Proposed)
• Combined individual income, residential property,
and retail sales taxes in Kansas are proportional to
slightly regressive under income tax rate rollback
provisions.
• Out of the ten income groupings the highest
effective tax rate paid is by households that earn
less than $10,000 (23.8 percent) while the lowest
effective rate paid is for households with $200,000 or
more of income (4.8 percent).
• The average effective tax rate for the state as a
whole is 5.7 percent.
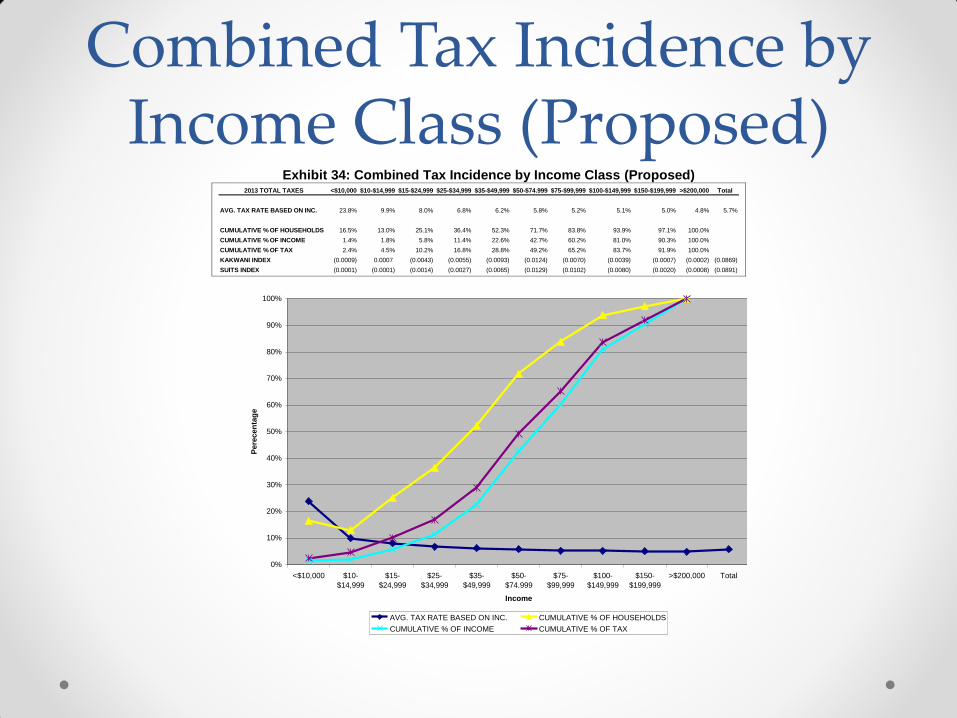
Combined Tax Incidence by Income Class (Proposed)
Exhibit 34: Combined Tax Incidence by Income Class (Proposed) 2013 TOTAL TAXES <$10,000 $10-$14,999 $15-$24,999 $25-$34,999 $35-$49,999 $50-$74.999 $75-$99,999 $100-$149,999 $150-$199,999 >$200,000 Total
AVG. TAX RATE BASED ON INC. 23.8% 9.9% 8.0% 6.8% 6.2% 5.8% 5.2% 5.1% 5.0% 4.8% 5.7%
CUMULATIVE % OF HOUSEHOLDS 16.5% 13.0% 25.1% 36.4% 52.3% 71.7% 83.8% 93.9% 97.1% 100.0%
CUMULATIVE % OF INCOME 1.4% 1.8% 5.8% 11.4% 22.6% 42.7% 60.2% 81.0% 90.3% 100.0%
CUMULATIVE % OF TAX 2.4% 4.5% 10.2% 16.8% 28.8% 49.2% 65.2% 83.7% 91.9% 100.0%
KAKWANI INDEX (0.0009) 0.0007 (0.0043) (0.0055) (0.0093) (0.0124) (0.0070) (0.0039) (0.0007) (0.0002) (0.0869)
SUITS INDEX (0.0001) (0.0001) (0.0014) (0.0027) (0.0065) (0.0129) (0.0102) (0.0080) (0.0020) (0.0008) (0.0891)
0%
10%
20%
30%
40%
50%
60%
70%
80%
90%
100%
<$10,000 $10-
$14,999
$15-
$24,999
$25-
$34,999
$35-
$49,999
$50-
$74.999
$75-
$99,999
$100-
$149,999
$150-
$199,999
>$200,000 Total
Income
Pere
cen
tag
e
AVG. TAX RATE BASED ON INC. CUMULATIVE % OF HOUSEHOLDS
CUMULATIVE % OF INCOME CUMULATIVE % OF TAX
Conclusions—Tax Incidence
• Total Kansas state and local individual income, residential
property, and retail sales taxes are slightly regressive.
• The incidence of combined individual income, residential
property, and retail sales taxes are slightly more regressive
under income tax rollback provisions than under the existing
individual income tax rate structure.
• The overall incidence of the combined taxes under the proposed individual income tax rates is more regressive
because of the reduced amount of progressive income tax
receipts available balance the regressive residential property
and retail sales taxes.
Findings—Budgetary Impact
• A $603.5 reduction in state general fund receipts resulting from proposed income tax rate reductions would be 9.6 percent below receipts under existing income tax rates.
• Assuming an across the board spending reduction, human services expenditures would be reduced by $147.3 million.
• This would include reductions of $69.3 million for overall Social and Rehabilitation Services, $56.9 million for the Division of Health in the Department of Health and Environment, and $20.2 million for the Department of Aging.
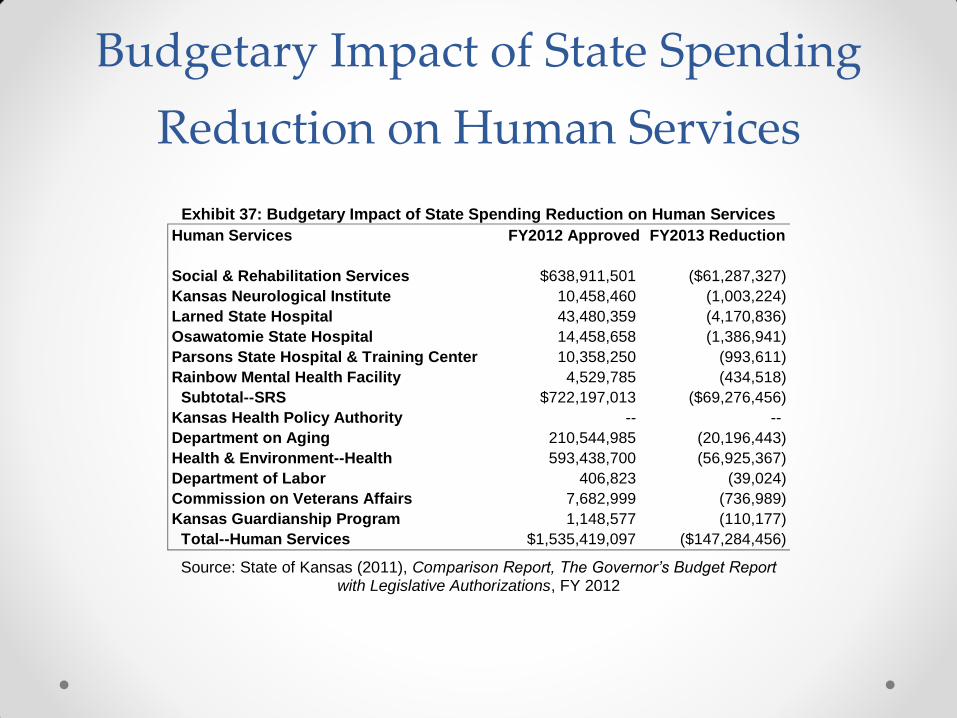
Budgetary Impact of State Spending
Reduction on Human Services
Exhibit 37: Budgetary Impact of State Spending Reduction on Human Services
Human Services FY2012 Approved FY2013 Reduction
Social & Rehabilitation Services $638,911,501 ($61,287,327)
Kansas Neurological Institute 10,458,460 (1,003,224)
Larned State Hospital 43,480,359 (4,170,836)
Osawatomie State Hospital 14,458,658 (1,386,941)
Parsons State Hospital & Training Center 10,358,250 (993,611)
Rainbow Mental Health Facility 4,529,785 (434,518)
Subtotal--SRS $722,197,013 ($69,276,456)
Kansas Health Policy Authority -- --
Department on Aging 210,544,985 (20,196,443)
Health & Environment--Health 593,438,700 (56,925,367)
Department of Labor 406,823 (39,024)
Commission on Veterans Affairs 7,682,999 (736,989)
Kansas Guardianship Program 1,148,577 (110,177)
Total--Human Services $1,535,419,097 ($147,284,456)
Source: State of Kansas (2011), Comparison Report, The Governor’s Budget Report with Legislative Authorizations, FY 2012