Embed Size (px)
Citation preview
ECONOMIC IMPACT OF THE UNITED STATESCERVID FARMING INDUSTRY
Agricultural and Food Policy CenterTexas A&M University
August 2007
Department of Agricultural EconomicsTexas Agricultural Experiment StationTexas Cooperative ExtensionTexas A&M University
College Station, Texas 77843-2124Telephone: (979) 845-5913
Fax: (979) 845-3140http://www.afpc.tamu.edu

2
AcknowledgementsIn no way could the study have been completed without the outstanding efforts of the members and leadership of both the North American Deer Farmers Association (NADeFA®) and the Texas Deer Association (TDA). We truly appreciate all of the members who took the time to complete and return the survey. In addition, we sincerely thank all of those who took time out of their schedules to educate us and let us see your operations first hand. Specifically, from NADeFA®: Fred Huebner, Holly Johnson, Glenn Dice, Julie Getschmann, and Shelly Burns. From the TDA: Scott Bugai, Dick Cain, and Lisa Barton. The following people and operations: Robert Williams of RW Trophy Ranch, Buddy Jordan of Indian Creek Ranch, Trophy Ridge Ranch (Dick Cain), Buck Naked Trophy Whitetails (Scott Bugai), Stephen Frisina of Celebrity Ranch, Tom Malouf of Malouf’s Trophy Whitetails, Robert Gegenheimer of Cotton Mesa, Dave McQuaig of Cougar Ridge Whitetails, Mike Hine of Timberghost Ranch, Pat Cooper, Russ Walk of Walk’s Whitetails, Dean Borntrager of Sundance Whitetails, Levi Mast of Mast’s Whitetails, Dave Griffith of Griffith Brothers Whitetail Ridge, and Tim Tague and Doug Berty of Double T Ranch.
David P. AndersonBrian J. FroschJoe L. Outlaw
Agricultural & Food Policy CenterDepartment of Agricultural EconomicsTexas Agricultural Experiment Station
Texas Cooperative ExtensionTexas A&M University
APFC Research Report 07-4
August 2007
College Station, Texas 77843-2124Telephone: 979.845.5913
Fax: 979.845.3140Web site: http://www.afpc.tamu.edu/
ECONOMIC IMPACT OF THE UNITED STATESCERVID FARMING INDUSTRY
4
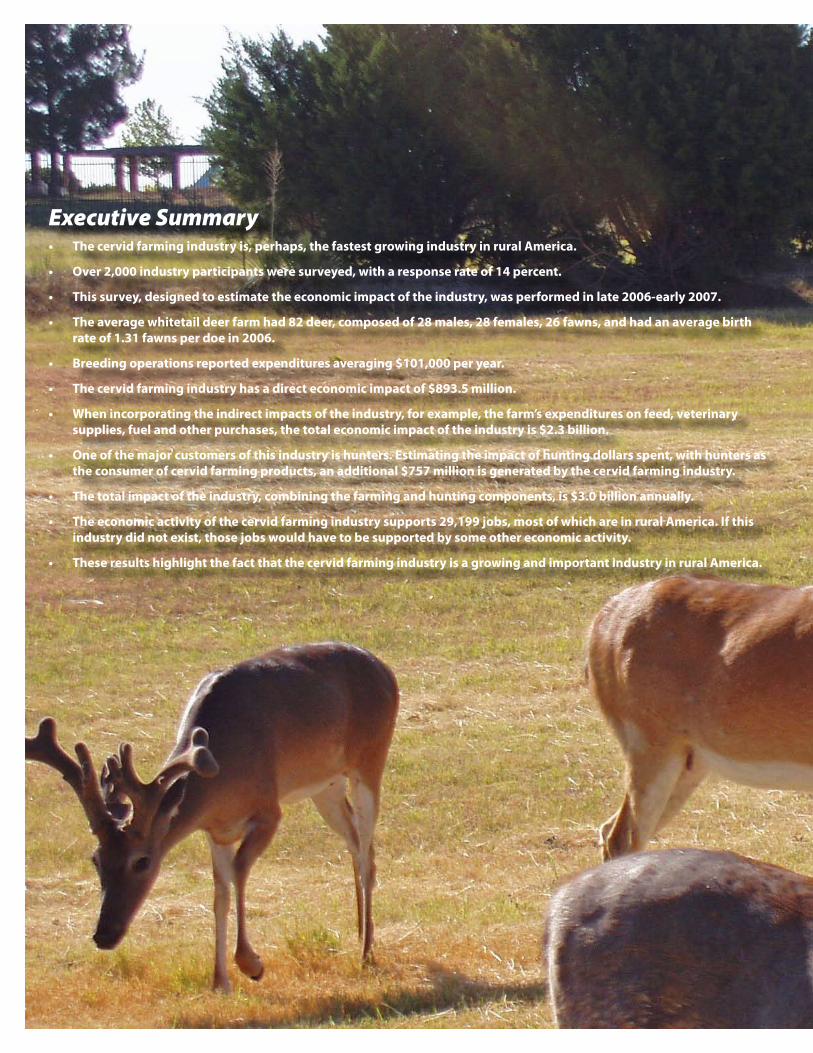
Executive SummaryThe cervid farming industry is, perhaps, the fastest growing industry in rural America.•
Over 2,000 industry participants were surveyed, with a response rate of 14 percent.•
This survey, designed to estimate the economic impact of the industry, was performed in late 2006-early 2007.•
The average whitetail deer farm had 82 deer, composed of 28 males, 28 females, 26 fawns, and had an average birth •rate of 1.31 fawns per doe in 2006.
Breeding operations reported expenditures averaging $101,000 per year. •
The cervid farming industry has a direct economic impact of $893.5 million. •
When incorporating the indirect impacts of the industry, for example, the farm’s expenditures on feed, veterinary •supplies, fuel and other purchases, the total economic impact of the industry is $2.3 billion.
One of the major customers of this industry is hunters. Estimating the impact of hunting dollars spent, with hunters as •the consumer of cervid farming products, an additional $757 million is generated by the cervid farming industry.
The total impact of the industry, combining the farming and hunting components, is $3.0 billion annually.•
The economic activity of the cervid farming industry supports 29,199 jobs, most of which are in rural America. If this •industry did not exist, those jobs would have to be supported by some other economic activity.
These results highlight the fact that the cervid farming industry is a growing and important industry in rural America.•
5
6
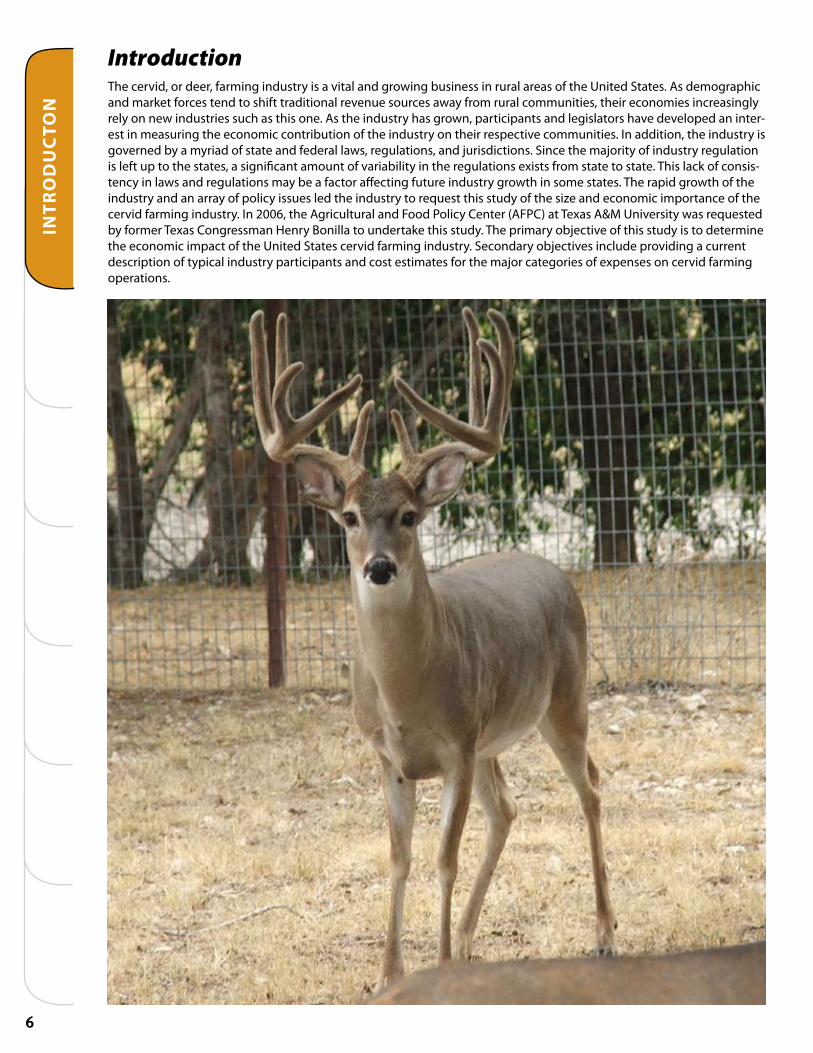
IntroductionThe cervid, or deer, farming industry is a vital and growing business in rural areas of the United States. As demographic and market forces tend to shift traditional revenue sources away from rural communities, their economies increasingly rely on new industries such as this one. As the industry has grown, participants and legislators have developed an inter-est in measuring the economic contribution of the industry on their respective communities. In addition, the industry is governed by a myriad of state and federal laws, regulations, and jurisdictions. Since the majority of industry regulation is left up to the states, a significant amount of variability in the regulations exists from state to state. This lack of consis-tency in laws and regulations may be a factor affecting future industry growth in some states. The rapid growth of the industry and an array of policy issues led the industry to request this study of the size and economic importance of the cervid farming industry. In 2006, the Agricultural and Food Policy Center (AFPC) at Texas A&M University was requested by former Texas Congressman Henry Bonilla to undertake this study. The primary objective of this study is to determine the economic impact of the United States cervid farming industry. Secondary objectives include providing a current description of typical industry participants and cost estimates for the major categories of expenses on cervid farming operations.
INTR
OD
UC
TON
7
Cervid IndustryThe term “cervid” refers to any one of the various members of the cervidae family. This family includes members such as whitetail deer, elk, fallow, reindeer, axis, sika, and red deer among others.1
Like any industry, the cervid farming industry involves producers and consumers. In general, the production side of the industry is comprised of breeding stock producers, trophy hunting preserves, commercial venison producers, and com-mercial scent collection. Some commercial production operations may take on a single segment, such as one produc-ing and selling only breeding stock. Others may consist of any combination of these, such as an operation producing venison and velvet, while also collecting urine for scent sales. Consumers of the industry include hunters (for scent products and hunting) other breeders, and consumers of venison and related products (hides, velvet, shed antlers, etc.).
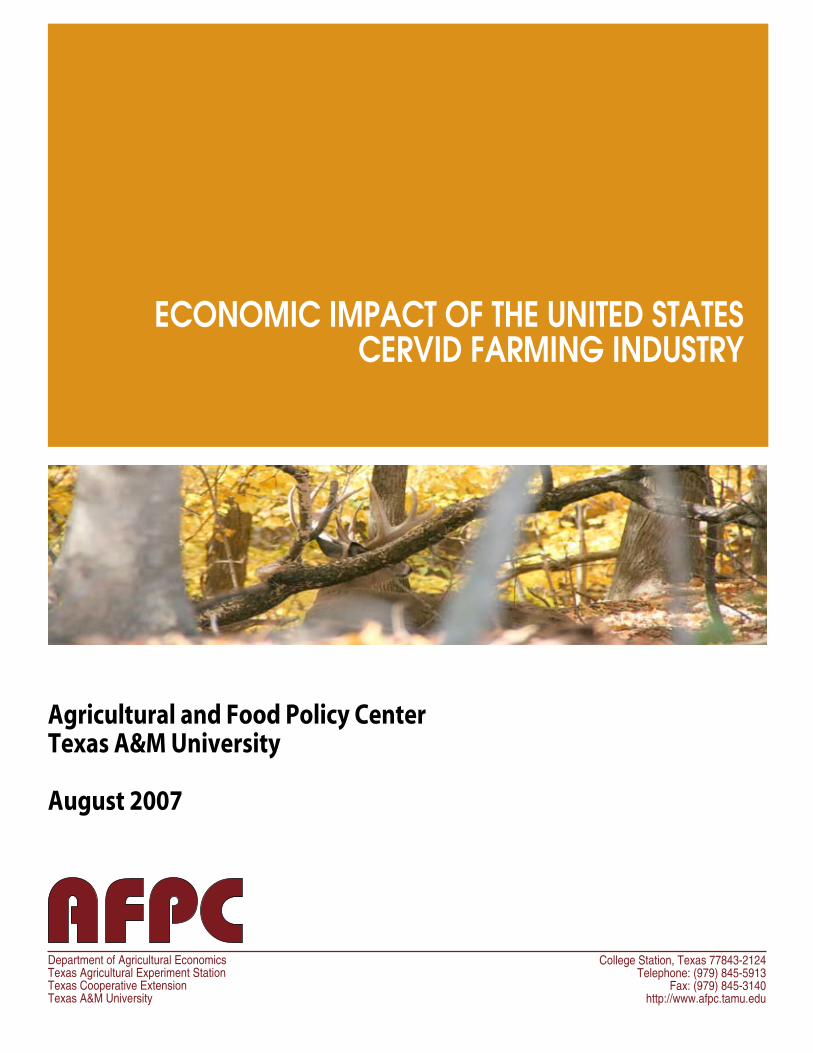
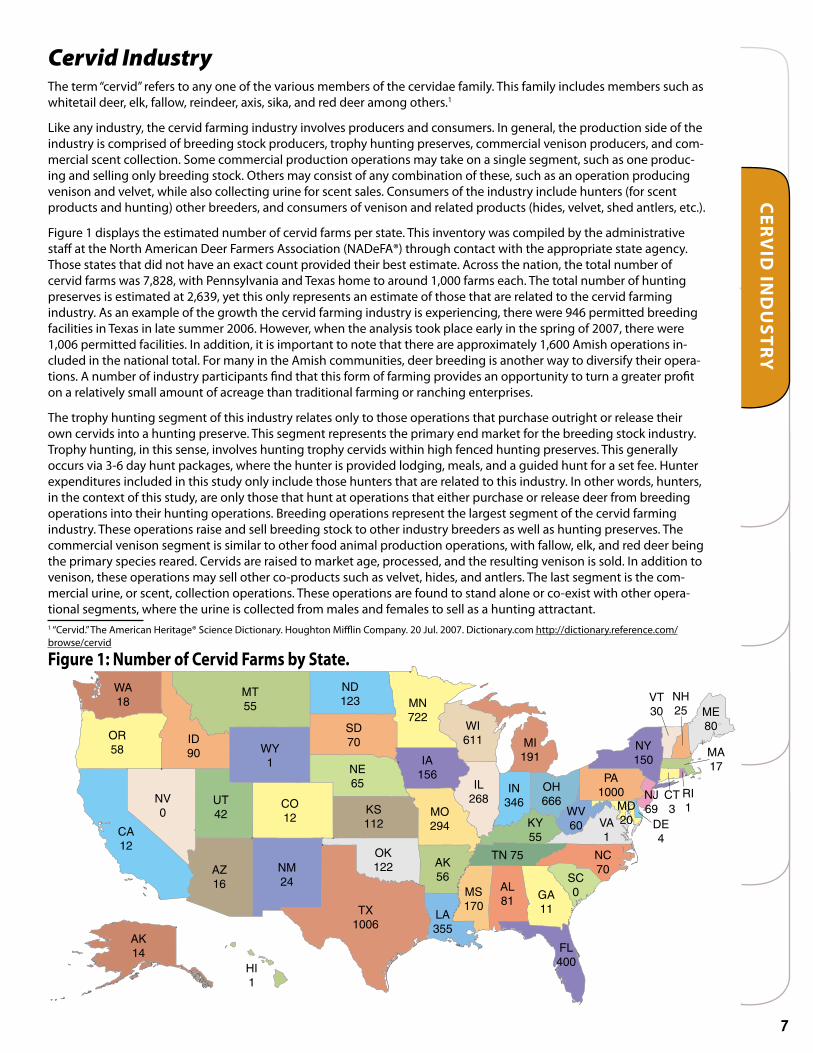
Figure 1 displays the estimated number of cervid farms per state. This inventory was compiled by the administrative staff at the North American Deer Farmers Association (NADeFA®) through contact with the appropriate state agency. Those states that did not have an exact count provided their best estimate. Across the nation, the total number of cervid farms was 7,828, with Pennsylvania and Texas home to around 1,000 farms each. The total number of hunting preserves is estimated at 2,639, yet this only represents an estimate of those that are related to the cervid farming industry. As an example of the growth the cervid farming industry is experiencing, there were 946 permitted breeding facilities in Texas in late summer 2006. However, when the analysis took place early in the spring of 2007, there were 1,006 permitted facilities. In addition, it is important to note that there are approximately 1,600 Amish operations in-cluded in the national total. For many in the Amish communities, deer breeding is another way to diversify their opera-tions. A number of industry participants find that this form of farming provides an opportunity to turn a greater profit on a relatively small amount of acreage than traditional farming or ranching enterprises.
The trophy hunting segment of this industry relates only to those operations that purchase outright or release their own cervids into a hunting preserve. This segment represents the primary end market for the breeding stock industry. Trophy hunting, in this sense, involves hunting trophy cervids within high fenced hunting preserves. This generally occurs via 3-6 day hunt packages, where the hunter is provided lodging, meals, and a guided hunt for a set fee. Hunter expenditures included in this study only include those hunters that are related to this industry. In other words, hunters, in the context of this study, are only those that hunt at operations that either purchase or release deer from breeding operations into their hunting operations. Breeding operations represent the largest segment of the cervid farming industry. These operations raise and sell breeding stock to other industry breeders as well as hunting preserves. The commercial venison segment is similar to other food animal production operations, with fallow, elk, and red deer being the primary species reared. Cervids are raised to market age, processed, and the resulting venison is sold. In addition to venison, these operations may sell other co-products such as velvet, hides, and antlers. The last segment is the com-mercial urine, or scent, collection operations. These operations are found to stand alone or co-exist with other opera-tional segments, where the urine is collected from males and females to sell as a hunting attractant.1 “Cervid.” The American Heritage® Science Dictionary. Houghton Mifflin Company. 20 Jul. 2007. Dictionary.com http://dictionary.reference.com/browse/cervid
CER
VID
IND
USTR
Y
WA18
OR58
CA12
NV0
ID90
MT55
WY1
AK14
HI1
UT42
CO12
AZ16
NM24
TX1006
OK122
KS112
NE65
ND123
SD70
MN722
IA156
MO294
AK56
LA355
MS170
AL81 GA
11
FL400
WI611
IL268
MI191
IN346
OH666
PA1000
KY55
TN 75
VA1
NC70
SC0
NY150
ME80
VT30
NH25
MA17
RI1
CT3
NJ69
DE4
MD20
WV60
Figure 1: Number of Cervid Farms by State.
8
MET
HO
DO
LOG
YMethodologyAs previously mentioned, the primary objective of this study is to estimate the economic impact of the United States cervid farming industry. In order to do this, a survey instrument was developed to collect detailed operational informa-tion from industry participants. This information was then combined with the inventory of cervid farms to analyze the production side of the industry. In addition, an analysis was performed to determine the impact of hunters, but only the portion of hunters who are related to the cervid farming industry. The production and hunting components were then combined to estimate the economic impact of the cervid farming industry.
Data Collection
During the late summer and early fall of 2006, background information to develop the survey was gained through site visits to cervid farms across the nation. Interviews from these visits provided a base set of information that was then utilized to develop the survey instrument. The survey was then reviewed by industry participants, revised, and sent to over 700 members of NADeFA® and 1,300 members of the Texas Deer Association (TDA) over the fall of 2006 to early 2007. Overall, the extensive survey achieved a response rate of 14 percent. These memberships were selected to par-ticipate in this study because they represent all facets of the cervid farming industry.
Survey Development
The actual survey instruments are contained in Appendix A (NADeFA®) and Appendix B (TDA). For the purposes of the survey, the cervid farming industry was segmented into three operational structures: breeding only, breeding and hunting, and hunting only operations. Breeding only operations were defined as those that only involve the scientific breeding and rearing of cervids for the purpose(s) of breeding stock, commercial venison, or commercial urine collec-tion. Hunting only operations relate to only those hunting preserves that purchase cervids from breeding operations as stockers or as breeding stock for release into the preserve. Operations that manage their deer populations by selective harvest and nutritional supplements, rather than supplementing the natural genetics with deer released from breeding operations, are not included in this category. Breeding and hunting operations represent those that engage in breed-ing activities while also utilizing their own breeding stock, or purchased breeding stock, to supplement the genetics and/or populate their hunting preserve.
While a majority of the industry are whitetail deer producers, a variety of cervid species are raised as well, including elk, red deer, mule deer, sika, pere david’s, reindeer, axis, fallow, and muntjak. The surveys proved to be quite extensive, as they were designed to represent producers of all of these cervid species and operational segments. For breeding operations, the survey included questions regarding the operation in general, herd inventory, purchases, sales, capital expenditures, veterinary expenditures, labor, feeding rates and expenditures, utilities, and other miscellaneous expens-es. For hunting operations, the base operational questions remained the same, however, hunting related questions were included as well, such as the number of hunters, harvest rate, percentage of herd from breeding operations, hunt revenues, processing, and taxidermy.
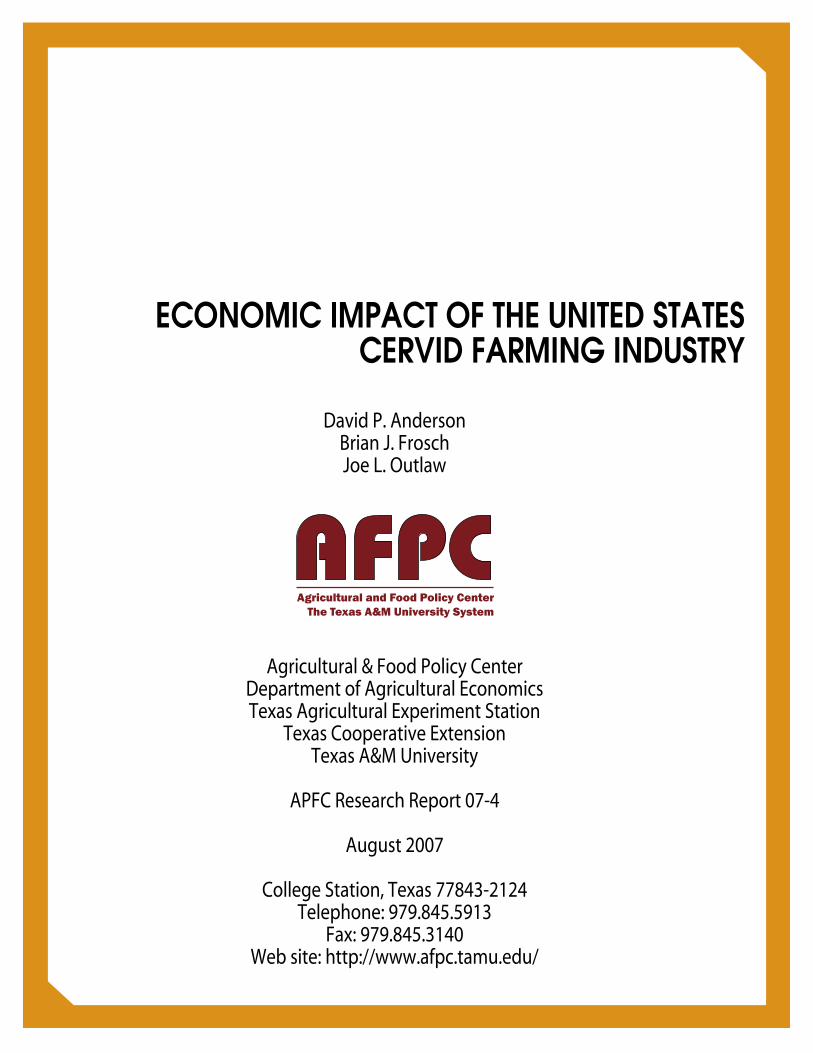
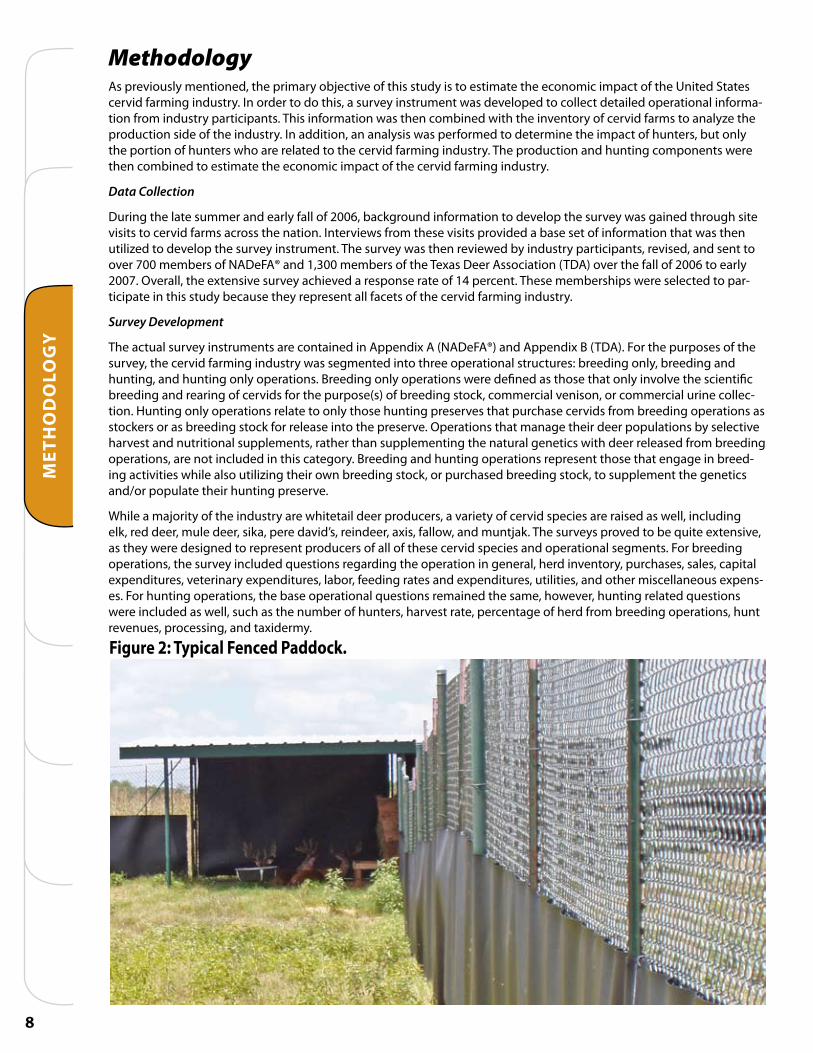
Figure 2: Typical Fenced Paddock.
9
SUR
VEY
RESU
LTSSurvey ResultsGeneral Operations
Of the 302 respondents, 61 percent were breeding only operations, 32 percent were breeding and hunting operations, and 7 percent were hunting only operations. Respondents represented 26 of the 48 states that have some type of cervid operation. When combining all survey respondents, operations have been in business, on average, since 1999.
From the NADeFA® survey results, the average whitetail deer breeding operation reported a total of 82 deer, on close to 25 acres. Of these, 28 were bucks, 28 were does, and 26 were fawns. In 2005, bred does had an average of 1.24 fawns each, which increased to 1.31 for the 2006 fawning season. Average annual mortality rate was reported to be 9.6 percent. For comparison, whitetail breeding operations from the Texas survey were slightly larger, averaging 114 head, on a little more than 64 acres. Of these, 42 were bucks, 44 were does, with the remainder being fawns. Bred does aver-aged 1.27 fawns each in 2005 and 1.37 in 2006, slightly higher than the national results. Overall herd mortality rate was reported to be 5.7 percent.
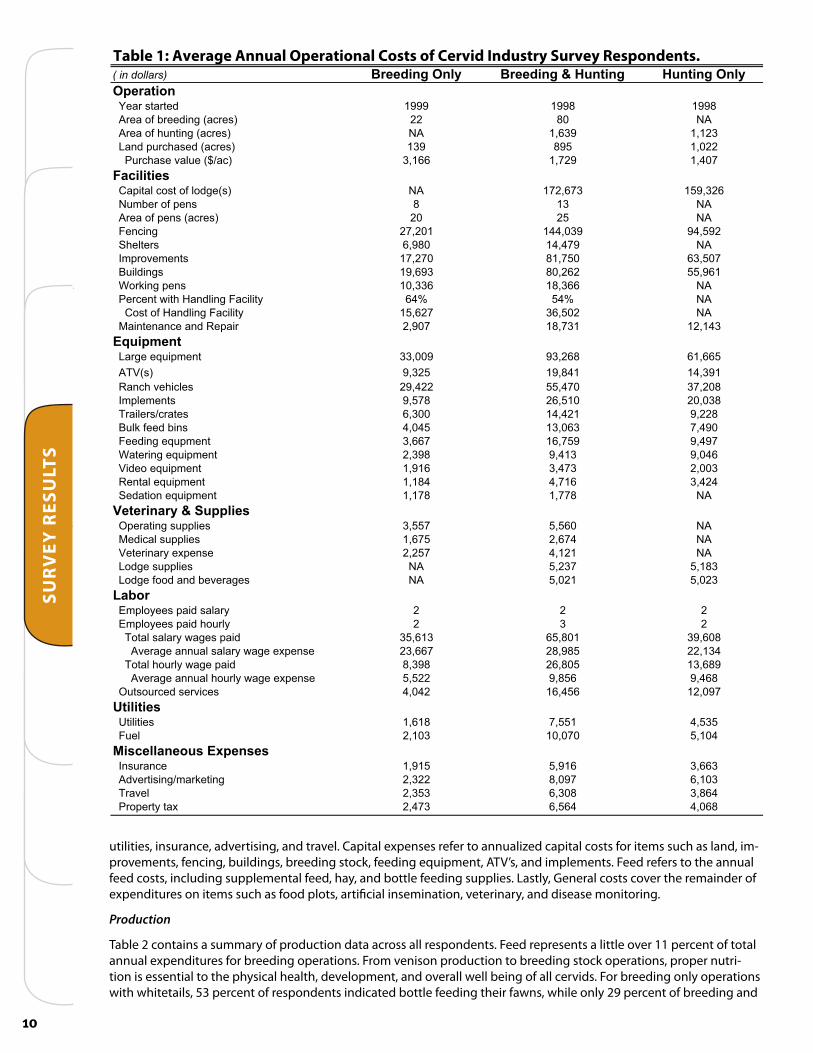
Table 1 above contains a summary of the average operational costs across all survey respondents. A quick glance through the table reveals expected differences across operations for general expenditures. Breeding and hunting operations displayed the largest footprint, around 1,700 acres, as expected. Breeding only operations were the small-est, averaging around 20 acres in pens. Pens, in this sense, are typically described as a high fenced paddock, as shown in Figure 2. For those pens holding bucks or bulls, a protective screening is often used in conjunction with the fence to keep an antler from hooking in the fence accidentally. In addition, screening may be used as a visual barrier, particularly if the operation is near a road, to shield the deer from view from passers-by.
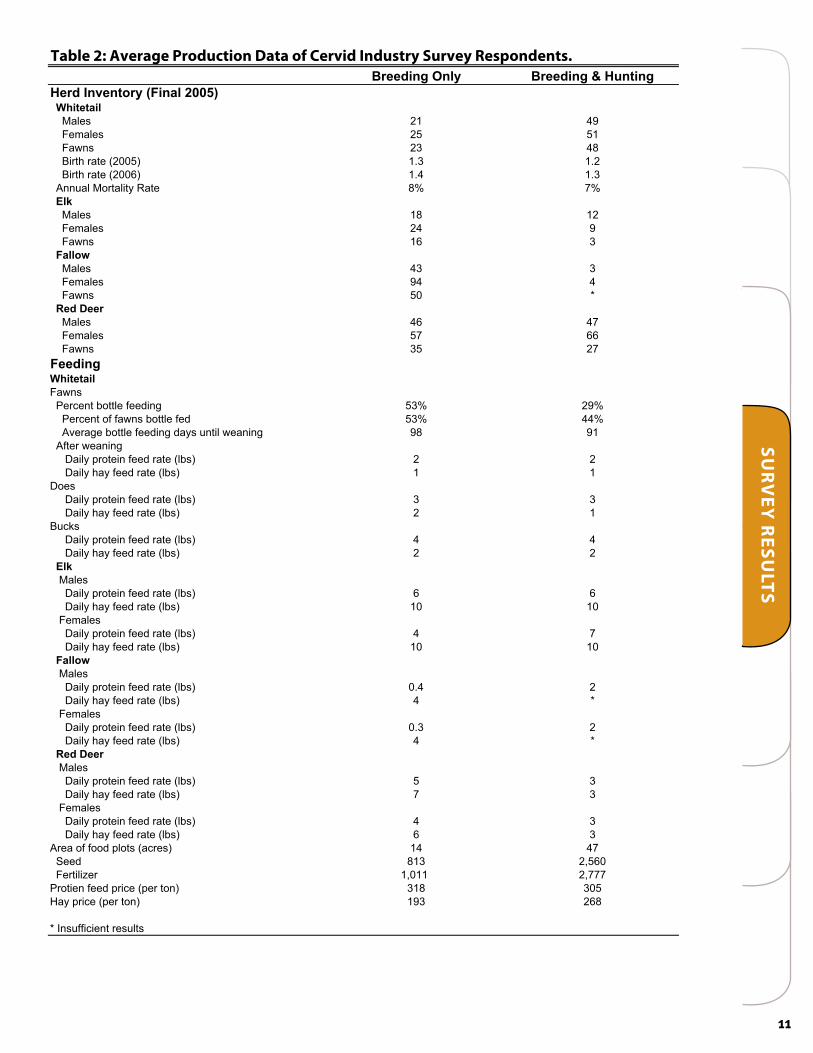
Breeding and hunting operations had more area devoted to breeding pens, more pens overall, and more deer (Table 2) than breeding only operations. This was expected as the breeding and hunting operations supply their hunting opera-tion from their breeding operation, and are not necessarily relying on sales or transfers to move deer off the operation.
The results indicate expenditures on lodges, fencing, and improvements were the top three in terms of the capital cost for both breeding and hunting and hunting only operations, while breeding operations spent the most on fencing, buildings, and improvements. The category of improvements includes expenditures on land clearing, roads, tanks/ponds, and forage development among others. Large equipment, ranch vehicles, and implements were reported as the highest equipment expenditures across all three types of operations. Of all the respondents, 49 percent reported hiring labor, while 43 percent reported outsourcing labor and/or consulting needs. Breeding and hunting operations reported using four times the amount of outsourced services than breeding only operations, or $16,456 versus $4,042. Examples of outsourced services include those of operational management and or nutritional consulting, bottle feeding services for newborns, annual herd maintenance/vaccination services, and accounting services.
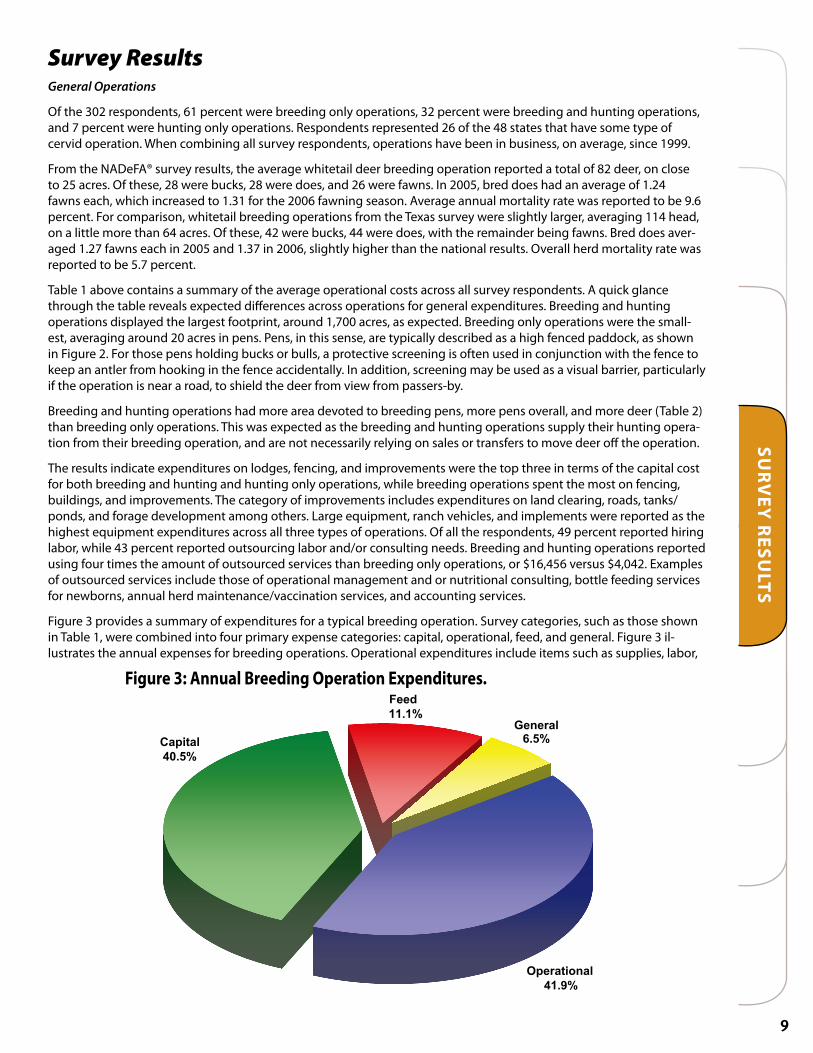
Figure 3 provides a summary of expenditures for a typical breeding operation. Survey categories, such as those shown in Table 1, were combined into four primary expense categories: capital, operational, feed, and general. Figure 3 il-lustrates the annual expenses for breeding operations. Operational expenditures include items such as supplies, labor,
General6.5%
Feed11.1%
Capital40.5%
Operational41.9%
Figure 3: Annual Breeding Operation Expenditures
Figure 3: Annual Breeding Operation Expenditures.
10
SUR
VEY
RES
ULT
STable 1: Average Annual Operational Costs of Cervid Industry Survey Respondents.( in dollars) Breeding Only Breeding & Hunting Hunting OnlyOperation
899189919991detrats raeY AN0822)serca( gnideerb fo aerA
321,1936,1AN)serca( gnitnuh fo aerA 220,1598931)serca( desahcrup dnaL 704,1927,1661,3)ca/$( eulav esahcruP
Facilities623,951376,271AN)s(egdol fo tsoc latipaC
AN318snep fo rebmuN AN5202)serca( snep fo aerA
295,49930,441102,72gnicneF AN974,41089,6sretlehS
705,36057,18072,71stnemevorpmI 169,55262,08396,91sgnidliuB
AN663,81633,01snep gnikroW AN%45%46ytilicaF gnildnaH htiw tnecreP AN205,63726,51ytilicaF gnildnaH fo tsoC
341,21137,81709,2riapeR dna ecnanetniaM
Equipment566,16862,39900,33tnempiuqe egraL
193,41148,91523,9)s(VTA 802,73074,55224,92selcihev hcnaR 830,02015,62875,9stnemelpmI
822,9124,41003,6setarc/sreliarT 094,7360,31540,4snib deef kluB 794,9957,61766,3tnempuqe gnideeF 640,9314,9893,2tnempiuqe gniretaW 300,2374,3619,1tnempiuqe oediV 424,3617,4481,1tnempiuqe latneR
AN877,1871,1tnempiuqe noitadeS
Veterinary & SuppliesAN065,5755,3seilppus gnitarepO AN476,2576,1seilppus lacideM AN121,4752,2esnepxe yranireteV
381,5732,5ANseilppus egdoL 320,5120,5ANsegareveb dna doof egdoL
Labor222yralas diap seeyolpmE 232ylruoh diap seeyolpmE
806,93108,56316,53diap segaw yralas latoT 431,22589,82766,32esnepxe egaw yralas launna egarevA 986,31508,62893,8diap egaw ylruoh latoT
864,9658,9225,5esnepxe egaw ylruoh launna egarevA 790,21654,61240,4secivres decruostuO
Utilities535,4155,7816,1seitilitU 401,5070,01301,2leuF
Miscellaneous Expenses366,3619,5519,1ecnarusnI 301,6790,8223,2gnitekram/gnisitrevdA 468,3803,6353,2levarT 860,4465,6374,2xat ytreporP
utilities, insurance, advertising, and travel. Capital expenses refer to annualized capital costs for items such as land, im-provements, fencing, buildings, breeding stock, feeding equipment, ATV’s, and implements. Feed refers to the annual feed costs, including supplemental feed, hay, and bottle feeding supplies. Lastly, General costs cover the remainder of expenditures on items such as food plots, artificial insemination, veterinary, and disease monitoring.
Production
Table 2 contains a summary of production data across all respondents. Feed represents a little over 11 percent of total annual expenditures for breeding operations. From venison production to breeding stock operations, proper nutri-tion is essential to the physical health, development, and overall well being of all cervids. For breeding only operations with whitetails, 53 percent of respondents indicated bottle feeding their fawns, while only 29 percent of breeding and
11
Table 2: Average Production Data of Cervid Industry Survey Respondents.Breeding Only Breeding & Hunting
Herd Inventory (Final 2005) Whitetail
9412selaM 1552selameF 8432snwaF 2.13.1)5002( etar htriB 3.14.1)6002( etar htriB
%7%8etaR ytilatroM launnA Elk
2181selaM 942selameF 361snwaF
Fallow334selaM 449selameF *05snwaF
Red Deer7464selaM 6675selameF 7253snwaF
FeedingWhitetailFawns
%92%35gnideef elttob tnecreP %44%35def elttob snwaf fo tnecreP 1989gninaew litnu syad gnideef elttob egarevA
After weaning22)sbl( etar deef nietorp yliaD 11)sbl( etar deef yah yliaD
Does33)sbl( etar deef nietorp yliaD 12)sbl( etar deef yah yliaD
Bucks44)sbl( etar deef nietorp yliaD 22)sbl( etar deef yah yliaD
Elk Males
66)sbl( etar deef nietorp yliaD 0101)sbl( etar deef yah yliaD
Females74)sbl( etar deef nietorp yliaD 0101)sbl( etar deef yah yliaD
Fallow Males
24.0)sbl( etar deef nietorp yliaD *4)sbl( etar deef yah yliaD
Females23.0)sbl( etar deef nietorp yliaD *4)sbl( etar deef yah yliaD
Red Deer Males
35)sbl( etar deef nietorp yliaD 37)sbl( etar deef yah yliaD
Females34)sbl( etar deef nietorp yliaD 36)sbl( etar deef yah yliaD 7441)serca( stolp doof fo aerA
065,2318deeS 777,2110,1rezilitreF
503813)not rep( ecirp deef neitorP862391)not rep( ecirp yaH
* Insufficient results
SUR
VEY
RESU
LTS
12
SUR
VEY
RES
ULT
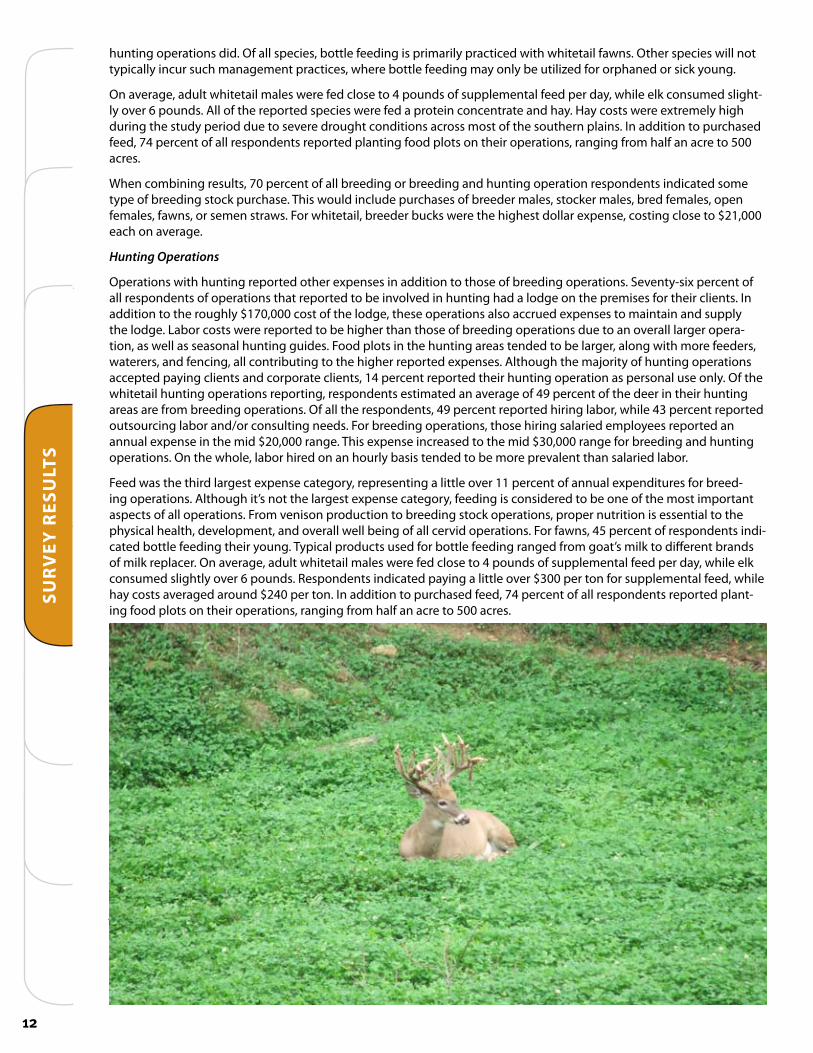
Shunting operations did. Of all species, bottle feeding is primarily practiced with whitetail fawns. Other species will not typically incur such management practices, where bottle feeding may only be utilized for orphaned or sick young.
On average, adult whitetail males were fed close to 4 pounds of supplemental feed per day, while elk consumed slight-ly over 6 pounds. All of the reported species were fed a protein concentrate and hay. Hay costs were extremely high during the study period due to severe drought conditions across most of the southern plains. In addition to purchased feed, 74 percent of all respondents reported planting food plots on their operations, ranging from half an acre to 500 acres.
When combining results, 70 percent of all breeding or breeding and hunting operation respondents indicated some type of breeding stock purchase. This would include purchases of breeder males, stocker males, bred females, open females, fawns, or semen straws. For whitetail, breeder bucks were the highest dollar expense, costing close to $21,000 each on average.
Hunting Operations
Operations with hunting reported other expenses in addition to those of breeding operations. Seventy-six percent of all respondents of operations that reported to be involved in hunting had a lodge on the premises for their clients. In addition to the roughly $170,000 cost of the lodge, these operations also accrued expenses to maintain and supply the lodge. Labor costs were reported to be higher than those of breeding operations due to an overall larger opera-tion, as well as seasonal hunting guides. Food plots in the hunting areas tended to be larger, along with more feeders, waterers, and fencing, all contributing to the higher reported expenses. Although the majority of hunting operations accepted paying clients and corporate clients, 14 percent reported their hunting operation as personal use only. Of the whitetail hunting operations reporting, respondents estimated an average of 49 percent of the deer in their hunting areas are from breeding operations. Of all the respondents, 49 percent reported hiring labor, while 43 percent reported outsourcing labor and/or consulting needs. For breeding operations, those hiring salaried employees reported an annual expense in the mid $20,000 range. This expense increased to the mid $30,000 range for breeding and hunting operations. On the whole, labor hired on an hourly basis tended to be more prevalent than salaried labor.
Feed was the third largest expense category, representing a little over 11 percent of annual expenditures for breed-ing operations. Although it’s not the largest expense category, feeding is considered to be one of the most important aspects of all operations. From venison production to breeding stock operations, proper nutrition is essential to the physical health, development, and overall well being of all cervid operations. For fawns, 45 percent of respondents indi-cated bottle feeding their young. Typical products used for bottle feeding ranged from goat’s milk to different brands of milk replacer. On average, adult whitetail males were fed close to 4 pounds of supplemental feed per day, while elk consumed slightly over 6 pounds. Respondents indicated paying a little over $300 per ton for supplemental feed, while hay costs averaged around $240 per ton. In addition to purchased feed, 74 percent of all respondents reported plant-ing food plots on their operations, ranging from half an acre to 500 acres.
1
1
13
Economic ImpactIMPLAN® (Impact Analysis for Planning), an input/output model, was used to estimate the economic impact of the cervid farming industry on the national economy. Originally developed by the USDA Forest Service, the IMPLAN model is now managed and maintained by the Minnesota IMPLAN Group (MIG). The model is, arguably, the most used and cited model for performing economic impact analyses in the United States.
The IMPLAN model is driven by purchases of final goods and services in a certain region, such as a state, a group of states, or the entire nation. These purchases represent the dollar value of the increase in finished goods and services demanded, and create an impact that ripples throughout the economy.
Industries produce goods and services for final use and purchase goods and services from other industries. These other producers and industries buy goods and services as well, which IMPLAN designates as indirect purchases. In addition, each step along the cycle pays wages and salaries to employees, who, in turn, make ad-ditional expenditures into the economy of the region.2
In determining the overall economic impact of an industry, the IMPLAN model uses a set of multipliers, sepa-rated by sector, to estimate the direct, indirect, and induced effects (induced being effects of household spending) of the economic cycle. Over 500 sector codes are included in the IMPLAN model, where each code represents a unique industrial sector that a specific product or category of products is represented by. The multipliers that are derived for each sector quantify the ripple effects of a dollar increase in final demand, thus resulting in an estimation of the economic impact.3
Cervid Industry
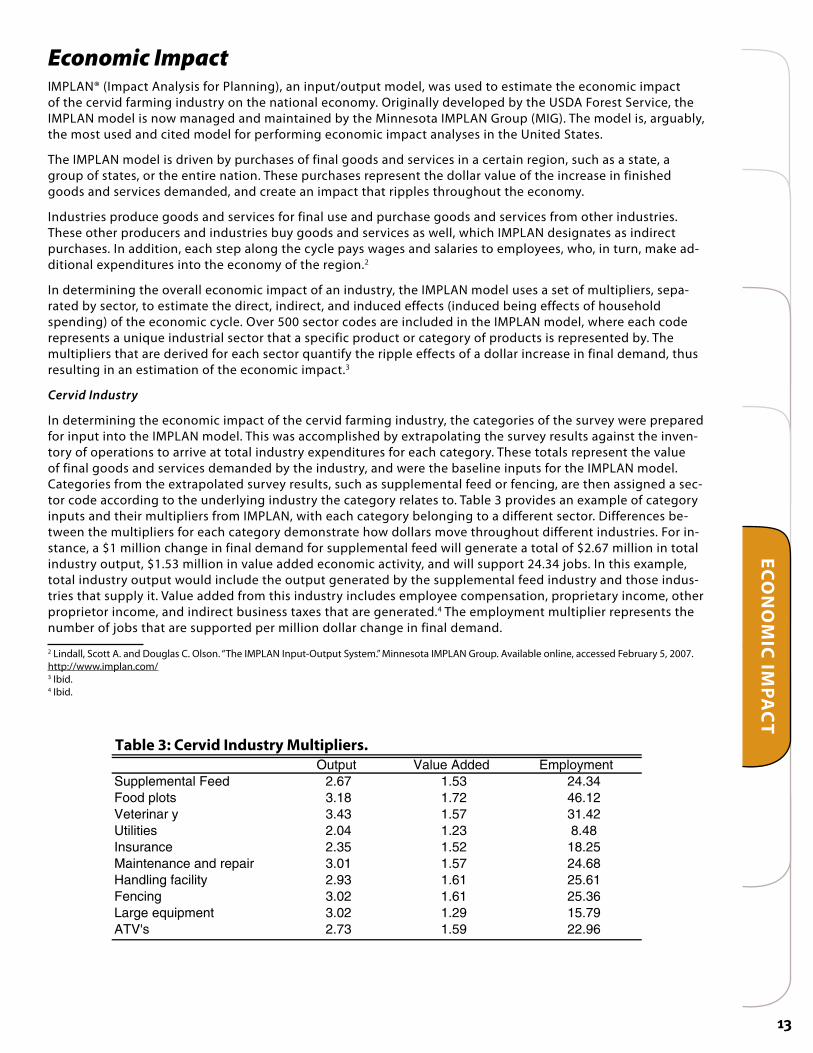
In determining the economic impact of the cervid farming industry, the categories of the survey were prepared for input into the IMPLAN model. This was accomplished by extrapolating the survey results against the inven-tory of operations to arrive at total industry expenditures for each category. These totals represent the value of final goods and services demanded by the industry, and were the baseline inputs for the IMPLAN model. Categories from the extrapolated survey results, such as supplemental feed or fencing, are then assigned a sec-tor code according to the underlying industry the category relates to. Table 3 provides an example of category inputs and their multipliers from IMPLAN, with each category belonging to a different sector. Differences be-tween the multipliers for each category demonstrate how dollars move throughout different industries. For in-stance, a $1 million change in final demand for supplemental feed will generate a total of $2.67 million in total industry output, $1.53 million in value added economic activity, and will support 24.34 jobs. In this example, total industry output would include the output generated by the supplemental feed industry and those indus-tries that supply it. Value added from this industry includes employee compensation, proprietary income, other proprietor income, and indirect business taxes that are generated.4 The employment multiplier represents the number of jobs that are supported per million dollar change in final demand.
2 Lindall, Scott A. and Douglas C. Olson. “The IMPLAN Input-Output System.” Minnesota IMPLAN Group. Available online, accessed February 5, 2007. http://www.implan.com/3 Ibid.4 Ibid.
Table 3: Cervid Industry Multipliers.Output Value Added Employment
Supplemental Feed 2.67 1.53 24.34Food plots 3.18 1.72 46.12Veterinar y 3.43 1.57 31.42Utilities 2.04 1.23 8.48Insurance 2.35 1.52 18.25Maintenance and repair 3.01 1.57 24.68Handling facility 2.93 1.61 25.61Fencing 3.02 1.61 25.36Large equipment 3.02 1.29 15.79ATV's 2.73 1.59 22.96
ECO
NO
MIC
IMPA
CT
14
ECO
NO
MIC
IMPA
CT
Hunter Expenditures
An additional component in determining the economic impact of the industry is to evaluate and include the role of hunter expenditures in the consumption of industry products. Not all hunting is related to cervid farm-ing, but some is, therefore it is important to include only that which is related to this industry. In other words, the hunting product of cervid farming is a small part of overall cervid hunting in the United States. Yet the hunting component or economic activity associated with deer farming is an important part of the economic activity generated by the cervid farming industry. While overall hunter numbers in the United States are down, the demand for trophy hunting appears to be increasing. Dollars spent on hunting, assorted gear, and travel continue to grow. Time is increasingly the limiting factor for many industry participants, as they have the mon-ey to participate, but not the time to invest in traditional hunting. The growth of this segment of the industry is expected to continue, therefore, it is important to include this aspect of the industry in this study.
In order to determine this impact, the number of hunters per operation was taken from the survey, extrapo-lated against all hunting operations, and combined with a report that outlines hunting expenditures on a per hunter basis. This report, entitled the “Economic Importance of Hunting in America”,5 was based on the 2001 National Survey of Fishing, Hunting, and Wildlife-Associated Recreation survey conducted by the U.S. Fish and Wildlife Service and the U.S. Census Bureau. These retail expenditures were then combined with other hunt related expenditures, such as trophy and processing fees, and assigned sector codes for the IMPLAN model. When totaled, less than 1 percent of the report’s estimated 11 million deer hunters are related to the cervid farming industry. However, this small percentage of hunters account for over 2 percent of the report’s estimat-ed $10 billion in retail, travel, and hunt related expenditures.
Results
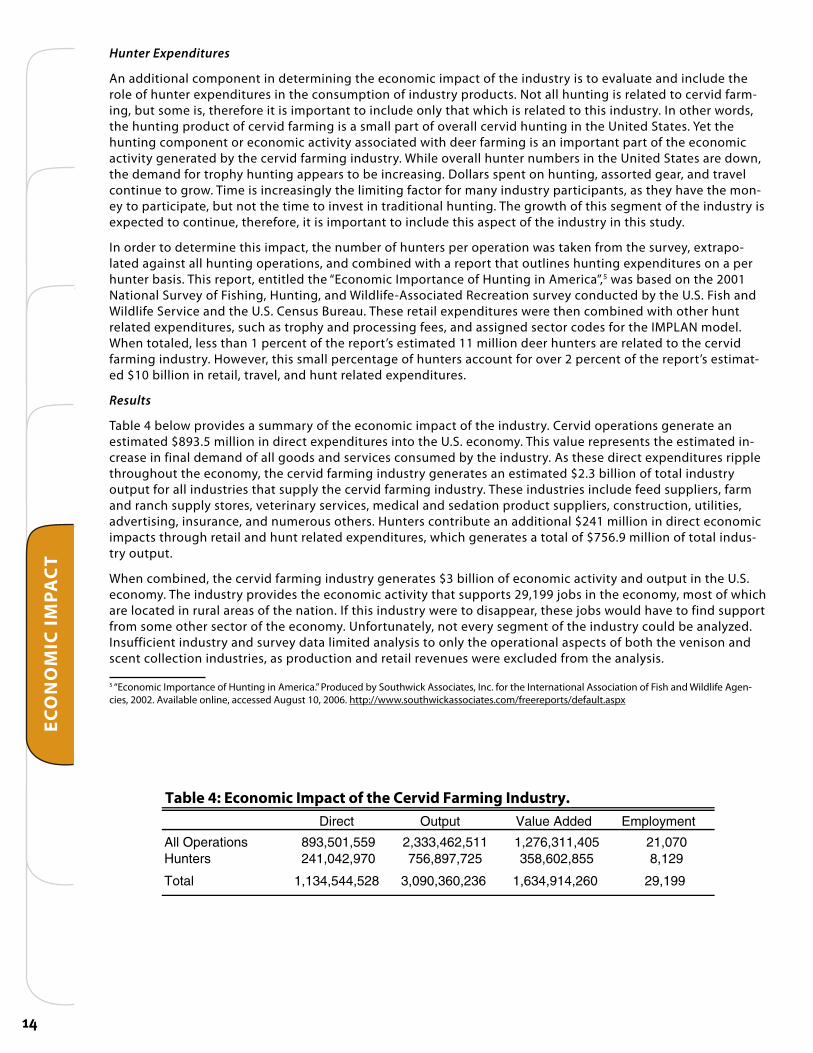
Table 4 below provides a summary of the economic impact of the industry. Cervid operations generate an estimated $893.5 million in direct expenditures into the U.S. economy. This value represents the estimated in-crease in final demand of all goods and services consumed by the industry. As these direct expenditures ripple throughout the economy, the cervid farming industry generates an estimated $2.3 billion of total industry output for all industries that supply the cervid farming industry. These industries include feed suppliers, farm and ranch supply stores, veterinary services, medical and sedation product suppliers, construction, utilities, advertising, insurance, and numerous others. Hunters contribute an additional $241 million in direct economic impacts through retail and hunt related expenditures, which generates a total of $756.9 million of total indus-try output.
When combined, the cervid farming industry generates $3 billion of economic activity and output in the U.S. economy. The industry provides the economic activity that supports 29,199 jobs in the economy, most of which are located in rural areas of the nation. If this industry were to disappear, these jobs would have to find support from some other sector of the economy. Unfortunately, not every segment of the industry could be analyzed. Insufficient industry and survey data limited analysis to only the operational aspects of both the venison and scent collection industries, as production and retail revenues were excluded from the analysis.
5 “Economic Importance of Hunting in America.” Produced by Southwick Associates, Inc. for the International Association of Fish and Wildlife Agen-cies, 2002. Available online, accessed August 10, 2006. http://www.southwickassociates.com/freereports/default.aspx
Table 4: Economic Impact of the Cervid Farming Industry.Direct Output Value Added Employment
All Operations 893,501,559 2,333,462,511 1,276,311,405 21,070Hunters 241,042,970 756,897,725 358,602,855 8,129
Total 1,134,544,528 3,090,360,236 1,634,914,260 29,199
15
CO
NC
LUSIO
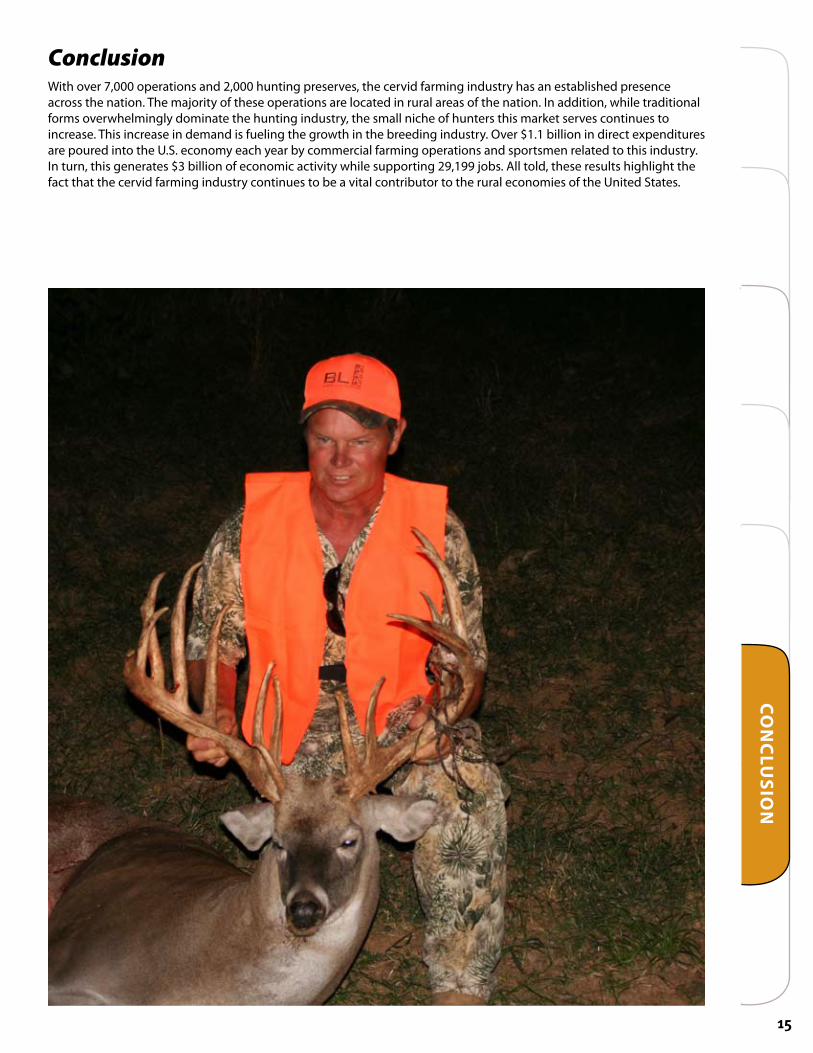
NConclusionWith over 7,000 operations and 2,000 hunting preserves, the cervid farming industry has an established presence across the nation. The majority of these operations are located in rural areas of the nation. In addition, while traditional forms overwhelmingly dominate the hunting industry, the small niche of hunters this market serves continues to increase. This increase in demand is fueling the growth in the breeding industry. Over $1.1 billion in direct expenditures are poured into the U.S. economy each year by commercial farming operations and sportsmen related to this industry. In turn, this generates $3 billion of economic activity while supporting 29,199 jobs. All told, these results highlight the fact that the cervid farming industry continues to be a vital contributor to the rural economies of the United States.
16
AP
PEN
DIX
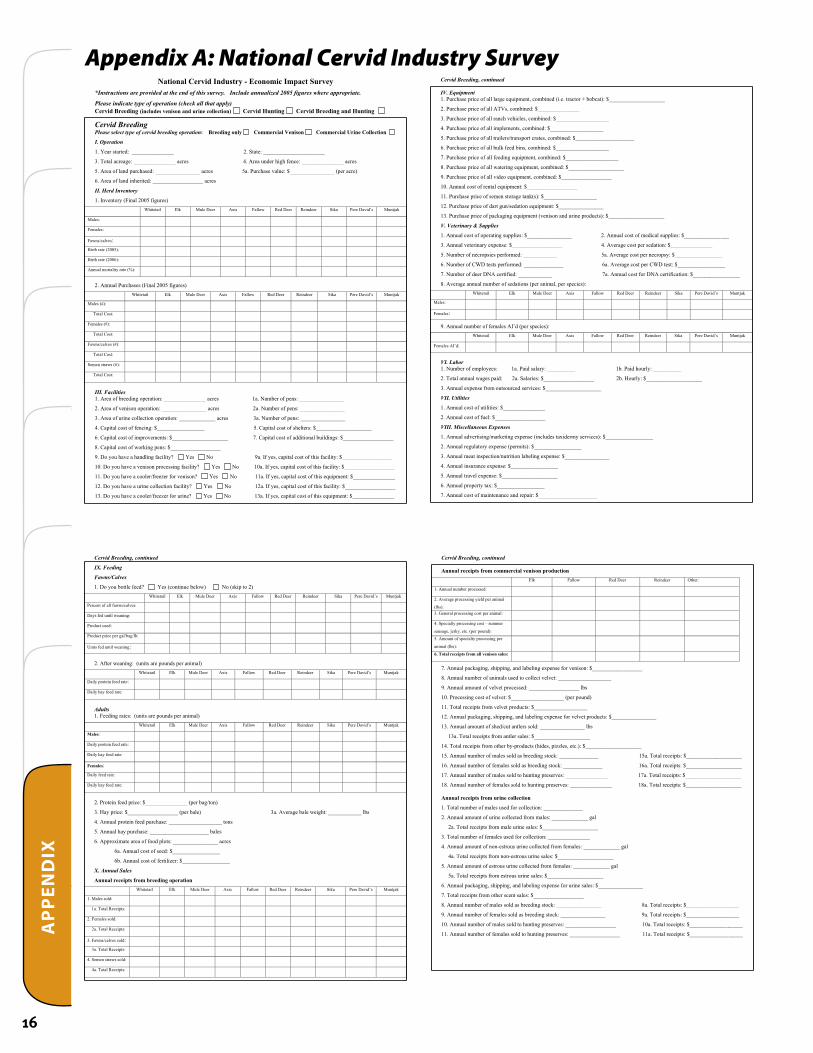
National Cervid Industry - Economic Impact Survey *Instructions are provided at the end of this survey. Include annualized 2005 figures where appropriate.
Please indicate type of operation (check all that apply)Cervid Breeding (includes venison and urine collection) Cervid Hunting Cervid Breeding and Hunting
Cervid Breeding Please select type of cervid breeding operation: Breeding only Commercial Venison Commercial Urine Collection
I. Operation
1. Year started: _______________ 2. State: ______________________
3. Total acreage: _______________ acres 4. Area under high fence: _______________ acres
5. Area of land purchased: ________________ acres 5a. Purchase value: $________________ (per acre)
6. Area of land inherited: __________________ acres
II. Herd Inventory
1. Inventory (Final 2005 figures)
Whitetail Elk Mule Deer Axis Fallow Red Deer Reindeer Sika Pere David’s Muntjak
Males:
Females:
Fawns/calves:
Birth rate (2005):
Birth rate (2006):
Annual mortality rate (%):
2. Annual Purchases (Final 2005 figures)
Whitetail Elk Mule Deer Axis Fallow Red Deer Reindeer Sika Pere David’s Muntjak
Males (#):
Total Cost:
Females (#):
Total Cost:
Fawns/calves (#):
Total Cost:
Semen straws (#):
Total Cost:
III. Facilities 1. Area of breeding operation: _______________ acres 1a. Number of pens: ________________
2. Area of venison operation: ________________ acres 2a. Number of pens: ________________
3. Area of urine collection operation: _____________ acres 3a. Number of pens: ________________
4. Capital cost of fencing: $_________________ 5. Capital cost of shelters: $____________________
6. Capital cost of improvements: $____________________ 7. Capital cost of additional buildings: $__________________
8. Capital cost of working pens: $__________________
9. Do you have a handling facility? Yes No 9a. If yes, capital cost of this facility: $__________________
10. Do you have a venison processing facility? Yes No 10a. If yes, capital cost of this facility: $__________________
11. Do you have a cooler/freezer for venison? Yes No 11a. If yes, capital cost of this equipment: $_______________
12. Do you have a urine collection facility? Yes No 12a. If yes, capital cost of this facility: $__________________
13. Do you have a cooler/freezer for urine? Yes No 13a. If yes, capital cost of this equipment: $_______________
Cervid Breeding, continued
IV. Equipment 1. Purchase price of all large equipment, combined (i.e. tractor + bobcat): $____________________
2. Purchase price of all ATVs, combined: $_______________
3. Purchase price of all ranch vehicles, combined: $___________________
4. Purchase price of all implements, combined: $___________________
5. Purchase price of all trailers/transport crates, combined: $_____________________
6. Purchase price of all bulk feed bins, combined: $___________________
7. Purchase price of all feeding equipment, combined: $___________________
8. Purchase price of all watering equipment, combined: $____________________
9. Purchase price of all video equipment, combined: $__________________
10. Annual cost of rental equipment: $__________________
11. Purchase price of semen storage tank(s): $___________________
12. Purchase price of dart gun/sedation equipment: $________________
13. Purchase price of packaging equipment (venison and urine products): $____________________
V. Veterinary & Supplies
1. Annual cost of operating supplies: $________________ 2. Annual cost of medical supplies: $________________
3. Annual veterinary expense: $__________________ 4. Average cost per sedation: $_______________
5. Number of necropsies performed: ____________ 5a. Average cost per necropsy: $_________________
6. Number of CWD tests performed: ______________ 6a. Average cost per CWD test: $_________________
7. Number of deer DNA certified: ____________ 7a. Annual cost for DNA certification: $_________________
8. Average annual number of sedations (per animal, per species):
Whitetail Elk Mule Deer Axis Fallow Red Deer Reindeer Sika Pere David’s Muntjak
Males:
Females:
9. Annual number of females AI’d (per species):
Whitetail Elk Mule Deer Axis Fallow Red Deer Reindeer Sika Pere David’s Muntjak
Females AI’d:
VI. Labor 1. Number of employees: 1a. Paid salary: __________ 1b. Paid hourly: __________
2. Total annual wages paid: 2a. Salaries: $__________________ 2b. Hourly: $____________________
3. Annual expense from outsourced services: $____________________
VII. Utilities
1. Annual cost of utilities: $_______________
2. Annual cost of fuel: $__________________
VIII. Miscellaneous Expenses
1. Annual advertising/marketing expense (includes taxidermy services): $_________________
2. Annual regulatory expense (permits): $_________________
3. Annual meat inspection/nutrition labeling expense: $________________
4. Annual insurance expense: $_________________
5. Annual travel expense: $____________________
6. Annual property tax: $_________________
7. Annual cost of maintenance and repair: $_____________________
Cervid Breeding, continued
IX. Feeding
Fawns/Calves
1. Do you bottle feed? Yes (continue below) No (skip to 2)
Whitetail Elk Mule Deer Axis Fallow Red Deer Reindeer Sika Pere David’s Muntjak
Percent of all fawns/calves:
Days fed until weaning:
Product used:
Product price per gal/bag/lb:
Units fed until weaning:
2. After weaning: (units are pounds per animal)
Whitetail Elk Mule Deer Axis Fallow Red Deer Reindeer Sika Pere David’s Muntjak
Daily protein feed rate:
Daily hay feed rate:
Adults1. Feeding rates: (units are pounds per animal)
Whitetail Elk Mule Deer Axis Fallow Red Deer Reindeer Sika Pere David’s Muntjak
Males:
Daily protein feed rate:
Daily hay feed rate:
Females:
Daily feed rate:
Daily hay feed rate:
2. Protein feed price: $_______________ (per bag/ton)
3. Hay price: $__________________ (per bale) 3a. Average bale weight: ____________ lbs
4. Annual protein feed purchase: ___________________ tons
5. Annual hay purchase: _____________________ bales
6. Approximate area of food plots: ________________ acres
6a. Annual cost of seed: $_________________
6b. Annual cost of fertilizer: $_________________
X. Annual Sales
Annual receipts from breeding operation
Whitetail Elk Mule Deer Axis Fallow Red Deer Reindeer Sika Pere David’s Muntjak
1. Males sold:
1a. Total Receipts:
2. Females sold:
2a. Total Receipts:
3. Fawns/calves sold:
3a. Total Receipts:
4. Semen straws sold:
4a. Total Receipts:
Cervid Breeding, continued
Annual receipts from commercial venison production
Elk Fallow Red Deer Reindeer Other:
1. Annual number processed:
2. Average processing yield per animal
(lbs): 3. General processing cost per animal:
4. Specialty processing cost – summer
sausage, jerky, etc. (per pound):
5. Amount of specialty processing per
animal (lbs):
6. Total receipts from all venison sales:
7. Annual packaging, shipping, and labeling expense for venison: $__________________
8. Annual number of animals used to collect velvet: ___________________
9. Annual amount of velvet processed: __________________ lbs
10. Processing cost of velvet: $___________________ (per pound)
11. Total receipts from velvet products: $___________________
12. Annual packaging, shipping, and labeling expense for velvet products: $________________
13. Annual amount of shed/cut antlers sold: ________________ lbs
13a. Total receipts from antler sales: $____________________
14. Total receipts from other by-products (hides, pizzles, etc.): $____________________
15. Annual number of males sold as breeding stock: ______________ 15a. Total receipts: $____________________
16. Annual number of females sold as breeding stock: ______________ 16a. Total receipts: $____________________
17. Annual number of males sold to hunting preserves: _______________ 17a. Total receipts: $____________________
18. Annual number of females sold to hunting preserves: _______________ 18a. Total receipts: $____________________
Annual receipts from urine collection
1. Total number of males used for collection: ______________
2. Annual amount of urine collected from males: _____________ gal
2a. Total receipts from male urine sales: $____________________
3. Total number of females used for collection: _______________
4. Annual amount of non-estrous urine collected from females: _____________ gal
4a. Total receipts from non-estrous urine sales: $____________________
5. Annual amount of estrous urine collected from females: _____________ gal
5a. Total receipts from estrous urine sales: $____________________
6. Annual packaging, shipping, and labeling expense for urine sales: $________________
7. Total receipts from other scent sales: $__________________
8. Annual number of males sold as breeding stock: ________________ 8a. Total receipts: $___________________
9. Annual number of females sold as breeding stock: ________________ 9a. Total receipts: $___________________
10. Annual number of males sold to hunting preserves: __________________ 10a. Total receipts: $___________________
11. Annual number of females sold to hunting preserves: __________________ 11a. Total receipts: $___________________
Appendix A: National Cervid Industry Survey
17
AP
PEN
DIX
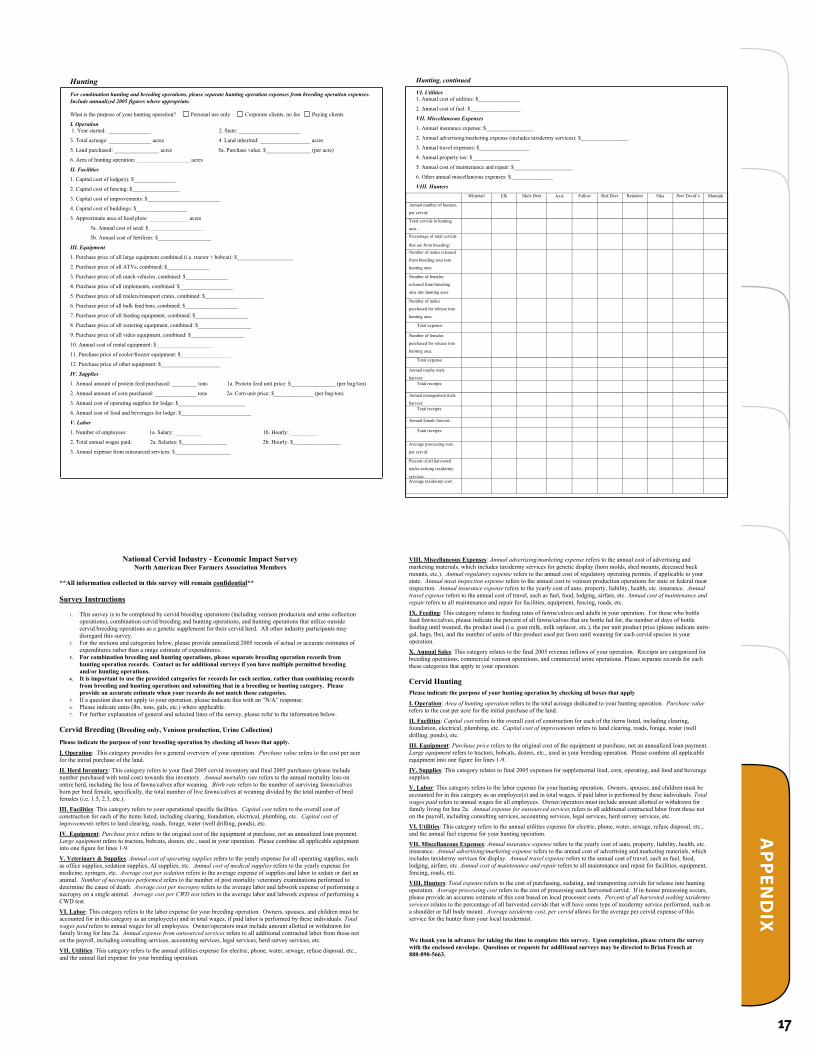
Hunting
For combination hunting and breeding operations, please separate hunting operation expenses from breeding operation expenses. Include annualized 2005 figures where appropriate.
What is the purpose of your hunting operation? Personal use only Corporate clients, no fee Paying clients
I. Operation 1. Year started: _______________ 2. State: ______________________
3. Total acreage: _______________ acres 4. Land inherited: __________________ acres
5. Land purchased: ________________ acres 5a. Purchase value: $________________ (per acre)
6. Area of hunting operation: ___________________ acres
II. Facilities
1. Capital cost of lodge(s): $_______________
2. Capital cost of fencing: $_________________
3. Capital cost of improvements: $__________________________
4. Capital cost of buildings: $__________________
5. Approximate area of food plots: ______________ acres
5a. Annual cost of seed: $____________________
5b. Annual cost of fertilizer: $___________________
III. Equipment
1. Purchase price of all large equipment combined (i.e. tractor + bobcat): $____________________
2. Purchase price of all ATVs, combined: $_______________
3. Purchase price of all ranch vehicles, combined: $_______________
4. Purchase price of all implements, combined: $___________________
5. Purchase price of all trailers/transport crates, combined: $_____________________
6. Purchase price of all bulk feed bins, combined: $___________________
7. Purchase price of all feeding equipment, combined: $___________________
8. Purchase price of all watering equipment, combined: $___________________
9. Purchase price of all video equipment, combined: $___________________
10. Annual cost of rental equipment: $____________________
11. Purchase price of cooler/freezer equipment: $__________________
12. Purchase price of other equipment: $_____________________
IV. Supplies
1. Annual amount of protein feed purchased: _________ tons 1a. Protein feed unit price: $________________ (per bag/ton)
2. Annual amount of corn purchased: _______________ tons 2a. Corn unit price: $______________ (per bag/ton)
3. Annual cost of operating supplies for lodge: $________________________
4. Annual cost of food and beverages for lodge: $_________________________
V. Labor
1. Number of employees: 1a. Salary: __________ 1b. Hourly: __________
2. Total annual wages paid: 2a. Salaries: $________________ 2b. Hourly: $_________________
3. Annual expense from outsourced services: $____________________
Hunting, continued
VI. Utilities 1. Annual cost of utilities: $_______________
2. Annual cost of fuel: $__________________
VII. Miscellaneous Expenses
1. Annual insurance expense: $_________________
2. Annual advertising/marketing expense (includes taxidermy services): $_________________
3. Annual travel expenses: $__________________
4. Annual property tax: $_________________
5. Annual cost of maintenance and repair: $_____________________
6. Other annual miscellaneous expenses: $_______________
VIII. Hunters
Whitetail Elk Mule Deer Axis Fallow Red Deer Reindeer Sika Pere David’s Muntjak
Annual number of hunters,
per cervid:
Total cervids in hunting
area :
Percentage of total cervids
that are from breeding:Number of males released
from breeding area into
hunting area:
Number of females
released from breeding
area into hunting area:
Number of males
purchased for release into
hunting area:
Total expense:
Number of females
purchased for release into
hunting area:
Total expense:
Annual trophy male
harvest: Total receipts:
Annual management male
harvest: Total receipts:
Annual female harvest:
Total receipts:
Average processing cost,
per cervid:
Percent of all harvested
males seeking taxidermy
services:Average taxidermy cost:
National Cervid Industry - Economic Impact Survey North American Deer Farmers Association Members
**All information collected in this survey will remain confidential**
Survey Instructions
1. This survey is to be completed by cervid breeding operations (including venison production and urine collection operations), combination cervid breeding and hunting operations, and hunting operations that utilize outside cervid breeding operations as a genetic supplement for their cervid herd. All other industry participants may disregard this survey.
2. For the sections and categories below, please provide annualized 2005 records of actual or accurate estimates of expenditures rather than a range estimate of expenditures.
3. For combination breeding and hunting operations, please separate breeding operation records from hunting operation records. Contact us for additional surveys if you have multiple permitted breeding and/or hunting operations.
4. It is important to use the provided categories for records for each section, rather than combining records from breeding and hunting operations and submitting that in a breeding or hunting category. Please provide an accurate estimate when your records do not match these categories.
5. If a question does not apply to your operation, please indicate this with an “N/A” response. 6. Please indicate units (lbs, tons, gals, etc.) where applicable. 7. For further explanation of general and selected lines of the survey, please refer to the information below.
Cervid Breeding (Breeding only, Venison production, Urine Collection)
Please indicate the purpose of your breeding operation by checking all boxes that apply.
I. Operation: This category provides for a general overview of your operation. Purchase value refers to the cost per acre for the initial purchase of the land.
II. Herd Inventory: This category refers to your final 2005 cervid inventory and final 2005 purchases (please include number purchased with total cost) towards this inventory. Annual mortality rate refers to the annual mortality loss on entire herd, including the loss of fawns/calves after weaning. Birth rate refers to the number of surviving fawns/calves born per bred female, specifically, the total number of live fawns/calves at weaning divided by the total number of bred females (i.e. 1.5, 2.3, etc.).
III. Facilities: This category refers to your operational specific facilities. Capital cost refers to the overall cost of construction for each of the items listed, including clearing, foundation, electrical, plumbing, etc. Capital cost of improvements refers to land clearing, roads, forage, water (well drilling, ponds), etc.
IV. Equipment: Purchase price refers to the original cost of the equipment at purchase, not an annualized loan payment. Large equipment refers to tractors, bobcats, dozers, etc., used in your operation. Please combine all applicable equipment into one figure for lines 1-9.
V. Veterinary & Supplies: Annual cost of operating supplies refers to the yearly expense for all operating supplies, such as office supplies, sedation supplies, AI supplies, etc. Annual cost of medical supplies refers to the yearly expense for medicine, syringes, etc. Average cost per sedation refers to the average expense of supplies and labor to sedate or dart an animal. Number of necropsies performed refers to the number of post mortality veterinary examinations performed to determine the cause of death. Average cost per necropsy refers to the average labor and labwork expense of performing a necropsy on a single animal. Average cost per CWD test refers to the average labor and labwork expense of performing a CWD test.
VI. Labor: This category refers to the labor expense for your breeding operation. Owners, spouses, and children must be accounted for in this category as an employee(s) and in total wages, if paid labor is performed by these individuals. Total wages paid refers to annual wages for all employees. Owner/operators must include amount allotted or withdrawn for family living for line 2a. Annual expense from outsourced services refers to all additional contracted labor from those not on the payroll, including consulting services, accounting services, legal services, herd survey services, etc.
VII. Utilities: This category refers to the annual utilities expense for electric, phone, water, sewage, refuse disposal, etc., and the annual fuel expense for your breeding operation.
VIII. Miscellaneous Expenses: Annual advertising/marketing expense refers to the annual cost of advertising and marketing materials, which includes taxidermy services for genetic display (horn molds, shed mounts, deceased buck mounts, etc.). Annual regulatory expense refers to the annual cost of regulatory operating permits, if applicable to your state. Annual meat inspection expense refers to the annual cost to venison production operations for state or federal meat inspection. Annual insurance expense refers to the yearly cost of auto, property, liability, health, etc. insurance. Annual travel expense refers to the annual cost of travel, such as fuel, food, lodging, airfare, etc. Annual cost of maintenance and repair refers to all maintenance and repair for facilities, equipment, fencing, roads, etc.
IX. Feeding: This category relates to feeding rates of fawns/calves and adults in your operation. For those who bottle feed fawns/calves, please indicate the percent of all fawns/calves that are bottle fed for, the number of days of bottle feeding until weaned, the product used (i.e. goat milk, milk replacer, etc.), the per unit product price (please indicate units-gal, bags, lbs), and the number of units of this product used per fawn until weaning for each cervid species in your operation.
X. Annual Sales: This category relates to the final 2005 revenue inflows of your operation. Receipts are categorized for breeding operations, commercial venison operations, and commercial urine operations. Please separate records for each these categories that apply to your operation.
Cervid HuntingPlease indicate the purpose of your hunting operation by checking all boxes that apply
I. Operation: Area of hunting operation refers to the total acreage dedicated to your hunting operation. Purchase valuerefers to the cost per acre for the initial purchase of the land.
II. Facilities: Capital cost refers to the overall cost of construction for each of the items listed, including clearing, foundation, electrical, plumbing, etc. Capital cost of improvements refers to land clearing, roads, forage, water (well drilling, ponds), etc.
III. Equipment: Purchase price refers to the original cost of the equipment at purchase, not an annualized loan payment. Large equipment refers to tractors, bobcats, dozers, etc., used in your breeding operation. Please combine all applicable equipment into one figure for lines 1-9.
IV. Supplies: This category relates to final 2005 expenses for supplemental feed, corn, operating, and food and beverage supplies.
V. Labor: This category refers to the labor expense for your hunting operation. Owners, spouses, and children must be accounted for in this category as an employee(s) and in total wages, if paid labor is performed by these individuals. Total wages paid refers to annual wages for all employees. Owner/operators must include amount allotted or withdrawn for family living for line 2a. Annual expense for outsourced services refers to all additional contracted labor from those not on the payroll, including consulting services, accounting services, legal services, herd survey services, etc.
VI. Utilities: This category refers to the annual utilities expense for electric, phone, water, sewage, refuse disposal, etc., and the annual fuel expense for your hunting operation.
VII. Miscellaneous Expenses: Annual insurance expense refers to the yearly cost of auto, property, liability, health, etc. insurance. Annual advertising/marketing expense refers to the annual cost of advertising and marketing materials, which includes taxidermy services for display. Annual travel expense refers to the annual cost of travel, such as fuel, food, lodging, airfare, etc. Annual cost of maintenance and repair refers to all maintenance and repair for facilities, equipment, fencing, roads, etc.
VIII. Hunters: Total expense refers to the cost of purchasing, sedating, and transporting cervids for release into hunting operation. Average processing cost refers to the cost of processing each harvested cervid. If in-house processing occurs, please provide an accurate estimate of this cost based on local processor costs. Percent of all harvested seeking taxidermy services relates to the percentage of all harvested cervids that will have some type of taxidermy service performed, such as a shoulder or full body mount. Average taxidermy cost, per cervid allows for the average per cervid expense of this service for the hunter from your local taxidermist.
We thank you in advance for taking the time to complete this survey. Upon completion, please return the survey with the enclosed envelope. Questions or requests for additional surveys may be directed to Brian Frosch at 888-890-5663.
18
AP
PEN
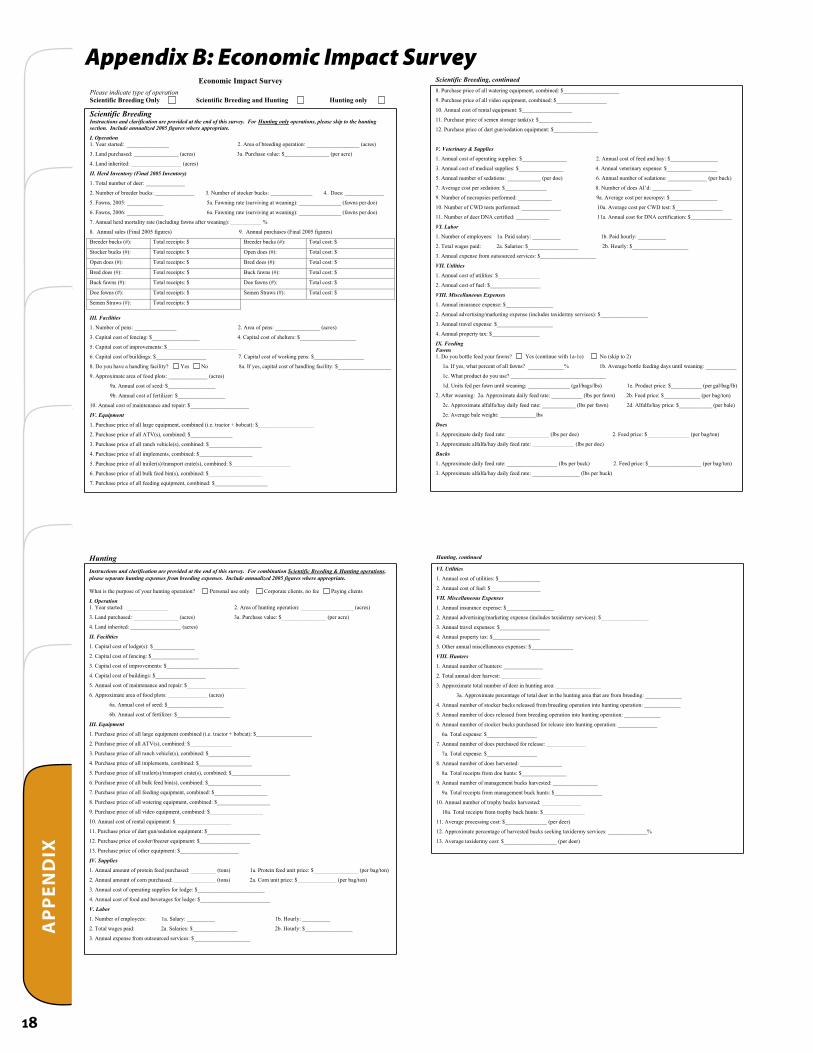
DIXEconomic Impact Survey
Please indicate type of operationScientific Breeding Only Scientific Breeding and Hunting Hunting only
Scientific BreedingInstructions and clarification are provided at the end of this survey. For Hunting only operations, please skip to the hunting section. Include annualized 2005 figures where appropriate.
I. Operation 1. Year started: _______________ 2. Area of breeding operation: ___________________ (acres)
3. Land purchased: ________________ (acres) 3a. Purchase value: $________________ (per acre)
4. Land inherited: __________________ (acres)
II. Herd Inventory (Final 2005 Inventory)
1. Total number of deer: ______________
2. Number of breeder bucks: ______________ 3. Number of stocker bucks: _______________ 4. Does: ______________
5. Fawns, 2005: _____________ 5a. Fawning rate (surviving at weaning): _______________ (fawns per doe)
6. Fawns, 2006: _____________ 6a. Fawning rate (surviving at weaning): _______________ (fawns per doe)
7. Annual herd mortality rate (including fawns after weaning): ___________ %
8. Annual sales (Final 2005 figures) 9. Annual purchases (Final 2005 figures)
Breeder bucks (#): Total receipts: $ Breeder bucks (#): Total cost: $
Stocker bucks (#): Total receipts: $ Open does (#): Total cost: $
Open does (#): Total receipts: $ Bred does (#): Total cost: $
Bred does (#): Total receipts: $ Buck fawns (#): Total cost: $
Buck fawns (#): Total receipts: $ Doe fawns (#): Total cost: $
Doe fawns (#): Total receipts: $ Semen Straws (#): Total cost: $
Semen Straws (#): Total receipts: $
III. Facilities
1. Number of pens: _______________ 2. Area of pens: ________________ (acres)
3. Capital cost of fencing: $_________________ 4. Capital cost of shelters: $____________________
5. Capital cost of improvements: $_________________________
6. Capital cost of buildings: $__________________ 7. Capital cost of working pens: $__________________
8. Do you have a handling facility? Yes No 8a. If yes, capital cost of handling facility: $___________________
9. Approximate area of food plots: ______________ (acres)
9a. Annual cost of seed: $_________________
9b. Annual cost of fertilizer: $_________________
10. Annual cost of maintenance and repair: $_____________________
IV. Equipment
1. Purchase price of all large equipment, combined (i.e. tractor + bobcat): $____________________
2. Purchase price of all ATV(s), combined: $_______________
3. Purchase price of all ranch vehicle(s), combined: $___________________
4. Purchase price of all implements, combined: $___________________
5. Purchase price of all trailer(s)/transport crate(s), combined: $_____________________
6. Purchase price of all bulk feed bin(s), combined: $___________________
7. Purchase price of all feeding equipment, combined: $___________________
Scientific Breeding, continued
8. Purchase price of all watering equipment, combined: $____________________
9. Purchase price of all video equipment, combined: $__________________
10. Annual cost of rental equipment: $__________________
11. Purchase price of semen storage tank(s): $___________________
12. Purchase price of dart gun/sedation equipment: $________________
V. Veterinary & Supplies
1. Annual cost of operating supplies: $________________ 2. Annual cost of feed and hay: $_________________
3. Annual cost of medical supplies: $________________ 4. Annual veterinary expense: $__________________
5. Annual number of sedations: ____________ (per doe) 6. Annual number of sedations: ______________ (per buck)
7. Average cost per sedation: $_______________ 8. Number of does AI’d: ______________
9. Number of necropsies performed: ____________ 9a. Average cost per necropsy: $_________________
10. Number of CWD tests performed: ______________ 10a. Average cost per CWD test: $_________________
11. Number of deer DNA certified: ____________ 11a. Annual cost for DNA certification: $_______________
VI. Labor
1. Number of employees: 1a. Paid salary: __________ 1b. Paid hourly: __________
2. Total wages paid: 2a. Salaries: $__________________ 2b. Hourly: $____________________
3. Annual expense from outsourced services: $____________________
VII. Utilities
1. Annual cost of utilities: $_______________
2. Annual cost of fuel: $__________________
VIII. Miscellaneous Expenses
1. Annual insurance expense: $_________________
2. Annual advertising/marketing expense (includes taxidermy services): $_________________
3. Annual travel expense: $____________________
4. Annual property tax: $_________________
IX. Feeding Fawns 1. Do you bottle feed your fawns? Yes (continue with 1a-1e) No (skip to 2)
1a. If yes, what percent of all fawns? _____________% 1b. Average bottle feeding days until weaning: ___________
1c. What product do you use? __________________________________
1d. Units fed per fawn until weaning: _______________ (gal/bags/lbs) 1e. Product price: $___________ (per gal/bag/lb)
2. After weaning: 2a. Approximate daily feed rate: ___________ (lbs per fawn) 2b. Feed price: $_____________ (per bag/ton)
2c. Approximate alfalfa/hay daily feed rate: ____________ (lbs per fawn) 2d. Alfalfa/hay price: $____________ (per bale)
2e. Average bale weight: _____________lbs
Does
1. Approximate daily feed rate: _______________ (lbs per doe) 2. Feed price: $_______________ (per bag/ton)
3. Approximate alfalfa/hay daily feed rate: _______________ (lbs per doe)
Bucks
1. Approximate daily feed rate: __________________ (lbs per buck) 2. Feed price: $___________________ (per bag/ton)
3. Approximate alfalfa/hay daily feed rate: _________________ (lbs per buck)
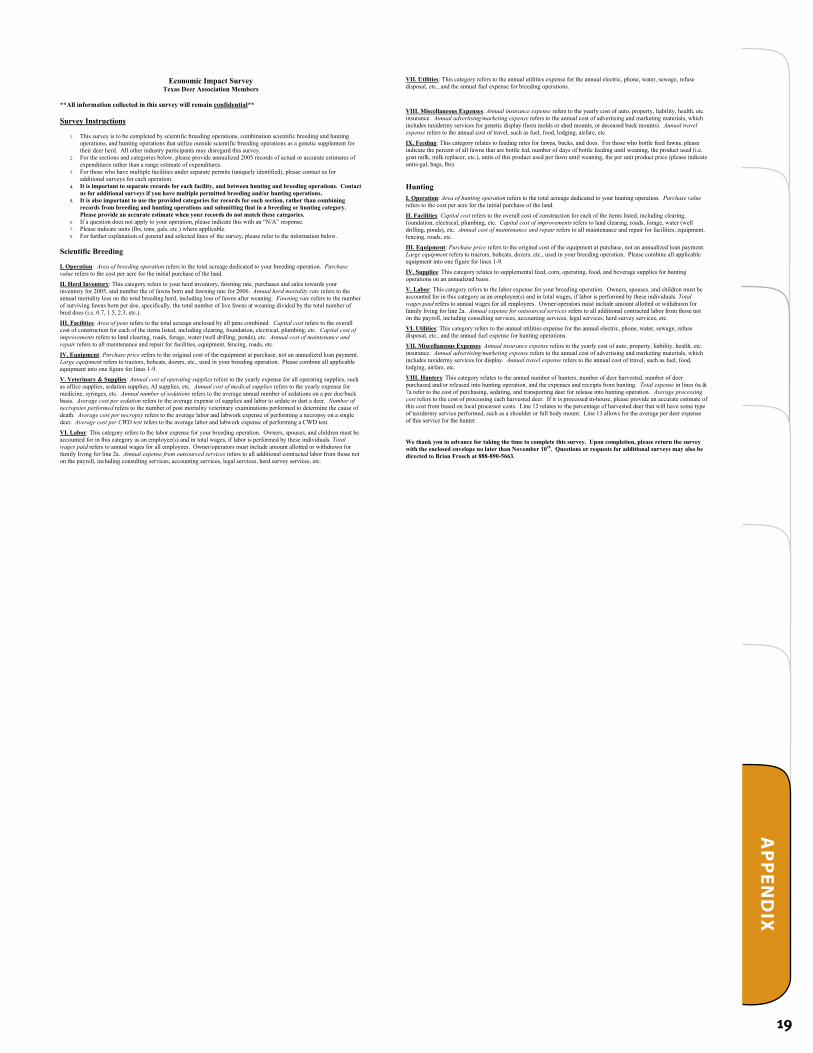
Hunting
Instructions and clarification are provided at the end of this survey. For combination Scientific Breeding & Hunting operations,please separate hunting expenses from breeding expenses. Include annualized 2005 figures where appropriate.
What is the purpose of your hunting operation? Personal use only Corporate clients, no fee Paying clients
I. Operation 1. Year started: _______________ 2. Area of hunting operation: ___________________ (acres)
3. Land purchased: ________________ (acres) 3a. Purchase value: $________________ (per acre)
4. Land inherited: __________________ (acres)
II. Facilities
1. Capital cost of lodge(s): $_______________
2. Capital cost of fencing: $_________________
3. Capital cost of improvements: $__________________________
4. Capital cost of buildings: $__________________
5. Annual cost of maintenance and repair: $_____________________
6. Approximate area of food plots: ______________ (acres)
6a. Annual cost of seed: $____________________
6b. Annual cost of fertilizer: $___________________
III. Equipment
1. Purchase price of all large equipment combined (i.e. tractor + bobcat): $____________________
2. Purchase price of all ATV(s), combined: $_______________
3. Purchase price of all ranch vehicle(s), combined: $_______________
4. Purchase price of all implements, combined: $___________________
5. Purchase price of all trailer(s)/transport crate(s), combined: $_____________________
6. Purchase price of all bulk feed bin(s), combined: $___________________
7. Purchase price of all feeding equipment, combined: $___________________
8. Purchase price of all watering equipment, combined: $___________________
9. Purchase price of all video equipment, combined: $___________________
10. Annual cost of rental equipment: $____________________
11. Purchase price of dart gun/sedation equipment: $___________________
12. Purchase price of cooler/freezer equipment: $__________________
13. Purchase price of other equipment: $_____________________
IV. Supplies
1. Annual amount of protein feed purchased: _________ (tons) 1a. Protein feed unit price: $________________ (per bag/ton)
2. Annual amount of corn purchased: _______________ (tons) 2a. Corn unit price: $______________ (per bag/ton)
3. Annual cost of operating supplies for lodge: $________________________
4. Annual cost of food and beverages for lodge: $_________________________
V. Labor
1. Number of employees: 1a. Salary: __________ 1b. Hourly: __________
2. Total wages paid: 2a. Salaries: $________________ 2b. Hourly: $_________________
3. Annual expense from outsourced services: $____________________
Hunting, continued
VI. Utilities
1. Annual cost of utilities: $_______________
2. Annual cost of fuel: $__________________
VII. Miscellaneous Expenses
1. Annual insurance expense: $_________________
2. Annual advertising/marketing expense (includes taxidermy services): $_________________
3. Annual travel expenses: $__________________
4. Annual property tax: $_________________
5. Other annual miscellaneous expenses: $_______________
VIII. Hunters
1. Annual number of hunters: ______________
2. Total annual deer harvest: ______________
3. Approximate total number of deer in hunting area: ________________
3a. Approximate percentage of total deer in the hunting area that are from breeding: _____________
4. Annual number of stocker bucks released from breeding operation into hunting operation: _____________
5. Annual number of does released from breeding operation into hunting operation: _____________
6. Annual number of stocker bucks purchased for release into hunting operation: ______________
6a. Total expense: $__________________
7. Annual number of does purchased for release: ______________
7a. Total expense: $__________________
8. Annual number of does harvested: _______________
8a. Total receipts from doe hunts: $________________
9. Annual number of management bucks harvested: ________________
9a. Total receipts from management buck hunts: $_________________
10. Annual number of trophy bucks harvested: ______________
10a. Total receipts from trophy buck hunts: $_______________
11. Average processing cost: $_______________ (per deer)
12. Approximate percentage of harvested bucks seeking taxidermy services: ______________%
13. Average taxidermy cost: $___________________ (per deer)
Appendix B: Economic Impact Survey
19
AP
PEN
DIX
Economic Impact Survey Texas Deer Association Members
**All information collected in this survey will remain confidential**
Survey Instructions
1. This survey is to be completed by scientific breeding operations, combination scientific breeding and hunting operations, and hunting operations that utilize outside scientific breeding operations as a genetic supplement for their deer herd. All other industry participants may disregard this survey.
2. For the sections and categories below, please provide annualized 2005 records of actual or accurate estimates of expenditures rather than a range estimate of expenditures.
3. For those who have multiple facilities under separate permits (uniquely identified), please contact us for additional surveys for each operation.
4. It is important to separate records for each facility, and between hunting and breeding operations. Contact us for additional surveys if you have multiple permitted breeding and/or hunting operations.
5. It is also important to use the provided categories for records for each section, rather than combining records from breeding and hunting operations and submitting that in a breeding or hunting category. Please provide an accurate estimate when your records do not match these categories.
6. If a question does not apply to your operation, please indicate this with an “N/A” response. 7. Please indicate units (lbs, tons, gals, etc.) where applicable. 8. For further explanation of general and selected lines of the survey, please refer to the information below.
Scientific Breeding
I. Operation: Area of breeding operation refers to the total acreage dedicated to your breeding operation. Purchasevalue refers to the cost per acre for the initial purchase of the land.
II. Herd Inventory: This category refers to your herd inventory, fawning rate, purchases and sales towards your inventory for 2005, and number the of fawns born and fawning rate for 2006. Annual herd mortality rate refers to the annual mortality loss on the total breeding herd, including loss of fawns after weaning. Fawning rate refers to the number of surviving fawns born per doe, specifically, the total number of live fawns at weaning divided by the total number of bred does (i.e. 0.7, 1.5, 2.3, etc.).
III. Facilities: Area of pens refers to the total acreage enclosed by all pens combined. Capital cost refers to the overall cost of construction for each of the items listed, including clearing, foundation, electrical, plumbing, etc. Capital cost of improvements refers to land clearing, roads, forage, water (well drilling, ponds), etc. Annual cost of maintenance and repair refers to all maintenance and repair for facilities, equipment, fencing, roads, etc.
IV. Equipment: Purchase price refers to the original cost of the equipment at purchase, not an annualized loan payment. Large equipment refers to tractors, bobcats, dozers, etc., used in your breeding operation. Please combine all applicable equipment into one figure for lines 1-9.
V. Veterinary & Supplies: Annual cost of operating supplies refers to the yearly expense for all operating supplies, such as office supplies, sedation supplies, AI supplies, etc. Annual cost of medical supplies refers to the yearly expense for medicine, syringes, etc. Annual number of sedations refers to the average annual number of sedations on a per doe/buck basis. Average cost per sedation refers to the average expense of supplies and labor to sedate or dart a deer. Number of necropsies performed refers to the number of post mortality veterinary examinations performed to determine the cause of death. Average cost per necropsy refers to the average labor and labwork expense of performing a necropsy on a single deer. Average cost per CWD test refers to the average labor and labwork expense of performing a CWD test.
VI. Labor: This category refers to the labor expense for your breeding operation. Owners, spouses, and children must be accounted for in this category as an employee(s) and in total wages, if labor is performed by these individuals. Totalwages paid refers to annual wages for all employees. Owner/operators must include amount allotted or withdrawn for family living for line 2a. Annual expense from outsourced services refers to all additional contracted labor from those not on the payroll, including consulting services, accounting services, legal services, herd survey services, etc.
VII. Utilities: This category refers to the annual utilities expense for the annual electric, phone, water, sewage, refuse disposal, etc., and the annual fuel expense for breeding operations.
VIII. Miscellaneous Expenses: Annual insurance expense refers to the yearly cost of auto, property, liability, health, etc. insurance. Annual advertising/marketing expense refers to the annual cost of advertising and marketing materials, which includes taxidermy services for genetic display (horn molds or shed mounts, or deceased buck mounts). Annual travel expense refers to the annual cost of travel, such as fuel, food, lodging, airfare, etc.
IX. Feeding: This category relates to feeding rates for fawns, bucks, and does. For those who bottle feed fawns, please indicate the percent of all fawns that are bottle fed, number of days of bottle feeding until weaning, the product used (i.e. goat milk, milk replacer, etc.), units of this product used per fawn until weaning, the per unit product price (please indicateunits-gal, bags, lbs).
HuntingI. Operation: Area of hunting operation refers to the total acreage dedicated to your hunting operation. Purchase valuerefers to the cost per acre for the initial purchase of the land.
II. Facilities: Capital cost refers to the overall cost of construction for each of the items listed, including clearing, foundation, electrical, plumbing, etc. Capital cost of improvements refers to land clearing, roads, forage, water (well drilling, ponds), etc. Annual cost of maintenance and repair refers to all maintenance and repair for facilities, equipment, fencing, roads, etc.
III. Equipment: Purchase price refers to the original cost of the equipment at purchase, not an annualized loan payment. Large equipment refers to tractors, bobcats, dozers, etc., used in your breeding operation. Please combine all applicable equipment into one figure for lines 1-9.
IV. Supplies: This category relates to supplemental feed, corn, operating, food, and beverage supplies for hunting operations on an annualized basis.
V. Labor: This category refers to the labor expense for your breeding operation. Owners, spouses, and children must be accounted for in this category as an employee(s) and in total wages, if labor is performed by these individuals. Totalwages paid refers to annual wages for all employees. Owner/operators must include amount allotted or withdrawn for family living for line 2a. Annual expense for outsourced services refers to all additional contracted labor from those not on the payroll, including consulting services, accounting services, legal services, herd survey services, etc.
VI. Utilities: This category refers to the annual utilities expense for the annual electric, phone, water, sewage, refuse disposal, etc., and the annual fuel expense for hunting operations.
VII. Miscellaneous Expenses: Annual insurance expense refers to the yearly cost of auto, property, liability, health, etc. insurance. Annual advertising/marketing expense refers to the annual cost of advertising and marketing materials, which includes taxidermy services for display. Annual travel expense refers to the annual cost of travel, such as fuel, food, lodging, airfare, etc.
VIII. Hunters: This category relates to the annual number of hunters, number of deer harvested, number of deer purchased and/or released into hunting operation, and the expenses and receipts from hunting. Total expense in lines 6a & 7a refer to the cost of purchasing, sedating, and transporting deer for release into hunting operation. Average processing cost refers to the cost of processing each harvested deer. If it is processed in-house, please provide an accurate estimate of this cost from based on local processor costs. Line 12 relates to the percentage of harvested deer that will have some type of taxidermy service performed, such as a shoulder or full body mount. Line 13 allows for the average per deer expense of this service for the hunter.
We thank you in advance for taking the time to complete this survey. Upon completion, please return the survey with the enclosed envelope no later than November 10th. Questions or requests for additional surveys may also be directed to Brian Frosch at 888-890-5663.
20