Embed Size (px)
Citation preview
Economic Impact of the University of Suffolk 2017/18
A report to
June 2019
BiGGAR Economics Pentlands Science Park Bush Loan, Penicuik Midlothian, EH26 0PZ, Scotland +44 (0)131 514 0850 [email protected] www.biggareconomics.co.uk
CONTENTS Page
1 EXECUTIVE SUMMARY ........................................................................................1
2 INTRODUCTION AND APPROACH .....................................................................6
3 EDUCATION IN SUFFOLK .................................................................................15
4 CORE IMPACTS .................................................................................................19
5 RAISING ATTAINMENT .....................................................................................24
6 STUDENT IMPACTS ...........................................................................................35
7 IMPACTS AFTER UNIVERSITY ...........................................................................41
8 SUPPORT FOR THE PUBLIC SECTOR ................................................................48
9 SUPPORT FOR INDUSTRY .................................................................................53
10 SUPPORT FOR TOWN/CULTURE ....................................................................64
11 SUMMARY OF IMPACTS .................................................................................72
12 APPENDIX A: ABBREVIATIONS AND TERMS ..................................................77
1
1 EXECUTIVE SUMMARY
This report presents the findings of an economic impact study of the University of Suffolk for the 2017/18 academic year. The institution was established in 2007 as University Campus Suffolk (UCS) and became the University of Suffolk after receiving University Title in 2016. The first cohort of students were admitted to the new University of Suffolk in September 2016, therefore 2017/18 was the second full academic year for the University of Suffolk.
The University’s central purpose is to encourage wider participation in higher education across the region, helping to reverse the net export of graduates and the low post-16 participation rate which has adversely affected Suffolk for many years.
1.1 Key Quantifiable Impacts
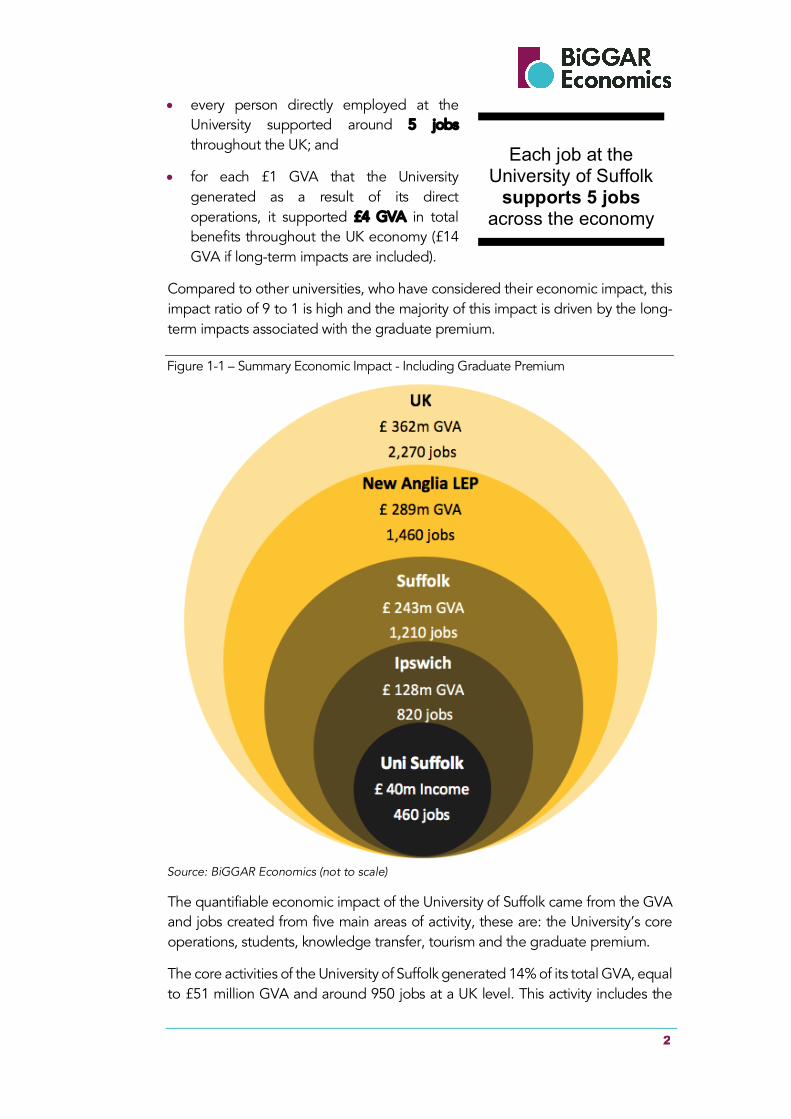
In the academic year 2017/18 the University of Suffolk generated £103 million Gross Value Added (GVA) and supported 2,270 jobs across the UK. Of this:
• £41 million GVA and 820 jobs were in Ipswich;
• £56 million GVA and 1,210 jobs were in Suffolk (including Ipswich); and
• £67 million GVA and 1,460 jobs were in the New Anglia LEP area (including Suffolk).
There will also be significant long-term economic impacts that are realised by the graduates of the University of Suffolk from the class of 2017/18 over the course of their working lives. When these are included, the University of Suffolk generated £362 million Gross Value Added (GVA) and supported 2,270 jobs across the UK. Of this:
• £128 million GVA and 820 jobs were in Ipswich;
• £243 million GVA and 1,210 jobs were in Suffolk (including Ipswich); and
• £289 million GVA and 1,460 jobs were in the New Anglia LEP area (including Suffolk).
This is a substantial economic impact considering the scale of the University of Suffolk. In 2017/18, the University of Suffolk had a total income of £40.2 million and employed 460 members of staff. This implies that:
• for each £1 income that the University received it generated £3 in economic impact (£9 if long-term impacts are included);
2
• every person directly employed at the University supported around 5 jobs throughout the UK; and
• for each £1 GVA that the University generated as a result of its direct operations, it supported £4 GVA in total benefits throughout the UK economy (£14 GVA if long-term impacts are included).
Compared to other universities, who have considered their economic impact, this impact ratio of 9 to 1 is high and the majority of this impact is driven by the long-term impacts associated with the graduate premium.
Figure 1-1 – Summary Economic Impact - Including Graduate Premium
Source: BiGGAR Economics (not to scale)
The quantifiable economic impact of the University of Suffolk came from the GVA and jobs created from five main areas of activity, these are: the University’s core operations, students, knowledge transfer, tourism and the graduate premium.
The core activities of the University of Suffolk generated 14% of its total GVA, equal to £51 million GVA and around 950 jobs at a UK level. This activity includes the
Each job at the
University of Suffolk supports 5 jobs
across the economy
3
direct impact of the University, the staff it employs and their spending, and expenditure within the University’s supply chain.
The University of Suffolk’s 4,530 full-time students contributed 13% of its total impact, which is equal to £48.7 million GVA and 1,260 jobs in the UK. This impact is created through student spending, students working part-time while studying and student volunteering.
As well as offering degree courses in tourism, the University of Suffolk also contributed to the tourism economy of the UK by attracting visitors to open days, conferences, events and visits to friends and relatives. This impact is relatively modest at around £0.5 million GVA and around 20 jobs at the UK level.
Graduates are typically more productive in their line of work and those from the University of Suffolk are no exception. The University of Suffolk has a large number of graduates each year relative to its income. This is due to its focus on education, the mix of courses it offers and the way in which they are delivered (including off-site in schools and healthcare settings). As a result, the long-term impacts from learning associated with the University generated 72% of the total impact, equal to £258.8 million GVA. This relates to the premium associated with increased productivity as a result of graduating from the University of Suffolk and accrues over the graduates’ working lifetimes. This impact is new to the economy as it did not exist before the University of Suffolk was established. It is also likely to underestimate the full impact as this study does not attempt to estimate the increased profitability and taxation that is associated with the contribution of graduates.
1.2 Wider Impact
The full impact of the University of Suffolk extends beyond its quantifiable economic contributions. It has stimulated a wider educational, social, economic
and cultural transformation which has had a significant impact on the local economy and the local population. These wider, non-quantifiable impacts include:
• the catalytic impact created by regenerating a key site on the Ipswich Waterfront. This has fundamentally regenerated the area, making it a more vibrant and attractive place in which to live, work, visit and invest;
• creating a new facility for higher education where none had previously existed;
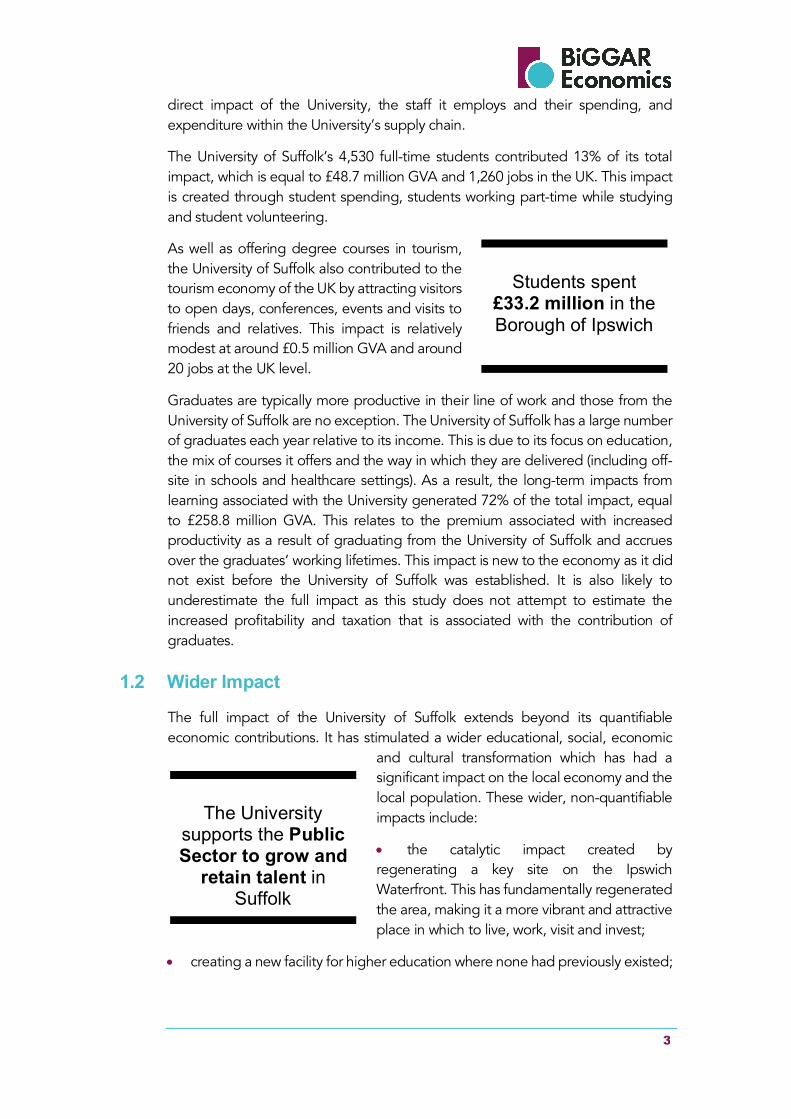
Students spent
£33.2 million in the Borough of Ipswich
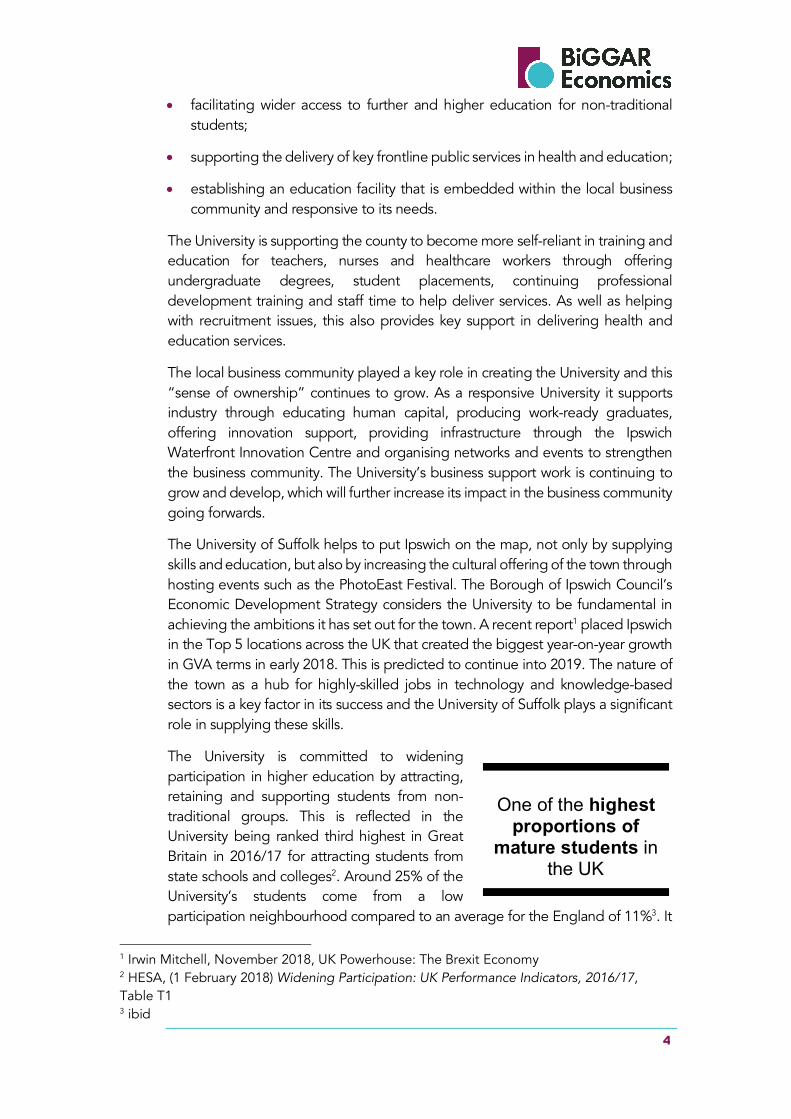
The University
supports the Public Sector to grow and
retain talent in Suffolk
4
• facilitating wider access to further and higher education for non-traditional students;
• supporting the delivery of key frontline public services in health and education;
• establishing an education facility that is embedded within the local business community and responsive to its needs.
The University is supporting the county to become more self-reliant in training and education for teachers, nurses and healthcare workers through offering undergraduate degrees, student placements, continuing professional development training and staff time to help deliver services. As well as helping with recruitment issues, this also provides key support in delivering health and education services.
The local business community played a key role in creating the University and this “sense of ownership” continues to grow. As a responsive University it supports industry through educating human capital, producing work-ready graduates, offering innovation support, providing infrastructure through the Ipswich Waterfront Innovation Centre and organising networks and events to strengthen the business community. The University’s business support work is continuing to grow and develop, which will further increase its impact in the business community going forwards.
The University of Suffolk helps to put Ipswich on the map, not only by supplying skills and education, but also by increasing the cultural offering of the town through hosting events such as the PhotoEast Festival. The Borough of Ipswich Council’s Economic Development Strategy considers the University to be fundamental in achieving the ambitions it has set out for the town. A recent report1 placed Ipswich in the Top 5 locations across the UK that created the biggest year-on-year growth in GVA terms in early 2018. This is predicted to continue into 2019. The nature of the town as a hub for highly-skilled jobs in technology and knowledge-based sectors is a key factor in its success and the University of Suffolk plays a significant role in supplying these skills.
The University is committed to widening participation in higher education by attracting, retaining and supporting students from non-traditional groups. This is reflected in the University being ranked third highest in Great Britain in 2016/17 for attracting students from state schools and colleges2. Around 25% of the University’s students come from a low participation neighbourhood compared to an average for the England of 11%3. It
1 Irwin Mitchell, November 2018, UK Powerhouse: The Brexit Economy 2 HESA, (1 February 2018) Widening Participation: UK Performance Indicators, 2016/17, Table T1 3 ibid
One of the highest
proportions of mature students in
the UK
5
is also attracting a significant proportion of mature students from low participation areas and its targeted work with local schools is also producing successful results in terms of raising aspirations among young people who are then encouraged to enter higher education on leaving school.
Both the quantifiable and the wider, non-quantifiable, impacts of the University are equally valid and it is important to consider both aspects when reflecting on the total economic contribution made by the University.
1.3 Growth in the Future
The University of Suffolk is a young institution that has ambitions to grow in the future, both in terms of its size and in the scope of its activity. This growth will increase its economic impact. In particular, as the University increases the range of services that it offers to business, and conducts more contract and collaborative research, the economic impact that it will have on these businesses and the wider economy will also grow. It is also contributing a significant social impact on
public services through the work of the Suffolk Institute for Social and Economic Research and its applied social research programme. This is helping to inform and deliver key public services across the region and reinforcing the University of Suffolk's position as a key driver of informed development across the economy.
The impacts that the University of Suffolk will create in the future are likely to be greater and broader than they are currently, as it complements its current teaching focus with additional research activity and income.
Expected growth in Research Activity and Services to
Business will increase economic impact
6
2 INTRODUCTION AND APPROACH
This report presents the findings of an economic impact study of the University of Suffolk for the 2017/18 academic year. The research and analysis for this assignment was commissioned by the University of Suffolk and undertaken by BiGGAR Economics.
2.1 University of Suffolk
The institution was established in 2007 as University Campus Suffolk (UCS) with degrees validated by the University of East Anglia and the University of Essex. It was awarded Taught Degree Awarding Powers (TDAP) in 2015 and Higher Education Funding Council for England (HEFCE) designation and University Title in 2016. UCS became the University of Suffolk in August 2016, with the first cohort of students admitted in September 2016.
The University of Suffolk aims to attract students from Suffolk and beyond, helping to reverse the net export of graduates and the low post-16 participation rate which has adversely affected Suffolk for many years.
Widening participation continues to be the central aim of the University of Suffolk, and this is reflected in the profile of its student population with relatively large proportions of part-time students, mature (over 21) students and also students from ethnic minority backgrounds. The University has a series of targets in place for further widening student access, encouraging the successful completion of studies and for positive progression beyond university.
In 2017/18 it had 5,830 full-time and part-time students, employed 460 members of staff and had an income of £40.2 million.
Academic teaching at the University is based around six academic Schools which work inclusively across the three Partner Colleges which are Suffolk New College, West Suffolk College and East Coast College. The six Schools are:
• School of Art, Design and Humanities;
• School of Health Sciences;
• School of Law and Social Sciences;
• School of Psychology and Education;
• Suffolk Business School;
• School of Science, Technology and Engineering.
7
2.2 Baseline Year and Study Areas
In the main, the economic contributions described in this report are for 2017/18, which is the latest full academic year for which published data on income, staff and students was available from the University at the time of writing.
This study considers the economic contribution that the University of Suffolk makes to:
• Ipswich (defined as the Borough of Ipswich);
• Suffolk (defined as the county of Suffolk);
• New Anglia Local Enterprise Partnership area (New Anglia LEP);
• the UK.
Throughout the report, the impact data for each area is presented in an inclusive format, i.e. the impact in Suffolk includes the impact in Ipswich, the impact in the New Anglia LEP area includes the impact in both Suffolk and Ipswich and the impact in the UK includes the impact in Ipswich, Suffolk and also the New Anglia LEP.
2.3 Framework and Approach
2.3.1 Framework
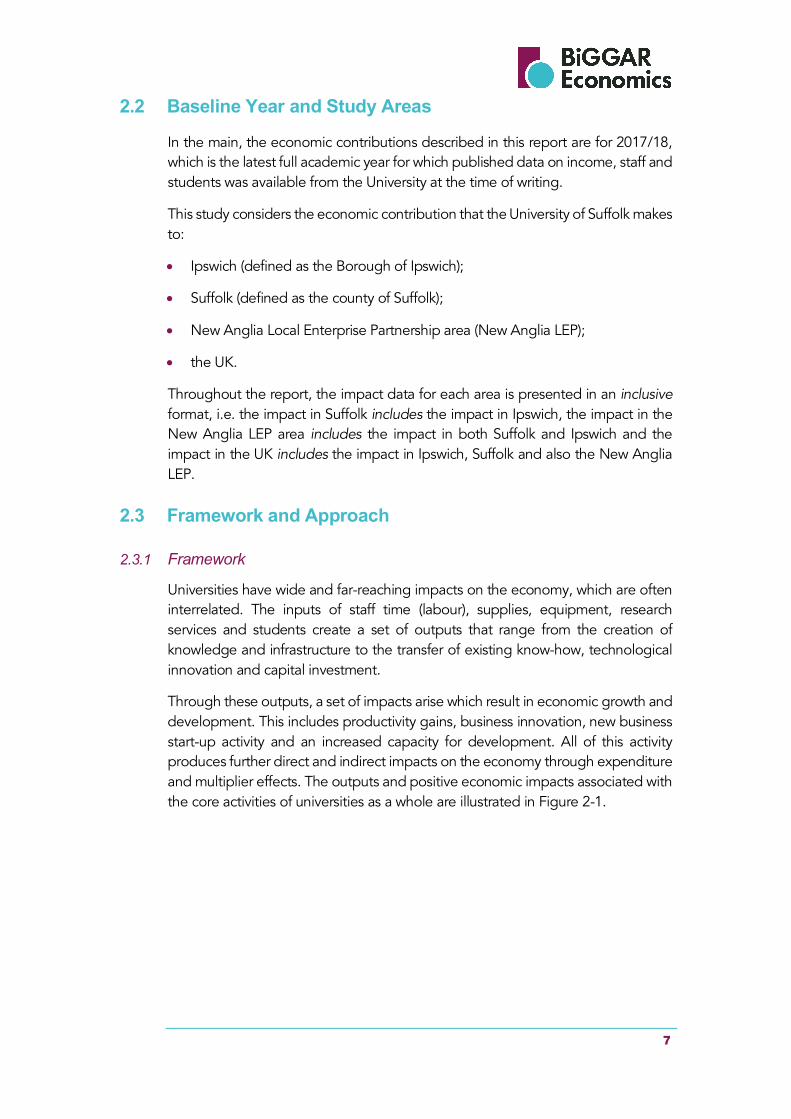
Universities have wide and far-reaching impacts on the economy, which are often interrelated. The inputs of staff time (labour), supplies, equipment, research services and students create a set of outputs that range from the creation of knowledge and infrastructure to the transfer of existing know-how, technological innovation and capital investment.
Through these outputs, a set of impacts arise which result in economic growth and development. This includes productivity gains, business innovation, new business start-up activity and an increased capacity for development. All of this activity produces further direct and indirect impacts on the economy through expenditure and multiplier effects. The outputs and positive economic impacts associated with the core activities of universities as a whole are illustrated in Figure 2-1.
8
Figure 2-1 – University Outputs and Expected Economic Impacts
Source: Goldstein and Renault (2004), Contribution of Universities to Regional Economic Development: A Quasi-Experimental Approach.
2.3.2 Universities and Economic Growth
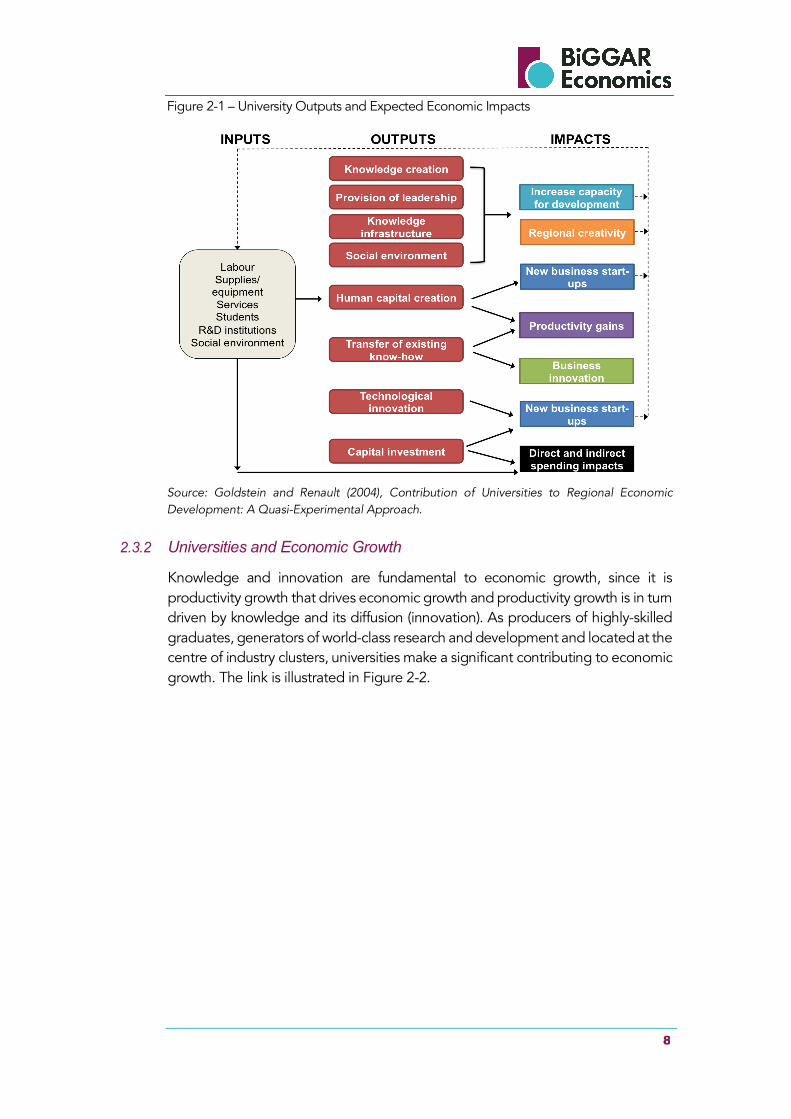
Knowledge and innovation are fundamental to economic growth, since it is productivity growth that drives economic growth and productivity growth is in turn driven by knowledge and its diffusion (innovation). As producers of highly-skilled graduates, generators of world-class research and development and located at the centre of industry clusters, universities make a significant contributing to economic growth. The link is illustrated in Figure 2-2.
9
Figure 2-2 – Universities and Economic Growth
Source: BiGGAR Economics
Universities also create an impact on their local environment as their staff and students contribute to the overall vibrancy of the cities and towns in which they are located and this wider role in underpinning the economy is something that should not be overlooked.
They provide a space for discussion and create connections between academia, students and companies that would not otherwise exist and therefore foster an environment for innovation. This creates clusters of people, which lead to the creation of an education ecosystems which, in turn, draws in more people.
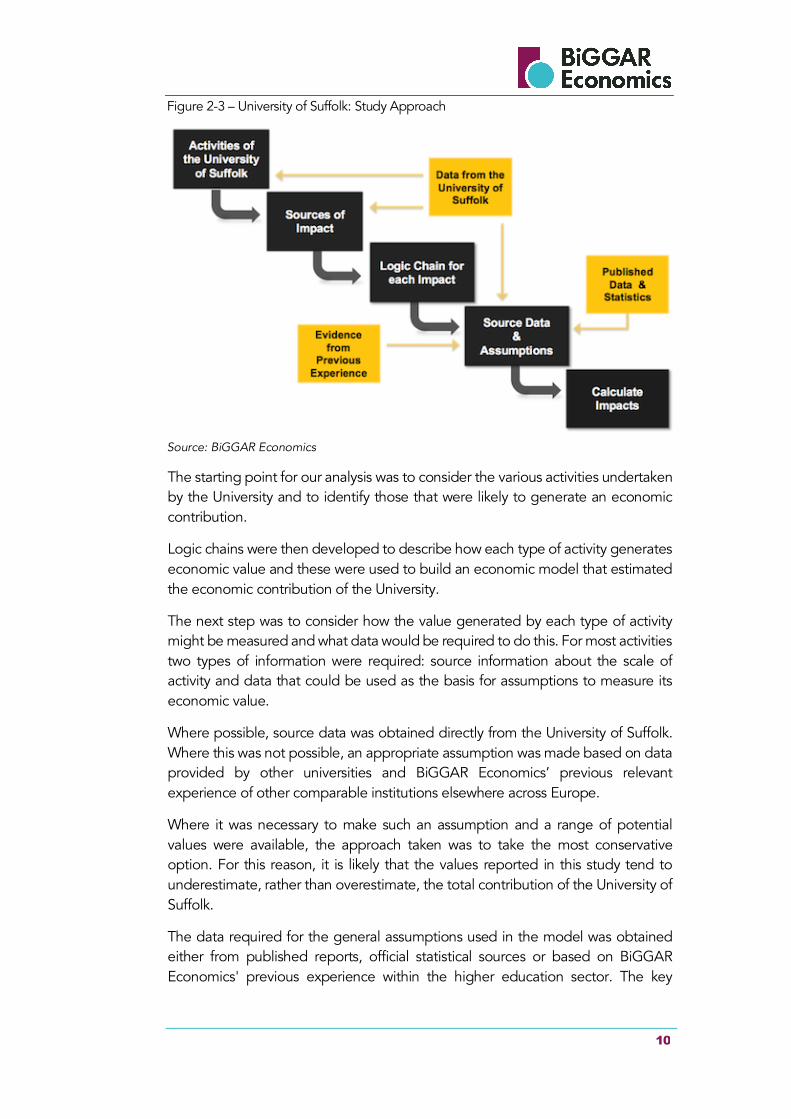
2.3.3 Approach
The overarching objective of this research is to illustrate the scale and breadth of the economic contribution made by the University of Suffolk. The different steps involved in this process are illustrated in Figure 2-3.
10
Figure 2-3 – University of Suffolk: Study Approach
Source: BiGGAR Economics
The starting point for our analysis was to consider the various activities undertaken by the University and to identify those that were likely to generate an economic contribution.
Logic chains were then developed to describe how each type of activity generates economic value and these were used to build an economic model that estimated the economic contribution of the University.
The next step was to consider how the value generated by each type of activity might be measured and what data would be required to do this. For most activities two types of information were required: source information about the scale of activity and data that could be used as the basis for assumptions to measure its economic value.
Where possible, source data was obtained directly from the University of Suffolk. Where this was not possible, an appropriate assumption was made based on data provided by other universities and BiGGAR Economics’ previous relevant experience of other comparable institutions elsewhere across Europe.
Where it was necessary to make such an assumption and a range of potential values were available, the approach taken was to take the most conservative option. For this reason, it is likely that the values reported in this study tend to underestimate, rather than overestimate, the total contribution of the University of Suffolk.
The data required for the general assumptions used in the model was obtained either from published reports, official statistical sources or based on BiGGAR Economics' previous experience within the higher education sector. The key
11
statistical sources used were the UK’s Input-Output Tables, 2014 (multipliers calculated were Leontief Type 1 and Type 2).
This data was then used to populate the economic model and estimate the value of each source of contribution for the University. These were then aggregated in order to produce an overall estimate of the total contribution of the University of Suffolk.
2.3.4 Metrics of Quantitative Analysis
As far as possible this report has attempted to express the economic value generated by the University of Suffolk using two widely accepted measures of economic contribution: jobs and gross value added (GVA).
• Gross Value Added (GVA) is a measure of the value that an organisation, company or industry adds to the economy through its operations. The report used the production approach to measuring this contribution, where the GVA is equal to the value of production less the value of the inputs used. Typically, this is estimated by subtracting the non-labour costs of the organisation from the organisation’s total revenue. In the case of the University of Suffolk, this is estimated by subtracting the non-staff operational expenditure (£14.4 million) from the total income of the University (£40.2 million);
• employment (jobs) is measured in terms of headcount jobs supported unless stated otherwise. Employment figures have been rounded to the nearest 10 jobs unless otherwise stated.
In addition, each area of impact requires the use of three types of economic assumptions:
• turnover to GVA ratio – this is used to estimate the direct GVA impact of spend in an area and is obtained from the Annual Business Survey;4
• turnover per employee – this is used to estimate the direct employment impact of the spend in each of the study areas. This is obtained from the UK Annual Business Survey;
• GVA and employment multipliers – these are used to estimate the indirect impacts (arising from spending in the supply chain) and induced impacts (as a result of staff spending). These multipliers have been based on the UK’s Input-Output tables5, published by the ONS in 2014. These multipliers have been adapted to each of the study areas to reflect the comparative size of the economy in that area.
One of the reasons that these measures are so widely used is because they provide a convenient way of capturing the entire economic contribution of an organisation in a single number. While the appeal of such measures is easy to understand they
4 ONS (2017), UK Annual Business Survey 2016 Revised Results 5 ONS (2018), Input-Output Tables 2014
12
do have parameters which should be kept in mind. For this reason, this assessment also highlights various examples of the wider, qualitative contributions that the University generates for the local, regional and UK economy.
Throughout the analysis, adjustments have been made to calculations where necessary to avoid double counting.
2.4 Economic Contribution and the Counterfactual
The question that arises from any study of economic contribution or impact that considers the outputs and impacts delivered by a given set of resources and inputs is what the counterfactual position could have been. That is, what outputs and contributions could have been achieved by using the same resources and inputs in a different way?
This study does not seek to directly compare the economic contribution of the University with that made by other organisations. Rather, the counterfactual position is to imagine an alternative situation where the University of Suffolk did not exist and where the activities that it undertakes did not take place.
In practical terms, the study has only included the economic contributions that are additional and attributable to the University of Suffolk. So, for example, the economic contribution of student part-time work has been included, but adjustments have been made to exclude employment that could have been taken by non-student employees.
2.5 Previous Uses of Method
The methodology followed in this study is one that has been in wide usage for at least 20 years. During that time, BiGGAR Economics has worked with more than 100 leading institutions and groups of institutions in the UK, Ireland and Europe, assessing historic, current and potential future economic contributions. The approach used in this report has been developed and informed by this experience.
In the last three years, examples of our economic impact work for Universities or University Consortia include the University of Surrey (2018), University of St Andrews (2018), CURIF Universities (2018), VU Brussels (2018), UC Louvain (2018), VLIR Universities (2017), UHasselt (2017), ETH Domain (2017), Solent Universities (2017), University of Edinburgh (2017), League of European Research Universities (2014 & 2017), Universities Estonia (2017), Finnish Universities (2017), Brunel University (2016), Durham University (2016), University of South Wales (2016) and the University of Oxford (2016).
Some examples of similar studies undertaken by other organisations include the University of Birmingham (Oxford Economics, April 2013), the University of British Columbia (2009, Planning and Institutional Research), the University of Iowa (September 2010, Tripp Umbach), the University of Notre Dame, Indiana
13
(September 2013, Appleseed). Also relevant is work by Universities Scotland6 on the contribution of the sector to economic growth and a study by UniversitiesUK that demonstrates the contribution made by the higher education sector to the UK economy7.
The approach used for the economic impact of universities is also consistent with Guidance issued by several governments and public-sector organisations. For example, the methodology is consistent with the principles set out in European Commission Guidance8 on major projects, which highlights the importance of assessing the fullest range of potential economic effects possible.
From this, BiGGAR Economics has established credibility with policy makers and sector organisations. Our impact studies have been used to demonstrate the value that universities have for stakeholders, policy makers and the public as well as being used in support of funding applications.
2.6 Parameters of the Study
While every attempt has been made to measure the economic contribution of the University of Suffolk as consistently and accurately as possible, there are certain parameters to the study that should be considered.
The report aims to quantify the economic contribution that the University of Suffolk makes using the two widely accepted economic measures of GVA and employment. However, using GVA and jobs as a basis for measuring economic contribution gives equal weight to all types of economic activity regardless of their wider value to society. This means that they cannot reflect the fact that some types of research activity are intrinsically more valuable than others. As well as this, it is not always possible to quantify all of the benefits of the University due to the lack of available data. It is important to note therefore that what can be counted is not always the most important and as such there will be significant unquantifiable economic contributions.
For example, there is a partnership working approach at the University of Suffolk that contributes very real benefits that cannot be measured in quantifiable terms.
In addition, through their work, the employees of the University of Suffolk generate a wide variety of benefits for the regional economy and wider society. They help to improve the productivity of the workforce by providing high-quality education and training and they aim to stimulate innovation within the business base through their business engagement activities. Good examples of this are internships, work
6 Universities Scotland (2013), Grow Export Attract Support: Universities’ contribution to Scotland’s economic growth (available at http://www.universities-scotland.ac.uk) 7 Viewforth Consulting Ltd (April 2014), The Impact of Universities on the UK Economy (available at http://www.universitiesuk.ac.uk/highereducation) 8 European Commission (July 2008), Guide to Cost Benefit Analysis of Investment Projects [in particular section 2.5 on Economic Analysis] (available at http://ec.europa.eu/regional_policy/sources/docgener/guides/cost/guide2008_en.pdf)
14
placements and knowledge transfer partnerships. This is an active aspect of the University’s work that is discussed in more detail in sections 8 and 9.
The University of Suffolk has also provided a major anchor for the extensive regeneration of Ipswich Waterfront and also makes important contributions to other, socially valuable outcomes, such as improving social cohesion, facilitating social mobility and encouraging greater civic engagement.
The value of these outcomes to the individuals affected and society as a whole simply cannot be quantified. It is therefore essential that the economic contribution of the University of Suffolk is understood as part of this wider context.
2.7 Report Structure
The remainder of this report is structured as follows:
• section three discusses educational attainment in Suffolk;
• section four presents the core impacts associated with the University;
• section five describes the measures the University is taking to raise educational attainment and aspirations in the region;
• section six covers the impacts associated with students at the University;
• section seven discusses the range of impacts that arise after graduating;
• section eight discusses the support provided by the University in the delivering public sector services;
• section nine describes the University’s work in supporting business and industry;
• section ten reviews the role of the University in regenerating the waterfront area of the town and reviving the cultural scene;
• section eleven summarises the total quantifiable impacts of the University;
• Appendix A contains a list of abbreviations that are commonly used throughout the report.
15
3 EDUCATION IN SUFFOLK
This section reflects on post-16 qualification levels in Ipswich and Suffolk compared with the UK average to set the context within which the University of Suffolk is operating.
3.1 Educational Attainment of the Population
The highest level of educational qualification attained by an individual is an important factor in determining what kind of work that they might do and the amount that they will be paid. Within a region or economy, the proportion of the population that hold different levels of educational qualification can determine the economic performance of the area and the capacity for growth and innovation.
The qualifications that can be awarded are categorised into 9 qualification levels, where a Level 1 qualification includes those equivalent to a grade D award at GCSE and a Level 9 qualification includes those equivalent to a PhD award. A and AS level qualifications are Level 3 qualifications. Therefore, to analyse the proportion of the population that have progressed into higher education beyond the age of 18, it is necessary to consider the proportion which has at least a Level 4 qualification or higher.
Before UCS was established in 2007, the proportion of the population in Suffolk that held a qualification at Level 4 or above was significantly lower than the national average (Table 3-1). In Suffolk in 2004, the proportion of 16 to 64-year-olds with a qualification at Level 4 or above was 24.0% compared to a UK average of 26.0%. For 25 to 29-year-olds, the equivalent proportion was 28.1% compared to a UK average of 36.9%.
More recent data for 2017 shows that there has been an increase in the proportion of the population in Suffolk with a qualification at Level 4 or above. However, the gap between attainment in the rest of the UK and in Suffolk still remains. While the proportion of the population aged 25-29 in Suffolk that held a qualification at Level 4 or above grew from 28.1% to 32.1% between 2004 and 2007, the equivalent proportion in the UK grew more significantly from 36.9% to 45.6%.
Several factors will have influenced this trend relating to historical and demographic change as well as educational performance. However, it highlights the continued need to encourage and support participation in post-18 education throughout the region in order to address this performance gap.
16
Table 3-1 – Population with a Qualification at Level 4 or Above
2004 2017 Growth (%)
Number % Number %
Ipswich
Aged 16-64 17,600 23.9 21,000 24.3 19.3
Aged 25-29 2,600 32.1 3,700 33.7 42.3
Suffolk
Aged 16-64 98,100 24.0 139,300 32.2 42.0
Aged 25-29 10,000 28.1 13,600 32.1 36.0
UK
Aged 16-64 9,685,400 26.0 15,769,500 38.4 62.8
Aged 25-29 1,355,300 36.9 2,065,900 45.6 52.4
Source: Office for National Statistics (2018). Annual Population Survey
3.2 Sub-regional Participation in Higher Education
A closer insight into young participation in higher education is shown through data provided by HEFCE. Two data sets are available relating to the change which occurred between 2005/06 and 2010/11 and again between 2009/10 and 2014/15. Due to boundary changes which occurred between these time periods it is not possible to fully compare performance at a local area level across the full-time period however, the data provides an overall impression of the different levels of participation between towns and rural areas across the region.
Figure 3-1 shows that between the academic years of 2005/6 and 2010/11, there was a significant variation in the geography of young participation in higher education across Suffolk. There were high participation rates among those in more rural locations to the north-east and south-west of Ipswich. Areas of lower participation were mainly located around the town of Lowestoft, within Ipswich and around the Forest Heath area in the north-west of the region.
17
Figure 3-1 – Participation in Higher Education by Young People, 2005/6 to 2010/11
Source: Higher Education Funding Council for England, 2017.
Figure 3-2 shows the pattern of participation rates more recently for the academic years between 2009/10 and 2014/15. Although some improvement can be seen, the indication is that participation in higher education by young people continues to be lower than average in certain areas around Lowestoft, Ipswich, the North-West of Bury St. Edmunds and in the Forest Heath area.
Figure 3-2 –Participation in Higher Education by Young People, 2009/10 to 2014/15
Source: Higher Education Funding Council for England, 2017.
18
The University of Suffolk was established to address these persistent issues. Through itself and its Partner Colleges, the University currently operates at five sites across the region, two of which are located in Ipswich, and one each in Lowestoft, Bury St. Edmunds and Great Yarmouth (Norfolk) which are in the centres of the lowest participation areas and therefore best placed to address the issue.
3.3 Conclusion
The profile of educational participation and attainment in Suffolk indicates that, overall, the area compares unfavorably with the UK average. Sub-regional data further indicate that the picture is complex with poorer levels of participation and attainment in towns across the region compared to more rural areas. This feature is the result of historic economic, social and demographic factors. More recent data suggest that the issue is persistent and has grown in significance over time.
This performance gap provides evidence of the continued need to deliver, support and extend the provision of higher education throughout the region to prevent further deterioration in performance and to move towards a more improved situation going forwards.
19
4 CORE IMPACTS
This section describes the core impacts generated by the daily operations of the University of Suffolk. The core impacts include:
• direct impact;
• supplier impact;
• staff spending impact;
• impact of capital spending.
4.1 Direct Impact
In 2017/18 the total income of the University of Suffolk was £40.2 million and £14.4 million was spent on supplies of goods and services. The majority of the income to the University was from tuition fees and other funding associated with teaching. Income from research grants and contracts accounted for 1% of total income.
Table 4-1 – Key Assumptions for the Direct Impact, 2017/18
Value
Income (£m) 40.2
Expenditure on goods and services (£m) 14.4 Source: University of Suffolk
The direct impact of any organisation is the value it adds to the economy and the number of jobs it supports. The direct GVA of the University was calculated by subtracting the expenditure on goods and services from the total income of the University. Therefore, it was estimated that the direct impact of the University was £25.9 million GVA.
The direct employment impact is the number of people directly employed by the University, in 2017/18 this figure was 460 employees.
Table 4-2 – Direct Impact, 2017/18
Value
GVA (£m) 29.5
Employment 460
Source: BiGGAR Economics Analysis
4.2 Supplier Spending Impact
The University of Suffolk has an impact on the wider economy through its purchases of goods and services, as this increases turnover and supports employment in the companies that supply the University.
20
In 2017/18, the University of Suffolk spent £14.4 million on goods and services in the UK and it works closely with the local authority in order to maximise the scale of local procurement.
Of the total expenditure of goods and services, £8 million was spent directly by the University and the remainder was spent as payments to Partner Colleges. In order to get a better understanding of the wider supply chain impact the Partner Colleges were considered an extension of the core activities of the University of Suffolk, rather than a supplier. Therefore, it has been assumed that the Partner Colleges spend this on a similar range of goods and services as the University.
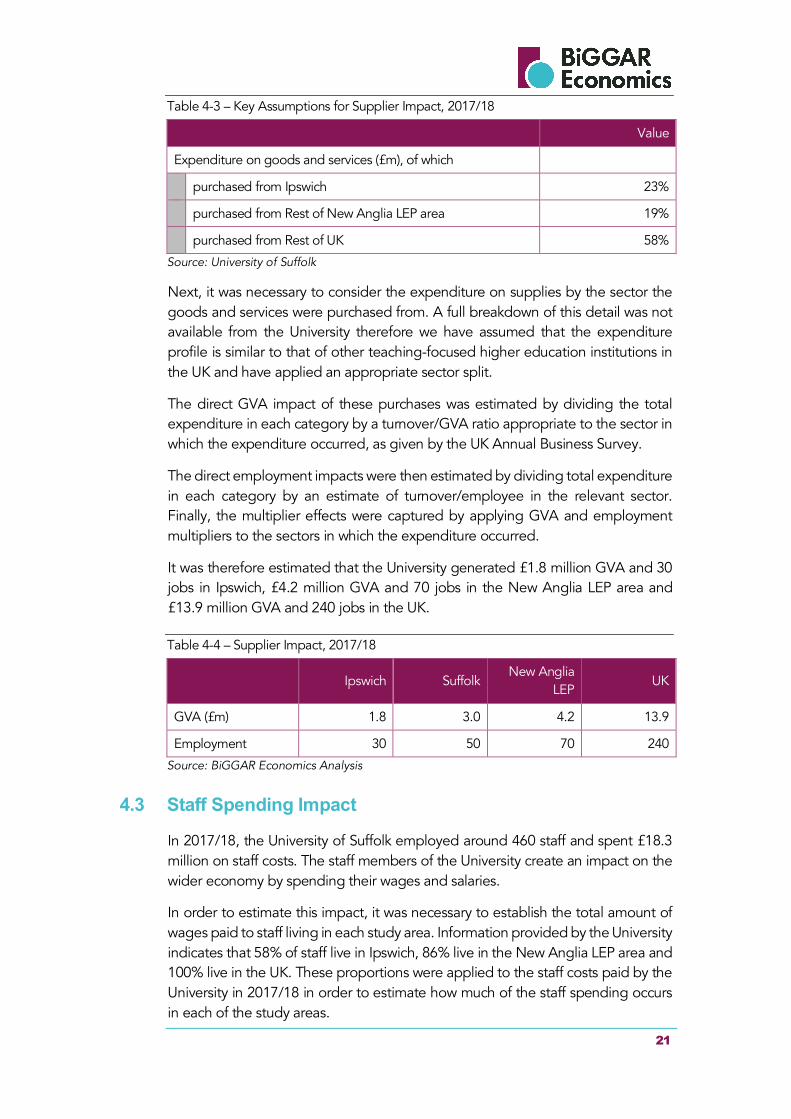
In order to estimate the impact this had, it was necessary to consider how much of the University’s expenditure occurs in each study area. Information provided by the University indicated that 23% of expenditure occurred in Ipswich, 42% occurred in the New Anglia LEP area and 100% occurred in the UK. The breakdown is shown in Table 4-3.
CASE STUDY – Local supply chain initiatives
The University of Suffolk is aware that as a major organisation, its procurement process represents a significant opportunity for local businesses. Therefore, in partnership with the local council and other public bodies, the University is a member of the Suffolk Growth Programme Board (SGPB) which is considering the value and impact of public sector procurement across Suffolk.
A report for the SGPB into the value and practice of public procurement found that over 50% of the supply chain of public bodies in Suffolk was procured in the local area. This is worth approximately £1 billion to the local economy. The University of Suffolk had one of the highest levels of local procurement of the group (when the Partner Colleges were considered an external supplier). However, the report also found that there were still barriers for local companies that impeded their ability to benefit from these opportunities and that there was potential for an even greater level of economic impact in Suffolk. The study acknowledged that while there had been initiatives, such as ‘Meet the Buyer’ events, there was still work to do to raise awareness of the opportunities available and improve access.
As a result of this study, the University of Suffolk has committed to addressing these barriers and supporting the development of the local supply chain.
21
Table 4-3 – Key Assumptions for Supplier Impact, 2017/18
Value
Expenditure on goods and services (£m), of which
purchased from Ipswich 23%
purchased from Rest of New Anglia LEP area 19%
purchased from Rest of UK 58%
Source: University of Suffolk
Next, it was necessary to consider the expenditure on supplies by the sector the goods and services were purchased from. A full breakdown of this detail was not available from the University therefore we have assumed that the expenditure profile is similar to that of other teaching-focused higher education institutions in the UK and have applied an appropriate sector split.
The direct GVA impact of these purchases was estimated by dividing the total expenditure in each category by a turnover/GVA ratio appropriate to the sector in which the expenditure occurred, as given by the UK Annual Business Survey.
The direct employment impacts were then estimated by dividing total expenditure in each category by an estimate of turnover/employee in the relevant sector. Finally, the multiplier effects were captured by applying GVA and employment multipliers to the sectors in which the expenditure occurred.
It was therefore estimated that the University generated £1.8 million GVA and 30 jobs in Ipswich, £4.2 million GVA and 70 jobs in the New Anglia LEP area and £13.9 million GVA and 240 jobs in the UK.
Table 4-4 – Supplier Impact, 2017/18
Ipswich Suffolk
New Anglia LEP
UK
GVA (£m) 1.8 3.0 4.2 13.9
Employment 30 50 70 240
Source: BiGGAR Economics Analysis
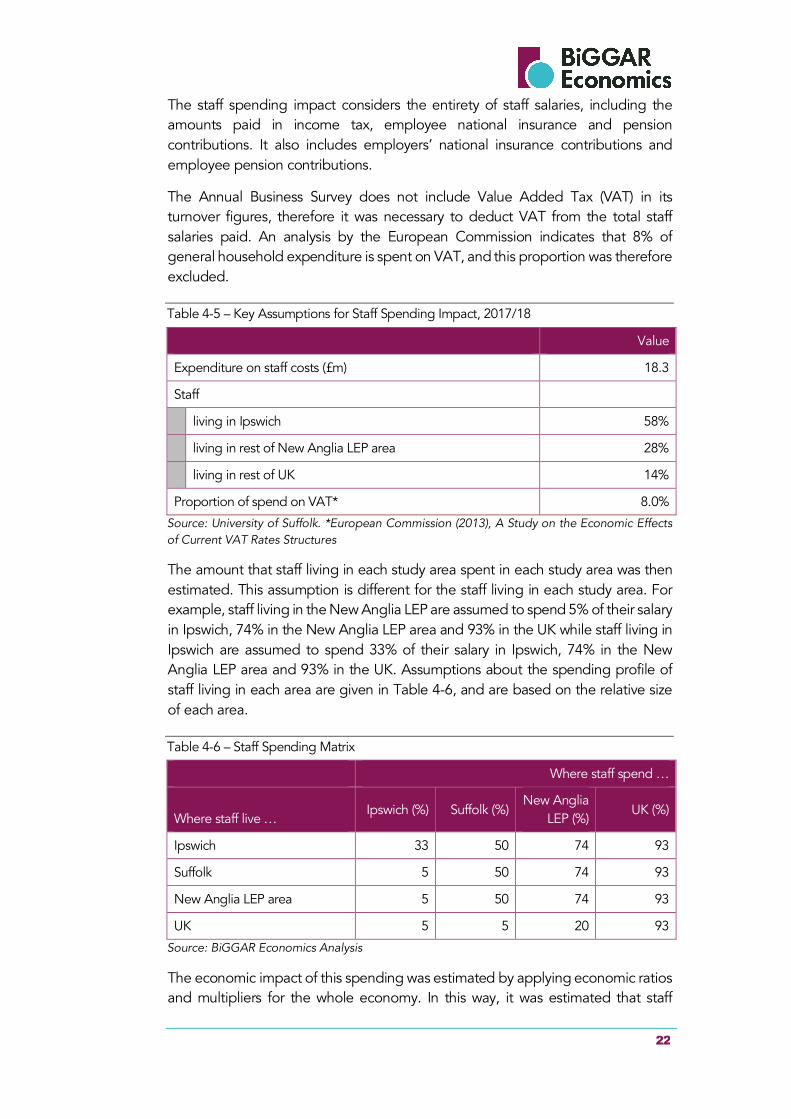
4.3 Staff Spending Impact
In 2017/18, the University of Suffolk employed around 460 staff and spent £18.3 million on staff costs. The staff members of the University create an impact on the wider economy by spending their wages and salaries.
In order to estimate this impact, it was necessary to establish the total amount of wages paid to staff living in each study area. Information provided by the University indicates that 58% of staff live in Ipswich, 86% live in the New Anglia LEP area and 100% live in the UK. These proportions were applied to the staff costs paid by the University in 2017/18 in order to estimate how much of the staff spending occurs in each of the study areas.
22
The staff spending impact considers the entirety of staff salaries, including the amounts paid in income tax, employee national insurance and pension contributions. It also includes employers’ national insurance contributions and employee pension contributions.
The Annual Business Survey does not include Value Added Tax (VAT) in its turnover figures, therefore it was necessary to deduct VAT from the total staff salaries paid. An analysis by the European Commission indicates that 8% of general household expenditure is spent on VAT, and this proportion was therefore excluded.
Table 4-5 – Key Assumptions for Staff Spending Impact, 2017/18
Value
Expenditure on staff costs (£m) 18.3
Staff
living in Ipswich 58%
living in rest of New Anglia LEP area 28%
living in rest of UK 14%
Proportion of spend on VAT* 8.0%
Source: University of Suffolk. *European Commission (2013), A Study on the Economic Effects of Current VAT Rates Structures
The amount that staff living in each study area spent in each study area was then estimated. This assumption is different for the staff living in each study area. For example, staff living in the New Anglia LEP are assumed to spend 5% of their salary in Ipswich, 74% in the New Anglia LEP area and 93% in the UK while staff living in Ipswich are assumed to spend 33% of their salary in Ipswich, 74% in the New Anglia LEP area and 93% in the UK. Assumptions about the spending profile of staff living in each area are given in Table 4-6, and are based on the relative size of each area.
Table 4-6 – Staff Spending Matrix
Where staff spend …
Where staff live … Ipswich (%) Suffolk (%)
New Anglia LEP (%)
UK (%)
Ipswich 33 50 74 93
Suffolk 5 50 74 93
New Anglia LEP area 5 50 74 93
UK 5 5 20 93
Source: BiGGAR Economics Analysis
The economic impact of this spending was estimated by applying economic ratios and multipliers for the whole economy. In this way, it was estimated that staff
23
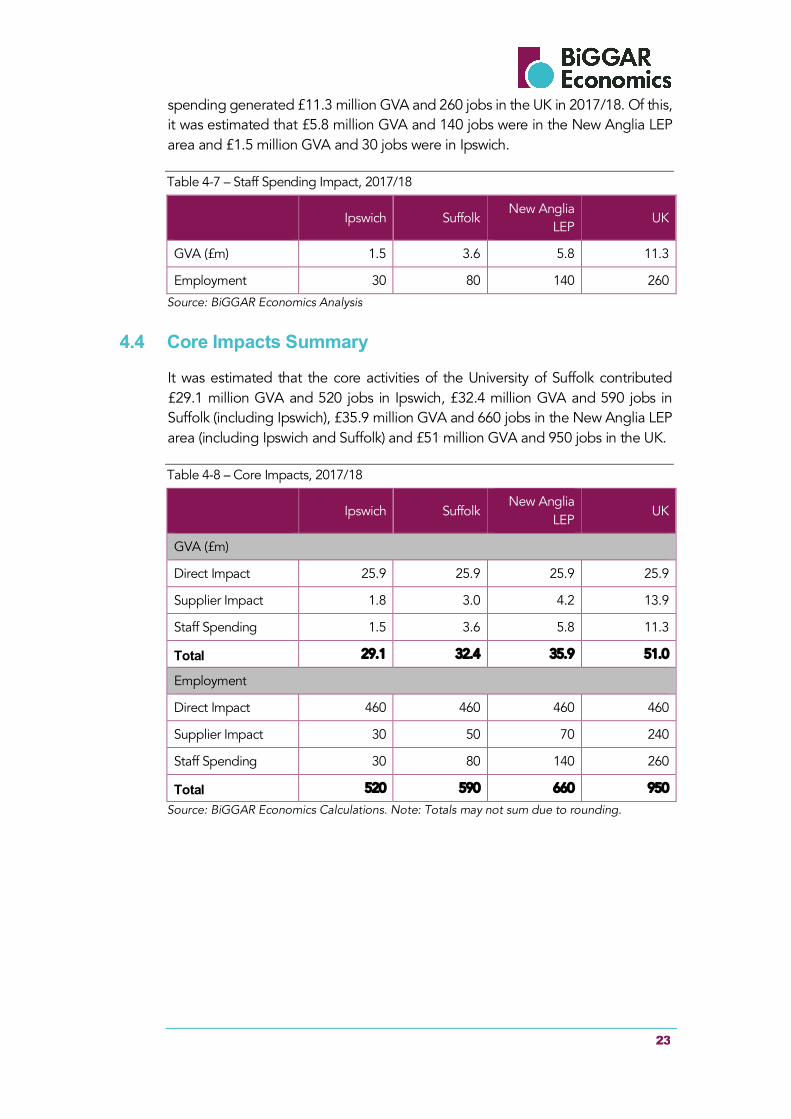
spending generated £11.3 million GVA and 260 jobs in the UK in 2017/18. Of this, it was estimated that £5.8 million GVA and 140 jobs were in the New Anglia LEP area and £1.5 million GVA and 30 jobs were in Ipswich.
Table 4-7 – Staff Spending Impact, 2017/18
Ipswich Suffolk
New Anglia LEP
UK
GVA (£m) 1.5 3.6 5.8 11.3
Employment 30 80 140 260
Source: BiGGAR Economics Analysis
4.4 Core Impacts Summary
It was estimated that the core activities of the University of Suffolk contributed £29.1 million GVA and 520 jobs in Ipswich, £32.4 million GVA and 590 jobs in Suffolk (including Ipswich), £35.9 million GVA and 660 jobs in the New Anglia LEP area (including Ipswich and Suffolk) and £51 million GVA and 950 jobs in the UK.
Table 4-8 – Core Impacts, 2017/18
Ipswich Suffolk
New Anglia LEP
UK
GVA (£m)
Direct Impact 25.9 25.9 25.9 25.9
Supplier Impact 1.8 3.0 4.2 13.9
Staff Spending 1.5 3.6 5.8 11.3
Total 29.1 32.4 35.9 51.0
Employment
Direct Impact 460 460 460 460
Supplier Impact 30 50 70 240
Staff Spending 30 80 140 260
Total 520 590 660 950
Source: BiGGAR Economics Calculations. Note: Totals may not sum due to rounding.
24
5 RAISING ATTAINMENT
This chapter considers the University’s role in addressing the issue of widening participation in further and higher education in Suffolk.
5.1 Background
For several decades, higher education performance in Suffolk has been adversely affected by the twin issues of a low post-16 participation rate and a net export of graduates from the area.
Within this context, the University of Suffolk aims to become a catalyst for widening access to education in the region and drawing in more students from non-traditional backgrounds. This has become its central mission. It became the University of Suffolk in August 2016, with the first cohort of students admitted in September 2016. As a result, the University is at a relatively early stage in its mission of turning around a situation which has evolved over many years.
HESA data provide early evidence to suggest that it is being successful in this mission, ranking in third position in England in 2016/17 for the proportion of students it attracts from low participation neighbourhoods9.
5.1.1 Student Profile
Widening participation is the central aim of the University of Suffolk, and this is reflected in the profile of its student population which is both diverse and inclusive. For example, data provided by the University show that10:
• 99% of 18-21-year olds at the University in 2015/16 came from a state school;
• around 61% are mature students (over 21);
• 55% are from an IP postcode;
• 28% are from low participation neighbourhoods;
• 26% of the student population are enrolled on part-time courses;
• 12% are from ethnic minority backgrounds (against a figure of 5% for the whole of Suffolk);
• 15% of students disclosed a disability;
• 6% of full-time undergraduate students are in receipt of the Disabled Students Allowance.
9 Higher Education Statistics Agency (HESA), 2016/17 10 University of Suffolk Access Agreement, 2018-19
25
5.1.2 Balancing Participation, Wider Access and Retention
The University has an excellent track record in admitting students from a range of backgrounds and it continues to work in this area to further attract specific groups of under-represented students. Outreach work is a key priority and will remain so going forwards.
Student Support is a key service at the University and it is especially important for its non-traditional student population. Data relating to retention, success and student progression indicates that there is a continued need for this service going forwards. The University has responded to the issue by developing a Progression Strategy which integrates its current and proposed activities relating to outreach, access, induction, attendance, retention, progression, student satisfaction and employability. This was put in place for 2017 entrants and rolled out thereafter with a view to ensuring that the learning and teaching delivered by the University supports the lives and multiple demands of its under-represented students.
In the 2018-19 academic year, the University planned to invest £2.25 million on measures to support access, student support, success and progression.
5.1.3 Participation in Further and Higher Education by School Leavers
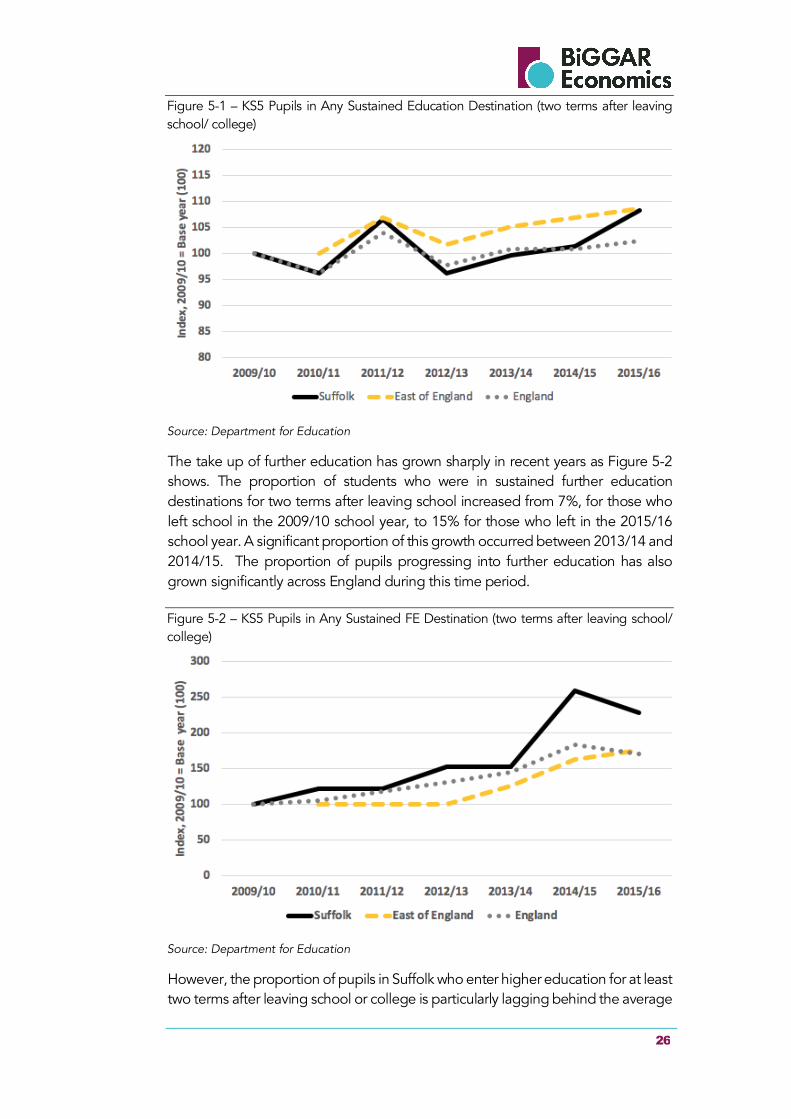
Data from the Department for Education show the extent and persistency of the issue of low participation in further and higher education in Suffolk. Figure 5-1 to Figure 5-3 show the change in proportion of KS5 (Key Stage 5) pupils from state-funded mainstream schools and colleges who are sustained in education destinations for at least two terms after leaving school or college.
Figure 5-1 shows the change in the proportion of pupils going to any sustained education destination (both further education and higher education) on the basis of an indices with the base year set at 2009/10. Suffolk has consistently underperformed against both the East of England and England as a whole in the years between 2009/10 and 2015/16. The rate of change in each area has been broadly similar, however data for Suffolk for the cohort of leavers in 2015/16 showed a significant increase in education destinations compared to England as a whole and a key reason for this could be that this was the first year in which the University of Suffolk was operational as a university.
Across the East of England and in Suffolk, 63% of pupils who left school in 2015/16 were in a sustained education destination two terms after leaving school compared to 66% of school leavers in England as a whole. The data for this year indicates that the gap in performance is beginning to close with the launch of the University of Suffolk.
26
Figure 5-1 – KS5 Pupils in Any Sustained Education Destination (two terms after leaving school/ college)
Source: Department for Education
The take up of further education has grown sharply in recent years as Figure 5-2 shows. The proportion of students who were in sustained further education destinations for two terms after leaving school increased from 7%, for those who left school in the 2009/10 school year, to 15% for those who left in the 2015/16 school year. A significant proportion of this growth occurred between 2013/14 and 2014/15. The proportion of pupils progressing into further education has also grown significantly across England during this time period.
Figure 5-2 – KS5 Pupils in Any Sustained FE Destination (two terms after leaving school/ college)
Source: Department for Education
However, the proportion of pupils in Suffolk who enter higher education for at least two terms after leaving school or college is particularly lagging behind the average
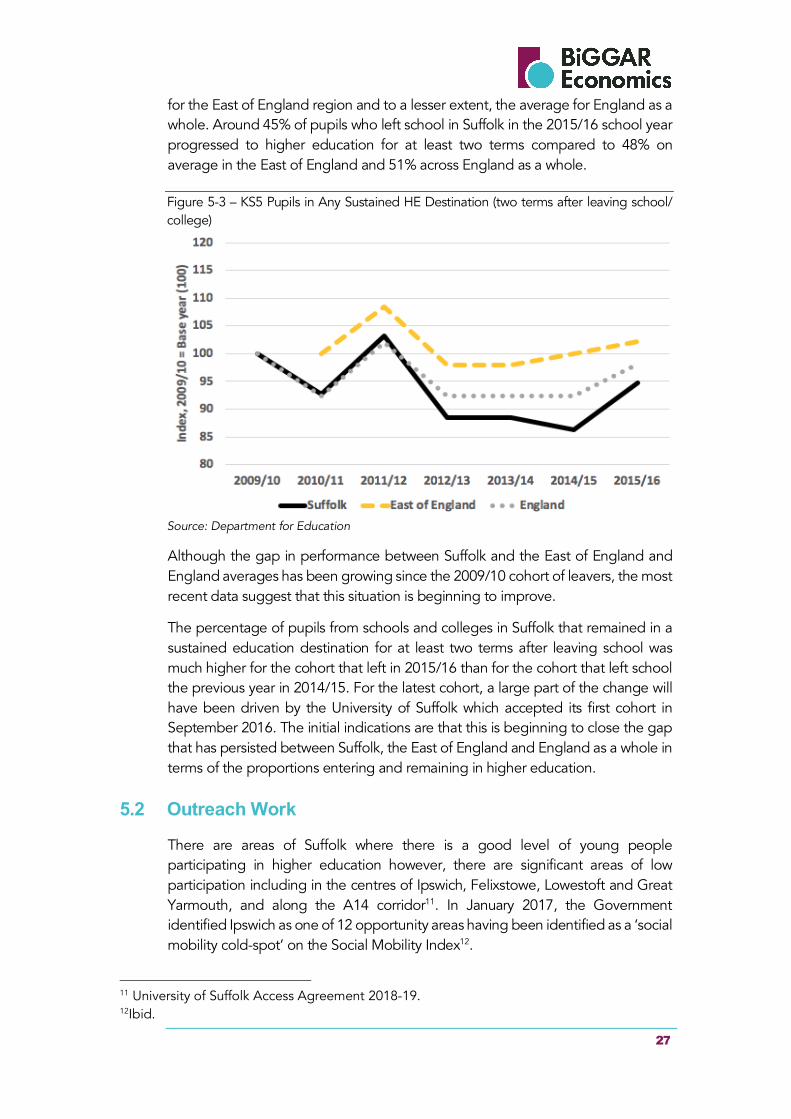
27
for the East of England region and to a lesser extent, the average for England as a whole. Around 45% of pupils who left school in Suffolk in the 2015/16 school year progressed to higher education for at least two terms compared to 48% on average in the East of England and 51% across England as a whole.
Figure 5-3 – KS5 Pupils in Any Sustained HE Destination (two terms after leaving school/ college)
Source: Department for Education
Although the gap in performance between Suffolk and the East of England and England averages has been growing since the 2009/10 cohort of leavers, the most recent data suggest that this situation is beginning to improve.
The percentage of pupils from schools and colleges in Suffolk that remained in a sustained education destination for at least two terms after leaving school was much higher for the cohort that left in 2015/16 than for the cohort that left school the previous year in 2014/15. For the latest cohort, a large part of the change will have been driven by the University of Suffolk which accepted its first cohort in September 2016. The initial indications are that this is beginning to close the gap that has persisted between Suffolk, the East of England and England as a whole in terms of the proportions entering and remaining in higher education.
5.2 Outreach Work
There are areas of Suffolk where there is a good level of young people participating in higher education however, there are significant areas of low participation including in the centres of Ipswich, Felixstowe, Lowestoft and Great Yarmouth, and along the A14 corridor11. In January 2017, the Government identified Ipswich as one of 12 opportunity areas having been identified as a ‘social mobility cold-spot’ on the Social Mobility Index12.
11 University of Suffolk Access Agreement 2018-19. 12Ibid.
28
The University of Suffolk has worked with a range of partners to widen access and raise aspirations across the region, including Suffolk County Council, New Anglia LEP, schools, colleges and local community groups. It is also a partner in a National Collaborative Outreach Project (NEACO: Network for East Anglian Collaborative Outreach) to raise participation rates across Suffolk, Norfolk, Cambridgeshire and Peterborough, and is represented on the Ipswich Opportunity Area Board.
In recognition of the role that information, advice and guidance (IAG) plays in supporting informed choices of young people and mature students, the University continues to focus on delivering excellent IAG support across all of its activities and works in a structured way with schools and colleges with low progression rates, as well as with communities with low participation rates, including mature and part-time students.
The Student Recruitment and Outreach team at the University organise a range of carefully targeted events and activities throughout the UK and Europe to help prospective students and their families find out about the range of options in higher education in general, and at the University of Suffolk more specifically.
In 2018/19 the University planned new activities to promote Higher and Degree Apprenticeships, such as those offered in conjunction with BT, which are expected to play a growing role in increasing the participation rate of young people in Suffolk.
Also, in 2018/19, the University implemented a fund to support outreach students to attend on-campus interviews to remove the financial barrier this represents to students from low-income backgrounds.
5.2.1 Target Groups
The University has designed its approach to targeting non-traditional groups over a period of many years. It plans to continue working with low-participation neighbourhoods, specifically groups that include students from households with an annual income of less than £25,000, white males from economically disadvantaged backgrounds, students with a physical or specific learning disability, students who are the first in their family to consider progressing to higher education, mature students, prospective part-time students, students who live in, or have recently left, local authority care, students from military families and ex-military, students from ethnic minority groups, young carers, refugees, and students from gypsy and Traveller communities.
The University of Suffolk has subscribed to the Higher Education Access Tracker (HEAT) service which assists higher education institutions in England to target, monitor and evaluate their outreach activity.
5.2.2 Evidence of Success in Outreach Work
Data from HESA indicate that the University of Suffolk is performing strongly in encouraging participation from non-traditional groups, particularly people from
29
low participation neighbourhoods. This success applies to both young students and also to mature students with no previous higher education experience.
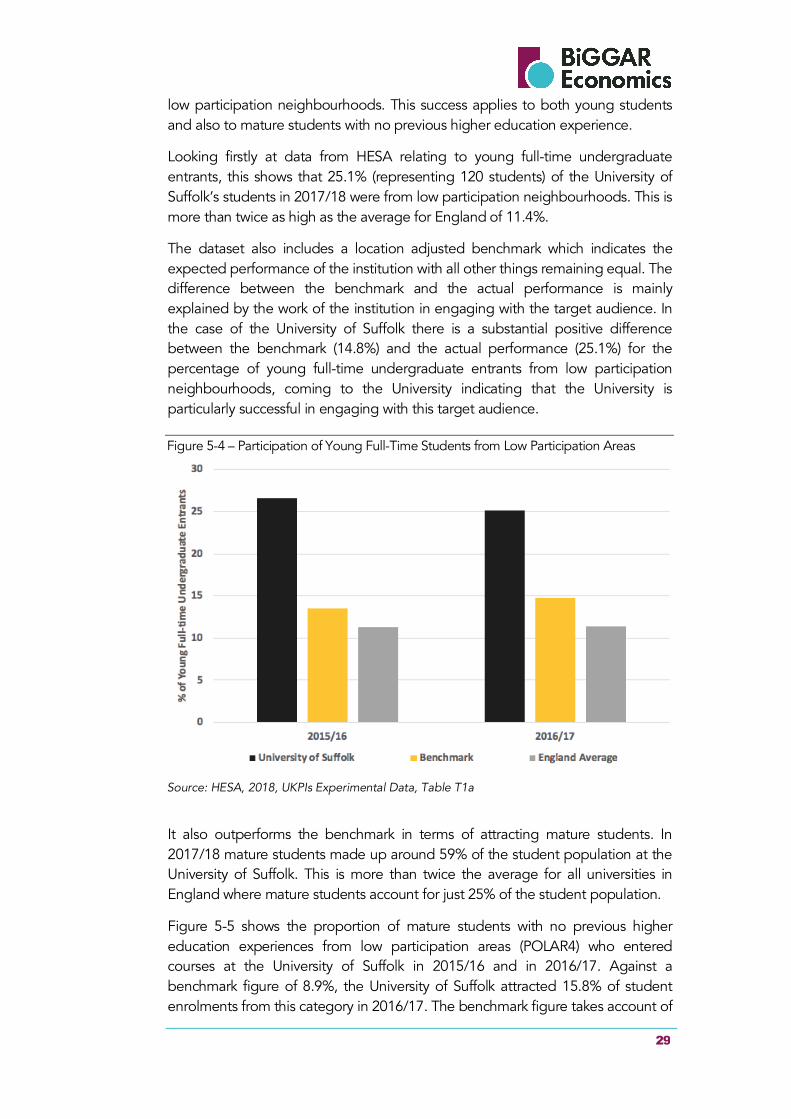
Looking firstly at data from HESA relating to young full-time undergraduate entrants, this shows that 25.1% (representing 120 students) of the University of Suffolk’s students in 2017/18 were from low participation neighbourhoods. This is more than twice as high as the average for England of 11.4%.
The dataset also includes a location adjusted benchmark which indicates the expected performance of the institution with all other things remaining equal. The difference between the benchmark and the actual performance is mainly explained by the work of the institution in engaging with the target audience. In the case of the University of Suffolk there is a substantial positive difference between the benchmark (14.8%) and the actual performance (25.1%) for the percentage of young full-time undergraduate entrants from low participation neighbourhoods, coming to the University indicating that the University is particularly successful in engaging with this target audience.
Figure 5-4 – Participation of Young Full-Time Students from Low Participation Areas
Source: HESA, 2018, UKPIs Experimental Data, Table T1a
It also outperforms the benchmark in terms of attracting mature students. In 2017/18 mature students made up around 59% of the student population at the University of Suffolk. This is more than twice the average for all universities in England where mature students account for just 25% of the student population.
Figure 5-5 shows the proportion of mature students with no previous higher education experiences from low participation areas (POLAR4) who entered courses at the University of Suffolk in 2015/16 and in 2016/17. Against a benchmark figure of 8.9%, the University of Suffolk attracted 15.8% of student enrolments from this category in 2016/17. The benchmark figure takes account of
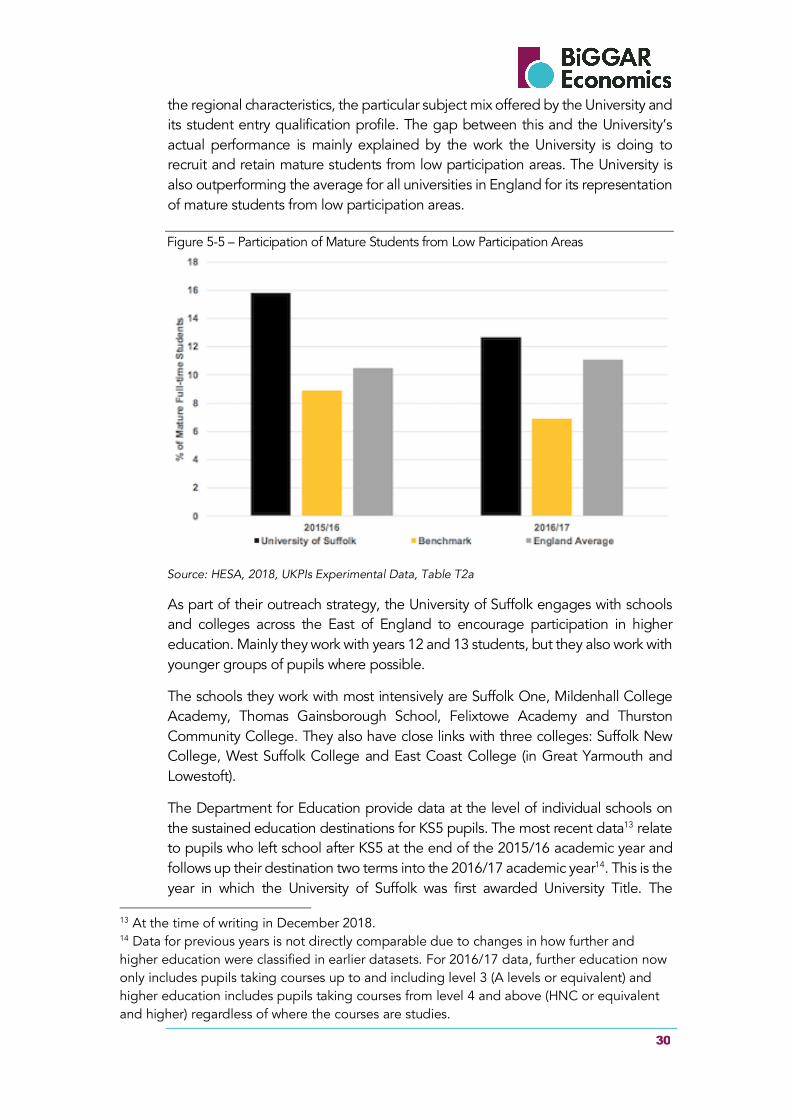
30
the regional characteristics, the particular subject mix offered by the University and its student entry qualification profile. The gap between this and the University’s actual performance is mainly explained by the work the University is doing to recruit and retain mature students from low participation areas. The University is also outperforming the average for all universities in England for its representation of mature students from low participation areas.
Figure 5-5 – Participation of Mature Students from Low Participation Areas
Source: HESA, 2018, UKPIs Experimental Data, Table T2a
As part of their outreach strategy, the University of Suffolk engages with schools and colleges across the East of England to encourage participation in higher education. Mainly they work with years 12 and 13 students, but they also work with younger groups of pupils where possible.
The schools they work with most intensively are Suffolk One, Mildenhall College Academy, Thomas Gainsborough School, Felixtowe Academy and Thurston Community College. They also have close links with three colleges: Suffolk New College, West Suffolk College and East Coast College (in Great Yarmouth and Lowestoft).
The Department for Education provide data at the level of individual schools on the sustained education destinations for KS5 pupils. The most recent data13 relate to pupils who left school after KS5 at the end of the 2015/16 academic year and follows up their destination two terms into the 2016/17 academic year14. This is the year in which the University of Suffolk was first awarded University Title. The
13 At the time of writing in December 2018. 14 Data for previous years is not directly comparable due to changes in how further and higher education were classified in earlier datasets. For 2016/17 data, further education now only includes pupils taking courses up to and including level 3 (A levels or equivalent) and higher education includes pupils taking courses from level 4 and above (HNC or equivalent and higher) regardless of where the courses are studies.
31
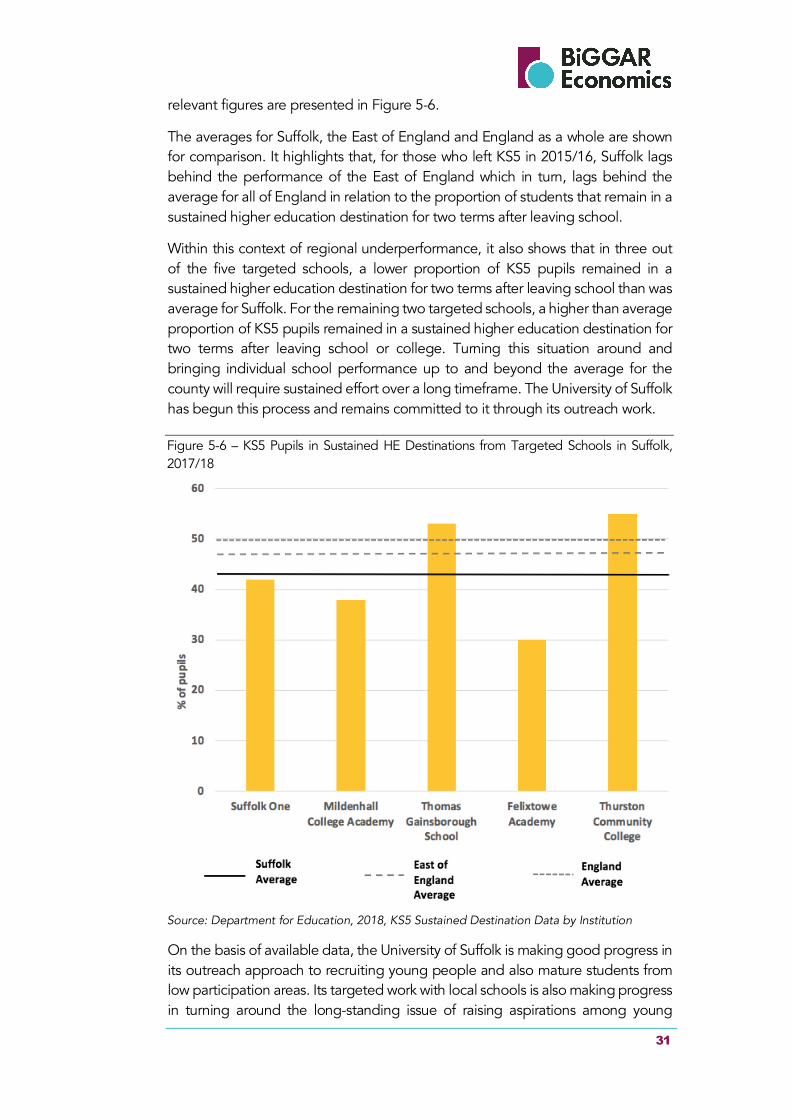
relevant figures are presented in Figure 5-6.
The averages for Suffolk, the East of England and England as a whole are shown for comparison. It highlights that, for those who left KS5 in 2015/16, Suffolk lags behind the performance of the East of England which in turn, lags behind the average for all of England in relation to the proportion of students that remain in a sustained higher education destination for two terms after leaving school.
Within this context of regional underperformance, it also shows that in three out of the five targeted schools, a lower proportion of KS5 pupils remained in a sustained higher education destination for two terms after leaving school than was average for Suffolk. For the remaining two targeted schools, a higher than average proportion of KS5 pupils remained in a sustained higher education destination for two terms after leaving school or college. Turning this situation around and bringing individual school performance up to and beyond the average for the county will require sustained effort over a long timeframe. The University of Suffolk has begun this process and remains committed to it through its outreach work.
Figure 5-6 – KS5 Pupils in Sustained HE Destinations from Targeted Schools in Suffolk, 2017/18
Source: Department for Education, 2018, KS5 Sustained Destination Data by Institution
On the basis of available data, the University of Suffolk is making good progress in its outreach approach to recruiting young people and also mature students from low participation areas. Its targeted work with local schools is also making progress in turning around the long-standing issue of raising aspirations among young
32
people who are then encouraged to enter and remain in higher education on leaving school. The University’s annual Access and Participation Plan describes its continual approach to targeting individual groups in its commitment to widening participation.
5.3 Relationships with Colleges
The University works in close partnership with three local further education colleges located across Suffolk and in Great Yarmouth to offer the opportunity for students to study at their local college and obtain a recognised University of Suffolk award. Students are encouraged to consider courses in Ipswich if their local college is unable to offer a relevant progression route. These three colleges are all Partner Colleges of the University.
5.3.1 University of Suffolk at Suffolk New College, Ipswich
Suffolk New College is situated in the Education Quarter of Ipswich. Set within a modern £70 million building, which opened in 2009, the College is situated a few minutes’ walk from the main University of Suffolk’s campus on the Ipswich Waterfront. It is close to the town centre, the railway station and is on several major bus routes.
University of Suffolk at Suffolk New College offers higher education courses in civil engineering, fashion and teacher training. It has excellent laboratory and testing facilities to support its programme of teaching in civil engineering.
5.3.2 University of Suffolk at West Suffolk College, Bury St Edmunds
The University of Suffolk at West Suffolk College has a wide range of degrees in vocational subjects as well as humanities and social sciences. The college prides itself on its student satisfaction scores and its engagement with employers for work placements and project experience.
It offers courses in vocational subjects as well as humanities and social sciences. Courses include art practice, applied sports, interior design, psychology and counselling, engineering (mechanical, electrical and civil), construction management, computer games technology, education, creative and commercial music production and software development.
5.3.3 University of Suffolk at East Coast College, (Great Yarmouth and Lowestoft)
The University of Suffolk at East Coast College is based in the coastal towns of Great Yarmouth and Lowestoft. It offers a growing range of Foundation and Honours degrees, the majority of which are led by lecturers who are active in their specialist fields with established, close links to employers and the local community.
Both campuses have undergone recent, substantial capital investment to create modern study and leisure facilities, industry standard equipment and dedicated
33
undergraduate resources. Reflecting the nature of the local economy, the College also has an international reputation for courses in engineering, offshore and related maritime safety and logistics.
It offers courses in vocational subjects as well as humanities, education, health and social sciences. Students can study a range of higher education qualifications, including Honours and Foundation degrees, with many courses developed in collaboration with local businesses.
5.4 Consultation Feedback
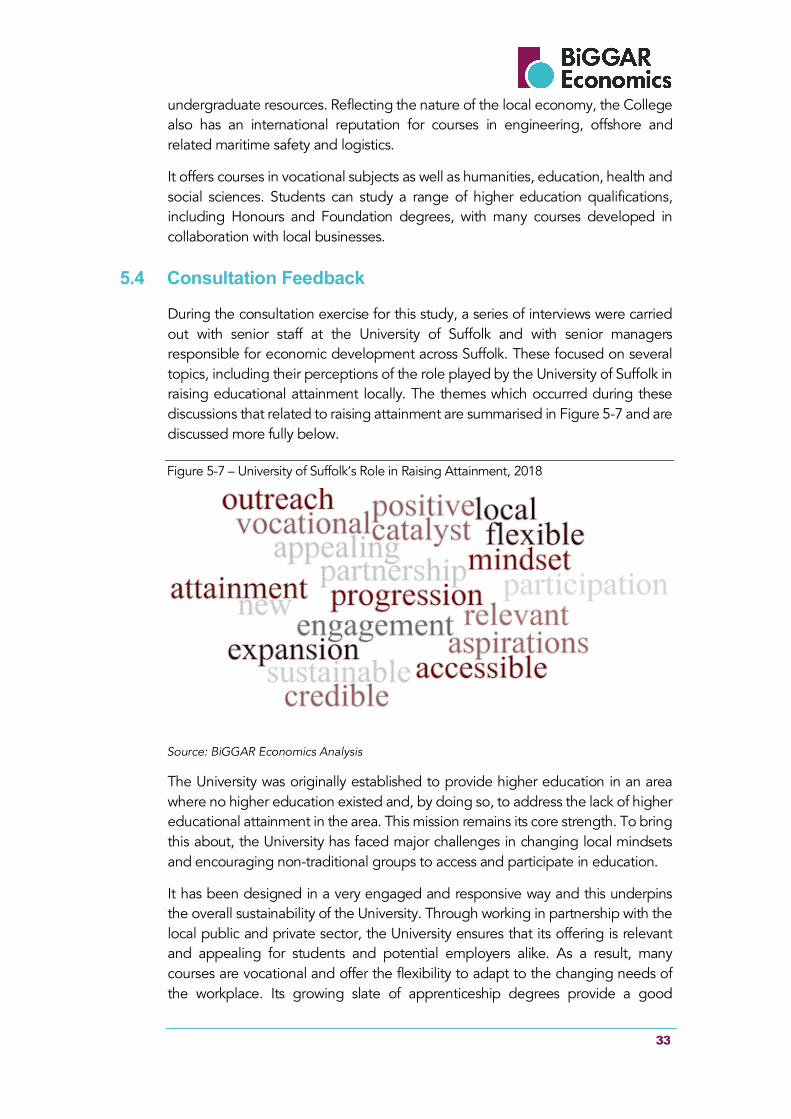
During the consultation exercise for this study, a series of interviews were carried out with senior staff at the University of Suffolk and with senior managers responsible for economic development across Suffolk. These focused on several topics, including their perceptions of the role played by the University of Suffolk in raising educational attainment locally. The themes which occurred during these discussions that related to raising attainment are summarised in Figure 5-7 and are discussed more fully below.
Figure 5-7 – University of Suffolk’s Role in Raising Attainment, 2018
Source: BiGGAR Economics Analysis
The University was originally established to provide higher education in an area where no higher education existed and, by doing so, to address the lack of higher educational attainment in the area. This mission remains its core strength. To bring this about, the University has faced major challenges in changing local mindsets and encouraging non-traditional groups to access and participate in education.
It has been designed in a very engaged and responsive way and this underpins the overall sustainability of the University. Through working in partnership with the local public and private sector, the University ensures that its offering is relevant and appealing for students and potential employers alike. As a result, many courses are vocational and offer the flexibility to adapt to the changing needs of the workplace. Its growing slate of apprenticeship degrees provide a good
34
example of its partnership approach. The University of Suffolk is viewed positively and is considered to offer a credible progression route for young people in the area, acting as a catalyst through which many can aspire to change and direct their future careers. This requires an extensive amount of proactive outreach and support work on the part of the University to ensure that students apply for courses and are actively supported in order to complete their studies.
5.5 Raising Attainment Summary
Historically, a lower proportion of pupils from Suffolk enter further and higher education. This is illustrated by data from the Department for Education15 on the proportion of pupils from the area that enter a sustained further or higher education destination on leaving school after completing KS5 qualifications. The University of Suffolk has been designed and thoughtfully developed in order to address this gap and they invest a significant amount of resources in activities to support outreach and retention work.
As a new venture, the University has significantly expanded further and higher education provision in Suffolk in a sustainable and well-planned manner. Data from the Higher Education Statistics Agency16 indicate that the University is making progress with higher than expected shares of mature students from low participation areas in its student profile. It is also successful in encouraging pupils from targeted schools in the area into sustained higher education destinations17. Although the proportion of students that progress onto higher education in Suffolk still lags behind the rest of the country, the gap is beginning to close. This situation will require sustained effort over a long timeframe to change mindsets and encourage wider participation. This is the University’s central purpose.
15 Department for Education, 16th October 2018, Key Stage 5 Destination Measures 2016 to 2017 16 HESA, 2018, UKPIs Experimental Data, Table T2a 17 Department for Education, 2018, KS5 Sustained Destination Data by Institution
35
6 STUDENT IMPACTS
This chapter describes the economic impact associated with students at the University of Suffolk. This includes:
• students spending money on goods and services;
• students working part-time while studying;
• students undertaking unpaid voluntary work for charities and third sector organisations.
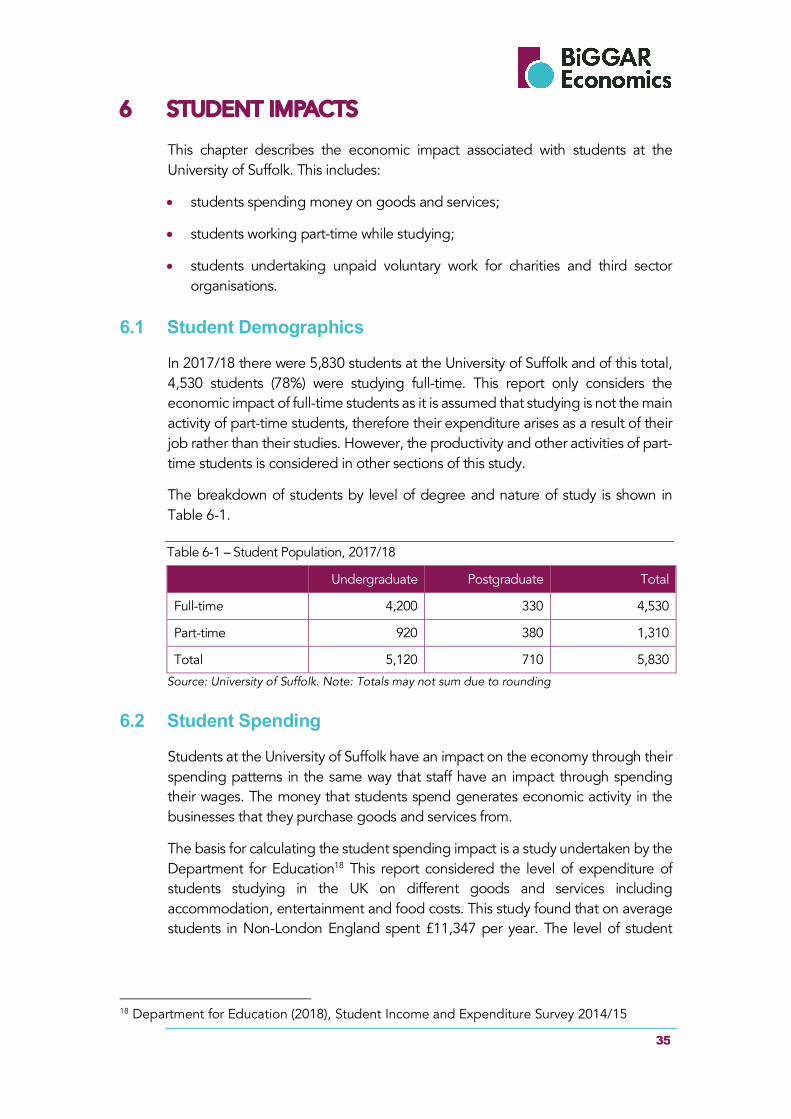
6.1 Student Demographics
In 2017/18 there were 5,830 students at the University of Suffolk and of this total, 4,530 students (78%) were studying full-time. This report only considers the economic impact of full-time students as it is assumed that studying is not the main activity of part-time students, therefore their expenditure arises as a result of their job rather than their studies. However, the productivity and other activities of part-time students is considered in other sections of this study.
The breakdown of students by level of degree and nature of study is shown in Table 6-1.
Table 6-1 – Student Population, 2017/18
Undergraduate Postgraduate Total
Full-time 4,200 330 4,530
Part-time 920 380 1,310
Total 5,120 710 5,830
Source: University of Suffolk. Note: Totals may not sum due to rounding
6.2 Student Spending
Students at the University of Suffolk have an impact on the economy through their spending patterns in the same way that staff have an impact through spending their wages. The money that students spend generates economic activity in the businesses that they purchase goods and services from.
The basis for calculating the student spending impact is a study undertaken by the Department for Education18 This report considered the level of expenditure of students studying in the UK on different goods and services including accommodation, entertainment and food costs. This study found that on average students in Non-London England spent £11,347 per year. The level of student
18 Department for Education (2018), Student Income and Expenditure Survey 2014/15
36
expenditure varies between the age of students, household characteristics and level of education.
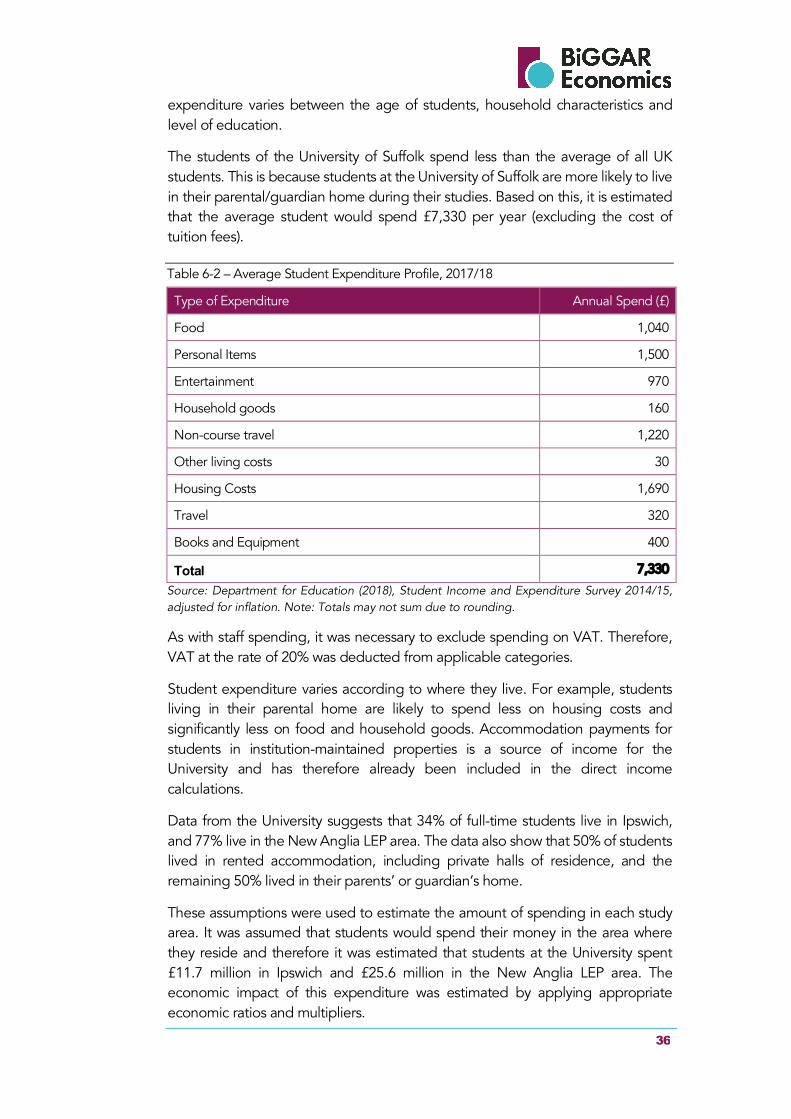
The students of the University of Suffolk spend less than the average of all UK students. This is because students at the University of Suffolk are more likely to live in their parental/guardian home during their studies. Based on this, it is estimated that the average student would spend £7,330 per year (excluding the cost of tuition fees).
Table 6-2 – Average Student Expenditure Profile, 2017/18
Type of Expenditure Annual Spend (£)
Food 1,040
Personal Items 1,500
Entertainment 970
Household goods 160
Non-course travel 1,220
Other living costs 30
Housing Costs 1,690
Travel 320
Books and Equipment 400
Total 7,330
Source: Department for Education (2018), Student Income and Expenditure Survey 2014/15, adjusted for inflation. Note: Totals may not sum due to rounding.
As with staff spending, it was necessary to exclude spending on VAT. Therefore, VAT at the rate of 20% was deducted from applicable categories.
Student expenditure varies according to where they live. For example, students living in their parental home are likely to spend less on housing costs and significantly less on food and household goods. Accommodation payments for students in institution-maintained properties is a source of income for the University and has therefore already been included in the direct income calculations.
Data from the University suggests that 34% of full-time students live in Ipswich, and 77% live in the New Anglia LEP area. The data also show that 50% of students lived in rented accommodation, including private halls of residence, and the remaining 50% lived in their parents’ or guardian’s home.
These assumptions were used to estimate the amount of spending in each study area. It was assumed that students would spend their money in the area where they reside and therefore it was estimated that students at the University spent £11.7 million in Ipswich and £25.6 million in the New Anglia LEP area. The economic impact of this expenditure was estimated by applying appropriate economic ratios and multipliers.
37
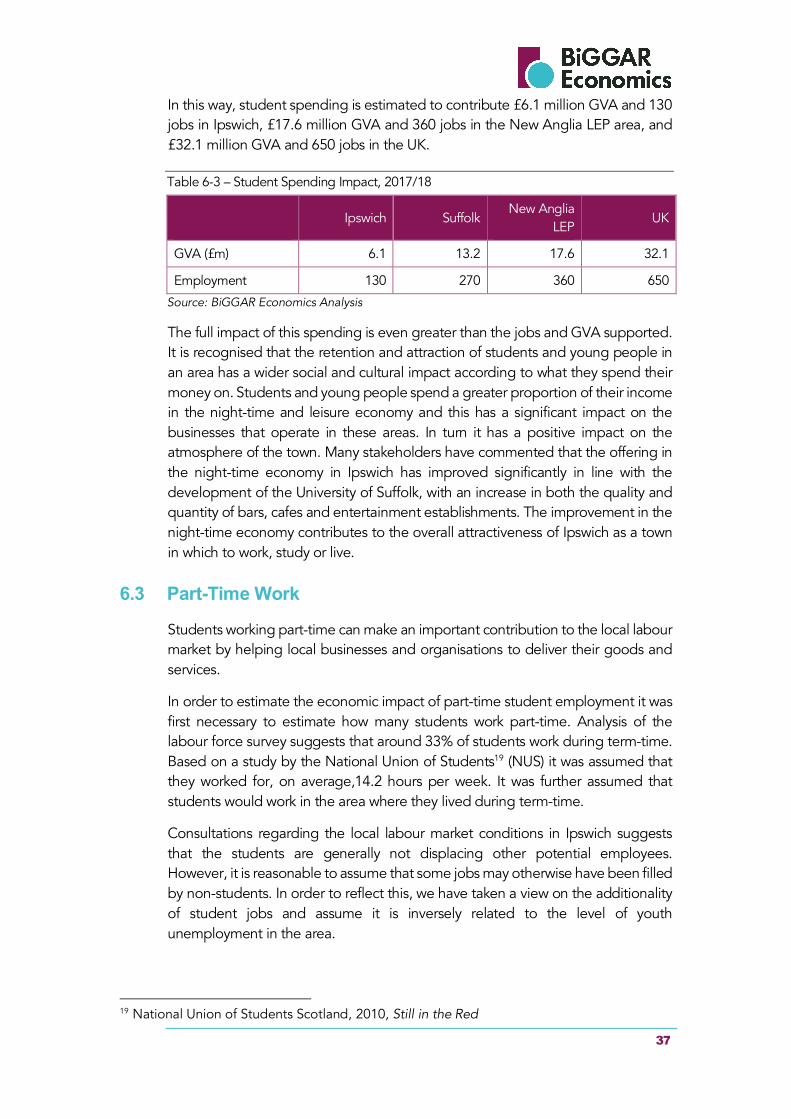
In this way, student spending is estimated to contribute £6.1 million GVA and 130 jobs in Ipswich, £17.6 million GVA and 360 jobs in the New Anglia LEP area, and £32.1 million GVA and 650 jobs in the UK.
Table 6-3 – Student Spending Impact, 2017/18
Ipswich Suffolk
New Anglia LEP
UK
GVA (£m) 6.1 13.2 17.6 32.1
Employment 130 270 360 650
Source: BiGGAR Economics Analysis
The full impact of this spending is even greater than the jobs and GVA supported. It is recognised that the retention and attraction of students and young people in an area has a wider social and cultural impact according to what they spend their money on. Students and young people spend a greater proportion of their income in the night-time and leisure economy and this has a significant impact on the businesses that operate in these areas. In turn it has a positive impact on the atmosphere of the town. Many stakeholders have commented that the offering in the night-time economy in Ipswich has improved significantly in line with the development of the University of Suffolk, with an increase in both the quality and quantity of bars, cafes and entertainment establishments. The improvement in the night-time economy contributes to the overall attractiveness of Ipswich as a town in which to work, study or live.
6.3 Part-Time Work
Students working part-time can make an important contribution to the local labour market by helping local businesses and organisations to deliver their goods and services.
In order to estimate the economic impact of part-time student employment it was first necessary to estimate how many students work part-time. Analysis of the labour force survey suggests that around 33% of students work during term-time. Based on a study by the National Union of Students19 (NUS) it was assumed that they worked for, on average,14.2 hours per week. It was further assumed that students would work in the area where they lived during term-time.
Consultations regarding the local labour market conditions in Ipswich suggests that the students are generally not displacing other potential employees. However, it is reasonable to assume that some jobs may otherwise have been filled by non-students. In order to reflect this, we have taken a view on the additionality of student jobs and assume it is inversely related to the level of youth unemployment in the area.
19 National Union of Students Scotland, 2010, Still in the Red
38
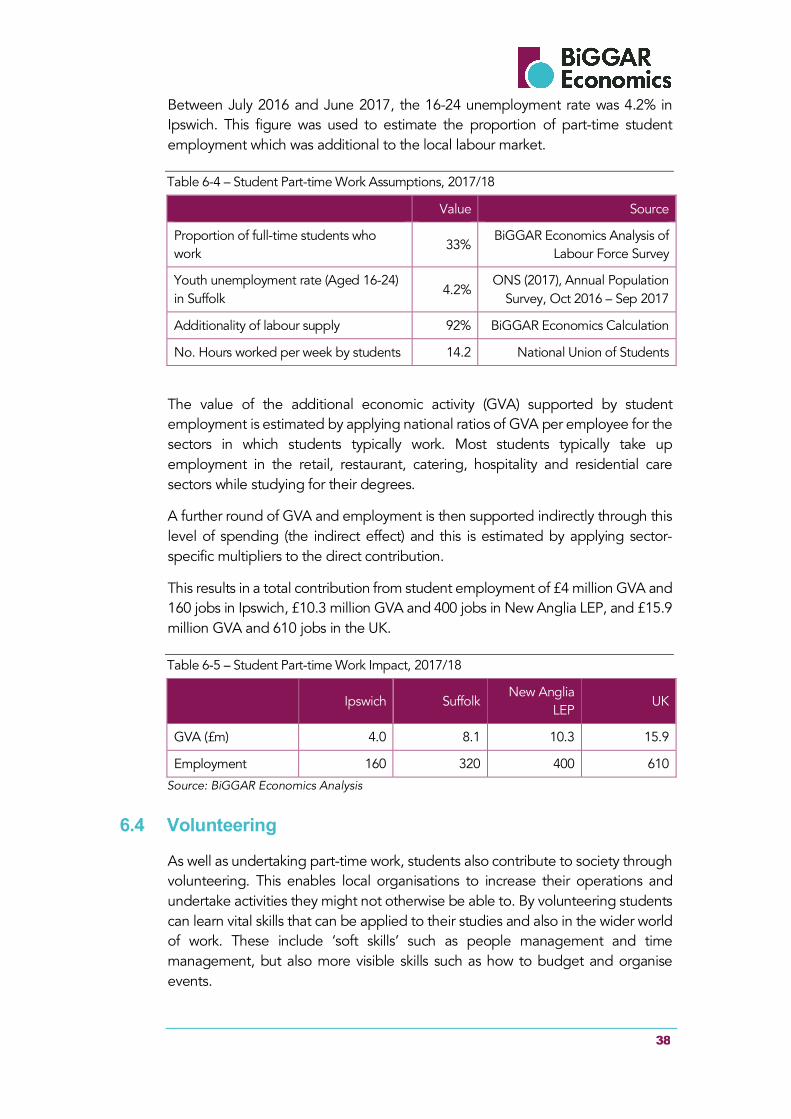
Between July 2016 and June 2017, the 16-24 unemployment rate was 4.2% in Ipswich. This figure was used to estimate the proportion of part-time student employment which was additional to the local labour market.
Table 6-4 – Student Part-time Work Assumptions, 2017/18
Value Source
Proportion of full-time students who work
33% BiGGAR Economics Analysis of
Labour Force Survey
Youth unemployment rate (Aged 16-24) in Suffolk
4.2% ONS (2017), Annual Population
Survey, Oct 2016 – Sep 2017
Additionality of labour supply 92% BiGGAR Economics Calculation
No. Hours worked per week by students 14.2 National Union of Students
The value of the additional economic activity (GVA) supported by student employment is estimated by applying national ratios of GVA per employee for the sectors in which students typically work. Most students typically take up employment in the retail, restaurant, catering, hospitality and residential care sectors while studying for their degrees.
A further round of GVA and employment is then supported indirectly through this level of spending (the indirect effect) and this is estimated by applying sector-specific multipliers to the direct contribution.
This results in a total contribution from student employment of £4 million GVA and 160 jobs in Ipswich, £10.3 million GVA and 400 jobs in New Anglia LEP, and £15.9 million GVA and 610 jobs in the UK.
Table 6-5 – Student Part-time Work Impact, 2017/18
Ipswich Suffolk
New Anglia LEP
UK
GVA (£m) 4.0 8.1 10.3 15.9
Employment 160 320 400 610
Source: BiGGAR Economics Analysis
6.4 Volunteering
As well as undertaking part-time work, students also contribute to society through volunteering. This enables local organisations to increase their operations and undertake activities they might not otherwise be able to. By volunteering students can learn vital skills that can be applied to their studies and also in the wider world of work. These include ‘soft skills’ such as people management and time management, but also more visible skills such as how to budget and organise events.
39
Part of the value of student volunteering can be captured quantitatively by estimating the number of hours that were contributed towards volunteering. A survey undertaken by NUS Connect in 2014 on the Student Volunteering Landscape found that 33% of university students volunteer for an average of 44 hours per year. Applying this estimate to the student population at the University of Suffolk suggests that around 1,500 students spend approximately 65,800 hours on voluntary activities per year.
This figure is then valued according to data from the ONS on the Hours and Value of Formal Voluntary Activity20 which implies that volunteering in the UK is worth around £11.30 per hour.
Table 6-6 – Student Volunteering Assumptions, 2017/18
Value Source
Proportion of students who volunteer 33% NUS Connect (2014), Student Volunteering
Landscape Annual hours volunteered per student 44
The increased activity this supports within the third sector organisations will also increase activity within their supply chains, resulting in further increases in employment even if the volunteers themselves are not counted as employees. These multiplier effects can be captured by applying GVA and employment multipliers to the direct impact.
Students were assumed to undertake their voluntary work in the area where they reside during term-time. The impact in each study area was therefore attributed accordingly and, in this way, it was estimated that student volunteering contributed £0.3 million GVA in Ipswich, £0.6 million GVA in the New Anglia LEP area and £0.7 million GVA in the UK.
Table 6-7 – Student Volunteering Impact, 2017/18
Ipswich Suffolk
New Anglia LEP
UK
GVA (£m) 0.3 0.5 0.6 0.7
Source: BiGGAR Economics Analysis
In practice, the value of student volunteering is greater than this figure suggests as the calculations are only an approximate method which captures the monetary value of the students’ time. It does not reflect the wider community benefits such as:
• the value of volunteering to the service supported as many organisations could not run without these additional volunteers;
20 ONS, Annual Survey of Hours and Earnings 2012/13, Community Life
40
• the value of the services to the people who use them;
• the value of the contributions on service users, as improvements in health and wellbeing will result in cost savings in health and social services.
6.5 Summary of Student Impacts
The total contribution associated with student spending, student employment and student volunteering is estimated at £48.7 million GVA and 1,260 jobs in the UK of which around 21% occurs in Ipswich and 58% occurs in the New Anglia LEP area.
Table 6-8 – Student Impacts, 2017/18
Ipswich Suffolk
New Anglia LEP
UK
GVA (£m)
Student spending 6.1 13.2 17.6 32.1
Part-Time Work 4.0 8.1 10.3 15.9
Volunteering 0.3 0.5 0.6 0.7
Total 10.3 21.8 28.4 48.7
Employment
Student spending 130 270 360 650
Part-Time Work 160 320 400 610
Total 280 590 760 1,260
Source: BiGGAR Economics Analysis (totals may not sum due to rounding)
41
7 IMPACTS AFTER UNIVERSITY
The most visible output of a University are the graduates that emerge each year and start to contribute to the economy through their places of work. The graduates themselves benefit through increased earnings during their working lives, however wider society also benefits from these graduates as everyone benefits from their skills. Without the availability of these skills, many crucial services and industries across the area, from healthcare to ICT, would suffer.
This chapter considers how University of Suffolk graduates have an impact on the economy.
7.1 Graduate Employment
Graduates in Suffolk are more likely to be in employment than those without degrees and therefore attending University is one of the main ways in which an individual can improve their employability. In addition, many graduates go on to further study, to further improve their employment prospects and pursue their interests. The Destination of Leavers of Higher Education Survey21 found that 56% of graduates from the University of Suffolk were in full-time employment six months after graduation. This included both 'graduate level' and 'non-graduate level' employment. In addition to that many more were in either part-time employment or had gone on to further study. The majority of graduates find employment within Suffolk after leaving University.
In total, 95.4% of graduates of the University of Suffolk were either in employment or had gone on to further study. Across the UK 94.6% of graduates were either in employment or further study. Therefore, the graduates of the University of Suffolk are more likely than average to be in a positive outcome after University.
7.2 Graduate Earnings in Suffolk
Graduates who work in Suffolk earn more than those who are non-graduates. However, graduates in Suffolk earn less than other graduates across the UK. The latest city level analysis was undertaken by the Centre for Cities22 found that in 2014, graduates in Suffolk earned £21,200. This was 54th out of the 63 cities covered in the analysis.
21 HESA, Destination of Leavers of Higher Education Survey, 2013/14 – 2014/15 22 Centre for Cities Data Tool, Centre for Cities Website
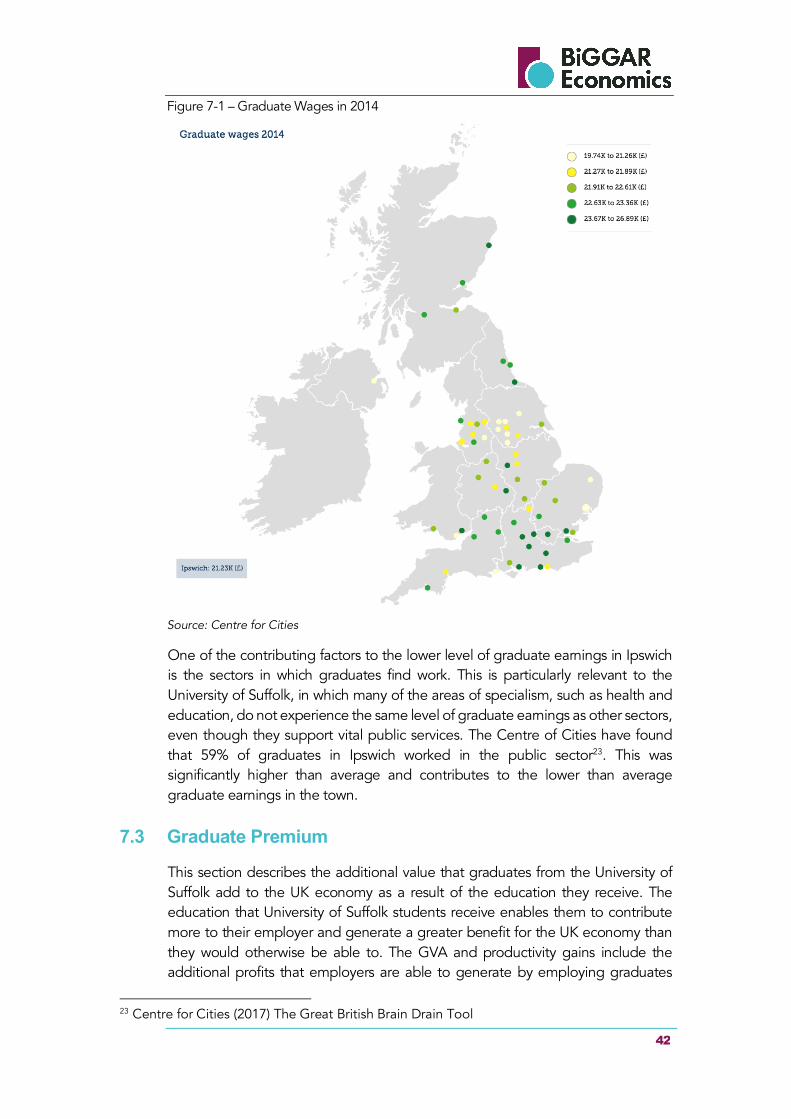
42
Figure 7-1 – Graduate Wages in 2014
Source: Centre for Cities
One of the contributing factors to the lower level of graduate earnings in Ipswich is the sectors in which graduates find work. This is particularly relevant to the University of Suffolk, in which many of the areas of specialism, such as health and education, do not experience the same level of graduate earnings as other sectors, even though they support vital public services. The Centre of Cities have found that 59% of graduates in Ipswich worked in the public sector23. This was significantly higher than average and contributes to the lower than average graduate earnings in the town.
7.3 Graduate Premium
This section describes the additional value that graduates from the University of Suffolk add to the UK economy as a result of the education they receive. The education that University of Suffolk students receive enables them to contribute more to their employer and generate a greater benefit for the UK economy than they would otherwise be able to. The GVA and productivity gains include the additional profits that employers are able to generate by employing graduates
23 Centre for Cities (2017) The Great British Brain Drain Tool
43
and the additional employment costs they are willing to pay in order to generate these additional profits.
The subject of graduate earnings premiums has been well researched so information about them is readily available and can be used to provide a measure of the additional contribution graduates make to the economy each year. Information about the graduate premium for different subject areas is provided in a research paper produced by the Department for Business Innovation and Skills (BIS),24 which considered data from the UK Labour Force Survey between 1996 and 2009. Although the data used in the report is now somewhat dated, evidence from the OECD25 suggests that the returns to higher education are fairly consistent over time.
The analysis considered the after-tax earnings of a graduate compared to the after-tax earnings of a non-graduate. Direct costs, such as tuition fees less student support, and indirect costs such as foregone earnings were then subtracted from the gross graduate premium for each degree subject to give the net graduate premium.
In this way the total graduate premium gives the combined personal economic benefit that the year’s graduates will obtain rather than the increase in national productivity associated with the degree, which will be higher. It therefore does not include the corporate profit associated with each graduate as well as the taxes paid to the Treasury. For these reasons (as illustrated in Figure 7-2) the impact presented in this section is likely to underestimate the full impact that graduates from the University of Suffolk generate for the UK economy.
24 Department for Business, Innovation and Skills (2011), The Returns to Higher Education Qualifications 25 Education at a Glance, OECD Indicators series
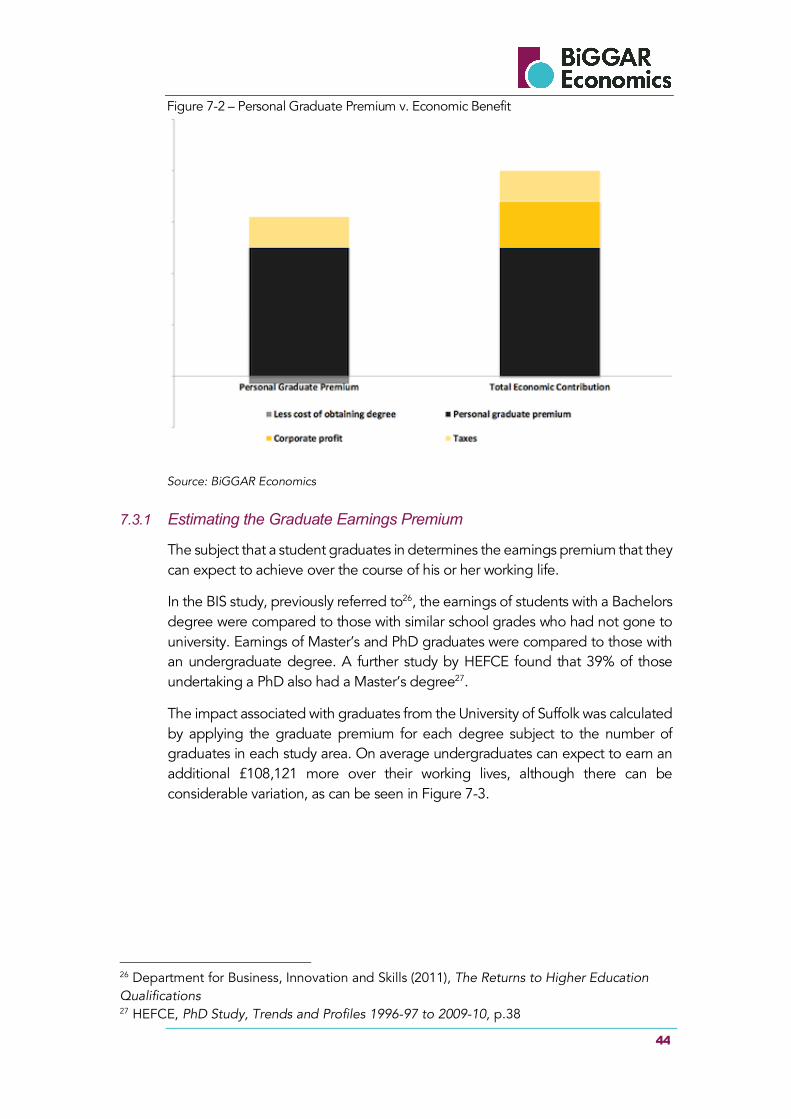
44
Figure 7-2 – Personal Graduate Premium v. Economic Benefit
Source: BiGGAR Economics
7.3.1 Estimating the Graduate Earnings Premium
The subject that a student graduates in determines the earnings premium that they can expect to achieve over the course of his or her working life.
In the BIS study, previously referred to26, the earnings of students with a Bachelors degree were compared to those with similar school grades who had not gone to university. Earnings of Master’s and PhD graduates were compared to those with an undergraduate degree. A further study by HEFCE found that 39% of those undertaking a PhD also had a Master’s degree27.
The impact associated with graduates from the University of Suffolk was calculated by applying the graduate premium for each degree subject to the number of graduates in each study area. On average undergraduates can expect to earn an additional £108,121 more over their working lives, although there can be considerable variation, as can be seen in Figure 7-3.
26 Department for Business, Innovation and Skills (2011), The Returns to Higher Education Qualifications 27 HEFCE, PhD Study, Trends and Profiles 1996-97 to 2009-10, p.38
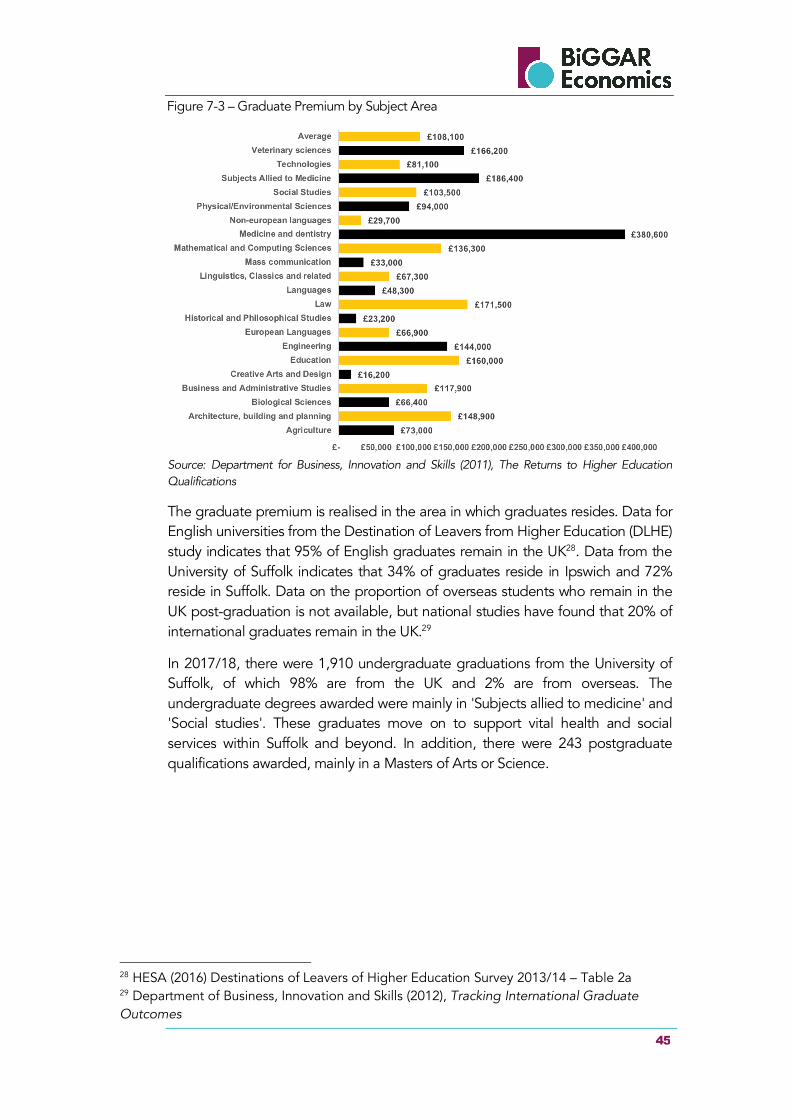
45
Figure 7-3 – Graduate Premium by Subject Area
Source: Department for Business, Innovation and Skills (2011), The Returns to Higher Education Qualifications
The graduate premium is realised in the area in which graduates resides. Data for English universities from the Destination of Leavers from Higher Education (DLHE) study indicates that 95% of English graduates remain in the UK28. Data from the University of Suffolk indicates that 34% of graduates reside in Ipswich and 72% reside in Suffolk. Data on the proportion of overseas students who remain in the UK post-graduation is not available, but national studies have found that 20% of international graduates remain in the UK.29
In 2017/18, there were 1,910 undergraduate graduations from the University of Suffolk, of which 98% are from the UK and 2% are from overseas. The undergraduate degrees awarded were mainly in 'Subjects allied to medicine' and 'Social studies'. These graduates move on to support vital health and social services within Suffolk and beyond. In addition, there were 243 postgraduate qualifications awarded, mainly in a Masters of Arts or Science.
28 HESA (2016) Destinations of Leavers of Higher Education Survey 2013/14 – Table 2a 29 Department of Business, Innovation and Skills (2012), Tracking International Graduate Outcomes
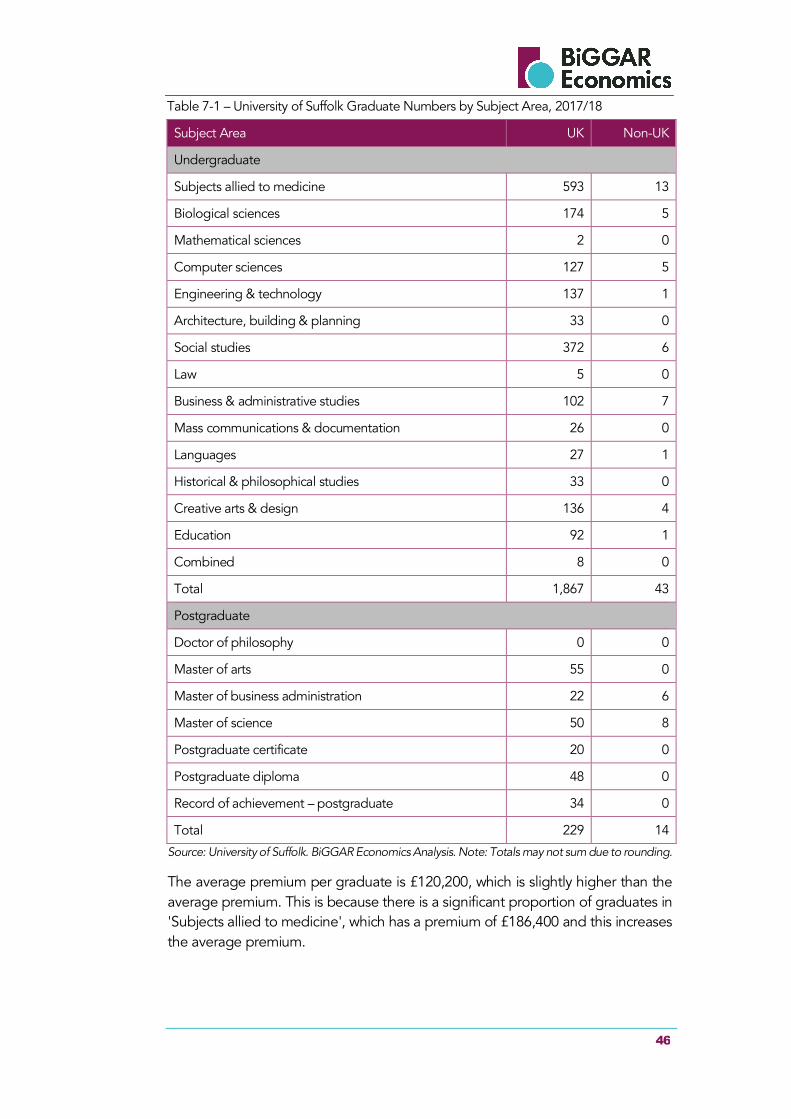
46
Table 7-1 – University of Suffolk Graduate Numbers by Subject Area, 2017/18
Subject Area UK Non-UK
Undergraduate
Subjects allied to medicine 593 13
Biological sciences 174 5
Mathematical sciences 2 0
Computer sciences 127 5
Engineering & technology 137 1
Architecture, building & planning 33 0
Social studies 372 6
Law 5 0
Business & administrative studies 102 7
Mass communications & documentation 26 0
Languages 27 1
Historical & philosophical studies 33 0
Creative arts & design 136 4
Education 92 1
Combined 8 0
Total 1,867 43
Postgraduate
Doctor of philosophy 0 0
Master of arts 55 0
Master of business administration 22 6
Master of science 50 8
Postgraduate certificate 20 0
Postgraduate diploma 48 0
Record of achievement – postgraduate 34 0
Total 229 14
Source: University of Suffolk. BiGGAR Economics Analysis. Note: Totals may not sum due to rounding.
The average premium per graduate is £120,200, which is slightly higher than the average premium. This is because there is a significant proportion of graduates in 'Subjects allied to medicine', which has a premium of £186,400 and this increases the average premium.

47
In total, the graduate premium realised by students at the University of Suffolk in 2017/18 is estimated to be £87.5 million in Ipswich, £222.4 million in the New Anglia LEP area, and £258.8 million in the UK.
Table 7-2 – Graduate Productivity Impact, 2017/18
Ipswich Suffolk
New Anglia LEP
UK
GVA (£m) 87.5 187.1 222.4 258.8
Source: BiGGAR Economics Analysis
48
8 SUPPORT FOR THE PUBLIC SECTOR
The University of Suffolk supports a number of public sector services through the courses it delivers in health and education. Most notably, it improves the quality of life of the local community by improving the health and wellbeing of the population. This chapter briefly highlights some of the ways in which the University of Suffolk supports public sector services.
8.1 Health
The main contribution that the University of Suffolk makes to improving the health of the population is through providing courses for students in nursing, radiography and radiotherapy. Typically, these include a placement in the health service which assists with the running of these services.
8.1.1 Student Placements
Student placements are another channel through which the University can engage with and transfer knowledge to the business community. In 2017/18, around 250 University of Suffolk students undertook professional placements of an average length of 18 weeks. Almost 160 of these were through the School of Health Sciences where placements varied in length from 12 weeks to around six months.
These students have an impact on the economy through the contribution the students make to the companies and organisations they were placed with. As students on placement are likely to be less productive than an average worker and require more training time, it was assumed that the GVA of students undertaking placements is 33% of the average workers’ GVA.
Although the direct employment impact of students on placement was not considered, the indirect effects were captured through employment and GVA multipliers. In total, it was estimated that in 2017/18 students on placement contributed £0.4 million GVA and 10 jobs in Ipswich, £0.9 million GVA and 30 jobs in the New Anglia LEP area, and £1.2 million GVA and 40 jobs in the UK.
Table 8-1 – Student Placement Impact, 2017/18
Ipswich Suffolk
New Anglia LEP
UK
Student Placements
GVA (£m) 0.4 0.6 0.9 1.2
Employment 10 20 30 40
Staff Engagement with Healthcare
GVA (£m) 0.7 0.7 0.7 0.7
Source: BiGGAR Economics Analysis. Note: Totals may not sum due to rounding.
The University’s focus on placements distinguishes it from many other universities,
49
as over 40% of students take part in a placement at some point during their university career (although not all will be of 12 weeks). By learning how their skills can be applied in the world of work, students are able to perform better in their final years, enabling them to get better degrees and better jobs. Many also go on to work for the host organisation where they carried out their placement.
8.1.2 Training and Continued Professional Development (CPD)
Many of the students that are educated within the School of Health Sciences are currently employed within the health sector and pursue flexible learning opportunities provided by the University of Suffolk as a form of Continuing Professional Development (CPD). Approximately 60% of the students within the school are A-Level leavers.
The ability for students to undertake most of their placement within a hospital setting is particularly important and relevant for those based at more remote locations, such as the Queen Elizabeth Hospital in King's Lynn. This particular hospital has had issues with attracting sufficiently trained and skilled staff. The training and education that the University of Suffolk provides for staff at this hospital, who can work towards a BSc that is delivered and accredited by the University, has helped to address this issue.
In addition to these students undertaking full degrees as a form of CPD, the University of Suffolk also offers bespoke CPD courses for members of the health service without it forming part of a wider degree programme. This has included short CPD courses for paramedics on Learning from Incidents, healthcare professionals who wish to become Mentors and healthcare professionals in leadership positions on Building Resilient Leaders and Teams.
The provision of training and CPD opportunities for healthcare professionals within East Anglia is fundamental to the aims of the school to enhance the patient experience and support the local community and NHS.
8.1.3 Staff Time
The academic staff within the School of Health Sciences also directly support the local health sector by spending one day a week in clinical practice. This ensures that the academic staff have a strong understanding of the sector and its developments through this experience and that in turn, the NHS staff and students are able to learn from their specialised experience.
As part of this, the staff will engage directly with the education and training of students who are on placement in these locations and support them in the wards that they are working in. In addition to this the staff also engage with the other members of NHS staff who are on site, this will involve direct training and less formal interactions which encourage the transition of education and research into practice.
There are approximately 65 academic members of staff within the School of Health
50
Sciences and therefore, if they spent 20% of their time in clinical practice, this would be the equivalent of 13 additional highly trained and highly skilled practitioners within these hospitals.
8.2 Education
There is a particular need for teacher training provision in East Anglia as it has historically faced issues in attracting suitably qualified people from outside the region to work in the area. To address this, a more self-reliant approach has evolved of providing teacher training locally as most teaching graduates tend to remain in the area where they train.
The University of Suffolk has been providing teacher training since the 1990s, when it operated as a college. Working with the two County Councils, the University delivers the Suffolk and Norfolk School Centred Initial Teacher Training (SCITT) programme, which offers a range of school-based routes into teaching to produce competent and confident Newly Qualified Teachers. Courses are available for both primary and secondary level and both Salaried and Tuition training routes are available. The courses are school centred with 80% of the students’ time spent in a school setting.
These are popular courses and demand is strong, attracting around 300 trainees per year. There is a wide catchment area for the course and many people are home-based and retraining for a new career. As well as delivering traditional teacher training, students from the psychology course at the University are linking in with the educational psychology team at the Council to build capacity in this area also.
8.3 Service Provision
The University of Suffolk supports the development of the public sector through the formal services which it provides. This includes providing facilities available for hire, consultancy work that utilises the expertise of the academic base in the University and contract research which helps organisations overcome specific issues.
In 2017/18, the University of Suffolk received £346,000 from consultancy, facilities hire and contract research. Of this, 96% came from non-commercial organisations, such as those in the public and third sectors.
This investment will enable the public and third sectors to develop new products and approaches and increase their productivity. As with private companies, profit-seeking companies and non-commercial organisations will only invest in this research if they expect to see positive benefits to them and those they work with. Unlike in private organisations, these benefits will not be realised through increased profitability but in increased efficiency and the development and improvement of services provided.
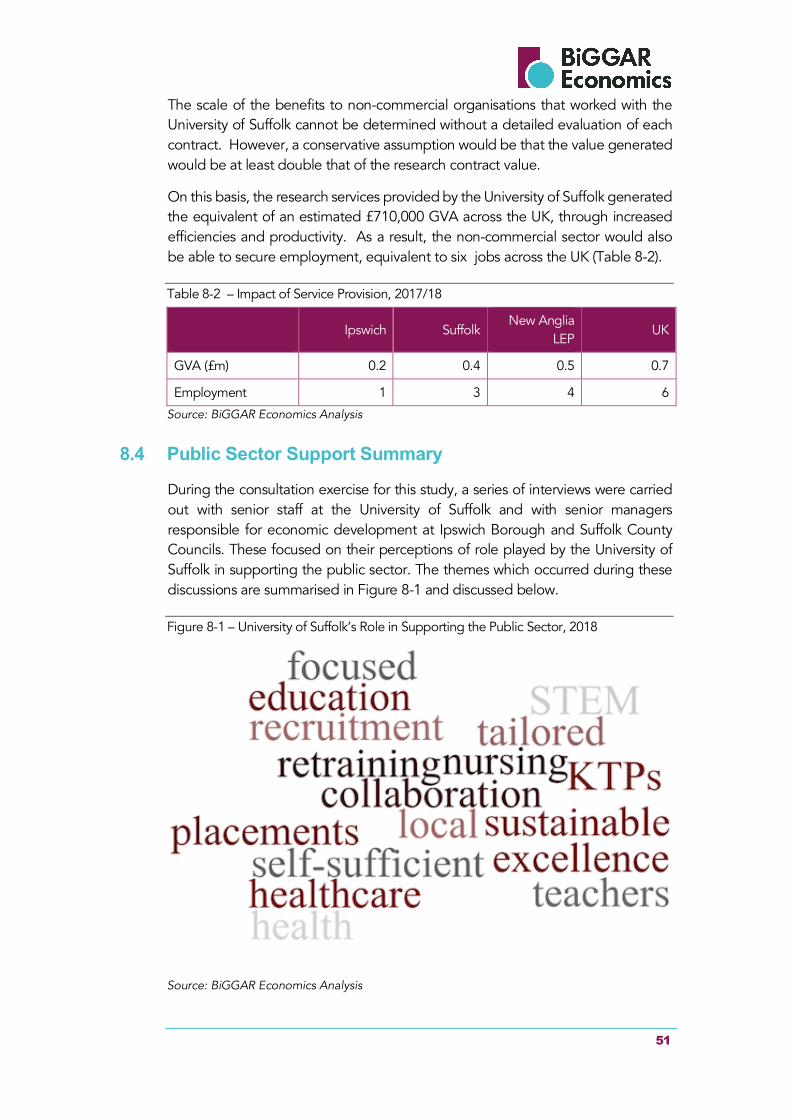
51
The scale of the benefits to non-commercial organisations that worked with the University of Suffolk cannot be determined without a detailed evaluation of each contract. However, a conservative assumption would be that the value generated would be at least double that of the research contract value.
On this basis, the research services provided by the University of Suffolk generated the equivalent of an estimated £710,000 GVA across the UK, through increased efficiencies and productivity. As a result, the non-commercial sector would also be able to secure employment, equivalent to six jobs across the UK (Table 8-2).
Table 8-2 – Impact of Service Provision, 2017/18
Ipswich Suffolk
New Anglia LEP
UK
GVA (£m) 0.2 0.4 0.5 0.7
Employment 1 3 4 6
Source: BiGGAR Economics Analysis
8.4 Public Sector Support Summary
During the consultation exercise for this study, a series of interviews were carried out with senior staff at the University of Suffolk and with senior managers responsible for economic development at Ipswich Borough and Suffolk County Councils. These focused on their perceptions of role played by the University of Suffolk in supporting the public sector. The themes which occurred during these discussions are summarised in Figure 8-1 and discussed below.
Figure 8-1 – University of Suffolk’s Role in Supporting the Public Sector, 2018
Source: BiGGAR Economics Analysis
52
Through offering courses in healthcare, nursing and education, the University of Suffolk is a major provider of training and education for key public sector workers throughout the East of England. This is helping to promote a more locally sustainable approach to recruitment where the county is becoming more self-reliant in filling teaching, nursing and healthcare vacancies.
Student placements also help to support the delivery of frontline services in the health and education sectors. Through focused collaboration with partners in education and health, the University is creating tailored solutions that suit the needs of both the workplace and the students, many of whom are retraining or formalising their pre-existing skills and experience in these fields.
Although knowledge transfer partnerships (KTPs) are at a relatively early stage of implementation at the University, those that have been created are already proving to be an excellent method for sharing knowledge between the University and the healthcare services.
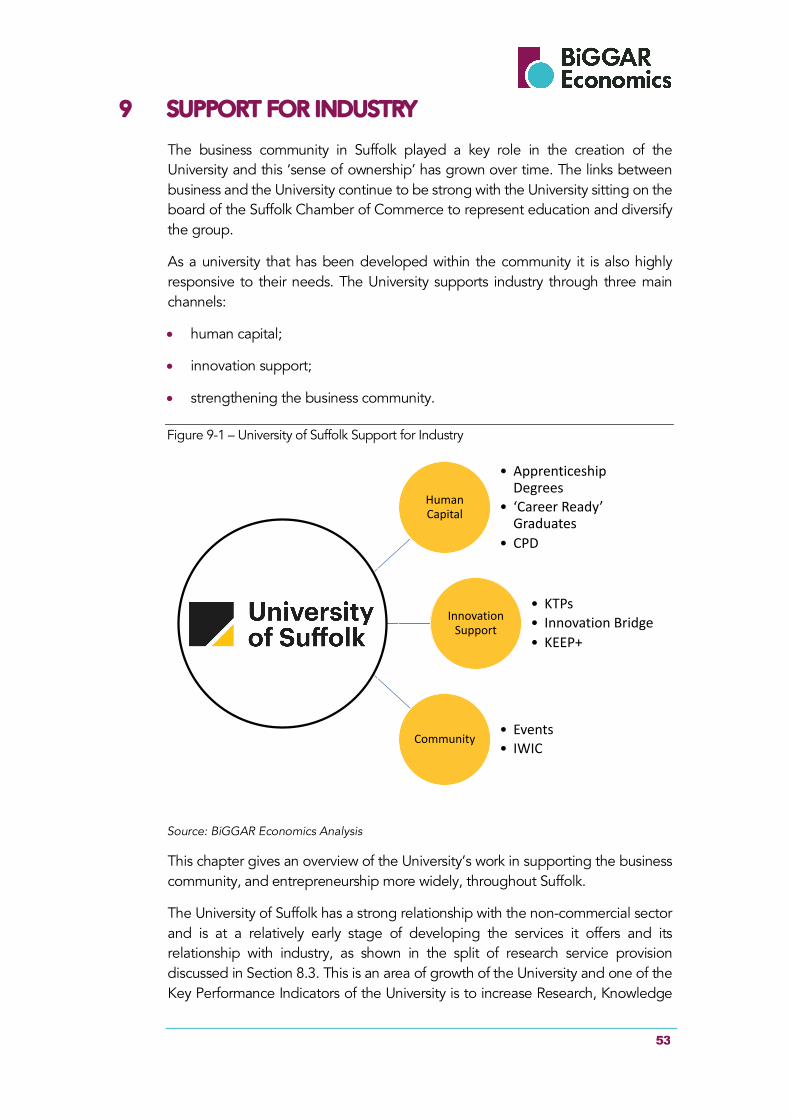
53
9 SUPPORT FOR INDUSTRY
The business community in Suffolk played a key role in the creation of the University and this ‘sense of ownership’ has grown over time. The links between business and the University continue to be strong with the University sitting on the board of the Suffolk Chamber of Commerce to represent education and diversify the group.
As a university that has been developed within the community it is also highly responsive to their needs. The University supports industry through three main channels:
• human capital;
• innovation support;
• strengthening the business community.
Figure 9-1 – University of Suffolk Support for Industry
Source: BiGGAR Economics Analysis
This chapter gives an overview of the University’s work in supporting the business community, and entrepreneurship more widely, throughout Suffolk.
The University of Suffolk has a strong relationship with the non-commercial sector and is at a relatively early stage of developing the services it offers and its relationship with industry, as shown in the split of research service provision discussed in Section 8.3. This is an area of growth of the University and one of the Key Performance Indicators of the University is to increase Research, Knowledge
HumanCapital
• Apprenticeship Degrees
• ‘Career Ready’ Graduates
• CPD
Innovation Support
• KTPs• Innovation Bridge• KEEP+
Community• Events• IWIC
54
Exchange and Enterprise income to £4 million by 202130. Organisations consider that working with a university is an investment in their growth and development and that the resulting economic impacts will be realised over the medium- to long-term.
9.1 Human Capital
The development of skills and human capital has been highlighted in all the economic strategies for the area as a key requirement for economic growth and business development in Suffolk. The approach that the University of Suffolk has taken has been structured to meet the specific needs of the industries in the area and the preference for non-traditional routes to higher education.
9.1.1 Apprenticeship Degrees
Degree Apprenticeships were introduced by the UK Government in 2014 in order to meet the demands of both employers and students, with the first Degree Apprenticeships available in September 2015. Degree Apprenticeships provide students the chance to combine their work and study, which allows them to leave university with less debt and a more secured route for employment than a standard degree programme.
Between 2014/15 and 2017/18, the number of new starts on Higher Apprenticeships (including Degree Apprenticeships) increased from 19,700 to 48,150, while the overall number of new starts on Apprenticeships decreased from 449,890 to 375,760. In 2016-17 there were 2,580 students undertaking degree apprenticeships with a higher education institution.
In 2017/18, 182 students were enrolled at the University of Suffolk through the Higher and Degree Apprenticeships programme, equivalent to 7% of all those starting degree apprenticeships nationally31. The degree apprenticeships that are currently offered at the University of Suffolk are:
• Assistant Practitioner Higher Apprenticeships;
• Chartered Manager Degree Apprenticeship;
• Digital and Technology Solutions Professional Degree Apprenticeship;
• Healthcare Assistant Practitioner Higher Apprenticeship;
• Adult and Mental Health Nurse Degree Apprenticeship.
The majority of the students, 69%, are enrolled on apprenticeships in the health
30 University of Suffolk (2017) Submission for the European Commission HR Excellence in Research Award 31 Office for Students (2018) Analysis of Degree Apprenticeships accessed at https://www.officeforstudents.org.uk/data-and-analysis/analysis-of-degree-apprenticeships/overall-findings/
55
sector, reflecting the University strong presence in this area and drive to attract, retain and grow talent in the sector in Suffolk. The Digital and Technology Degree Apprenticeship helps to support the local ICT (Information and communications technology) sector, including business such as BT, who see apprenticeships playing an increasing role in how they train and recruit staff.
The Apprenticeship Degree programme is expected to grow over time and in 2019, the University of Suffolk expects to start offering new apprenticeship degree programmes in the areas of Social Work; Police Officer; Cyber Security; and Level 7 Leadership and Management.
9.1.2 ‘Career Ready’ Graduates
The largest contribution that the University of Suffolk makes to the business community in Suffolk is through the graduates that leave the University every year, with the skills and experience to make a significant contribution to the organisations that they work for and increase their capacity to innovate and adapt. The value of this contribution is discussed in Section 7, however in addition to this the University aims to ‘add value’ by creating ‘career ready’ graduates.
In practice the focus on ‘career ready’ graduates means that throughout their time at the University, students will have the opportunity and be encouraged to work with different types of businesses in their field of study. These will range from start-ups to big multinationals and can include placements, mentoring and site visits. In addition to these organisations, the students are also encouraged to engage with wider societal issues, which will allow them to see how their chosen career or discipline area sits within the society in which they live.
By focusing on the wider career potential of the students and their transferrable skills, the University of Suffolk produces graduates that local companies and organisations want to employ. The University is seen as a serious and focused institution that has the needs of the local business community at its core. This reinforces the sense of ownership and involvement that the local business community has had in the University since its involvement and support in establishing a University presence in Suffolk.
9.1.3 Continued Professional Development (CPD)
The University of Suffolk also supports the human capital development of local business organisations through the provision of continued professional development courses (CPD).
CPD courses support businesses by improving the productivity of the staff who work for them. CPD is sometimes delivered through short courses which are specifically designed for professionals in a sector or occupation, which will be undertaken in tandem with working. Currently the University of Suffolk offers a number of these courses in areas such as accredited events safety training and health. Due to demographic breakdown of the student population at the University
56
of Suffolk many of the students who are studying part-time, while working or later on in their career could also be considered to be undertaking CPD.
The development of specific CPD and short courses for those currently in work is an area that the University of Suffolk aims to build on in the future.
9.2 Innovation Support
In its commitment to having a significant impact on the economy, the University has access to funding opportunities that support business collaboration. These include:
• Knowledge Transfer Partnerships (KTPs);
• Innovation Bridge (ERDF funded programme);
• KEEP+ (ERDF funded programme).
In addition, business support has also been supported through the Innovation Voucher Scheme which provided a significant opportunity to work with local SMEs (Small and medium-sized enterprises) in delivering projects focused on growth and has allowed the University to match the skills of graduates to the needs of local businesses. Although the scheme is no longer running at the University of Suffolk, during its time it resulted in a number of former students being offered permanent jobs with local businesses.
9.2.1 Knowledge Transfer Partnerships
The Knowledge Transfer Partnership (KTP) scheme helps businesses in the UK to innovate and grow by using academic and graduate expertise. It is a collaboration between three partners: a University Academic, a recent graduate or postgraduate and a company. The three partners work together to reach the objectives of a specific business project which is delivered by the recent graduate and is based within the business.
KTPs are a UK-wide programme, funded by Innovate UK. They can come from any sector or industry. The aim is to help businesses to improve innovation, competitiveness and productivity through better use of the knowledge, technology and skills available within universities and other parts of the UK knowledge base. KTPs can last from one to three years.
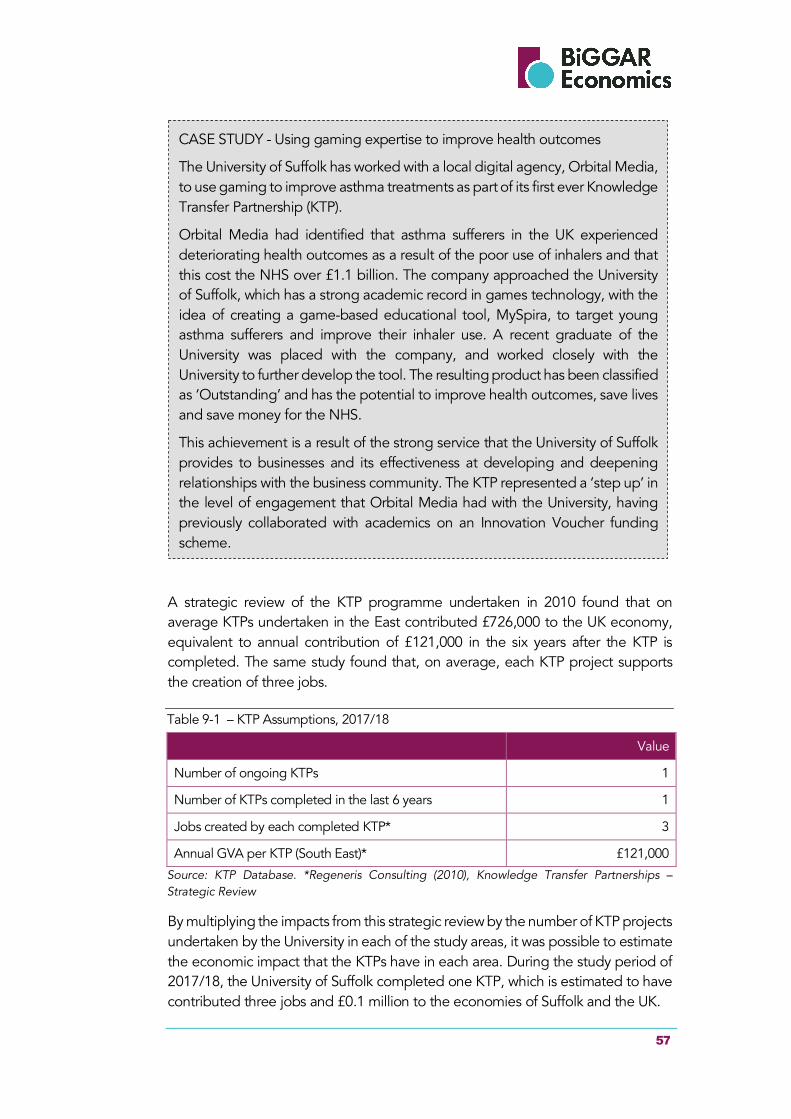
57
A strategic review of the KTP programme undertaken in 2010 found that on average KTPs undertaken in the East contributed £726,000 to the UK economy, equivalent to annual contribution of £121,000 in the six years after the KTP is completed. The same study found that, on average, each KTP project supports the creation of three jobs.
Table 9-1 – KTP Assumptions, 2017/18
Value
Number of ongoing KTPs 1
Number of KTPs completed in the last 6 years 1
Jobs created by each completed KTP* 3
Annual GVA per KTP (South East)* £121,000
Source: KTP Database. *Regeneris Consulting (2010), Knowledge Transfer Partnerships – Strategic Review
By multiplying the impacts from this strategic review by the number of KTP projects undertaken by the University in each of the study areas, it was possible to estimate the economic impact that the KTPs have in each area. During the study period of 2017/18, the University of Suffolk completed one KTP, which is estimated to have contributed three jobs and £0.1 million to the economies of Suffolk and the UK.
CASE STUDY - Using gaming expertise to improve health outcomes
The University of Suffolk has worked with a local digital agency, Orbital Media, to use gaming to improve asthma treatments as part of its first ever Knowledge Transfer Partnership (KTP).
Orbital Media had identified that asthma sufferers in the UK experienced deteriorating health outcomes as a result of the poor use of inhalers and that this cost the NHS over £1.1 billion. The company approached the University of Suffolk, which has a strong academic record in games technology, with the idea of creating a game-based educational tool, MySpira, to target young asthma sufferers and improve their inhaler use. A recent graduate of the University was placed with the company, and worked closely with the University to further develop the tool. The resulting product has been classified as ‘Outstanding’ and has the potential to improve health outcomes, save lives and save money for the NHS.
This achievement is a result of the strong service that the University of Suffolk provides to businesses and its effectiveness at developing and deepening relationships with the business community. The KTP represented a ‘step up’ in the level of engagement that Orbital Media had with the University, having previously collaborated with academics on an Innovation Voucher funding scheme.
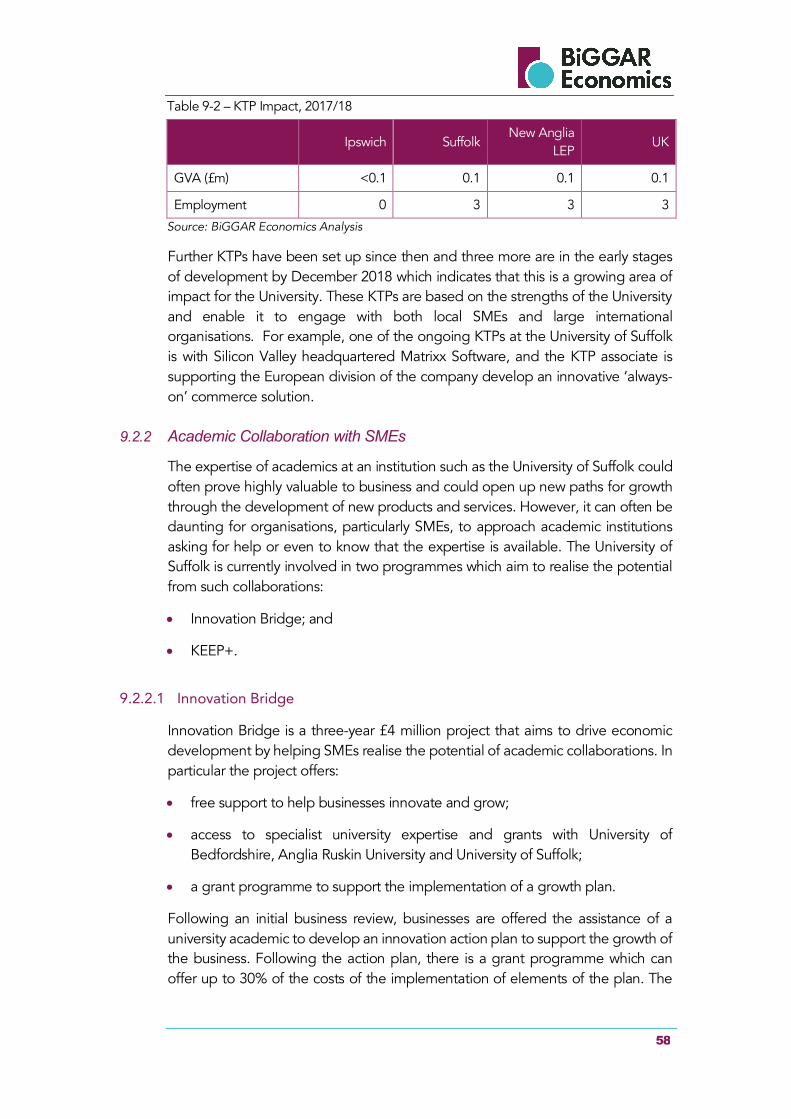
58
Table 9-2 – KTP Impact, 2017/18
Ipswich Suffolk
New Anglia LEP
UK
GVA (£m) <0.1 0.1 0.1 0.1
Employment 0 3 3 3
Source: BiGGAR Economics Analysis
Further KTPs have been set up since then and three more are in the early stages of development by December 2018 which indicates that this is a growing area of impact for the University. These KTPs are based on the strengths of the University and enable it to engage with both local SMEs and large international organisations. For example, one of the ongoing KTPs at the University of Suffolk is with Silicon Valley headquartered Matrixx Software, and the KTP associate is supporting the European division of the company develop an innovative ‘always-on’ commerce solution.
9.2.2 Academic Collaboration with SMEs
The expertise of academics at an institution such as the University of Suffolk could often prove highly valuable to business and could open up new paths for growth through the development of new products and services. However, it can often be daunting for organisations, particularly SMEs, to approach academic institutions asking for help or even to know that the expertise is available. The University of Suffolk is currently involved in two programmes which aim to realise the potential from such collaborations:
• Innovation Bridge; and
• KEEP+.
9.2.2.1 Innovation Bridge
Innovation Bridge is a three-year £4 million project that aims to drive economic development by helping SMEs realise the potential of academic collaborations. In particular the project offers:
• free support to help businesses innovate and grow;
• access to specialist university expertise and grants with University of Bedfordshire, Anglia Ruskin University and University of Suffolk;
• a grant programme to support the implementation of a growth plan.
Following an initial business review, businesses are offered the assistance of a university academic to develop an innovation action plan to support the growth of the business. Following the action plan, there is a grant programme which can offer up to 30% of the costs of the implementation of elements of the plan. The
59
future target is for the University to work with 35 businesses on innovation projects with further targets for grants and jobs.
9.2.2.2 KEEP+
The KEEP+ (Knowledge Exchange and Embedded Partnerships) programme is a project with similar aims to Innovation Bridge. It is a £9.3m European Regional Development Fund (ERDF) supported programme, which provides grants to support SMEs to access knowledge and expertise through collaboration with universities and research institutions.
It provides flexible opportunities for knowledge exchange with a focus on innovation to develop new products and services, increase profitability, reduce costs, provide opportunities to collaborate and access graduate talent.
A range of opportunities are available through the KEEP+ programme. Interventions can cover the following scenarios:
• Innovation Internships – a 12-week placement within a company enabling graduates to work in a role aligned with their qualification, and giving businesses access to the expertise needed to bring their products or services to market;
• Knowledge Exchange and Embed Partnerships (KEEPs) – a three-way collaboration between a business, a University and a graduate employee who will work with the business to achieve agreed goals (limited capital funding may also be available to support the approved collaborative activity); and
• Research and Innovation Collaborations (RICs) – a collaborative research and development activity for projects requiring more feasibility work and greater levels of research support than a KEEP (limited capital funding may also be available to support the approved collaborative activity).
This support has allowed local businesses to accelerate their growth plans and hire people earlier on in their development as it has provided the financial security needed to proceed with recruitment.
9.3 Community
9.3.1 Ipswich Waterfront Innovation Centre
The University of Suffolk also helps the local business community by providing the Ipswich Waterfront Innovation Centre (IWIC), which brings opportunities for companies to meet, network and collaborate.
The IWIC is located on the University of Suffolk’s campus and was established by the University in partnership with the LEP (Local Enterprise Partnership), Ipswich Borough Council, Suffolk County Council, and other economic stakeholders, to encourage entrepreneurialism, collaboration and ICT sector development.
60
The IWIC provides hot-desk facilities, networking, training and events opportunities for the local business community.
The co-location on the University’s campus brings industry closer to the academic expertise of the University of Suffolk, particularly in STEM (Science, Technology, Engineering and Mathematics) subject areas, Digital Creative, Leadership and Business Management. Local organisations and entrepreneurs are invited to become members of the IWIC. The IWIC grew significantly in 2018, from 13 members in December 2017 to 29 members by December 2018. Two of the members have a permanent base at the IWIC through their ‘home desks’, while others will use one of the 17 'hot desks’ that are available when they wish to work at the IWIC.
The IWIC creates employment by supporting the businesses it reaches and giving them the expertise and resources required to grow. In 2018, the first two companies to 'graduate' from the IWIC left after their success within the centre resulted in them growing too big for the space. By December 2018 the IWIC had generated 17 job full-time jobs and 2 part-time jobs in companies like this.
The IWIC was opened in 2016 and through the events and space that it offers it has started to have an impact on the local business community. As its membership and reach grows, the impact that the IWIC will have on the economy will also grow.
9.3.2 Events
The Business Engagement and Entrepreneurship Services team at the University provide enterprise skills development opportunities for staff, students, graduates and businesses in order to support the development of entrepreneurial effectiveness and entrepreneurial education across campus. They also run and host many networking events at the Ipswich Waterfront Innovation Centre (IWIC) for businesses and individuals to network with other businesses, students, academics and graduates. They also present and exhibit at events across the region and can deliver and facilitate events on behalf of businesses.
The University also hosts a series of business breakfasts, which are held every eight weeks throughout the academic year at the IWIC. They provide an opportunity to hear some unique insights into leadership, management, innovation and enterprise from academic staff across a variety of disciplines. They also present an opportunity to join the emergent enterprise network and offer advice on how engaging with a higher education provider can support business growth and enterprise.
The University also hosts the, free-to-attend, Women in Enterprise Speaker Series which showcases high-profile female entrepreneurs. As well as hearing from inspirational speakers, this series gives attendees an opportunity to develop their local network and hear about the wealth of opportunities to grow their business with the IWIC.
61
9.4 Consultations
The University of Suffolk provides support for industry through directly supporting human capital development, providing support for innovation and bringing together the business community. During the consultation exercise for this study, a series of interviews were carried out with senior staff at the University of Suffolk and with senior managers within local economic development agencies. Part of these discussions considered the role played by the University of Suffolk in supporting the local businesses sector. The themes which occurred during these discussions are summarised in Figure 9-2.
CASE STUDY – Local SME Engagement through Awards
The University of Suffolk is active in providing support and encouragement to local small businesses, as shown through the Suffolk BME Business Awards. These awards have been held at the University since 2016 and recognise the contribution that the hundreds of BME businesses in Suffolk have on the economy.
The Bangladeshi and Pakistani communities in the UK are most likely to be entrepreneurs with more than one in five reporting themselves as self-employed. The awards are co-organised with the local advocacy group, the Bangladeshi Support Centre.
In 2017 awards were given to seven entrepreneurs across the restaurant, pharmacy and personal services sectors. In addition to honouring their achievements, the awards also introduced BME entrepreneurs to the work that the University does and the programmes through which it could provide support.
Initiatives such as these lay the groundwork for new projects and enhance the University's reputation and visibility within the local business community. In time, this strong base will enable it to engage more companies and offer a wider range of services to the business community.
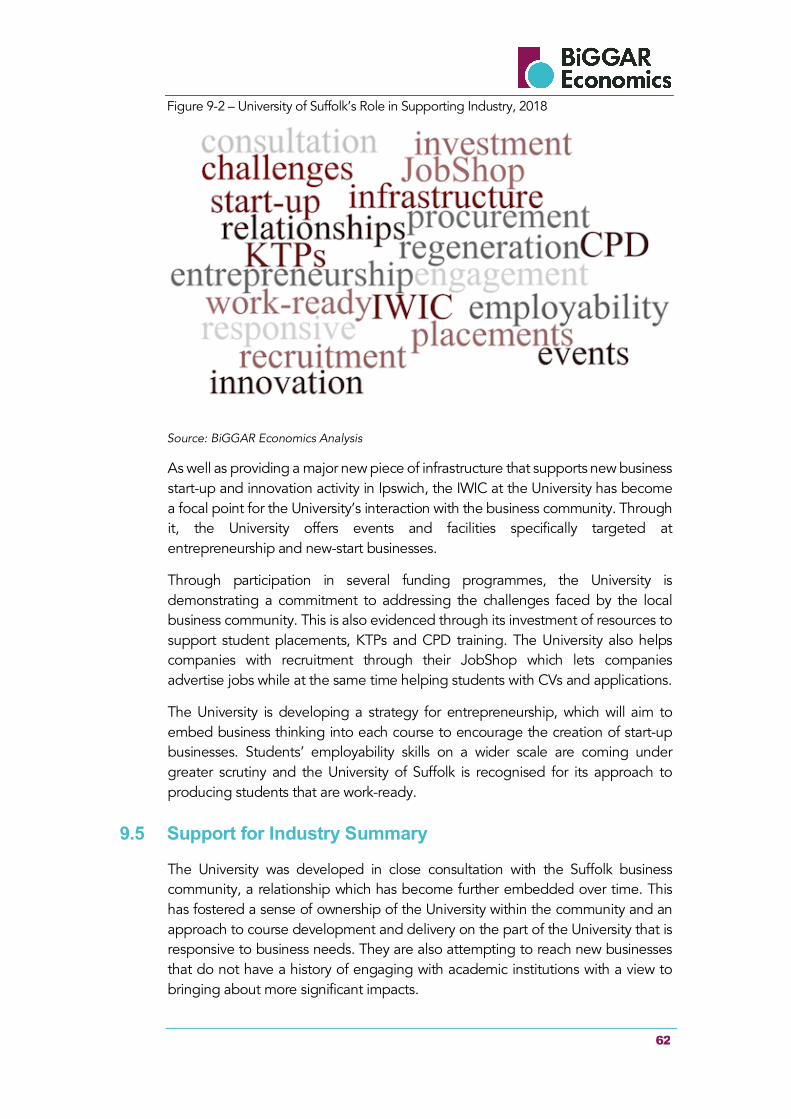
62
Figure 9-2 – University of Suffolk’s Role in Supporting Industry, 2018
Source: BiGGAR Economics Analysis
As well as providing a major new piece of infrastructure that supports new business start-up and innovation activity in Ipswich, the IWIC at the University has become a focal point for the University’s interaction with the business community. Through it, the University offers events and facilities specifically targeted at entrepreneurship and new-start businesses.
Through participation in several funding programmes, the University is demonstrating a commitment to addressing the challenges faced by the local business community. This is also evidenced through its investment of resources to support student placements, KTPs and CPD training. The University also helps companies with recruitment through their JobShop which lets companies advertise jobs while at the same time helping students with CVs and applications.
The University is developing a strategy for entrepreneurship, which will aim to embed business thinking into each course to encourage the creation of start-up businesses. Students’ employability skills on a wider scale are coming under greater scrutiny and the University of Suffolk is recognised for its approach to producing students that are work-ready.
9.5 Support for Industry Summary
The University was developed in close consultation with the Suffolk business community, a relationship which has become further embedded over time. This has fostered a sense of ownership of the University within the community and an approach to course development and delivery on the part of the University that is responsive to business needs. They are also attempting to reach new businesses that do not have a history of engaging with academic institutions with a view to bringing about more significant impacts.

63
The impacts, both those that can be quantified and those that cannot, have been growing and will continue to grow over time. The economic impacts to businesses associated with working with universities to drive innovation and skills development are often realised over a period of time, in the years after an interaction. In addition, the University of Suffolk is working to grow and develop the support that it offers to industry, which will further increase its impact in the community.
64
10 SUPPORT FOR TOWN/CULTURE
In terms of population, income and employment, Ipswich is one of the fastest growing city economies in the UK. Specifically,
• in the decade up to 2016, its population grew by around 20% which was over three times the rate of population growth across Suffolk (6%) and over twice the rate of population growth in the East of England region (9%)32;
• based on data for early 2018, Ipswich ranked fifth out of 46 cities in the UK for year-on-year growth in GVA income.33 The average GVA growth of the UK economy over the same time was 1.2%, while over the same period, GVA in Ipswich grew by 2.8%;
• employment in Ipswich grew by 0.5% in the year to Q2 201834.
The University of Suffolk is a catalyst for change within the Borough of Ipswich and the wider county of Suffolk. In addition to being involved in supporting a number of public bodies in the area, the University plays a key role in the future vision for the community and improves the cultural capital of the town.
10.1 Involvement on Public Bodies
The local community’s support was vital in developing the organisation from a College to a University Campus and finally a recognised University. This has generated a fundamental sense of community ownership, with a strong local ambition for the University to grow and succeed. It is also reflected in the Board of the University of Suffolk which contains members representing Ipswich Borough Council, Suffolk County Council and the New Anglia LEP.
This sense of community involvement is reciprocated by the University, which is heavily involved in public life across Suffolk. This includes guiding policy and providing support through membership of boards, groups and initiatives.
10.2 Driving Ambition
The University of Suffolk plays a central role in the ambition to develop the economy of the Borough of Ipswich, the County of Suffolk and beyond. This is reflected in the role identified for the University in the economic development strategies that relate to the area.
32 ONS, Mid-Year Population Estimates 2007 - 2016 33 Irwin Mitchell, November 2018, UK Powerhouse: The Brexit Economy 34 Ibid.
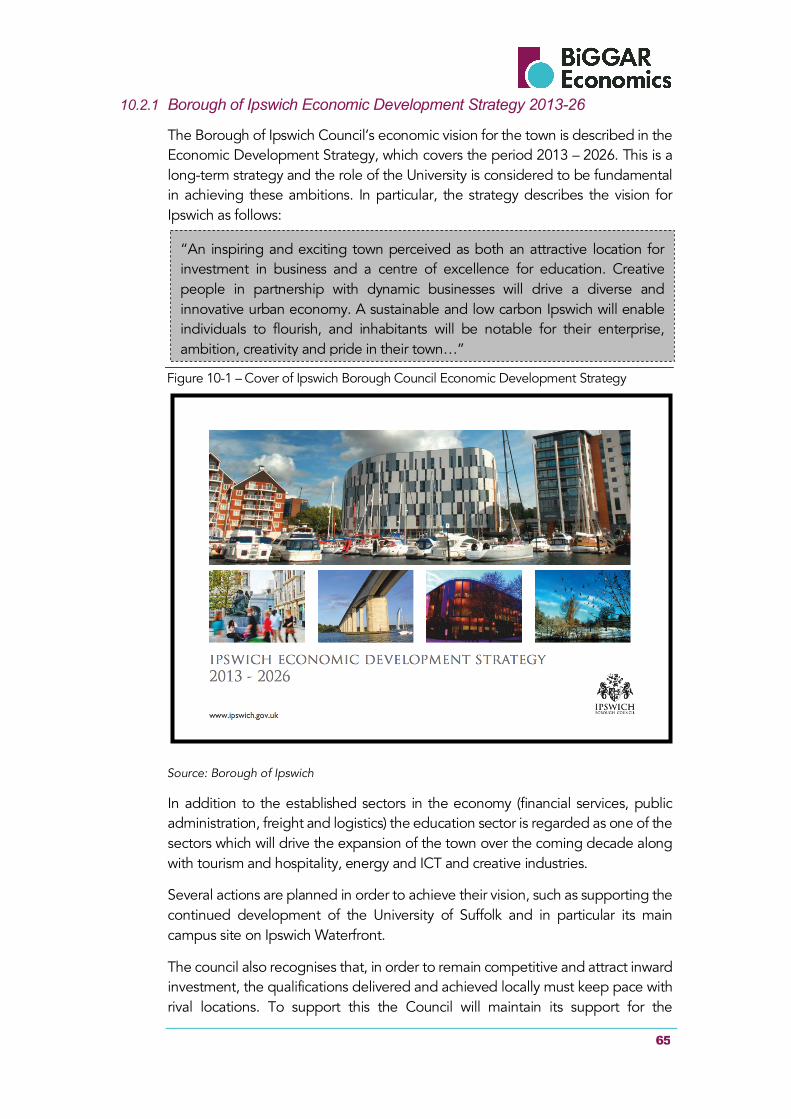
65
10.2.1 Borough of Ipswich Economic Development Strategy 2013-26
The Borough of Ipswich Council’s economic vision for the town is described in the Economic Development Strategy, which covers the period 2013 – 2026. This is a long-term strategy and the role of the University is considered to be fundamental in achieving these ambitions. In particular, the strategy describes the vision for Ipswich as follows:
Figure 10-1 – Cover of Ipswich Borough Council Economic Development Strategy
Source: Borough of Ipswich
In addition to the established sectors in the economy (financial services, public administration, freight and logistics) the education sector is regarded as one of the sectors which will drive the expansion of the town over the coming decade along with tourism and hospitality, energy and ICT and creative industries.
Several actions are planned in order to achieve their vision, such as supporting the continued development of the University of Suffolk and in particular its main campus site on Ipswich Waterfront.
The council also recognises that, in order to remain competitive and attract inward investment, the qualifications delivered and achieved locally must keep pace with rival locations. To support this the Council will maintain its support for the
“An inspiring and exciting town perceived as both an attractive location for investment in business and a centre of excellence for education. Creative people in partnership with dynamic businesses will drive a diverse and innovative urban economy. A sustainable and low carbon Ipswich will enable individuals to flourish, and inhabitants will be notable for their enterprise, ambition, creativity and pride in their town…”
66
expansion of higher-level qualifications and well as supporting the enhancement of the academic reputation of the University.
The Council’s continuing efforts to attract significant investment and capitalise on the unique appeal of the waterfront area are greatly supported by the transformational impact created by having the University’s Waterfront Campus in such a prominent position. The current Town Centre Master Plan covers a 15-year period ending in 2027. Part of this plan involves schemes to improve pedestrian links between the town centre and the Waterfront and to include an area/conferencing facility within the Education Quarter on the Waterfront.
10.2.2 Suffolk Growth Strategy
The Suffolk Growth Strategy details the current approach that local authorities in Suffolk have adopted to enable the growth of the county’s economy. It is structured around four main elements:
• strengthening the skills of the workforce and young people starting work;
• attracting inward investment and promoting enterprise
• focusing investment in the principal growth locations (including Greater Ipswich, Lowestoft and Great Yarmouth);
• improving transport, digital communications and other infrastructure.
The current strategy was drafted in 2013 and reported that Suffolk employers often cite low skills levels and the mismatch between supply and demand as a particular barrier to growth in the county. In this context it highlighted the potential offered by of the University Campus Suffolk (the forerunner to the University of Suffolk) as an economic driver for the region and an important part of the infrastructure for raising attainment and improving employability.
In addition to providing a catalyst for growth, as shown in the economic strategies, the University of Suffolk is also working with the Council to change the metrics that are used to measure success to reflect a more ambitious outlook. For example, the University is actively working with the Council to increase the level of aspiration in the town. Part of this has included changing what the Council had considered to be a ‘high value job’. ‘High Value’ jobs were initially seen as those which had a skills requirement of Level 3 qualifications, equivalent to A Levels.
10.2.3 New Anglia LEP Economic Strategy
The Local Enterprise Partnership (LEP) in the area is the New Anglia LEP which covers both Norfolk and Suffolk. The economic strategy for the LEP was published in 2017 and was agreed by businesses, local authorities, third sector organisations, colleges and universities, including the University of Suffolk.
The LEP economic strategy outlines the ambition for the area to be:
• the place where high growth businesses with aspirations chose to be;
67
• an international facing economy with high value exports;
• a high performing productive economy;
• a well-connected place;
• an inclusive economy with a highly skilled workforce;
• a centre for the UK's clean energy sector;
• a place with a clear, ambitious offer to the world.
The universities in the area will have a role to play in achieving each of these aims, however the strategy particularly highlights the role of the University of Suffolk in supporting the development of the ICT Innovation Hub at Adastral Park.
10.3 Cultural Events
The University of Suffolk helps to put Ipswich on the map by increasing the cultural offering of the town through hosting events. This includes events hosted by student societies and those organised by the University. In 2018, the University of Suffolk ran eight public lectures, on topics ranging from the history of refugees in Suffolk to the life and times of Cardinal Wolsey.
The University also host cultural events that are non-ticketed and engage with people who are in the vicinity of the University, such as the PhotoEast Festival.
CASE STUDY – Showcasing student art work
The University of Suffolk is able to attract renowned artists to Ipswich as part of the festivals and events that it holds, such as the PhotoEast Festival.
The PhotoEast Festival was launched in 2016 and showcased the art of the students of the University of Suffolk alongside that of world leading artists, such as Mark Power, Sian Davey and Matt Eich. The festival included exhibitions in public spaces, such as on the outside of buildings along the Waterfront, in galleries and within the Atrium of the University of Suffolk. The festival also included events for children, such as the Global Family trail, and collaborations with the internationally-acclaimed DanceEast.
By bringing art out into the streets, the PhotoEast Festival helped to showcase to residents the cultural capital within Ipswich and highlighted the role of the University in creating this. While the majority of the viewers were local people, the event also attracted visitors from further afield into Ipswich, who were attracted by the artists exhibiting and the individuals holding the events.
The 2018 PhotoEast Festival was the second time that the festival was run and it attracted a growing number of visitors and exhibitions. The PhotoEast Festival reported that the opening weekend saw 200 people an hour viewing the outdoor exhibitions along the waterfront.
68
10.4 Supporting the Tourism Economy
The University of Suffolk contributes to the tourism sector locally through course delivery and providing skilled staff to work in the sector and by attracting visitors and visitor expenditure as a result of:
• friends and family visiting students and staff;
• visitors to conferences and events held at the University of Suffolk;
• open day visits from applicants.
The value of the skills base is quantified and discussed in Chapter 7. This section focuses on the economic impacts associated with the visitors attracted.
10.4.1 Visiting Friends and Relatives
The University of Suffolk attracts additional visitors to the study areas discussed through visits to staff and students from friends and relatives (VFR). In 2017/18 there were 4,530 staff and students (headcount) at the University of Suffolk. These visitors spend money in the economy and this spending increases turnover in local businesses, which supports local employment in the tourism sector.
In order to assess this impact, it was first necessary to estimate the number of visits from friends and family that staff and students will receive. Tourism data from 2015, the most recent year for which detailed data exists, indicates that there were 0.68 UK VFR trips and 0.18 overseas VFR trips per head of population in Suffolk. This was applied to the total number of staff and students at the University of Suffolk living in each of the study areas in order to estimate the number of domestic and overseas VFR visits. Average expenditure per trip figures were then applied to estimate the expenditure of these visitors, using the assumptions in Table 10-1.
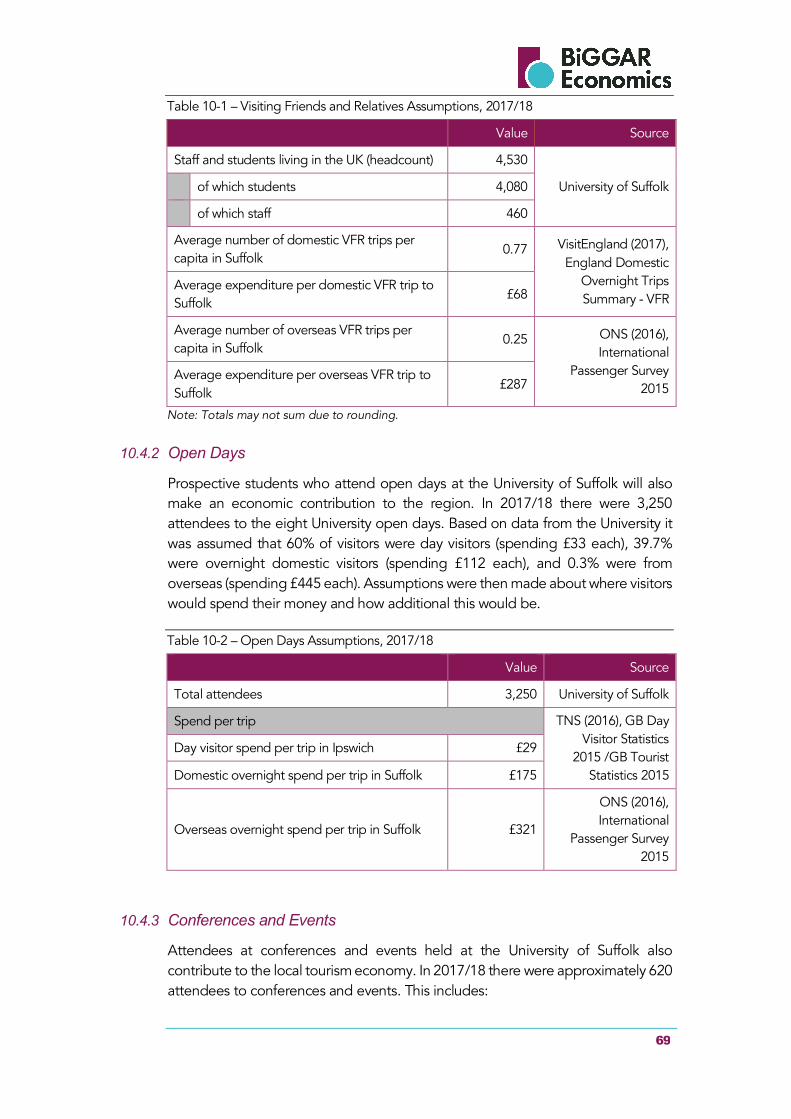
69
Table 10-1 – Visiting Friends and Relatives Assumptions, 2017/18
Value Source
Staff and students living in the UK (headcount) 4,530
University of Suffolk of which students 4,080
of which staff 460
Average number of domestic VFR trips per capita in Suffolk
0.77 VisitEngland (2017), England Domestic
Overnight Trips Summary - VFR
Average expenditure per domestic VFR trip to Suffolk
£68
Average number of overseas VFR trips per capita in Suffolk
0.25 ONS (2016), International
Passenger Survey 2015
Average expenditure per overseas VFR trip to Suffolk
£287
Note: Totals may not sum due to rounding.
10.4.2 Open Days
Prospective students who attend open days at the University of Suffolk will also make an economic contribution to the region. In 2017/18 there were 3,250 attendees to the eight University open days. Based on data from the University it was assumed that 60% of visitors were day visitors (spending £33 each), 39.7% were overnight domestic visitors (spending £112 each), and 0.3% were from overseas (spending £445 each). Assumptions were then made about where visitors would spend their money and how additional this would be.
Table 10-2 – Open Days Assumptions, 2017/18
Value Source
Total attendees 3,250 University of Suffolk
Spend per trip TNS (2016), GB Day Visitor Statistics
2015 /GB Tourist Statistics 2015
Day visitor spend per trip in Ipswich £29
Domestic overnight spend per trip in Suffolk £175
Overseas overnight spend per trip in Suffolk £321
ONS (2016), International
Passenger Survey 2015
10.4.3 Conferences and Events
Attendees at conferences and events held at the University of Suffolk also contribute to the local tourism economy. In 2017/18 there were approximately 620 attendees to conferences and events. This includes:
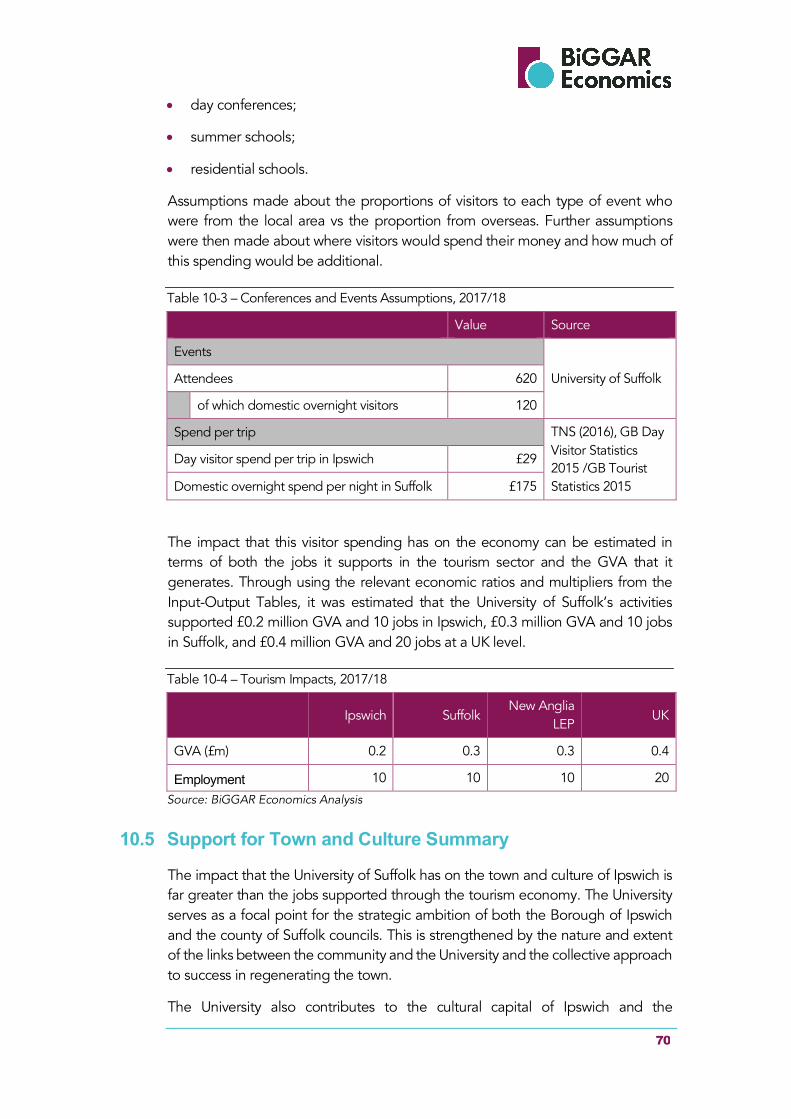
70
• day conferences;
• summer schools;
• residential schools.
Assumptions made about the proportions of visitors to each type of event who were from the local area vs the proportion from overseas. Further assumptions were then made about where visitors would spend their money and how much of this spending would be additional.
Table 10-3 – Conferences and Events Assumptions, 2017/18
Value Source
Events
University of Suffolk Attendees 620
of which domestic overnight visitors 120
Spend per trip TNS (2016), GB Day Visitor Statistics 2015 /GB Tourist Statistics 2015
Day visitor spend per trip in Ipswich £29
Domestic overnight spend per night in Suffolk £175
The impact that this visitor spending has on the economy can be estimated in terms of both the jobs it supports in the tourism sector and the GVA that it generates. Through using the relevant economic ratios and multipliers from the Input-Output Tables, it was estimated that the University of Suffolk’s activities supported £0.2 million GVA and 10 jobs in Ipswich, £0.3 million GVA and 10 jobs in Suffolk, and £0.4 million GVA and 20 jobs at a UK level.
Table 10-4 – Tourism Impacts, 2017/18
Ipswich Suffolk
New Anglia LEP
UK
GVA (£m) 0.2 0.3 0.3 0.4
Employment 10 10 10 20
Source: BiGGAR Economics Analysis
10.5 Support for Town and Culture Summary
The impact that the University of Suffolk has on the town and culture of Ipswich is far greater than the jobs supported through the tourism economy. The University serves as a focal point for the strategic ambition of both the Borough of Ipswich and the county of Suffolk councils. This is strengthened by the nature and extent of the links between the community and the University and the collective approach to success in regenerating the town.
The University also contributes to the cultural capital of Ipswich and the

71
attractiveness of the town through the events that it hosts and the art that it exhibits. These events have an economic impact as visitors spend money in the local tourism sector, but more importantly it supports the vibrancy of the town and showcases the works and benefits of the University to the wider public.
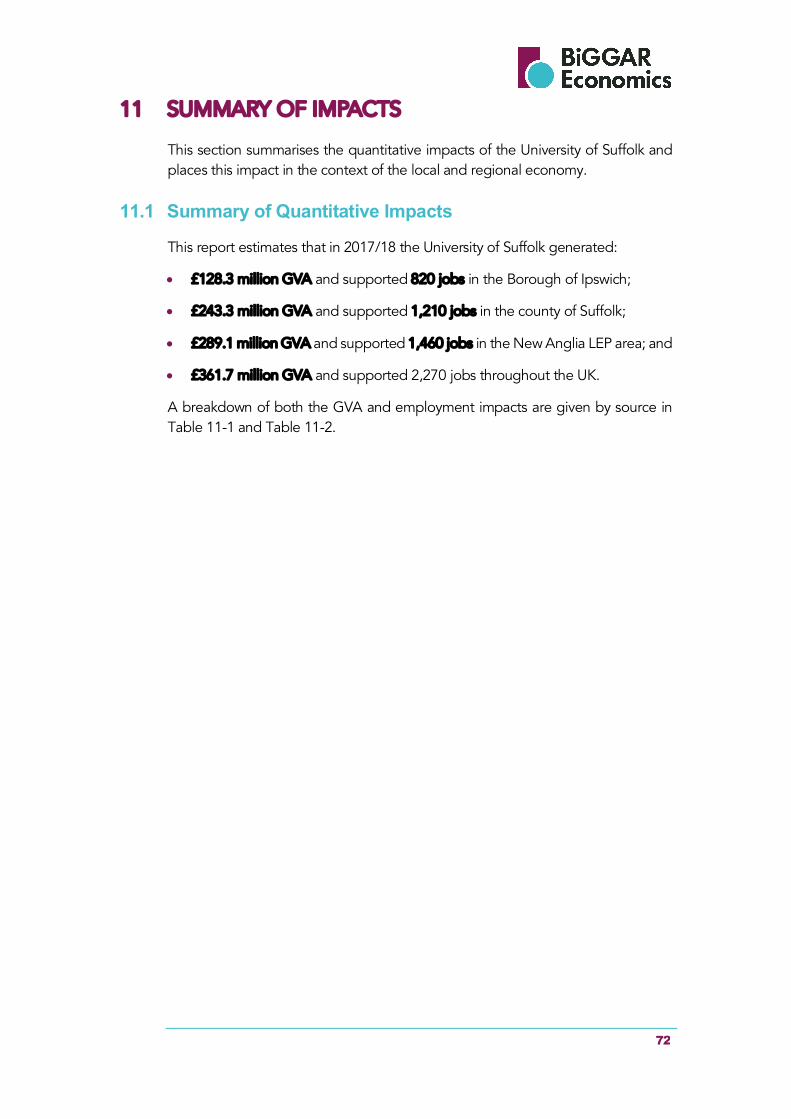
72
11 SUMMARY OF IMPACTS
This section summarises the quantitative impacts of the University of Suffolk and places this impact in the context of the local and regional economy.
11.1 Summary of Quantitative Impacts
This report estimates that in 2017/18 the University of Suffolk generated:
• £128.3 million GVA and supported 820 jobs in the Borough of Ipswich;
• £243.3 million GVA and supported 1,210 jobs in the county of Suffolk;
• £289.1 million GVA and supported 1,460 jobs in the New Anglia LEP area; and
• £361.7 million GVA and supported 2,270 jobs throughout the UK.
A breakdown of both the GVA and employment impacts are given by source in Table 11-1 and Table 11-2.
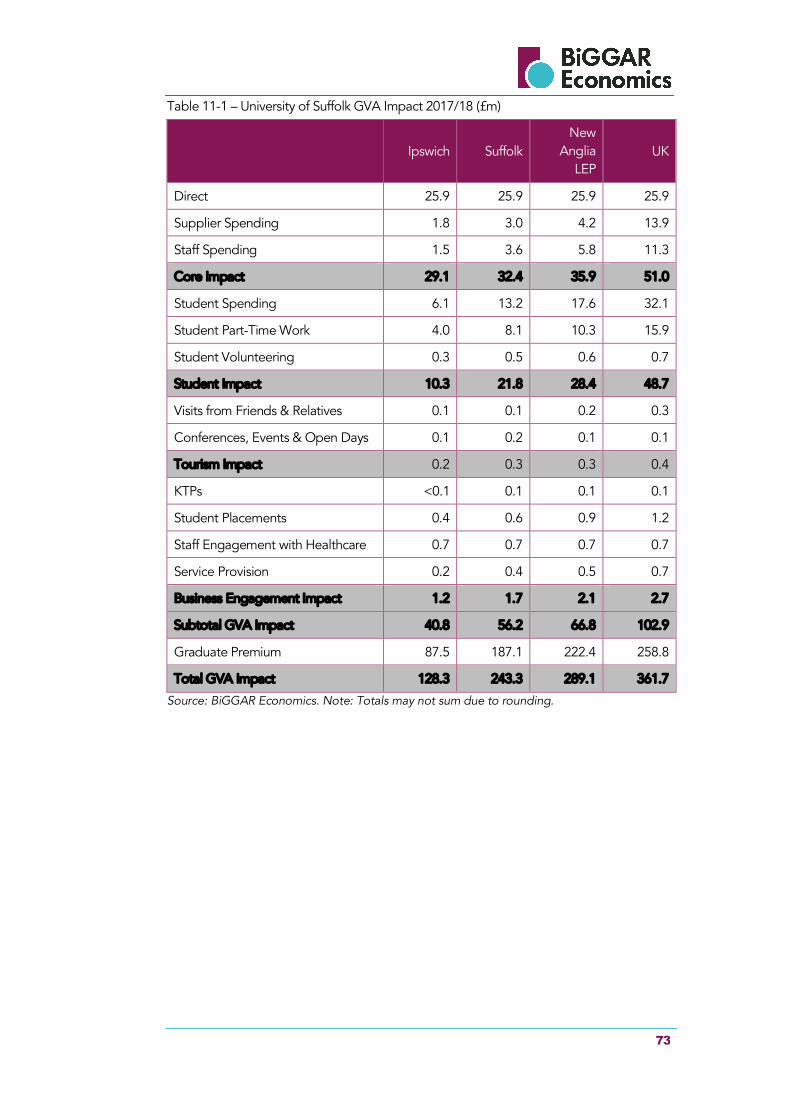
73
Table 11-1 – University of Suffolk GVA Impact 2017/18 (£m)
Ipswich Suffolk New
Anglia LEP
UK
Direct 25.9 25.9 25.9 25.9
Supplier Spending 1.8 3.0 4.2 13.9
Staff Spending 1.5 3.6 5.8 11.3
Core Impact 29.1 32.4 35.9 51.0
Student Spending 6.1 13.2 17.6 32.1
Student Part-Time Work 4.0 8.1 10.3 15.9
Student Volunteering 0.3 0.5 0.6 0.7
Student Impact 10.3 21.8 28.4 48.7
Visits from Friends & Relatives 0.1 0.1 0.2 0.3
Conferences, Events & Open Days 0.1 0.2 0.1 0.1
Tourism Impact 0.2 0.3 0.3 0.4
KTPs <0.1 0.1 0.1 0.1
Student Placements 0.4 0.6 0.9 1.2
Staff Engagement with Healthcare 0.7 0.7 0.7 0.7
Service Provision 0.2 0.4 0.5 0.7
Business Engagement Impact 1.2 1.7 2.1 2.7
Subtotal GVA Impact 40.8 56.2 66.8 102.9
Graduate Premium 87.5 187.1 222.4 258.8
Total GVA Impact 128.3 243.3 289.1 361.7
Source: BiGGAR Economics. Note: Totals may not sum due to rounding.
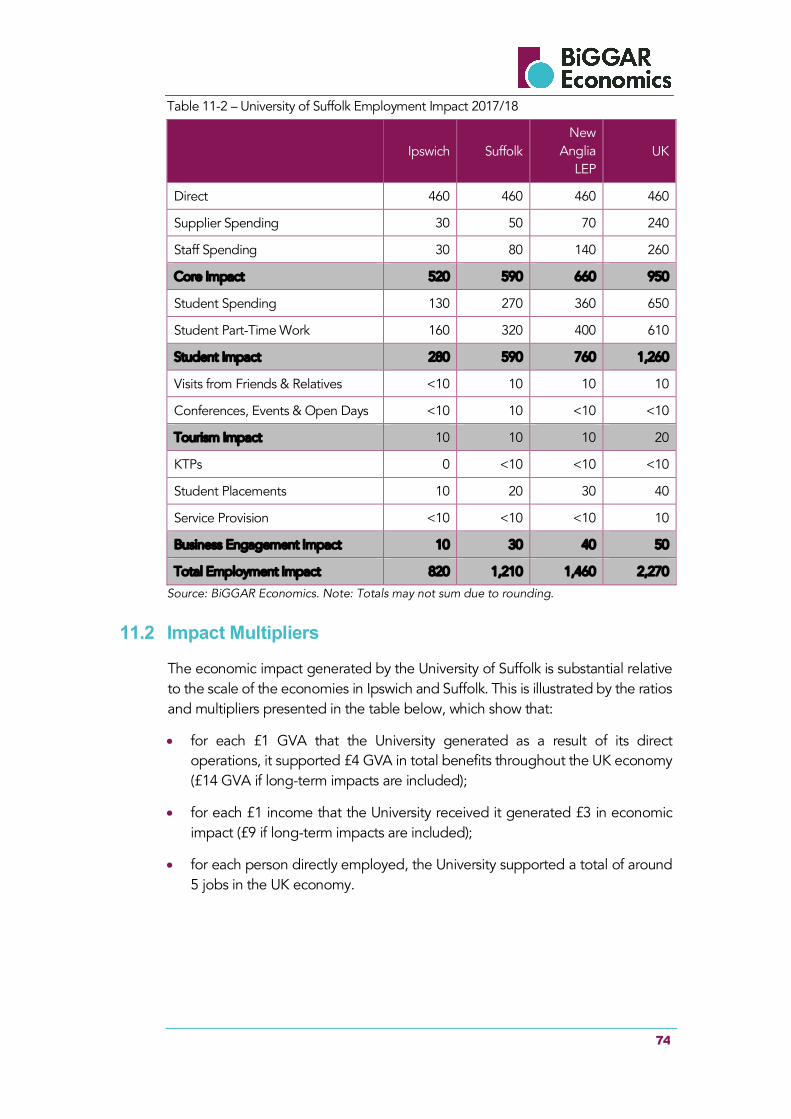
74
Table 11-2 – University of Suffolk Employment Impact 2017/18
Ipswich Suffolk New
Anglia LEP
UK
Direct 460 460 460 460
Supplier Spending 30 50 70 240
Staff Spending 30 80 140 260
Core Impact 520 590 660 950
Student Spending 130 270 360 650
Student Part-Time Work 160 320 400 610
Student Impact 280 590 760 1,260
Visits from Friends & Relatives <10 10 10 10
Conferences, Events & Open Days <10 10 <10 <10
Tourism Impact 10 10 10 20
KTPs 0 <10 <10 <10
Student Placements 10 20 30 40
Service Provision <10 <10 <10 10
Business Engagement Impact 10 30 40 50
Total Employment Impact 820 1,210 1,460 2,270
Source: BiGGAR Economics. Note: Totals may not sum due to rounding.
11.2 Impact Multipliers
The economic impact generated by the University of Suffolk is substantial relative to the scale of the economies in Ipswich and Suffolk. This is illustrated by the ratios and multipliers presented in the table below, which show that:
• for each £1 GVA that the University generated as a result of its direct operations, it supported £4 GVA in total benefits throughout the UK economy (£14 GVA if long-term impacts are included);
• for each £1 income that the University received it generated £3 in economic impact (£9 if long-term impacts are included);
• for each person directly employed, the University supported a total of around 5 jobs in the UK economy.
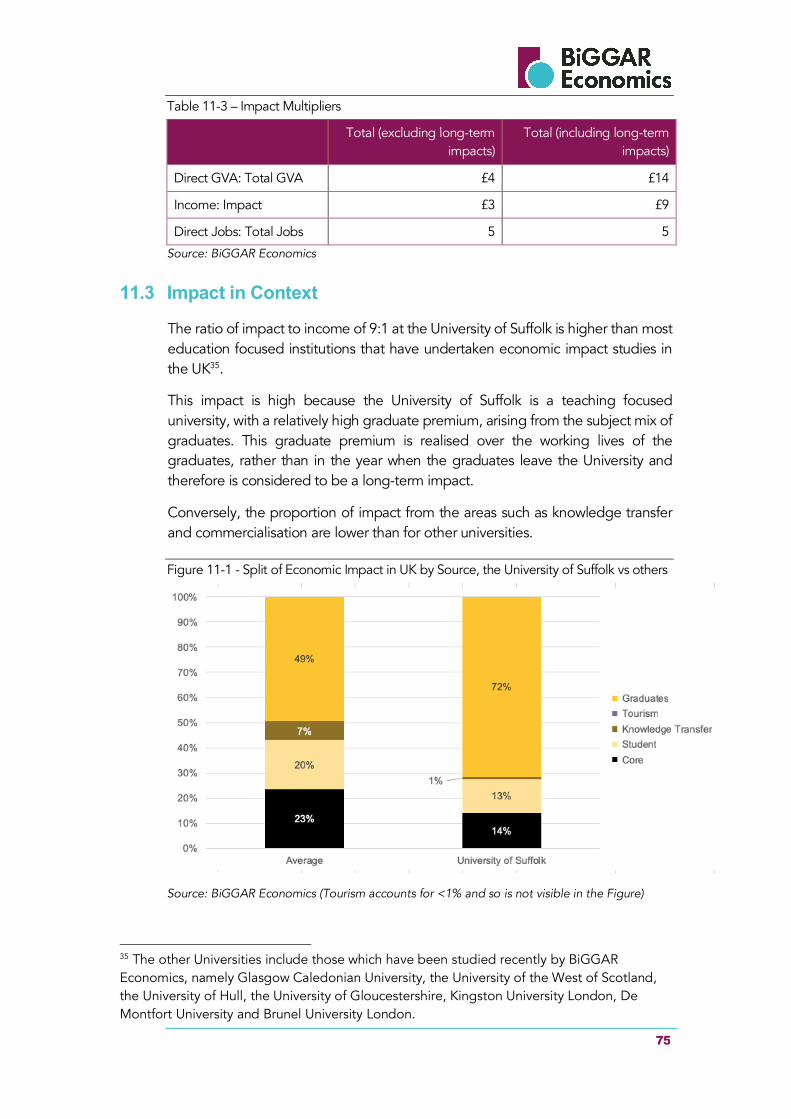
75
Table 11-3 – Impact Multipliers
Total (excluding long-term impacts)
Total (including long-term impacts)
Direct GVA: Total GVA £4 £14
Income: Impact £3 £9
Direct Jobs: Total Jobs 5 5
Source: BiGGAR Economics
11.3 Impact in Context
The ratio of impact to income of 9:1 at the University of Suffolk is higher than most education focused institutions that have undertaken economic impact studies in the UK35.
This impact is high because the University of Suffolk is a teaching focused university, with a relatively high graduate premium, arising from the subject mix of graduates. This graduate premium is realised over the working lives of the graduates, rather than in the year when the graduates leave the University and therefore is considered to be a long-term impact.
Conversely, the proportion of impact from the areas such as knowledge transfer and commercialisation are lower than for other universities.
Figure 11-1 - Split of Economic Impact in UK by Source, the University of Suffolk vs others
Source: BiGGAR Economics (Tourism accounts for <1% and so is not visible in the Figure)
35 The other Universities include those which have been studied recently by BiGGAR Economics, namely Glasgow Caledonian University, the University of the West of Scotland, the University of Hull, the University of Gloucestershire, Kingston University London, De Montfort University and Brunel University London.

76
As the University of Suffolk continues its development as an independent university, it would be expected that the impacts associated with research and knowledge transfer will account for a larger proportion of the overall economic impact. The impact to income ratio from these activities is likely to be lower than 9:1 and therefore in the future, the overall impact to income ratio of the University of Suffolk could to be lower. However, this would not be a matter for concern since the impacts from growth in research and knowledge transfer will be additional to teaching related impacts and will contribute to an overall increase in impact.
77
12 APPENDIX A: ABBREVIATIONS AND TERMS
This section contains a list of common abbreviations and terms used in this report.
Assumptions are the data upon which the economic contribution calculations are based.
CPD - Continued Professional Development. Mainly this relates to bespoke courses that are organised for working people (outside the University) and delivered by University staff.
FTE (or fte) – Full-Time Equivalent is a unit that measures employed persons or students in a way that makes them comparable although they may work or study a different number of hours per week. The unit is obtained by comparing an employee's or student's average number of hours worked to the average number of hours of a full-time worker or student. A full-time person is therefore counted as one FTE, while a part-time worker / student gets a score in proportion to the hours he or she works or studies. For example, a part-time worker employed for 20 hours a week where full-time work consists of 40 hours, is counted as 0.5 FTE.
GDP – Gross Domestic Product refers to the market value of all final goods and services produced within a country in a given period.
Gross Value Added (GVA) is a measure of the value that an organisation, company or industry adds to the economy through its operations. In the case of the University of Suffolk this is estimated by subtracting the non-staff operational expenditure (mainly represented by expenditure on goods and services) from their total income.
This report uses the production approach to measuring the GVA contribution, where the GVA is equal to the value of the service produced less the value of the inputs used. Typically, this is estimated by subtracting the non-labour (goods and services) costs of the organisation from the organisation’s total income.
Multipliers – every expenditure and employment impact has a multiplier effect throughout the economy. Multipliers are a numeric way of describing the secondary impacts that stem from a business, industry, service or organisation. For example, an employment multiplier of 1.8 suggests that for every 10 employees in Organisation A, 8 additional jobs would be created in other supplier industries such that 18 total jobs are supported by Organisation A.
Direct effect – this relates to the income and employees directly engaged by the University of Suffolk.
Indirect effect – this arises from the business-to-business transactions required to satisfy the direct effect. It is a second-round impact that would not occur were it not for the University of Suffolk and it relates to the businesses engaged in their supply chain for goods and services.
78
Induced effect – as a result of the direct and indirect effects the level of household income throughout the economy will increase as a result of increased employment. A proportion of this increased income will be re-spent on final goods and services, which is the induced effect
Multipliers differ between sectors and countries. Each country calculates their individual multipliers in the form of Input-Output tables which form part of the national accounts. The Input-Output tables are quantitative techniques that represent the interdependencies between different branches of a national economy. The multipliers used in this report have been calculated using both the Scottish and UK Input – Output Tables.
Spin-outs are companies that are created to commercialise an organisation's intellectual property; usually involving a licensing agreement and/or staff transfer.
Start-ups are businesses that are set up by the staff of an organisation and/or former students. Although such companies will draw on the experience acquired by the founders during their time at university, they have no formal intellectual property relationship with the University of Suffolk.
Turnover/employee is a ratio of the amount of turnover required to support one full-time equivalent job for one year. It varies by sector depending on the relative labour intensities of different industries e.g. agriculture is a relatively labour-intensive process compared to oil refining therefore the amount of turnover required to support an oil refining job is much higher than that required to support an agricultural job. The ratios used in this report are calculated from the data provided in the ONS Annual Business Survey.
Turnover/GVA is a ratio of the amount of turnover required to produce a certain amount of GVA in each sector. This relationship varies between sectors and countries.