Embed Size (px)
Citation preview

8/16/2019 Economic Impact Report- Illinois budget impasse
http://slidepdf.com/reader/full/economic-impact-report-illinois-budget-impasse 1/48
Human Services as an Economic Engine:How Human Services in Illinois Drive
Jobs and Economic Bene ts
HUMAN SERVICE
I L L I N O I S P A R T N E R S
for

8/16/2019 Economic Impact Report- Illinois budget impasse
http://slidepdf.com/reader/full/economic-impact-report-illinois-budget-impasse 2/48
May 2016Human Services as an Economic Engine:How Human Services in Illinois Drive Jobs and Economic Benefts
The Chicago Community Trust provided generous support for this report.
Rob Paral and Associates (www.robparal.com) developed the data in
this report on human service workers and establishments and the legisla ve district es mates.
Analysis of IMPLAN data was conducted by the Public Policy Center at UMass Dartmouth,
David R. Borges, MPA, Director of Research and Michael Goodman, Ph.D., Execu ve Director.
The report was wri en by James Lewis.
Judith Gethner is Execu ve Director of Illinois Partners for Human Service.
Acknowledgments
8/16/2019 Economic Impact Report- Illinois budget impasse
http://slidepdf.com/reader/full/economic-impact-report-illinois-budget-impasse 3/48
May 2016Human Services as an Economic Engine:How Human Services in Illinois Drive Jobs and Economic Benefts
Dear Reader:
As a coali on of over 850 community organiza ons, Illinois Partners for Human Service understands thathuman services are the pillars that uphold healthy, vibrant communi es. Not only do they strengthen
individual and community well-being - they drive economic produc vity as well. However, past budgets havenot re ected the immense bene ts that service providers bring to the State. Years of budget cuts have erodedthe human services infrastructure, making it increasingly di cult for providers to keep pace with growingdemand. The well-being of people who have not received enough support can be threatened when they donot have community resources and the opportuni es that they need to thrive.
To curb this alarming trend, we knew that rigorous, evidence-based research was necessary to demonstratethe economic value of human services in Illinois. In par cular, we wanted to inves gate the quan ta veimpact of the human services sector on the State’s economy collec vely, as well as in each individuallegisla ve district. We also recognized gaps in understanding around the socioeconomic pro le and scalcontribu on of human service workers themselves, and knew that our advocacy e orts would bene t fromconcrete data analysis on these topics.
In 2015, we commissioned a research ini a ve designed to address these issues, and we are now proud topresent the result of our e orts - Human Services as an Economic Engine: How Human Services in IllinoisDrive Jobs and Economic Bene ts . Rather than highlight the incredible work of professionals in this sector, thisreport examines the lesser known but important role that the sector’s payroll and employee spending playsin job crea on and as a driver of economic growth in other sectors. Evidence suggests that human servicesmake a major economic contribu on to Illinois, yet those employed in the sector by nonpro t organiza onsremain some of the most underpaid - albeit highly educated - workers in the State. In the context of thecurrent budget impasse, a history of consistent cuts, and at and declining reimbursement rates, these
ndings underscore the pressing need to allocate su cient funding to human services, which do so much toensure that everyone can fully contribute to their communi es.
On behalf of Illinois Partners for Human Service, we sincerely hope that this report helps inform the discourseon human services in Illinois and encourages engagement in seeking solu ons that rea rm the State’scommitment to and investment in well-being for all its residents.
All the best,
Jim Runyon,Chair, Board of Directors
Judith Gethner,Execu ve Director

8/16/2019 Economic Impact Report- Illinois budget impasse
http://slidepdf.com/reader/full/economic-impact-report-illinois-budget-impasse 4/48
1 May 2016Human Services as an Economic Engine:How Human Services in Illinois Drive Jobs and Economic Benefts
Table of Contents
Execu ve Summary ................................................................................................................ 2
Introduc on ............................................................................................................................ 3
Human Services: Economic Impact ....................................................................................... 7
Human Service Workers Create an Es mated $4.5 Billion Economic Impact Annually ... 7
Human Service Workers Are Responsible for $598 Million in State andLocal Tax Payments Annually ........................................................................................... 8
Human Service Establishments ............................................................................................. 9
The Percent of Human Service Establishments That Are SmallIs About the Same as for Any Other Industry ................................................................... 9
Human Service Establishments Are Found Across the State .......................................... 12Human Service Workers ...................................................................................................... 20
There Are Approximately 169,000 Human Service Workers in Illinois ........................... 20
Many Human Service Workers Are Highly Educated but Work for Low Wages ............. 25
Even Human Service Workers with College Degrees Earn Low Wages .......................... 27
Many Human Service Workers Earn Poverty-Level Wages .............................................. 28
Human Service Workers Create Tens of Millions of Dollars of Economic Impact inIndividual Legisla ve Districts ........................................................................................ 29
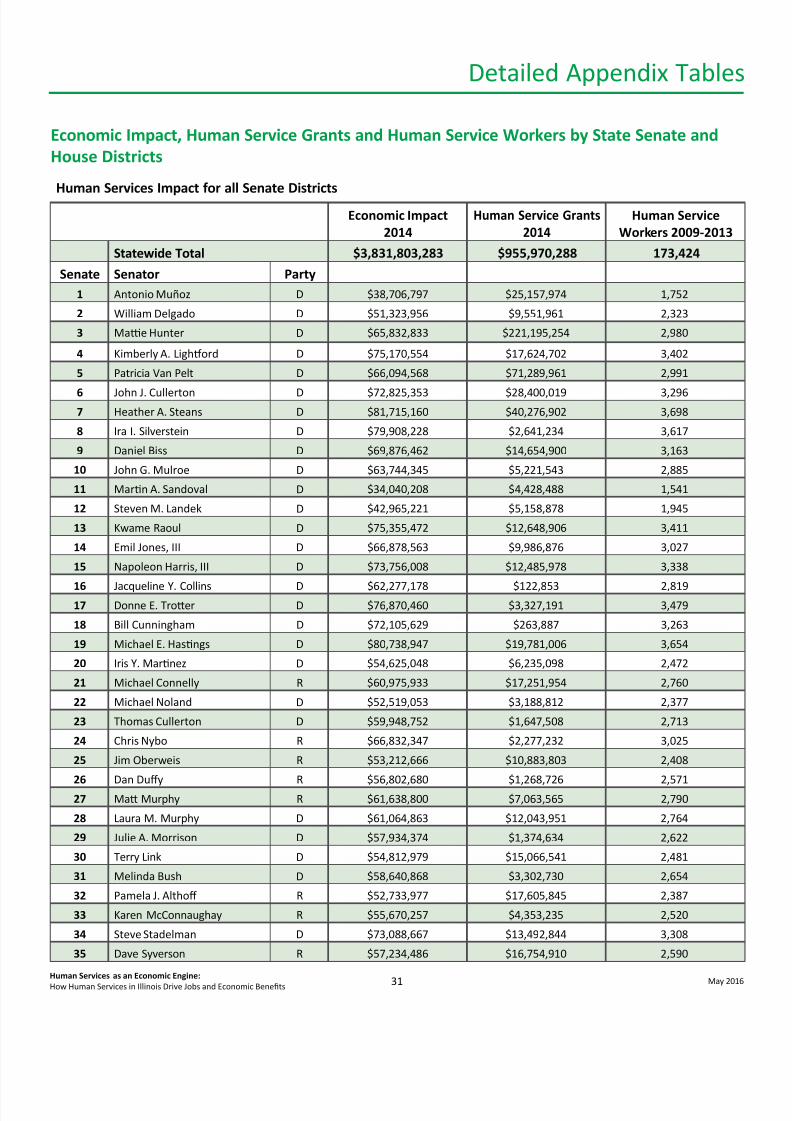
Detailed Appendix Tables .................................................................................................... 31
Economic Impact, Human Service Grants and Human Service Workers by State Senateand House Districts ........................................................................................................ 31
Types of Human Service Establishments by County ....................................................... 36
Methodology ....................................................................................................................... 39
Economic Impact ............................................................................................................ 39
Number of Human Service Workers .............................................................................. 39
Es ma ng Wages per Hour ............................................................................................ 40
De ning Human Service Establishments ........................................................................ 40
Es mates of Economic Impact by Legisla ve District .................................................... 41
Es ma ng Human Service Grants by Legisla ve District ............................................... 41
Appendix ............................................................................................................................... 42

8/16/2019 Economic Impact Report- Illinois budget impasse
http://slidepdf.com/reader/full/economic-impact-report-illinois-budget-impasse 5/48
2 May 2016Human Services as an Economic Engine:How Human Services in Illinois Drive Jobs and Economic Benefts
Execu ve Summary
• Human services make a major economic contribu on to Illinois. Econometric modelling of IMPLAN data conductedby the Public Policy Center of the University of Massachuse s at Dartmouth nds that income of Illinois human serviceworkers generates approximately $3.1 billion in direct spending and $1.4 billion in induced spending per year for atotal annual economic impact of $4.5 billion.
This economic ac vity generates approximately $597 million in state and local taxes annually.
• The human services industry looksabout like any other industry in termsof the percent of establishments thatare “small businesses.”
It has no fewer large establishments(over 500 employees) than do otherindustries and the overall pro le of thesizes of its establishments is similar tothat of retail, manufacturing, or hotel
and food services.
• Human service providers address needsstatewide, not just in the Chicago area .Human services are found in all coun esacross the state. The least amount ofservice per low-income person is found inthe Chicago area, while establishment topoverty ra os are lowest in rural Illinois.
Government grants suppor ng human services are distributed across the state with the lowest grants per capita foundin predominantly La no areas of Chicago and in southern and western Chicago suburbs.
• Human service workers are a signi cant por on of the Illinois workforce. Illinois has approximately 169,000 humanservice workers. These workers make up about 3.5 percent of the Illinois workforce. The highest concentra ons ofhuman service workers – measured as the total number of human service workers divided by the total workforce in agiven area – are found in rural Illinois, while the lowest concentra ons are found in urban areas and northeast Illinois.
• Human service workers are not highly paid, de nitely not over-paid, and many live in poverty. Workers in the humanservices industry are among the most educated workers in Illinois industries, but are among the lowest paid. Themedian hourly wage for human service workers is $12.25, compared to $19.61 for all workers. Human service workerswith college degrees have a median hourly wage of $16.61 compared to the median wage for all workers with degreesof $26.14 per hour.
Human service workers are more likely to live in poverty than are workers in other industries. Twenty percent of
human service workers earn less than 138 percent of the poverty line.• Human service workers create tens of millions of dollars of economic impact in individual legisla ve districts.
Human service workers create over $75 million in economic impact in ten state Senate districts. Human service grantsexceeded $25 million in eight state Senate districts in 2014. Six state Senate districts have more than 3,500 humanservice workers. Many of these districts are found in the Chicago suburbs and downstate.

8/16/2019 Economic Impact Report- Illinois budget impasse
http://slidepdf.com/reader/full/economic-impact-report-illinois-budget-impasse 6/48
3 May 2016Human Services as an Economic Engine:How Human Services in Illinois Drive Jobs and Economic Benefts
Introduc on
Provision of human services in Illinois is an industryfundamentally like any other industry opera ng in Illinois.
The human services industry comprises the organiza ons
and people who provide assistance to seniors, operate a er-school programs, help people reduce drug dependency,provide assistance to the disabled, facilitate adop ons,operate shelters for the homeless, collect and distributefood to people without food, and perform thousands ofother tasks that promote community well-being.
Some of these func ons may be provided by for-pro tcorpora ons, par cularly in child care, behavioral health andother areas of healthcare, but the vast majority of services aredelivered by personnel working for non-pro t organiza ons.
Non-pro t organiza ons are dis nguishable from for-pro ts by their corporate form but in most respects theyfunc on the same way that other businesses do. Theyare compensated for services rendered by governments,corporate, private and public philanthropic en es, by
individual donors, or by individuals who pay fees fortheir services in the same way that private corpora onsare compensated by the customers who purchase theirproducts – be they individuals, other businesses orgovernment. The major di erence between non-pro tsand for-pro ts is that in many non-pro t contexts, theimmediate consumers of the service are unable topay a signi cant por on of the cost of the service theyreceive. Instead, service fees are paid on their behalf, bygovernment who is responsible for the collec ve good, by
philanthropy and by individual donors who care about thewell-being of their less fortunate neighbors.
Whereas publicly held companies are required to act in
the best interests of their shareholders, or owners, not-for-pro ts are required to act in the best interest of theirmission. In a legal sense, non-pro ts are accountableto the broader public whose interests they serve.Consequently, they do not pay taxes on the incomethey receive, mostly in the form of government grantsand contracts, nor on contribu ons from individual andorganiza onal donors, and in many cases are exempt fromsales taxes.
A common refrain heard whenever the future of non-pro ts and human services is discussed is that non-
pro ts need to learn to act more like businesses. Butthe reality is that they already do. They have CEOsand boards of directors. They have budgets and u lizedebt to fund opera ons or construc on. Many of theiremployees bargain collec vely. They seek e cienciesand increase and decrease their workforces. They worryover customer service. They undergo annual audits andfollow government rules regarding whistleblowing andtransparency, just like for-pro t organiza ons. They worryover red ink. Employees of non-pro ts get raises – orsalary cuts – based on the organiza on’s ability to generateincome, which in turn is based on sa sfac on with anddemand for the services they provide, as well as theavailability of resources to purchase their services.
Perhaps because much of the human services industryhas its history in religious ins tu ons and ethnic self-helporganiza ons, or perhaps because so much of its incomeis based on contribu ons or dona ons from individuals ororganiza ons like United Way, it is usually not thought ofas an industry in the same sense that other “industries”may be. As data in this report shows, the human servicesindustry is no di erent from manufacturing or the
entertainment industry. Ci es and states should be asconcerned with development of their human servicesinfrastructure as they would be with support fromany other industry. A mayor, a chamber of commerce,or someone running for o ce, would not hesitate tomake the case that his or her city should develop itstourism industry or its transporta on infrastructure. TheCity of Chicago has in its recent history convened taskforces to advance the futures of steel and of apparel.Metropolis 2020 developed reports on how to develop
“A common refrain heard whenever
the future of non-prots and humanservices is discussed is that non-
prots need to learn to act more
like businesses. But the reality is
that they already do.”

8/16/2019 Economic Impact Report- Illinois budget impasse
http://slidepdf.com/reader/full/economic-impact-report-illinois-budget-impasse 7/48
4 May 2016Human Services as an Economic Engine:How Human Services in Illinois Drive Jobs and Economic Benefts
transporta on and logis cs, and World Business Chicagorecently ini ated its One Thousand Jobs campaign toboost manufacturing – all industrial ini a ves in the nameof economic development. Universi es and, to a lesserdegree, hospital systems, which are generally non-pro t,are widely considered engines of economic development,in part because of the research and business spin-o s, butalso in large measure because of the number of peoplethey employ and their contribu on to the region’s qualityof life. As this report documents, the human servicesindustry has economic func ons and characteris cs similarto those of most other industries, and business leaders,government, and community residents should be equallyconcerned about its health.
Human service providers may be downplayed as anindustry because they rely on government for a signi cantpart of their revenue. But so, too, do other industries thatare considered vital to the economy. Just as the public“purchases” services from its social service providers, so it
does from federal defense contractors like Boeing, LockheedMar n, Northrop Grumman, General Dynamics andother major corpora ons. Road builders and construc oncompanies depend heavily on income from projects paidfor by state and local government. Military bases havebeen notoriously hard to close or relocate because of theeconomic bene t to their neighboring communi es.
Human service providers’ work with children, the disabled,seniors, young mothers and others in need is every bitas important as the work of defense contractors, roadbuilders and college professors. And they are part of
an industry that ma ers to the economic health of thehundreds of Illinois towns and ci es where they operate just as much as are defense contracts, construc oncompanies and colleges.
It’s an Industry Everyone Values
Most people want to live in a community with goodschools even if they don’t themselves have children inschool. Most people don’t want to be surrounded by sickpeople even if they are not sick themselves. Most peoplethink adop ons of orphaned children are a good thing,don’t want people sleeping on the streets, and wantpeople to grow old with dignity.
So human services are an important industry, bothna onally and in Illinois, and we need to recognize thatthe industry is as signi cant as any other. Human serviceworkers earn and spend their wages with local businesses.Human service workers and their clients have enormouspoten al to vote. The following report demonstratesthat the Illinois human services sector employs more
people than many other industrial sectors and generatesa signi cant por on of economic ac vity in the state. Andbecause human service providers are as likely to be locatedin low-income communi es as in wealthier communi es,their rela ve contribu on to local economies is signi cant.
Human Services Operate the Way PeopleThink Industries Should Operate
With the excep on of a few hospital execu ves, top-endsalaries and compensa on of health and human servicesmanagement is far lower than top-end compensa on inother industries. Most human service providers operateextraordinarily e ciently, some mes even sacri cingadministra ve sta and infrastructure in order to providemore services. The media reports on failures of child-welfare providers or other services from me to me,but these are organiza ons opera ng on bare-bonesbudgets with minimum wage employees and over-burdened supervisors, and for many services, actuallylosing money on every contract they take on because statereimbursement rates for services have stagnated in many
elds. Successful non-pro ts o en retain less cash thando for-pro ts and because of Illinois state government’shistory of delinquent payments, they have less access tocapital markets for nancing.
Why Now?
The economic value of the human services sector isunderappreciated. Maybe because human serviceproviders don’t adver se much? Maybe because manytypes of providers are in the business of reducing, ratherthan increasing, their number of customers? Maybebecause the role of government in producing a humaneand stable society is under-appreciated? Maybe becausethey work with people rather than consumer items?
This report is wri en at a me unlike any other in thehistory of human services provision in Illinois. Illinois is

8/16/2019 Economic Impact Report- Illinois budget impasse
http://slidepdf.com/reader/full/economic-impact-report-illinois-budget-impasse 8/48
5 May 2016Human Services as an Economic Engine:How Human Services in Illinois Drive Jobs and Economic Benefts
in an unprecedented posi on of having passed no statebudget almost at the end of the scal year. Since theRecession, providers have endured years of late paymentsof reimbursements owed to them by state government,service reimbursement rates have not been increasedwith the cost of living, and many service areas of thesector have su ered signi cant cuts in the number andsize of state contracts. Consequently, the me has come todocument not only the human and social value of the workperformed by Illinois human service providers, but also thesector’s economic value.
What Are Human Services?
For the purpose of this report, human services areconsidered the wide variety of occupa ons whose workerssupport the basic well-being of people beyond primaryhealthcare, and do not work directly for government. Theyare occupa ons that by history and tradi on are generallyprovided by non-pro t rather than for-pro t providers.
This report describes the economic value of the providersof a vital industry about which too li le is known.
There is no single, universally used de ni on of humanservices. The types of human service establishmentsincluded in this report are based on de ni ons used bythe Massachuse s Council of Human Service Providers,Inc. in their report Beyond Social Value: The EconomicImpact of the Human Services Sector .1 Some may preferthat some industries that were excluded be included, orvice-versa. For example, one might argue for includinglong-term-care facili es for seniors, but we exclude them(as did the Massachuse s Council) because they include askilled-care, medical component that places them closer tohospitals and medical clinics than to many other types ofresiden al facili es. 2 Other public reports have joined thehuman services included in this report with the full rangeof healthcare workers.
Human service establishments in this report are bothnon-pro t and for-pro t (but not governmental) en esthat are described in the following categories thatcorrespond to the federal government’s North American
Industry Classi ca on System, which is also used by theUnited States Census. A complete list of speci c types ofhuman service organiza ons may be found in an appendixto this report.
Outpa ent Mental Health and Substance Abuse Centers
Examples:
• Alcoholism treatment centers and clinics (excepthospitals), outpa ent
• Detoxi ca on centers and clinics (except hospitals),outpa ent
• Drug addic on treatment centers and clinics (excepthospitals), outpa ent
• Mental health centers and clinics (except hospitals),outpa ent
• Substance abuse treatment centers and clinics(except hospitals), outpa ent
1 h p://providers.org/reports/entry/beyond-social-value-the-economic-impact-of-the-human-services-sector2 Note that other services for older adults and people with disabili es fall under Individual and Family Services.

8/16/2019 Economic Impact Report- Illinois budget impasse
http://slidepdf.com/reader/full/economic-impact-report-illinois-budget-impasse 9/48
6 May 2016Human Services as an Economic Engine:How Human Services in Illinois Drive Jobs and Economic Benefts
Residen al Intellectual and Developmental Disability, Mental Health,and Substance Abuse Facili es
Examples:
• Group homes, intellectual and developmental disability
• Intermediate care facili es, intellectual and developmental disability
• Alcoholism rehabilita on facili es (except licensed hospitals),residen al
• Halfway houses for pa ents with mental health illnesses • Substance abuse facili es, residen al
Individual and Family Services
Examples:
• Adop on agencies
• Foster home placement services
• Senior ci zens’ centers
• Alcoholism and drug addic on self-help organiza ons
• Welfare service centers, mul -programCommunity Food, Housing, Emergency orOther Relief Services
Examples:
• Community meals, social services
• Food banks
• Soup kitchens
• Shelters, temporary (e.g., ba ered women’s, homeless,runaway youth)
• Shelters for vic ms of domes c or interna onal disasters orcon icts, emergency
Voca onal Rehabilita on Services
Examples:
• Habilita on job counseling and training, voca onal
• Job counseling, voca onal rehabilita on or habilita on
• Job training, voca onal rehabilita on or habilita on
• Rehabilita on job counseling and training, voca onal
• Sheltered workshops (i.e., work experience centers)
Child Care Services
Examples:
• Babysi ng services in provider’s own home, child day care
• Child day care, before or a er school, separate from schools
• Head start programs, separate from schools
• Nursery schools
• Pre-kindergarten centers (except part of elementary school system)

8/16/2019 Economic Impact Report- Illinois budget impasse
http://slidepdf.com/reader/full/economic-impact-report-illinois-budget-impasse 10/48
7 May 2016Human Services as an Economic Engine:How Human Services in Illinois Drive Jobs and Economic Benefts
Human Services: Economic Impact
The contribu ons of the Illinois human services industryextend well beyond the substan al social value theycontribute; the industry employees create a large amountof economic ac vity as well.
As there are no su ciently detaileddata describing how the industryspends its non-payroll relatedrevenue (including the costsassociated with doing business,such as rent and u li es, capitalexpenses, contracts for services,employee health insurance, etc.),the es mates of economic impactthat follow are based solely on theeconomic contribu ons of wagespaid to human service workers inIllinois. The economic impact ofoverall industry spending is likelyto be substan ally larger thandescribed in the conserva ve es mate of economic impactdescribed below.
Illinois’ human services industry paid its workers nearly$4.2 billion in 2013. As shown below, of the $4.2 billionearned through human service jobs in 2013, $3.1 billionwas disposable income. The $3.1 billion in local spendingof disposable income by human service workers generatedan es mated $1.4 billion in addi onal economic ac vityacross the state. 3
This $1.4 billion is the money earned and spent by personsemployed in establishments where human service workerspurchased goods and services (e.g., grocery stores,clothing stores, gas sta ons, etc.) in Illinois.
The direct spending of disposableincome and the $1.4 billion inaddi onal economic ac vity thatspending generated suggeststhat the total economic impactof the disposable income earnedby human service workers inIllinois was $4.5 billion, andthese expenditures supported anaddi onal 30,034 jobs in Illinoisin 2013.
As stated above, the $4.5 billiongure is conserva ve in that it does
not include all of the economicvalue created when child care allows mothers to work,youth programs improve school outcomes leading to astronger workforce, or when costs of crime are reducedthrough successful drug treatment, to name just a fewexamples. Transfer payments such as TANF (TemporaryAssistance for Needy Families, commonly known as cashwelfare) or SNAP (Supplemental Nutri on AssistanceProgram, commonly known as food stamps) createmillions of dollars of economic value, par cularly in lowincome neighborhoods.
3 See Methodology for discussion of human services worker popula on es mates.
Economic Impact of Human Services Industry in Illinois: 2013
Economic Impact Employment Impact
2011 Human Service Jobs 206,183Direct Spending of Disposable Income $3,128,477,805 0
Indirect Spending $1,427,037,453 30,034Total Economic Impact $4,555,515,258 236,217All data input in the IMPLAN model are from U.S. Census Bureau, County Business Pa erns Survey, 2013 and CensusNonemployer Sta s cs, 2013.
Human Service Workers Create an Es mated $4.5 Billion Economic Impact Annually
Total economic impactof the disposable incomeearned by human service workers in Illinois was$4.5 billion and these
expenditures supported anadditional 30,034 jobs in
Illinois in 2013.

8/16/2019 Economic Impact Report- Illinois budget impasse
http://slidepdf.com/reader/full/economic-impact-report-illinois-budget-impasse 11/48
8 May 2016Human Services as an Economic Engine:How Human Services in Illinois Drive Jobs and Economic Benefts
Human Service Workers Are Responsible for $598 Million inState and Local Tax Payments Annually
As can be seen in the table below, wages paid to human service workersin Illinois also generated nearly $598 million in state and local tax revenuesin 2013.
Of the $598 million in tax payments related to human service workers:
• $171 million in taxes were paid directly by human service employeesthrough income and other taxes .
• $165 million in taxes were paid by Illinois businesses based on purchasesand other expenditures by human service employees at those businesses.
• $262 million in taxes were paid by the employees of the businesses wherehuman service workers made purchases and other expenditures.
State and Local Tax Impact
Total
Paid By HumanService Employees
(Direct)
Paid By IllinoisBusinesses(Indirect)
Paid By Employeesof Supported
Businesses(Induced)
2013 Annual Human Services Payroll $4,154,685,000 n/a n/a n/aTotal Taxes $597,895,356 $170,799,392 $165,248,813 $261,847,154
Social Insurance Tax $12,117,093 $7,199,093 $1,996,143 $2,921,858Sales Tax $149,731,856 $20,860,014 $47,800,184 $81,071,664Income Tax $140,974,640 $85,344,272 $22,789,416 $32,840,956Fines, Fees, and Licensing $44,537,982 $24,571,299 $8,008,402 $11,958,284
Property Taxes $3,556,726 $2,153,197 $574,967 $828,562Other Taxes $246,977,059 $30,671,517 $84,079,701 $132,225,830
All data input in the IMPLAN model are from U.S. Census Bureau, County Business Pa erns Survey, 2013 and Census Nonemployer Sta s cs, 2013.

8/16/2019 Economic Impact Report- Illinois budget impasse
http://slidepdf.com/reader/full/economic-impact-report-illinois-budget-impasse 12/48
9 May 2016Human Services as an Economic Engine:How Human Services in Illinois Drive Jobs and Economic Benefts
Human Service Establishments
The Percentage of Human Service Establishments that Are Small Is About the Same as forAny Other Industry
The more than 7,600 human service establishments in Illinois make it one of the state’s most signi cant industries.Establishments range from large service centers operated by organiza ons such as Metropolitan Family Services orCatholic Chari es, to small child care centers or organiza ons providing language-speci c services to members of apar cular ethnic group. Collec vely, these human service establishments have an annual payroll of more than $3 billion.
A common no on is that a shake-out is needed among human service providers. One of the perceived problems withthe sector is that there are too many small providers that operate ine ciently. However, the data indicates that otherindustries have the same ra o of small to large providers as human services.
The following table provides a summary of the size of establishments for major industries in the Illinois economy. It showsthat for all industries, around two-thirds of establishments have less than ten employees. While businesses come andgo in all industries, no one argues that a shake-out would bene t the construc on industry, where over 70 percent of
rms have four or fewer employees, the real estate industry, where 72 percent of rms have four or fewer employees, orprofessional and scien c services, where almost 73 percent of rms have four or fewer employees. Almost all industriesconstantly have new, small entrants with an innova ve idea or serving a unique or underserved group of customers.
Human Service Establishments in Illinois: 2013
Number ofestablishments
All Human Service Establishments 7,630Outpa ent Mental Health and Substance Abuse Centers 301Residen al Intellectual or Developmental Disabili es, MentalHealth and Substance Abuse Facili es
1,301
Individual and Family Services 2,319
Community Food, Housing, Emergency, or Other Relief Services 462Voca onal Rehabilita on Services 337
Child Day Care Centers 2,910Source: U.S. Census Bureau, County Business Pa erns 2013
Almost all industries constantly have new, smallentrants with an innovative idea or serving aunique or underserved group of customers.

8/16/2019 Economic Impact Report- Illinois budget impasse
http://slidepdf.com/reader/full/economic-impact-report-illinois-budget-impasse 13/48
10 May 2016Human Services as an Economic Engine:How Human Services in Illinois Drive Jobs and Economic Benefts
Across the array of industries in the state, human service industriesare typical of all industries with respect to rm size. Most humanservice sub-industries (e.g., Individual and Family Services) averageless than 60 percent of rms with one to four employees, aboutthe same as retail trade. Rehabilita on service providers averagesomewhat larger size than other industries, with only 40 percent of
rms having fewer than ten employees.
Across the array of industries in the state,human service industries are typical of all
industries with respect to rm size.
Nor are human service providers much di erent from other industriesat the other end of the spectrum: large establishments. Only u li esand management industries have over two percent of rms with morethan 500 employees and about one percent of establishments in mostIllinois industries might be considered to be large, about the same ashuman services.
Like most small businesses, human service organiza ons with fewerthan 100 employees o en have many cross-func oning employeesand lack specialists and full- me employees in the areas of accoun ng,human resources and informa on technology. And this trend hasincreased since the 2008 Recession and the 2015 State budgetcrisis, during which most non-pro ts pared administra ve sta toa minimum. Because of the cross-func oning of sta , many of thesmallest providers operate with less administra ve overhead percapita than their larger counterparts.

8/16/2019 Economic Impact Report- Illinois budget impasse
http://slidepdf.com/reader/full/economic-impact-report-illinois-budget-impasse 14/48
11 May 2016Human Services as an Economic Engine:How Human Services in Illinois Drive Jobs and Economic Benefts
AllEstablishments
Percent of Establishments by Number of Employees
<10 10-19 20-99 100-499 500-999 >=1,000Total for All Sectors 315,364 73.7% 12.3% 11.5% 2.2% 0.2% 0.1%Agriculture, Forestry, Fishing and Hun ng 348 88.2% 4.9% 6.6% .3% 0.0% 0.0%Mining, Quarrying, and Oil and GasExtrac on
562 74.0% 13.7% 8.3% 3.7% 0.0% 0.2%
U li es 501 45.5% 13.4% 27.6% 11.4% 2.0% 0.2%
Construc on 28,087 87.0% 7.0% 5.3% .6% 0.0% 0.0%Manufacturing 13,608 50.8% 15.7% 24.4% 7.9% 0.8% 0.2%Wholesale Trade 19,182 70.3% 14.0% 13.4% 2.0% 0.2% 0.1%Retail Trade 39,701 68.4% 16.2% 12.4% 2.9% 0.0% 0.0%Transporta on and Warehousing 13,636 79.4% 8.4% 9.0% 2.8% 0.2% 0.1%Informa on 5,300 66.1% 13.3% 16.3% 3.6% 0.5% 0.1%Finance and Insurance 22,367 79.5% 11.0% 7.7% 1.5% 0.1% 0.1%Real Estate and Rental and Leasing 12,135 87.0% 8.0% 4.4% .5% 0.0% 0.0%Professional, Scien c, and Technical
Services
38,766 85.1% 7.6% 6.0% 1.2% 0.1% 0.1%
Management of Companies andEnterprises
2,294 46.7% 13.9% 24.9% 11.3% 1.8% 1.3%
Administra ve and Support and WasteManagement and Remedia on Services
16,861 75.4% 8.7% 11.4% 3.9% 0.6% 0.3%
Educa onal Services 4,136 61.5% 13.3% 20.2% 3.7% 0.5% 0.7%Healthcare and Social Assistance 33,382 69.5% 15.0% 12.0% 3.0% 0.2% 0.3% Child Day Care Centers 2,910 56.4% 25.4% 17.8% .4% 0.0% 0.0% Community Food, Housing, Emergency,
or Other Relief Services462 62.2% 17.3% 19.5% .6% 0.4% 0.0%
Individual and Family Services 2,319 58.2% 16.0% 21.8% 3.6% 0.3% 0.2% Outpa ent Mental Health and
Substance Abuse Centers301 57.4% 12.3% 26.9% 3.3% 0.0% 0.0%
Residen al Intellectual orDevelopmental Disabili es, MentalHealth and Substance Abuse Facili es
1,301 58.5% 26.8% 10.6% 3.6% 0.2% 0.2%
Voca onal Rehabilita on Service 337 40.1% 16.6% 30.0% 12.5% 0.9% 0.0%Arts, Entertainment, and Recrea on 4,583 71.5% 10.9% 14.4% 2.9% 0.2% 0.0%Accommoda on and Food Services 27,695 51.8% 20.8% 25.9% 1.5% 0.1% 0.0%
Other Services (except Public Administra on) 31,899 82.5% 10.8% 6.1% .6% 0.0% 0.0%
Industries Not Classi ed 321 99.1% 0.6% .3% 0% 0.0% 0.0%Source: U.S. Census Bureau, County Business Pa erns 2013

8/16/2019 Economic Impact Report- Illinois budget impasse
http://slidepdf.com/reader/full/economic-impact-report-illinois-budget-impasse 15/48
12 May 2016Human Services as an Economic Engine:How Human Services in Illinois Drive Jobs and Economic Benefts
Human Service Establishments are Found Across the State
Although the large number of low-income persons in Chicagoand Cook County is well known, human service workers arefound across the state. Low income people in need of servicelive in every county state-wide, and human service customersare not only low income people. As the data indicates, ofIllinois’ 103 coun es, two-thirds have ten or more humanservice establishments. Cook, Champaign, DuPage, Kane,Lake, Madison, Peoria, Rock Island, St. Clair, Sangamon, Willand Winnebago coun es each have more than 100.
The wide range of ra o of total popula on, persons inpoverty, or persons with disabili es to human serviceestablishments suggests that in many parts of the state, low-income persons are probably wan ng for services. Calhoun,Clark, Marshall and Stark coun es each have ra os of total
popula on to human services establishment of over 4,000:1 while the “best” have ra os in the high hundreds of personsper establishment.
Human service providers work with people from all income levels, butgovernment funding is directed mostly toward assuring that people with lowincomes are not denied basic quality of life. The “best” ra o of providers topoor is found in Richland County, which has 88 persons in poverty per humanservices establishment. However, ra os are over 500:1 in Edgar, Hancock,Marshall, Pike, Putnam and Stark coun es. The number of persons in Illinoiswith a disability is only somewhat less than the number in poverty, so ra osof numbers of persons with disabili es to service establishments are similarto poverty ra os.
Rural areas pose a challenge for e ciency when people in need must travellong distances by car to address needs. Because of the necessity of providingcoverage across the state, and because many services are necessarilyprovided to rela vely small popula ons of people, large numbers of smaller-sized providers are inevitable across the industry, just as small restaurants,barber shops, and law o ces are found across the state serving di erenttypes of people who have di erent tastes, cultures and needs.
Because of the necessityproviding coverage acro
the state, and because maservices are necessaril
provided to relatively smpopulations of people, lanumbers of smaller-size
providers are inevitablacross the industry
Ra os of Number of Service Establishments to Total Persons, Persons in Poverty, and Persons with Disabili es
County
Total HumanService
EstablishmentsPer County
TotalPopula onin County
Ra o of TotalPopula on to
Human ServiceEstablishments
Number ofPersons in
Poverty
Ra o ofPersons inPoverty to
Human ServiceEstablishments
Numberof Persons
with aDisability
Ra o ofPersons witha Disability to
Human ServicEstablishment
Adams 34 67,152 1,975 9,374 275.7 9,526 280.2Alexander 5 7,980 1,596 2,399 479.8 1,806 361.2Bond 7 17,665 2,524 2,462 351.7 2,539 362.7Boone 17 54,068 3,180 6,055 356.2 4,578 269.3Brown 3 6,904 2,301 641 213.7 567 189Bureau 15 34,594 2,306 3,955 263.7 4,367 291.1Calhoun 1 5,062 5,062 593 593 789 789Carroll 10 15,199 1,520 2,038 203.8 2,369 236.9

8/16/2019 Economic Impact Report- Illinois budget impasse
http://slidepdf.com/reader/full/economic-impact-report-illinois-budget-impasse 16/48
13 May 2016Human Services as an Economic Engine:How Human Services in Illinois Drive Jobs and Economic Benefts
Ra os of Number of Service Establishments to Total Persons, Persons in Poverty, and Persons with Disabili es (con nued from page 12)
County
Total HumanService
EstablishmentsPer County
TotalPopula onin County
Ra o of TotalPopula on to
Human ServiceEstablishments
Number ofPersons in
Poverty
Ra o ofPersons inPoverty to
Human ServiceEstablishments
Numberof Persons
with aDisability
Ra o ofPersons witha Disability to
Human ServicEstablishment
Cass 5 13,530 2,706 1,975 395 1,703 340.6
Champaign 122 202,428 1,659 41,384 339.2 17,162 140.7Chris an 20 34,651 1,733 4,873 243.7 4,598 229.9Clark 4 16,284 4,071 1,956 489 2,404 601Clay 20 13,744 687 2,100 105 2,148 107.4Clinton 36 37,891 1,053 3,184 88.4 4,086 113.5Coles 68 53,732 790 10,829 159.3 6,749 99.3Cook 3,315 5,212,372 1,572 868,652 262 529,687 159.8Crawford 12 19,707 1,642 2,688 224 3,059 254.9Cumberland 5 11,015 2,203 1,497 299.4 1,952 390.4DeKalb 71 104,820 1,476 18,622 262.3 8,474 119.4De Wi 11 16,511 1,501 2,259 205.4 2,278 207.1Douglas 7 19,902 2,843 2,028 289.7 2,084 297.7DuPage 447 922,803 2,064 62,913 140.7 71,735 160.5Edgar 6 18,339 3,057 3,311 551.8 2,855 475.8Edwards 3 6,695 2,232 757 252.3 1,034 344.7E ngham 31 34,274 1,106 3,066 98.9 3,960 127.7Faye e 12 22,088 1,841 3,548 295.7 3,327 277.3Ford 6 13,991 2,332 1,416 236 1,842 307Franklin 20 39,470 1,974 7,410 370.5 7,652 382.6
Fulton 22 36,829 1,674 4,566 207.5 4,897 222.6Galla n 3 5,516 1,839 929 309.7 1,108 369.3Greene 4 13,778 3,445 1,775 443.8 2,101 525.3Grundy 22 50,064 2,276 4,468 203.1 4,928 224Hamilton 7 8,413 1,202 1,413 201.9 1,353 193.3Hancock 5 18,949 3,790 2,535 507 2,672 534.4Hardin 6 4,273 712 992 165.3 1,277 212.8Henderson 3 7,186 2,395 799 266.3 1,161 387Henry 25 50,260 2,010 5,179 207.2 5,620 224.8
Iroquois 31 29,446 950 3,922 126.5 3,660 118.1Jackson 38 60,055 1,580 16,711 439.8 7,016 184.6Jasper 4 9,680 2,420 635 158.8 1,310 327.5Je erson 33 38,769 1,175 6,081 184.3 5,768 174.8Jersey 10 22,850 2,285 1,668 166.8 2,469 246.9Jo Daviess 11 22,602 2,055 2,121 192.8 2,722 247.5Johnson 8 12,665 1,583 1,500 187.5 2,031 253.9Kane 242 518,380 2,142 56,796 234.7 38,798 160.3Kankakee 86 112,991 1,314 17,848 207.5 17,944 208.7

8/16/2019 Economic Impact Report- Illinois budget impasse
http://slidepdf.com/reader/full/economic-impact-report-illinois-budget-impasse 17/48
14 May 2016Human Services as an Economic Engine:How Human Services in Illinois Drive Jobs and Economic Benefts
Ra os of Number of Service Establishments to Total Persons, Persons in Poverty, and Persons with Disabili es (con nued from page 13)
County
Total HumanService
EstablishmentsPer County
TotalPopula onin County
Ra o of TotalPopula on to
Human ServiceEstablishments
Number ofPersons in
Poverty
Ra o ofPersons inPoverty to
Human ServiceEstablishments
Numberof Persons
with aDisability
Ra o ofPersons witha Disability to
Human ServicEstablishment
Kendall 47 116,366 2,476 5,540 117.9 7,676 163.3
Knox 51 52,545 1,030 8,068 158.2 7,232 141.8Lake 374 702,099 1,877 61,256 163.8 52,545 140.5LaSalle 66 113,295 1,717 13,423 203.4 13,038 197.5Lawrence 11 16,702 1,518 1,462 132.9 1,909 173.5Lee 38 35,535 935 3,531 92.9 4,036 106.2Livingston 23 38,687 1,682 3,533 153.6 4,357 189.4Logan 21 30,177 1,437 3,228 153.7 3,377 160.8McDonough 23 32,549 1,415 6,324 275 3,698 160.8McHenry 158 308,060 1,950 23,542 149 23,709 150.1McLean 91 171,240 1,882 23,051 253.3 15,442 169.7Macon 64 110,262 1,723 18,707 292.3 14,946 233.5Macoupin 18 47,462 2,637 5,714 317.4 6,954 386.3Madison 166 268,373 1,617 36,554 220.2 31,319 188.7Marion 37 39,070 1,056 6,897 186.4 7,377 199.4Marshall 2 12,454 6,227 1,333 666.5 1,666 833Mason 6 14,508 2,418 2,323 387.2 2,269 378.2Massac 7 15,282 2,183 2,458 351.1 2,957 422.4Menard 6 12,687 2,115 1,221 203.5 1,432 238.7Mercer 8 16,325 2,041 1,623 202.9 1,959 244.9
Monroe 17 33,181 1,952 1,780 104.7 3,433 201.9Montgomery 17 29,878 1,758 3,444 202.6 3,584 210.8Morgan 42 35,424 843 4,681 111.5 4,682 111.5Moultrie 8 14,869 1,859 1,851 231.4 1,685 210.6Ogle 18 53,092 2,950 5,907 328.2 5,318 295.4Peoria 139 187,117 1,346 31,258 224.9 20,389 146.7Perry 18 22,182 1,232 3,670 203.9 3,122 173.4Pia 9 16,620 1,847 1,022 113.6 1,802 200.2Pike 5 16,337 3,267 2,616 523.2 2,573 514.6
Pope 6 4,383 731 715 119.2 951 158.5Pulaski 11 6,035 549 1,118 101.6 1,328 120.7Putnam 1 5,927 5,927 839 839 704 704Randolph 18 33,218 1,845 3,694 205.2 4,641 257.8Richland 26 16,213 624 2,271 87.3 2,720 104.6Rock Island 106 147,477 1,391 18,982 179.1 18,729 176.7St. Clair 160 268,939 1,681 46,561 291 35,669 222.9Saline 19 24,950 1,313 4,595 241.8 4,880 256.8Sangamon 131 198,269 1,514 27,659 211.1 26,476 202.1

8/16/2019 Economic Impact Report- Illinois budget impasse
http://slidepdf.com/reader/full/economic-impact-report-illinois-budget-impasse 18/48
15 May 2016Human Services as an Economic Engine:How Human Services in Illinois Drive Jobs and Economic Benefts
Ra os of Number of Service Establishments to Total Persons, Persons in Poverty, and Persons with Disabili es (con nued from page 14)
County
Total HumanService
EstablishmentsPer County
TotalPopula onin County
Ra o of TotalPopula on to
Human ServiceEstablishments
Number ofPersons in
Poverty
Ra o ofPersons inPoverty to
Human ServiceEstablishments
Numberof Persons
with aDisability
Ra o ofPersons witha Disability to
Human ServicEstablishment
Schuyler 6 7,490 1,248 1,153 192.2 1,103 183.8
Sco 2 5,288 2,644 639 319.5 650 325Shelby 12 22,266 1,856 2,583 215.3 2,958 246.5Stark 1 5,942 5,942 643 643 839 839Stephenson 24 7,315 1,971 7,373 307.2 6,885 286.9Tazewell 76 135,747 1,786 12,150 159.9 14,478 190.5Union 24 17,722 738 3,381 140.9 3,006 125.3Vermilion 53 81,147 1,531 15,494 292.3 11,957 225.6Wabash 5 11,848 2,370 1,496 299.2 1,862 372.4Warren 19 17,762 935 2,614 137.6 2,047 107.7Washington 10 14,626 1,463 1,462 146.2 1,907 190.7Wayne 9 16,674 1,853 2,432 270.2 2,520 280White 10 14,630 1,463 2,230 223 2,496 249.6Whiteside 30 58,150 1,938 6,843 228.1 8,115 270.5Will 283 679,688 2,402 53,560 189.3 54,595 192.9Williamson 45 66,606 1,480 10,041 223.1 9,772 217.2Winnebago 165 293,384 1,778 50,549 306.4 36,231 219.6Woodford 13 38,903 2,993 3,316 255.1 3,366 258.9Total for allof Illinois
7,628 2,848,554 1,684 1,772,333 232.3 1,327,536 174
Source: U.S. Census Bureau, County Business Pa erns 2013 and American Community Survey 2009-2013
While it is commonly imagined that the largest numbers of human serviceworkers are located in Chicago, as the maps below demonstrate, many collar and“downstate” regions have as many human service workers as does Chicago. In fact,among the lowest numbers of human service workers per capita statewide arefound in the La no communi es of Chicago. The largest concentra ons are foundin coun es immediate south of Chicago and in much of central Illinois. Six stateSenate districts have more than 3,500 human service workers. 4 Ten Illinois Houseof Representa ves districts have human service worker popula ons exceeding1,800. 5 Consequently, human service providers are not primarily an economic asset
for Chicago, but across Illinois.
4 Steans (7th), Silverstein (8th), Has ngs (19th), Koehler (46th), McCann (50th) and Clayborne (57th).5 Welch (7th), Cassidy (14th), Lang (16th), Mitchell (26th), Riley (38th), Butler (87th), Gordon-Booth (92nd), Poe (99th), Cavale o (107th) and
Ho man (113th)

8/16/2019 Economic Impact Report- Illinois budget impasse
http://slidepdf.com/reader/full/economic-impact-report-illinois-budget-impasse 19/48
16 May 2016Human Services as an Economic Engine:How Human Services in Illinois Drive Jobs and Economic Benefts
Human Service Workers in Senate Districts
1,541 - 2,520
2,521 - 3,113
3,114 - 3,698
Urban Areas with 500+Human Service Workers

8/16/2019 Economic Impact Report- Illinois budget impasse
http://slidepdf.com/reader/full/economic-impact-report-illinois-budget-impasse 20/48
17 May 2016Human Services as an Economic Engine:How Human Services in Illinois Drive Jobs and Economic Benefts
Human Service Workers in Senate Districts
1,541 - 2,520
2,521 - 3,113
3,114 - 3,698

8/16/2019 Economic Impact Report- Illinois budget impasse
http://slidepdf.com/reader/full/economic-impact-report-illinois-budget-impasse 21/48
18 May 2016Human Services as an Economic Engine:How Human Services in Illinois Drive Jobs and Economic Benefts
State government grants to human service provider organiza ons are a major source of human services funding. At theme of this wri ng in spring of 2016, many human service providers in Illinois have not had appropria ons for their state
grant in the current scal year (which begins in July and ends in June) due to the failure of the Illinois legislature andgovernor to adopt a budget for the current scal year. State grants for 2014 demonstrate the substan al role of humanservices funding at the local level.
Human service grants exceeded $25 million in eight state Senate districts in 2014. 6 Human service grants exceeded $20million in nine Illinois House of Representa ves districts. 7
While some of the greatest concentra on of social need is found in low-income neighborhoods in Chicago, grants thatsupport human services are distributed across most of the state. In addi on to funding Chicago providers, major grantsgo to providers in the central por on of the state, as well as the northwest, west and southeast regions.
Human Service Grants 2014
6 Muñoz (1st), Hunter (3rd), Van Pelt (5th), Cullerton (6th), Steans (7th), Brady (44th), Manar (48th) and Benne (52nd)7 Acevedo (2nd), Dunkin (5th), Harper (6th), Turner (9th), Reaves-Harris (10th), Harris (13th), Sommer (88th), Scherer (96th) and Ammons (103rd)
$42,534 - $6,205,940
$6,205,941 - $16,283,184
$16,283,185 - $37,798,328

8/16/2019 Economic Impact Report- Illinois budget impasse
http://slidepdf.com/reader/full/economic-impact-report-illinois-budget-impasse 22/48
19 May 2016Human Services as an Economic Engine:How Human Services in Illinois Drive Jobs and Economic Benefts
$42,534 - $10,352,166
$10,352,167 - $29,862,291
$29,862,292 - $221,195,254
Human Service Grants 2014

8/16/2019 Economic Impact Report- Illinois budget impasse
http://slidepdf.com/reader/full/economic-impact-report-illinois-budget-impasse 23/48
20 May 2016Human Services as an Economic Engine:How Human Services in Illinois Drive Jobs and Economic Benefts
Human Service Workers
There Are Approximately 169,000 Human Service Workers in Illinois
There are approximately 169,000 human service workers in Illinois according to the U.S. Census Bureau’s AmericanCommunity Survey for the 2009-2013 period. 8 The majority of these – about 64,000 persons – work for employersclassi ed as “Child day care services.” They are followed closely in number by about 60,000 persons working in“Individual and family services.” 9
Human service workers make up an appreciable por on of workers across the state. As the table below demonstrates,the percentage of all workers who are human service workers ranges from 2 percent to 5 percent across all Illinoiscoun es. As important as human service workers are to Chicago and Cook County, at 2.9 percent Cook County is only inthe mid-range statewide in the signi cance of human service workers for its overall workforce. The highest percentagesare found not in urban areas but in rural areas. The highest percentages are in Galla n (4.3%), Hardin (5.3%), Jersey(4.3%), Lawrence (4.8%), Marion (4.5%), Massac (4.0%), Montgomery (4.7%), Pope (4.5%), and Pulaski (4.1%) coun es.As the map indicates, human service workers are most concentrated - that is, the ra o of human service workers to thetotal workforce is highest - in central and downstate Illinois.
8 See Methodology for discussion of human service worker popula on es mates.9 These are the most detailed classi ca ons available for human service industrial categories.
Human Service Workers in Illinois by Industry Category: 2009-2013
Categories Number of Workers
Total Human Service Workers 169,108Residen al Care Facili es, except Skilled Nursing Facili es 30,945Individual and Family Services 60,038Community Food and Housing, and Emergency Services 4,282Voca onal Rehabilita on Services 9,422Child Day Care Services 64,421
Source: American Community Survey, 2009-2013
Es mate of Human Service Workers by Illinois County, 2009-2013
County Workers Human Service Workers Pct Human ServiceAdams 32,358 1,119 3.5%Alexander 2,459 95 3.9%Bond 7,528 247 3.3%Boone 23,891 550 2.3%Brown 2,703 60 2.2%Bureau 16,100 463 2.9%
Calhoun 2,212 54 2.4%Carroll 7,049 170 2.4%Cass 5,972 187 3.1%Champaign 100,244 2,610 2.6%Chris an 15,535 501 3.2%

8/16/2019 Economic Impact Report- Illinois budget impasse
http://slidepdf.com/reader/full/economic-impact-report-illinois-budget-impasse 24/48
21 May 2016Human Services as an Economic Engine:How Human Services in Illinois Drive Jobs and Economic Benefts
Es mate of Human Service Workers by Illinois County, 2009-2013 (con nued from page 20)
County Workers Human Service Workers Pct Human ServiceClark 7,447 199 2.7%Clay 6,041 194 3.2%Clinton 18,885 634 3.4%Coles 24,643 689 2.8%Cook 2,414,798 70,101 2.9%Crawford 8,508 261 3.1%Cumberland 4,998 165 3.3%DeKalb 51,992 1,190 2.3%De Wi 7,846 244 3.1%Douglas 9,425 216 2.3%DuPage 470,864 12,049 2.6%Edgar 7,993 250 3.1%Edwards 2,887 87 3.0%E ngham 17,528 578 3.3%
Faye e 9,424 331 3.5%Ford 6,434 209 3.2%Franklin 15,631 535 3.4%Fulton 15,156 549 3.6%Galla n 2,209 94 4.3%Greene 6,250 190 3.0%Grundy 22,931 575 2.5%Hamilton 3,515 120 3.4%Hancock 8,835 246 2.8%
Hardin 1,481 78 5.3%Henderson 3,480 117 3.4%Henry 23,893 702 2.9%Iroquois 13,562 487 3.6%Jackson 26,408 790 3.0%Jasper 4,839 128 2.6%Je erson 16,619 548 3.3%Jersey 10,423 445 4.3%Jo Daviess 11,180 336 3.0%Johnson 4,123 162 3.9%Kane 247,519 5,532 2.2%Kankakee 49,441 1,813 3.7%Kendall 57,882 1,342 2.3%Knox 21,663 853 3.9%Lake 332,723 8,016 2.4%LaSalle 52,238 1,504 2.9%Lawrence 4,211 202 4.8%Lee 16,042 610 3.8%

8/16/2019 Economic Impact Report- Illinois budget impasse
http://slidepdf.com/reader/full/economic-impact-report-illinois-budget-impasse 25/48
22 May 2016Human Services as an Economic Engine:How Human Services in Illinois Drive Jobs and Economic Benefts
Es mate of Human Service Workers by Illinois County, 2009-2013 (con nued from page 21)
County Workers Human Service Workers Pct Human ServiceLivingston 16,259 473 2.9%Logan 11,210 395 3.5%McDonough 14,798 355 2.4%McHenry 153,608 3,422 2.2%McLean 88,807 2,137 2.4%Macon 48,357 1,554 3.2%Macoupin 21,862 712 3.3%Madison 124,212 3,500 2.8%Marion 16,938 757 4.5%Marshall 5,576 173 3.1%Mason 6,037 207 3.4%Massac 6,143 243 4.0%Menard 6,357 240 3.8%Mercer 7,879 247 3.1%Monroe 16,691 516 3.1%Montgomery 10,361 492 4.7%Morgan 16,484 563 3.4%Moultrie 6,746 204 3.0%Ogle 25,332 721 2.8%Peoria 85,513 3,176 3.7%Perry 8,787 249 2.8%Pia 8,316 266 3.2%Pike 7,125 203 2.8%
Pope 1,650 74 4.5%Pulaski 2,192 90 4.1%Putnam 2,666 66 2.5%Randolph 13,986 520 3.7%Richland 7,284 252 3.5%Rock Island 68,496 1,922 2.8%St. Clair 118,336 4,268 3.6%Saline 9,143 337 3.7%Sangamon 97,035 3,556 3.7%Schuyler 3,331 126 3.8%Sco 2,489 81 3.2%Shelby 9,981 346 3.5%Stark 2,654 85 3.2%Stephenson 21,188 704 3.3%Tazewell 63,979 2,303 3.6%Union 6,982 257 3.7%Vermilion 32,883 1,110 3.4%

8/16/2019 Economic Impact Report- Illinois budget impasse
http://slidepdf.com/reader/full/economic-impact-report-illinois-budget-impasse 26/48
23 May 2016Human Services as an Economic Engine:How Human Services in Illinois Drive Jobs and Economic Benefts
Es mate of Human Service Workers by Illinois County, 2009-2013 (con nued from page 22)
County Workers Human Service Workers Pct Human ServiceWabash 5,536 171 3.1%Warren 8,036 259 3.2%Washington 7,463 230 3.1%Wayne 7,713 216 2.8%White 6,480 232 3.6%Whiteside 26,515 901 3.4%Will 323,606 9,228 2.9%Williamson 28,566 1,069 3.7%Winnebago 130,062 4,451 3.4%Woodford 18,652 585 3.1%Es mate is based on statewide es mate of Social Assistance workers being 21.8% of all Heal th Care and Social Assistanceworkers. This percentage is applied to county data on the aggregate Census Bureau category of Health Care and SocialAssistance Workers for each county.

8/16/2019 Economic Impact Report- Illinois budget impasse
http://slidepdf.com/reader/full/economic-impact-report-illinois-budget-impasse 27/48
24 May 2016Human Services as an Economic Engine:How Human Services in Illinois Drive Jobs and Economic Benefts
Human Service Percent of Workers
2.2% - 2.9%
3.0% - 3.9%
4.0% - 5.3%

8/16/2019 Economic Impact Report- Illinois budget impasse
http://slidepdf.com/reader/full/economic-impact-report-illinois-budget-impasse 28/48
25 May 2016Human Services as an Economic Engine:How Human Services in Illinois Drive Jobs and Economic Benefts
Many Human Service Workers Are Highly Educated but Workfor Low Wages
The educa on level of human service workers loosely resembles that of the en reworkforce. Thirty-eight percent of all Illinois workers have a bachelor’s degreecompared to 36 percent of human service workers. Over 50 percent of humanservice workers in “Individual and family services” have a bachelor’s degree, a ratesimilar to such high-skill sectors as nance and informa on. Only a quarter or less
of child care, residen al care or voca onal rehabilita on workers have four-yearcollege degrees. Most workers in these elds make low wages and consequentlymany providers have high employee turnover.
Most workers in theseelds make low wages
and consequently manyproviders have highemployee turnover.
Educa onal A ainment
Employed Civilian Labor ForceBachelor's degree
or higher
Total 38.3%Agriculture, Forestry, Fishing and Hun ng, and Mining 20.3%
Arts, Entertainment, and Recrea on, andAccommoda on and Food Services 22.7%
Construc on 14.1%Educa onal Services 72.5%Finance and Insurance, and Real Estate and Rental andLeasing
52.8%
Healthcare 42.2%Informa on 50.4%Manufacturing 27.9%Other Services, Except Public Administra on 26.9%
Professional, Scien c, Management, Administra ve &Waste Management
53.2%
Public Administra on 42.4%Retail Trade 25.6%Human Service Workers (Social Assistance Category) 35.5% Child Day Care Services 27.1% Community Food and Housing, and Emergency Services 43.1% Individual and Family Services 50.6% Residen al Care Facili es, except Skilled Nursing Facili es 25.5% Voca onal Rehabilita on Services 17.9%Transporta on and Warehousing, and U li es 18.9%Wholesale Trade 34.7%Source: American Community Survey, 2009-2013

8/16/2019 Economic Impact Report- Illinois budget impasse
http://slidepdf.com/reader/full/economic-impact-report-illinois-budget-impasse 29/48
26 May 2016Human Services as an Economic Engine:How Human Services in Illinois Drive Jobs and Economic Benefts
In the debate over the role of unions in state governmentand cost di eren als betweenservices provided in state ins tu onsas opposed to community se ngs,a percep on has been created thathuman service workers are tooexpensive or over-paid. As the datapresented below indicates, that ishardly the case.
The median wages of workers inmost human service elds in Illinoisare lower than the median wages
for most other industries. The median wage per hour offull- me human service workersin Illinois is about $12.25, farbelow the median of $19.61 for allworkers. The median hourly wagesfor construc on and manufacturing jobs are $21.44 and $19.61,respec vely. The median hourlywage for human service workersis closest to that of retail trade($15.29) and the median wageearned in movie theaters, hotelsand restaurants ($11.76).
Wages of Social Assistance and Other Workers in Illinois: 2009-2013
MedianWage
Pct of Median Wagefor All Workers
All Workers $19.61 100%
Agriculture, Forestry, Fishing and Hun ng,and Mining $11.33 58%
Arts, Entertainment, and Recrea on, and Accommoda onand Food Services
$11.76 60%
Construc on $21.44 109%Educa onal Services $21.57 110%Finance and Insurance, and Real Estate and Rentaland Leasing
$24.51 125%
Healthcare $19.61 100%Informa on $24.51 125%
Manufacturing $19.61 100%Other Services, Except Public Administra on $14.71 75%Professional, Scien c, Management, Administra ve &Waste Management
$23.53 120%
Public Administra on $27.94 142%Retail Trade $15.29 78%Social Assistance $12.25 62% Child Day Care Services $8.82 45% Community Food and Housing, and
Emergency Services$15.61 80%
Individual and Family Services $15.87 81% Residen al Care Facili es, except Skilled
Nursing Facili es$12.89 66%
Voca onal Rehabilita on Services $14.68 75%Transporta on and Warehousing, and U li es $21.08 107%Wholesale Trade $20.13 103%Source: American Community Survey, 2009-2013
The median wages of workers in most humanservice elds in Illinois
are lower than themedian wages for most
other industries.
8/16/2019 Economic Impact Report- Illinois budget impasse
http://slidepdf.com/reader/full/economic-impact-report-illinois-budget-impasse 30/48
27 May 2016Human Services as an Economic Engine:How Human Services in Illinois Drive Jobs and Economic Benefts
Even Human Service Workers with College Degrees Earn Low Wages
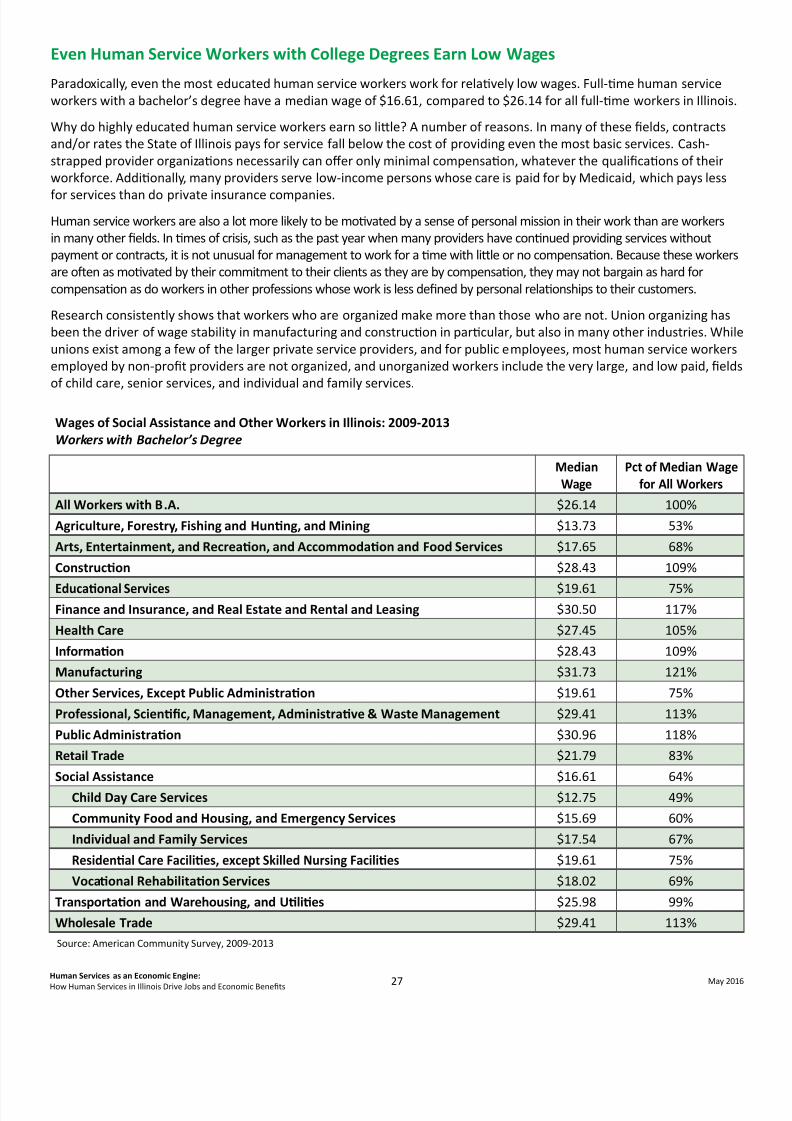
Paradoxically, even the most educated human service workers work for rela vely low wages. Full- me human serviceworkers with a bachelor’s degree have a median wage of $16.61, compared to $26.14 for all full- me workers in Illinois.
Why do highly educated human service workers earn so li le? A number of reasons. In many of these elds, contractsand/or rates the State of Illinois pays for service fall below the cost of providing even the most basic services. Cash-strapped provider organiza ons necessarily can o er only minimal compensa on, whatever the quali ca ons of theirworkforce. Addi onally, many providers serve low-income persons whose care is paid for by Medicaid, which pays less
for services than do private insurance companies.Human service workers are also a lot more likely to be mo vated by a sense of personal mission in their work than are workersin many other elds. In mes of crisis, such as the past year when many providers have con nued providing services withoutpayment or contracts, it is not unusual for management to work for a me with li le or no compensa on. Because these workersare o en as mo vated by their commitment to their clients as they are by compensa on, they may not bargain as hard forcompensa on as do workers in other professions whose work is less de ned by personal rela onships to their customers.
Research consistently shows that workers who are organized make more than those who are not. Union organizing hasbeen the driver of wage stability in manufacturing and construc on in par cular, but also in many other industries. Whileunions exist among a few of the larger private service providers, and for public employees, most human service workersemployed by non-pro t providers are not organized, and unorganized workers include the very large, and low paid, eldsof child care, senior services, and individual and family services.
Wages of Social Assistance and Other Workers in Illinois: 2009-2013Workers with Bachelor’s Degree
MedianWage
Pct of Median Wagefor All Workers
All Workers with B.A. $26.14 100%Agriculture, Forestry, Fishing and Hun ng, and Mining $13.73 53%Arts, Entertainment, and Recrea on, and Accommoda on and Food Services $17.65 68%Construc on $28.43 109%
Educa onal Services $19.61 75%Finance and Insurance, and Real Estate and Rental and Leasing $30.50 117%Health Care $27.45 105%Informa on $28.43 109%Manufacturing $31.73 121%Other Services, Except Public Administra on $19.61 75%Professional, Scien c, Management, Administra ve & Waste Management $29.41 113%Public Administra on $30.96 118%Retail Trade $21.79 83%Social Assistance $16.61 64% Child Day Care Services $12.75 49% Community Food and Housing, and Emergency Services $15.69 60% Individual and Family Services $17.54 67%
Residen al Care Facili es, except Skilled Nursing Facili es $19.61 75% Voca onal Rehabilita on Services $18.02 69%Transporta on and Warehousing, and U li es $25.98 99%Wholesale Trade $29.41 113%Source: American Community Survey, 2009-2013
8/16/2019 Economic Impact Report- Illinois budget impasse
http://slidepdf.com/reader/full/economic-impact-report-illinois-budget-impasse 31/48
28 May 2016Human Services as an Economic Engine:How Human Services in Illinois Drive Jobs and Economic Benefts
Many Human Service Workers Earn Poverty-Level Wages
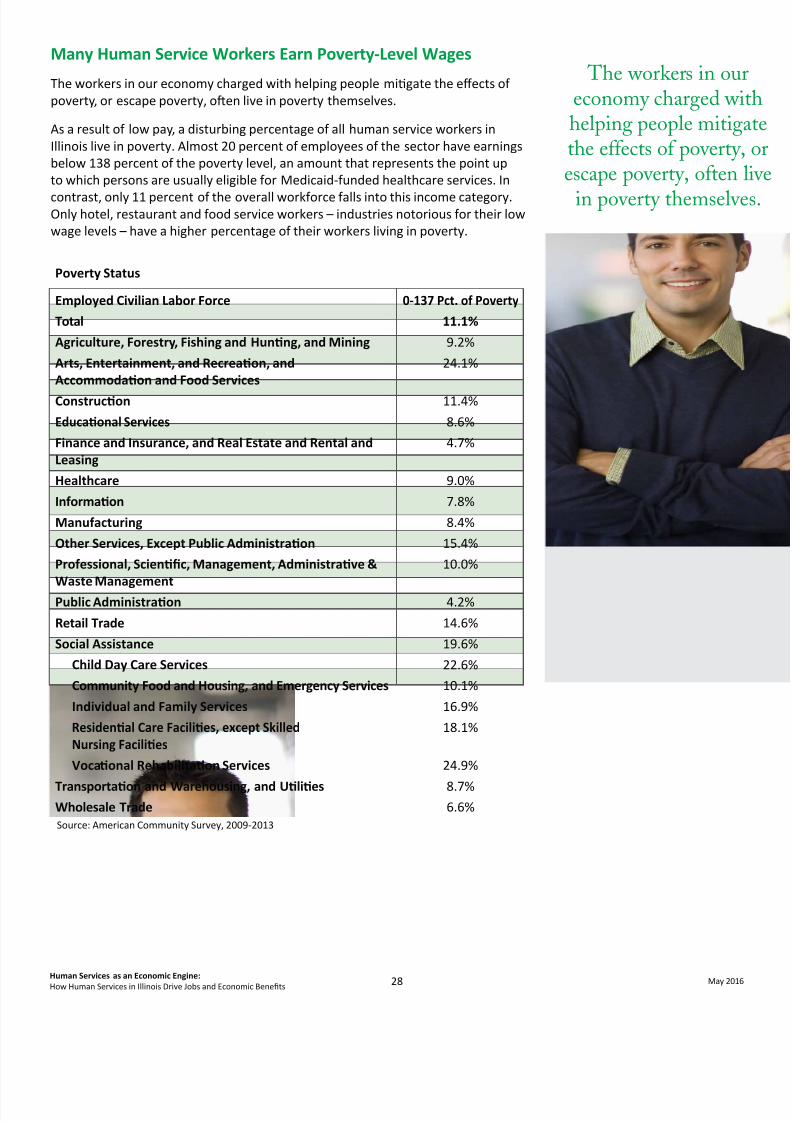
The workers in our economy charged with helping people mi gate the e ects ofpoverty, or escape poverty, o en live in poverty themselves.
As a result of low pay, a disturbing percentage of all human service workers inIllinois live in poverty. Almost 20 percent of employees of the sector have earningsbelow 138 percent of the poverty level, an amount that represents the point upto which persons are usually eligible for Medicaid-funded healthcare services. In
contrast, only 11 percent of the overall workforce falls into this income category.Only hotel, restaurant and food service workers – industries notorious for their lowwage levels – have a higher percentage of their workers living in poverty.
Poverty Status
Employed Civilian Labor Force 0-137 Pct. of Poverty
Total 11.1%Agriculture, Forestry, Fishing and Hun ng, and Mining 9.2%Arts, Entertainment, and Recrea on, andAccommoda on and Food Services
24.1%
Construc on 11.4%Educa onal Services 8.6%Finance and Insurance, and Real Estate and Rental andLeasing
4.7%
Healthcare 9.0%Informa on 7.8%Manufacturing 8.4%Other Services, Except Public Administra on 15.4%Professional, Scien c, Management, Administra ve &Waste Management
10.0%
Public Administra on 4.2%Retail Trade 14.6%Social Assistance 19.6% Child Day Care Services 22.6% Community Food and Housing, and Emergency Services 10.1% Individual and Family Services 16.9% Residen al Care Facili es, except Skilled
Nursing Facili es18.1%
Voca onal Rehabilita on Services 24.9%
Transporta on and Warehousing, and U li es 8.7%Wholesale Trade 6.6%Source: American Community Survey, 2009-2013
The workers in oueconomy charged whelping people mitigthe effects of povertyescape poverty, often
in poverty themselv

8/16/2019 Economic Impact Report- Illinois budget impasse
http://slidepdf.com/reader/full/economic-impact-report-illinois-budget-impasse 32/48
29 May 2016Human Services as an Economic Engine:How Human Services in Illinois Drive Jobs and Economic Benefts
10 See Methodology sec on for descrip on of these es mates including the es mate of human service workers.
Because the economic impact of human serviceestablishments is spread across the state, it is also spreadacross the state’s House and Senate
legisla ve districts.The economic impact of humanservice workers amounts to tens ofmillions of dollars in individual statelegisla ve districts. 10
The table below highlights thetop twenty districts in totalimpact in both the state Senateand House. This is the legisla vedistrict equivalent of the statewide
es mates reported earlier in this study.Economic impact includes the local impact of human
service workers spending their earnings and the indirectimpact of workers in other industries who are supported
by human service workers’ spending
(e.g., when a human services workershops or purchases a service fromanother worker). Also included arethe economic impacts on businessessupported by human serviceworkers’ spending.
Human service workers create over$75 million in economic impact inten state Senate districts.
Human service workers are
responsible for more than $40 million in economic impactin nine House districts.
The economic impactof human service
workers amounts to tensof millions of dollars
in individual statelegislative districts.
Human Service Workers Create Tens of Millions of Dollars of Economic Impact in IndividualLegisla ve Districts

8/16/2019 Economic Impact Report- Illinois budget impasse
http://slidepdf.com/reader/full/economic-impact-report-illinois-budget-impasse 33/48
30 May 2016Human Services as an Economic Engine:How Human Services in Illinois Drive Jobs and Economic Benefts
Human Services Impact for Leading Senate Districts (Based on Top Twenty Districts Ranked by Economic Impact)Economic Impact Human Service Grants 2014 Human Service Workers
Statewide Total 3,831,803,283 $955,970,288 173,424
Senate Senator Party7 Heather A. Steans D $81,715,160 $40,276,902 3,698
46 David Koehler D $81,309,500 $11,407,107 3,680
50 Wm. Sam McCann R $80,888,449 $14,435,248 3,661
19 Michael E. Has ngs D $80,738,947 $19,781,006 3,654
8 Ira I. Silverstein D $79,908,228 $2,641,234 3,617
57 James F. Clayborne, Jr. D $78,870,847 $11,331,215 3,570
17 Donne E. Tro er D $76,870,460 $3,327,191 3,479
44 William E. Brady R $75,505,830 $45,757,331 3,417
13 Kwame Raoul D $75,355,472 $12,648,906 3,411
4 Kimberly A. Ligh ord D $75,170,554 $17,624,702 3,402
54 Kyle McCarter R $74,820,993 $8,559,909 3,386
15 Napoleon Harris, III D $73,756,008 $12,485,978 3,338
41 Chris ne Radogno R $73,152,053 $267,474 3,311
40 Toi W. Hutchinson D $73,145,420 $14,518,537 3,310
34 Steve Stadelman D $73,088,667 $13,492,844 3,308
6 John J. Cullerton D $72,825,353 $28,400,019 3,296
37 Chuck Weaver R $72,620,827 $2,575,849 3,287
48 Andy Manar D $72,609,942 $33,840,322 3,286
18 Bill Cunningham D $72,105,629 $263,887 3,263
51 Chapin Rose R $70,257,019 $6,647,832 3,180
Human Services Impact for Leading House Districts (Based on Top Twenty Districts Ranked by Economic Impact)Economic Impact Human Service Grants 2014 Human Service Workers
Statewide Total $3,831,803,280 $955,970,288 173,424
House Rep Party38 Al Riley D $46,091,021 $13,195,699 2,086
99 Sara Wojcicki Jimenez R $44,053,049 $10,361,467 1,994
14 Kelly M. Cassidy D $43,852,419 $5,313,866 1,985
92 Jehan A. Gordon-Booth D $42,789,931 $8,903,632 1,937
26 Chris an L. Mitchell D $42,495,854 $7,670,786 1,923
113 Jay Ho man D $41,726,980 $4,776,403 1,889
16 Lou Lang D $41,027,985 $2,641,234 1,857
7 Emanuel Chris Welch D $40,372,582 $5,604,649 1,827
107 John D. Cavale o R $40,353,524 $2,447,877 1,826
87 Tim Butler R $39,928,181 $13,677,764 1,807
12 Sara Feigenholtz D $39,738,776 $19,805,385 1,79934 Elgie R. Sims, Jr. D $39,710,940 $3,222,207 1,797
78 Camille Y. Lilly D $39,531,193 $1,452,769 1,789
15 John D'Amico D $38,880,242 $ - 1,760
91 Michael Unes R $38,519,569 $2,503,475 1,743
68 John M. Cabello R $38,497,972 $9,278,582 1,742
5 Kenneth Dunkin D $38,379,860 $32,069,194 1,737
13 Greg Harris D $37,862,741 $34,963,037 1,714
17 Laura Fine D $37,660,473 $8,442,064 1,704
94 Randy Frese R $37,362,508 $7,689,209 1,691
8/16/2019 Economic Impact Report- Illinois budget impasse
http://slidepdf.com/reader/full/economic-impact-report-illinois-budget-impasse 34/48
31 May 2016Human Services as an Economic Engine:How Human Services in Illinois Drive Jobs and Economic Benefts
Detailed Appendix Tables
Economic Impact, Human Service Grants and Human Service Workers by State Senate andHouse Districts
Human Services Impact for all Senate Districts
Economic Impact2014
Human Service Grants2014
Human ServiceWorkers 2009-2013
Statewide Total $3,831,803,283 $955,970,288 173,424Senate Senator Party
1 Antonio Muñoz D $38,706,797 $25,157,974 1,752
2 William Delgado D $51,323,956 $9,551,961 2,323
3 Ma e Hunter D $65,832,833 $221,195,254 2,980
4 Kimberly A. Ligh ord D $75,170,554 $17,624,702 3,402
5 Patricia Van Pelt D $66,094,568 $71,289,961 2,991
6 John J. Cullerton D $72,825,353 $28,400,019 3,2967 Heather A. Steans D $81,715,160 $40,276,902 3,698
8 Ira I. Silverstein D $79,908,228 $2,641,234 3,617
9 Daniel Biss D $69,876,462 $14,654,900 3,163
10 John G. Mulroe D $63,744,345 $5,221,543 2,885
11 Mar n A. Sandoval D $34,040,208 $4,428,488 1,541
12 Steven M. Landek D $42,965,221 $5,158,878 1,945
13 Kwame Raoul D $75,355,472 $12,648,906 3,411
14 Emil Jones, III D $66,878,563 $9,986,876 3,027
15 Napoleon Harris, III D $73,756,008 $12,485,978 3,338
16 Jacqueline Y. Collins D $62,277,178 $122,853 2,81917 Donne E. Tro er D $76,870,460 $3,327,191 3,479
18 Bill Cunningham D $72,105,629 $263,887 3,263
19 Michael E. Has ngs D $80,738,947 $19,781,006 3,654
20 Iris Y. Mar nez D $54,625,048 $6,235,098 2,472
21 Michael Connelly R $60,975,933 $17,251,954 2,760
22 Michael Noland D $52,519,053 $3,188,812 2,377
23 Thomas Cullerton D $59,948,752 $1,647,508 2,713
24 Chris Nybo R $66,832,347 $2,277,232 3,025
25 Jim Oberweis R $53,212,666 $10,883,803 2,408
26 Dan Du y R $56,802,680 $1,268,726 2,571
27 Ma Murphy R $61,638,800 $7,063,565 2,790
28 Laura M. Murphy D $61,064,863 $12,043,951 2,764
29 Julie A. Morrison D $57,934,374 $1,374,634 2,622
30 Terry Link D $54,812,979 $15,066,541 2,481
31 Melinda Bush D $58,640,868 $3,302,730 2,654
32 Pamela J. Altho R $52,733,977 $17,605,845 2,387
33 Karen McConnaughay R $55,670,257 $4,353,235 2,520
34 Steve Stadelman D $73,088,667 $13,492,844 3,308
35 Dave Syverson R $57,234,486 $16,754,910 2,590

8/16/2019 Economic Impact Report- Illinois budget impasse
http://slidepdf.com/reader/full/economic-impact-report-illinois-budget-impasse 35/48
32 May 2016Human Services as an Economic Engine:How Human Services in Illinois Drive Jobs and Economic Benefts
Human Services Impact for all Senate Districts (con nued from page 31)
Economic Impact2014
Human Service Grants2014
Human ServiceWorkers 2009-2013
Statewide Total $3,831,803,283 $955,970,288 173,424Senate Senator Party
36 Neil Anderson R $65,631,022 $17,544,821 2,970
37 Chuck Weaver R $72,620,827 $2,575,849 3,287
38 Sue Rezin R $60,071,817 $6,090,470 2,719
39 Don Harmon D $62,729,846 $4,235,910 2,839
40 Toi W. Hutchinson D $73,145,420 $14,518,537 3,310
41 Chris ne Radogno R $73,152,053 $267,474 3,311
42 Linda Holmes D $49,027,067 $42,534 2,219
43 Pat McGuire D $59,901,540 $20,678,244 2,711
44 William E. Brady R $75,505,830 $45,757,331 3,417
45 Tim Bivins R $68,536,334 $14,355,859 3,102
46 David Koehler D $81,309,500 $11,407,107 3,680
47 John M. Sullivan D $68,785,895 $17,563,448 3,113
48 Andy Manar D $72,609,942 $33,840,322 3,286
49 Jennifer Ber no-Tarrant D $67,481,058 $4,691,379 3,054
50 Wm. Sam McCann R $80,888,449 $14,435,248 3,661
51 Chapin Rose R $70,257,019 $6,647,832 3,180
52 Sco M. Benne D $57,624,855 $28,191,093 2,608
53 Jason A. Barickman R $66,122,975 $4,080,143 2,993
54 Kyle McCarter R $74,820,993 $8,559,909 3,386
55 Dale A. Righter R $65,362,794 $12,563,167 2,958
56 William R. Haine D $61,816,376 $8,624,035 2,798
57 James F. Clayborne, Jr. D $78,870,847 $11,331,215 3,570
58 David S. Luechtefeld R $67,676,915 $9,148,031 3,063
59 Gary Forby D $69,932,217 $20,790,431 3,165
Human Services Impact for all House Districts
Economic Impact2014
Human Service Grants2014
Human ServiceWorkers 2009-2013
Statewide Total $3,831,803,280 $955,970,288 173,424House Rep Party
1 Daniel J. Burke D $19,186,109 $1,541,285 868
2 Edward J. Acevedo D $19,520,688 $23,616,689 883
3 Luis Arroyo D $23,564,082 $531,774 1,066
4 Cynthia Soto D $27,759,874 $9,020,187 1,256
5 Kenneth Dunkin D $38,379,860 $32,069,194 1,737
6 Sonya M. Harper D $27,452,974 $189,126,060 1,242
7 Emanuel Chris Welch D $40,372,582 $5,604,649 1,827
8 La Shawn K. Ford D $34,797,972 $12,020,053 1,575
9 Arthur Turner D $34,732,600 $37,798,328 1,572
10 Pamela Reaves-Harris D $31,361,968 $33,491,633 1,419
11 Ann Williams D $33,086,577 $8,594,634 1,497
12 Sara Feigenholtz D $39,738,776 $19,805,385 1,799

8/16/2019 Economic Impact Report- Illinois budget impasse
http://slidepdf.com/reader/full/economic-impact-report-illinois-budget-impasse 36/48
33 May 2016Human Services as an Economic Engine:How Human Services in Illinois Drive Jobs and Economic Benefts
Human Services Impact for all House Districts (con nued from page 32)
Economic Impact2014
Human Service Grants2014
Human ServiceWorkers 2009-2013
Statewide Total $3,831,803,280 $955,970,288 173,424House Rep Party
13 Greg Harris D $37,862,741 $34,963,037 1,714
14 Kelly M. Cassidy D $43,852,419 $5,313,866 1,985
15 John D'Amico D $38,880,242 $ - 1,760
16 Lou Lang D $41,027,985 $2,641,234 1,857
17 Laura Fine D $37,660,473 $8,442,064 1,704
18 Robyn Gabel D $32,215,989 $6,212,836 1,458
19 Robert F. Martwick D $30,881,560 $ - 1,398
20 Michael P. McAuli e R $32,862,785 $5,221,543 1,487
21 Silvana Tabares D $15,142,079 $4,428,488 685
22 Michael J. Madigan D $18,898,129 $ - 855
23 Michael J. Zalewski D $23,248,598 $3,194,277 1,052
24 Elizabeth Hernandez D $19,716,622 $1,964,601 892
25 Barbara Flynn Currie D $32,859,618 $4,978,120 1,487
26 Chris an L. Mitchell D $42,495,854 $7,670,786 1,923
27 Monique D. Davis D $31,575,766 $7,108,069 1,429
28 Robert Rita D $35,302,797 $2,878,807 1,598
29 Thaddeus Jones D $37,051,486 $2,078,856 1,677
30 William Davis D $36,704,522 $10,407,122 1,661
31 Mary E. Flowers D $31,950,085 $ - 1,446
32 André M. Thapedi D $30,327,093 $122,853 1,373
33 Marcus C. Evans, Jr. D $37,159,519 $104,984 1,682
34 Elgie R. Sims, Jr. D $39,710,940 $3,222,207 1,797
35 Frances Ann Hurley D $37,105,308 $ - 1,679
36 Kelly Burke D $35,000,321 $263,887 1,58437 Margo McDermed R $34,647,926 $6,585,307 1,568
38 Al Riley D $46,091,021 $13,195,699 2,086
39 Will Guzzardi D $24,512,288 $5,130,711 1,109
40 Jaime M. Andrade, Jr. D $30,112,759 $1,104,387 1,363
41 Grant Wehrli R $31,920,883 $927,532 1,445
42 Jeanne M Ives R $29,055,050 $16,324,422 1,315
43 Anna Moeller D $24,942,928 $2,988,812 1,129
44 Fred Crespo D $27,576,126 $200,000 1,248
45 Chris ne Winger R $30,100,648 $1,101,859 1,362
46 Deborah Conroy D $29,848,103 $545,649 1,35147 Patricia R. Bellock R $36,154,867 $1,010,128 1,636
48 Peter Breen R $30,677,480 $1,267,104 1,388
49 Mike Fortner R $25,041,893 $1,873,642 1,133
50 Keith Wheeler R $28,170,774 $9,010,160 1,275
51 Ed Sullivan R $27,977,835 $866,231 1,266
52 David McSweeney R $28,824,845 $402,495 1,305
53 David Harris R $32,719,970 $5,343,127 1,481
54 Thomas Morrison R $28,918,829 $1,720,438 1,309
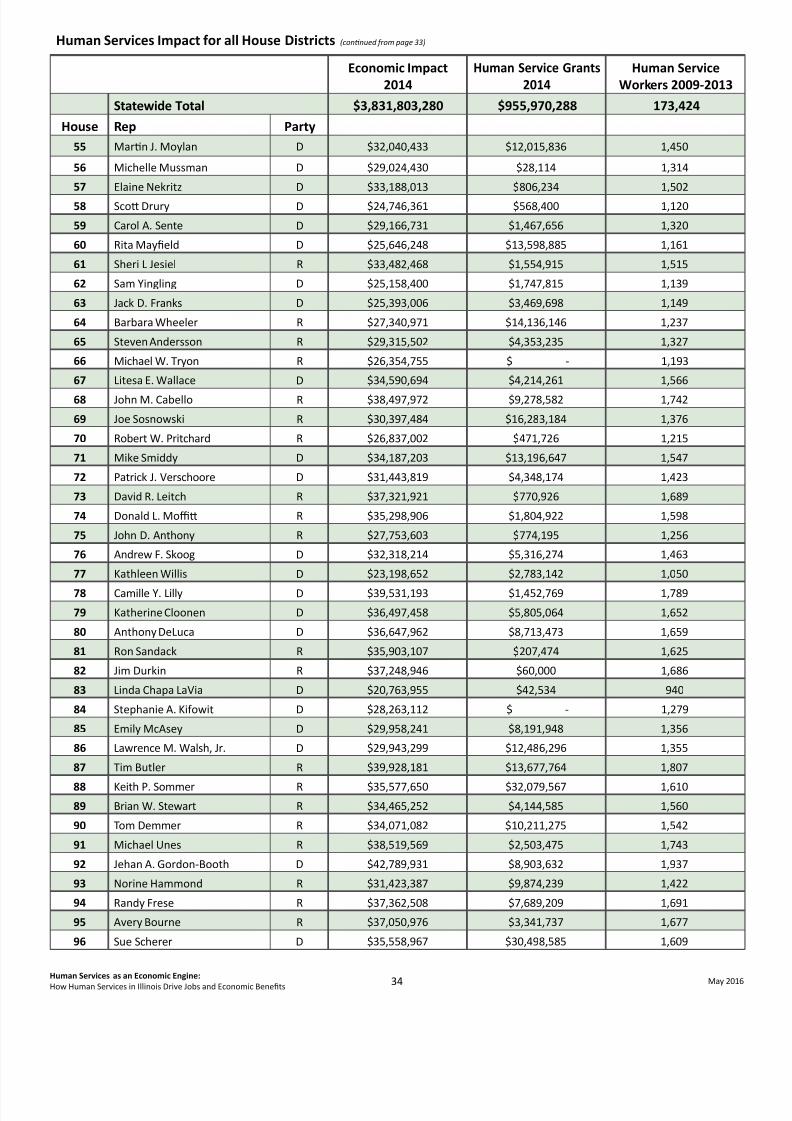
8/16/2019 Economic Impact Report- Illinois budget impasse
http://slidepdf.com/reader/full/economic-impact-report-illinois-budget-impasse 37/48
34 May 2016Human Services as an Economic Engine:How Human Services in Illinois Drive Jobs and Economic Benefts
Human Services Impact for all House Districts (con nued from page 33)
Economic Impact2014
Human Service Grants2014
Human ServiceWorkers 2009-2013
Statewide Total $3,831,803,280 $955,970,288 173,424House Rep Party
55 Mar n J. Moylan D $32,040,433 $12,015,836 1,450
56 Michelle Mussman D $29,024,430 $28,114 1,314
57 Elaine Nekritz D $33,188,013 $806,234 1,502
58 Sco Drury D $24,746,361 $568,400 1,120
59 Carol A. Sente D $29,166,731 $1,467,656 1,320
60 Rita May eld D $25,646,248 $13,598,885 1,161
61 Sheri L Jesiel R $33,482,468 $1,554,915 1,515
62 Sam Yingling D $25,158,400 $1,747,815 1,139
63 Jack D. Franks D $25,393,006 $3,469,698 1,149
64 Barbara Wheeler R $27,340,971 $14,136,146 1,237
65 Steven Andersson R $29,315,502 $4,353,235 1,327
66 Michael W. Tryon R $26,354,755 $ - 1,193
67 Litesa E. Wallace D $34,590,694 $4,214,261 1,566
68 John M. Cabello R $38,497,972 $9,278,582 1,742
69 Joe Sosnowski R $30,397,484 $16,283,184 1,376
70 Robert W. Pritchard R $26,837,002 $471,726 1,215
71 Mike Smiddy D $34,187,203 $13,196,647 1,547
72 Patrick J. Verschoore D $31,443,819 $4,348,174 1,423
73 David R. Leitch R $37,321,921 $770,926 1,689
74 Donald L. Mo R $35,298,906 $1,804,922 1,598
75 John D. Anthony R $27,753,603 $774,195 1,256
76 Andrew F. Skoog D $32,318,214 $5,316,274 1,463
77 Kathleen Willis D $23,198,652 $2,783,142 1,050
78 Camille Y. Lilly D $39,531,193 $1,452,769 1,78979 Katherine Cloonen D $36,497,458 $5,805,064 1,652
80 Anthony DeLuca D $36,647,962 $8,713,473 1,659
81 Ron Sandack R $35,903,107 $207,474 1,625
82 Jim Durkin R $37,248,946 $60,000 1,686
83 Linda Chapa LaVia D $20,763,955 $42,534 940
84 Stephanie A. Kifowit D $28,263,112 $ - 1,279
85 Emily McAsey D $29,958,241 $8,191,948 1,356
86 Lawrence M. Walsh, Jr. D $29,943,299 $12,486,296 1,355
87 Tim Butler R $39,928,181 $13,677,764 1,807
88 Keith P. Sommer R $35,577,650 $32,079,567 1,61089 Brian W. Stewart R $34,465,252 $4,144,585 1,560
90 Tom Demmer R $34,071,082 $10,211,275 1,542
91 Michael Unes R $38,519,569 $2,503,475 1,743
92 Jehan A. Gordon-Booth D $42,789,931 $8,903,632 1,937
93 Norine Hammond R $31,423,387 $9,874,239 1,422
94 Randy Frese R $37,362,508 $7,689,209 1,691
95 Avery Bourne R $37,050,976 $3,341,737 1,677
96 Sue Scherer D $35,558,967 $30,498,585 1,609

8/16/2019 Economic Impact Report- Illinois budget impasse
http://slidepdf.com/reader/full/economic-impact-report-illinois-budget-impasse 38/48
35 May 2016Human Services as an Economic Engine:How Human Services in Illinois Drive Jobs and Economic Benefts
Human Services Impact for all House Districts (con nued from page 34)
Economic Impact2014
Human Service Grants2014
Human ServiceWorkers 2009-2013
Statewide Total $3,831,803,280 $955,970,288 173,424House Rep Party
97 Mark Ba nick R $32,351,681 $499,985 1,464
98 Natalie A. Manley D $35,129,377 $4,191,394 1,590
99 Sara Wojcicki Jimenez R $44,053,049 $10,361,467 1,994
100 C.D. Davidsmeyer R $36,835,400 $4,073,781 1,667
101 Bill Mitchell R $34,758,585 $4,826,342 1,573
102 Adam Brown R $35,498,434 $1,821,490 1,607
103 Carol Ammons D $26,278,620 $22,089,988 1,189
104 Chad Hays R $31,346,235 $6,101,105 1,419
105 Dan Brady R $30,770,506 $1,309,093 1,393
106 Thomas Benne R $35,352,470 $2,771,050 1,600
107 John D. Cavale o R $40,353,524 $2,447,877 1,826
108 Charles E. Meier R $34,467,469 $6,112,032 1,560
109 David Reis R $33,468,082 $6,205,940 1,515
110 Reginald Phillips R $31,894,712 $6,357,227 1,444
111 Daniel V. Beiser D $33,441,748 $7,972,527 1,514
112 Dwight Kay R $28,374,628 $651,509 1,284
113 Jay Ho man D $41,726,980 $4,776,403 1,889
114 Eddie Lee Jackson, Sr. D $37,143,866 $6,554,812 1,681
115 Terri Bryant R $32,985,944 $5,954,298 1,493
116 Jerry F. Costello, II D $34,690,971 $3,193,734 1,570
117 John E. Bradley D $36,151,067 $8,111,726 1,636
118 Brandon W. Phelps D $33,781,150 $12,678,704 1,529

8/16/2019 Economic Impact Report- Illinois budget impasse
http://slidepdf.com/reader/full/economic-impact-report-illinois-budget-impasse 39/48
36 May 2016Human Services as an Economic Engine:How Human Services in Illinois Drive Jobs and Economic Benefts
Types of Human Service Establishments by County
Geography
Outpa entMental
Health andSubstance
AbuseCenters
Residen alIntellectualor Devel -opmental
Disabili esMental
Health andSubstance
AbuseFacili es
Individualand Family
Services
CommunityFood,
Housing,Emergency,
or OtherRelief
Services
Voca onalRehabil -ita on
Services
ChildDay CareCenters
Total Hu -man Service
Establish -ments Per
County
Number ofPersons in
Poverty PerCounty
Ra o oPersons
in Povertto Huma
ServiceEstablish
ments
Adams County 6 14 6 1 7 34 9,374 275.7
Alexander County 1 1 1 2 5 2,399 479.8
Bond County 5 2 7 2,462 351.7
Boone County 2 4 1 10 17 6,055 356.2
Brown County 2 1 3 641 213.7
Bureau County 1 3 6 1 1 3 15 3,955 263.7
Calhoun County 1 1 593 593.0
Carroll County 1 1 2 2 4 10 2,038 203.8
Cass County 1 1 1 2 5 1,975 395.0
Champaign County 3 21 48 10 4 36 122 41,384 339.2Chris an County 4 7 4 5 20 4,873 243.7
Clark County 1 3 4 1,956 489.0
Clay County 10 5 3 2 20 2,100 105.0
Clinton County 12 8 2 1 13 36 3,184 88.4
Coles County 7 31 16 2 4 8 68 10,829 159.3
Cook County 121 464 984 195 137 1,414 3,315 868,652 262.0
Crawford County 4 5 2 1 12 2,688 224.0
CumberlandCounty
1 2 2 5 1,497 299.4
DeKalb County 6 19 19 2 3 22 71 18,622 262.3De Wi County 2 4 1 4 11 2,259 205.4
Douglas County 2 1 4 7 2,028 289.7
DuPage County 11 38 157 37 11 193 447 62,913 140.7
Edgar County 2 4 6 3,311 551.8
Edwards County 3 3 757 252.3
E ngham County 2 3 9 5 3 9 31 3,066 98.9
Faye e County 1 3 4 4 12 3,548 295.7
Ford County 6 6 1,416 236.0
Franklin County 1 2 11 1 5 20 7,410 370.5
Fulton County 1 3 5 2 3 8 22 4,566 207.5
Galla n County 1 1 1 3 929 309.7
Greene County 1 3 4 1,775 443.8
Grundy County 1 8 4 1 8 22 4,468 203.1
Hamilton County 3 1 1 2 7 1,413 201.9
Hancock County 1 4 5 2,535 507.0
Hardin County 2 2 1 1 6 992 165.3
Henderson County 1 2 3 799 266.3
Henry County 1 3 7 1 2 11 25 5,179 207.2
Iroquois County 15 10 2 4 31 3,922 126.5

8/16/2019 Economic Impact Report- Illinois budget impasse
http://slidepdf.com/reader/full/economic-impact-report-illinois-budget-impasse 40/48
37 May 2016Human Services as an Economic Engine:How Human Services in Illinois Drive Jobs and Economic Benefts
Types of Human Service Establishments by County (con nued from page 36)
Geography
Outpa entMental
Health andSubstance
AbuseCenters
Residen alIntellectualor Devel -opmental
Disabili esMental
Health andSubstance
Abuse Facil -i es
Individualand Family
Services
CommunityFood,
Housing,Emergency,
or OtherRelief
Services
Voca onalRehabil -ita on
Services
ChildDay CareCenters
Total Hu -man Service
Establish -ments Per
County
Number ofPersons in
Poverty PerCounty
Ra o oPersons
in Povertto Huma
ServiceEstablish
mentsJackson County 4 13 13 1 3 4 38 16,711 439.8
Jasper County 2 2 4 635 158.8
Je erson County 1 11 9 2 3 7 33 6,081 184.3
Jersey County 1 6 3 10 1,668 166.8
Jo Daviess County 4 3 1 3 11 2,121 192.8
Johnson County 2 4 2 8 1,500 187.5
Kane County 15 43 69 18 6 91 242 56,796 234.7
Kankakee County 4 31 23 4 3 21 86 17,848 207.5
Kendall County 2 8 9 2 26 47 5,540 117.9
Knox County 2 20 10 3 8 8 51 8,068 158.2Lake County 10 30 102 8 13 211 374 61,256 163.8
LaSalle County 5 16 18 7 7 13 66 13,423 203.4
Lawrence County 3 5 2 1 11 1,462 132.9
Lee County 1 19 8 3 7 38 3,531 92.9
Livingston County 1 6 5 1 2 8 23 3,533 153.6
Logan County 1 9 6 1 4 21 3,228 153.7
McDonoughCounty
2 5 8 1 3 4 23 6,324 275.0
McHenry County 8 23 43 8 1 75 158 23,542 149.0
McLean County 3 14 30 5 2 37 91 23,051 253.3
Macon County 5 13 25 12 1 8 64 18,707 292.3
Macoupin County 1 1 6 10 18 5,714 317.4
Madison County 4 35 45 10 12 60 166 36,554 220.2
Marion County 8 10 1 3 15 37 6,897 186.4
Marshall County 1 1 2 1,333 666.5
Mason County 1 1 4 6 2,323 387.2
Massac County 1 3 1 2 7 2,458 351.1
Menard County 3 3 6 1,221 203.5
Mercer County 3 1 4 8 1,623 202.9
Monroe County 2 5 10 17 1,780 104.7
MontgomeryCounty
1 5 5 6 17 3,444 202.6
Morgan County 2 10 14 4 1 11 42 4,681 111.5
Moultrie County 2 2 1 1 2 8 1,851 231.4
Ogle County 2 1 8 2 5 18 5,907 328.2
Peoria County 3 29 47 15 10 35 139 31,258 224.9
Perry County 1 6 5 1 5 18 3,670 203.9
Pia County 3 2 4 9 1,022 113.6
Pike County 1 1 3 5 2,616 523.2
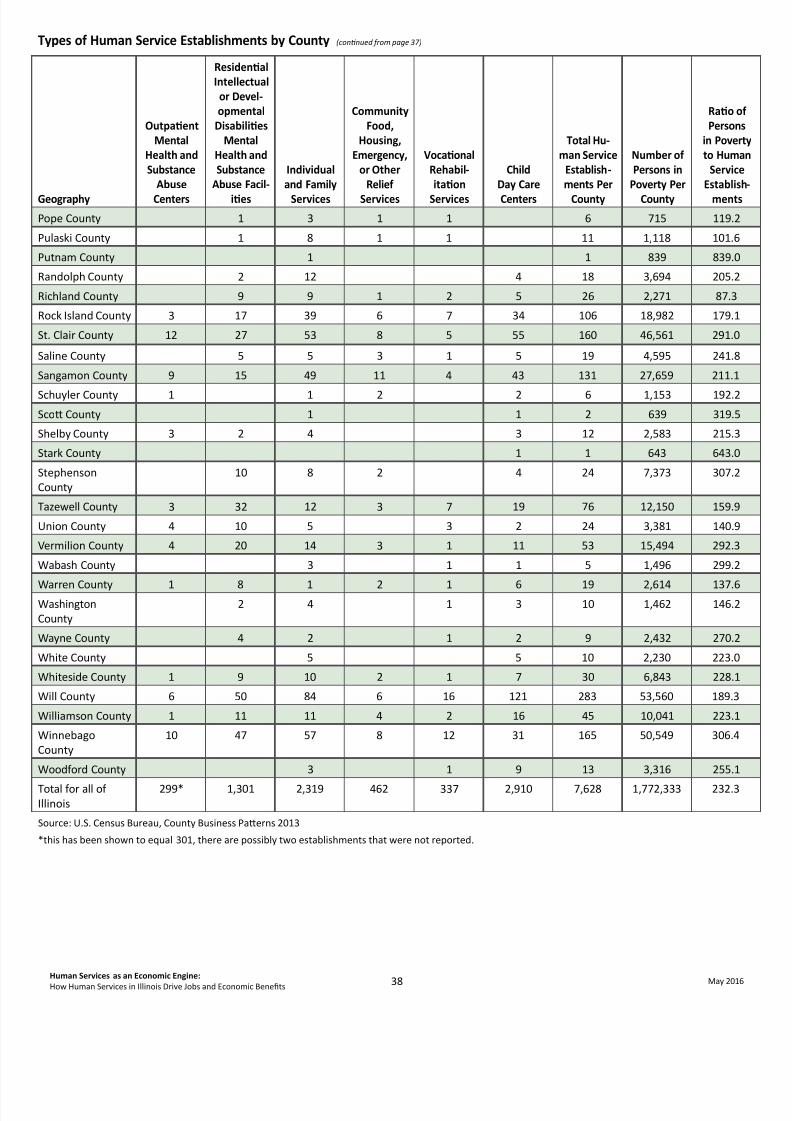
8/16/2019 Economic Impact Report- Illinois budget impasse
http://slidepdf.com/reader/full/economic-impact-report-illinois-budget-impasse 41/48
38 May 2016Human Services as an Economic Engine:How Human Services in Illinois Drive Jobs and Economic Benefts
Types of Human Service Establishments by County (con nued from page 37)
Geography
Outpa entMental
Health andSubstance
AbuseCenters
Residen alIntellectualor Devel -opmental
Disabili esMental
Health andSubstance
Abuse Facil -i es
Individualand Family
Services
CommunityFood,
Housing,Emergency,
or OtherRelief
Services
Voca onalRehabil -ita on
Services
ChildDay CareCenters
Total Hu -man Service
Establish -ments Per
County
Number ofPersons in
Poverty PerCounty
Ra o oPersons
in Povertto Huma
ServiceEstablish
mentsPope County 1 3 1 1 6 715 119.2
Pulaski County 1 8 1 1 11 1,118 101.6
Putnam County 1 1 839 839.0
Randolph County 2 12 4 18 3,694 205.2
Richland County 9 9 1 2 5 26 2,271 87.3
Rock Island County 3 17 39 6 7 34 106 18,982 179.1
St. Clair County 12 27 53 8 5 55 160 46,561 291.0
Saline County 5 5 3 1 5 19 4,595 241.8
Sangamon County 9 15 49 11 4 43 131 27,659 211.1
Schuyler County 1 1 2 2 6 1,153 192.2Sco County 1 1 2 639 319.5
Shelby County 3 2 4 3 12 2,583 215.3
Stark County 1 1 643 643.0
StephensonCounty
10 8 2 4 24 7,373 307.2
Tazewell County 3 32 12 3 7 19 76 12,150 159.9
Union County 4 10 5 3 2 24 3,381 140.9
Vermilion County 4 20 14 3 1 11 53 15,494 292.3
Wabash County 3 1 1 5 1,496 299.2
Warren County 1 8 1 2 1 6 19 2,614 137.6WashingtonCounty
2 4 1 3 10 1,462 146.2
Wayne County 4 2 1 2 9 2,432 270.2
White County 5 5 10 2,230 223.0
Whiteside County 1 9 10 2 1 7 30 6,843 228.1
Will County 6 50 84 6 16 121 283 53,560 189.3
Williamson County 1 11 11 4 2 16 45 10,041 223.1
WinnebagoCounty
10 47 57 8 12 31 165 50,549 306.4
Woodford County 3 1 9 13 3,316 255.1
Total for all ofIllinois
299* 1,301 2,319 462 337 2,910 7,628 1,772,333 232.3
Source: U.S. Census Bureau, County Business Pa erns 2013
*this has been shown to equal 301, there are possibly two establishments that were not reported.

8/16/2019 Economic Impact Report- Illinois budget impasse
http://slidepdf.com/reader/full/economic-impact-report-illinois-budget-impasse 42/48
39 May 2016Human Services as an Economic Engine:How Human Services in Illinois Drive Jobs and Economic Benefts
Methodology
Economic Impact
Economic impact es mates were developed for this report by the Public Policy Center of the University of Massachuse sat Dartmouth. The Center used the IMPLAN system of economic impact analysis, which u lizes input-output analysis incombina on with regional social accoun ng matrices.
Inputs to the IMPLAN model included wages paid to human service employees and proprietorships, which were obtained fromtwo Census databases: County Business Pa erns and Nonemployer Sta s cs. County Business Pa erns (CBP) is an annualseries that provides subna onal economic data by industry. This series includes the number of establishments, employmentduring the week of March 12, for each year, rst quarter payroll and annual payroll (see www.census.gov/econ/cbp/ ).
Proprietors and partners of unincorporated businesses are not included in the County Business Pa ern employmentdata. This data was obtained from the Census’ Nonemployer Sta s cs database, an annual series that providessubna onal economic data for businesses that have no paid employees and are subject to federal income tax(see www.census.gov/econ/nonemployer/index.html ).
In order to determine the economic impact of the human services industry’s $4.2 billion annual payroll in 2013, adisposable income ra o was calculated using IMPLAN’s social accoun ng matrix, which takes into account income-speci c factors by household income group to determine the amount of money workers spend on expenses excludingthe amount paid for taxes and savings. The resul ng total disposable income of human service workers was the basis forthe IMPLAN analysis, which generated induced nancial, employment, and tax impacts for Illinois.
Number of Human Service Workers
There is no formal de ni on of “human services worker” infederal data sources. The data in this report uses several datasources to es mate the contribu ons and characteris csof human service workers, and the total number of such
workers varies unavoidably among the survey instrumentsthat were employed here.
Es mates of Human Service Workers’Economic Characteris cs
The IMPLAN model requires the use of County BusinessPa erns and Nonemployer Sta s cs for popula on totals.The number of human service workers in these surveys inIllinois total 206,183.
Es mates of Human Service Worker Characteris cs
The American Community Survey (ACS) (see www.census.gov/programs-surveys/acs/about.html ) is the primarysource of informa on on the characteris cs of workers in the United States. For this report, ACS data from the 2009-2013 period were used for es mates of human service workers in major industrial categories (e.g., the number ofvoca onal rehabilita on workers) and for es mates of their educa onal a ainment and income levels. The table belowdisplays the categories of human service workers using the major industrial classi ca ons employed by the CensusBureau. This data is generated from Public Use Microdata Samples (PUMS), which are an approximately ve percentsample of individual ACS records. Human service workers as es mated by the PUMS total 169,108 in Illinois.

8/16/2019 Economic Impact Report- Illinois budget impasse
http://slidepdf.com/reader/full/economic-impact-report-illinois-budget-impasse 43/48
40 May 2016Human Services as an Economic Engine:How Human Services in Illinois Drive Jobs and Economic Benefts
PUMS Industrial Codes and Number of Employed Civilian Workers in Illinois: 2009-2013
Categories Industry Code Number of WorkersSocial Assistance Total 169,108
Residen al care facili es, except skilled nursing facili es 8290 30,945Individual and family services 8370 60,038Community food and housing, and emergency services 8380 4,282
Voca onal rehabilita on services 8390 9,422Child day care services 8470 64,421
NAICS Code Industry CategoryEstablishments
in 201362142 Outpa ent mental health and substance abuse centers 3016232 Residen al intellectual and developmental disability, mental health, and substance
abuse facili es1,301
62321 Residen al intellectual and developmental disability facili es 99662322 Residen al mental health and substance abuse facili es 305624 Social assistance 6,0286241 Individual and family services 2,31962411 Child and youth services 47362412 Services for the elderly and persons with disabili es 716
62419 Other individual and family services 1,1306242 Community food and housing, and emergency and other relief services 46262421 Community food services 15362422 Community housing services 272
624221 Temporary shelters 116624229 Other community housing services 15662423 Emergency and other relief services 37
6243 Voca onal rehabilita on services 337
6244 Child day care services 2,910
Es ma ng Wages per HourFor the analysis, we restricted the universe to full- me workers, de ned as working at least 35 hours per week and 48weeks or more, who were also in the civilian labor force. The American Community Survey provides data on the numberof weeks worked in ranges. Some recoding of ACS ranges was done; workers repor ng 50 to 52 weeks worked wererecoded as working 51 weeks, and workers repor ng 48 to 49 weeks were recoded as 48.5 weeks. The recoded weeksworked value was mul plied by the usual number of hours worked per week to develop an annual es mate of hoursworked. This annual amount was divided into the sum of wages and salary income reported for each person. The resultis an hourly wage es mate for each worker.
De ning Human Service EstablishmentsThe number of human service establishments in Illinois comes from the U.S. Census Bureau’s County Business Pa ernsreports (see www.census.gov/econ/cbp/overview.htm ). County Business Pa erns are derived from The Business Register,a Census Bureau database of all known business establishments located in the United States with paid employees.
County Business Pa erns reports use North American Industrial Categories (NAICS) which are used by the federalgovernment to classify business establishments for the purpose of publishing data on the U.S. business economy.Human service establishments are in the NAICS category 62 Healthcare and Social Assistance. The table below shows thediscrete categories within the NAICS 62 series de ned as human service establishments in this report.

8/16/2019 Economic Impact Report- Illinois budget impasse
http://slidepdf.com/reader/full/economic-impact-report-illinois-budget-impasse 44/48
41 May 2016Human Services as an Economic Engine:How Human Services in Illinois Drive Jobs and Economic Benefts
Es mates of Economic Impact by Legisla ve DistrictThese es mates are based on applying a statewide es mate of economicimpact per human services worker to the number of human service workers perdistrict. Statewide, the 206,183 human service workers leveraged $4.5 billion ineconomic impact, or $22,095 per worker.
Es mates of Human Service Workers in Legisla ve Districts
Es mates of human service workers by state legisla ve district are not available,
and so data at the census tract level was used. For each census tract anes mate of human service workers was developed on the basis of tract-level,published es mates of “healthcare and social assistance workers.” From thispopula on, the number of social assistance workers (which represent humanservice workers) was es mated by applying a factor of 0.218 as, statewide,social assistance workers are 21.8 percent of all healthcare and social assistanceworkers combined. Applying this es mate to tract popula ons leads to astatewide es mate of human service workers of 173,671.
The tract-level es mates were appor oned to blocks using block-to-tractpopula on ra os. The resul ng block-level es mates are subsequently summedto state legisla ve districts by using district geographic de ni ons de ned during
the most recent redistric ng process, and found at www.ilhousedems.com/redistric ng . These de ni ons assign each block in Illinois to a legisla ve district.
Es ma ng Human Service Grants by Legisla ve DistrictThe Illinois Department of Human Services posts human service grant amountsat the Illinois state data portal. The data are provided by zip code. Data for eachzip code was assigned to a legisla ve district based on the district that containsthe geographic center of a given zip code (i.e., its “centroid”).

8/16/2019 Economic Impact Report- Illinois budget impasse
http://slidepdf.com/reader/full/economic-impact-report-illinois-budget-impasse 45/48
42 May 2016Human Services as an Economic Engine:How Human Services in Illinois Drive Jobs and Economic Benefts
Human Service Establishments in the North American IndustryClassi ca on System
The North American Industry Classi ca on System (NAICS) is thestandard used by the federal government to classify business
establishments. The NAICS categories used in this report are asfollows.
Outpa ent Mental Health and Substance Abuse Centers
NAICS Category 621420
• This industry comprises establishments with medicalsta primarily engaged in providing outpa ent servicesrelated to the diagnosis and treatment of mental healthdisorders and alcohol and other substance abuse. Theseestablishments generally treat pa ents who do not requireinpa ent treatment. They may provide a counseling staand informa on regarding a wide range of mental healthand substance abuse issues and/or refer pa ents to moreextensive treatment programs,if necessary.
Examples:
• Alcoholism treatment centers and clinics(except hospitals), outpa ent
• Detoxi ca on centers and clinics (except hospitals),outpa ent
• Drug addic on treatment centers and clinics(except hospitals), outpa ent
• Mental health centers and clinics (except hospitals),outpa ent
• Outpa ent mental health centers and clinics(except hospitals)
• Outpa ent treatment centers and clinics(except hospitals) for substance abuse(i.e., alcoholism, drug addic on)
• Outpa ent treatment centers and clinics for alcoholism • Outpa ent treatment centers and clinics for
drug addic on • Psychiatric centers and clinics (except hospitals), outpa ent • Substance abuse treatment centers and clinics
(except hospitals), outpa ent
Residen al Intellectual and Developmental Disability, MentalHealth, and Substance Abuse Facili es
Includes NAICS categories:
• 623210 Residen al Intellectual and Developmental DisabilityFacili es
• This industry comprises establishments(e.g., group homes, hospitals, intermediate carefacili es) primarily engaged in providing residen al careservices for persons diagnosed with intellectual anddevelopmental disabili es. These facili es may provide
some healthcare, though the focus is room, board,protec ve supervision, and counseling.
• 623220 Residen al Mental Health and SubstanceAbuse Facili es
• This industry comprises establishments primarilyengaged in providing residen al care and treatmentfor pa ents with mental health and substance abuseillnesses. These establishments provide room, board,supervision, and counseling services. Although medicalservices may be available at these establishments, theyare incidental to the counseling, mental rehabilita on,and support services o ered. These establishmentsgenerally provide a wide range of social services inaddi on to counseling.
Examples:
• Group homes, intellectual and developmental disability • Homes with or without healthcare, intellectual and
developmental disability • Hospitals, intellectual and developmental disability • Intellectual and developmental disability facili es (e.g.,
homes, hospitals, intermediate care facili es), residen al • Intellectual and developmental disability homes • Intellectual and developmental disability hospitals • Intellectual and developmental disability intermediate care
facili es • Intermediate care facili es, intellectual and developmental
disability
• Alcoholism rehabilita on facili es (except licensedhospitals), residen al • Convalescent homes or hospitals for psychiatric pa ents • Drug addic on rehabilita on facili es (except licensed
hospitals), residen al • Halfway houses for pa ents with mental health illnesses • Halfway houses, substance abuse (e.g., alcoholism,
drug addic on) • Homes for emo onally disturbed adults or children • Homes, psychiatric convalescent • Hospitals, psychiatric convalescent • Mental health facili es, residen al • Mental health halfway houses • Psychiatric convalescent homes or hospitals • Residen al group homes for the emo onally disturbed • Substance abuse (i.e., alcoholism, drug addic on)
halfway houses • Substance abuse facili es, residen al
Individual and Family Services
NAICS Category 6241
• This industry comprises establishments primarily engaged
Appendix

8/16/2019 Economic Impact Report- Illinois budget impasse
http://slidepdf.com/reader/full/economic-impact-report-illinois-budget-impasse 46/48
43 May 2016Human Services as an Economic Engine:How Human Services in Illinois Drive Jobs and Economic Benefts
in providing nonresiden al social assistance services forchildren and youth. These establishments provide for thewelfare of children in such areas as adop on and fostercare, drug preven on, life skills training, and posi vesocial development.
Examples:
• Adop on agencies • Adop on services, child
• Aid to families with dependent children (AFDC) • Child guidance agencies • Child welfare services • Community centers (except recrea onal only), youth • Foster care placement agencies • Foster home placement services • Self-help organiza ons, youth • Teen outreach services • Youth centers (except recrea onal only) • Youth guidance organiza ons • Youth self-help organiza ons
• Ac vity centers for disabled persons, the elderly, andpersons diagnosed with intellectual and developmentaldisabili es
• Centers, senior ci zens’ • Community centers (except recrea onal only), adult • Companion services for disabled persons, the elderly, and
persons diagnosed with intellectual and developmentaldisabili es
• Day care centers for disabled persons, the elderly, andpersons diagnosed with intellectual and developmentaldisabili es
• Day care centers, adult • Disability support groups • Home care of elderly, non-medical • Homemaker’s service for elderly or disabled persons, non-
medical
• Self-help organiza ons for disabled persons, the elderly,and persons diagnosed with intellectual and developmentaldisabili es
• Senior ci zens ac vity centers • Senior ci zens centers • Alcoholism and drug addic on self-help organiza ons • Alcoholism counseling (except medical treatment),
nonresiden al • Alcoholism self-help organiza ons • Community ac on service agencies • Counseling services • Crisis interven on centers • Drug addic on self-help organiza ons • Exo ender rehabilita on agencies • Exo ender self-help organiza ons • Family social service agencies • Family welfare services
• Hotline centers • Individual and family social services, mul -purpose • Marriage counseling services (except by o ces of mental
health prac oners) • Media on, social service, family, agencies • Mul service centers, neighborhood • O ender self-help organiza ons • Paren ng support services
• Parole o ces, privately operated • Proba on o ces, privately operated • Rape crisis centers • Referral services for personal and social problems • Rehabilita on agencies for o enders • Self-help organiza ons (except for disabled persons,
the elderly, persons diagnosed with intellectual anddevelopmental disabili es)
• Social service agencies, family • Social service centers, mul purpose • Suicide crisis centers
• Support group services • Telephone counseling services • Travelers’ aid centers • Welfare service centers, mul -program
Community Food, Housing, Emergency orOther Relief Services
Includes NAICS Categories
• 62421 Community Food Services
• This industry comprises establishments primarily engagedin the collec on, prepara on, and delivery of food for theneedy. Establishments in this industry may also distributeclothing and blankets to the poor. These establishmentsmay prepare and deliver meals to persons who by reasonof age, disability, or illness are unable to prepare mealsfor themselves; collect and distribute salvageable ordonated food; or prepare and provide meals at xed ormobile loca ons. Food banks, meal delivery programs,and soup kitchens are included in this industry.
• 62422 Community Housing Services
• This industry comprises establishments primarilyengaged in providing one or more of the followingcommunity housing services: (1) short term emergencyshelter for vic ms of domes c violence, sexual assault,or child abuse; (2) temporary residen al shelter for thehomeless, runaway youths, and pa ents and familiescaught in medical crises; (3) transi onal housing forlow-income individuals and families; (4) volunteerconstruc on or repair of low cost housing, in partnershipwith the homeowner who may assist in construc onor repair work; and (5) repair of homes for elderlyor disabled homeowners. These establishments mayoperate their own shelter; or may subsidize housingusing exis ng homes, apartments, hotels, or motels; ormay require a low-cost mortgage or work (sweat) equity.
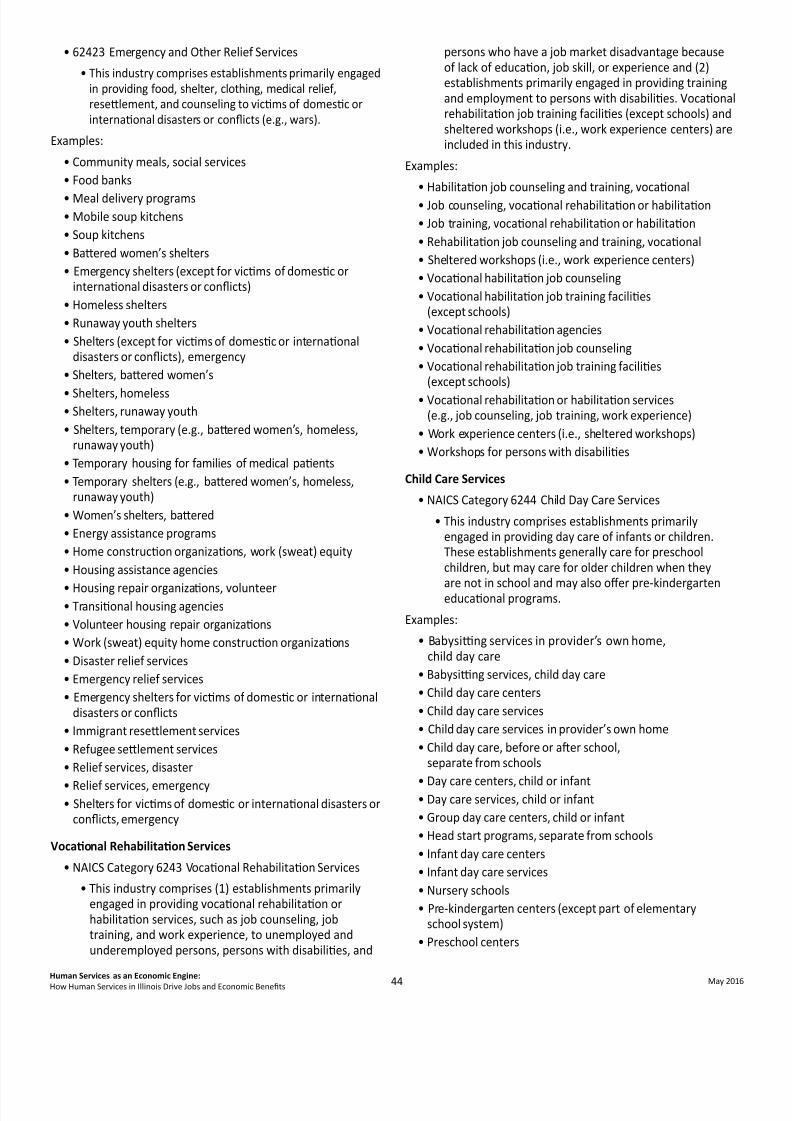
8/16/2019 Economic Impact Report- Illinois budget impasse
http://slidepdf.com/reader/full/economic-impact-report-illinois-budget-impasse 47/48
44 May 2016Human Services as an Economic Engine:How Human Services in Illinois Drive Jobs and Economic Benefts
• 62423 Emergency and Other Relief Services
• This industry comprises establishments primarily engagedin providing food, shelter, clothing, medical relief,rese lement, and counseling to vic ms of domes c orinterna onal disasters or con icts (e.g., wars).
Examples:
• Community meals, social services • Food banks
• Meal delivery programs • Mobile soup kitchens • Soup kitchens • Ba ered women’s shelters • Emergency shelters (except for vic ms of domes c or
interna onal disasters or con icts) • Homeless shelters • Runaway youth shelters • Shelters (except for vic ms of domes c or interna onal
disasters or con icts), emergency • Shelters, ba ered women’s
• Shelters, homeless • Shelters, runaway youth • Shelters, temporary (e.g., ba ered women’s, homeless,
runaway youth) • Temporary housing for families of medical pa ents • Temporary shelters (e.g., ba ered women’s, homeless,
runaway youth) • Women’s shelters, ba ered • Energy assistance programs • Home construc on organiza ons, work (sweat) equity • Housing assistance agencies
• Housing repair organiza ons, volunteer • Transi onal housing agencies • Volunteer housing repair organiza ons • Work (sweat) equity home construc on organiza ons • Disaster relief services • Emergency relief services • Emergency shelters for vic ms of domes c or interna onal
disasters or con icts • Immigrant rese lement services • Refugee se lement services • Relief services, disaster
• Relief services, emergency • Shelters for vic ms of domes c or interna onal disasters or
con icts, emergency
Voca onal Rehabilita on Services
• NAICS Category 6243 Voca onal Rehabilita on Services
• This industry comprises (1) establishments primarilyengaged in providing voca onal rehabilita on orhabilita on services, such as job counseling, jobtraining, and work experience, to unemployed andunderemployed persons, persons with disabili es, and
persons who have a job market disadvantage becauseof lack of educa on, job skill, or experience and (2)establishments primarily engaged in providing trainingand employment to persons with disabili es. Voca onalrehabilita on job training facili es (except schools) andsheltered workshops (i.e., work experience centers) areincluded in this industry.
Examples:
• Habilita on job counseling and training, voca onal • Job counseling, voca onal rehabilita on or habilita on • Job training, voca onal rehabilita on or habilita on • Rehabilita on job counseling and training, voca onal • Sheltered workshops (i.e., work experience centers) • Voca onal habilita on job counseling • Voca onal habilita on job training facili es
(except schools) • Voca onal rehabilita on agencies • Voca onal rehabilita on job counseling • Voca onal rehabilita on job training facili es
(except schools) • Voca onal rehabilita on or habilita on services
(e.g., job counseling, job training, work experience) • Work experience centers (i.e., sheltered workshops) • Workshops for persons with disabili es
Child Care Services
• NAICS Category 6244 Child Day Care Services
• This industry comprises establishments primarilyengaged in providing day care of infants or children.These establishments generally care for preschoolchildren, but may care for older children when they
are not in school and may also o er pre-kindergarteneduca onal programs.
Examples:
• Babysi ng services in provider’s own home,child day care
• Babysi ng services, child day care • Child day care centers • Child day care services • Child day care services in provider’s own home • Child day care, before or a er school,
separate from schools
• Day care centers, child or infant • Day care services, child or infant • Group day care centers, child or infant • Head start programs, separate from schools • Infant day care centers • Infant day care services • Nursery schools • Pre-kindergarten centers (except part of elementary
school system) • Preschool centers

8/16/2019 Economic Impact Report- Illinois budget impasse
http://slidepdf.com/reader/full/economic-impact-report-illinois-budget-impasse 48/48
HUMAN SERVICE
I L L I N O I S P A R T N E R S
for
For addi onal copies or more informa on, please contact: