Embed Size (px)
Citation preview

Economic impacts of hosting a
major sporting event
Did the 1998 FIFA World Cup in France have positive impacts on
employment?
Author: Thomas Giraud Tutor: Lars Behrenz
Examiner: Dominique Anxo
Subject: Economics

Thomas Giraud
2
Abstract
This paper examines the effects on employment due to a mega-sport event and more
precisely this study demonstrates that the 1998 Football World cup in France had a
significant positive effect on employment in the host regions. Moreover, it shows the
impact differences between the host regions where some have been more affected than
other. This work is the first to analyze the effect on employment in the host regions
using a Difference in Difference approach. The basic DID model is then improved to add
new parameters in the regression. It is one of the rare studies to find a significant
positive impact on the economy owing of the World cup or the Olympic Games.

Thomas Giraud
3
Contents
1 Introduction ........................................................................................................................ 4
2 Review of literature ......................................................................................................... 5
2.1 The significant cost of hosting a major sporting event ............................. 5
2.2 Impact on growth ...................................................................................................... 7
2.3 An Impact overestimated ...................................................................................... 8
2.4 Several more cases ................................................................................................... 9
2.5 Employment effect ................................................................................................ 10
2.6 Differences between developed and developing countries ................. 11
2.6.i Disadvantages for developing countries .................................................. 12
2.6.ii Advantages for developing countries ........................................................ 13
2.7 The counterfactual ................................................................................................ 13
3 Empirical application ................................................................................................... 14
4 Methodology .................................................................................................................... 18
4.1 Model specification ............................................................................................... 18
4.2 Estimation ................................................................................................................. 22
5 Results ................................................................................................................................ 23
5.1 Classical Difference in Difference estimation ............................................ 23
5.2 Modified Difference in Difference regression ............................................ 23
6 Analysis .............................................................................................................................. 24
7 Conclusion and possible improvements .............................................................. 27
8 Appendix ........................................................................................................................... 29
9 References ........................................................................................................................ 32
Thomas Giraud
4
1 Introduction
The Football World Cup and Olympic Games are together the largest sporting events
since the 20th century in human history. Both of them happen every four years and
nations across the globe apply to host the event in attempt to encourage economical
activities as well as acquiring positive political, psychological, sociological and cultural
effects in their native countries. Nevertheless, the economical implication of hosting
these sporting events is the most studied and researched among all other activities.
Since such events involve large scale investments from the public and private sectors,
and constructions of new facilities and infrastructures, hosts hope to acquire a
significant return on their investments and a boost in their economy. However, studying
ex post analyses in the last two decade, only few of them seem to have an improvement
on aggregated wages, income, and/or employment generated by mega sport event. Since
twenty years, new methods occurred using more disaggregated data and different
variables.
In 1998, France hosted the Football World Cup and also won the finale against Brazil,
the “country of football”, with a large score of 3-0. Since it was the first time France won
the cup, people were euphoric and economist assumed it boosted a little bit the
economy in the short run. This study will focus on this event, and its aim will be to find
whether the World Cup had a positive impact on the French economy. In order to
proceed this analyze, I will look at the employment in France before and after the event.
I will use a method became widespread after the work by Ashenfelter and Card (1985):
the Difference in Difference method. One of the most famous DID study was realized by
Card and Krueger in 1994. They compared employment in the fast food sector in New
Jersey and in Pennsylvania. In this case, I will compare employment in the 8 regions that
welcomed the World Cup, with the 14 others regions. Data from 8 years before the event
and 10 years after will be used.
To my knowledge, the present work is the first to analyze the effects on employment
with a Difference in Difference method and to compare the host regions with the non-
host regions. It is interesting to see if they have been impacted by the World Cup
whereas the remaining regions have not or maybe less. Making use of this method, it
may be easier to find a positive effect because it employs disaggregated data. The first
Thomas Giraud
5
section will present a review of literature where the huge cost of hosting will be shown
as well as different past studies on growth and several more cases. The second part will
be an empirical application using the data and then a presentation of our methodology.
Later will be the exhibition of the results to analyze them in the next part. Finally, the
last section will conclude the work.
2 Review of literature
According to Baade, Baumann, and Matheson (2011), trying to find significant
economic impacts of mega-events is “equivalent to trying to uncover the proverbial
needle in the haystack.” Looking at existing ex post studies like Olympic Games or FIFA
Football World Cup, only few of them succeeded to find positive impacts on the
economy. The big size of the host country could be a reason because it is hard to identify
the mega-event impacts on the global economy. For example, Kurscheidt, Prub, and
Schutte (2008) found an impact through substitution-adjusted consumer spending of
€3.2 billion during the 2006 football World Cup in Germany. It seems to be a good result
but compared with the GDP of Germany in 2006 which was €2325 billion it is only an
impact of 0.14%. You could assume that any positive impact of a sporting event will
certainly be lost within normal fluctuations in the economy.
How does a country obtain the right to host a major sporting event? It differs a bit for
different championship but the main attribution reason is the economic project. Of
course politic have to be taken into account but the economic aspect is the most
important factor because it gives host country the chance to build or to improve
facilities, infrastructures etc.
2.1 The significant cost of hosting a major sporting event
A major sporting event like World Cup or Olympic Games leads to big capital
expenditures in new and improved facilities for the host. They can get help from private
investments for instance to provide new hostels and other tourist related capacities but
a good part comes from public investments. A good way to save money for the state is to
Thomas Giraud
6
hire volunteers to work in the organization of the event like during the London Olympic
Games in 2012. They engaged 70,000 volunteers and they did not even house them or
refund their traveling ticket. However it is still very attractive for people because they
can in one sense participate and get a great experience from that work.
It costs a lot of money to welcome a mega-event in the short run but that is not all. On
the long run it is still very costly to maintain the new stadiums and one saw some
countries that deserted their new facilities because of the cost. A very recent example is
the winter Olympic Games in Sochi; it cost $51 billion to Russia (International Olympic
Comitee, 2014). They are the most expensive games ever. In comparison, the 2008
summer Olympic Games in Beijing cost $40 billion (AFP, 2013) and they were before
Sochi the most expensive games. The total budget was 3 times more than expected and
people speak about corruption. They spent $17 billion in infrastructures and in the
construction of the stadium (AFP, 2013). 2 months after, Sochi is a ghost town. The
journalist Alexander Valov uploaded pictures from the Olympic park completely desert
(L’Equipe, 2014). The constructions are no longer useful since it was built to host mega-
event; they are too big to host little events. A welcome country has to think also about
the “after event” otherwise it could be a financial problem in the future.
There are also very significant operating expenditures because of the security, extra
police time, renting equipment etc. Indeed, security is enhanced because of terrorism
fear. We can recall the politically disastrous during the 1972 summer Olympic Games in
Munich which were marred by a terrorist attack who killed 11 Israeli team members.
Since this tragedy the security cost is even more important and taken in account very
carefully.
For instance, Brazil will host the FIFA World Cup soon; it will start the 12th of June
2014. The country expensed €10 billion in total to prepare the event. This includes the
security price of €300 million. Actually, it is a big amount because population in Brazil
protests against the government due to the huge expenditures they have done to
welcome the event while this amount could have been used to improve education or to
help Brazilian people. In comparison, France expensed in total €1.5 billion for the 1998
World cup. The difference comes from the fact they had already all the stadiums and
they only needed to renovate and to improve them. They built only one new stadium:
the “Stade de France” while Brazil had more construction to manage.

Thomas Giraud
7
As explained previously, there are huge expenditures to prepare a major sporting
event. So from where do they expect make money? The main source of revenue comes
from tourism and visitor expenditures. They also expect a raise in production and so an
increase of the GDP growth. Moreover they expect a multiplier effect due to all expenses.
2.2 Impact on growth
Most of economists assume that the impact on the GDP growth rate by the FIFA
World Cup is very small or null for the host. We might observe an increase of the GDP
growth rate during and few months after the event due to the rise in consumption and
therefore in production. However, in the medium and long-term consumption comes
back to normal and growth follows the movement.
For instance, Germany hosted the World Cup in 2006 and the country spent €7
billion in infrastructures and facilities (stadium reconditioning and building). At the end,
it boosted the GDP by 0.3%. The director of the German Institute for Economic Research
Gert Wagner (2007) concluded, “The World Cup's contribution to economic growth has
been negligible. It was great fun. Nothing more, nothing less”. In fact, the FIFA made
more benefits with the sold of the “marketing right”.
Several countries knew some problems by welcoming a mega sporting event. Canada
hosted the summer Olympic Games in 1976 at Montreal and they suffered a lot from the
economic impact. They took more than 30 years to refund their debt who was initially
about €1 billion. At Athena in 2004 during the Olympic Games, most of economists
assume that the Games damaged the economic Greek situation. It cost nearly €11 billion
by current exchange rates, double the initial budget. We know now how huge are
Greek’s problems even if it was not the only cause. Furthermore there is the example of
Argentina in 1978. During that period, the country’s economy is going very badly.
Argentina organized and also won the FIFA World Cup and even so the growth was
negative and they noted a big inflation. The French economist Nathalie Hénaff said “for
the host, in despite of all economic activities that lead such competitions, the impact
does generally not exceed 1% of GDP, which is not big” (le Parisien, 2013).
Thomas Giraud
8
According to economists, Olympic Games must lead to a fast increase in the growth
during the first 3 months but the effect will then slowly disappear. Taking the example of
the London summer Olympic Games there are now a lot of interrogations from
economists about its real impact on economy. The state tries to convince people that the
impact exists but it is still not very clear so far. Government declared the country
enjoyed a raise in trade and investment evaluated at €11.5 billion. Foreign tourist
expenditures noted an increase around €695 million in 2012. In all, government said in
2013 the total revenue from Olympic Games already exceeded the expenditures caused
by all the organization. However, a lot of economists doubt about it. They think
government did not take into account all of the expenses in their calculus. They believe it
is strongly hard to predict the economic impact of such big event especially in the long
run.
Symanski’s (2002) has studied the world’s largest economies over the past 30 years
which have hosted either FIFA World Cup or Olympic Games and he concluded that the
growth of these countries was significantly lower during the years of FIFA World Cup.
His result may imply that governments overestimate the total revenues and don’t take
into account the good parameters.
2.3 An Impact overestimated
Matheson Bades (2004) assumed that sporting event studies are often overestimated
and wrong according to 3 reasons. Firstly, studies provide a gross measure of direct
spending in despite of net measure which does not include the local resident spending. It
is assumed that this amount will be spent somewhere else in the economy. Therefore
gross measure amplifies the financial result. For instance, during the Olympic Games in
Australia the occupancy level was around 100% at Sydney but we noted a decline in
Melbourne and Brisbane of 19% and 17% respectively. Second thing: tourism. One can
see an increase in the tourist market which is consequent but in the same time a
decrease in tourism from populations that are not interested in the particular sport
being hosted. For example if one dislike football, one will probably not visit a country
welcoming the FIFA World Cup. So we can record a decrease in “regular” tourists
compared to the previous years. Finally, the “multiplier” is questioned. The multiplier is
Thomas Giraud
9
the stimulation of other economic sectors caused by government spending related to the
event. For example, unemployment should decrease because of the huge nature of the
event, but in fact firms try to increase marginal productivity of workers instead of hiring
which is costly. To act in that way they can increase wages and rise the time of work by
few hours per week.
For instance, Vladimir Poutine hopes a rise in GDP growth during the next years
around 5%. It seems overestimated and economists forecast a number around 2.5%. In
the past, government often overestimated the impact since they want to reassure
population or at least not scare them.
2.4 Several more cases
It is assumed that there is not a significant effect on the global activity for the host
country. For instance the 1998 World Cup in France, since 1 year the country knows an
economic recovery because of the increase of the growth in the United States. In 1998,
France reached a growth rate of 3.3% (Insee, 2012) while it was only around 2% in
1997 and 1% in 1996. Economist stated that the World Cup was just a little help and it
made people euphoric especially because France won for the first time. Such events are
the only one that can generate such emotions to people and influence them to expense
more. It was surely the case when France won.
In 2002, the World Cup was co-hosted by Japan and South Korea. It is now a drag to
the local economy. A study (by the Dentsu Insitute for Human studies) estimated a $24.8
billion impact for Japan and an $8.9 billion impact for South Korea. It represents, as a
percentage of national income, 0.6% and 2.2% of the total Japenese and South Korean
economies, respectively (Finner 2002). Nevertheless, 8 of the 10 stadiums built or
renovated in Japan lose between $2 million and $6 million a years. A member of the
2002 World Cup Bidding Committee in Japan said: “no strategy, no success” and “they
did not have a strategy” talking about the use of the stadiums. As a consequence, the
World Cup generated a real boost for both countries but in other hand it also produced a
loss of money due to the maintenance price.
Thomas Giraud
10
More recently, we can study the case of the FIFA World Cup in South Africa in 2010. It
was the first time that Africa welcomed such event, so it was really expected by the
entire continent. The positive effects of the event were very short and lower than the
expectations of the government in term of new employments and decrease in
criminality. Thus, 309,000 tourists came to assist the event and they expensed roughly
$400 million according to studies from the department of tourist. However, estimations
were about 480,000 tourists and 3 times more in expenditure than reality. The country
saw a small positive effect on the growth in the short run due to the temporally activity
in the country. In South Africa the increase was estimated around 0.4 percentage points
of GDP growth. It was a very short positive effect, but a long cost due to the maintenance
price of the new stadiums which are enormous and kind of useless especially for South
Africa. The World Cup cost $4.3 billion for the state and the total incomings for the
government will not exceed $4 billion.
2.5 Employment effect
Host countries saw a small or null impact on the growth of the host countries or
cities, but how does it impact employment? They need more workforces to build new
facilities and to manage the event so it should have a positive impact on employment.
Indeed, the demand on the market in several sectors increases so firms need to raise
their production in order to answer the boost in demand. Thus they hire more people
and employment rises. A good part of these new jobs will disappear in the long-run.
Most of employments generated by a mega-sporting event are temporary. A study
showed the employment effects of the 1974 football World Cup in Germany (Florian
Hagn and Wolfgang Mennig, 2007). As a result, they demonstrated that the 1974 World
Cup in Germany was not able to engender any medium to long-term employment effects
that were significantly different from zero. This study examined the employment effects
on the 9 host cities in comparison to 66 others cities in Germany. Thus the data involved
the 75 most densely populated municipalities in the year 1974 and the observations
stretched from 1961 to 1988. They used as independent variables the population, the
relative income of the municipalities and the share of gross added value of the economic
sectors agriculture and manufacturing, as well as the sectors trade and transport in the
Thomas Giraud
11
municipalities. This study was the first to utilize these different data but it failed to
prove a positive significant impact on employment. However in contrast to the
conclusions in similar studies, they could not clearly reject the hypothesis of the positive
effect of a mega-sporting event.
Another study about employment effect was realized by Arne Feddresen and
Wolfgang Maennig (2013) about the 1996 Olympic Games in Atlanta, United States.
Here, they used monthly data, they analyzed 16 different sectors and they utilized
modified Difference in Difference model and a nonparametric approach to isolate the
employment effect. It was the first study like that and they found significant positive
short-run employment effects only during the Olympic Games. These effects have been
seen on the sectors of “retail trade,” “accommodation and food services,” and “arts,
entertainment, and recreation.” By isolated sectors they increased their chance to find a
positive effect since they employed disaggregated data. Always about the 1996 Olympic
Games, Hotchkiss, Moore, and Zobay (2003) found a boost of employment by 17.2% in
Georgia counties affiliated to Olympic activities. It was in total 293,000 additional jobs
raised from the Olympic Games.
It is obvious to assume that a mega-sporting event will raise employments in the
country. Nevertheless, this increase will not affect all sectors and could be too small to
be significant. For example, it will impact more the service-related industries than the
mining or utility industry. The strongly impacted sectors may be hospitality because of
an increase in demand for hostel, food services, retail trade and event management.
Moreover, the construction industry may be also affected since it requires more workers
to improve and build new infrastructures and stadiums.
We have seen different cases in both developing and developed countries. Since they
are different in much ways, they may also exist differences in the approach of hosting a
major sporting event.
2.6 Differences between developed and developing countries
From 1896 to 2004, only one summer Olympic Games have been accommodated to
developing countries, the 1968 Games in Mexico City was the only case. Henceforth it
Thomas Giraud
12
changed, in 2008 it was hosted by China and it will be welcomed by Brazil in 2016.
Developing countries increase their demand in hosting mega-event.
2.6.i Disadvantages for developing countries
Developing countries know some deficiencies which can be costly to host a mega-
sport event. The infrastructure expenditures are likely to be higher in developing
countries than in developed countries. For instance in 1998, France only needed to build
the “Stade de France” and refurbished existing stadiums while South Africa in 2010 had
to build entirely new facilities to host World Cup. The reason: their existing stocks of
sport infrastructures are lower and emerging firms involved in the construction and
preparation may know a lack in the technologies and management expertise available in
comparison with developed countries.
Another point concerns the opportunity cost of capital which may be higher for
developing countries. For example, Nigeria built in 2001 his new national stadium for
$330 million. This amount is bigger than the annual national government expenditures
on education and health. (Farah, 2001) In such countries it is criticized to spend as much
money in facilities because they have more important issues.
We can see a difference in the utilization of facilities after the event: the demand for
sport infrastructures in developed countries is higher than in developing countries
because sport is considered as a luxury good. They have to take care about not having
investments in facilities considered as “white elephants”.
Finally, tourists are more likely to be attracted by industrialized states than
developing nations. Visitors can worry about the security, the infrastructures and the
quality of accommodation. For example in South Africa, where criminality is extremely
consequential and where according to the ONU in 2000 it is the country with the world
highest rape rate per habitant, obviously it discouraged people to come. As a
consequence stadiums are less full in developing countries.

Thomas Giraud
13
2.6.ii Advantages for developing countries
Even if they might have some problems compared to developed nations, developing
countries also know advantages. First, they normally have lower wages and so lower
employment costs to build and to manage infrastructures. During the event, they raise
prices for foreign visitors and thus make more money.
Secondly, investments in infrastructures are not only based on sport facilities but
also on non-sport and they may be useful in the future economic development. For
example, only a fraction of the $22 billion expensed in infrastructures for the Beijing
Olympic Games was destined to sport facilities. On the other side, it is not manifest that
non-sport infrastructures will help to economic development. They may go unused after
the completion of the event.
Finally, the high unemployment or underemployment in developing countries may
benefit to firms since the opportunity labor cost is close to zero. During the 1996
Olympic Games, Atlanta had almost a full employment so they had to import labor force
from away. When the Games ended, workers returned home and repatriated their
working earning which reduced the multiplier effect in Atlanta because they will spend
their money outside. Atlanta does not plenty benefit from its investments if the resulting
indirect spending takes place outside of Atlanta area. In the case of a city with unused
labor force, earning generated by the event may rest in the local area after the end of the
event.
It would be interesting to compare developed and developing countries economic
effects but this study will only focus on the employment effect with the example of a
developed country: France.
2.7 The counterfactual
Any analysis of economic impact due to a mega-sporting event has to deal with one
important concern: the counterfactual. One does not know what would have happened
in the case of the public money needed for the event had been used for a different
investment. Furthermore we might ask whether the observed impacts are caused or not
Thomas Giraud
14
by the event or whether they are provoked by a macroeconomic shocked in the same
time. To avoid these two issues, two different type of research have been made. The first
one have been done by Baade and Matheson (2001), Coates and Humphreys (2002) and
Matheson (2005). They used panel data and growth models to compare the forecasted
values with the observed values of economic indicator. The second type of study has
been effectuated by Feddersen, Grötzinger, and Maennig (2009). They used Difference in
Difference approach in order to isolate the impact of sport events from macroeconomic
shocks using a control group formed by other geographic units. These two approaches
are preferred because when you don’t take into account the counterfactual the bias is
stronger.
3 Empirical application
This paper concerns the effects of the football 1998 World Cup in France on
employment. Relevant annual regional data from Insee the French National Institute for
Statistics and Economic Studies are used from 1990 to 2011 on employment. In order to
organize the World Cup, France had to present at least 10 stadiums with high capacity.
Therefore 10 cities in France hosted the event: Paris and Saint Denis (Ile de France),
Marseille (Provence-Alpes-Côte d'Azur), Lyon and Saint Etienne (Rhônes-Alpes), Lens
(Nord-pas-de-Calais), Nantes (Pays de la Loire), Toulouse (Midi-Pyrénées), Montpelier
(Languedoc-Roussillon), Bordeaux (Aquitaine). These cities are located into 8 different
regions over 22, excluding the Dom Tom. Thus 14 regions didn’t host the World Cup; the
work will be to compare these regions with the host regions in attempt to find whether
the World Cup had a significant impact.
Firstly, the data are presented to give an idea about the variable. Only one year over
two is provided to make the table shorter. Values represent the sum of the host region
on one side and non-host regions on the other side.
Thomas Giraud
15
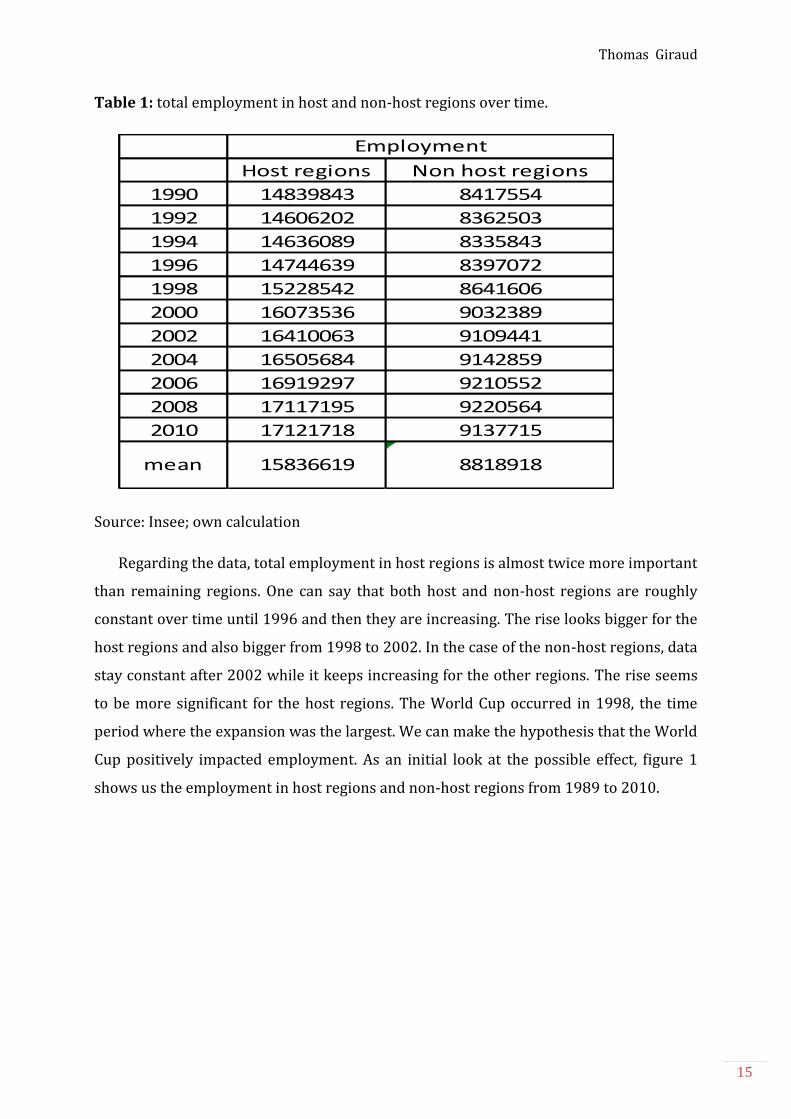
Table 1: total employment in host and non-host regions over time.
Source: Insee; own calculation
Regarding the data, total employment in host regions is almost twice more important
than remaining regions. One can say that both host and non-host regions are roughly
constant over time until 1996 and then they are increasing. The rise looks bigger for the
host regions and also bigger from 1998 to 2002. In the case of the non-host regions, data
stay constant after 2002 while it keeps increasing for the other regions. The rise seems
to be more significant for the host regions. The World Cup occurred in 1998, the time
period where the expansion was the largest. We can make the hypothesis that the World
Cup positively impacted employment. As an initial look at the possible effect, figure 1
shows us the employment in host regions and non-host regions from 1989 to 2010.
Host regions Non host regions Host regions Non host regions
1990 14839843 8417554 602502 307183
1992 14606202 8362503 652346 332990
1994 14636089 8335843 678549 341932
1996 14744639 8397072 715324 359729
1998 15228542 8641606 771270 387148
2000 16073536 9032389 849791 418171
2002 16410063 9109441 919608 444246
2004 16505684 9142859 984510 474921
2006 16919297 9210552 1071529 503668
2008 17117195 9220564 1179608 524364
2010 17121718 9137715 1282089 516218
Employment Added Value
mean 15836619 8818918 882466 419143
Thomas Giraud
16
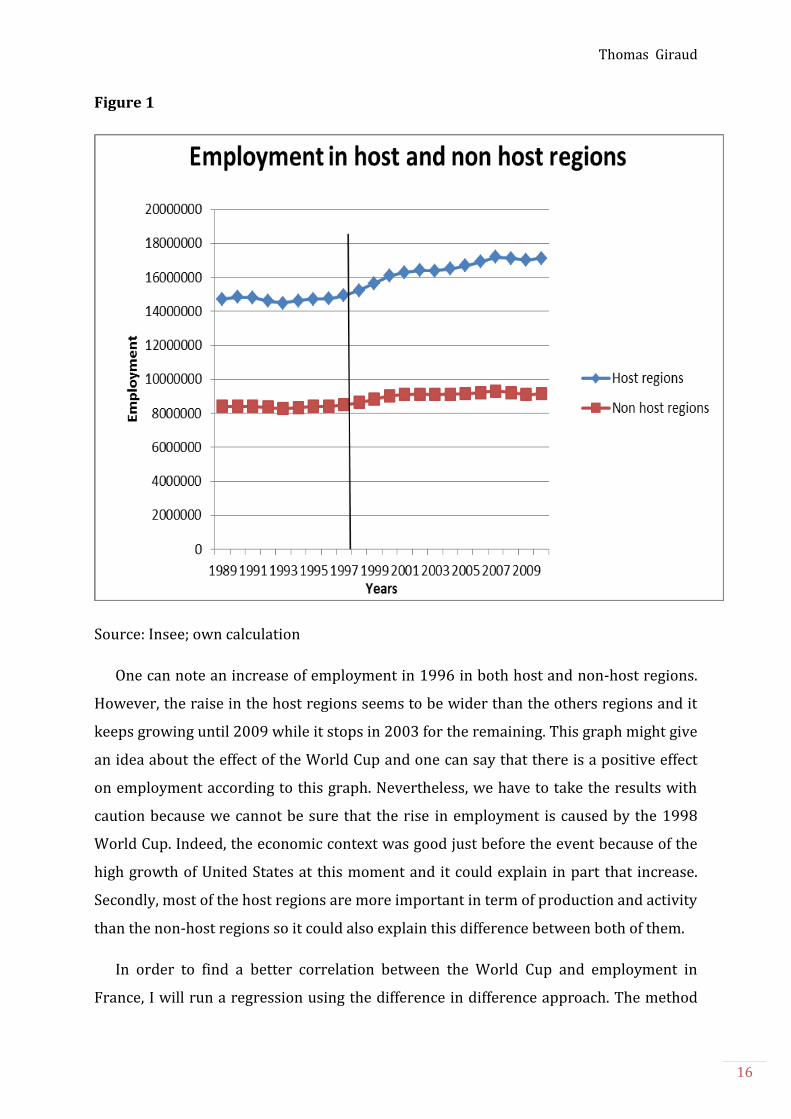
Figure 1
Source: Insee; own calculation
One can note an increase of employment in 1996 in both host and non-host regions.
However, the raise in the host regions seems to be wider than the others regions and it
keeps growing until 2009 while it stops in 2003 for the remaining. This graph might give
an idea about the effect of the World Cup and one can say that there is a positive effect
on employment according to this graph. Nevertheless, we have to take the results with
caution because we cannot be sure that the rise in employment is caused by the 1998
World Cup. Indeed, the economic context was good just before the event because of the
high growth of United States at this moment and it could explain in part that increase.
Secondly, most of the host regions are more important in term of production and activity
than the non-host regions so it could also explain this difference between both of them.
In order to find a better correlation between the World Cup and employment in
France, I will run a regression using the difference in difference approach. The method
Thomas Giraud
17
consists of analyzing the difference in differences of employment from regions that
hosted the World Cup and them that did not. I will make use of the same employment
data utilized just above from 1990 to 2010.
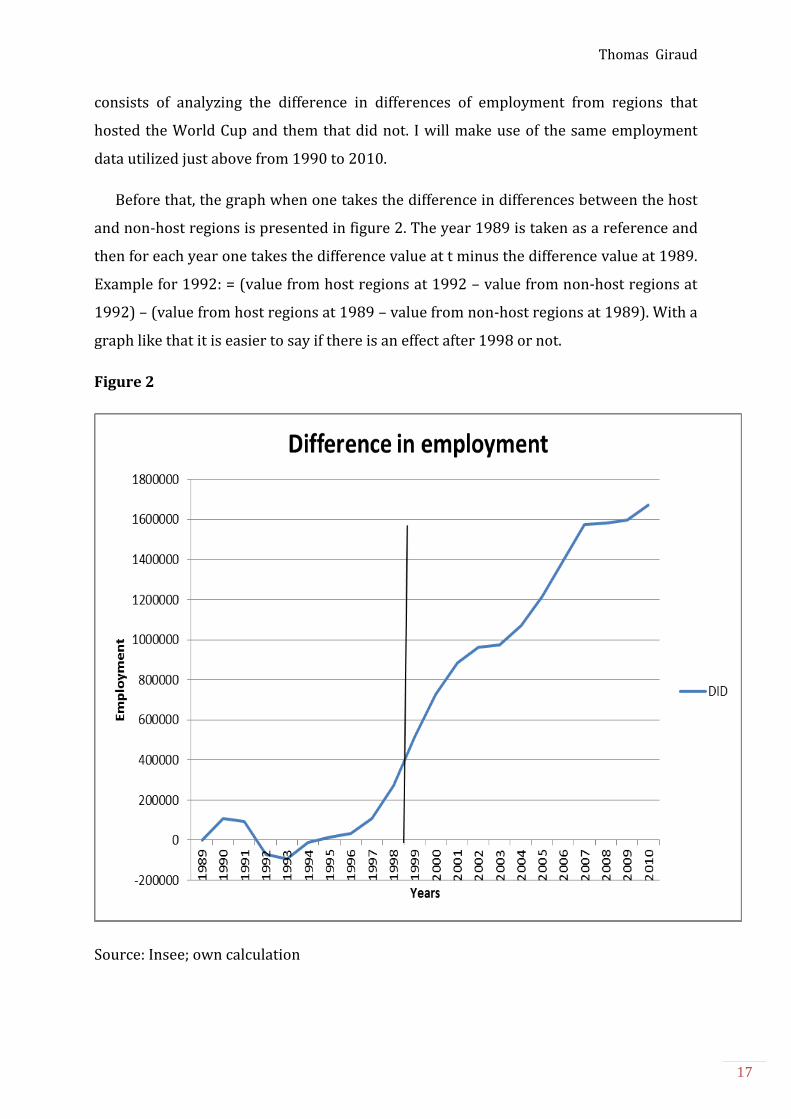
Before that, the graph when one takes the difference in differences between the host
and non-host regions is presented in figure 2. The year 1989 is taken as a reference and
then for each year one takes the difference value at t minus the difference value at 1989.
Example for 1992: = (value from host regions at 1992 – value from non-host regions at
1992) – (value from host regions at 1989 – value from non-host regions at 1989). With a
graph like that it is easier to say if there is an effect after 1998 or not.
Figure 2
Source: Insee; own calculation

Thomas Giraud
18
At the first look, one can easily say that there is a significant rise from 1996 until
2007. Before 1996 the curve is roughly constant with little waves. After 2007 it keeps
growing very slowly. According to this graph, it is obvious that something happened in
1996 and had an impact on employment in the host regions during 10 years. One can
assume the effects of the World Cup started in 1996 because of the construction and
improvement of facilities as well as all preparation due to the World Cup. It is easier to
see the impact with this graph than the first one which was a bit wave. It is clear here
that the difference in employment between host and non-host regions increased just
before the World Cup.
According to the first 2 graphs, I expect the regression to find a significant positive
effect. Indeed the second graph is very clear and tends to show us a real impact since
1996 on employment. Now after the examination and presentation of the data, the
methodology of the regression will be presented. I will use the Difference in Difference
model in attempt to find a significant positive effect on employment due to the 1998
World Cup.
4 Methodology
4.1 Model specification
In this section the model used to conduct the regression is described. Since the work
by Ashenfelter and Card (1985), the use of Difference in Difference method has become
very widespread. It is a method employed to measure the changes induced by a
particular treatment or event. The usual case is when outcomes are observed for two
groups and two time period. A group is exposed to a treatment only in the second time
period while the other is not exposed at all. The second group is called the control group
and the first one the treatment group. As mentioned before, I use this method in
attempt to find an effect on the employment. Here, the treatment group will be having
hosted the World Cup and the control group will include the other regions. Two
indicators based on time dimension t and spatial dimension i can be defined: X1i takes
the value 1 if i belongs to the treatment group otherwise it equals to 0; it represents the
Thomas Giraud
19
group effect. X2t takes the value 1 if t > 1997 otherwise it takes 0; it corresponds to the
business cycle effect. Then, X3 is the interaction between both effects and takes the value
1 when both X1 and X2 are equals to 1 otherwise it is equal to 0. The Difference in
Difference approach permits to compare the change in employment in the treatment
group to the change in employment in control group before and after the event. The
group effect captures differences across groups that are constants over time while the
year effect catches differences over time that are common to all groups.
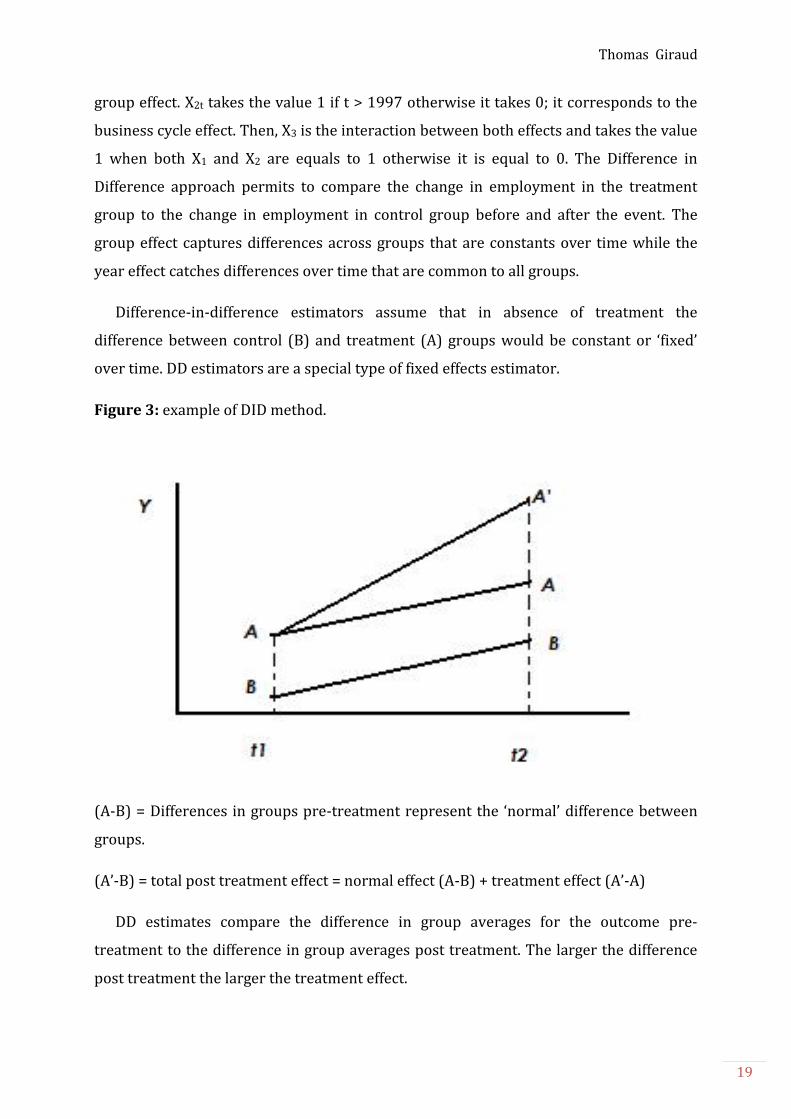
Difference-in-difference estimators assume that in absence of treatment the
difference between control (B) and treatment (A) groups would be constant or ‘fixed’
over time. DD estimators are a special type of fixed effects estimator.
Figure 3: example of DID method.
(A-B) = Differences in groups pre-treatment represent the ‘normal’ difference between
groups.
(A’-B) = total post treatment effect = normal effect (A-B) + treatment effect (A’-A)
DD estimates compare the difference in group averages for the outcome pre-
treatment to the difference in group averages post treatment. The larger the difference
post treatment the larger the treatment effect.
Thomas Giraud
20
After this short explanation about how consists the DID method, the regression
model is presented. A typical regression model in DID would be:
Outcomeit = b0 + b1 Treati + b2 Postt + b3 (Treat * Post)it + ϵ
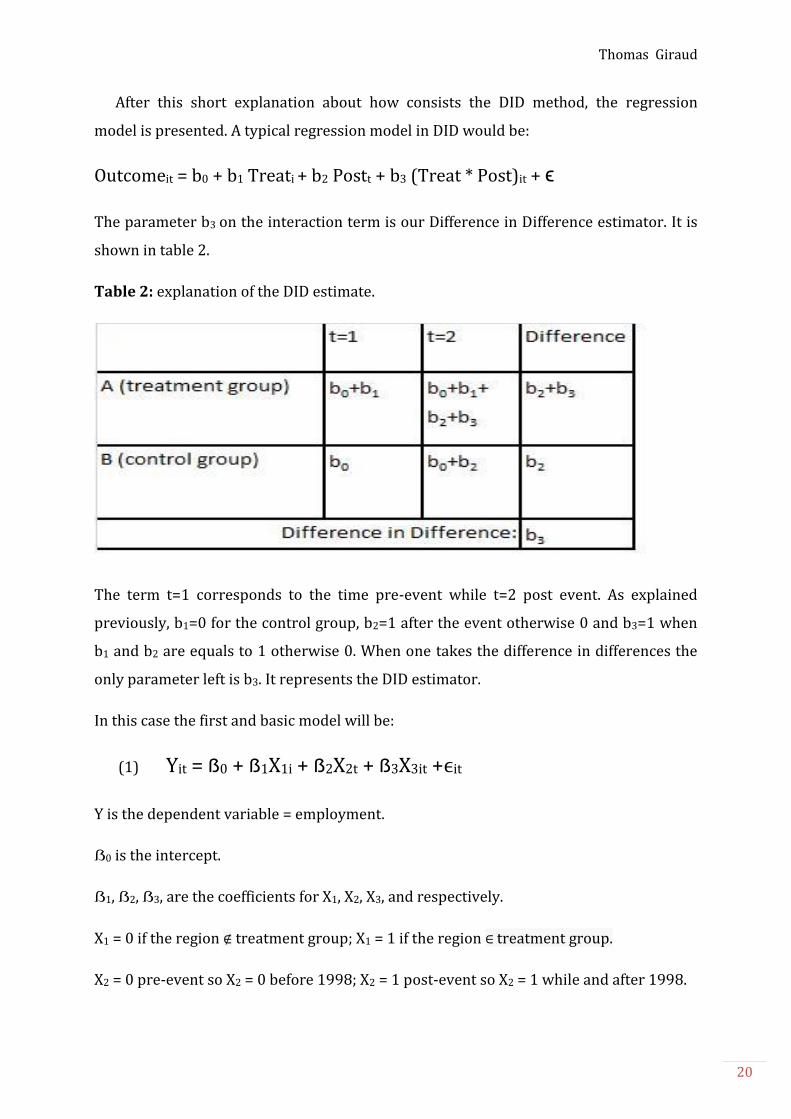
The parameter b3 on the interaction term is our Difference in Difference estimator. It is
shown in table 2.
Table 2: explanation of the DID estimate.
The term t=1 corresponds to the time pre-event while t=2 post event. As explained
previously, b1=0 for the control group, b2=1 after the event otherwise 0 and b3=1 when
b1 and b2 are equals to 1 otherwise 0. When one takes the difference in differences the
only parameter left is b3. It represents the DID estimator.
In this case the first and basic model will be:
(1) Yit = ẞ0 + ẞ1X1i + ẞ2X2t + ẞ3X3it +ϵit
Y is the dependent variable = employment.
ẞ0 is the intercept.
ẞ1, ẞ2, ẞ3, are the coefficients for X1, X2, X3, and respectively.
X1 = 0 if the region ∉ treatment group; X1 = 1 if the region ∈ treatment group.
X2 = 0 pre-event so X2 = 0 before 1998; X2 = 1 post-event so X2 = 1 while and after 1998.
Thomas Giraud
21
X3 = X1 * X2 = 1 if X1 and X2 = 1 otherwise X3 = 0; X3 is the interaction between time effect
and treatment effect. It is our most important variable in the model.
ϵit is the error term.
Equation (1) is the simplest simplification that can detect the discontinuity caused by
the World Cup. However, some problems arise when estimating this equation. We know
that to obtain unbiased estimates the covariance between the error term and the
variable must be null. Therefore the equation must be in accordance to the following
constraint:
(2) Cov(ϵit, X1i) = 0 and Cov(ϵit, X2t) = 0
When one look at the figure 1, one can see that both host regions and remaining regions
enjoyed a positive employment growth rate from 1996 until 2007. This result advances
a positive correlation between X2 and ϵit. Furthermore, the big difference between the
mean total employment per year in host regions and in non-host regions, 15,836,619
and 8,818,918 respectively, may lead to the suggestion that there is a positive
correlation between X1 and the error term. As demonstrated by Dachis, Duranton, and
Turner (2012), correlations between two explanatory variables (X1 and X2) and the
residual (ϵit) could bias estimates of ẞ1 and ẞ2. Moreover it may bias the estimate of the
interaction variable. To deal with this problem, region-fixed effect and time-fixed effect
are included in the model. Thus, X2 is replaced by a dummy variable for each year from
1991 to 2010 so 20 dummy variables while X1 is changed by a dummy variable for each
host regions so 8 dummy variables are defined. Furthermore an interaction with time is
added for each host regions. By this way, the effects in each host regions induced by the
World cup can be analyzed and the number of employment created by the World Cup
will be known.
(3) Yit = ẞ0 +ẞiδi + ẞtDt + ẞ3X3it + ẞ4X4t + ẞ5X5t + ẞ6X6t + ẞ7X7t +
ẞ8X8t + ẞ9X9t + ẞ10X10t +ϵit
δi is the region-fixed effect, it includes the 8 dummies. Dt is the time-fixed effect and it
includes the 20 dummies; X3, X4, X5…X10 are the interactions between the time variable
Thomas Giraud
22
and the 8 host region dummies. With this second model, one have more chance to
identify a significant positive impact on employment because host regions are
differentiated each other and they are no longer considered as a whole. Furthermore
there are variables for each year so one can see when the effect was the strongest.
4.2 Estimation
A lot of studies have been done on the economic impacts of a World Cup using
Difference in Difference strategy. However, it is the first study that analyzes the
employment effect of the 1998 World Cup in France. There exists some works about the
impact on tourism but not on employment with a DID method. Many past studies on
economic impacts of a World Cup did not find significant positive results. Only few of
them succeeded to do it.
Two estimations have been run with employment as dependent variable using the
Difference in Difference model and then a modified DID method as described previously.
The reason I made use of this type of regression is because it seems to be the easiest and
more practical way to show the effects on a treatment group of a certain event using a
control group. This method required data from several years before and after the event
to compare the regions. In this case, 8 years before and 12 years after the event have
been used. According to the graphs presented in the 3rd section, a positive impact on
employment is expected due to the World Cup.
Past studies have been further than this regression, they took in account more
parameters in their models but it was not possible to follow their methods here since it
required more complicated data. It would had been hard to find them and also tough to
employ them.
The DID method utilize the OLS regression and STATA has been used to run the
estimate.
Thomas Giraud
23
5 Results
I ran two regressions, the first one follows the classic and basic DID estimate while
the second modifies the original one.
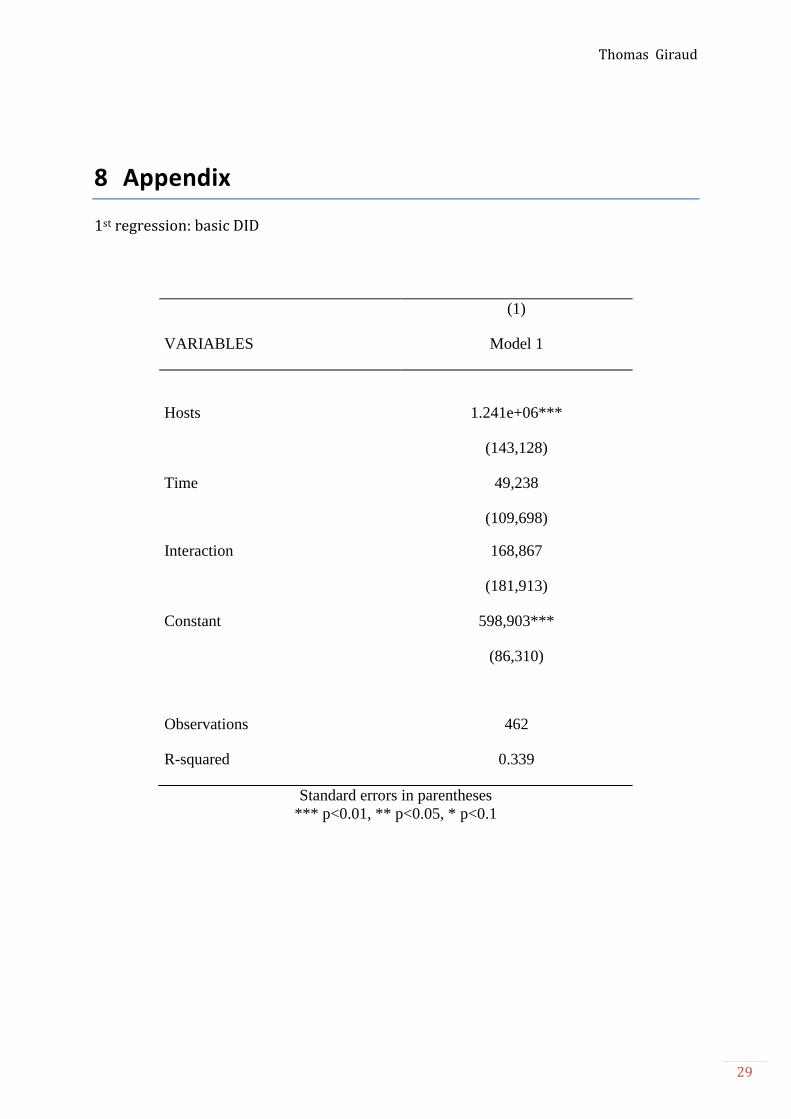
5.1 Classical Difference in Difference estimation
Firstly, the initial and classical DID regression has been run. Result gave positive
coefficients for the three independent variables and also for the constant. The variable
treatment, that means to have hosted the World Cup or not, had a coefficient equal to
1,241,280 at 1% significance level. The time variable that took the value 0 before 1998
and 1 after 1998 had a coefficient equal to 49,238 but this result was not significant at
5% level. Finally, the interaction variable between the 2 first had a coefficient equal to
168,867 and this result was also not significant at 5% level. The constant was equal to
598,903 and significant at 1% level. The R-squared and Adj R-squared were quite low,
approximately equal to 0.33. With this first regression we found only 2 significant
results over 4.
Secondly, the modified regression results will be presented.
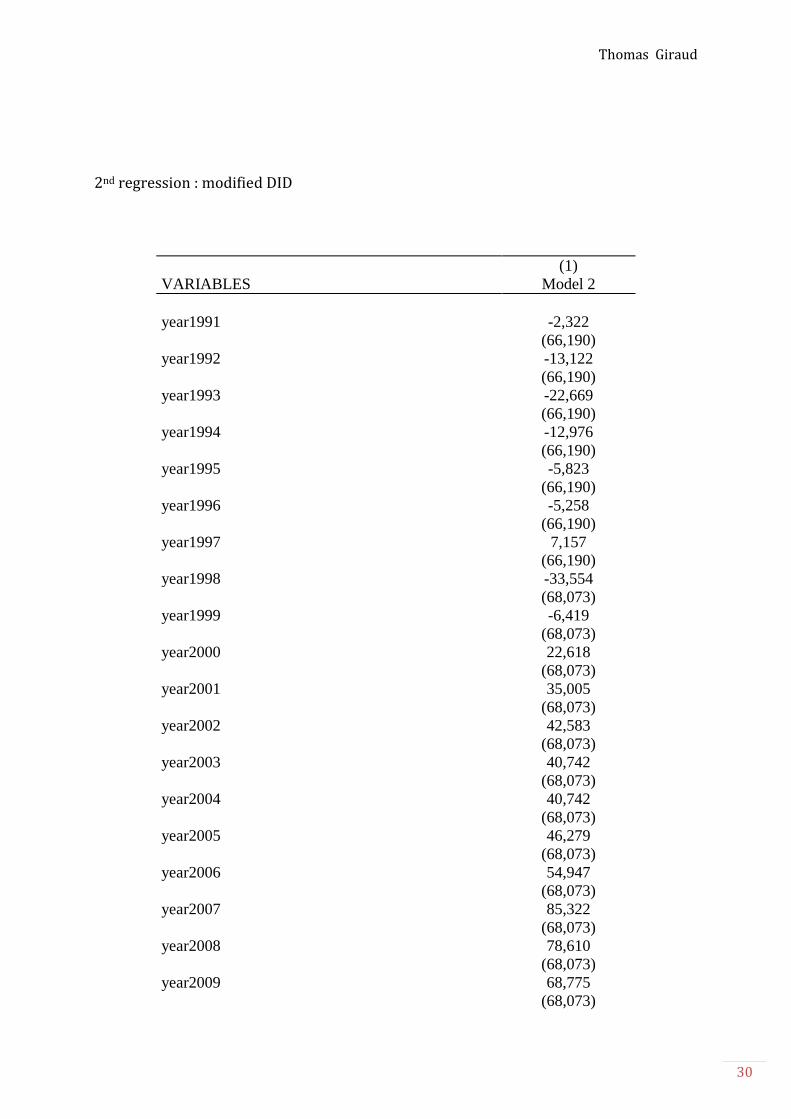
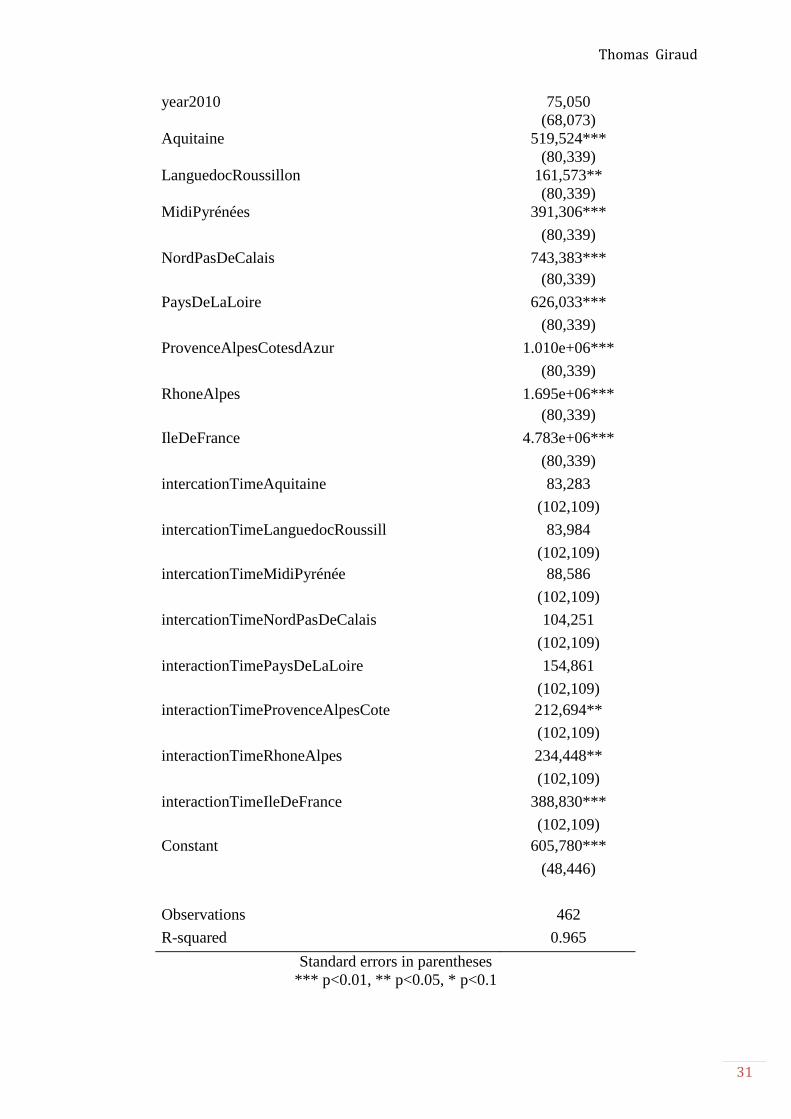
5.2 Modified Difference in Difference regression
This second regression improved the first one by replacing the 2 first variables by
dummy variables and the last one by interactions for each host regions as explained
previously. It no longer took every host regions as a whole. It was better because some
regions could have been more affected than other where only several matches occurred
while some welcomed twice more games. First, all the dummy variables for the time-
fixed effect were not significant. From 1991 to 1999 each year was negative coefficients
excepted in 1997 but from 2000 to 2010 they were all positives coefficient. All the
values were less than 100,000 employments created. Nevertheless, as said before none
of them was significant. As a contrary all the host regions were significant at 1% level
excepted one that was significant at 5% level. They were all positive coefficients. The
most impacted regions were Ile de France and Rhône Alpes, with a coefficient equal to
Thomas Giraud
24
4,783,780 and 1,691,361 respectively. The less impacted was Languedoc Rousillon with
a coefficient equal to 161,573. Finally 3 interactions were significant while the 5 others
were not. The significant interactions include the region Ile de France, Rhône Alpes and
Provence Alpes Côte d’Azur with positive coefficients equals to 388,830, 234,448 and
212,694 respectively. However, the remaining interactions were all positive coefficients
but not significant. Moreover the constant was also positive and significant.
These results will be analyzed in the next part.
6 Analysis
I have made an OLS regression using the method of Difference in Differences in order
to find a positive effect on employment and to try to find an economic effect through
employment due to the World Cup in France in the host regions. Previous researches on
similar topic but with different countries had problems and failed to find significant
results. To my knowledge, only few studies have found significant positive effects from
sport event. Hotchkiss et al. (2003) succeeded to find a significant positive employment
effects on regions in Georgia related to the 1996 Atlanta Olympic Games. My study is the
first to focus on the employment effect on the 1998 World Cup in France using the DID
method. It was already applied in United States to find the effects of the 1996 Atlanta
Olympic Games. The major problem of different past studies occurred because it is hard
to find a significant effect of an event since the country is big and the effects are very
small compared to the total production of the country. My study focuses on region i.e.
the 22 regions in France so it might be easier to find significant results with
disaggregated data.
The first regression showed positive effect on employment but the results were not
significant at 5% level for the two variables “time” and “interaction”. Moreover, the
interaction variable was the most important and could not find a positive significant
result. Nevertheless the treatment variable was significant and it meant that it had a
positive effect on the employment since 1990. Regions that have hosted the World Cup
had an impact around 1,241,280 more jobs. It was a significant raise regarding to the
Thomas Giraud
25
total population in France. This first regression was the basic DID method, without
added any parameters. On the next one, the host regions were no longer used as a whole
but as different variable for each host regions. By this way one can differentiate the
regions because there are big disparities between them. As a matter of fact some of them
are more actives and more important than other so they grow faster and secondly they
did not host the same number of matches during the World Cup. For instance the finale
was played in Ile de France as well as one semi-final whereas some regions hosted less
important games.
The second regression that improved the first model gave interesting results. The
most important variables in this regression were the interactions between the 8 host
regions and the time. As a result, 3 of them found a positive and significant coefficient.
That means that employment in these regions has been impacted by the World Cup. In
Ile de France, 388,830 jobs have been created because of the event; it is more likely to be
jobs in the sectors construction, retail trade and food services as well as in tourism. In
the two others regions, more than 200,000 jobs were created each. Employment in Ile de
France increased almost twice more than the two other which were Rhône Alpes and
Provence Alpes Cote d’Azur. This result is in accordance with the expectations; some
regions knew bigger effects than other. However, the remaining 5 interactions were
positives but not significant. It is not possible to affirm that employment in these regions
increased because of the World Cup. Nevertheless, the 8 dummy regions were all
positives and significant coefficients. For instance, according to the results the region Ile
de France had an increase in employment since 1990 around 4,800,000 jobs created.
388,830 of them were induced by the World Cup which is only a little part. All the host
regions knew an increase in employment since 1990; it seems to be totally logical result.
There are big disparities between them, for instance the region Languedoc Roussillon
had a rise in employment of 161,573 since 1990 while the expansion in Nord Pas De
Calais was 743,383. On the other hand, it seems to be also logical that employment in
non-host regions also increased since 1990 so only the interaction variables can explain
a rise due to the 1998 World Cup. Finally, the 20 year dummy variables were negatives
before 1999 and positive after 2000. It looks like the time had a negative effect on
employment since 1990 and then a positive after 2000 but none of them were significant
so we cannot conclude anything about these results.

Thomas Giraud
26
To summarize, the first regression was not able to show a significant positive effect
on employment because the estimates were probably biased and host regions were not
differentiated while the second regression which was improved to obtain unbiased
estimates found a positive effect on employment in three host regions according to the
interaction variables. The results are in respect with those found on the graphs above.
According to the second graph, we expected a significant positive effect on employment.
The regression can confirm the increase due to the World Cup. Regarding to the graph
that plot the difference in differences of the employment, the curve was almost constant
before 1996 but it increased in 1996 until 2007. It meant a significant rise in
employment for the host regions just before and after the World Cup.
Indeed, the effects on employment of the event started before the beginning since
the constructions and the management had to be finished before 1998. Firms had to hire
new workers to prepare everything in time. During 1998, employment may rose in the
sectors of tourism, retail trade and accommodation and food services. In the same way,
firms needed to answer the expansion of demand by increasing their production and
therefore they hired new employees. After the event, there is still the cost of
maintenance that might positively affected employment. Furthermore, the multiplier
effect could also impact consumption of population in the host regions and firms needed
to produce more. In total, the World Cup had an effect on employment during the event
as well as ante and post event. My regression caught only the effect in 1998 so a part of
the rise before the event was not taken into account since some jobs have been
temporary and they no longer existed in 1998. If my time variable had the value 1 after
1996 and 0 before the increase could have been even higher and it would be interesting
to improve my regression.
According to past studies there could be a possible problem in these two regressions.
In fact, a common problem with all empirical analyses on Difference in Difference
approach concerns the exact definition of the treatment group. In most of the cases and
also in that one, the analyzed intervention is not totally exogenous and it cannot be
clearly distinct based on those dimensions. The 1998 World Cup should define a
treatment with regard to three dimensions: time, space, and magnitude.
About the time dimension, it corresponds to what has been said before: it is assumed
that the effect on employment might start before the event because of the anticipation
Thomas Giraud
27
effect. Equivalently, the amplitude and the duration of the effect might not be derived
from theoretical considerations. Finally, from a spatial point of view one can assume that
the treatment might generate spillover effects to neighbor regions as well as an increase
in number of tourist because they might stay in conjunct areas. There exists several
ways to deal with these facts as including the surrounding regions which could be also
affected but it will not be explained in this paper since it is not used here. Moreover, it
was hard to add conjunct regions since there are only 22 regions in France.
Nevertheless, it could have been possible to take into account counties instead of
regions. By this way it would have been easier to measure the spillover effect in other
counties. In fact, there are 96 counties in metropolitan France and only 10 of them
hosted the World Cup. Moreover, by using the host counties the data would have been
more disaggregated than in this paper and the results might have been better.
After this analyze, the last part will conclude the paper.
7 Conclusion and possible improvements
This paper was the first to analyze the effects on employment in France due to the
1998 World Cup. More precisely it studied the effects on the host regions in comparison
to the non-host regions in France. I used a Difference in Difference method to catch the
possible effects and then an improved method was presented to obtain better results.
Firstly a significant positive impact on employment owing of the World Cup was found
in the second regression. Nevertheless, host regions have been not impacted in the same
scale. According to the regression, only 3 regions over 8 found a significant positive
effect and the region Ile de France was the most affected. It seems to be logical since this
region welcomed more matches and even more important one than the other. Moreover,
according to the graph and to the regressions, employment in host regions increased
more than in the other regions. In the regression, a significant positive impact on
employment in host regions was found for all of them and in the graph we saw that the
rise occurred in 1996. It can be explained by the fact that construction and preparation
to the event began two years before the start of the World Cup.
In my regression, I employed regional data in order to get more chance to find a
positive impact. It seems to be easier to find an effect using regions as treatment and
Thomas Giraud
28
control groups than using countries. Moreover, in order to ameliorate the regression, I
used time fixed effect and region fixed effect to differentiate the regions and the years so
it was easier to identify the time effect and region effect. A possible way to improve this
work would be to differentiate sectors. A study from Arne Feddersen and Wolfgang
Maennig on employment in the case of the 1996 Olympic Games in USA analyzed the
impact for 16 different sectors or subsectors. As a result they found significant positive
employment short-term effects in the sectors of “retail trade,” accommodation and food
services,” and “art, entertainment, and recreation.” They used more disaggregated data
than in this work and it would be interesting to apply the same method in the case of the
1998 World Cup in France. Furthermore, it assumed that host regions will generate a
spillover effect on surrounding areas. The increase of tourists in the host country also
affects the remaining regions since they will not all stay in these regions. As a
consequence, the tourism related industry as hostel companies’ rise also in conjunct
areas. Another way to improve this study could be to include in the regression a
parameter that catches this effect on the non-host regions. As explained before, to use
counties instead of regions could improve the results and moreover it would be easier to
catch the spillover effects. Finally, It would be interesting to change the time variable, to
take time = 1 after 1996 instead of time = 1 after 1998 because the construction and
management of the event started 1 or 2 years before the event. . By this way the
anticipation effect is included in the model
As a conclusion, according to this paper, one can confirm that a mega sporting event
like a World Cup has a positive economic effect on the host country’s economy. In this
case, France saw a significant positive impact through its employment.
Thomas Giraud
29
8 Appendix
1st regression: basic DID
(1)
VARIABLES Model 1
Hosts 1.241e+06***
(143,128)
Time 49,238
(109,698)
Interaction 168,867
(181,913)
Constant 598,903***
(86,310)
Observations 462
R-squared 0.339
Standard errors in parentheses
*** p<0.01, ** p<0.05, * p<0.1
Thomas Giraud
30
2nd regression : modified DID
(1)
VARIABLES Model 2
year1991 -2,322
(66,190)
year1992 -13,122
(66,190)
year1993 -22,669
(66,190)
year1994 -12,976
(66,190)
year1995 -5,823
(66,190)
year1996 -5,258
(66,190)
year1997 7,157
(66,190)
year1998 -33,554
(68,073)
year1999 -6,419
(68,073)
year2000 22,618
(68,073)
year2001 35,005
(68,073)
year2002 42,583
(68,073)
year2003 40,742
(68,073)
year2004 40,742
(68,073)
year2005 46,279
(68,073)
year2006 54,947
(68,073)
year2007 85,322
(68,073)
year2008 78,610
(68,073)
year2009 68,775
(68,073)
Thomas Giraud
31
year2010 75,050
(68,073)
Aquitaine 519,524***
(80,339)
LanguedocRoussillon 161,573**
(80,339)
MidiPyrénées 391,306***
(80,339)
NordPasDeCalais 743,383***
(80,339)
PaysDeLaLoire 626,033***
(80,339)
ProvenceAlpesCotesdAzur 1.010e+06***
(80,339)
RhoneAlpes 1.695e+06***
(80,339)
IleDeFrance 4.783e+06***
(80,339)
intercationTimeAquitaine 83,283
(102,109)
intercationTimeLanguedocRoussill 83,984
(102,109)
intercationTimeMidiPyrénée 88,586
(102,109)
intercationTimeNordPasDeCalais 104,251
(102,109)
interactionTimePaysDeLaLoire 154,861
(102,109)
interactionTimeProvenceAlpesCote 212,694**
(102,109)
interactionTimeRhoneAlpes 234,448**
(102,109)
interactionTimeIleDeFrance 388,830***
(102,109)
Constant 605,780***
(48,446)
Observations 462
R-squared 0.965
Standard errors in parentheses
*** p<0.01, ** p<0.05, * p<0.1

Thomas Giraud
32
9 References
Arne Feddersen and Wolfgang Maennig, 2013. Mega-event and sectoral employment: the
case of the 1996 Olympic Games. Contemporary Economic Policy (ISSN 1465-7287)
Robert A. Baade, Robert W. Baumann and Victor A. Matheson, 2010. Big Men on Campus:
Estimating the Economic Impact of College Sports on Local Economies. Department of
Economics and Business, Lake Forest College, Lake Forest, IL, 60045.
D. Coates, V. A. Matheson2009. Mega-events and housing costs: raising the rent while
raising the roof? Department of economics, University of Maryland, Baltimore county;
Department of Economics, College of the Holy Cross.
Robert A. Baade, Robert Baumann and V. A. Matheson, 2008. Selling the Game:
Estimating the Economic Impact of Professional Sports through Taxable Sales. Southern
Economic Journal, Vol. 74, No 3, pp. 794-810.
ShiNa Li, Leo Jago, 2013. Evaluating economic impacts of major sport events – a meta
analysis of the key trends. Current Issues in Tourism, 16:6, 591-611, DOI: 10.
1080/13683500.2012.736482.
Arne Feddersen and Wolfgang Maennig, 2012. Sectoral labour market effects of the 2006
FIFA World Cup. Labour Economics 19, 860-869
FlorianHagn, Wolfgang Maennig, 2008. Employment effects of the Football World Cup
1974 in Germany. Labour Economics 15, 1062-1075.
Johan Fourie, Maria Santana-Gallego, 2011. The impact of mega-sport events on tourist
arrivals. Tourism Management 32, 1364-1370.
Dominic Ebenbichler, 2013. Londres affirme avoir amorti le coût des JO 2012. Le Monde.fr
with Reuters. http://www.lemonde.fr/europe/article/2013/07/19/londres-affirme-
avoir-amorti-le-cout-des-jo-de-2012_3449924_3214.html
Bob Yates, 2010. Major Events: Good Economics and Exposure to the World.
http://timreview.ca/article/393
Thomas Giraud
33
Pamela Wicker, 2009. Le bilan economique et mediatique de la Coupe du monde de
football en Allemagne. Les cahiers du journalistes n°19.
http://www.cahiersdujournalisme.net/cdj/pdf/19/04_WICKER.pdf
Patrick Bond & Eddie Cottle, Economic Promises and Pitfalls of South Africa’s World Cup.
http://ccs.ukzn.ac.za/files/Bond%20Cottle%20World%20Cup%20economics.pdf
Elsa Dicharry, 2014. Foot : à un mois de la Coupe du monde au Brésil. Les Echos.
http://www.lesechos.fr/entreprises-secteurs/service-
distribution/dossier/0202836000580-foot-a-un-an-de-la-coupe-du-monde-au-bresil-
577282.php
L’Equipe, 2014. Le gachis de Sochi. http://www.lequipe.fr/Tous-sports/Actualites/Le-
gachis-de-sotchi/460648
Fabian Waldinger, Lecture 3: Difference in Difference.
http://www2.warwick.ac.uk/fac/soc/economics/staff/academic/waldinger/teaching/e
c9a8/slides/lecture_3_-_did.pdf
Imbens/Wooldridge, 2007. What’s New in Econometrics? Lecture notes 10, Summer 07.
http://www.nber.org/WNE/lect_10_diffindiffs.pdf
Samuel Duhamel, 2014. Brésil : le gouvernement va dépenser 300 millions d’euros pour
assurer la sécurité pendant la Coupe du monde. M6 info. http://news.fr.msn.com/m6-
actualite/monde/bresil-le-gouvernement-va-depenser-300-millions-euros-pour-
assurer-la-securite-pendant-la-coupe-du-monde
Michel chemin, 2001. Cour des comptes: Coupe du monde.
http://www.liberation.fr/societe/2001/01/25/cour-des-comptes-coupe-du-
monde_352176
Kevin Voigt, 2010. Is there a World Cup economic bounce? CNN.
http://edition.cnn.com/2010/BUSINESS/06/11/business.bounce.world.cup/index.html
Matt Bogard, 2012. Difference-in-Difference Estimators.
http://econometricsense.blogspot.se/2012/12/difference-in-difference-
estimators.html

Thomas Giraud
34
Olga Ponomarenko and Alexander Plekhanov, 2014. ECONOMIC IMPACT OF THE 2014
SOCHI WINTER OLYMPICS.
http://www.ebrd.com/pages/news/press/2014/140205.shtml
Sylvain Fontan, 2013. Les impacts de l'immigration sur le marché du travail.
http://www.leconomiste.eu/decryptage-economie/47-les-impacts-de-l-immigration-
sur-le-marche-du-travail.html