Embed Size (px)
Citation preview

Economic Impacts of Sanitation in VietnamA five-country study conducted in Cambodia, Indonesia, Lao PDR, the Philippines and Vietnam under the Economics of Sanitation Initiative (ESI)
Research Report February 2008

THE WORLD BANKJakarta Stock Exchange Building Tower II/12th Fl.Jl. Jend. Sudirman Kav. 52-53Jakarta 12910Tel: (6221) 5299-3000Fax: (6221) 5299-3111
Printed in 2008. The volume is a product of World Bank staff and consultants. The fi ndings, interpretations, and conclusions expressed herein do not necessarily refl ect the views of the Board of Executive Directors of the World Bank or the governments they represent.The World Bank does not guarantee the accuracy of the data included in this work. The boundaries, colors, denominations, and other information shown on any map in this work do not imply any judgment on the part of the World Bank concerning the legal status of any territory or the endorsement of acceptance of such boundaries.

WSP-EAP Research Report February 2008
Economic Impacts of Sanitation in VietnamA fi ve-country study conducted in Cambodia,Indonesia, Lao PDR, the Philippines and Vietnamunder the Economics of Sanitation Initiative (ESI)

4Economic Impacts of Sanitation in VietnamA five-country study conducted in Cambodia, Indonesia, Lao PDR, the Philippines and Vietnam under the Economics of Sanitation Initiative (ESI)

1Economic Impacts of Sanitation in Vietnam
A five-country study conducted in Cambodia, Indonesia, Lao PDR, the Philippines and Vietnam under the Economics of Sanitation Initiative (ESI)
EXECUTIVE SUMMARY
Executive Summary Sanitation coverage in Vietnam has risen rapidly over the 14 year period 1990 to 2004: from 36% to 60%. Compared to water supply, the sanitation sector is weaker in terms of material facilities and institutions as well as management capacity. While poor sanitation and hygiene have a wide variety of negative impacts, the evidence base is weak, thus hampering the implementation of much needed investments in the sanitation sector. The urgency for such research, and not to mention investments, is only likely to grow over time. One of the reasons is that, with an average population growth of more 1.3% per annum, an additional 1 million Vietnamese will require adequate and clean sanitation facilities each year. Thus, the “Sanitation Impact” study was initiated by the World Bank to generate evidence on the impacts of the existing sanitation situation and potential improvements in sanitation and hygiene in Vietnam.
The study conducted a quantitative assessment of the impacts of poor sanitation on health, water resources, environment, tourism and other welfare indicators. The inclusion of health was based on well-established links between sanitation and disease incidence. On the other hand, water impacts were deemed important because poor sanitation is a signifi cant cause of water pollution. This in turn leads to costly avertive behavior in response to less usable water resources. Moreover, pollution also aff ects the productivity of water resources by way of lower output of fi sheries. Environment impact cannot be ignored since unimproved sanitation aff ects the quality of land, and renders it unattractive or even unusable for productive use. Other welfare impacts were included because the absence of improved sanitation aff ects people in terms of the time spent accessing facilities, productivity in work and school and intangible welfare impacts. Finally, tourism was included in the study because poor sanitation aff ects the country’s attractiveness as a tourist destination.
The primary focus of this study is on human excreta, while for selected impacts other important components of domestic sanitation – gray water and solid waste – were included. In Vietnam, given that ‘Sanitation’ is more broadly defi ned in the proposal to develop a ’Unifi ed Sanitation Sector Strategy and Action Plan’ (U3SAP), some additional components of sanitation described in the strategy are included in this present study such as agricultural waste and waste water from trade villages. In measuring the impacts, the study used standard peer-reviewed methodologies. Financial and economic costs were also distinguished to improve policy interpretation of the results. For selected impacts, the analysis was conducted at the regional level and aggregated to national level.
This study has found that poor sanitation causes considerable fi nancial and economic losses in Vietnam. Financial losses – refl ecting expenditure or income losses resulting from poor sanitation are equal to roughly 0.5% of annual Gross Domestic Product (GDP), while overall population welfare losses are equal to 1.3% of GDP. The majority of economic losses are shared between health (34%), water resources (37%) and the environment (15%). The annual losses per capita equal US$9.38 or VND 150,770. The diagram below shows the annual losses by impact category.

2Economic Impacts of Sanitation in VietnamA five-country study conducted in Cambodia, Indonesia, Lao PDR, the Philippines and Vietnam under the Economics of Sanitation Initiative (ESI)
EXECUTIVE SUMMARY
0
5050
100100
150150
200200
250250
300300
350350
HealthHealth WaterWater EnvironmentEnvironment OtherOtherwelfarewelfare
TourismTourism
Econ
omic
loss
es (U
S$ m
illio
n)Ec
onom
ic lo
sses
(US$
mill
ion)
.
The study estimated the economic losses of health impact to be US$262 million. Health impacts were divided into the costs of health care, productivity and premature death. The study results indicate that sanitation accounts for nearly 7 million diarrhea cases, 2.4 million cases of scabies, helminthes, hepatitis A and trachoma and 0.9 million malnutrition-related cases per annum. These diseases also cause more than 9,000 deaths per year, mostly among children. The health impacts were found to be driven mostly by the costs of premature death and treatment of disease. Of the total health economic costs of US$262 million, health care, productivity costs, and premature death are US$53 million (20%), US$4.6 million (2%) and US$204 million (78%) of the costs, respectively.
A second major impact measured in this study is the impact of poor sanitation on water resources. This study estimates the costs of poor sanitation to be more than US$287 million, including 3 sub-impacts: drinking water, domestic water uses and fi sheries. The study shows that economic losses total US$197 for domestic water uses, US$27 million for fi sheries and US$63 million for drinking water annually.
The impacts on the environment were divided into aesthetics and land use, but only the latter was evaluated quantitatively. The study estimated the amount of land that has been rendered temporarily unusable or unproductive for other uses for all unsanitary landfi lls in Vietnam as a result of unexpected buff er zones. The study estimated that more than US$118 million in the value of land is lost annually.
Other welfare impacts comprise two components evaluated quantitatively. The fi rst - sanitation access time - includes the time it takes for users who share or do not have toilets to access a facility or suitable location. The second - life choices – includes days of females absent from school and work places due to poor sanitation. The study found that the cost of sub-optimal access to toilet facilities US$41.6 million per year, while estimates for life choices totaled US$1.3 million per annum. Other ‘intangible’ welfare impacts were not evaluated quantitatively, but are expected to be important, such as loss of comfort, privacy, prestige and status associated with poor sanitation facilities.
Losses to tourism were conservatively estimated to equal US$69 million annually, refl ecting lower-than-optimal tourist numbers, part of which is attributed to poor sanitation.
The above impacts are related to lack of access to improved household latrines and household gray water management; for environmental impacts, the estimates include inadequate solid waste management. As a part of the expanded components of sanitation evaluated in Vietnam, water pollution from agricultural waste and trade villages were included, adding an additional US$287 million economic impacts per year. However, this fi gure refl ects only a proportion of the total impacts of agricultural waste and waste from trade villages.

3Economic Impacts of Sanitation in Vietnam
A five-country study conducted in Cambodia, Indonesia, Lao PDR, the Philippines and Vietnam under the Economics of Sanitation Initiative (ESI)
EXECUTIVE SUMMARY
Having estimated the costs of poor sanitation, the study also evaluated the benefi ts associated with improved sanitation and hygiene practices. In this study, fi ve potential improvements were examined. These are (a) better hygiene practices, (b) improved latrine physical access, (c) improved toilet system, (d) improved treatment and (e) re-use. The results indicate that improvements in treatment or disposal of waste can reduce the losses by US$355 million a year, mainly through water and tourism impacts. There is also a large benefi t arising from the improved hygiene through reduced health care costs (US$228 million). The value of sanitation input and output markets are estimated at US$129 million and US$202 million, respectively.
While the benefi ts arising from specifi c sanitation options will not necessarily lead to gains which are equal to the sum of the values above, the results nonetheless suggests that the gains can be signifi cant. Hence the diff erent sanitation options need to be examined in terms of what impacts they have, given that single options may simultaneously have several or all of the measured benefi ts. Moreover, the gains are also likely to be larger when one incorporates the impacts on related markets..
The fi ndings of this study indicate that poor sanitation has signifi cant economic costs. Consequently, it also showed that the gains from improved sanitation can be substantial. On the basis of these fi ndings, the study recommends the following.
First, sanitation ‘players’ are advised to act now, otherwise the negative impacts of poor sanitation will increase over time. The government and other stakeholders should jointly reassess the current and planned spending levels in the sanitation and related sectors, covering health, water resources, environment, rural and urban planning and development, fi sheries, and tourism. Increased political importance and budget allocations should be given to sanitation. Sanitation decision makers should use an evidence-based approach to design effi cient sanitation policies and implementation strategies, to increase value-for-money from public and private investments into sanitation..
Second, when fi nancial resources are scarce, the government should give priority to the populations with no latrine, recognizing that eff ective demand may be low in these groups due to low incomes and poor awareness of the benefi ts of investing in sanitation. As well as stimulating demand through public health and latrine advocacy messages, the government should target programs, subsidies and fi nancing mechanisms to the most disadvantaged population groups.
Third, players should broaden the scope of sanitation beyond latrines. Sanitation investments should not be made just in latrine extension programs, but in improved sludge, water and solid waste management, and in hygiene programs to raise population awareness on personal and community hygiene issues. The Unifi ed Sanitation Sector Strategy and Action Plan is critical to boosting harmonized sanitation eff orts.
Fourth, the government should focus on the easy health wins from improved sanitation, through targeting children and focusing on safe but simple latrine designs, improved excreta isolation measures, and improved hygiene practices. Given the key role of hygiene practices in health improvement, high-impact hygiene components should be integrated in the planning and implementation of sanitation programs. The Ministry of Health should (continue to) play a central role in the health aspects of sanitation programs.
To convince local decision makers such as city mayors or district offi cers to invest in sanitation, local studies would be more credible in convincing local decision makers that sanitation is a neglected issue and that signifi cant improvements in population welfare can be obtained. The methodology used in this study can be equally applied to local micro-level studies as well as the national level. Furthermore, local as well as national decision makers need to be informed of the effi ciency of diff erent measures to improve sanitation. Local level cost-benefi t studies inform national decision makers how to invest effi ciently in sanitation.

FOREWORD
4Economic Impacts of Sanitation in VietnamA five-country study conducted in Cambodia, Indonesia, Lao PDR, the Philippines and Vietnam under the Economics of Sanitation Initiative (ESI)4Economic Impacts of Sanitation in VietnamA five-country study conducted in Cambodia, Indonesia, Lao PDR, the Philippines and Vietnam under the Economics of Sanitation Initiative (ESI)
Foreword Vietnam, like other countries of Southeast and East Asia, is on a development path that is lifting large numbers of people out of poverty and improving access to goods and services that improve quality of life. While Vietnam has done well so far in achieving socio-economic development, some aspects of development are being forgotten in the race to economic progress. Also, the development process itself jeopardizes the quality of life of its citizens, especially vulnerable and low income groups, which in turn has unrecognized negative economic impacts.
Sanitation is one such neglected aspect of development. Among the many priorities of households as well as the government, it is often pushed down the agenda, and left as an issue to be dealt with by someone else, or not at all. Though sanitation coverage in Vietnam rose rapidly over the last 15 years, the sanitation sector is weaker than the water sector in terms of material facilities, institutions and management capacity. On current projections, the 2015 Millennium Development Goal (MDGs) sanitation target and Vietnam’ own goals, the 2010 Vietnam Development Goals (VDGs), need considerable further investment to meet. Given that ‘Sanitation’ in Vietnam is more broadly defi ned in the proposal to develop a “Unifi ed Sanitation Sector Strategy and Action Plan”, boosting sanitation eff orts and approaches is even more urgent.
To control and mitigate these direct impacts and externalities requires increased investment in sanitation as well as in improved knowledge, understanding and behavioral change, regulation and monitoring to maintain standards.
Hence, if all stakeholders are to be convinced that these expenditures are worth making, evidence is needed to better understand the impacts of poor sanitation now and in the future, and to detail the expected benefi ts from diff erent sanitation choices.
Based on this premise, the World Bank’s Water and Sanitation Program (WSP) in East Asia and the Pacifi c (WSP-EAP) is supporting the development of a research program “the Economics of Sanitation Initiative” (ESI) to generate evidence on the economic costs and benefi ts of diff erent sanitation-related options. The research under this program is initially being conducted in Cambodia, Indonesia, Philippines and Vietnam.
The fi rst major activity of the Economics of Sanitation Initiative is to conduct a ‘Sanitation Impact Study’, to examine the economic and social impacts of unimproved sanitation to the population and economy of Vietnam, as well as the potential benefi ts of improving sanitation. They will be further supported in decision making following the completion of the second study of ESI, a ‘Sanitation Options Study’, which will examine the cost-eff ectiveness and cost-benefi t of alternative sanitation improvement, fi nancing and management options in a range of settings.
While the Water and Sanitation Program has supported the development of this program, it is an ‘initiative’ in the broadest sense, one in which many people and institutions have become involved and have actively contributed (see ‘Acknowledgements’ section and Annex C for details), with a high sense of country and regional ownership.

5Economic Impacts of Sanitation in Vietnam
A five-country study conducted in Cambodia, Indonesia, Lao PDR, the Philippines and Vietnam under the Economics of Sanitation Initiative (ESI)
ABBREVIATIONS
5Economic Impacts of Sanitation in Vietnam
A five-country study conducted in Cambodia, Indonesia, Lao PDR, the Philippines and Vietnam under the Economics of Sanitation Initiative (ESI)
AbbreviationsADB Asian Development BankBOD Biochemical Oxygen DemandCBA Cost-Benefi t AnalysisCOD Chemical Oxygen DemandDHS Demographic and Health SurveyDO Dissolved OxygenEAP East Asia and the Pacifi cEASAN East Asia Sanitation Conference Ecosan Ecological SanitationESI Economics of Sanitation InitiativeFAO Food and Agriculture OrganizationFDI Foreign Direct InvestmentFY Financial YearGDP Gross Domestic ProductGNP Gross National ProductGSO General Statistics Offi ce of VietnamHH HouseholdHRQL Health-Related Quality of LifeIPD In-patient DayJMP Joint Monitoring Program (WHO, UNICEF)Kg KilogramsMARD Ministry of Agriculture and Rural DevelopmentMDG Millennium Development GoalMOC Ministry of ConstructionMOH Ministry of HealthMONRE Ministry of Natural Resource and EnvironmentNGO Non-Governmental OrganizationNRWSSS National Rural Water Supply and Sanitation StrategyOECD Organization of Economic Cooperation and DevelopmentOPV Out-patient VisitSEAR-B WHO Southeast Asia region epidemiological strata BSEI Stockholm Environment InstituteSTC Short Term ConsultantUNEP United Nations Environment ProgramUNICEF United Nation Children’s FundUNITAR United Nations Institute for Training and ResearchVDG Vietnam Development GoalVHLSS Vietnam Household Living Standard SurveyVNHS Vietnam National Health SurveyWB World BankWHO World Health OrganizationWSS Water Supply and SanitationWPR-B WHO Western-Pacifi c Region epidemiological strata BWSP Water and Sanitation ProgramWTP Willingness To Pay

ACKNOWLEDGEMENTS
6Economic Impacts of Sanitation in VietnamA five-country study conducted in Cambodia, Indonesia, Lao PDR, the Philippines and Vietnam under the Economics of Sanitation Initiative (ESI)
AcknowledgementsThe Sanitation Impact Study was conducted in four countries: Cambodia, Indonesia, the Philippines and Vietnam. A study is ongoing in Lao PDR. The study was led by the East Asia and Pacifi c offi ce of the World Bank’s Water and Sanitation Program (WSP), with the contribution of WSP teams in each of the participating countries. The study took one year to complete, and has undergone two major peer review processes.
Guy Hutton (WSP-EAP Regional Senior Water and Sanitation Economist) led the development of the concept and methodology for the Economics of Sanitation Initiative, and the management and coordination of the country team. The study benefi ted from the continuous support of other WSP-EAP staff . Isabel Blackett was the Task Team Leader; and Jema Sy, Brian Smith, Almud Weitz and Richard Pollard provided input to the concept development and study execution. Bjorn Larsen (WSP Consultant) contributed to the study methodology and provided the fi gures for malnutrition-related health eff ects of poor sanitation.
The country team in Vietnam consisted of Pham Ngoc Thang (WSP Consultant and country lead) and Hoang Anh Tuan (WSP Consultant). WSP staff in Vietnam country offi ce provided valuable management, technical support and peer review: Nguyen Thanh, Mike Seager, Nguyen Diem Hang and Nga Kim Nguyen.
The ESI has been fi nanced by the regional component of the Sustainable Sanitation in East Asia (SUSEA) program, which is funded by the Swedish International Development Agency (SIDA). The Philippines study received co-funding from the USAID Environmental Cooperation-Asia (ECO-Asia) program. WSP and the report authors are grateful to the funding agencies for supporting this study.
Elena Strukova, Caroline van den Berg, Anjali Archarya, and Tracey Hart reviewed the methodology study before its implementation. Peer reviewers of the Vietnam country draft report were: Samuel Leibermann, Doan Hong Quang, Pham Khanh Toan (Ministry of Construction), Nguyen Viet Anh (University of Civil Engineering), Nguyen Kim Thai (University of Civil Engineering), Nguyen Van Thuan (Australian Agency for International Development), and John Collett (Plan International). The Vietnam study benefi ted from peer review conducted simultaneously on other country reports as well as the synthesis report. Peer reviewers of the synthesis draft report were (World Bank staff unless otherwise stated): Eddy Perez, Anjali Acharya, Pete Kolsky, Elena Strukova (consultant), Bjorn Larsen (consultant), and Peter Feldman (Plan International). Peer reviewers of the Cambodia country draft report were: Hilda Winarta (UNICEF), Jan Lam (SNV), Chea Samnang (Ministry of Rural Development), Ruud Corsel (Niras-Scanagri, Vietnam), and Oun Syvibola (Plan International). Peer reviewers of the Philippines country draft report were: Jema Sy and Andy Robinson (consultant).
WSP and the country team appreciate the inputs of local stakeholders from the relevant governmental authorities, donor agencies and NGOs. A complete list of key informants is given in Annex C.
Reference for citationEconomic impacts of sanitation in Vietnam. Thang P, Tuan H, Hutton G. World Bank, Water and Sanitation Program. 2008.
This technical report is available in shortened form from WSP offi ces and from http://www.wsp.org/pubs/index.asp.
References for other reports• Economic impacts of sanitation in Southeast Asia. Hutton G, Rodriguez UE, Napitupulu L, Thang P, Kov P. World
Bank, Water and Sanitation Program. 2008.

ACKNOWLEDGEMENTS
7Economic Impacts of Sanitation in Vietnam
A five-country study conducted in Cambodia, Indonesia, Lao PDR, the Philippines and Vietnam under the Economics of Sanitation Initiative (ESI)
• Economic impacts of sanitation in Cambodia. Kov P, Sok H, Roth S, Chhoeun K, Hutton G. World Bank, Water and Sanitation Program. 2008.
• Economic impacts of sanitation in Indonesia. Napitupulu L and Hutton G. World Bank, Water and Sanitation Program. 2008.
• Economic impacts of sanitation in the Philippines. Rodriguez UE, Jamora N, Hutton G. World Bank, Water and Sanitation Program. 2008.

CONTENTS
8Economic Impacts of Sanitation in VietnamA five-country study conducted in Cambodia, Indonesia, Lao PDR, the Philippines and Vietnam under the Economics of Sanitation Initiative (ESI)
Table of ContentsExecutive Summary 1
Foreword 4
Abbreviations 5
Acknowledgements 6
Table of Contents 8
1. Introduction 15
1.1 Human development and sanitation 16
1.2 Sanitation in Vietnam 16
1.3 Measuring the economic impact of sanitation 20
1.4 Study aims 22
2. Study Methodology Overview 25
2.1 Levels and units of analysis 26
2.2 Scope of sanitation 27
2.3 Impact identifi cation and classifi cation 28
2.4 Estimation methods for fi nancial and economic costs of poor sanitation 30
2.5 Impact mitigation 31
2.6 Uncertainty 32
3. Economic Impact Results 35
3.1 Summary of economic impacts of poor sanitation 36
3.1.1 Overall impacts 36
3.1.2 Other non-quantifi ed impacts of poor sanitation 37
3.2 Health impacts 39
3.3 Water resource impacts 42
3.4 Environmental impacts 48
3.5 Other welfare impacts 49
3.6 Tourism impacts 50
3.7 Economic gains from improved sanitation & hygiene 50
3.8 Evaluation of Uncertainty 54
4. Discussion, Conclusions and Recommendations 57
4.1 Discussion 58
4.2 Recommendations 59
Annexes 63
Annex A: Study Methods 64
A1. Health impact 64
A1.1 Selection of diseases 64
A1.2 Health care cost estimation 65
A1.3 Health-related productivity cost estimation 70
A1.4 Premature death cost estimation 72
A1.5 Disease burden from diseases indirectly related to poor sanitation 74

CONTENTS
9Economic Impacts of Sanitation in Vietnam
A five-country study conducted in Cambodia, Indonesia, Lao PDR, the Philippines and Vietnam under the Economics of Sanitation Initiative (ESI)
A2. Water resources 79
A2.1 Water quality measurement 79
A2.2 Contribution of poor sanitation to water pollution 80
A3. Environment 90
A3.1 Aesthetics 90
A.3.2 Land quality 91
A4. Other welfare 92
A4.1 Intangible user preferences 92
A4.2 Access time 93
A4.3 Impact on life decisions and behavior 93
A5. Tourism 94
A5.1 Tourism and sanitation 94
A5.2 Estimation of tourist losses due to poor sanitation 96
A6. Impact mitigation associated with improved sanitation and hygiene 97
A6.1 Health 97
A6.2 Other economic losses due to poor sanitation 98
A6.3 Market for sanitation inputs 98
A6.4 Market for sanitation outputs 99
A7. Uncertainty analysis 100
Annex B: Algorithms 101
B1. Aggregating equations 101
B2. Health costs related to poor sanitation and hygiene 101
B3. Water related costs associated with poor sanitation and hygiene 102
B4. Land costs 102
B5. User preference costs Algorithm 102
B6. Tourism losses 102
B7. Variable defi nition summary 103
Annex C: List of Stakeholder and Person met 105
Annex D: Data Inputs 106
Annex E: Results 118
Annex F: References 121

CONTENTS
10Economic Impacts of Sanitation in VietnamA five-country study conducted in Cambodia, Indonesia, Lao PDR, the Philippines and Vietnam under the Economics of Sanitation Initiative (ESI)
List of TablesTable 1. Improved sanitation coverage statistics for Southeast Asian countries versus other developing
world regions (%)17
Table 2. Comparison of sanitation types and coverage values (%) measured in diff erent national surveys in Vietnam
18
Table 3. Solid waste disposal practices of household by urban and rural areas (%) 19
Table 4. Population size and provincial make-up of regions in Vietnam (year 2005) 27
Table 5. Aspects of sanitation included in the present ‘Sanitation Impact’ study 28
Table 6. Justifi cation for choice of impacts included in the study 29
Table 7. Categorization of impacts measured in the present study 30
Table 8. Financial and economic costs due to poor sanitation measured in the present study 31
Table 9. Potential benefi ts of diff erent sanitation improvement options 32
Table 10. Financial and economic losses due to poor sanitation, by impact type 36
Table 11. Financial and economic losses due to poor sanitation, by area 37
Table 12. Description of importance of non-quantifi ed impacts of poor sanitation 38
Table 13. Summary health impacts by disease 39
Table 14. Total health care costs by disease 40
Table 15. Total productivity costs by disease 40
Table 16. Total costs of premature death, using human capital approach 41
Table 17. Total health-related costs (US$ Thousand) 42
Table 18. Water resources in Vietnam 43
Table 19. Water quality of 8 regions in Vietnam 43
Table 20. Total release of polluting substances to inland water bodies 44
Table 21. Selected water quality measurements in Vietnam (in 2005) 44
Table 22. Drinking water access costs (US$ Thousands) 46
Table 23. Domestic use water access costs (drinking water excluded) (US$ Thousand) 46
Table 24. Fish catch value (farm and inland catch) – actual and estimated loss, 2005 47
Table 25. Economic loss due to degraded and unavailable land in the unsanitary dumps 48
Table 26. Time used accessing latrines 49
Table 27. Impacts of poor sanitation on school of pupils and work attendance of women 49
Table 28. Volume and importance of tourist sector in Vietnam 50
Table 29. Economic impact of lower tourist numbers 50
Table 30. Predicted fi nancial and economic gains from improved sanitation (US$) 52
Table 31. Sanitation input market values 53
Table 32. Sanitation output market values 53
Annex Table A1. Importance of sanitation and hygiene-related diseases, total cases and total deaths (2005)
65
Annex Table A2. Treatment seeking behavior, by provider 66
CONTENTS
11Economic Impacts of Sanitation in Vietnam
A five-country study conducted in Cambodia, Indonesia, Lao PDR, the Philippines and Vietnam under the Economics of Sanitation Initiative (ESI)
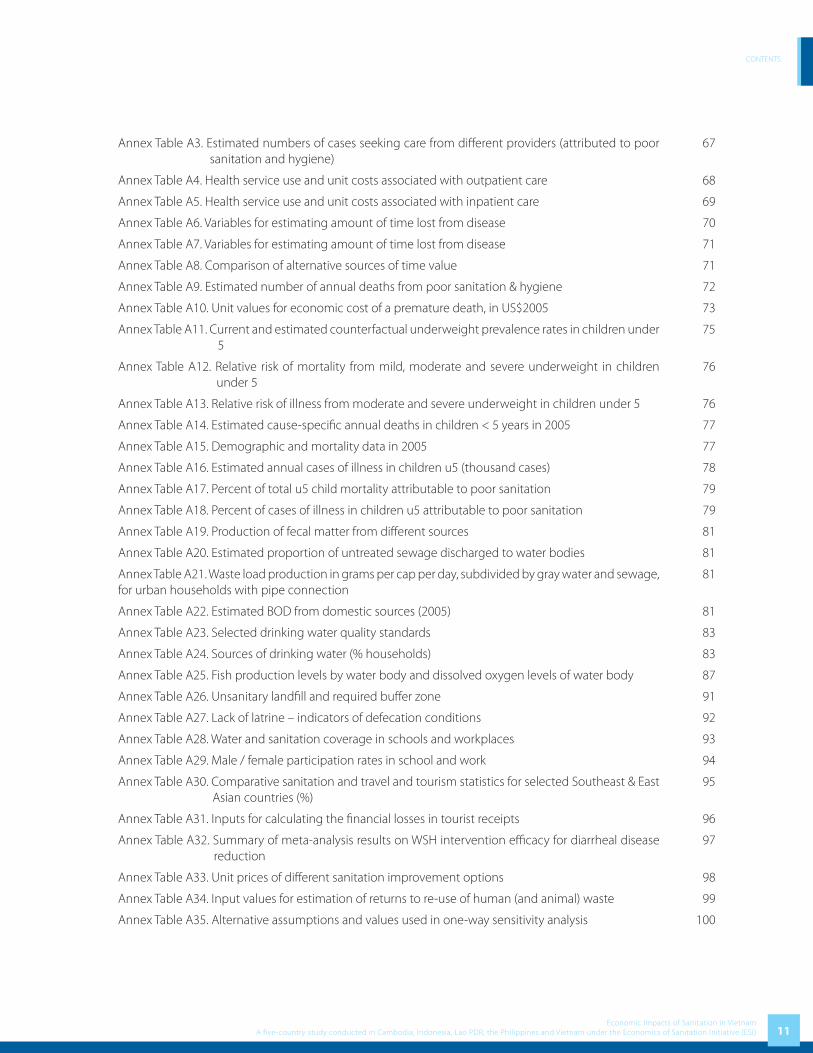
Annex Table A3. Estimated numbers of cases seeking care from diff erent providers (attributed to poor sanitation and hygiene)
67
Annex Table A4. Health service use and unit costs associated with outpatient care 68
Annex Table A5. Health service use and unit costs associated with inpatient care 69
Annex Table A6. Variables for estimating amount of time lost from disease 70
Annex Table A7. Variables for estimating amount of time lost from disease 71
Annex Table A8. Comparison of alternative sources of time value 71
Annex Table A9. Estimated number of annual deaths from poor sanitation & hygiene 72
Annex Table A10. Unit values for economic cost of a premature death, in US$2005 73
Annex Table A11. Current and estimated counterfactual underweight prevalence rates in children under 5
75
Annex Table A12. Relative risk of mortality from mild, moderate and severe underweight in children under 5
76
Annex Table A13. Relative risk of illness from moderate and severe underweight in children under 5 76
Annex Table A14. Estimated cause-specifi c annual deaths in children < 5 years in 2005 77
Annex Table A15. Demographic and mortality data in 2005 77
Annex Table A16. Estimated annual cases of illness in children u5 (thousand cases) 78
Annex Table A17. Percent of total u5 child mortality attributable to poor sanitation 79
Annex Table A18. Percent of cases of illness in children u5 attributable to poor sanitation 79
Annex Table A19. Production of fecal matter from diff erent sources 81
Annex Table A20. Estimated proportion of untreated sewage discharged to water bodies 81
Annex Table A21. Waste load production in grams per cap per day, subdivided by gray water and sewage, for urban households with pipe connection
81
Annex Table A22. Estimated BOD from domestic sources (2005) 81
Annex Table A23. Selected drinking water quality standards 83
Annex Table A24. Sources of drinking water (% households) 83
Annex Table A25. Fish production levels by water body and dissolved oxygen levels of water body 87
Annex Table A26. Unsanitary landfi ll and required buff er zone 91
Annex Table A27. Lack of latrine – indicators of defecation conditions 92
Annex Table A28. Water and sanitation coverage in schools and workplaces 93
Annex Table A29. Male / female participation rates in school and work 94
Annex Table A30. Comparative sanitation and travel and tourism statistics for selected Southeast & East Asian countries (%)
95
Annex Table A31. Inputs for calculating the fi nancial losses in tourist receipts 96
Annex Table A32. Summary of meta-analysis results on WSH intervention effi cacy for diarrheal disease reduction
97
Annex Table A33. Unit prices of diff erent sanitation improvement options 98
Annex Table A34. Input values for estimation of returns to re-use of human (and animal) waste 99
Annex Table A35. Alternative assumptions and values used in one-way sensitivity analysis 100

CONTENTS
12Economic Impacts of Sanitation in VietnamA five-country study conducted in Cambodia, Indonesia, Lao PDR, the Philippines and Vietnam under the Economics of Sanitation Initiative (ESI)
Annex Table A36. Alternative assumptions for links between poor sanitation and impacts 100
Table B 1. Subscripts used in algorithms 103
Table B2. Variables used in algorithms 103
Table B3. Parameters used in algorithms 104
Annex Table C1. List of Stakeholder and Person met 105
Annex Table D1. Defi nition of ‘improved’ and ‘unimproved’ sanitation and water supply 106
Annex Table D2. Sanitation coverage by region and rural/urban grouping 106
Annex Table D3. Diseases linked to poor sanitation and hygiene, and primary transmission routes and vehicles
107
Annex Table D4. Health care unit cost studies from the Vietnam 108
Annex Table D5: Breakdown Diseases by Morbidity and Mortality by Region 110
Annex Table D6: Breakdown of Diseases by Age 111
Annex Table D7: Breakdown Diseases by Region 112
Annex Table D8: Sources of drinking water for households, 2004 113
Annex Table D9: Water quality – Fresh-water quality guidelines for protection of aquatic life 113
Annex Table D10. Fish production levels by region (in thousand tons) 115
Annex Table D11. Share of household having toilet by type of toilet, area, and region (in percentage) 115
Annex Table D12. Percentage of household using latrines and types of latrines 116
Annex Table D13. Cottage villages and their waste 116
Annex Table E1. Average pH by region and source of water 118
Annex Table E2. Average Nitrite level by region and source of water (mg/l) 118
Annex Table E3. Average Nitrate level by region and source of water (mg/l) 118
Annex Table E4. Average Amoni level by region and source of water (mg/l) 119
Annex Table E5. Average dissolved oxygen level by region and source of water (mg/l) 119
Annex Table E6. Average Clorua level by region and source of water (mg/l) 119
Annex Table E7. Average Iron (Fe) level by region and source of water (mg/l) 120
List of FiguresFigure 1. Primary and economic impacts associated with improved sanitation options (human waste) 27
Figure 2. Economic cost of premature death at diff erent values for premature death 41
Figure 3. Contribution of diff erent costs to total cost, by disease 42
Figure 4. Ranges in impacts from one-way sensitivity analysis on selected variables 54
Figure A1. Modeled relationship between dissolved oxygen levels and fi sh production (with lower and upper range)
88

CONTENTS
13Economic Impacts of Sanitation in Vietnam
A five-country study conducted in Cambodia, Indonesia, Lao PDR, the Philippines and Vietnam under the Economics of Sanitation Initiative (ESI)
List of BoxesBox 1. Loss of caged-fi sh farming in Ha Nam Province 47
Box 2. Problems with the Dong Thanh Dump Site in Ho Chi Minh City 48
Box 3. Vietnam’s water resources are unsustainable 80
Box 4. Water treatment costs in Dong Nai 84
Box 5. Small business saves on water costs in An Giang province 90
Box 6. View of a local tourist on Thanh Nien Newspaper 96
Annex Box D1. Waste from cottage villages 117

Table of Basic Country Data, Vietnam (latest year)
Variable Value
Population
Total population (millions) 84.2
Rural population (millions) 61.4
Urban population (millions) 22.8
Under 5 population (% of total) 8.85%
Under fi ve mortality rate (per 1000) 19
Female population (% of total) 51%
Urban population (% of total) 26%
Annual population growth (2005-15) 1.0%
Population below poverty line 29%
Currency
Currency name Dong
Year of cost data presented 2005
Currency exchange with US$ 16,080
Exchange rate year 2007
GDP per capita (US Dollar) 723
GDP per capita (PPP) 3,300
Sanitation
% improved rural 50%
% improved urban 92%
% urban sewage connection treated 14%

WSP-EAP Research Report February 2008
1Introduction

INTRODUCTION
16Economic Impacts of Sanitation in VietnamA five-country study conducted in Cambodia, Indonesia, Lao PDR, the Philippines and Vietnam under the Economics of Sanitation Initiative (ESI)
1.1 Human development and sanitation
Pollution caused by human activity is not a new issue or problem – it has been around as long as man himself. However, as human populations have become more concentrated and located in vulnerable land or coastal areas, the ability of man to pollute has increased substantially. A major cause of pollution is due to waste products, including waste from human living activities, industrial and agricultural waste.
Like other Asian countries, Vietnam faces severe population pressures, with high population density, especially in coastal areas. Environmental concerns and economic development are not aligned towards sustainable growth. Of 122 countries evaluated for environmental sustainability, Vietnam ranked at 114th, and with respect to environmental systems1, Vietnam ranked at 108th [1]. Vietnam along with other Southeast Asian countries is reported to have the worst water pollution, with “very severe” ranking for fecal coliforms, biochemical oxygen demand and lead, and severe for suspended solids [2]. The quality of water bodies is being increasing polluted as a result of economic development and lack of proper disposal or treatment of sewage and wastewater, and many rivers reaching severe levels of water pollution [3]. Water pollution and water-borne diseases remain key issues in Vietnam, with inadequate water supply and sanitation listed as major causes. Indeed, severe disease and premature mortality are some of the most direct and devastating impacts of poor sanitation and hygiene, with the poor, children and women aff ected disproportionately.
1.2 Sanitation in Vietnam
Unarguably, sanitation is lagging behind other global development goals. In 2004, 59% of the world’s population had access to improved sanitation, which represents a 10% increase from 49% global coverage in 1990. However, due to population growth, the unserved global population has decreased only marginally from 2.7 to 2.6 billion over a 14 year time period [4]. Offi cial sanitation coverage data from the WHO/UNICEF Joint Monitoring Program (JMP) are tabulated below for Southeast Asian countries, and for other world regions, comparing the MDG base year (1990) with the most recent coverage data (2004). Annex Table D1 provides JMP defi nitions of improved and unimproved water and sanitation.
Based on JMP statistics for 2004 Vietnam has the best access statistics for urban sanitation of all the lower income countries in the region, although this does not refl ect adequate treatment and disposal of wastes. All the middle and high income countries in the region, such as Singapore, Thailand and Malaysia, have higher coverage fi gures. Despite an impressive growth in sanitation coverage of more than 60% since 1990, only 50% of rural households have access to improved sanitation in the year 2004.
1 5 indicators: air quality, water quantity, water quality, biodiversity and terrestrial systems
INTRODUCTION
17Economic Impacts of Sanitation in Vietnam
A five-country study conducted in Cambodia, Indonesia, Lao PDR, the Philippines and Vietnam under the Economics of Sanitation Initiative (ESI)
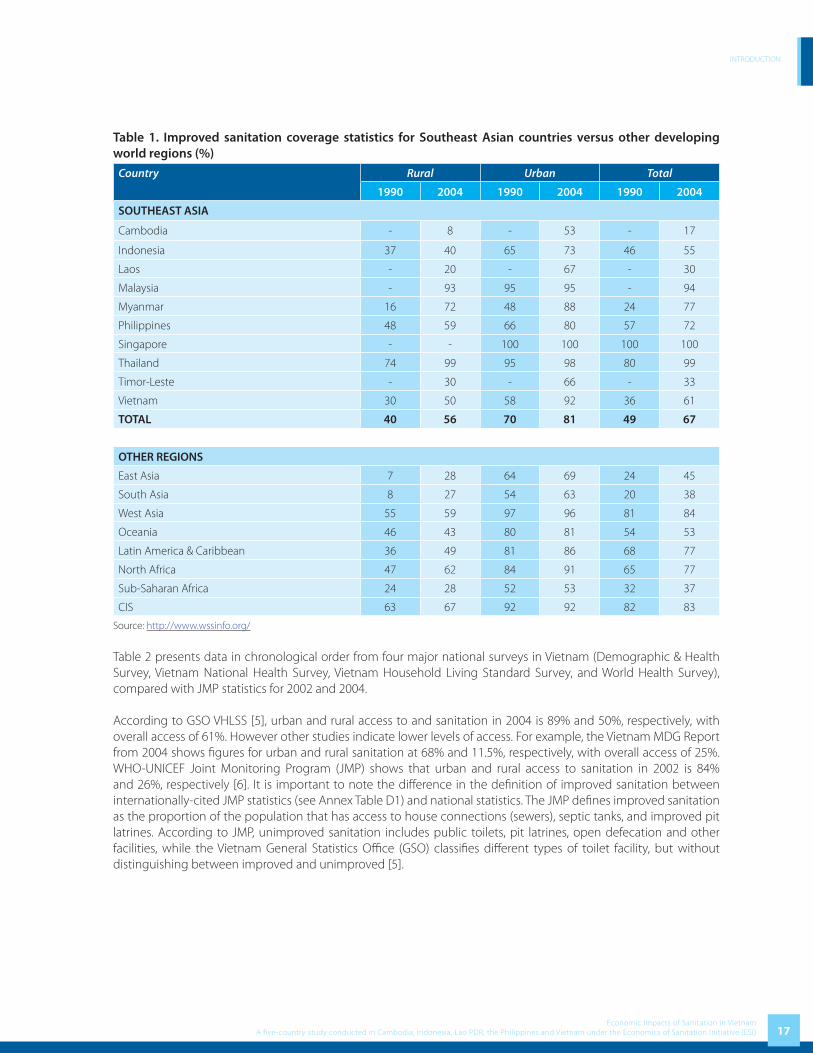
Table 1. Improved sanitation coverage statistics for Southeast Asian countries versus other developing world regions (%)
Country Rural Urban Total
1990 2004 1990 2004 1990 2004
SOUTHEAST ASIA
Cambodia - 8 - 53 - 17
Indonesia 37 40 65 73 46 55
Laos - 20 - 67 - 30
Malaysia - 93 95 95 - 94
Myanmar 16 72 48 88 24 77
Philippines 48 59 66 80 57 72
Singapore - - 100 100 100 100
Thailand 74 99 95 98 80 99
Timor-Leste - 30 - 66 - 33
Vietnam 30 50 58 92 36 61
TOTAL 40 56 70 81 49 67
OTHER REGIONS
East Asia 7 28 64 69 24 45
South Asia 8 27 54 63 20 38
West Asia 55 59 97 96 81 84
Oceania 46 43 80 81 54 53
Latin America & Caribbean 36 49 81 86 68 77
North Africa 47 62 84 91 65 77
Sub-Saharan Africa 24 28 52 53 32 37
CIS 63 67 92 92 82 83
Source: http://www.wssinfo.org/
Table 2 presents data in chronological order from four major national surveys in Vietnam (Demographic & Health Survey, Vietnam National Health Survey, Vietnam Household Living Standard Survey, and World Health Survey), compared with JMP statistics for 2002 and 2004.
According to GSO VHLSS [5], urban and rural access to and sanitation in 2004 is 89% and 50%, respectively, with overall access of 61%. However other studies indicate lower levels of access. For example, the Vietnam MDG Report from 2004 shows fi gures for urban and rural sanitation at 68% and 11.5%, respectively, with overall access of 25%. WHO-UNICEF Joint Monitoring Program (JMP) shows that urban and rural access to sanitation in 2002 is 84% and 26%, respectively [6]. It is important to note the diff erence in the defi nition of improved sanitation between internationally-cited JMP statistics (see Annex Table D1) and national statistics. The JMP defi nes improved sanitation as the proportion of the population that has access to house connections (sewers), septic tanks, and improved pit latrines. According to JMP, unimproved sanitation includes public toilets, pit latrines, open defecation and other facilities, while the Vietnam General Statistics Offi ce (GSO) classifi es diff erent types of toilet facility, but without distinguishing between improved and unimproved [5].

INTRODUCTION
18Economic Impacts of Sanitation in VietnamA five-country study conducted in Cambodia, Indonesia, Lao PDR, the Philippines and Vietnam under the Economics of Sanitation Initiative (ESI)
Table 2. Comparison of sanitation types and coverage values (%) measured in diff erent national surveys in Vietnam
Survey Improved sanitation (%) Unimproved sanitation (%)
House sewer connection,
Septic tank (Flush/pour-fl ush)
Ventilated improved pit latrine, pit latrine
with slab, composting toilet
Total Public or shared toilet,
Pit latrine without slab
Open (No facilities)
Other Total
Demographic & Health Survey 1997
Rural 6.0 9.4 15.4 58.4 26.2 na 84.6
Urban 67.4 7.3 74.7 16.9 8.3 na 25.2
Total 17.7 9.0 26.7 50.5 22.8 na 73.3
Vietnam National Health Survey 2001 - 2002
Rural 13.8 15.1 28.9 48.3 21.3 1.5 71.1
Urban 70.8 8.2 79 12.4 8.2 0.4 21
Total 28.4 13.3 41.7 39.1 18.0 1.2 58.3
Joint Monitoring Program 2002
Rural na na 26.0 na na na 74.0
Urban na na 84.0 na na na 16.0
Total na na na na na na na
Vietnam Household Living Standard Survey 2002
Rural 14.3 29.8 44.1 na 18.5 37.4 55.9
Urban 73.5 11.5 85.0 na 4.9 10.1 15.0
Total 30.2 24.9 55.1 na 14.8 30.1 44.9
Vietnam Household Living Standard Survey 2004
Rural 20.5 29.5 50.0 na 16.3 33.7 50.0
Urban 80.8 8.8 89.6 na 3.2 7.2 10.4
Total 37.2 23.8 61.0 na 12.6 26.4 39.0
Joint Monitoring Program 2004
Rural na na 50.0 na na na 50.0
Urban na na 92.0 na na na 18.0
Total na na 61.0 na na na 39.0
na – not available
In addition, there are considerable disparities in sanitation coverage between diff erent regions. In general, sanitation coverage in the North West, the Central Highlands and the Mekong River Delta are much lower than in the rest of the country. The coverage in those regions is 22.8%, 42.9% and 31.4% respectively. Annex Table D2 provides further information on sanitation coverage in diff erent regions of Vietnam.
In terms of other aspects of sanitation, there are fewer data available. One aspect where there are data, solid waste management, indicates relatively poor sanitation levels in Vietnam. Only 60% of solid waste from urban areas and industrial zones is collected and disposed of in dumpsites, and only 12 out of 61 cities and provincial capitals have engineered or sanitary landfi lls [7]. Data on solid waste disposal practices of households reveal only 22% of households have their solid waste collected by garbage truck, with over 50% of households burning their rubbish, 20% burying it, and 13% throwing into a river [8].

INTRODUCTION
19Economic Impacts of Sanitation in Vietnam
A five-country study conducted in Cambodia, Indonesia, Lao PDR, the Philippines and Vietnam under the Economics of Sanitation Initiative (ESI)
Table 3. Solid waste disposal practices of household by urban and rural areas (%)
Location Garbage truck Burning BuryingThrowing to
riverThrowing to animal
closureOther
Rural 6.8 63.0 23.0 15.0 16.7 18.9
Urban 71.0 20.0 7.5 6.3 4.1 2.8
Total 21.9 52.9 19.4 12.9 13.7 15.1
Source: [8]
The coverage of sewerage and drainage services in urban areas is estimated to be about 40-50% (from 0% in some small towns to 70% in some big cities) [9]. In addition, agricultural waste is also a growing problem. Agricultural chemicals are used by a high proportion of farners, covering large areas of land. As a result, many contaminants from agricultural land (mud, alum, fertilizer, pesticide, etc.) have been carried to water sources.
During the last decade, the Government and the donor community have focused mainly on improving access to water supply. The sanitation sector has been given greater attention in recent years due to the fact that wastewater and solid waste are becoming urgent issues in urban areas, industrial zones, and trade villages as a result of urbanization and industrialization processes. In general, in comparison with water supply, the sanitation sector is weaker in terms of material facilities and institutional support, as well as institutional implementation capacity. Current trends shows that it remains diffi cult to meet the sanitation MDG sanitation target in Vietnam, and the development goals of the Vietnam government (VDGs) [9].
In addition to excreta, urban areas and industrial zones in Vietnam generate some 20,000 tons of solid waste every day of which only 60% is collected and disposed of. In big cities, the problem related to the landfi lls – which are often little more than open dumping ground – also needs to be urgently and properly dealt with to avoid protests raised by the local residents.
There are about 1,450 cottage/trade villages in Vietnam, which are concentrated in Red River Delta (67.3%), central area (20.5%) and southern area (12.2%) [10]. Vietnamese trade villages can be divided into: agricultural product processing villages, weaving and dying villages, fi ne arts and craft villages, recycling villages, construction material villages and other professional villages. These cottage villages generate a substantial amount of solid waste from their production activities. Annex Table D13 provides further information on numbers of cottage villages in Vietnam.
According to current estimates, the government targets for service provision by 2010, which refl ect the MDGs on water supply and sanitation, will require investment in the order of US$8.8 billion [6]. Sanitation requires US$4.2 of this total, US$3.8 billion in urban areas and US$0.4 billion in rural areas. If the budget contribution to urban water supply and sanitation remains at the level of the last 10 years, this source will be able to fi nance only about 4% of urban needs during 2004-2010. With respect to rural water supply and sanitation, according to the NRWSSS, users are responsible for all the investment and operation and maintenance costs of the rural water supply and sanitation facilities, with government grants supporting only the poor. With the current mix of overseas development aid and government funds, around 25% of urban and rural needs can be funded.
The reasons for public underinvestment in sanitation in Vietnam are many, and include the low political profi le of sanitation in terms of government prioritization and funding, limited tax revenue, the lack of recognition of the many costs to society of poor sanitation, and a higher demand for investments in domestic water supply. As well as lack of top-down investment in the sector, the opportunities for attracting private sector engagement in the fi nancing and provision of sanitation services are not suffi ciently enabled, especially the potential for contribution by small-scale entrepreneurs. To date, most sanitation investment has been by household self-provision. Sanitation in Vietnam is predominantly a private good with the majority of households investing in septic tanks or latrines. The fi nancing source in rural areas has been predominantly community and household contributions, whereas public investment is mainly in the big cities.

INTRODUCTION
20Economic Impacts of Sanitation in VietnamA five-country study conducted in Cambodia, Indonesia, Lao PDR, the Philippines and Vietnam under the Economics of Sanitation Initiative (ESI)
As a result, this sanitation impact study is important for a number of reasons. First, this is the fi rst attempt to measure the real impacts of poor sanitation in Vietnam. Second, the results of the study can be used to raise the awareness of all stakeholders, including government, private sector and donor agencies with regards to the urgency of boosting sanitation eff orts and approaches. Finally, this study will hopefully stimulate further research in the area.
1.3 Measuring the economic impact of sanitation
Until now, many of the consequences of poor sanitation are understood at a general level, but few impact-specifi c and location-specifi c data exists to support assertions that poor sanitation imposes a considerable burden on society. Without such information, policy makers are unable to act. Furthermore, while some impacts of sanitation are now better understood, such as health impacts, many of the stakeholders that need to become convinced of the importance of sanitation are not directly concerned with health. Hence a range of potential impacts need to be examined and presented so that stakeholders see the multiple negative impacts of sanitation, and thus become convinced that concerted action is needed from several sectors. This sub-section seeks to briefl y elaborate some of the economic impacts associated with poor sanitation, and on the other side of the coin, some economic benefi ts associated with improved sanitation.
1. Population healthOne of the major arguments commonly used for improving sanitation is reduction in disease incidence, and the various health-related benefi ts. There are many diseases associated with poor sanitation and hygiene practices, among them diarrhea, dysentery, cholera, salmonellosis, shigellosis, typhoid fever, hepatitis A, trachoma, and some parasitic diseases (ascariasis, trichuriasis, hookworm, schistosomiasis). Disease and poverty are linked in a vicious circle, and hence disease reduction can lift populations out of poverty, or prevent them from falling into poverty [11]. Less disease means less treatment seeking costs as well as a gain in healthy time, leading to more time for productive or leisure activities, which have a direct welfare impact [12, 13]. When productive time gained leads to a net increase in economic activities, it can contribute to economic growth and poverty reduction. Disease reduction also leads to savings for society, such as health care and other state benefi ts for chronic suff erers.
2. Water resourcesThe 2003 United Nations Report “Water for people, Water for life” states that many rivers, lakes and groundwater resources are becoming increasingly polluted, and that human waste is one of the most frequent sources of pollution [14]. In Southeast Asian countries, a signifi cant proportion of human waste is fl ushed directly into water resources due to low coverage of sewage treatment for piped sewerage, or else human waste eventually fi nds its way into water resources through open defecation, leaking septic tanks or seepage from pit latrines. As a result, levels of suspended solids in rivers in Asia have risen by a factor of four over the last three decades and Asian rivers have a higher biological oxygen demand and bacterial content than the global average [14]. The results of polluted water on human activity are many: previously safe drinking water sources are rendered unusable, and water becomes less productive or usable for agricultural uses including fi sh production, for industrial as well as for domestic uses. According to the Asian Development Bank, the threat to fi sh production is especially important, given the economic importance, subsistence value as well as nutritional value of fi sh in the Southeast Asian region.
3. EnvironmentThe release of human waste into the environment has other eff ects besides water pollution, given the smells emanating from feces and urine, the widespread wish to avoid it, and the associated degradation of land where human waste accumulates. As well as human waste as a source of pollution, another major source of environmental pollution is that of solid waste. The use of open land as a public toilet and open garbage dump aff ects the quality of land, and renders it unattractive or even unusable for productive use. Even in East Asian countries where municipalities are responsible for collecting solid waste, solid waste collection is not commonly done, or inadequately done. Households and often the commercial sector respond by managing waste disposal themselves, and thus solid waste is commonly disposed of in the street or in other unoffi cial dumping grounds which are not managed properly.

INTRODUCTION
21Economic Impacts of Sanitation in Vietnam
A five-country study conducted in Cambodia, Indonesia, Lao PDR, the Philippines and Vietnam under the Economics of Sanitation Initiative (ESI)
This presents a threat to those disposing of waste as well as those living in the vicinity of the dumping area. Waste grounds are inhabited by stray dogs, rats or other animals, which are diseased and pose a threat to human health. Even where there is a private or public agency taking care of disposal, it is often not performed according to plan. In cities, waste carts stay on the streets for many days, with resulting smell and unsightliness for local inhabitants and tourists.
4. User preferencesLack of or poor sanitation facilities has implications for access time and convenience related to toilet-going, which have a number of direct as well as indirect welfare eff ects. Intangible welfare eff ects related to the comfort and privacy of having a private and clean place to meet toilet needs is an often underrated negative impact of unimproved sanitation. Also, closer sanitation facilities in the home or compound leads to time savings for those who previously regularly accessed public latrines or an isolated spot in the open fi eld or bush [15]. Time savings can be used for other productive or leisure activities, and thus have an economic value. Furthermore, the presence of improved sanitation facilities in educational establishments has shown to aff ect the rate of school attendance, especially for girls [16]. This eff ect may also be present in workplaces, where women’s ability to participate in the labor force is reduced due to poor conditions of toilets and no separate female toilet options.
5. Earnings from tourism and foreign direct investmentTourists are sensitive to their environment, and are less likely to choose destinations which are dirty or where the risk of disease is high. Countries may be losing tourist revenues due to the degraded environment and high infectious disease rates among the general population, as well as actual or perceived health risks to tourists. Hence any initiative to attract more tourists to a country will need to consider the part sanitation plays in this [17-19]. Likewise, foreign companies may also take into account the general environmental conditions and health of the local workforce in making location decisions.
6. Opportunities for use of outputs of sanitationWhere human waste is used as fertilizer and soil conditioner, the availability of nutrients from human excreta can lead to the replacement of chemical fertilizer, which saves costs. Furthermore, where fertilizer was not being used optimally before, the nutritional content and economic value of crops may increase. Also, there are long-term benefi ts of reducing the use of chemical and mineral fertilizers, especially taking into account the fact that some fossil resources are in increasingly short supply (e.g. phosphorous). Alternatively, families with livestock may instead invest in a biogas reactor, which provides biofuel for cooking, space heating and can even be used for lighting where other improved sources (electricity) are not available.
7. Stimulus to the local economy of sanitation input marketsGiven the needs of sanitation programs for human labor and materials, sanitation programs will have a number of economic eff ects at local level. Economic impacts – revenue, employment and profi t – and with eff ects up the supply chain, will be for small local entrepreneurs as well as larger, non-local companies. There is also a potential for improving livelihoods of poor people, largely through health improvement and employment generation [20].
8. Macroeconomic eff ect and overall economic growthEconomic growth results from the combination of many of the benefi ts listed above. The main eff ects are likely to be through lower disease rates, increased time availability, easier access to and reduced treatment of suitable water sources for domestic, agricultural and industrial use, and more tourism and foreign direct investment. The production and sale of sanitation options can also give a stimulus to the local economy through local employment; and re-use of human (and animal waste) can lead to cost savings and higher productivity at household level. Property prices also may rise due to better living standards brought by improved sanitation. However, the overall eff ects on the economy such as GDP growth are highly uncertain.

INTRODUCTION
22Economic Impacts of Sanitation in VietnamA five-country study conducted in Cambodia, Indonesia, Lao PDR, the Philippines and Vietnam under the Economics of Sanitation Initiative (ESI)
1.4 Study aims
The goal of the Economics of Sanitation Initiative (ESI) is to provide decision makers in Vietnam with evidence for making more informed decisions on sanitation. The target audience is primarily national level policy makers with infl uence the overall allocation of resources to sanitation, including central ministries (Ministry of Planning and Investment, Ministry of Finance), line ministries (MOC, MARD, MONRE, MOH) and external funding and technical partners (multilateral, bilateral and non-government agencies). The study disaggregates impacts by regional groupings for Vietnam, as well as providing a rural-urban breakdown. However, to inform local decisions, further studies are needed that disaggregate at provincial, city, and district levels, and below.
ESI is organized into two main overlapping studies:
1. ‘Sanitation Impact’ study.
2. ‘Sanitation Options’ study
The primary aim of the current ‘Sanitation Impact’ study is to generate evidence on the negative impacts of existing sanitation coverage levels and hygiene practices at national level for fi ve countries: Cambodia, Indonesia, Lao PDR, Philippines and Vietnam. The study uses information collected from government and donor statistics and reports, and from the scientifi c literature, to present a selected range of impacts associated with poor sanitation and hygiene. Results are presented at national level as well as sub-national level for the most recent year for which complete data are available, being 2005. Costs are distinguished according to whether they are fi nancial or economic, and are disaggregated by diff erent impacts and key population groups such as children and women. Separate reports and policy briefs have been produced for each country (www.wsp.org/pubs/index.asp).
Once the Sanitation Impact study is published and disseminated, and the results discussed among sector partners, they will need to know exactly how to act. Decision makers will need to know which sanitation improvements provide the best value for money, what the overall costs and benefi ts are, and who is willing or able to fi nance the improvements. Hence a second ‘Sanitation Options’ study is planned to measure and compare the diff erent costs and benefi ts of alternative sanitation options, and present them in diff erent forms to promote and enable rational decision making by a range of actors (e.g. national and local governments, donors, private companies, NGOs, communities, and households). This second study will select specifi c contexts where sanitation improvements are being made, and measure the specifi c costs and benefi ts in each context where the study is conducted of a range of relevant water and sanitation improvements.

INTRODUCTION
23Economic Impacts of Sanitation in Vietnam
A five-country study conducted in Cambodia, Indonesia, Lao PDR, the Philippines and Vietnam under the Economics of Sanitation Initiative (ESI)

WSP-EAP Research Report February 2008
2Study Methodology Overview
OVERVIEW OF STUDY METHODOLOGY
26Economic Impacts of Sanitation in VietnamA five-country study conducted in Cambodia, Indonesia, Lao PDR, the Philippines and Vietnam under the Economics of Sanitation Initiative (ESI)
The fi ve country Sanitation Impact studies all followed a standardized peer reviewed methodology [21]. Diff erences in the quality and level of detail of data in the fi ve countries required adaptations to the methodology to arrive at the same output data on economic impacts. However, the fi ndings of the fi ve country studies are still largely comparable [22].
This section describes:
1. The levels and units of analysis (2.1).
2. Which aspects of ‘sanitation’ are included in this study (2.2).
3. How impacts are classifi ed and which are included and excluded in the study (2.3).
4. An overview of how the diff erent economic impacts of unimproved sanitation are measured (2.4).
5. The methods used for predicting the economic benefi ts associated with improved sanitation (‘Impact mitigation’) (2.5).
Annex A describes the detailed methods for estimating the economic impacts of unimproved sanitation, and how methodological weaknesses and uncertainty in input variables are evaluated in sensitivity analysis.
2.1 Levels and units of analysis
The primary aim of this study is to describe and quantify sanitation impacts at national level, in order to inform policy makers about the overall negative impacts of poor sanitation and the potential benefi ts of implementing diff erent types of sanitation improvement. The ultimate usefulness of these overall economic impacts of poor sanitation is to serve as the basis for estimation of what impacts can be mitigated from improving sanitation. It is key to note in the interpretation of the results of this study that the gains from improving sanitation will be less than the losses from unimproved sanitation, given that (a) sanitation interventions do not have 100% eff ectiveness to reduce adverse health outcomes associated with poor sanitation, (b) poor sanitation is one of many causes of water and environmental pollution.
The aim of the study is to present impacts in disaggregated form, to aid interpretation and eventually policy recommendations. Geographical disaggregation of results is presented for some types of economic impact at the regional level. Rural/urban disaggregations are made for impacts where feasible. Furthermore, health impacts are disaggregated by age groups for selected diseases and descriptive gender analyses are conducted for selected impacts.
The study uses a modeling approach and draws almost exclusively on secondary sources of data. The study presents impacts in terms of both physical units, and converts these to monetary equivalents using conventional economic valuation techniques. Results on economic impact are presented for a single year – the latest available data were for 2005 for most variables, while for some variables 2006 was the latest year. Overall impacts are presented in terms of per capita impacts in United States Dollars. Results are also presented in international dollars2 (I$) to enable cross country comparisons of the relative impact of poor sanitation. For those impacts where quantifi cation in economic terms is not feasible using secondary data sources, the impacts are examined and reported descriptively.
Table 4 below shows the population size and provincial make-up of each region of Vietnam. It indicates that about 73% of the population in Vietnam is concentrated in rural areas. The urbanization rate of Vietnam is lower than that in other South East Asian countries, but still equates to approximately 1 million people offi cially recognized as moving to urban areas each year.
2 International dollars (I$) take into account the diff erent value of the United States Dollar in each country, by comparing the price of a pre-defi ned bundle of goods in each country to a reference country, the United States.

OVERVIEW OF STUDY METHODOLOGY
27Economic Impacts of Sanitation in Vietnam
A five-country study conducted in Cambodia, Indonesia, Lao PDR, the Philippines and Vietnam under the Economics of Sanitation Initiative (ESI)
Table 4. Population size and provincial make-up of regions in Vietnam (year 2005)
Region Population size Provinces contained
Urban Rural Total
Red River Delta 4,484 13,555 18,039 Hanoi; Vinh Phuc; Bac Ninh; Ha Tay; Hai Duong; Hai Phong; Hung Yen; Thai Binh; Ha Nam; Nam Dinh; Ninh Binh
North East 1,768 7,590 9,358 Ha Giang; Cao Bang; Bac Kan; Tuyen Quang; Lao Cai; Yen Bai; Thai Nguyen; Lang Son; Quang Ninh; Bac Giang; Phu Tho
North West 357 2,208 2,566 Dien Bien; Lai Chau; Son La; Hoa Binh
North Central Coast
1,455 9,165 10,620 Thanh Hoa; Nghe An; Ha Tinh; Quang Binh; Quang Tri; Thua Thien - Hue
South Central Coast
2,123 4,927 7,050 Da Nang; Quang Nam; Quang Ngai; Binh Dinh; Phu Yen; Khanh Hoa
Central Highlands
1,337 3,422 4,759 Kon Tum; Gia Lai; Dak Lak; Dak Nong; Lam Dong
South East 7,328 6,132 13,460 Ninh Thuan; Binh Thuan; Binh Phuoc; Tay Ninh; Binh Duong; Dong Nai; Ba Ria - Vung Tau; Ho Chi Minh city
Mekong River Delta
3,566 13,701 17,268 Long An; Tien Giang; Ben Tre; Tra Vinh; Vinh Long; Dong Thap; An Giang; Kien Giang; Can Tho; Hau Giang; Soc Trang; Bac Lieu; Ca Mau
Total 22,418 60,701 83,120 64 provinces
Source: [23]
2.2 Scope of sanitation
In conducting an impact study of poor sanitation, it should be clear what aspects of sanitation are being assessed given that ‘sanitation’ has relevance for many aspects of life. Furthermore, what actually constitutes improved sanitation will vary across countries and cultural contexts. In the international arena, the sanitation target adopted as part of the Millennium Development Goals focuses on the disposal of human waste, thus leading to a narrower understanding of the term ‘sanitation’. However, this present study recognizes that other aspects of sanitation are relevant to the impacts being measured in the present study, especially in Vietnam, where a broader defi nition is gaining ground. Hence, while the primary focus of this study is on human waste aspects, other important components of domestic sanitation – gray water and solid waste - have been included. For some impacts, the implications of animal waste and other agricultural waste and waste of small scale cottage industry are also evaluated. In addition, the health implications of poor hygiene as they relate to human waste are assessed. In Vietnam, ‘Sanitation’ is more broadly defi ned in the proposal to develop a “Unifi ed Sanitation Sector Strategy and Action Plan”, with preliminary support from all major stakeholders in the sector. Therefore, in addition to the standardized components for the fi ve-country study, some additional components of sanitation described in the strategy are included for the fi rst phase of this present study: (1) agricultural waste and (2) trade villages. Agricultural waste includes animal waste, crop waste, and fertilizer. Pesticides, an important part of agricultural wastes and a cause of major negative health impacts like cancer, will be analyzed in later stages.
While it is understood that sanitation in Vietnam is more often even more broadly defi ned than the components listed above, it was not possible to apply a comprehensive defi nition in this present study due to time and resource constraints. Hence, issues such as storm water and drainage, fl ood control measures, hospital waste, large-scale industrial waste, and broader environmental health such as food hygiene, air pollution and vector control, were not included. Table 5 summarizes the aspects of sanitation included and excluded from this study.
OVERVIEW OF STUDY METHODOLOGY
28Economic Impacts of Sanitation in VietnamA five-country study conducted in Cambodia, Indonesia, Lao PDR, the Philippines and Vietnam under the Economics of Sanitation Initiative (ESI)
Table 5. Aspects of sanitation included in the present ‘Sanitation Impact’ studyIncluded Excluded
• Practices related to human excreta:
• Quality, safety and proximity of latrine system
• Disposal or treatment of excreta and impact on the (inhabited) outdoor environment
• Hygiene practices
• Practices related to disposal or treatment of gray water
• Practices related to disposal or treatment of household solid waste
• Practices related to use or disposal of animal excreta
• Practices related to use or disposal of agricultural waste
• General fl ood control measures
• Large-scale industrial effl uents, toxic waste and medical waste
• Air pollution unrelated to human excreta
• Vector control
• Broader food safety
2.3 Impact identifi cation and classifi cation
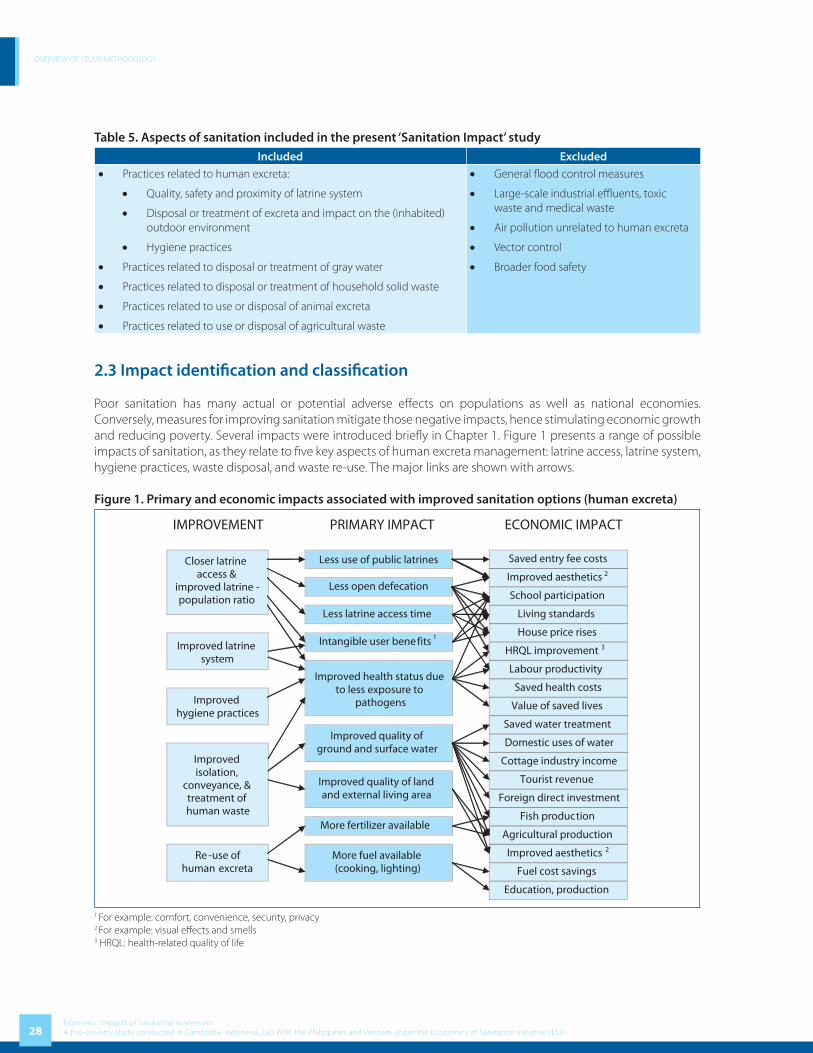
Poor sanitation has many actual or potential adverse eff ects on populations as well as national economies. Conversely, measures for improving sanitation mitigate those negative impacts, hence stimulating economic growth and reducing poverty. Several impacts were introduced briefl y in Chapter 1. Figure 1 presents a range of possible impacts of sanitation, as they relate to fi ve key aspects of human excreta management: latrine access, latrine system, hygiene practices, waste disposal, and waste re-use. The major links are shown with arrows.
Figure 1. Primary and economic impacts associated with improved sanitation options (human excreta)
1 For example: comfort, convenience, security, privacy2 For example: visual eff ects and smells3 HRQL: health-related quality of life
OVERVIEW OF STUDY METHODOLOGY
29Economic Impacts of Sanitation in Vietnam
A five-country study conducted in Cambodia, Indonesia, Lao PDR, the Philippines and Vietnam under the Economics of Sanitation Initiative (ESI)
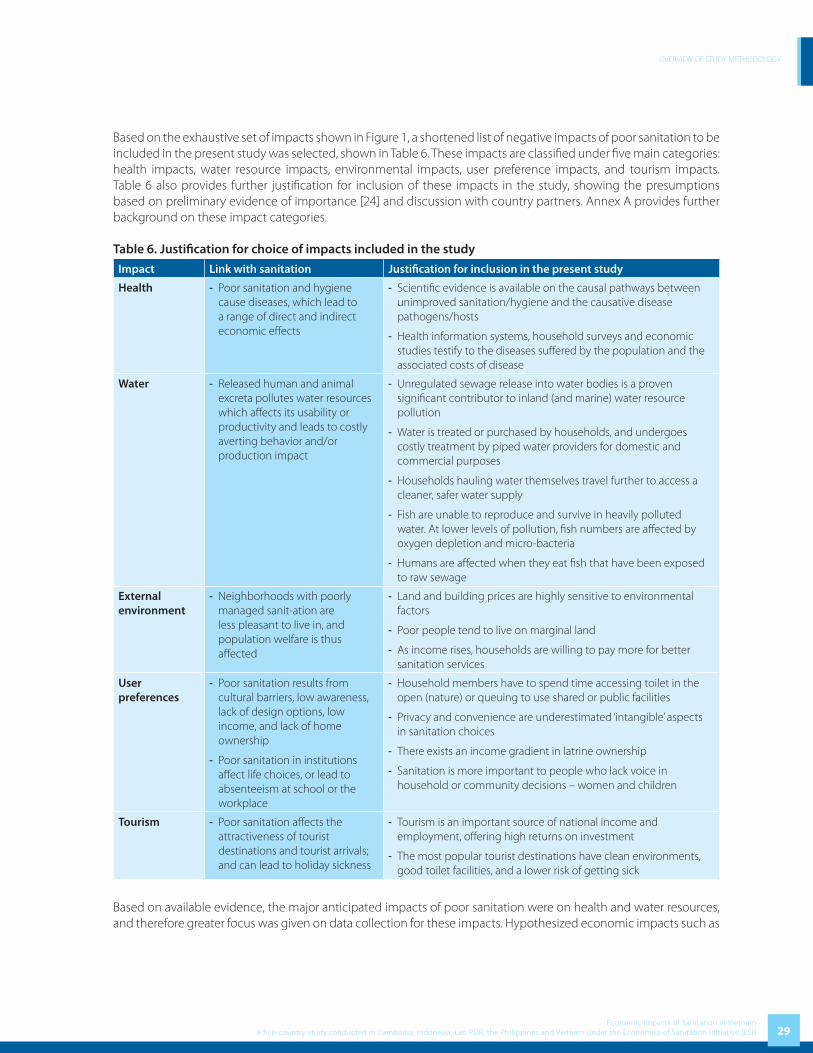
Based on the exhaustive set of impacts shown in Figure 1, a shortened list of negative impacts of poor sanitation to be included in the present study was selected, shown in Table 6. These impacts are classifi ed under fi ve main categories: health impacts, water resource impacts, environmental impacts, user preference impacts, and tourism impacts. Table 6 also provides further justifi cation for inclusion of these impacts in the study, showing the presumptions based on preliminary evidence of importance [24] and discussion with country partners. Annex A provides further background on these impact categories.
Table 6. Justifi cation for choice of impacts included in the study
Impact Link with sanitation Justifi cation for inclusion in the present study
Health - Poor sanitation and hygiene cause diseases, which lead to a range of direct and indirect economic eff ects
- Scientifi c evidence is available on the causal pathways between unimproved sanitation/hygiene and the causative disease pathogens/hosts
- Health information systems, household surveys and economic studies testify to the diseases suff ered by the population and the associated costs of disease
Water - Released human and animal excreta pollutes water resources which aff ects its usability or productivity and leads to costly averting behavior and/or production impact
- Unregulated sewage release into water bodies is a proven signifi cant contributor to inland (and marine) water resource pollution
- Water is treated or purchased by households, and undergoes costly treatment by piped water providers for domestic and commercial purposes
- Households hauling water themselves travel further to access a cleaner, safer water supply
- Fish are unable to reproduce and survive in heavily polluted water. At lower levels of pollution, fi sh numbers are aff ected by oxygen depletion and micro-bacteria
- Humans are aff ected when they eat fi sh that have been exposed to raw sewage
External environment
- Neighborhoods with poorly managed sanit-ation are less pleasant to live in, and population welfare is thus aff ected
- Land and building prices are highly sensitive to environmental factors
- Poor people tend to live on marginal land
- As income rises, households are willing to pay more for better sanitation services
User preferences
- Poor sanitation results from cultural barriers, low awareness, lack of design options, low income, and lack of home ownership
- Poor sanitation in institutions aff ect life choices, or lead to absenteeism at school or the workplace
- Household members have to spend time accessing toilet in the open (nature) or queuing to use shared or public facilities
- Privacy and convenience are underestimated ‘intangible’ aspects in sanitation choices
- There exists an income gradient in latrine ownership
- Sanitation is more important to people who lack voice in household or community decisions – women and children
Tourism - Poor sanitation aff ects the attractiveness of tourist destinations and tourist arrivals; and can lead to holiday sickness
- Tourism is an important source of national income and employment, off ering high returns on investment
- The most popular tourist destinations have clean environments, good toilet facilities, and a lower risk of getting sick
Based on available evidence, the major anticipated impacts of poor sanitation were on health and water resources, and therefore greater focus was given on data collection for these impacts. Hypothesized economic impacts such as

OVERVIEW OF STUDY METHODOLOGY
30Economic Impacts of Sanitation in VietnamA five-country study conducted in Cambodia, Indonesia, Lao PDR, the Philippines and Vietnam under the Economics of Sanitation Initiative (ESI)
saving entry fee which is related to public toilet users, house price rises due to improved sanitation, and foreign direct investment were not examined in this present study, either due to anticipated low importance or data limitations.
Table 7 details the sub-impacts examined under health, water resources, external environment, user preferences and tourism. The columns indicate the fi ve key components of sanitation assessed (refer to Table 6) for the diff erent impacts. Human excreta management is relevant for all impact areas. Poor hygiene mainly aff ects health. Gray water and animal excreta mainly aff ect water resources. Solid waste mainly aff ects mainly health, water resources, the external environment and tourism (not all of these are evaluated due to lack of data). Also, potential impacts of improved sanitation – the stimulation of local markets for sanitation inputs (labor, materials) and the reuse of waste for productive purposes – are also included in Table 7. In Vietnam, additionally storm water, agricultural waste and waste from small commercial enterprises were assessed for their impact on water resources only.
Table 7. Categorization of impacts measured in the present study 1, 2
Impact Sub-impacts Human waste
Hygiene practices
Gray water
Solid waste
Storm water
Animal and agricultural
waste
1. Health Health status √ √
Disease treatment cost √ √
Productive time lost √ √
Premature death √ √
2. Water resources
Water quality √ √ √ √
Drinking water √ √ √ √
Fish production √ √ √ √
Domestic uses of water √ √ √ √
3. External environment
Aesthetics √ √
Land use and quality √ √
4. User preferences
Intangible aspects √
Time for toilet access √
Life choices √
5. Tourism Tourist numbers √ √ √
Tourist sickness √ √1 A tick shows which impacts were measured in this study. The absence of tick does not indicate that no empirical relationship is anticipated; only that it was not evaluated in this study.2 The broader defi nition of sanitation in Vietnam was excluded here, but the additional components – storm water, agricultural waste and small-scale industry – have implications mainly for water resources.
2.4 Estimation methods for fi nancial and economic costs of poor sanitation
Policy makers are interested to understand the nature of the economic impacts being measured. For example, do the impacts have immediate implications for expenditure and incomes by households or governments, or are the eff ects non-pecuniary or longer-term in nature? The answer will naturally aff ect how the results are interpreted, and what level of support there will be for impact mitigation measures. Hence, while recognizing the diffi culties in distinguishing diff erent types of economic impact, this present study attempts to distinguish broadly between two diff erent types of impact – fi nancial and economic:
• Under fi nancial costs, those costs which are most likely to aff ect quantifi ed indicators of economic activity in the short term were included. Financial costs include changes in household and government spending as well as impacts likely to have real income losses for households (e.g. health-related time loss with impact on

OVERVIEW OF STUDY METHODOLOGY
31Economic Impacts of Sanitation in Vietnam
A five-country study conducted in Cambodia, Indonesia, Lao PDR, the Philippines and Vietnam under the Economics of Sanitation Initiative (ESI)
household income) or enterprises (e.g. fi shery loss). It should be noted that, while these ‘fi nancial’ costs aff ect economic activity indicators in the short term, these impacts are not expected to directly aff ect Gross Domestic Product, due to substitution eff ect, transfer payments, and so on.
• Under economic costs, other costs were added to the above fi nancial costs to approximate the overall population welfare impact of poor sanitation. These include the longer-term fi nancial impacts (e.g. less educated children, loss of working people due to premature death, loss of usable land, long-term tourist losses), as well as non-fi nancial implications (value of loss of life, time use of adults and children, intangible impacts).
Table 8 describes which cost components were included for fi nancial and economic defi nitions of cost for each sub-impact. It should be noted that costs were those attributed to poor sanitation using an attribution factor (variable by impact). Some costs were non-quantifi ed, as indicated in Table 12. The detailed methods of impact estimation are described in Annex A.
Table 8. Financial and economic costs due to poor sanitation measured in the present study
Impact category
Sub-impacts evaluated
Financial costs attributable to poor sanitation
Economic costs attributable to poor sanitation
1. Health Health care costs
Marginal health seeking costs, including patient transport, medication cost in public sector, and private sector tariff s
Full costs of health seeking, including full health care and patient transport costs
Productivity costs
Income loss due to lost adult working days due to sickness
Welfare loss due to adult and child sickness time
Premature mortality
Short-term household income loss due to adult death (1 year)
Discounted lifetime income losses for adult & child death
2. Water resources
Drinking water costs
Financial costs of water treatment and distribution
Financial + Time spent hauling water from safe water sources
Domestic water uses
Additional expenditure sourcing water from non-polluted sources
Financial + Time spent hauling water from less polluted sources
Fish losses Lost sales value due to reduction in fi sh catch
Lost sales value due to reduction in fi sh catch
3. External environment
Land quality - Economic value of land made unusable by poor sanitation
4. User preferences
Time loss - Welfare loss due to adult & child latrine travel/waiting time
Work/school absence
- Temporary absence of women from work and girls from school
5. Tourism Tourism costs - Revenue loss from low occupancy rates and failure to exploit long term potential tourist capacity
2.5 Impact mitigation
Having estimated the fi nancial and economic costs of poor sanitation, from a policy viewpoint it is important to know by how much these costs can be reduced by implementing improved sanitation options. Indeed, while this study initially presents total costs attributed to poor sanitation, it is unlikely that this total value can be averted by improving sanitation.

OVERVIEW OF STUDY METHODOLOGY
32Economic Impacts of Sanitation in VietnamA five-country study conducted in Cambodia, Indonesia, Lao PDR, the Philippines and Vietnam under the Economics of Sanitation Initiative (ESI)
While there are many types and confi gurations of sanitation improvement available, this present study aims to estimate potential benefi ts obtainable for a selected number of features of sanitation improvements. This study provides an initial tentative estimate of the likely gains possible from improving sanitation using diff erent options. It is the aim of the second study of ESI to estimate the costs and benefi ts of specifi c sanitation options, which are the most relevant policy options in each country context.
Table 9 shows the fi ve main features of sanitation improvement (in columns) assessed in this study, and the relevance of these for each sub-impact category (in rows). The features are described in the table footnotes. The impact mitigation estimation methods are described in Annex A6.
Table 9. Potential benefi ts of diff erent sanitation improvement options
Impacts A B C D E F
Latrine physical access1
Improved toilet
system2
Hygiene practices3
Waste treatment or
disposal4
Waste reuse5
Tourism
Health √ √ √
Water resources √
Environment
Aesthetics √ √
Land quality √ √
User preferences
Intangible eff ects √ √ √
Access time √
Life choices √ √ √
Tourism √ √
Sanitation markets
Sanitation inputs √ √ √ √ √ √
Sanitation outputs √1 Close and improved latrine for those using open defecation; improved population:toilet ratios through increased coverage of latrines (less queuing time)2 Improved position or type of toilet seat or pan; safe, private and secure structure: walls / door / roof; improved & safe collection system (tank vault, pit); improved ventilation; improved waste evacuation3 Availability of water for anal cleansing; safe disposal of materials used for anal cleansing; hand washing with soap; toilet cleaning4 Improved septic tank functioning and emptying; sealed top of pit latrine to withstand fl ooding; household connection (sewerage) with treatment; sewers with non-leaking pipes and a drainage system that can handle heavy rains; wetlands or wastewater ponds5 Urine separation, composting of feces, hygienization; use of human excreta products in commercial aquaculture, composting (fertilizer); biogas production (anaerobic digestion)
2.6 Uncertainty
This study has faced several challenges in attempting to both meet scientifi c criteria and present evidence that is useful for national as well as local policy makers. In order to provide timely evidence on sanitation impact, the present study is based on entirely secondary information collected from a variety of sources, and combined with assumptions where necessary input data were missing. Therefore, in order to fi ll the gaps in evidence, several innovative and not previously tested methodologies were developed for this present study. Quantitative information were combined using the methodology outlined above and in Annex A to estimate the impacts of poor sanitation and the potential benefi ts of improving sanitation. A number of impacts were excluded from quantitative estimation, which are described in Table 12. Three major types of uncertainty surround the quantitative fi gures presented in this study:
OVERVIEW OF STUDY METHODOLOGY
33Economic Impacts of Sanitation in Vietnam
A five-country study conducted in Cambodia, Indonesia, Lao PDR, the Philippines and Vietnam under the Economics of Sanitation Initiative (ESI)
(1) Uncertainty in the input values for the estimation of overall economic impacts, such as in the epidemiological variables (for health) and economic variables such as market prices and economic values. In fact, there is a severe lack of data available from routine information systems or research studies to feed into the quantitative model. Hence, in the absence of these data, relationships were modeled and assumptions made.
(2) Uncertainty in the attribution of the overall impact to poor sanitation. For example, when there are multiple sources of pollution, a portion of the overall economic impact estimated must be apportioned to the component of pollution being examined (e.g. domestic waste contribution to overall water pollution). A second example is the importance of poor sanitation in keeping away tourists from a country.
(3) Uncertainty in the actual size of impact mitigation achievable.
The variables with greatest importance for the quantitative results were evaluated further in one-way sensitivity analysis by varying a single input value over a reasonable range, to assess the impact on overall fi ndings. Alternative values used in the sensitivity analysis are provided in Annex A7.


WSP-EAP Research Report February 2008
3Economic Impact Results
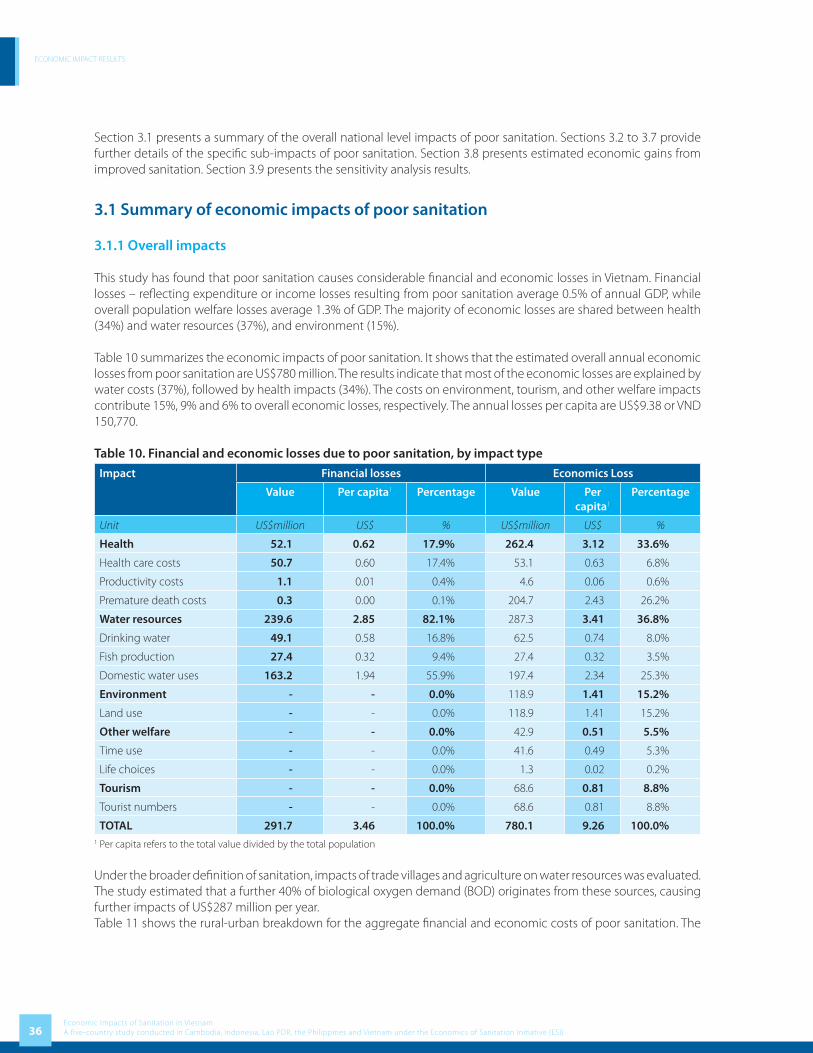
ECONOMIC IMPACT RESULTS
36Economic Impacts of Sanitation in VietnamA five-country study conducted in Cambodia, Indonesia, Lao PDR, the Philippines and Vietnam under the Economics of Sanitation Initiative (ESI)
Section 3.1 presents a summary of the overall national level impacts of poor sanitation. Sections 3.2 to 3.7 provide further details of the specifi c sub-impacts of poor sanitation. Section 3.8 presents estimated economic gains from improved sanitation. Section 3.9 presents the sensitivity analysis results.
3.1 Summary of economic impacts of poor sanitation
3.1.1 Overall impacts
This study has found that poor sanitation causes considerable fi nancial and economic losses in Vietnam. Financial losses – refl ecting expenditure or income losses resulting from poor sanitation average 0.5% of annual GDP, while overall population welfare losses average 1.3% of GDP. The majority of economic losses are shared between health (34%) and water resources (37%), and environment (15%).
Table 10 summarizes the economic impacts of poor sanitation. It shows that the estimated overall annual economic losses from poor sanitation are US$780 million. The results indicate that most of the economic losses are explained by water costs (37%), followed by health impacts (34%). The costs on environment, tourism, and other welfare impacts contribute 15%, 9% and 6% to overall economic losses, respectively. The annual losses per capita are US$9.38 or VND 150,770.
Table 10. Financial and economic losses due to poor sanitation, by impact type
Impact Financial losses Economics Loss
Value Per capita1 Percentage Value Per capita1
Percentage
Unit US$million US$ % US$million US$ %
Health 52.1 0.62 17.9% 262.4 3.12 33.6%
Health care costs 50.7 0.60 17.4% 53.1 0.63 6.8%
Productivity costs 1.1 0.01 0.4% 4.6 0.06 0.6%
Premature death costs 0.3 0.00 0.1% 204.7 2.43 26.2%
Water resources 239.6 2.85 82.1% 287.3 3.41 36.8%
Drinking water 49.1 0.58 16.8% 62.5 0.74 8.0%
Fish production 27.4 0.32 9.4% 27.4 0.32 3.5%
Domestic water uses 163.2 1.94 55.9% 197.4 2.34 25.3%
Environment - - 0.0% 118.9 1.41 15.2%
Land use - - 0.0% 118.9 1.41 15.2%
Other welfare - - 0.0% 42.9 0.51 5.5%
Time use - - 0.0% 41.6 0.49 5.3%
Life choices - - 0.0% 1.3 0.02 0.2%
Tourism - - 0.0% 68.6 0.81 8.8%
Tourist numbers - - 0.0% 68.6 0.81 8.8%
TOTAL 291.7 3.46 100.0% 780.1 9.26 100.0%1 Per capita refers to the total value divided by the total population
Under the broader defi nition of sanitation, impacts of trade villages and agriculture on water resources was evaluated. The study estimated that a further 40% of biological oxygen demand (BOD) originates from these sources, causing further impacts of US$287 million per year. Table 11 shows the rural-urban breakdown for the aggregate fi nancial and economic costs of poor sanitation. The

ECONOMIC IMPACT RESULTS
37Economic Impacts of Sanitation in Vietnam
A five-country study conducted in Cambodia, Indonesia, Lao PDR, the Philippines and Vietnam under the Economics of Sanitation Initiative (ESI)
majority of assigned impacts are in rural areas (49.1%), due largely to the signifi cantly greater rural populations. Considerable shares of total impact (27.5%) could not be assigned due to lack of input data disaggregated by rural-urban setting for land loss, fi sh losses and losses to tourism.
Table 11. Financial and economic losses due to poor sanitation, by area
Impact Financial losses Economic losses
Value Per capita1 Percentage Value Per capita1 Percentage
Unit US$ million US$ % US$ million US$ %
Health costs 52.1 0.62 17.9% 262.4 3.12 33.6%
Rural 41.0 0.49 14.0% 192.1 2.28 24.6%
Urban 11.1 0.13 3.8% 70.4 0.84 9.0%
Water costs 239.6 2.85 82.1% 287.3 3.41 36.8%
Rural 116.8 1.39 40.0% 155.3 1.84 19.9%
Urban 95.5 1.13 32.7% 104.6 1.24 13.4%
Non-assigned 27.4 0.32 9.4% 27.4 0.32 3.5%
Environment - - 0.0% 118.9 1.41 15.2%
Other welfare - - 0.0% 42.9 0.51 5.5%
Rural - - 0.0% 35.4 0.42 4.5%
Urban - - 0.0% 7.5 0.09 1.0%
Tourism - - 0.0% 68.6 0.81 8.8%
TOTAL 291.7 3.46 100.0% 780.1 9.26 100.0%
Rural 157.7 1.87 54.1% 382.9 4.55 49.1%
Urban 106.6 1.27 36.6% 182.4 2.17 23.4%
Non-assigned 27.4 0.32 9.4% 214.8 2.55 27.5%1 Per capita refers to the total value divided by the total population
3.1.2 Other non-quantifi ed impacts of poor sanitation
As well as quantifi ed, monetized impacts, there are a number of other key impacts which have not been valued in this present study, and which should be taken into account in interpreting the quantitative impacts discussed above. These non-monetized impacts include suff ering from disease, intangible aspects of environmental impacts (aesthetics) and user preference, time loss from seeking private place for urination (especially women), loss from marine fi sheries, the non-use value of clean water resources such as ‘existence’ and ‘bequest’ values, and the losses to wildlife from polluted water resources and an unclean environment. Other impacts with less clear linkages with poor sanitation include the use of water for irrigation purposes and hence agricultural productivity, the impact of poor sanitation on foreign direct investment, and impact of unimproved sanitation (and running water) in institutions which aff ect life decisions of the population, especially the decision of women to take employment and of girls to enroll in or complete school. Table 12 shows a longer listing of excluded impacts of poor sanitation from the quantitative analysis, and elaborates on the likely links to sanitation.

ECONOMIC IMPACT RESULTS
38Economic Impacts of Sanitation in VietnamA five-country study conducted in Cambodia, Indonesia, Lao PDR, the Philippines and Vietnam under the Economics of Sanitation Initiative (ESI)
Table 12. Description of importance of non-quantifi ed impacts of poor sanitationImpact Excluded items Link with poor sanitation
1. Health Quality of life Sanitation-related diseases cause pain and suff ering beyond the measurable economic eff ects. Disability-adjusted life-years (DALY), which attempt to capture quality of life loss, indicate that sanitation-related diseases contribute signifi cantly to national disease burden estimates.
Informal treatment seeking and home
treatment
This study has largely missed the large proportion of disease cases – especially for mild disease – which are treated at home or by consulting an informal care giver. These costs are largely unknown, but potentially signifi cant.
Other sanitation-related diseases
The following disease and health conditions have been excluded:1. Helminthes and skin diseases (Cambodia, Philippines)2. Malnutrition and the costs of supplemental feeding3. Reproductive tract infections for women bathing in dirty water4. Dehydration resulting from low water consumption from lack of access to
private latrines (especially women)5. Specifi c health problems suff ered by those working closely with waste
products (sanitation workers, dump scavengers)6. Health impacts due to fl ooding (physical, psychological)7. Education impacts of childhood malnutrition8. Food poisoning due to contaminated fi sh (e.g. E Coli)9. Animal and insect vectors of disease (e.g. rodents, mosquitoes)10. Animal health related to human sanitation11. Avian infl uenza
2. Water resources
Household water use Household time spent treating drinking water, including boiling, maintaining rain water collection systems, replacing fi lters, etc.
Fish production The study excluded the following1. Non-recorded marketed freshwater fi sh2. Farmed freshwater fi sh (Indonesia)3. Marine fi sh 4. Subsistence fi shing losses 5. Nutrient losses from less fi sh capture and eff ect on spending
Water management Economic losses associated with fl ooding from lack of drainage
Irrigation Polluted surface water may lead to extraction of scarce groundwater, or use of polluted water has implications for plant growth, animal health, and eventually human health
Other welfare impacts 1. ‘Non-use’ value of clean water resources such as ‘existence’ and ‘bequest’ values
2. Wildlife use of water resources
3. External environment
Aesthetics Welfare loss from population exposure to open sewers / defecation
Land value Economic value of land made unusable by poor sanitation (Cambodia, Philippines)
4. User preferences
Intangible impacts Welfare loss from lack of comfort, privacy, security, and convenience of unimproved sanitation; eff ects on status & prestige
Time loss Time for urination, especially women
Life decisions and absence from daily
activities
Poor sanitation in schools and the workplace aff ect daily attendance, especially of girls and women1. Loss of time from temporary absence of women from workplace (Cambodia
and Philippines) 2. Welfare loss from school absence (Cambodia and Philippines)3. Work decisions and early drop-out of girls from school (all countries)
5. Tourism Tourist sickness Expenditure by tourists becoming sick and welfare loss of sick tourists (Cambodia, Philippines).

ECONOMIC IMPACT RESULTS
39Economic Impacts of Sanitation in Vietnam
A five-country study conducted in Cambodia, Indonesia, Lao PDR, the Philippines and Vietnam under the Economics of Sanitation Initiative (ESI)
Impact Excluded items Link with poor sanitation
6. Other Foreign direct investment
1. Companies selecting investment locations may be infl uenced by, among other factors, by the sanitation situation in a country; tangible secondary evidence is however very limited.
2. Macroeconomic impact.
Together, the quantifi ed and non-quantifi ed fi nancial and economic losses will aff ect the overall economic situation in a country, including economic growth. The main eff ects are likely to be through sickness time and income loss associated with premature death, and household expenditure on health care and clean water, including water treatment. The production and sale of sanitation options can also give a stimulus to the local economy through local employment. The re-use of human (and animal) excreta can lead to cost savings and enhanced household and farmer production. Property prices also may rise due to better living standards brought by improved sanitation. However, given the weak empirical evidence on the direct economic eff ects of improved sanitation, this study did not move beyond a partial equilibrium analysis to examine redistributive eff ects. Therefore, the empirical link between poor sanitation and macro-economic indicators such as gross domestic product (GDP) is still not known.
3.2 Health impacts
Table 13 reports the estimated cases and deaths per year from selected diseases which are attributable to poor sanitation. It shows that diarrhea has the most number of cases at 7.05 million. Diarrhea is also the main cause of death from poor sanitation and hygiene, accounting for 4,576 deaths per year. Malnutrition-related diseases, in particular acute lower respiratory infection (ALRI), account for an estimated 1,475 deaths per year, followed by malaria with 631 deaths per year.
Less serious diseases (scabies, helminthes, hepatitis A) appear to account for only a small proportion of the total. There are no reported cases from offi cial statistics of mortality from these diseases. Collectively these account for only about 5.4 percent of the number of cases. However, their collective infl uence on the quality of life cannot be ignored. The prevalence of trachoma is still high as it is endemic in Vietnam. The proportion of cases actually seeking treatment for most diseases is only a small fraction of total cases, thus incurring lower health care costs than would be the case if all cases sought formal health care.
Table 13. Summary health impacts by diseaseDisease Total cases Total deaths
Seeking formal treatment1 All cases
Diarrheal diseases 933,559 7,050,762 4,576
Helminthes 27,000 203,918 -
Trachoma 864,747 864,747 -
Scabies 234,388 1,370,042 -
Hepatitis A 5,170 39,050 -
Malnutrition 960,400 960,400 -
ALRI (Pneumonia) 43,095 325,474 1,475
Measles - - 335
Malaria 2,382 17,990 631
Total 3,075,048 10,864,924 7,016 1 Includes the estimated cases reporting to government facility or formal private provider
Table 14 presents the total costs of health care related to treatment seeking for diseases related to sanitation and hygiene. Diarrhea diseases contribute the largest proportion of health costs. The second is malnutrition-related diseases.

ECONOMIC IMPACT RESULTS
40Economic Impacts of Sanitation in VietnamA five-country study conducted in Cambodia, Indonesia, Lao PDR, the Philippines and Vietnam under the Economics of Sanitation Initiative (ESI)
Tab
le 1
4. T
otal
hea
lth
car
e co
sts
by
dis
ease
Dis
ease
Fin
anci
al c
osts
Econ
omic
cos
ts
Pub
lic
clin
ics
Priv
ate
clin
ics
Self
-tr
eatm
ent
Tota
lPu
blic
cl
inic
sPr
ivat
e cl
inic
sSe
lf-
trea
tmen
tTr
ansp
orta
tion
an
d o
ther
cos
tsTo
tal
Dia
rrhe
a di
seas
es2,
259,
111
1,82
6,87
821
,868
,529
25,9
54,5
181,
871,
579
1,91
0,82
318
,297
,982
5,68
7,65
927
,768
,042
Hel
min
ths
45,3
2851
,929
174,
859
272,
116
18,8
7038
,430
94,9
3216
7,64
031
9,87
1
Trac
hom
a16
,919
,153
--
16,9
19,1
5316
,015
,147
--
1,03
6,78
117
,051
,928
Scab
ies
596,
515
726,
144
2,61
1,37
53,
934,
034
418,
750
635,
453
2,07
4,37
61,
126,
304
4,25
4,88
4
Hep
atiti
s A
23,9
0130
,494
377,
322
431,
718
22,7
3530
,212
357,
547
31,5
7744
2,07
1
ALR
I (Pn
eum
onia
)16
3,62
920
8,28
62,
532,
814
2,90
4,73
015
4,66
720
6,88
82,
377,
754
252,
642
2,99
1,95
0
Mal
aria
11,0
1814
,055
255,
729
280,
802
10,4
6413
,904
246,
405
14,7
7928
5,55
1
Tota
l20
,018
,656
2,85
7,78
627
,820
,629
50,6
97,0
7118
,512
,211
2,83
5,71
023
,448
,996
8,31
7,38
153
,114
,298
Tab
le 1
5. T
otal
pro
duc
tivi
ty c
osts
by
dis
ease
1
Dis
ease
Fin
anci
al c
osts
2Ec
onom
ic c
osts
, by
age
gro
up
Ag
e g
roup
15+
Tota
lA
ge
gro
up 0
-14
Ag
e g
roup
15+
Tota
lU
rban
Rura
lU
rban
Rura
lU
rban
Rura
l
Dia
rrhe
a di
seas
es25
8,69
070
0,44
395
9,13
369
8,46
41,
891,
196
336,
297
910,
576
3,83
6,53
2
Hel
min
ths
1,61
24,
365
5,97
74,
353
11,7
852,
096
5,67
423
,908
Tra
chom
a12
,025
49,2
7061
,295
68,5
4228
0,84
115
,632
64,0
5142
9,06
7
Sca
bies
497
1,34
61,
843
14,9
3540
,438
646
1,75
057
,769
Hep
atiti
s A
6,43
017
,410
23,8
4017
,361
47,0
088,
359
22,6
3395
,361
ALR
I15
,106
30,1
2045
,226
40,7
8681
,324
19,6
3839
,156
180,
904
Mal
aria
2,00
96,
220
8,23
03,
416
10,5
752,
612
8,08
724
,690
Tota
l 2
96,3
70
809
,175
1
,105
,544
8
47,8
56
2,3
63,1
67
385
,281
1
,051
,927
4
,648
,231
Not
es. D
ata
are
2004
US
dolla
rs. C
HC
: com
mun
ity h
ealth
car
e cl
inic
. 1 V
alue
of t
ime
is a
ppro
xim
ated
usi
ng th
e av
erag
e co
mpe
nsat
ion
of e
mpl
oyee
s2 F
inan
cial
cos
ts re
fl ect
the
estim
ated
lost
ear
ning
s of
wor
king
adu
lts
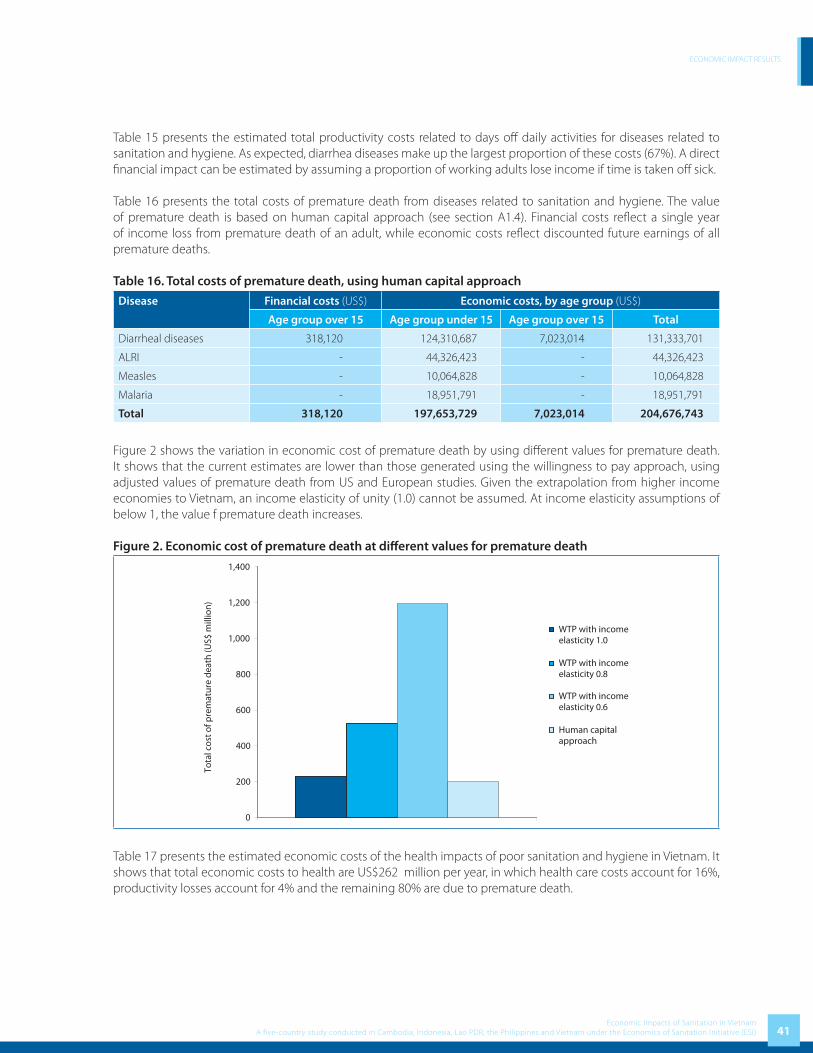
ECONOMIC IMPACT RESULTS
41Economic Impacts of Sanitation in Vietnam
A five-country study conducted in Cambodia, Indonesia, Lao PDR, the Philippines and Vietnam under the Economics of Sanitation Initiative (ESI)
Table 15 presents the estimated total productivity costs related to days off daily activities for diseases related to sanitation and hygiene. As expected, diarrhea diseases make up the largest proportion of these costs (67%). A direct fi nancial impact can be estimated by assuming a proportion of working adults lose income if time is taken off sick.
Table 16 presents the total costs of premature death from diseases related to sanitation and hygiene. The value of premature death is based on human capital approach (see section A1.4). Financial costs refl ect a single year of income loss from premature death of an adult, while economic costs refl ect discounted future earnings of all premature deaths.
Table 16. Total costs of premature death, using human capital approach
Disease Financial costs (US$) Economic costs, by age group (US$)
Age group over 15 Age group under 15 Age group over 15 Total
Diarrheal diseases 318,120 124,310,687 7,023,014 131,333,701
ALRI - 44,326,423 - 44,326,423
Measles - 10,064,828 - 10,064,828
Malaria - 18,951,791 - 18,951,791
Total 318,120 197,653,729 7,023,014 204,676,743
Figure 2 shows the variation in economic cost of premature death by using diff erent values for premature death. It shows that the current estimates are lower than those generated using the willingness to pay approach, using adjusted values of premature death from US and European studies. Given the extrapolation from higher income economies to Vietnam, an income elasticity of unity (1.0) cannot be assumed. At income elasticity assumptions of below 1, the value f premature death increases.
Figure 2. Economic cost of premature death at diff erent values for premature death
0
200
400
600
800
1,000
1,200
1,400
Tota
l cos
t of p
rem
atur
e de
ath
(US$
mill
ion)
WTP with incomeelasticity 1.0
WTP with incomeelasticity 0.8
WTP with incomeelasticity 0.6
Human capitalapproach
Table 17 presents the estimated economic costs of the health impacts of poor sanitation and hygiene in Vietnam. It shows that total economic costs to health are US$262 million per year, in which health care costs account for 16%, productivity losses account for 4% and the remaining 80% are due to premature death.
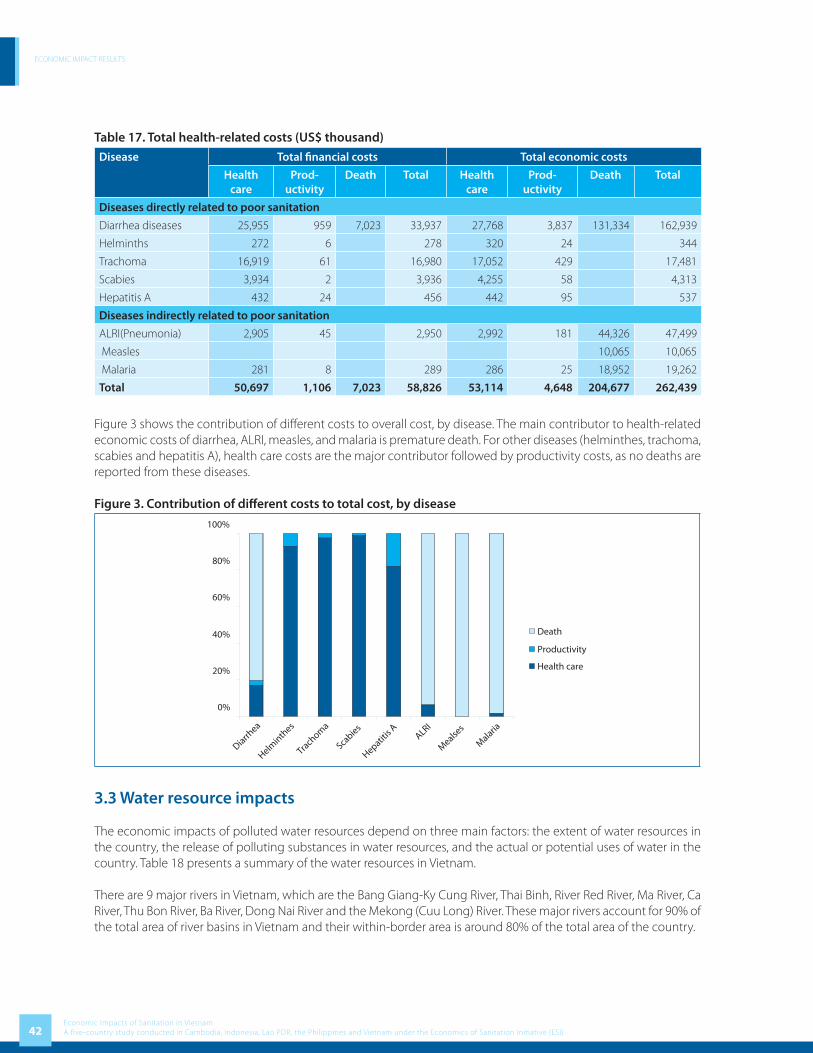
ECONOMIC IMPACT RESULTS
42Economic Impacts of Sanitation in VietnamA five-country study conducted in Cambodia, Indonesia, Lao PDR, the Philippines and Vietnam under the Economics of Sanitation Initiative (ESI)
Table 17. Total health-related costs (US$ thousand)
Disease Total fi nancial costs Total economic costs
Health care
Prod-uctivity
Death Total Health care
Prod-uctivity
Death Total
Diseases directly related to poor sanitation
Diarrhea diseases 25,955 959 7,023 33,937 27,768 3,837 131,334 162,939
Helminths 272 6 278 320 24 344
Trachoma 16,919 61 16,980 17,052 429 17,481
Scabies 3,934 2 3,936 4,255 58 4,313
Hepatitis A 432 24 456 442 95 537
Diseases indirectly related to poor sanitation
ALRI(Pneumonia) 2,905 45 2,950 2,992 181 44,326 47,499
Measles 10,065 10,065
Malaria 281 8 289 286 25 18,952 19,262
Total 50,697 1,106 7,023 58,826 53,114 4,648 204,677 262,439
Figure 3 shows the contribution of diff erent costs to overall cost, by disease. The main contributor to health-related economic costs of diarrhea, ALRI, measles, and malaria is premature death. For other diseases (helminthes, trachoma, scabies and hepatitis A), health care costs are the major contributor followed by productivity costs, as no deaths are reported from these diseases.
Figure 3. Contribution of diff erent costs to total cost, by disease
0%
20%
40%
60%
80%
100%
Diarrhea
Helminth
es
Trach
oma
Scabies
Hepatitis
AALRI
Mealse
s
Malaria
Death
Productivity
Health care
3.3 Water resource impacts
The economic impacts of polluted water resources depend on three main factors: the extent of water resources in the country, the release of polluting substances in water resources, and the actual or potential uses of water in the country. Table 18 presents a summary of the water resources in Vietnam.
There are 9 major rivers in Vietnam, which are the Bang Giang-Ky Cung River, Thai Binh, River Red River, Ma River, Ca River, Thu Bon River, Ba River, Dong Nai River and the Mekong (Cuu Long) River. These major rivers account for 90% of the total area of river basins in Vietnam and their within-border area is around 80% of the total area of the country.

ECONOMIC IMPACT RESULTS
43Economic Impacts of Sanitation in Vietnam
A five-country study conducted in Cambodia, Indonesia, Lao PDR, the Philippines and Vietnam under the Economics of Sanitation Initiative (ESI)
Table 18. Water resources in Vietnam
No.
River
Basin Area ( km2) Average Annual Water Discharge (billion m3)
Water availability (total)
External Internal Total External Internal TotalThousand
m3/km2
m3
/person1 Bang Giang
– Ky Cung1,980 11,280 13,260 1.7 7.3 9 798 9,070
2 Thai Binh 15,180 15,180 9.7 9.7 1,550 5,160
3 Red 82,300 72,700 155,000 45.2 81.3 126.5
4 Ma 10,800 17,600 28,400 5.6 14 19.6 1,110 5,500
5 Ca 9,470 17,730 27,200 4.4 17.8 22.2 1,250 8,290
6 Thu Bon 10,350 10,350 20.1 20.1 1,940 16,500
7 Ba 13,900 13,900 9.5 9.5 683 9,140
8 Dong Nai 6,700 37,400 44,100 3.5 32.8 36.3 877 2,980
9 Mekong 726,180 68,820 795,000 447 53 500 7,265 28,380
10 Others 66,030 66,030 94.5 94.5 1,430 8,900
Vietnam 837,430 330,990 1,167,000 507.4 340 847.4 2,560 10,240
Source: [25]
The main activities related to these water resources measured in this study include:• Withdrawal for treatment to provide drinking water • Other household uses • Commercial and subsistence fi shing
The overall picture of water quality in Vietnam is summarized below, extracted from the Vietnam Environment Monitor (2003). The eight economic regions are largely formed within the major river basins and they diff er from each other in water quality. Red River Delta, Mekong River Delta and North East of Mekong regions are characterized by dense river networks and abundant surface water resources. In these regions rapid population growth, urbanization and industrialization, intensive agriculture, and water transport have resulted in worsening water quality and declining groundwater levels.
Table 19. Water quality of 8 regions in Vietnam
RegionRivers Ground
waterCoastalWater
IssuesUpstream Downstream
Red River Delta++++ ++ +++ +++
Urban and Industrial pollution, Saline intrusion, Agrochemical pollution,
transport pollution risksNorth East
+++++ ++ ++++ +++ Urban pollution, Saline intrusion, Marine transport pollution risks
North West +++++ ++++ +++++ North Central Coast ++++ +++ ++++ ++++ Urban pollution, Saline intrusionSouth Central Coast +++++ ++ ++++ ++++ Urban pollution, Saline intrusionCentral Highlands +++++ ++++ +++++ - -South East
++++ + +++ ++Urban and Industrial pollution, Saline
intrusionMekong River Delta
++++ ++ +++ +++Saline intrusion, low pH in rivers
(Acid Soils) Agrochemical pollution, transport pollution risks
Note: A high score (+++++) means water is abundant or good quality, a low score (+) they are scarce or the water quality is unacceptable and out of range of standards. Assessment and scoring are based on the information of the Vietnam Environment Monitor 2003 [25]

ECONOMIC IMPACT RESULTS
44Economic Impacts of Sanitation in VietnamA five-country study conducted in Cambodia, Indonesia, Lao PDR, the Philippines and Vietnam under the Economics of Sanitation Initiative (ESI)
There is increasing evidence of pollution of Vietnam’s surface, ground and coastal waters. Although the quality of upstream river waters is generally good, downstream sections of major rivers reveal poor water quality and most of the lakes and canals in urban areas are fast becoming sewage sinks. Total pollution of water resources from household sources is presented by region in Table 20. Annually, approximately 2.3 million tons of feces, 46 million cubic meters of urine and 610 million cubic meters of gray water are released into inland water resources annually in Vietnam.
Table 20. Total release of polluting substances to inland water bodies
Region
Total release (volume) 2005
Feces Urine Gray water
(tons/year) (m3/year) (m3)
Red River Delta 493,831 9,876,613
North East 256,185 5,123,690
North West 70,235 1,404,695
North Central Coast 290,722 5,814,442
South Central Coast 192,988 3,859,766
Central Highlands 130,276 2,605,518
South East 368,472 7,369,437
Mekong River Delta 472,700 9,453,993
Total 2,275,408 45,508,154 609,876,054
Water pollution caused by cottage or trade villages is now a very critical problem in Vietnam. The impact on surface water results from the inadequate collection of waste water and solids from food processing, wooden fi ne arts production and paper recycling. For ground water, the impact so far measured or documented is insignifi cant; there is currently no evidence linking ground water quality with solid waste from trade villages [10].
Table 21 presents water quality indicators measured in a number of water bodies throughout Vietnam, collected regularly by the Vietnam Environmental Protection Agency. It indicates diff erent pollution levels by regions.
Table 21. Selected water quality measurements in Vietnam (in 2005)
Location Water body location Selected water quality indicators
pH DO BOD TSS Coliform
Vietnam’s Standard 5.5 - 9.0 <25mg/l <80mg/l <10,000 MPN/100ml
Red River Delta
Hong River
Lien Mac Culvert 8.42 4.78 8.85 85 500
Lien Mac Culvert 7.39 4.57 6.08 152 900
Van Phuc village (morning) 8.21 4.68 9.34 635 700
Moi brigde 7.7 0.1 96 58 480,000
Thanh Liet dam 7.55 0.3 91.2 97 410,000
West Lake (middle) 8.3 4.02 17.2 16 1,300
Cau River Nhu Nguyet brigde 6.89 4.25 6.13 61 1,200
Thai Binh River Pha Lai 6.73 4.06 3.94 216 600

ECONOMIC IMPACT RESULTS
45Economic Impacts of Sanitation in Vietnam
A five-country study conducted in Cambodia, Indonesia, Lao PDR, the Philippines and Vietnam under the Economics of Sanitation Initiative (ESI)
Location Water body location Selected water quality indicators
pH DO BOD TSS Coliform
Vietnam’s Standard 5.5 - 9.0 <25mg/l <80mg/l <10,000 MPN/100ml
Nhue River
Border of Tu Liem district and Ha Dong
7.58 3.26 26.1 47 11,000
Downstream Ha Dong bridge 7.58 3.16 37.5 41 11,000
Day River Mai Linh bridge 6.72 1.09 36.8 29 22,000
Cam River
National Road No. 5, km 9 7.82 4.95 10.4 94 1,100
Chua Ve port 7.71 4.17 16.9 98 2,700
North Central Coast
Huong River
Tuan confl uence 7.48 5.49 4 31.2 400,000
Tuan confl uence 7.83 5.48 4.6 32 220,000
Sinh confl uence 7.67 4.96 4 25.4 1,100,000
Sinh confl uence 7.8 5.56 1 21 250
South Central Coast
Vu Gia - Thu Bon River
Giao Thuy 8.14 5.1 2.9 16.7 25
Giao Thuy 7.69 5.25 0.5 16.5 21
Cua Dai 8.11 5.73 2.4 16.7 200
Cua Dai 7.38 5.09 1.3 12.5 500
Han River
Thuan Phuoc bridge 7.93 4.17 5.8 32 5,000
Thuan Phuoc bridge 7.74 4.32 3.8 14 3,100
South East
Thi Vai River From Long Tho commune, Nhon Trach District, Dong Nai province to My Xuan commune, Tan Thanh district, Ba Ria Vung Tau
9 - 10.5 < 0.5 880 na 30,000 – 690,000
Source: VEPA (2005)
Table 22 shows the costs attributed to poor sanitation of access to drinking water, including only the daily needs per capita for drinking water. Financial costs equal US$49 million while economic costs equal US$63 million per year. The results indicate that the majority of fi nancial and economic costs are incurred by households treating their water. An estimated 20% of economic costs refl ect the time required by households to access (haul) water from less polluted water sources.

ECONOMIC IMPACT RESULTS
46Economic Impacts of Sanitation in VietnamA five-country study conducted in Cambodia, Indonesia, Lao PDR, the Philippines and Vietnam under the Economics of Sanitation Initiative (ESI)
Table 22. Drinking water access costs (US$ thousand)Water source Financial Economic
Value % Value %
Purchased piped water 1,584 100.0% 1,584 100.0%
Rural 367 23.2% 367 23.2%
Urban 1,217 76.8% 1,217 76.8%
Purchased non-piped water 66 100.0% 66 100.0%
Rural 30 45.6% 30 45.6%
Urban 36 54.4% 36 54.4%
Household water treatment 47,430 100.0% 47,430 100.0%
Rural 36,956 77.9% 36,956 77.9%
Urban 10,474 22.1% 10,474 22.1%
Hauled water - 0.0% 13,463 100.0%
Rural - 0.0% 12,343 91.7%
Urban - 0.0% 1,119 8.3%
Total 49,080 100.0% 62,543 100.0%
Rural 37,353 76.1% 49,697 79.5%
Urban 11,727 23.9% 12,846 20.5%
Table 23 shows the costs attributed to poor sanitation of accessing water for domestic purposes from improved water sources. Financial costs equal US$163 million while economic costs equal US$197 million per year. Again, the results indicate that the majority of fi nancial and economic costs are incurred by households treating their water (although note that not all domestic uses require the water to be treated inside the household). An estimated 17% of economic costs refl ect the time required by households to access (haul) water from less polluted water sources.
Table 23. Domestic use water access costs (drinking water excluded) (US$ thousand)Water source Financial Economic
Value % Value %Purchased piped water 9,476 100.0% 9,476 100.0% Rural 780 8.2% 780 8.2% Urban 8,696 91.7% 8,696 91.7%Purchased non-piped water 320 100.0% 320 100.0% Rural 64 19.9% 64 19.9% Urban 256 80.0% 256 80.0%Household water treatment 153,377 100.0% 153,377 100.0% Rural 78,563 51.2% 78,563 51.2% Urban 74,814 48.7% 74,814 48.7%Hauled water - 0.0% 34,235 100.0% Rural - 0.0% 26,240 76.6% Urban - 0.0% 7,994 23.3%Total 163,172 100.0% 197,407 100.0% Rural 79,407 48.6% 105,647 53.5% Urban 83,765 51.3% 91,760 46.4%
Being a coastal country with territorial waters triple the area of the mainland and a variety of natural aquatic resources, Vietnam has great advantages in fi sheries development. In addition, Vietnam also has much potential fresh water resources including rivers, streams, lakes, reservoirs, ponds, channels, low-lying paddy-fi elds, etc., which provide favorable conditions for fi shing and aquaculture.

ECONOMIC IMPACT RESULTS
47Economic Impacts of Sanitation in Vietnam
A five-country study conducted in Cambodia, Indonesia, Lao PDR, the Philippines and Vietnam under the Economics of Sanitation Initiative (ESI)
According to statistics from GSO, the fi sheries sector is one of the key economic sectors in Vietnam, and it maintains higher growth rate than most other economic sectors. The share of fi sheries sector in the country’s GDP has grown consistently from 2.9% in 1995 to 3.4% in 2000, reaching more than 4% in 2005. Aquatic products are a major source of animal protein for people in Vietnam, providing about 40% of people’s dietary protein. In 2005, almost 4 million people are directly employed in the sector and nearly 10% of the population derives their main income from fi sheries. Total export value of fi sheries reached US$3.35 billion in 2006, accounting for over 10% of the total export earning. Fisheries remain the second most important export-oriented sector in Vietnam, after the crude oil industry.
Total fi sheries production in 2006 was 3.69 million tons, in which aquaculture accounts for 1.69 million tons and 2.00 million tons from marine and inland fi shing. Over time, aquaculture has gained importance, and is now more important than capture fi sheries in terms of quantity, quality and production stability.
Wastewater from domestic, agricultural and industrial activities has increasingly contributed to pollution loads in water bodies. The media reports many cases showing the heavy losses of aquaculture productivity due to water pollution (see Box 1).
Box 1. Loss of caged-fi sh farming in Ha Nam Province
Over the period 2000-2003, from November to March, polluted water from the Nhue River to the Day River killed many fi sh and shrimp. Water from Thanh Liet Dam (Hanoi) during November 22 to November 26, 2003 caused heavy losses in Chau Thuy, Chau Giang, Phu Ly Commune, Ha Nam Province. Nguyen Van Nam, investing 70 million dong to raise caged fi sh, lost 3 tons of breed fi sh and 10 tons of valuable fi sh; Bui Quoc Ky lost 400 million dong along 2.5 km of river used to raise caged fi sh.
Source: The Business Forum, 2003
Table 24 presents the estimated losses to inland fi sheries. On the assumption that “standard” poor sanitation contributes 40% to the pollution of rivers, the projected losses are US$27.4 million. Using the broader defi nition of sanitation, the attribution of losses is 80%, and the corresponding projected losses are US$54.7 million. See Annex Table D10 for more information on fi sh production by regions.
Table 24. Fish catch value (farm and inland catch) – actual and estimated loss, 2005
Water body name and type
Factor X 1
Actual Fish Volume Potential Fish Volume Loss Value (US$ thousand)Weight
(1000 ton)Value (US$
thousand)
Weight (1000 ton)
Value (US$
thousand)Narrow
defi nitionBroader
defi nition
Red River Delta 70% 206.8 62,038.3 295.4 88,626.2 10,635.1 21,270.3
North East 90% 48.8 14,627.9 54.2 16,253.2 650.1 1,300.3
North West 90% 7.9 2,380.0 8.8 2,644.4 105.8 211.6
North Central Coast 90% 48.1 14,421.2 53.4 16,023.5 640.9 1,281.9
South Central Coast 90% 65.8 19,736.1 73.1 21,929.0 877.2 1,754.3
Central Highlands 90% 15.4 4,610.1 17.1 5,122.3 204.9 409.8
South East 70% 53.3 15,999.6 76.2 22,856.6 2,742.8 5,485.6
Mekong River Delta 90% 863.0 258,895.1 958.9 287,661.2 11,506.4 23,012.9
Total 1,309.0 392,708.2 1,537.1 461,116.4 27,363.3 54,726.5
Source: Fish volume [23].1 See A.2.2.2 for defi nition of Factor X2 See Section 3.2 for information about broader scope of sanitation in Vietnam

ECONOMIC IMPACT RESULTS
48Economic Impacts of Sanitation in VietnamA five-country study conducted in Cambodia, Indonesia, Lao PDR, the Philippines and Vietnam under the Economics of Sanitation Initiative (ESI)
3.4 Environmental impacts
In many places in Vietnam, human waste is a major cause of reduced air quality and spoiled visual appearance due to inadequate treatment and/or disposal. Like other countries in South East Asia, open and controlled dump sites are the dominant form of waste disposal in Vietnam. Only 12 out of 64 cities and provincial capitals have engineered or sanitary landfi lls; most were constructed during the past 4 years. The World Bank estimates that in 2004 only 17 out of the 91 landfi lls in Vietnam, are sanitary landfi lls [7]. Discussion with Ministry of Construction suggests an even lower number of sanitary landfi lls.
Average collection rates of solid waste in Vietnam are improving, but remain low in many cities. Spending on solid waste is just 0.18% of country GNP. Fees for collection of solid waste account for 0.5% of household expenditure [7].
Box 2. Problems with the Dong Thanh Dump Site in Ho Chi Minh City
Dong Thanh is the second biggest dump site in Vietnam, located outside Ho Chi Minh City and with an area of about 40 hectares. Due to the fact that the site is not sealed, wastewater percolates into the soil, causing underground water pollution. Many nearby residents dig and drill wells and, in a 20 km circle, are now not able to use this water because of its poor quality and obnoxious odours.
Additionally, the leachate from the landfi ll (mainly from the wastewater storage lakes) into the surrounding areas has caused damages to the production and living activities of the local people. Fish, pigs, chickens and ducks have died and agricultural productivity is reduced. Wastewater from the waste storage lakes (about 200,000 m3 with average chemical oxygen demand concentration of about 40,000 – 50,000 mg/l) is not treated to environmental standards and penetrates into the underground water strata.
In June 2000, persistent heavy rain caused a 6 meter high dumpsite wall to collapse. A great deal of waste and wastewater spilt out causing environment pollution and harming production and people living nearby.
Source: Institute of Environment and Natural Resources, 2004
Table 25 below presents the value of land lost based on the estimation of buff er zones required around unsanitary landfi lls in Vietnam. It indicates that more than US$118 million in the value of land is lost annually.
Table 25. Economic loss due to degraded and unavailable land in the unsanitary dumps
Region Area of landfi lls (ha)
Area of sanitary landfi lls (ha)
Area of buff er zone (m2)
Total value loss (US$)
Whole country 780.8 158.3 170,073,731 118,871,905
Red River Delta 112.4 96.3 41,162,948 25,598,848
North East 31.6 24.0 27,007,490 16,795,703
North West 41.0 - 12,836,249 7,982,742
North Central Coast 93.8 - 2,202,400 14,474,310
South Central Coast 68.5 8.0 25,344,171 15,761,300
Central Highland 43.0 22.0 5,463,962 3,397,986
South East 282.0 8.0 25,555,333 15,892,620
Mekong River Delta 108.5 - 30,501,179 18,968,395
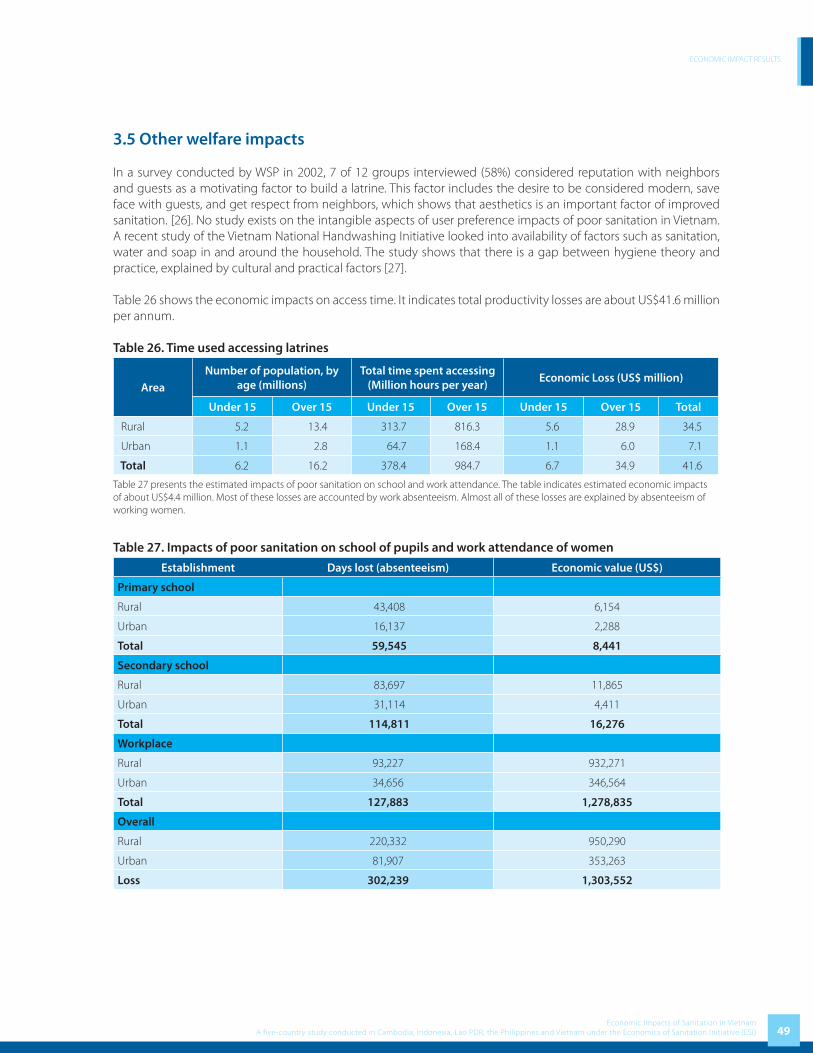
ECONOMIC IMPACT RESULTS
49Economic Impacts of Sanitation in Vietnam
A five-country study conducted in Cambodia, Indonesia, Lao PDR, the Philippines and Vietnam under the Economics of Sanitation Initiative (ESI)
3.5 Other welfare impacts
In a survey conducted by WSP in 2002, 7 of 12 groups interviewed (58%) considered reputation with neighbors and guests as a motivating factor to build a latrine. This factor includes the desire to be considered modern, save face with guests, and get respect from neighbors, which shows that aesthetics is an important factor of improved sanitation. [26]. No study exists on the intangible aspects of user preference impacts of poor sanitation in Vietnam. A recent study of the Vietnam National Handwashing Initiative looked into availability of factors such as sanitation, water and soap in and around the household. The study shows that there is a gap between hygiene theory and practice, explained by cultural and practical factors [27].
Table 26 shows the economic impacts on access time. It indicates total productivity losses are about US$41.6 million per annum.
Table 26. Time used accessing latrines
AreaNumber of population, by
age (millions)Total time spent accessing
(Million hours per year)Economic Loss (US$ million)
Under 15 Over 15 Under 15 Over 15 Under 15 Over 15 Total
Rural 5.2 13.4 313.7 816.3 5.6 28.9 34.5
Urban 1.1 2.8 64.7 168.4 1.1 6.0 7.1
Total 6.2 16.2 378.4 984.7 6.7 34.9 41.6
Table 27 presents the estimated impacts of poor sanitation on school and work attendance. The table indicates estimated economic impacts of about US$4.4 million. Most of these losses are accounted by work absenteeism. Almost all of these losses are explained by absenteeism of working women.
Table 27. Impacts of poor sanitation on school of pupils and work attendance of women
Establishment Days lost (absenteeism) Economic value (US$)
Primary school
Rural 43,408 6,154
Urban 16,137 2,288
Total 59,545 8,441
Secondary school
Rural 83,697 11,865
Urban 31,114 4,411
Total 114,811 16,276
Workplace
Rural 93,227 932,271
Urban 34,656 346,564
Total 127,883 1,278,835
Overall
Rural 220,332 950,290
Urban 81,907 353,263
Loss 302,239 1,303,552

ECONOMIC IMPACT RESULTS
50Economic Impacts of Sanitation in VietnamA five-country study conducted in Cambodia, Indonesia, Lao PDR, the Philippines and Vietnam under the Economics of Sanitation Initiative (ESI)
3.6 Tourism impacts
Tourism is an important growing industry in Vietnam with 3.6 million foreign visitors in 2006, generating about US$3.2 billion in national tourism-related revenues (equivalent to 5.2% of GDP). The industry boasted very rapid growth over the last 15 years, and the Government of Vietnam aim to maintain this trend. Table 28 provides key information on the tourism industry in Vietnam since 2002. It shows steady growth in the number of tourist as well as the industry’s share in the country’s GDP.
Table 28. Volume and importance of tourist sector in Vietnam
Variable 2002 2003 2004 2005 2006
Number of tourists 15,628 15,930 17,428 18,978 21,083
Domestic 13,000 13,500 14,500 15,500 17,500
International 2,628 2,430 2,928 3,478 3,583
Daily tourist expenditure
Domestic na 28.3 na 31.5 na
International na 74.6 76.5 76.4 na
Tourist income (US$ billion) 1.45 1.40 1.60 1.80 3.20
GDP Vietnam 35.06 39.49 45.66 52.96 60.97
As % GDP 4.14% 3.55% 3.50% 3.40% 5.25%
Tourism investment
Government expenditure na na na na 50.6
Private sector investment na na na na 1491.3
Number of hotels na na na 8556 na
Employment
Employment in tourism 2,006 2,149 2,313 2,575 3,364
As % jobs 5.08% 5.30% 5.56% 6.03% 7.67%
na – not available
Table 29 shows the economic losses associated with the gap between current occupancy rate of 70% compared with an assumed optimal occupancy rate of 80% and, over time, increased tourist infrastructure. It indicates that the economic impact of lower tourist numbers attributed to poor sanitation (5% of losses) is US$68.6 million.
Table 29. Economic impact of lower tourist numbers
Current tourism value
(US$ million)
Current occupancy rate
Potential value (US$ million)
Attribution to sanitation
Annual economic loss (US$ million)
Current Future
3,200.00 70% 3,200 4,571 5% 68.6
3.7 Economic gains from improved sanitation & hygiene
For policy decisions, it is not adequate to know only the economic losses associated with poor sanitation. Policy makers also need to know which of these costs can be mitigated with the implementation of diff erent sanitation options. A number of generic features of improved sanitation options were defi ned in Table 7 (section 2.5) to enable estimation of costs mitigated under diff erent options.
ECONOMIC IMPACT RESULTS
51Economic Impacts of Sanitation in Vietnam
A five-country study conducted in Cambodia, Indonesia, Lao PDR, the Philippines and Vietnam under the Economics of Sanitation Initiative (ESI)
This study has estimated the losses associated with poor sanitation using an attributable fraction based on representative indicators of impact, which varied by impact. For example, costs of polluted water were apportioned to poor sanitation based on the contribution of poor household sanitation to overall water pollution. Likewise, a proportion of sanitation-related diseases were attributed to exposure to human excreta, given that these diseases also have other causes.
Hence, based on this methodology, the reduction in pathogens, pollution and so on through improved sanitation, should lead to partial or full mitigation of the estimated losses shown in section 3.1. Table 30 therefore presents the estimated fi nancial and economic gains from diff erent features of sanitation and hygiene improvements.
• Better physical access of latrines and more private as opposed to shared latrines bring US$43 million economic gain, through saving time for those whose time access is not already minimized.
• The fi nancial and economic value of sanitation markets are US$329 million, including sanitation input (US$127 million) and output markets (US$202 million).
• Improved toilet system leads to US$17 million fi nancial gain and US$84 million economic gain through the reduction by 32% of the measured health impacts.
• Hygiene practices bring US$23 million fi nancial gain and US$231 million economic gain through reducing by 45% the measured health impacts.
• Treatment and/or safe disposal of human excreta leads to fi nancial savings of US$239 million and economic savings of US$287 million due to less polluted water resources; and US$69 million gain in revenue from tourism.

ECONOMIC IMPACT RESULTS
52Economic Impacts of Sanitation in VietnamA five-country study conducted in Cambodia, Indonesia, Lao PDR, the Philippines and Vietnam under the Economics of Sanitation Initiative (ESI)
Tab
le 3
0. P
red
icte
d fi
nan
cial
an
d e
con
omic
gai
ns
from
imp
rove
d s
anit
atio
n (U
S$)
Hyg
ien
e p
ract
ices
Latr
ine
phy
sica
l acc
ess
Imp
rove
d to
ilet s
yste
m1
Trea
tmen
t or d
isp
osal
Reus
e
Fin
anci
alEc
onom
icFi
nan
cial
Econ
omic
Fin
anci
alEc
onom
icFi
nan
cial
Econ
omic
Fin
anci
alEc
onom
ic
Hea
lth
23
,454
,331
228,
578,
177
--
16,6
78,6
3583
,980
,567
--
- -
Hea
lth c
are
22,8
13,6
8223
,901
,434
16,2
23,0
6316
,996
,575
Pro
duct
ivity
49
7,49
52,
091,
600
353,
774
1,48
7,43
4
Pre
mat
ure
deat
h 14
3,15
420
4,67
6,74
310
1,79
865
,496
,558
Wat
er
--
--
--
239,
615,
968
287,
313,
098
- -
Drin
king
wat
er
49,0
80,2
6362
,542
,853
Fis
h pr
oduc
tion
27,3
63,2
7527
,363
,275
Dom
estic
use
s 16
3,17
2,43
019
7,40
6,97
1
Env
iron
men
t -
--
--
--
--
-
Lan
d
Oth
er w
elfa
re2
--
-42
,905
,844
--
--
- -
Inta
ngib
le
--
Tim
e us
e -
41,6
02,2
92
Life
cho
ices
-
1,30
3,55
2
Tou
rism
3-
--
--
--
68,5
71,4
29-
-
Tou
rist n
umbe
rs
-68
,571
,429
San
itat
ion
m
arke
ts
--
--
--
--
127,
198,
499
329
,256
,078
Inpu
t mar
kets
12
7,19
8,49
9 1
27,1
98,4
99
Out
put m
arke
ts
202
,057
,578
2
02,0
57,5
78
TO
TAL
23,4
54,3
3123
0,66
9,77
7-
42,9
05,8
4416
,678
,635
83,9
80,5
6723
9,61
5,96
835
5,88
4,52
7 3
29,2
56,0
78
329
,256
,078
1 Im
prov
ed s
anita
tion
gene
rally
mea
ns im
prov
ed p
hysi
cal a
cces
s, im
prov
ed to
ilet s
yste
m a
nd tr
eatm
ent o
r dis
posa
l, al
l of w
hich
hav
e im
plic
atio
ns fo
r hea
lth s
tatu
s (s
ee a
nnex
tabl
e fo
r de
fi niti
ons)
. For
the
purp
oses
of r
epor
ting,
the
sani
tatio
n be
nefi t
s ar
e in
clud
ed o
nly
unde
r im
prov
ed to
ilet s
yste
m, t
o av
oid
conf
usio
n ov
er d
oubl
e-co
untin
g.2 U
ser p
refe
renc
es d
iscu
ssed
and
pre
sent
ed in
Cha
pter
4.5
are
all
pres
ente
d he
re u
nder
‘latr
ine
phys
ical
acc
ess’
but s
ome
of th
ese
are
also
like
ly d
ue to
impr
oved
toile
t sys
tem
.3 T
ouris
t num
bers
and
sic
knes
s w
ill a
lso
be re
late
d to
hyg
iene
pra
ctic
es a
nd to
ilet s
yste
ms
used
, but
the
bene
fi ts
are
repo
rted
her
e un
der t
reat
men
t and
dis
posa
l, as
this
has
the
maj
or
envi
ronm
enta
l im
plic
atio
ns.

ECONOMIC IMPACT RESULTS
53Economic Impacts of Sanitation in Vietnam
A five-country study conducted in Cambodia, Indonesia, Lao PDR, the Philippines and Vietnam under the Economics of Sanitation Initiative (ESI)
Table 31 shows more results for the potential market size for sanitation inputs, based on market prices and approximate breakdown between labor, materials, equipment and non-purchased items. The table indicates that the total input market is valued at US$127 million.
Table 31. Sanitation input market values
Variable Double Vault dehydration
toilet
Pour fl ush toilet
Flush toilet with septic
tank
Biogas system
Others Total
Rural
No, rural HH 2,973,131 2,821,722 5,175,451 82,587 2,711,606 13,764,497
No. with unimproved sanitation
1,486,566 1,410,861 2,587,725 41,293 1,355,803 6,882,248
% rural HH aff ording new sanitation facilities
30% 30% 30% 30% 30%
No rural HH aff ording new sanitation facilities
445,970 423,258 776,318 12,388 406,741 2,064,674
Urban
No urban HHs 1,152,951 1,094,236 2,006,988 32,026 1,051,534 5,337,735
No. HH with unimproved sanitation
119,907 113,801 208,727 3,331 109,360 555,124
% rural HH aff ording new sanitation facilities
30% 30% 30% 30% 30%
No. rural HH aff ording new sanitation facilities
35,972 34,140 62,618 999 32,808 166,537
Total value (US$) 29,971,502 31,289,693 62,607,137 3,330,167 na 127,198,499
Rural 27,734,433 28,954,235 57,934,150 3,081,604 na 117,704,422
Urban 2,237,069 2,335,458 4,672,988 248,563 na 9,494,077
Table 32 below shows the potential market size for sanitation outputs, based on market prices and approximate breakdown between labor, materials, equipment and non-purchased items. According to a project on biogas in Vietnam (MARD & SNV), just 1% of total rural households in Vietnam are potential users of biogas system. The market value is estimated at US$202 million, excluding the sales of biogas carbon credits through the Clean Development Mechanism. The values are assumed to be both fi nancial and economic gains, as use of human excreta for fertilizer (US$163.7 million) and biogas generation (US$38.31 million) are expected to lead to cost savings.
Table 32. Sanitation output market values
Variable Fertilizer Biogas Total Value
Financial Economic
Rural 163,702,267 38,306,331 202,008,598 202,008,598
Urban 39,692 9,288 48,980 48,980
Total 163,741,960 38,315,619 202,057,578 202,057,578

ECONOMIC IMPACT RESULTS
54Economic Impacts of Sanitation in VietnamA five-country study conducted in Cambodia, Indonesia, Lao PDR, the Philippines and Vietnam under the Economics of Sanitation Initiative (ESI)
As well as the narrow defi nition of sanitation assessed above, a broader defi nition includes the re-use of agricultural waste. With regards to raw waste materials, agricultural waste in Vietnam is estimated to total 30 million tons per year, consisting mainly of rice straw, husk, and bagasse. If this amount is taken into the energy value, it is equivalent to 20 million tons of dust coal and over 9 million tons of crude oil [10]. This can become a signifi cant source of energy once suitable policy and action plan are developed and implemented.
Materially, agricultural waste has not only high energy value but can also be used as inputs for agricultural production and other industries. Agricultural waste can be reused as fuel for households (rice husk, sugar cane leave, rice straw etc), mushroom shelve (rice straw), cattle feed (maize tree), and cage-stuffi ng materials (rice straw). In addition, if agricultural waste is well managed, it can be the material provision for paper, pressed wood (bagasse), and thermal power production.
3.8 Evaluation of Uncertainty
The present study is based on a range of secondary data and information, which were combined in a model to estimate the impacts of poor sanitation and the potential benefi ts of improving sanitation. Two major types of uncertainty surround the fi gures presented above. First, uncertainty exists in the values and assumptions used for the included variables. Second, there is uncertainty due to the fact that some impacts were not included (see section 3,1,2). The fi rst of these was evaluated quantitatively using sensitivity analysis.
One-way sensitivity analysis was applied separately on each impact by identifying some of the key areas of uncertainty, and using lower and upper ranges on selected data inputs. Figure 4 shows the resulting ranges on the fi ve main impacts, which are also added together to give overall lower and upper values.
Figure 4. Ranges in impacts from one-way sensitivity analysis on selected variables
0
200
400
600
800
1,000
1,200
Total Health Water Environment Other welfare Tourism
US$
mill
ions
�
Low value Base case High value

ECONOMIC IMPACT RESULTS
55Economic Impacts of Sanitation in Vietnam
A five-country study conducted in Cambodia, Indonesia, Lao PDR, the Philippines and Vietnam under the Economics of Sanitation Initiative (ESI)


WSP-EAP Research Report February 2008
4 Discussion, Conclusions and Recommendations

DISCUSSION, CONCLUSIONS, AND RECOMMENDATIONS
58Economic Impacts of Sanitation in VietnamA five-country study conducted in Cambodia, Indonesia, Lao PDR, the Philippines and Vietnam under the Economics of Sanitation Initiative (ESI)
4.1 Discussion
The primary objective of this study is to generate evidence on the negative eff ects of poor sanitation in Vietnam, focusing on the impacts on health, water resources, environment, tourism and other welfare indicators. The analysis was implemented using information from government and donor statistics and reports, and from the literature. The study found that poor sanitation leads to annual economic costs amounting to US$780 million or VND 12,544 billion. This is equivalent to 1.3% of GDP 2005. Accordingly, the losses per capita are US$9.38 or VND 151,000. All these estimated economic impacts could potentially be mitigated with improved sanitation options, except the health impacts which are reduced by up to around 50%, depending on the eff ectiveness of the sanitation or hygiene intervention.
The most important impact this present study can have is to raise awareness of all stakeholders for the purpose of improving the sanitation awareness in Vietnam. It is recommended this will lead to new policies, adoption of new approaches, collaboration with new partners, allocation of increased fi nancial resources, adoption of new fi nancial mechanisms and reinforcement of human resources for sanitation and hygiene. It is hoped that this study can contribute to advocating for the ’Unifi ed Sanitation Sector Strategy and Action Plan’ (U3SAP) in Vietnam.
In using secondary data to estimate impacts, and using new methodologies, the fi gures presented in this study are incomplete and imprecise. However, throughout the analysis, conservative assumptions were used, and combined with the fact that several impacts of poor sanitation were excluded due to lack of data, the quantifi ed results are an underestimate of the true impacts of poor sanitation.
Also, lack of available evidence made it diffi cult to conduct gender analyses on many of the variables evaluated. Although Vietnam holds a reputation throughout the region for relative gender equality and has been able to close gender gaps in key areas [28], gender inequalities are still a barrier to improvement in water and sanitation. Women currently bear the main burden of problems associated with poor water supply and sanitation, particularly in rural areas. Furthermore, women have the primary responsibility for waste management [29] and for health, hygiene and sanitation in the family. In addition, they have to take charge of the children’s hygiene education and to give instructions on personal hygiene and on the use of sanitation facilities. Lack of water and sanitation facilities inconveniences women more than men – for example, women’s needs for private and sanitary toilets are much higher than those of men.
The participation of women in the development of sanitation facilities is very crucial. Particular attention should be paid to gender issues and ensuring the representation of women as key decision makers in all aspects of water supply, sanitation and health management, especially in rural families. Women’s views and concerns must be expressed and integrated into the design of interventions, such as special privacy, security and ergonomically requirements for both women and children.
The Joint Government - Donor Sector Review in 2005 emphasized the serious challenges facing Vietnam for sustainable sanitation [30]. This has a serious impact on the health of people, and especially aff ects children, the elderly and the poor who are most vulnerable to water-borne diseases. It also has a serious impact on the environment: concerns over water quality are an issue throughout the country. Furthermore, water and sanitation are clearly referenced in the Comprehensive Poverty Reduction and Growth Strategy (CPRGS) which was approved by the Prime Minister in 2001. Sanitation is seen by the Government as a contributor to ensuring growth and poverty reduction. Therefore, it is necessary to consider further integrating sustainable sanitation into the Socio-Economic Plan of the country and sub-regions, ensuring that the voice of people without water or sanitation or those living in poverty can be listened to in the decision-making process. In this way socio-economic development will be aligned with sustainable growth.

DISCUSSION, CONCLUSIONS, AND RECOMMENDATIONS
59Economic Impacts of Sanitation in Vietnam
A five-country study conducted in Cambodia, Indonesia, Lao PDR, the Philippines and Vietnam under the Economics of Sanitation Initiative (ESI)
4.2 Recommendations
The central aim of this present study was to generate an evidence base to enable recommendations to be made for improved sanitation policies. This study has identifi ed a broad range of impacts of poor sanitation, and quantifi ed those impacts most amenable to secondary analysis. The following policy recommendations are based on eight major fi ndings of the study:
Major fi nding 1. Poor sanitation causes signifi cant losses to the national economyThis study has found that poor sanitation is signifi cant economic losses per year in the Vietnam (1.3% of annual GDP). In addition to these quantifi ed impacts, a range of other negative economic and social eff ects of poor sanitation result. By improving sanitation, a signifi cant proportion of these socio-economic impacts can be mitigated.
Recommendation 1. Decision makers from various sectors are advised to act nowSanitation ‘players’ are advised to act now, otherwise the negative impacts of poor sanitation will increase over time. The government and other stakeholders should jointly reassess the current and planned spending levels in the sanitation and related sectors, covering health, water resources, environment, rural and urban planning and development, fi sheries, and tourism. Increased political importance and budget allocations should be given to sanitation. Sanitation decision makers should use an evidence-based approach to design effi cient sanitation policies and implementation strategies, to increase value-for-money from public and private investments into sanitation.
Major fi nding 2. Poor sanitation has greater impact on the poor and vulnerableA greater share of the socio-economic burden of poor sanitation falls on the population currently without improved sanitation – health impacts, time access, water pollution, aesthetics, and land use – hence causing inequities in society. The population group unserved with improved sanitation tends to be the poorer and more vulnerable members of society. A disproportionate share of the burden falls on women, children and the elderly, especially health burden and user preferences such as intangible welfare impacts and life decisions.
Recommendation 2. Governments must defi ne and target the needs of priority groupsThe government should give priority to the populations with no latrine, recognizing that eff ective demand may be low in these groups due to low incomes and poor awareness of the benefi ts of investing in sanitation. As well as stimulating demand through public health and latrine advocacy messages, governments should target programs, subsidies and fi nancing mechanisms to the most disadvantaged population groups.
Major fi nding 3. Negative impacts result from several poor sanitary practicesEconomic impacts occur not just through the use of unimproved latrines (MDG target), but also through poor hygiene practices, poor isolation of wastewater from the environment and water sources, and poor broader environmental sanitation.
Recommendation 3. Players should broaden the scope of sanitation beyond latrines As is the aim of the current eff orts to unify sanitation in the U3SAP, sanitation investments should not be made just in latrine extension programs, but in improved sludge, water and solid waste management, and in hygiene programs to raise population awareness on personal and community hygiene issues, among others.
Major fi nding 4. Health-related economic impacts have a signifi cant toll on societyThis study has confi rmed that the major and most tangible impact of poor sanitation is an increased risk of infectious disease and premature death. This study has shown that economic losses of over US$262 million result from health care costs, health-related productivity costs and premature mortality costs.
Recommendation 4. Health aspects of sanitation programs deserve central focusThe government should focus on the easy health wins from improved sanitation, through targeting children and

DISCUSSION, CONCLUSIONS, AND RECOMMENDATIONS
60Economic Impacts of Sanitation in VietnamA five-country study conducted in Cambodia, Indonesia, Lao PDR, the Philippines and Vietnam under the Economics of Sanitation Initiative (ESI)
focusing on safe but simple latrine designs, improved excreta isolation measures, and improved hygiene practices. Given the key role of hygiene practices in health improvement, high-impact hygiene components should be integrated in the planning and implementation of sanitation programs. The Ministry of Health should (continue to) play a central role in the health aspects of sanitation programs.
Major fi nding 5. High water pollution levels are partially caused by poor sanitationThe majority of human excreta eventually fi nds its way to water bodies; so do gray water, animal excreta, solid waste and industrial wastewater (jncluding from trade villages). Together these cause signifi cant water pollution in study countries with associated high economic losses.
Recommendation 5. Sanitation solutions should focus on reducing water pollution The government should urgently implement sanitation standards that reduce the release of waste matter into water resources. Low technology, low cost and eff ective options should be explored as a matter of priority. Focus should not be just on excreta, but also solid waste, household, agricultural and industrial wastewater. The contamination of groundwater with microbiological pathogens should be averted through better planning, increased resource allocation, and awareness raising. Water quality monitoring should be conducted to assess the extent and nature of water pollution and to inform populations of which water sources are safe to use.
Major fi nding 6. Sanitation is linked with sustainable development in many waysSanitation has a major role in sustainable development, due to its links to other development goals (e.g. MDGs). Sanitation plays a key but unrecognized role in population welfare, economic growth and poverty reduction. Impacts not fully explored in this study – in particular tourism and the investment climate – are potentially major arguments for improving sanitation in countries, and suggest the adoption of a broader understanding of the term ‘sanitation’.
Recommendation 6. Several coordinated measures are needed to improve sanitation Sanitation cannot be only the responsibility of an individual sector/ministry, nor of a single level of government. The fact that sanitation touches on many sectors and line ministries should be used as a strength rather than hampering progress, and clear roles and responsibilities need to be defi ned. The development of a policy and regulatory framework for environmental and health protection is crucial and imperative in the context of rapid industrialization and high economic growth in Vietnam. While further progress is needed at the highest levels to ensure political support and resource allocations for sanitation, further emphasis is needed on the implementation levels where sanitation demand must be stimulated and aff ordable and attractive solutions for sanitation must be available.
Major fi nding 7. Variability is expected in the actual impacts of poor sanitationWhile the national per capita costs in rural and urban areas was not found to be dissimilar, there will exist signifi cant variation in the impacts of poor sanitation between diff erent geographic locations depending on sanitation coverage, demographics, environment, and practices related to health and water consumption.
Recommendation 7. Local as well as national studies should inform sanitation policyTo convince local decision makers such as city mayors or district offi cers to invest in sanitation, local studies would be more credible in convincing local decision makers that sanitation is a neglected issue. The methodology used in this study can be equally applied to local micro-level studies as well as the national level. Furthermore, local as well as national decision makers need to be informed of the effi ciency of diff erent measures to improve sanitation. Local level cost-benefi ts studies must now be performed to inform national decision makers how to invest effi ciently in sanitation.
Major fi nding 8. Existing data sources are weak for quantifying sanitation impactThis study has used a number of available data sources, but has been limited by lack of specifi c information on outcomes related to sanitation. With the exception of basic latrine coverage indicators, surveys tend not to include questions related to sanitation, such as expenditure, preferences, access time, health-related time loss, sanitation and hygiene practices, and gender. Questions related to broader sanitation ‘coverage’ (e.g. waste disposal, environmental

DISCUSSION, CONCLUSIONS, AND RECOMMENDATIONS
61Economic Impacts of Sanitation in Vietnam
A five-country study conducted in Cambodia, Indonesia, Lao PDR, the Philippines and Vietnam under the Economics of Sanitation Initiative (ESI)
quality) are largely left out. Routine government reporting systems such as health indicators and health service use, and water quality monitoring, only imperfectly capture the substantial impacts of poor sanitation. Water quality is known to be important for fi sh reproduction, growth and safety for human consumption, but little is known about the exact relationships, and the role poor sanitation plays.
Recommendation 8. Future survey and research work is key in monitoring progress Surveys and government reporting systems should be assessed for extension to include behavior and outcomes related to sanitation. Selected research studies could fi ll important gaps in knowledge about the economic and welfare eff ects of poor sanitation. Further research is required on the population benefi ts of improved sanitation, and what levels of benefi t diff erent types of sanitation option can deliver. A gender perspective is key in understanding the eff ectiveness of diff erent sanitation options. The link between poor sanitation and tourism and foreign direct investment losses is poorly understood, and merits further assessment. Studies on the value of time and the value of life will allow a better understanding of the importance of the identifi ed health impacts.


WSP-EAP Research Report February 2008
Annexes

ANNEXES
64Economic Impacts of Sanitation in VietnamA five-country study conducted in Cambodia, Indonesia, Lao PDR, the Philippines and Vietnam under the Economics of Sanitation Initiative (ESI)
Annex A: Study Methods
A1. Health impact
Health impacts are usually considered to be one of the most signifi cant impacts associated with poor sanitation and hygiene. Not only do diseases have direct implications for population welfare through health-related quality of life (HRQL), but diseases also have fi nancial and economic impacts, which include spending on health care, loss of income or production, and in the case of premature death, the value of loss of life.
A1.1 Selection of diseases
There are many diseases associated with exposure to human waste due to poor sanitation and poor hygiene practices. These are presented in detail in Annex Table D3. Diseases related to poor sanitation and hygiene can be viral, bacterial, parasitic, protozoal, helminthes, and fungal in nature, and have many pathways: fecal-oral, fecal-skin, urine-oral, and fecal-eye; the main one being fecal-oral [31, 32]. According to the F-diagram, pathogens can be passed from the feces through fl uids, fi elds, fl ies and fi ngers [33]. In addition, food can act as an intermediary for all of these four direct transmission pathways. The principle ‘poor practices’ which support heightened transmission of disease from human waste include an unsanitary toilet area, poor personal hygiene practices following toilet-going, open defecation in the fi elds or water sources, lack of protection or treatment of drinking water, poor food preparation practices, and lack of latrine and water-source protection in fl ood-prone areas.
Given the large number of diseases and health eff ects due to poor sanitation, this present study selected the key health impacts based on their epidemiological and economic importance. The availability of health data from national statistics, local research studies and international sources also played an important role in determining which diseases to include. Table A1 below presents data available from the national health information system in Vietnam on number of cases and deaths from key sanitation and hygiene-related diseases. Although these data are not representative of the total disease burden at national level due to underreporting, these data do provide an indication of which diseases are of most signifi cance nationally to aid selection of diseases to include in this present study.
In addition, exposure to household solid waste, agricultural and industrial wastes can also lead to disease and premature death, from contact with toxic materials or otherwise dangerous substances. With respect to solid waste, health impact on population in the vicinity of dumps and landfi lls is very high. They are exposed to high levels of dust, germs, noxious substances, rodents and insect bites, which can result in various diseases like fl u, dysentery, fever, tuberculosis, diarrhea, rash and scabies, asthma, pneumonia, parasites, articulation disorders and eye infections and bronchitis. The risk is even higher for waste pickers working in the dump sites. Waste pickers are exposed to bruises, factures, injuries and death. These diseases and occupational health problems are not considered in this present study due to time constraints and lack of routinely available data sources.
Table A1 shows that diarrhea diseases accounted for 964,420 cases in 2005. Diarrhea is also the major sources of death due to poor sanitation and hygiene. Malnutrition is considered as an important disease related to sanitation and hygiene since there are nearly 1,800,000 children under fi ve years of age suff ering from malnutrition. Although the prevalence of helminthes and scabies are not high compared to diarrhea and malnutrition, these diseases are included because of their obvious links to poor sanitation and hygiene.
Trachoma is endemic in Vietnam. For decades, trachoma control has been an important part of Vietnam’s health agenda. Globally, it is estimated that there are 3.8 million cases of blindness and 5.3 million cases of low vision in countries known or suspected to have trachoma, resulting in $2.9 billion in lost productivity to low vision or blinding trachoma [34]. In Vietnam, through trichiasis surgery, antibiotic treatment and health and hygiene education, the national prevalence of active disease decreased considerably from 17.5% in 1975 to 7% in 1995 [35]. According to

ANNEXES
65Economic Impacts of Sanitation in Vietnam
A five-country study conducted in Cambodia, Indonesia, Lao PDR, the Philippines and Vietnam under the Economics of Sanitation Initiative (ESI)
a recent study carried out in 2006 by the International Trachoma Institute (ITI) and their main partners, the MOH and the Institute for Ophthalmology, the trachoma prevalence rate is estimated at 1.76% in 2006 [35]. This study indicates that there are still districts where trachoma remains a public health problem. In the central and northern areas, trachoma prevalence is still high, especially in children.
Annex Table A1. Importance of sanitation and hygiene-related diseases, total cases and total deaths (2005)
Disease Morbidity Annual reported deaths Cases Cases per
population
Diarrheal diseases 964,420 0.0116028 42
Helminthes (worms)1 24,545 0.0002953 -
Trachoma2 982,667 0.0118223 -
Scabies3 206,137 0.0024800 -
Hepatitis A 7,834 0.0000942 -
Malnutrition (under fi ves) 1,818,939 0.0218833 -
Diseases associated with malnutrition (under fi ves) 596,046 0.0071709 2,494
ALRI (Pneumonia) 488,610 0.0058784 2,476
Measles 8,160 0.0000982 -
Malaria 99,276 0.0011944 18
Source: MOH Yearbook [36]1 Prevalence of helminthes is sourced from the survey on soil-transmitted nematodes by Institute of Malaria, Parasitology and Entomology/MOH in 2006-20072 Prevalence of trachoma is sourced from the survey on trachoma by Department of Preventive Medicine/MOH in 20073 Incidence of scabies is assumed to be 20% of reported skin disease as there is no information on scabies specifi cally
A1.2 Health care cost estimation
Health care costs result from diseases associated with sanitation and hygiene. In order to estimate health costs related to disease, it is necessary to compile information on disease rates for the selected diseases, treatment seeking rates, as well as health systems variables such as treatment practices and unit costs.
Health care costs can fall on both the patient and the public health system, depending on where the sick person seeks care from and the tariff rates in public facilities. Private health care is assumed to be fully fi nanced by the patient. Nationally, total expenditure on drugs accounted for 50% of total health expenditure and the annual drug expenditure per capita was US$8.6 in 2005 [37]. Costs are both fi nancial and economic in nature. Financial costs include the marginal cost to treat patients at public facilities (mainly drugs), patient transport costs, as well as the full costs of treatment in private clinics or self-treatment. Economic cost includes the fi nancial costs plus the short-term fi xed costs of public health facilities such as staff , capital items and overheads.

ANNEXES
66Economic Impacts of Sanitation in VietnamA five-country study conducted in Cambodia, Indonesia, Lao PDR, the Philippines and Vietnam under the Economics of Sanitation Initiative (ESI)
Annex Table A2. Treatment seeking behavior, by provider
Disease % seeking treatment from: Self-treatment No treatment
Public provider Private clinic
Nationwide1 12.18% 17.32% 65.94% 4.56%
Rural 12.33% 16.81% 66.09% 4.77%
Urban 11.64% 19.23% 65.36% 3.77%
Diarrhea diseases 964,420 1,370,737 5,219,670 360,960
Nationwide 3.00% 8.00% 66.00% 23.00%
Rural 5.00% 10.00% 50.00% 35.00%
Urban 2.00% 5.00% 70.00% 23.00%
Helminthes 24,545 34,886 132,845 9,187
Nationwide 2.00% 8.00% 70.00% 20.00%
Rural 5.00% 10.00% 60.00% 25.00%
Urban 1.00% 4.00% 80.00% 15.00%
Trachoma 982,667 - - -
Nationwide 100.00% 0.00% 0.00% 0.00%
Rural 90.00% 0.00% 0.00% 0.00%
Urban 10.00% 0.00% 0.00% 0.00%
Scabies 206,137 292,985 1,115,665 77,152
Nationwide 1.00% 4.00% 85.00% 10.00%
Rural 2.00% 5.00% 80.00% 13.00%
Urban 0.00% 2.00% 90.00% 8.00%
Hepatitis A 7,834 11,135 42,399 2,932
Nationwide 10.00% 18.00% 55.00% 17.00%
Rural 10.00% 15.00% 50.00% 25.00%
Urban 20.00% 20.00% 55.00% 5.00%
Malnutrition 1,818,939 - - -
Nationwide 100.00% 0.00% 0.00% 0.00%
Rural 70.00% 0.00% 0.00% 0.00%
Urban 30.00% 0.00% 0.00% 0.00%
ALRI (Pneumonia) 488,610 694,466 2,644,476 182,875
Measles 8,160 11,598 44,164 3,054
Malaria 99,276 141,102 537,305 37,157
Source: [8]
In order to estimate the costs of health care, it is necessary to know the total number of cases seeking health care from diff erent providers. Given that government statistics are often incomplete, public facility treatment seeking fi gures were adjusted to refl ect the total cases seeking care. Table A2 shows data extracted from the National Health Survey 2001 - 2002, which shows where households seek care from for diff erent diseases. Given the lack of alternative data on treatment seeking, these fi gures are assumed to apply to diseases associated with poor sanitation and hygiene.
Table A2 shows that self treatment is the most common behavior, accounted for 65.9% of total cases. The treatment seeking behavior slightly varies by urban and rural areas, and by disease. Nationally, public provider treats 12.18% of total cases, while private clinics treat 17.32% of those.

ANNEXES
67Economic Impacts of Sanitation in Vietnam
A five-country study conducted in Cambodia, Indonesia, Lao PDR, the Philippines and Vietnam under the Economics of Sanitation Initiative (ESI)
Based on the number of reported cases in the public health system, and the place of treatment seeking (Table A2), the total cases seeking treatment can therefore be estimated for each disease, for each health care provider, and for each region of the country. Table A3 below presents the fi gures after they have been adjusted for attribution to poor sanitation and hygiene: 90% for diarrhea [31], 48% for malnutrition [32], 100% for helminthes, 80% for scabies and trachoma, and 60% for Hepatitis A. For diseases related to malnutrition, attributable fractions of disease incidence for these diseases to malnutrition are 10.4% for ALRI/pneumonia and 4.1% for malaria, using regional estimates from Fishman et al for the Western Pacifi c Region [38].
Annex Table A3. Estimated numbers of cases seeking care from diff erent providers (attributed to poor sanitation and hygiene)
Disease Attribution to Sanitation
Public sector Private clinic
Self-treatment
No treatmentReported
cases% under-reported
Estimated attributed cases
Diarrhea diseases 88% 964,420 10% 933,559 1,206,249 4,593,310 317,645
Helminths 100% 24,545 10% 27,000 34,886 132,845 9,187
Trachoma 80% 982,667 10% 864,747 - - -
Scabies 80% 206,137 10% 181,401 234,388 892,532 61,722
Hepatitis A 60% 7,834 10% 5,170 6,681 25,440 1,759
Malnutrition 48% 1,818,939 10% 960,400 - - -
ALRI 5% 784,792 10% 43,095 55,682 212,034 14,663
Malaria 2% 110,032 10% 2,382 3,078 11,720 810
In order to calculate the costs associated with the cases seeking health care, it is necessary to know the treatment practices, the proportion of cases that are admitted for inpatient stay, and the costs associated with health care. Table A3 shows these variables for treatment seekers who receive their care on an outpatient basis from public providers, formal private providers, informal care, and self-treatment. For diarrheal disease, information from the study on health care costs of diarrhea disease in Khanh Hoa province is used [39]. For ALRI, the costs were based on the costing exercise to establish a case-based cost tariff covering 29 diseases, a recently published study by the Ministry of Health [37]. Annex Table A5 and D4 provide more information on those studies. For other diseases, data were generated through consultations and interviews with doctors from the Ministry of Health, its institutes and hospitals. The interviews were used to identify key variables, including duration of diseases for severe and non-severe cases, medical treatment requirements and related costs. The drug cost for helminthes is based on practices by MOH/WHO helminthes program in Vietnam for the last 5 years, which use a single dose of albendazole/mebendazole in accordance with WHO guidelines.
Annex Table A4 shows the unit costs for treatment seekers who receive their care on an outpatient basis from hospitals. It indicates that the fi nancial cost for diarrhea is US$3.76 and US$3.98 for urban and rural areas, respectively [39].

ANNEXES
68Economic Impacts of Sanitation in VietnamA five-country study conducted in Cambodia, Indonesia, Lao PDR, the Philippines and Vietnam under the Economics of Sanitation Initiative (ESI)
Annex Table A4. Health service use and unit costs associated with outpatient care
Provider and disease
Financial cost1 Economic Cost1
Urban Rural2 Urban Rural
Diagnostics and Medical
Cost
Diagnostics and Medical
Cost
Diagnostics and Medical
Cost
Cost per Visit
Non-medical
cost (Transport
etc.,)
Diagnostics and Medical
Cost
Cost per Visit
Non-medical
cost
Public provider
Diarrhea diseases 3.76 3.98 3.76 0.25 0.58 3.98 0.13 1.35
Helminthes 0.50 0.55 0.50 0.25 0.58 0.55 0.13 1.35
Trachoma 17.00 18.70 17.00 0.25 0.58 18.70 0.13 1.35
Scabies 2.00 2.20 2.00 0.25 0.58 2.20 0.13 1.35
Hepatitis A 10.00 11.00 10.00 0.25 0.58 11.00 0.13 1.35
Malnutrition 20.00 22.00 20.00 0.25 0.58 22.00 0.13 1.35
ALRI 8.00 8.80 8.00 0.25 0.58 8.80 0.13 1.35
Malaria 10.00 11.00 10.00 0.25 0.58 11.00 0.13 1.35
Private provider
Diarrhea diseases 3.05 3.49 3.05 0.66 0.47 3.49 0.53 1.13
Helminthes 0.50 0.55 0.50 0.66 0.47 0.55 0.53 1.13
Trachoma 17.00 18.70 17.00 0.66 0.47 18.70 0.53 1.13
Scabies 2.00 2.20 2.00 0.66 0.47 2.20 0.53 1.13
Hepatitis A 10.00 11.00 10.00 0.66 0.47 11.00 0.53 1.13
Malnutrition 20.00 22.00 20.00 0.66 0.47 22.00 0.53 1.13
ALRI 8.00 8.80 8.00 0.66 0.47 8.80 0.53 1.13
Malaria 10.00 11.00 10.00 0.66 0.47 11.00 0.53 1.13
Self-treatment3
Diarrheal diseases 2.68 3.00 2.68 0.20 0.40 3.00 0.17 0.92
Helminthes 0.50 0.55 0.50 0.20 0.40 0.55 0.17 0.92
Trachoma 17.00 18.70 17.00 0.20 0.40 18.70 0.17 0.92
Scabies 2.00 2.20 2.00 0.20 0.40 2.20 0.17 0.92
Hepatitis A 10.00 11.00 10.00 0.20 0.40 11.00 0.17 0.92
Malnutrition 20.00 22.00 20.00 0.20 0.40 22.00 0.17 0.92
ALRI 8.00 8.80 8.00 0.20 0.40 8.80 0.17 0.92
Malaria 15.00 16.50 15.00 0.20 0.40 16.50 0.17 0.92
(1) All cost fi gures refl ect the cost per outpatient consultation(2) Rural cost is estimated 10% higher than urban cost(3) Self treatment is considered to have the same value as treated in Polyclinic/CHCExchange rate US$1 = VND 16,080 to local currency, on 1 June 2007

ANNEXES
69Economic Impacts of Sanitation in Vietnam
A five-country study conducted in Cambodia, Indonesia, Lao PDR, the Philippines and Vietnam under the Economics of Sanitation Initiative (ESI)
Ann
ex T
able
A5
show
s th
e sa
me
varia
bles
for
inpa
tient
car
e fo
r pu
blic
and
form
al p
rivat
e pr
ovid
ers,
incl
udin
g th
e pr
opor
tion
of c
ases
adm
itted
, ave
rage
le
ngth
of s
tay
per p
atie
nt, a
nd a
ssoc
iate
d co
sts
per i
npat
ient
day
. The
sam
e so
urce
of i
nfor
mat
ion
is u
sed
for d
iarr
hea
dise
ase.
Fin
anci
al c
ost i
s U
S$3.
25 a
nd
US$
9.25
per
day
for u
rban
and
rura
l are
as, r
espe
ctiv
ely,
and
ave
rage
adm
issi
on d
ay p
er in
patie
nt is
US$
4.55
[39]
. The
stu
dy a
ssum
es th
at n
o in
patie
nt d
ay is
re
quire
d fo
r hel
min
thes
, tra
chom
a an
d sc
abie
s.
An
nex
Tab
le A
5. H
ealt
h s
ervi
ce u
se a
nd
un
it c
osts
ass
ocia
ted
wit
h in
pat
ient
car
ePr
ovid
er a
nd
d
isea
seN
umb
er
of c
ases
ad
mit
ted
Day
s ad
mis
sion
p
er p
atie
nt
Fin
anci
al c
ost
Econ
omic
Cos
t
Urb
anRu
ral
Urb
anRu
ral
Dia
gnos
tics
and
Med
ical
Co
st
Tran
spor
tatio
n Co
stD
iagn
ostic
s an
d M
edic
al
Cost
(1)
Tran
spor
tatio
n Co
st (1
)D
iagn
ostic
s an
d M
edic
al
Cost
Bed
Cost
pe
r Day
Non
-med
ical
Pa
tient
Cos
t (T
rans
port
atio
n et
c.,)
Dia
gnos
tics
and
Med
ical
Co
st
Bed
Cost
per
D
ay
Non
-med
ical
Pa
tient
Cos
t (T
rans
port
atio
n et
c.,)
Pub
lic p
rovi
der
Dia
rrhe
a di
seas
es66
,376
4.55
3.25
4.74
9.25
4.37
3.25
5.55
4.74
9.25
1.74
4.37
Hel
min
ths
--
-0
--
--
0-
--
Tra
chom
a-
--
0-
--
-0
--
-
Sca
bies
--
-0
--
--
0-
--
Hep
atiti
s A
368
5.00
10.0
02.
4711
.00
2.72
10.0
03.
652.
4711
.00
3.65
2.72
Mal
nutr
ition
--
-0
--
--
0-
--
ALR
I3,
064
7.00
8.00
2.47
8.80
2.72
8.00
3.65
2.47
8.80
3.65
2.72
Mal
aria
169
2.00
10.0
02.
4711
.00
2.72
10.0
03.
652.
4711
.00
3.65
2.72
Priv
ate
pro
vid
er
Dia
rrhe
a di
seas
es85
,764
4.55
1.37
1.00
1.51
1.10
1.37
3.65
1.00
1.51
3.65
1.10
Hel
min
ths
--
-0
--
--
0-
--
Tra
chom
a-
--
0-
--
-0
--
-
Sca
bies
--
-0
--
--
0-
--
Hep
atiti
s A
475
5.00
10.0
02.
4711
.00
2.72
10.0
03.
652.
4711
.00
3.65
2.72
Mal
nutr
ition
--
-0
--
--
0-
--
ALR
I3,
959
7.00
8.00
2.47
8.80
2.72
8.00
3.65
2.47
8.80
3.65
2.72
Mal
aria
219
2.00
10.0
02.
4711
.00
2.72
10.0
03.
652.
4711
.00
3.65
2.72
* D
ata
for h
elm
inth
es, t
rach
oma
and
scab
ies n
ot a
vaila
ble,
as u
sual
ly tr
eate
d on
out
patie
nt b
asis
Exch
ange
rate
US$
1 =
VN
D 1
6,08
0 to
loca
l cur
renc
y, on
1 Ju
ne 2
007

ANNEXES
70Economic Impacts of Sanitation in VietnamA five-country study conducted in Cambodia, Indonesia, Lao PDR, the Philippines and Vietnam under the Economics of Sanitation Initiative (ESI)
A1.3 Health-related productivity cost estimation
Disease takes people away from their occupations and daily activities, and regular sickness-related absences from school aff ects the ability of children to keep up with the curriculum and complete their education. Therefore, time lost from work, school or daily activities has a value.
Given that time off work is determined by the severity of the disease, as well as whether the case was treated or not, assumptions were made on the proportion of cases that are severe, and the treatment seeking behavior associated with these cases. Annex Table A6 shows the data inputs for diarrhea and other diseases.
Annex Table A6. Variables for estimating amount of time lost from disease
Disease % cases Days off daily activities
Severe Non-severeTreated Not treated
Severe Non-severe Severe Non-severe
Diarrhea diseases 4.2 95.8 5.0 2.0 2.0 1.0
Helminthes 12.2 87.8 2.0 - 1.0 -
Trachoma 12.2 87.8 3.0 - 1.0 -
Scabies 12.2 87.8 1.0 - 1.0 -
Hepatitis A 12.2 87.8 30.0 5.0 30.0 5.0
Malnutrition 12.2 87.8 7.0 5.0 7.0 5.0
ALRI 12.2 87.8 7.0 1.0 10.0 1.0
Malaria 12.2 87.8 10.0 5.0 5.0 3.0
Given that time off work has an opportunity cost, and in some instances a real fi nancial loss, time away from daily activities needs to be given a unit value to estimate overall fi nancial and economic losses associated with disease. A commonly applied economic valuation technique for time loss is the human capital approach (HCA), which values time loss according to what the sick person could be earning in productive employment. Even when the person would not be earning income (especially in the case of children), time for leisure and other activities can be assumed to have a value greater than zero [40-43]. A second common approach, which measures the sick person’s willingness to pay to avoid disease, can more accurately refl ect the welfare eff ects of disease, but due to lack of data on willingness to pay, this approach is not used in this study. Hence HCA is used as it is simple and it refl ects the time loss component of disease.
This study distinguishes between fi nancial and economic cost. For some adults, time spent away from productive activities will have a direct income-loss, while for others the salary may be paid for a maximum number of sick days per year. Given the self-employed and/or agricultural nature of agrarian societies of many Southeast Asian countries, loss of time from productive activities may not have immediate fi nancial loss, but may lead to income-losses in the future unless a family member or business partner replaces their lost labor. In order to be conservative, fi nancial cost is estimated as immediate income loss for those not paid their wage or earning an income from time lost due to sickness. For each country, this population is estimated based on the available published literature and interpretation of offi cial statistics according to local work patterns and conditions.
For those not directly losing income, there will also be a welfare loss, which may include longer-term income-earning potential as mentioned above. In estimation of economic cost, this study recognizes the value of time lost from daily activities, whether productive working time, school time, or leisure time. Given that value of time varies according to what the person is doing with their time, economic ‘welfare’ losses are valued at less than the fi nancial losses described above. Research studies have shown a whole range of results on the value of time. This present study takes the economic value of time as 30% of the unit value of time. Furthermore, this study distinguishes

ANNEXES
71Economic Impacts of Sanitation in Vietnam
A five-country study conducted in Cambodia, Indonesia, Lao PDR, the Philippines and Vietnam under the Economics of Sanitation Initiative (ESI)
between the value of adults and of children’s time, given that children do not generally have the same values as adults. On the other hand, children’s time is not worthless, given that children are or should be at school learning and hence time away from school would mean lost education and eventually lower income levels [44]. Also, for young children of non-school age, sickness will involve more time input from a carer, and hence incur a cost. In study countries, caring for a child is mostly the mother’s task and thus ill children are more likely to take the time of women than men, thus hindering women from working. Given the limited empirical work on the value of children’s time, and very few precedents in terms of valuing children’s time, a time value of 50% of adults time is given in this present study [45].
Annex Table A7. Variables for estimating amount of time lost from disease
Disease % cases Days off daily activities
Severe1 Non-severeTreated Not treated
Severe Non-severe Severe Non-severe
Diarrhea 29.5% 70.5% 5.0 2.0 2.0 1.0
Helminthes 29.5% 70.5% 2.0 - 1.0 -
Trachoma 29.5% 70.5% 3.0 - 1.0 -
Scabies 29.5% 70.5% 1.0 - 1.0 -
Hepatitis A 29.5% 70.5% 30.0 5.0 30.0 5.0
Malnutrition 29.5% 70.5% 7.0 5.0 7.0 5.0
ALRI 29.5% 70.5% 7.0 1.0 10.0 1.0
Malaria 29.5% 70.5% 10.0 5.0 5.0 3.0 (1) Severe mean cases which have to taken into public or private hospital(2) Non severe mean cases which can be treated themselves(3) For not treated, assume no-treatment number; distribute by percentage of severe and non-severe
Table A8 shows some alternative sources of economic value, comparing GDP per capita, and average income. The annual value was converted to hourly value by assuming 8 working hours per day, and 255 working days (public holiday and annual leave subtracted). Hourly average income wages were converted to annual fi gures by using the reverse calculation.
Annex Table A8. Comparison of alternative sources of time value
GDP per capita Average compensation of employees Minimum wage
Annual Hourly Annual Hourly Annual Hourly
723 0.12 411 0.07 261 0.04
Sources: GDP: World Bank; Average income: VHLSS (2004) adjusted to 2005 prices using infl ation rate of 6.6%.
Vietnam is still faced with a high prevalence of chronic malnutrition among the under fi ve population and high prevalence of low birth weight babies. Besides treatment costs, evidence for the relationship between malnutrition and future productivity comes from an extensive literature spanning several fi elds including nutrition, physiology, economics and history, reviewed recently by Martorell [46]. The Nobel Prize-winning economic historian Robert Fogel demonstrated that about 30% of the rise in productivity in Europe during the last 200 years was directly due to improvements in nutrition [47]. The underlying mechanism for the relationship between nutrition and productivity is not well-understood. A recent UNICEF-funded study (Profi les Vietnam) indicated that low birth weight causes a loss of US$41 million in 2010, most of which is explained by long-term productivity loss [48]. However, these long-term productivity costs are not taken into account in this present study.

ANNEXES
72Economic Impacts of Sanitation in VietnamA five-country study conducted in Cambodia, Indonesia, Lao PDR, the Philippines and Vietnam under the Economics of Sanitation Initiative (ESI)
A1.4 Premature death cost estimation
Cost of premature death is calculated by multiplying the number of deaths by the unit fi nancial and economic value of a death. Considerable mortality is from poor sanitation as shown in Annex Table A9 below. Diarrheal disease is estimated to cause at least 4,579 deaths annually, almost 90% of which are children under fi ve years of age.
Annex Table A9. Estimated number of annual deaths from poor sanitation & hygiene
Disase Age grouping Total Under 5 Over 5
Diarrheal diseases 4,136 440 4,576
ALRI 1,475 - 1,475
Measles 335 - 335
Malaria 631 - 631Source: “Environmental Health and Child Survival: Epidemiology, Economics, Experiences,” Environment and Development Series 3. World Bank: Washington DC, 2007
Premature death aff ects society in a number of ways, and has proven to be diffi cult to value with any degree of precision. As a result, economists have employed a range of methods for valuing premature loss of human life [49]. The most tangible economic impact of premature death is the loss of a member of the workforce, with implications for the economic outputs generated. Hence, this approach, what has been termed the ‘human capital approach’ (HCA) approximates the welfare loss by estimating the future discounted income stream from a productive person, from the time of death until the end of (what would have been) their productive life. However, this technique has been criticized for that fact that it values human life exclusively for its productive potential. Empirical evidence indeed proves that life has a value beyond the productive worth of a human, which both society as a whole and individuals are willing to pay for in order to safeguard [50, 51].
Various other methods are available to estimate this broader economic as well as inherent worth of human life: 1. Observations about actual market and individual behavior with respect to what they pay to reduce the risk of
death (e.g. safety measures) or what they are willing to accept for an increase in the risk of death (e.g. wage premium for risky jobs). This approach is known as ‘hedonic pricing’.
2. Stated preference from individuals exposed to risk, using interview technique. This approach is known as ‘contingent valuation’.
Both these approaches estimate directly the willingness to pay of individuals, or society, for the reduction in the risk of death, and hence are more closely associated with actual welfare loss compared with the human capital approach.
The problem in valuing life is that the alternative methods can give very diff erent estimates of the value of life, and applications of the same techniques to diff erent contexts can also reveal very diff erent implicit values in reducing the risk of death. For example, willingness to pay studies generally show greater value of life than the human capital approach. These variations and diff erences will aff ect the credibility of economic studies when used for policy decisions, and hence considerable care is needed in estimating and presenting the economic impact of premature loss of life to policy makers. Therefore, in order to sound more plausible to policy makers, this present study uses the more conservative human capital approach, described below. Sensitivity analysis explores the implications of alternative values for loss of human life using the willingness to pay approach.
Human capital approachThe human capital approach summates the future years of income at the average age of death. Given lack of data on exact age of death, three time points of death were used: 2 years of age for the 0-4 age group; 9 years of age for

ANNEXES
73Economic Impacts of Sanitation in Vietnam
A five-country study conducted in Cambodia, Indonesia, Lao PDR, the Philippines and Vietnam under the Economics of Sanitation Initiative (ESI)
the 5-14 age group; and 40 years of age in the 15+ age group. The discount rate applied was 3%, refl ecting the social rate of time preference approximated by the long-term real interest rate. Also, given that per capita income grows over time, a presumed long-term per capita income growth of 2% was applied to future incomes. Average income was taken from the average compensation of employees for each country. For the younger age groups who will not be in the work force for several years, the net present value of future earnings are further discounted to take this into account. Values are shown in Table A18.
Financial costs of premature death were approximated using the human capital approach by assuming a coping period following the loss of an adult member of the family. The coping period could be the period after which the income of the lost adult is expected to be replaced. A period of 1 year is conservatively used in this study. Therefore, the average compensation of employees for a single year is applied to the number of adult deaths to estimate the fi nancial impact of premature death. The average annual compensation of employees used is US$411 in Vietnam.
Willingness to pay approachGiven the lack of estimates of willingness to pay for avoiding death in developing countries, and Southeast Asian countries in particular, the benefi ts-transfer method was applied for the willingness to pay method. This essentially involves taking value-of-statistical-life (VOSL) values from a meta-analysis of studies in developed countries and transferring the value directly using an adjustment for diff erences in income. While this approach has many weaknesses [52], the absence of data from developing countries justifi es the use of this “benefi ts transfer” approach. The VOSL reported in North American and European studies is highly variable, ranging from around US$1 million to more than US$10 million [50, 53-57]. A meta-analysis of 40 VOSL studies reported by Bellavance et al in 2007 reported average VOSL of US$9.5 million and median VOSL of US$6.6 million [58], similar to the mean estimate of US$5.4 million found by Kochi et al (2006) [59]. Developing country studies are few. A study of the Indian labor market found VOSL varying from roughly US$0.14 to US$0.38 million [60]. Given the large number of studies from OECD countries, an adjusted benefi t transfer is justifi ed rather than transfer from a single study from a comparable developing country. In order to remain highly conservative, a VOSL estimate of US$2 million is used, which is signifi cantly lower than the values presented in the meta-analyses conducted by Bellavance (2007) [58] and Kochi (2006) [59], but consistent with the mid-range in the meta-analysis conducted by Mrozek and Taylor (2002) [61]. This value also refl ects the lower end of the US$2 million to US$4 million recommended by Abelson for public policy [50].
The VOSL of US$2 million is transferred to the study countries by adjusting downwards by the ratio of GDP per capita in each country to GDP per capita in the USA. The calculation is made at both offi cial exchange rates (more conservative) as well as at purchasing power diff erences (less conservative), and assuming an income elasticity of 1.0. Direct exchange from higher to lower income countries implies an income elasticity assumption of 1.0, which may not be true in practice. Therefore, the benefi ts transfer from OECD studies was also made at income elasticity of 0.8 and 0.6. Values are shown in Table A10.
Annex Table A10. Unit values for economic cost of a premature death, in US$2005
Human capital approach1 Willingness to pay using benefi ts transfer2
0-4 years 5-14 years 15+ years IE = 1.0, at OER IE = 0.8, at OER IE = 0.6, at OER
25,464 30,056 15,961 33,059 75,100 170,6031 Low and high values are produced by using income growth of 1% and 4% (base case 2%)2 Low and high values are produced by using US$1 and US$4 million as VOSL (base US$2 million). IE = income elasticity. OER = offi cial exchange rates.

ANNEXES
74Economic Impacts of Sanitation in VietnamA five-country study conducted in Cambodia, Indonesia, Lao PDR, the Philippines and Vietnam under the Economics of Sanitation Initiative (ESI)
A1.5 Disease burden from diseases indirectly related to poor sanitation3
The approach used here to estimate the indirect health eff ects of sanitation (via malnutrition) in children is as follows:
(a) the eff ect of diarrheal infections on children’s nutritional status is fi rst determined from a review of the research literature;
(b) counterfactual nutritional status is then estimated, i.e., the nutritional status that would have prevailed in the absence of diarrheal infections; and
(c) health eff ects of currently observed nutritional status and health eff ects of counterfactual nutritional status are estimated.
The diff erence in health eff ects of observed vs counterfactual nutritional status is then the indirect health eff ects of diarrheal infections, caused largely by poor sanitation.
Commonly used indicators of poor nutritional status are underweight, stunting and wasting.4 Underweight is measured as weight-for-age (WA) relative to an international reference population.5 Stunting is measured as height-for-age (HA), and wasting is measured as weight-for-height (WH). Underweight is an indicator of chronic or acute malnutrition or a combination of both. Stunting is an indicator of chronic malnutrition, and wasting an indicator of acute malnutrition. Underweight status is most commonly used in assessing the risk of mortality and morbidity from poor nutritional status.
A child is defi ned as mildly underweight if his or her weight is in the range of -1 to -2 standard deviations (SD) below the weight of the median child in the international reference population, moderately underweight if the weight is in the range of -2 to -3 SDs, and severely underweight if the child’s weight is below -3 SD from the weight of the median child in the reference population. The standard deviations are also called z-scores and noted as WAZ (weight-for-age z-score).
Repeated infections, and especially diarrheal infections, have been found to signifi cantly impair weight gains in young children. Studies documenting and quantifying this eff ect have been conducted in communities with a wide range of infection loads in a diverse group of countries such as Bangladesh ([62], [63], [64]), Gambia ([65], [66]), Guatemala ([67]), Guinea-Bissau ([68]), Indonesia ([69]), Mexico ([70]), Peru ([71]), Philippines ([72]), Sudan ([73]), and Tanzania ([74]).
These studies typically fi nd that diarrheal infections impair weight gains in the range of 20-50 percent. A mid-point – i.e., 35 percent of children’s weight defi cit - is here attributed to diarrheal infections to estimate the indirect disease burden from sanitation.6 So in the absence of weight retarding infections, the weight-for-age z-score (WAZ) of an underweight child would be approximately 40 percent greater than the observed z-score (i.e., observed WAZ*(1-0.4)).7 For instance, if a child has a WAZ=-3, then in the absence of weight retarding infections, the child’s WAZ would be -1.8.
Prevalence of underweight malnutrition rates are presented in Table A11. Current rates are for the most recent year available. None of the countries offi cially report the prevalence of mild underweight. Mild underweight is however
3 This section is largely based on Larsen B. Cost of environmental health risk in children under 5: Accounting for malnutrition in Ghana and Pakistan. Background report prepared for the World Bank study on malnutrition and environmental health. 2007. Washington DC: World Bank.
4 Micronutrient defi ciencies are not explicitly evaluated here, but are found in other studies to have a signifi cant cost (World Bank, 2006; Horton and Ross, 2003; Horton, 1999). Also, Alderman and Behrman (2006) fi nd a signifi cant cost associated with low birth weight, which in part is caused by low maternal pre-pregnancy body mass index (Fishman et al, 2004).
5 The international reference population is defi ned by the National Center for Health Statistics (NCHS standard), United States or by the World Health Organization’s international reference population.
6 A child’s weight defi cit is the diff erence in weight between the child’s observed weight and the weight of the median child in the international reference population.
7 This is calculated using the WHO Anthro 2005 software.
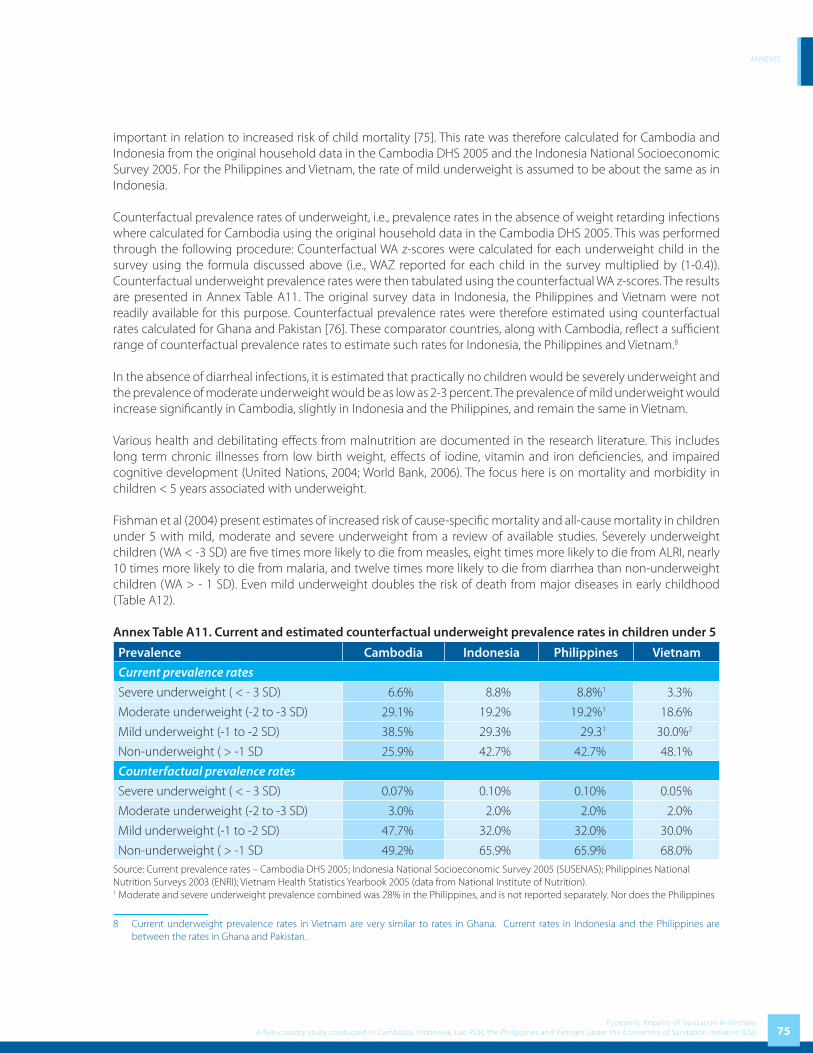
ANNEXES
75Economic Impacts of Sanitation in Vietnam
A five-country study conducted in Cambodia, Indonesia, Lao PDR, the Philippines and Vietnam under the Economics of Sanitation Initiative (ESI)
important in relation to increased risk of child mortality [75]. This rate was therefore calculated for Cambodia and Indonesia from the original household data in the Cambodia DHS 2005 and the Indonesia National Socioeconomic Survey 2005. For the Philippines and Vietnam, the rate of mild underweight is assumed to be about the same as in Indonesia.
Counterfactual prevalence rates of underweight, i.e., prevalence rates in the absence of weight retarding infections where calculated for Cambodia using the original household data in the Cambodia DHS 2005. This was performed through the following procedure: Counterfactual WA z-scores were calculated for each underweight child in the survey using the formula discussed above (i.e., WAZ reported for each child in the survey multiplied by (1-0.4)). Counterfactual underweight prevalence rates were then tabulated using the counterfactual WA z-scores. The results are presented in Annex Table A11. The original survey data in Indonesia, the Philippines and Vietnam were not readily available for this purpose. Counterfactual prevalence rates were therefore estimated using counterfactual rates calculated for Ghana and Pakistan [76]. These comparator countries, along with Cambodia, refl ect a suffi cient range of counterfactual prevalence rates to estimate such rates for Indonesia, the Philippines and Vietnam.8
In the absence of diarrheal infections, it is estimated that practically no children would be severely underweight and the prevalence of moderate underweight would be as low as 2-3 percent. The prevalence of mild underweight would increase signifi cantly in Cambodia, slightly in Indonesia and the Philippines, and remain the same in Vietnam. Various health and debilitating eff ects from malnutrition are documented in the research literature. This includes long term chronic illnesses from low birth weight, eff ects of iodine, vitamin and iron defi ciencies, and impaired cognitive development (United Nations, 2004; World Bank, 2006). The focus here is on mortality and morbidity in children < 5 years associated with underweight.
Fishman et al (2004) present estimates of increased risk of cause-specifi c mortality and all-cause mortality in children under 5 with mild, moderate and severe underweight from a review of available studies. Severely underweight children (WA < -3 SD) are fi ve times more likely to die from measles, eight times more likely to die from ALRI, nearly 10 times more likely to die from malaria, and twelve times more likely to die from diarrhea than non-underweight children (WA > - 1 SD). Even mild underweight doubles the risk of death from major diseases in early childhood (Table A12).
Annex Table A11. Current and estimated counterfactual underweight prevalence rates in children under 5
Prevalence Cambodia Indonesia Philippines Vietnam
Current prevalence rates
Severe underweight ( < - 3 SD) 6.6% 8.8% 8.8%1 3.3%
Moderate underweight (-2 to -3 SD) 29.1% 19.2% 19.2%1 18.6%
Mild underweight (-1 to -2 SD) 38.5% 29.3% 29.31 30.0%2
Non-underweight ( > -1 SD 25.9% 42.7% 42.7% 48.1%
Counterfactual prevalence rates
Severe underweight ( < - 3 SD) 0.07% 0.10% 0.10% 0.05%
Moderate underweight (-2 to -3 SD) 3.0% 2.0% 2.0% 2.0%
Mild underweight (-1 to -2 SD) 47.7% 32.0% 32.0% 30.0%
Non-underweight ( > -1 SD 49.2% 65.9% 65.9% 68.0%Source: Current prevalence rates – Cambodia DHS 2005; Indonesia National Socioeconomic Survey 2005 (SUSENAS); Philippines National Nutrition Surveys 2003 (ENRI); Vietnam Health Statistics Yearbook 2005 (data from National Institute of Nutrition). 1 Moderate and severe underweight prevalence combined was 28% in the Philippines, and is not reported separately. Nor does the Philippines
8 Current underweight prevalence rates in Vietnam are very similar to rates in Ghana. Current rates in Indonesia and the Philippines are between the rates in Ghana and Pakistan.

ANNEXES
76Economic Impacts of Sanitation in VietnamA five-country study conducted in Cambodia, Indonesia, Lao PDR, the Philippines and Vietnam under the Economics of Sanitation Initiative (ESI)
report the prevalence of mild underweight. The combined rate of moderate and severe underweight is the same as in Indonesia. Mild, moderate and severe underweight prevalence in the Philippines is therefore assumed to be the same as in Indonesia. 2 Vietnam does not report mild underweight prevalence rate. It is therefore assumed to be about the same as in Indonesia and the Philippines.
Annex Table A12. Relative risk of mortality from mild, moderate and severe underweight in children under 5
Weight-for-age (WA) < - 3 SD -2 to -3 SD -1 to -2 SD > - 1 SD
Pneumonia/ALRI 8.1 4.0 2.0 1.0
Diarrhea 12.5 5.4 2.3 1.0
Measles 5.2 3.0 1.7 1.0
Malaria 9.5 4.5 2.1 1.0
Other causes of mortality1 8.7 4.2 2.1 1.0
Source: Fishman et al (2004). 1 Not including mortality from perinatal conditions.
Child underweight also increases the risk of illness. Fishman et al (2004) present estimates of increased risk in children u5 with moderate and severe underweight (WA < - 2 SD). The largest increased risk of illness is for pneumonia/ALRI. No increased risk of measles is confi rmed (Annex Table A13).
Annex Table A13. Relative risk of illness from moderate and severe underweight in children under 5
Weight-for-age (WA) < - 2 SD > - 2 SD
Pneumonia/ALRI 1.86 1.0
Diarrhea 1.23 1.0
Measles 1.00 1.0
Malaria 1.31 1.0
Source: Fishman et al (2004).
These relative risk ratios can be applied to the underweight prevalence rates in Annex Table A11 to estimate attributable fractions (AF) of mortality and morbidity from diarrheal infections through their eff ect on nutritional status (underweight status).9 The following formula is used to calculate attributable fractions of ALRI, measles, malaria, and “other causes” of mortality, and attributable fractions of ALRI and malaria morbidity incidence from diarrheal infections:
∑
∑∑
=
==
−= n
iii
n
ii
Ci
n
iii
RRP
RRPRRPAF
1
11(1)
where RRi is relative risk of mortality or morbidity for each of the WA categories (i) in tables 2-3; P
i is the current
underweight prevalence rate in each of the WA categories (i); and Pic is the counterfactual underweight prevalence
rate in each of the WA categories (i). This formula is also called the “potential impact fraction” because it estimates the mortality or morbidity that would have been avoided for a diff erent counterfactual population distribution (e.g., less children being underweight) exposed to those levels of risk of mortality or morbidity. For a further discussion of this formula, see Ezzati et al. (2004).
For diarrheal mortality and morbidity the AF estimation procedure would be diff erent because there are two risk factors, i.e. the direct eff ect of sanitation and the indirect eff ect through malnutrition. As already 88 percent of
9 The attributable fraction of mortality or morbidity from malnutrition is the percent of deaths or percent of cases of illness (e.g., percent of ALRI deaths or cases of ALRI) caused by malnutrition.

ANNEXES
77Economic Impacts of Sanitation in Vietnam
A five-country study conducted in Cambodia, Indonesia, Lao PDR, the Philippines and Vietnam under the Economics of Sanitation Initiative (ESI)
diarrheal infections and mortality is estimated to originate from sanitation (or mediated from sanitation through water), the additional eff ect of malnutrition is minimal and is therefore ignored here.10
Annual cases of mortality and morbidity from diarrheal infections caused by poor sanitation, through the eff ect of infections on nutritional status, are estimated as follows:
∑=
=
=mj
jjj MAFcM
1
0(2)
where AFj is the AF in eq. (1) for each cause of mortality or type of disease “j”, M
j0 is the current total annual cases of
mortality or disease incidence in each of the categories in tables 2-3, and “c” is the fraction of diarrheal infections caused by poor sanitation (88%).
Most recent available estimates of annual cases of mortality (Mj0) in children under-5 are presented in Annex Table
A14. These estimates refl ect under 5 child mortality rates in 2005, and the structure of cause-specifi c deaths is estimated from WHO country estimates of cause-specifi c mortality in 2002 (WHO, 2004a).
Annex Table A14. Estimated cause-specifi c annual deaths in children under 5 in 2005
Disease Cambodia Indonesia Philippines Vietnam
Diarrheal disease 7,500 25,500 9,800 4,600
ALRI 5,400 22,400 11,600 4,700
Measles 1,600 12,400 5,500 1,400
Malaria 2,900 4,900 400 1,900
PEM 900 2,800 1,000 20
LBW 4,000 36,200 7,800 5,400
Other perinatal conditions 6,800 22,400 14,900 3,800
Other causes 5,600 30,400 16,200 6,300
Total 34,700 157,000 67,200 28,120
Source: Adjusted to 2005 from WHO country estimates of mortality by cause in 2002 (WHO, 2004a), by applying child mortality rate in 2005.
Annex Table A15. Demographic and mortality data in 2005
Variable Cambodia Indonesia Philippines Vietnam
Mortality rate, under-5 (per 1,000)* 83 36 33 19
Population, total** 13,806,974 218,868,791 84,221,578 83,119,900
Number of children u5** 1,694,990 19,297,054 10,650,271 7,356,100
Estimated annual births*** 369,682 4,003,538 2,202,745 1,499,715
Source: * World Bank (2007) and Cambodia DHS 2005 for child mortality; ** Country population statistics. *** Estimated from the number of children u5.
Complete records or statistics on annual cases of ALRI and malaria in children u5 are not available in any country. This is due to many reasons, including incomplete reporting and record systems, cases never treated at health care providers, and incomplete or potentially incorrect case identifi cation and diagnostic. Annual cases therefore need to be estimated. WHO provides regional estimates of ALRI for the year 2002, the most recently available (WHO, 2004b). These data suggest that the incidence of ALRI in children u5 in Asia is on the order of 0.35 to 0.7 cases per child per year. An annual incidence of 0.35 cases of ALRI is therefore applied to Indonesia, the Philippines and Vietnam.
10 See Larsen (2007) for methodology and estimation of environmental health eff ects from multiple environmental risk factors in Ghana and Pakistan.
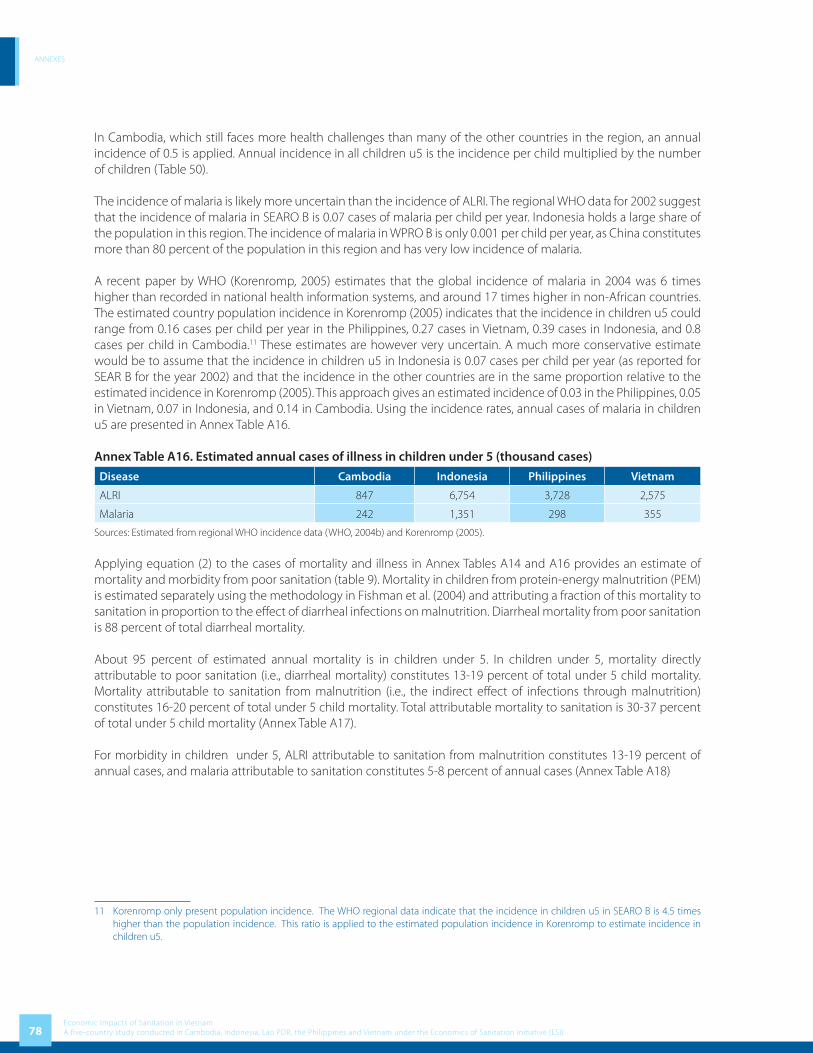
ANNEXES
78Economic Impacts of Sanitation in VietnamA five-country study conducted in Cambodia, Indonesia, Lao PDR, the Philippines and Vietnam under the Economics of Sanitation Initiative (ESI)
In Cambodia, which still faces more health challenges than many of the other countries in the region, an annual incidence of 0.5 is applied. Annual incidence in all children u5 is the incidence per child multiplied by the number of children (Table 50).
The incidence of malaria is likely more uncertain than the incidence of ALRI. The regional WHO data for 2002 suggest that the incidence of malaria in SEARO B is 0.07 cases of malaria per child per year. Indonesia holds a large share of the population in this region. The incidence of malaria in WPRO B is only 0.001 per child per year, as China constitutes more than 80 percent of the population in this region and has very low incidence of malaria.
A recent paper by WHO (Korenromp, 2005) estimates that the global incidence of malaria in 2004 was 6 times higher than recorded in national health information systems, and around 17 times higher in non-African countries. The estimated country population incidence in Korenromp (2005) indicates that the incidence in children u5 could range from 0.16 cases per child per year in the Philippines, 0.27 cases in Vietnam, 0.39 cases in Indonesia, and 0.8 cases per child in Cambodia.11 These estimates are however very uncertain. A much more conservative estimate would be to assume that the incidence in children u5 in Indonesia is 0.07 cases per child per year (as reported for SEAR B for the year 2002) and that the incidence in the other countries are in the same proportion relative to the estimated incidence in Korenromp (2005). This approach gives an estimated incidence of 0.03 in the Philippines, 0.05 in Vietnam, 0.07 in Indonesia, and 0.14 in Cambodia. Using the incidence rates, annual cases of malaria in children u5 are presented in Annex Table A16.
Annex Table A16. Estimated annual cases of illness in children under 5 (thousand cases)
Disease Cambodia Indonesia Philippines Vietnam
ALRI 847 6,754 3,728 2,575
Malaria 242 1,351 298 355
Sources: Estimated from regional WHO incidence data (WHO, 2004b) and Korenromp (2005).
Applying equation (2) to the cases of mortality and illness in Annex Tables A14 and A16 provides an estimate of mortality and morbidity from poor sanitation (table 9). Mortality in children from protein-energy malnutrition (PEM) is estimated separately using the methodology in Fishman et al. (2004) and attributing a fraction of this mortality to sanitation in proportion to the eff ect of diarrheal infections on malnutrition. Diarrheal mortality from poor sanitation is 88 percent of total diarrheal mortality.
About 95 percent of estimated annual mortality is in children under 5. In children under 5, mortality directly attributable to poor sanitation (i.e., diarrheal mortality) constitutes 13-19 percent of total under 5 child mortality. Mortality attributable to sanitation from malnutrition (i.e., the indirect eff ect of infections through malnutrition) constitutes 16-20 percent of total under 5 child mortality. Total attributable mortality to sanitation is 30-37 percent of total under 5 child mortality (Annex Table A17).
For morbidity in children under 5, ALRI attributable to sanitation from malnutrition constitutes 13-19 percent of annual cases, and malaria attributable to sanitation constitutes 5-8 percent of annual cases (Annex Table A18)
11 Korenromp only present population incidence. The WHO regional data indicate that the incidence in children u5 in SEARO B is 4.5 times higher than the population incidence. This ratio is applied to the estimated population incidence in Korenromp to estimate incidence in children u5.
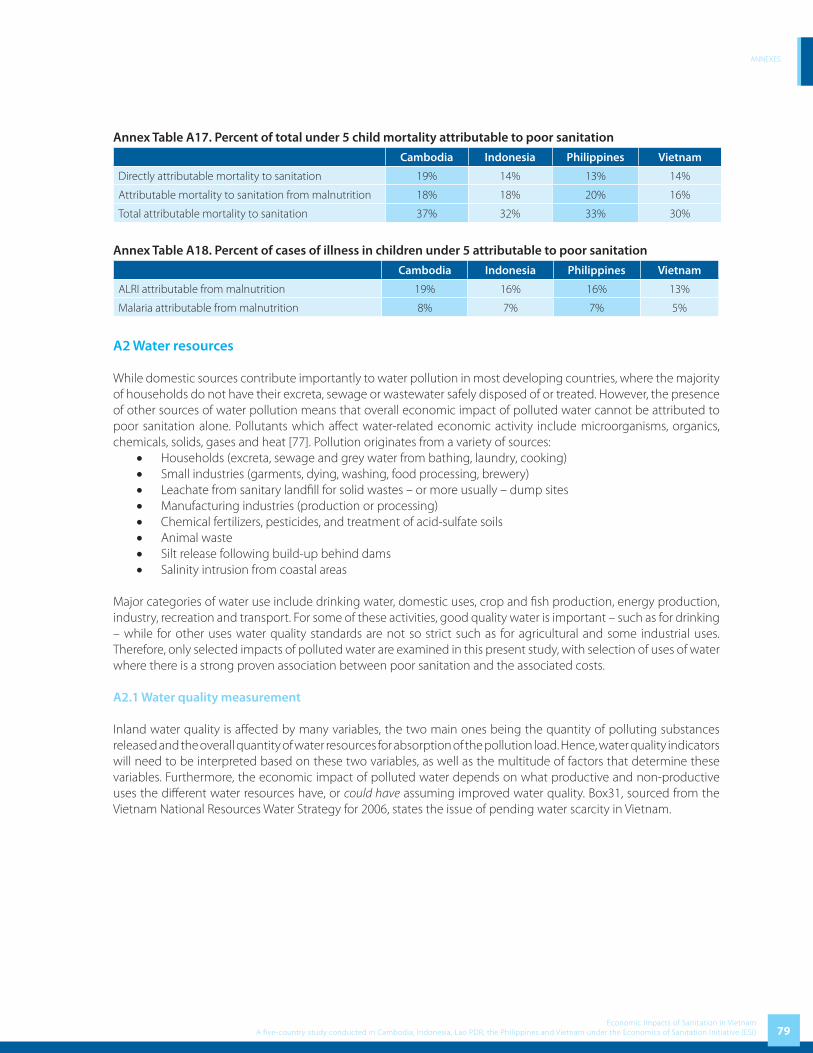
ANNEXES
79Economic Impacts of Sanitation in Vietnam
A five-country study conducted in Cambodia, Indonesia, Lao PDR, the Philippines and Vietnam under the Economics of Sanitation Initiative (ESI)
Annex Table A17. Percent of total under 5 child mortality attributable to poor sanitation
Cambodia Indonesia Philippines Vietnam
Directly attributable mortality to sanitation 19% 14% 13% 14%
Attributable mortality to sanitation from malnutrition 18% 18% 20% 16%
Total attributable mortality to sanitation 37% 32% 33% 30%
Annex Table A18. Percent of cases of illness in children under 5 attributable to poor sanitation
Cambodia Indonesia Philippines Vietnam
ALRI attributable from malnutrition 19% 16% 16% 13%
Malaria attributable from malnutrition 8% 7% 7% 5%
A2 Water resources
While domestic sources contribute importantly to water pollution in most developing countries, where the majority of households do not have their excreta, sewage or wastewater safely disposed of or treated. However, the presence of other sources of water pollution means that overall economic impact of polluted water cannot be attributed to poor sanitation alone. Pollutants which aff ect water-related economic activity include microorganisms, organics, chemicals, solids, gases and heat [77]. Pollution originates from a variety of sources:
• Households (excreta, sewage and grey water from bathing, laundry, cooking)• Small industries (garments, dying, washing, food processing, brewery)• Leachate from sanitary landfi ll for solid wastes – or more usually – dump sites• Manufacturing industries (production or processing)• Chemical fertilizers, pesticides, and treatment of acid-sulfate soils• Animal waste• Silt release following build-up behind dams• Salinity intrusion from coastal areas
Major categories of water use include drinking water, domestic uses, crop and fi sh production, energy production, industry, recreation and transport. For some of these activities, good quality water is important – such as for drinking – while for other uses water quality standards are not so strict such as for agricultural and some industrial uses. Therefore, only selected impacts of polluted water are examined in this present study, with selection of uses of water where there is a strong proven association between poor sanitation and the associated costs.
A2.1 Water quality measurement
Inland water quality is aff ected by many variables, the two main ones being the quantity of polluting substances released and the overall quantity of water resources for absorption of the pollution load. Hence, water quality indicators will need to be interpreted based on these two variables, as well as the multitude of factors that determine these variables. Furthermore, the economic impact of polluted water depends on what productive and non-productive uses the diff erent water resources have, or could have assuming improved water quality. Box31, sourced from the Vietnam National Resources Water Strategy for 2006, states the issue of pending water scarcity in Vietnam.

ANNEXES
80Economic Impacts of Sanitation in VietnamA five-country study conducted in Cambodia, Indonesia, Lao PDR, the Philippines and Vietnam under the Economics of Sanitation Initiative (ESI)
Box 3. Vietnam’s water resources are unsustainable
The current average per capita surface water availability from the total volume of water in rivers within Vietnam is about 3,840 m3 per year. If water infl ows from outside the country are included, the average per capita river water availability is 10,240 m3 per year. Taking population growth into consideration, by 2025 the average per capita surface water availability will be 2,830 and 7,660 m3 per year. According to standards of the International Water Resources Association (IWRA), nations with average per capita water availability lower than 4,000 m3 per year are considered nations with inadequate water supply.
Water resources are not evenly distributed over diff erent regions. About 60% of river water is concentrated on the Cuu Long River delta (Mekong River). The remaining 40% is spread over nearly 80% of the nation’s population and over 90% of production, trade and other service activities.
The average volume of water in 3-5 months in the wet reason makes up 75 - 85% of the total volume, while the 7 or 9 months of the dry season receives 15 - 25% of the year’s water quantity.
Source: National Resources Water Strategy, 2006
Water quality monitoring is limited in Vietnam. Diff erent organizations or agencies are interested in diff erent uses of water, and hence measure diff erent water quality indicators. The Ministry of Natural Resources and the Environment (MONRE) is responsible for monitoring both surface and ground waters. The Ministry of Fishery monitors water quality in aquaculture areas and the Ministry of Health is responsible for monitoring quality of drinking water.
Hydrological and Meteorological Services (MHS) of MONRE maintains a network of about 230 hydrological monitoring stations. It operates a national groundwater monitoring network with 300 regional monitoring stations and more than 600 observation wells across Vietnam. Monitoring operates upon a periodic schedule, once or twice monthly. In addition to water temperature, pH, and turbidity, other parameters are measured such as discharge, water level, ferrum, silica, calcium, magnesium, chloride, sulfate, bicarbonate, and chemical oxygen demand (COD). However, these measurements are mainly for hydrological and meteorological purposes rather than environmental purposes. With respect to monitoring water quality for environmental purpose, there are rather fewer stations under the Vietnam Environment Protection Agency (VEPA) which monitor water quality in selected water bodies. These stations measure parameters like dissolved oxygen (DO), biological oxygen demand (BOD5), COD, ammonium, nitrate, chloride, heavy metals, zooplankton, phytoplankton, oil, etc. However, as data from regular sources is not suffi cient, external consultants are sometimes engaged by VEPA to carry out the monitoring and investigation of water quality in selected areas. The Government has now recognized the need to establish water quality management and environmental protection mechanism for priority river basins with a clear focus on high risk water quality and environmental problems [3].
This present study uses data from 2005-2006 water quality monitor by VEPA. Regional fi gures are estimated by the Consultants on basis of surveyed fi gures on specifi c water bodies.
A2.2 Contribution of poor sanitation to water pollution
Water pollution from domestic sources can be estimated from the annual release or eventual seepage of untreated feces, urine and gray water into inland water bodies. It is estimated by applying the number of population with unimproved sanitation, the proportion of sewage released to water bodies, and average human (and animal) waste production per year. Annex Table A19 presents the fi gures and assumptions behind the release of human waste to water bodies. Pollution load from human waste is based on 0.15 kg feces and 1.5 liters urine per person per day. The following table shows the volume of waste per produced by some animals per day.

ANNEXES
81Economic Impacts of Sanitation in Vietnam
A five-country study conducted in Cambodia, Indonesia, Lao PDR, the Philippines and Vietnam under the Economics of Sanitation Initiative (ESI)
Annex Table A19. Production of fecal matter from diff erent sources
Producer Fecal matter
Kg / day Kg / year
Humans 0.15 54.75
Cow 18 – 25 6,570 – 9,125
Buff alo 30 – 40 10,950 – 14,600
Pig 3.5 – 7.0 1,277.5 – 2,555
Fowl 0.02 – 0.05 7.3 – 18.25
Annex Table A20. Estimated proportion of untreated sewage discharged to water bodies
% sewage discharged directly into water body
% open defecation in water courses
Septic tanks not managed properly
Leaking pit latrine
Total% of which to groundwater
Total% of which to groundwater
100% 12.7% 13.0% 10.0% 13.0% 10.0%
Source: Consultant’s estimates based on National Water Quality Monitor 2005-2006 (applied to all regions)
Annex Table A21 shows the assumptions on polluting substances used for discharge per day for urban households with pipe connection. Rural households without pipe connection are conservatively assumed to have zero gray water, and the same amount of sewage.
Annex Table A21. Waste load production in grams per cap per day, subdivided by gray water and sewage, for urban households with pipe connection
Source BOD5
COD N P TSS Oil Cu Cd Pb Zn
Gray water 15 40 2 1.5 48 5 0.018 0.0001 0.015 0.022
Sewage 35 35 7 0.8 20 2 0 0 0 0
Total 50 70 9 2.3 68 7 0.018 0.0001 0.015 0.022
Source: [78]
Annex Table A22. Estimated BOD from domestic sources (2005)
Region Domestic
BOD %
Red River Delta 100,076 21.7%
North East 51,916 11.3%
North West 14,233 3.1%
North Central Coast 58,915 12.8%
South Central Coast 39,109 8.5%
Central Highlands 26,401 5.7%
South East 74,671 16.2%
Mekong River Delta 95,793 20.8%
Total 461,115 100.0%
Note: Data on BOD from industry and agriculture is not available
The pollution in the water bodies is generated from three sources of industry, agriculture and domestic activities. They vary between rivers and regions of the country. For the Cau River sub-basin the major pollution is caused

ANNEXES
82Economic Impacts of Sanitation in VietnamA five-country study conducted in Cambodia, Indonesia, Lao PDR, the Philippines and Vietnam under the Economics of Sanitation Initiative (ESI)
by industrial production, craft villages and urban runoff . In the Nhue-Day River sub-basin, domestic wastewater accounts for the biggest proportion of wastewater (56%), making the Nhue - Day sub-basin diff erent to many other basins. Industry contributes 24% of the wastewater and craft villages 4%. Major pollution in the Dong Nai River basin is dominated by domestic wastewater and industrial wastewater. [3]
In this present study, it is not possible to calculate the contribution of various sources to overall water pollution using BOD. However, it is estimated by the Consultants that domestic source contributes 40% of BOD to overall pollution of water bodies in Vietnam. If additional components of sanitation in Vietnam are included (agricultural waste and waste from trade villages), it is assumed that expanded “sanitation” contributes 80% of total BOD.
A2.2.1 Cost implications of water pollution for drinking water supply
Both water consumers and water providers treat water because water sources are not clean. More wealthy populations purchase bottled water which is either chemically treated or from a protected (mineral) source. The more polluted the water source, the more likely the household will take some form of precautionary measures, thus leading to higher unit costs of treatment. In some cases, households will not haul water from more polluted water sources if less polluted sources are available, but it may lead to time or fi nancial costs.
Given that drinking water sources are polluted from several sources and not just from poor sanitary practices, by removing the human (and animal) waste component of polluted water, the need to treat water is not altogether removed. However, the removal of human and animal waste content from water sources may reduce the necessity for treatment or lowers the unit cost of treatment.
Annex Table A23 below shows selected drinking water quality standards. Some of the main indicators which will cause households to purchase, treat or walk further to access cleaner water are perceived or actual presence of infectious pathogens (microbial agents) and heavy metals, bad odour due to organics, turbidity caused by solids, and bad taste due to low pH and solids.
For the purposes of cost estimation, household drinking water sources are sub-divided into three categories, data for which are presented in Table A24 at national level and rural-urban breakdown.:
1. Households receive piped water supply, either from water treatment companies or from open community-managed sources. The table below shows that 19.08% of households receive piped water from water supply companies.
2. Households purchase water from other non-piped suppliers, such as tanker truck, water by the bucket, or bottled water. The table indicates that 0.5% of households purchase water from vendors.
3. Households collect water from free or low cost community or public sources. Hauled water accounts for 26.16% of total sources of drinking water. Drilled and other wells explain the rest (54.22%).
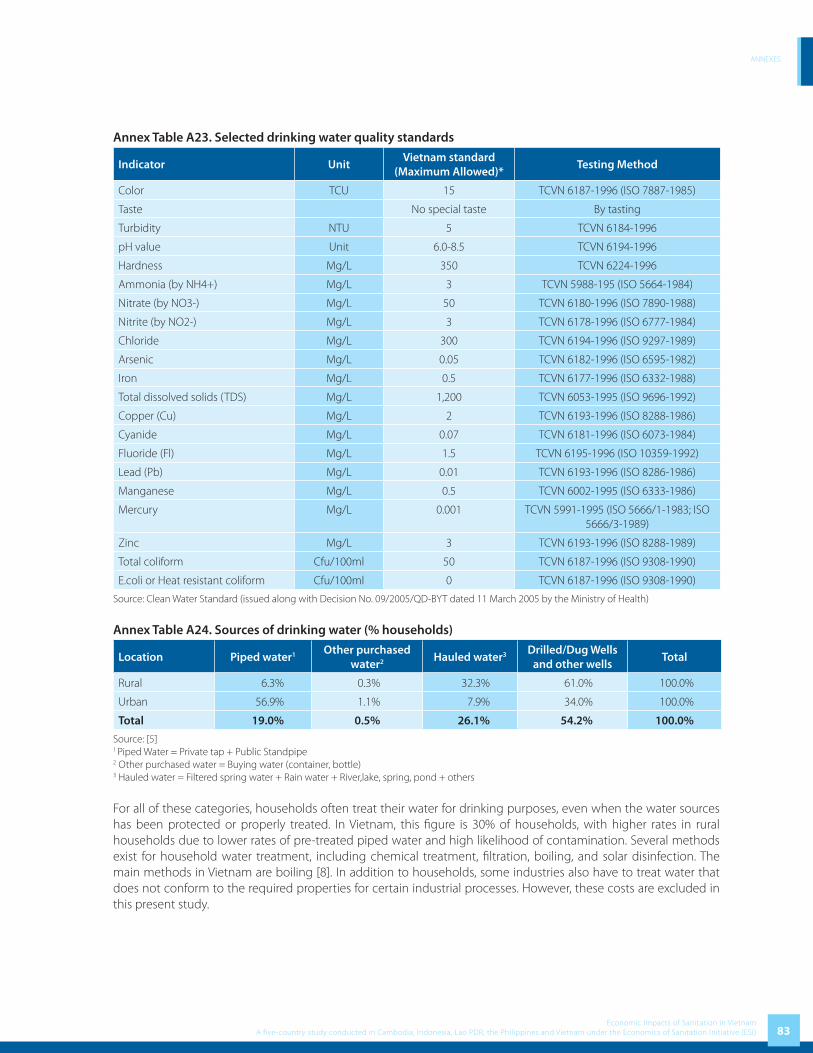
ANNEXES
83Economic Impacts of Sanitation in Vietnam
A five-country study conducted in Cambodia, Indonesia, Lao PDR, the Philippines and Vietnam under the Economics of Sanitation Initiative (ESI)
Annex Table A23. Selected drinking water quality standards
Indicator UnitVietnam standard
(Maximum Allowed)*Testing Method
Color TCU 15 TCVN 6187-1996 (ISO 7887-1985)
Taste No special taste By tasting
Turbidity NTU 5 TCVN 6184-1996
pH value Unit 6.0-8.5 TCVN 6194-1996
Hardness Mg/L 350 TCVN 6224-1996
Ammonia (by NH4+) Mg/L 3 TCVN 5988-195 (ISO 5664-1984)
Nitrate (by NO3-) Mg/L 50 TCVN 6180-1996 (ISO 7890-1988)
Nitrite (by NO2-) Mg/L 3 TCVN 6178-1996 (ISO 6777-1984)
Chloride Mg/L 300 TCVN 6194-1996 (ISO 9297-1989)
Arsenic Mg/L 0.05 TCVN 6182-1996 (ISO 6595-1982)
Iron Mg/L 0.5 TCVN 6177-1996 (ISO 6332-1988)
Total dissolved solids (TDS) Mg/L 1,200 TCVN 6053-1995 (ISO 9696-1992)
Copper (Cu) Mg/L 2 TCVN 6193-1996 (ISO 8288-1986)
Cyanide Mg/L 0.07 TCVN 6181-1996 (ISO 6073-1984)
Fluoride (Fl) Mg/L 1.5 TCVN 6195-1996 (ISO 10359-1992)
Lead (Pb) Mg/L 0.01 TCVN 6193-1996 (ISO 8286-1986)
Manganese Mg/L 0.5 TCVN 6002-1995 (ISO 6333-1986)
Mercury Mg/L 0.001 TCVN 5991-1995 (ISO 5666/1-1983; ISO 5666/3-1989)
Zinc Mg/L 3 TCVN 6193-1996 (ISO 8288-1989)
Total coliform Cfu/100ml 50 TCVN 6187-1996 (ISO 9308-1990)
E.coli or Heat resistant coliform Cfu/100ml 0 TCVN 6187-1996 (ISO 9308-1990)
Source: Clean Water Standard (issued along with Decision No. 09/2005/QD-BYT dated 11 March 2005 by the Ministry of Health)
Annex Table A24. Sources of drinking water (% households)
Location Piped water1 Other purchased water2 Hauled water3 Drilled/Dug Wells
and other wellsTotal
Rural 6.3% 0.3% 32.3% 61.0% 100.0%
Urban 56.9% 1.1% 7.9% 34.0% 100.0%
Total 19.0% 0.5% 26.1% 54.2% 100.0%
Source: [5]1 Piped Water = Private tap + Public Standpipe2 Other purchased water = Buying water (container, bottle)3 Hauled water = Filtered spring water + Rain water + River,lake, spring, pond + others
For all of these categories, households often treat their water for drinking purposes, even when the water sources has been protected or properly treated. In Vietnam, this fi gure is 30% of households, with higher rates in rural households due to lower rates of pre-treated piped water and high likelihood of contamination. Several methods exist for household water treatment, including chemical treatment, fi ltration, boiling, and solar disinfection. The main methods in Vietnam are boiling [8]. In addition to households, some industries also have to treat water that does not conform to the required properties for certain industrial processes. However, these costs are excluded in this present study.

ANNEXES
84Economic Impacts of Sanitation in VietnamA five-country study conducted in Cambodia, Indonesia, Lao PDR, the Philippines and Vietnam under the Economics of Sanitation Initiative (ESI)
Various methods are available to estimate of costs of avertive behavior to avoid drinking polluted water. The lower limit on fi nancial cost could be refl ected by identifying specifi c actions to remove bacteria, such as chemical treatment for piped water, open wells, and household treatment. The upper limit on fi nancial cost of avertive behavior can be refl ected by apportioning to poor sanitation a fraction of the total cost of water treatment and purchase. However, it is noted that households choose more convenient but more costly water sources for a variety of reasons, which include (but are not limited to) water pollution, convenience of access, time savings and no other available water supply. Hence the allocation of costs to sanitation has to be adjusted downwards by 50%. The economic costs of access to clean drinking water includes not only the fi nancial cost, but also the eff orts made by households to access clean water, such as walking further to access cleaner water sources, or the time taken to treat water in the home. See Annex B for algorithms for calculation of water access cost for diff erent water sources.
The algorithms were applied at national level due to lack of regional breakdown. Data available on drinking water sources from GSO is used. Piped water price was assumed on basis of government stipulated price (VND 2,500 – VND 8,000 per m3). Price of purchased water was assumed conservatively using data from some World Bank projects at VND 8,000 per m3. Household water treatment practices are presented in the table below [8]. The minimum drinking water per capita per day was assumed to be 4 liters, taken from WHO sources [79]. For hauled water, the proportion of households traveling further to access cleaner water was based on populations living close to polluted water sources which are unusable for drinking water purposes (lakes, rivers and polluted groundwater); while additional journey time was taken from international studies of time for collecting drinking water since there is no secondary data available in Vietnam concerning this issue. The Global Water Supply and Sanitation Assessment 2000 Report (WHO and UNICEF 2000) indicated that an average household required a journey of more than 30 minutes to collect water per day. These time-saving fi gures are confi rmed by the Multi-Indicator Cluster Surveys of the United Nations Children’s Fund (UNICEF). A recent analysis of the responses in 23 African and Asian countries produced a similar result (G. Keast, UNICEF, 2003). A conservative estimate of 15 additional minutes per day for water collection due to pollution of local water sources is used in this study. For households, it is assumed that water treatment costs (boiling) are US$5 per m3 in rural area and US$8 per m3 in urban area.
The attribution to poor sanitation of the overall costs of sourcing clean water was made diff erently for the diff erent costs:
• Attributable water pollution to poor sanitation: an estimate was made about this fraction due to lack of data on releases from industry, agriculture and domestic sources. Discussion with experts from WSP Vietnam estimated that a fraction of 40% can be used to this fraction.
• Attributable fraction of water purchased due to poor sanitation: given concerns of households about micro-bacteria in water available from open sources, this fraction may be higher than the fraction above. Other characteristics of water available from local sources (taste, color, cloudiness) are also taken into account, which often account for switching sources. Based on the discussion above with WSP Vietnam, this fraction is conservatively estimated at 40%
• Attributable fraction of water treated due to poor sanitation is the same as above variable.
Box 4. Water treatment costs in Dong Nai
The Dong Nai River at Hoa An Pumping station (supplying water to HCMC and Bien Hoa City) is now polluted with BOD5 concentrations at twice the standard. The price for each m3 of water after treatment increases by 4,658 VND (which is more expensive than the present price per m3 of water supply). The result will be that the price for each m3 of water after treatment is 9,077 VND/m3. Therefore, on average per day, the Thu Duc water station has additional costs of roughly 5.9 billion VND.
Source: Environment Protection Project in Dong Nai River Basin , 2003

ANNEXES
85Economic Impacts of Sanitation in Vietnam
A five-country study conducted in Cambodia, Indonesia, Lao PDR, the Philippines and Vietnam under the Economics of Sanitation Initiative (ESI)
A.2.2.2 Water quality and fi sh production valueFisheries in VietnamFisheries play a very important role in Vietnam in providing employment, income and food security to many people. Many Vietnamese depend upon fi sh as a central part of their diet from which they obtain protein and vital nutrients and vitamins. Currently, the fi sheries sector employs around 4,000,000 people and contributes 4% to the country’s GDP (in 2005). The fi sheries sector is one of the key economic sectors in Vietnam, and it maintains higher growth rate than many other sectors.
Pollution and fi sh productionPollution and river diversion have allegedly driven freshwater fi sheries into collapse worldwide, and the extinction of freshwater species far outpaces the extinction of mammals and birds [80-82]. Fish populations are aff ected by a multitude of changes taking place due to human interventions, such as hydroelectric dams, water diversions for agriculture, fl ood control levees, dredging, water pollution, and habitat degradation such as logging. According to FAO, the long-term productivity of fi sh stocks are related to the carrying capacity of their environment, which alter as a result of natural variability and of changes induced by human activity, such as coastal habitat degradation, destructive fi shing methods and pollution.” (page 47, [83]). Environmental degradation has been cited as one of the key threats to inland fi sh producers in countries of the lower Mekong basin [84]. Of particular concern for water quality for fi sh production in Southeast Asia are suspended solids, dissolved oxygen, heavy metals and pesticides [85]. However, as one of the few publications on water quality and fi sh production in Asia notes (writing in 1986) “data on the eff ect of water quality on Asian species of fi sh are not readily accessible” (page 15, [85]). Furthermore, it is diffi cult to predict the exact impact of water pollution on fi sh production given variations between fi sh species and the multiple other determinants of fi sh production such as food availability, water depth, fl ow, and temperature.
Domestic sources contribute importantly to water pollution, largely through the biological oxygen demand (BOD) exerted by organic matter which reduces dissolved oxygen levels [86]12. Fish living below a sewage treatment plant had signifi cantly higher mortality rate than fi sh upstream [87-89]. Pharmaceutical discharge in urine can aff ect fi sh health directly. The scientifi c literature testifi es, albeit incompletely, to the adverse eff ects of sewage release on fi sh reproduction and fi sh growth.
One key determinant of fi sh health which has received attention from scientists is the level of dissolved oxygen [87-97]. For example, experiments undertaken in Canada on native fi sh and benthic macroinvertebrate species showed that exposure to low dissolved oxygen and low temperatures caused delays in hatching of eggs, reduced mass of fi sh post-hatch, and depressed feeding rates and lowered survival of fi sh [93].
Additionally, micro-organisms contained in human and animal waste such as parasites and bacteria have a number of implications for fi sh health [84, 91, 92, 96, 97], as well as safety of fi sh for human consumption [87, 90, 98-101]. Common illnesses from contaminated fi sh and shell fi sh include typhoid, salmonellosis, gastroenteritis, infectious hepatitis, Vibrio parahaemolyticus and Vibrio vulnifi cus infections, paralytic shellfi sh poisoning (PSP), and amnesic shellfi sh poisoning (ASP).
A further consideration that needs to be addressed is the fact that, in many contexts, the nutrients from sewage act as a source of food for fi sh, and hence positively aff ect the production of fi sh. This happens both intentionally, when sewage is fed to farmed fi sh in a regulated way, and unintentionally when fi sh in open water bodies are exposed to untreated sewage disposed upstream. Vu Quyet Thang reported the positive impact of sewage and domestic waste water on fi sh farming in Vietnam [102], Hence, in recognizing the benefi ts of sewage for fi sh production, the impact
12 A major determinant of fi sh reproduction, growth and survivability is dissolved oxygen (DO). When an organic waste is discharged into an aquatic system, a biological oxygen demand (BOD) is created. BOD is a measure of the oxygen required to break down organic compounds, and high BOD levels signifi cantly deplete the amount of dissolved oxygen in surface water. Consequently high BOD levels have a detrimental eff ect on the health of aquatic species that require elevated levels of DO. From human waste, damages result from direct biological oxygen demand, as well as increased growth of algae from nitrates and phosphorous contained in human waste. The algae biodegrade the nutrients, thus reducing the amount of DO available.

ANNEXES
86Economic Impacts of Sanitation in VietnamA five-country study conducted in Cambodia, Indonesia, Lao PDR, the Philippines and Vietnam under the Economics of Sanitation Initiative (ESI)
analysis addresses only unregulated, unintentional, pollution of water with sewage. It should be noted, though, that sewage-fed farmed fi sh may not be optimally managed, and negative health eff ects need to be recognized.
The paragraph below describes the pollution of some major river basins in Vietnam. Pollution levels of rivers in the lower reaches of the Dong Nai River Basin are the worst in Vietnam. The Thi Vai River is the most polluted in basin with a “dead” section of 10 km, and drainage canals in inner Ho Chi Minh City suff er similar levels of pollution - extremely low DO levels, and high levels of N-NH
4, mercury and zinc. The water is seriously polluted by organic substances and
is a blackish brown color with fetid odors, in both high and low tidal periods. The DO value is often lower than 0.5 mg/l (Figure 2.42). With the DO value at nearly zero, biological species are unable to live. [3]
The average level of DO in Cau River is 6.5 mg/L for the section from Lien Mac to Cau Dien. From Cau Dien to downstream, level of DO reduced considerably to 4.5 mg/L. At To Lich junction, DO value is less than 1 mg/L.[3]
Methods for modeling the relationship between water pollution and fi sh productionGiven the lack of empirical evidence linking water quality and fi sh production in Vietnam, this study uses innovative methods to examine the likely importance of sewage release for fi sh production. While the following three key links are identifi ed, only the fi rst is assessed quantitatively in this study:
• The proven link between sewage and dissolved oxygen levels, and the resulting impact of lowered dissolved oxygen levels on fi sh production13.
• The proven link between micro-biological contents of water and fi sh disease, and hence survival.
• The link between micro-biological contents of water inhabited by fi sh and the transmission of disease to humans via fi sh consumption, due to inadequate de-contamination of fi sh prior to consumption.
This study assesses the water quality indicators available for diff erent freshwater locations where fi sh are (or used to be) farmed or caught, and assesses the various issues related to fi sh reproduction, fi sh populations, and overall fi sh health, and attributes estimated economic impact to poor sanitation (sewage and grey water release) as one of several sources of water pollution in those water bodies.
The focus of this study is on freshwater fi sh, given that dissolved oxygen is more aff ected in water bodies where oxygen depletion is more acute, resulting from release of untreated sewage into freshwater.
Annex Table A25 indicates that the Red River delta and South East are the two regions with lowest DO levels in Vietnam. They are the two most densely populated delta areas in Vietnam with two polluted river basins of Nhue-Day and Dong Nai. In addition, industrial zones and craft villages are highly developed in these two regions causing pollution in water bodies. DO levels are higher in the 6 other regions of the country. Levels of DO vary between rivers, between sections of a river, and a number of ‘hot spots’ of pollution are noted, from both industrial and domestic sources. As a result, the average level of DO may not truly refl ect the pollution of water bodies, especially in hot spots of pollution.
13 Dissolved oxygen was selected as the key water quality parameter because aquatic organisms require oxygen in specifi ed concentration ranges for respiration and effi cient metabolism, and because dissolved oxygen concentration changes above or below this range can have adverse physiological eff ects. Even short-lived anoxic and hypoxic events can cause high mortality rates of aquatic organisms. Exposure to low oxygen concentrations can have an immune suppression eff ect on fi sh which can elevate their susceptibility to diseases for several years. Moreover, the toxicity of many toxicants (lead, zinc, copper, cyanide, ammonia, hydrogen sulfi de and pentachlorophenol) can double when DO is reduced from 10 to 5 mg/L. The amount of oxygen available in the water also decreases with temperature and when plants die. Oxygen requirements increase at a higher temperature (e.g. an increase in water temperature from 10 to 20°C at least doubles the oxygen demand). The presence of other pollutants such as nitrogen and marine life overcrowding reduce DO levels. In cloudy conditions, plants use up more of the available DO. Plants proliferate with the presence of nitrate and phosphates from agricultural run-off , sewage and excess fi sh feed.

ANNEXES
87Economic Impacts of Sanitation in Vietnam
A five-country study conducted in Cambodia, Indonesia, Lao PDR, the Philippines and Vietnam under the Economics of Sanitation Initiative (ESI)
Annex Table A25. Fish production levels by water body and dissolved oxygen levels of water body
Water body name and type
Recorded DO (where estimated)
Fish volume (Farm and Inland Catch 2005)
Potential Fish Volume
Weight (tons)
Value (US$)
Fish weight (tons)
Fish value (US$)
Red River Delta 6.5 206,794 62,038,314 295,421 88,626,163
North East 7 48,760 14,627,889 54,177 16,253,210
North West 8 7,933 2,379,960 8,815 2,644,400
North Central Coast 6.7 48,071 14,421,161 53,412 16,023,512
South Central Coast 7.2 65,787 19,736,090 73,097 21,928,989
Central Highlands 8 15,367 4,610,100 17,074 5,122,333
South East 6.2 53,332 15,999,603 76,189 22,856,576
Mekong River Delta 8 862,984 258,895,083 958,871 287,661,203
Total 1,309,027 392,708,200 1,537,055 461,116,387
In Vietnam, fi sheries output refers to total production volume of one or a group of aquatic species harvested or caught in a given period, comprising production of caught products and production of farmed products (aquaculture). Production of caught product (fi shing) includes marine fi shing and inland fi shing (from rivers, streams, lagoons, or ponds). Production of farmed products includes all aquatic production from aquaculture. Aquaculture mainly comprises freshwater culture of fi sh and brackish-water culture of shrimp and prawn. Freshwater means water with salinity less than 0.5%. The focus of this present study is on freshwater fi sh caught or farmed, given that dissolved oxygen is more aff ected in water bodies where oxygen depletion is more acute, resulting from release of untreated sewage into freshwater. All freshwater fi shes are included in this study, while products from marine fi shing and culture of shrimp and prawn are excluded.
It is recognized that the impact of poor sanitation on fi sh stock, fi sh growth and eventual fi sh catch is extremely diffi cult to quantify. Coeffi cients linking water body pollution and yield reduction have not been developed. For a crude quantifi cation of the possible loss in fi sh value due to water pollution, a modeled relationship based on assumptions is used, represented in Figure A1. The Figure shows the estimated reduction in volume of fi sh caught at lower levels of dissolved oxygen, for an average fi sh species in Vietnam.
The amount of oxygen needed for the survival of fi sh varies with time of year and species. Oxygen needs vary even with the life stage of a species. Young species tend to be more sensitive to low oxygen conditions than adults. Also important is the duration of periods with low oxygen. Most species can survive short periods of reduced oxygen, but suff er during longer periods. According to Meck [95] and others, the minimum limiting oxygen concentrations for a fi sh is dependent upon its species, physical state, level of activity, long term acclimation, and stress tolerance. A research study from the USA examined the lowest DO at which diff erent fi sh species survived for 24 hours, varying from 6.0 mg/L down to 3.3 mg/L [94]. Usually larger fi sh are aff ected by low DO before smaller fi sh. Given the lack of published studies on the empirical relationship between these two variables, the following assumptions made used based on a mixture of available scientifi c literature, internet sources, and expert opinion. A range is assessed in sensitivity analysis, shown by dotted line in Figure A1.
• Water with an oxygen concentration of less than 3.0 mg/l will generally not support fi sh. When concentrations fall to about 3.0-4.0 mg/L, fi sh start gasping for air at the surface or huddle around water falls or higher concentration points.
• Numerous scientifi c studies suggest that 4.0-5.0 parts per million (ppm) of DO is the minimum amount that will support a fi sh population for short periods of 12-24 hours.
• Above 5.0 mg/l, almost all aquatic organisms can survive indefi nitely, provided other environmental
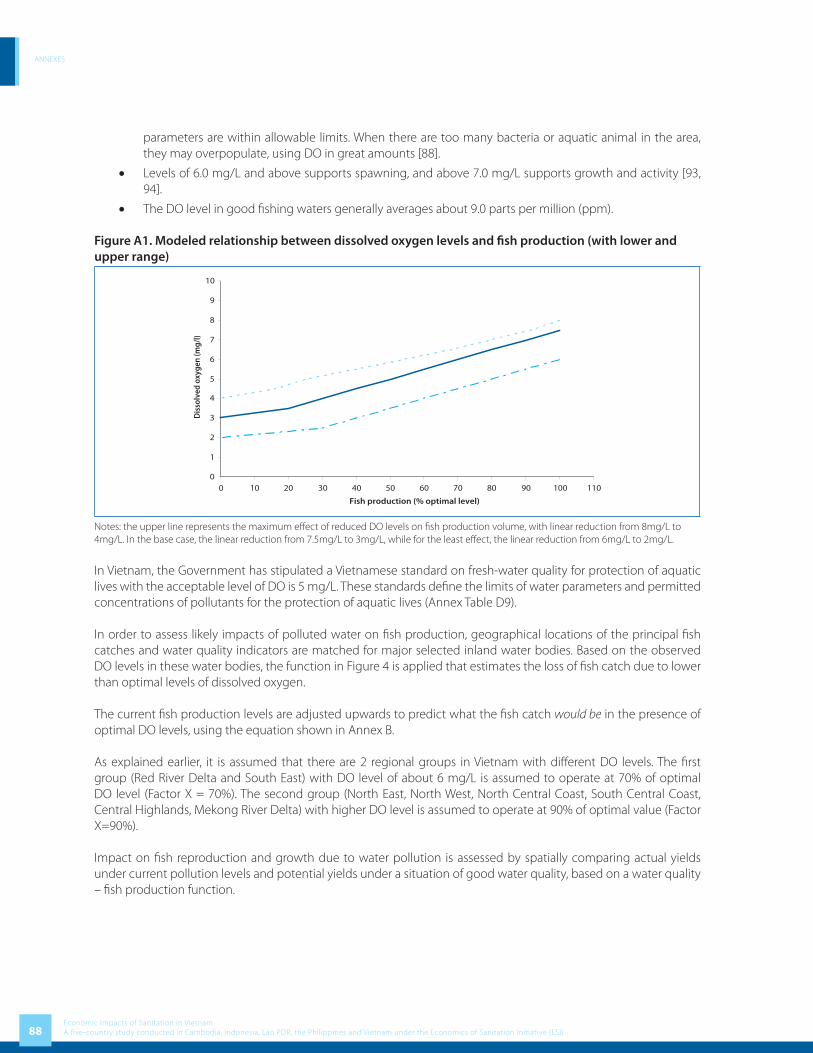
ANNEXES
88Economic Impacts of Sanitation in VietnamA five-country study conducted in Cambodia, Indonesia, Lao PDR, the Philippines and Vietnam under the Economics of Sanitation Initiative (ESI)
parameters are within allowable limits. When there are too many bacteria or aquatic animal in the area, they may overpopulate, using DO in great amounts [88].
• Levels of 6.0 mg/L and above supports spawning, and above 7.0 mg/L supports growth and activity [93, 94].
• The DO level in good fi shing waters generally averages about 9.0 parts per million (ppm).
Figure A1. Modeled relationship between dissolved oxygen levels and fi sh production (with lower and upper range)
0
1
2
3
4
5
6
7
8
9
10
0 10 20 30 40 50 60 70 80 90 100 110
Fish production (% optimal level)
Dis
solv
ed o
xyge
n (m
g/l)
Notes: the upper line represents the maximum eff ect of reduced DO levels on fi sh production volume, with linear reduction from 8mg/L to 4mg/L. In the base case, the linear reduction from 7.5mg/L to 3mg/L, while for the least eff ect, the linear reduction from 6mg/L to 2mg/L.
In Vietnam, the Government has stipulated a Vietnamese standard on fresh-water quality for protection of aquatic lives with the acceptable level of DO is 5 mg/L. These standards defi ne the limits of water parameters and permitted concentrations of pollutants for the protection of aquatic lives (Annex Table D9).
In order to assess likely impacts of polluted water on fi sh production, geographical locations of the principal fi sh catches and water quality indicators are matched for major selected inland water bodies. Based on the observed DO levels in these water bodies, the function in Figure 4 is applied that estimates the loss of fi sh catch due to lower than optimal levels of dissolved oxygen.
The current fi sh production levels are adjusted upwards to predict what the fi sh catch would be in the presence of optimal DO levels, using the equation shown in Annex B.
As explained earlier, it is assumed that there are 2 regional groups in Vietnam with diff erent DO levels. The fi rst group (Red River Delta and South East) with DO level of about 6 mg/L is assumed to operate at 70% of optimal DO level (Factor X = 70%). The second group (North East, North West, North Central Coast, South Central Coast, Central Highlands, Mekong River Delta) with higher DO level is assumed to operate at 90% of optimal value (Factor X=90%).
Impact on fi sh reproduction and growth due to water pollution is assessed by spatially comparing actual yields under current pollution levels and potential yields under a situation of good water quality, based on a water quality – fi sh production function.

ANNEXES
89Economic Impacts of Sanitation in Vietnam
A five-country study conducted in Cambodia, Indonesia, Lao PDR, the Philippines and Vietnam under the Economics of Sanitation Initiative (ESI)
The focus of the initial analysis is on fi sh production that is offi cially recorded in national statistics. Where fi sh catch values are available, these are recorded; where not available, fi nancial value is estimated by applying current market prices to the average type of fi sh. The economic impact of low DO levels for non-recorded fi sh catch is also assessed, by scaling up the fi nancial values by proportion of total fi sh catch accounted for by non-recorded sources. This was estimated as a factor of 1.1. Likewise for the economic estimates, the fi sh catch from subsistence fi shing was also estimated; and the nutritional importance discussed. Since the fi sh catch region is based on the geographic location, it is hard to match the fi sh catch with the specifi c water bodies.
To estimate attributable impact to poor sanitation, a proportion of this loss is assigned to sewage and domestic gray water, as compared to other sources of water pollution (industry, agriculture, silt/natural erosion). This is done by estimating the proportion of BOD from these diff erent sources. Due to the lack of reliable information on proportion of BOD from poor sanitation, it is assumed that poor sanitation contributes 40% of BOD to the water body.
A2.2.3 Water quality and domestic uses of waterIn addition to the uses of surface and groundwater sources for domestic use, industrial use, fi sheries and agriculture, water is an essential ingredient to many other human and non-human activities [103]. In this present study, it is not possible to conduct an exhaustive analysis of all the diff erent uses of water. However, the following three categories were assessed for relevance:
• Non-commercial household (domestic) activities
• Leisure activities [104]
• Wildlife, covering fl ora and forna and animal species.
Non-commercial activities are concentrated at the household level, and include water for cooking purposes, washing clothes and kitchenware, and personal hygiene. Also, some traditional customs as well as leisure activities are closely related to water. Again, some of these require good quality water given it will be ingested, while others do not require quality water.
Activities aff ected by below standard water quality were assessed in the following way:
• Proportion of households and population that use untreated or unprotected surface or ground water for cooking, washing and bathing; and those that treat water to make it cleaner for domestic use. About 84% of rural households boil water before drinking. Red River Delta, North Central Coast and the low-lying provinces of the Northeast are regions with the highest rates. In the North West, South Central Coast, Central Highlands and South East, from 20% to 25% of households do not boil water before drinking. About 35% of households in the Mekong do not boil water before drinking [30]. Results from the GSO survey also indicate that regular fi ltration or chemical disinfection of drinking water is practiced by only a small fraction of the population. Some households commonly use aluminum sulphate to remove the particulate matter and help remove microbial pathogens [105].
• Proportion of households and population that switch water source due to the preference to have clean water for domestic activities. For example, for laundry and bathing, purchased water (via pipe or vendor) may be used rather than using local water bodies.
• Extent of other cultural and leisure activities related to water, and that require water of a minimum quality standard, including swimming.
ANNEXES
90Economic Impacts of Sanitation in VietnamA five-country study conducted in Cambodia, Indonesia, Lao PDR, the Philippines and Vietnam under the Economics of Sanitation Initiative (ESI)
Box 5. Small business saves on water costs in An Giang province
A small business household producing rice wine at Thanh My Tay commune, Chau Phu district, An Giang province – utilizes both clean water supplied by the provincial Water Company and water from the canal. This household has 9 people with 6 working in the business, and the demand for water is high. To reduce expenditure, they pump water from the canal into a storage tank where it is cleansed using alum. This source of water is used for bathing, washing, etc. The clean water from the piped scheme is only used for cooking.
For rice wine production, they use the cleansed river water to wash the rice, and then use water from the piped scheme during the fermentation process. This cuts costs quite signifi cantly.
Source: National RWSS Review Survey, October 2004 .
Wildlife is dependent on water resources. For plants and trees, much of the water need is met from rainfall, and hence the issue of pollution does not come in. For some plants and trees, and most animals and water creatures, they are reliant on standing water, and hence can be aff ected by water polluted from the diff erent human sources.
According to the MONRE statistics, Vietnam now has about 700 species of fl ora and fauna under the threat of extinction. Many wildlife species listed in the Red book, including tigers, rhinoceros, reptiles and especially fresh water tortoises, were on the verge of extinction, along with precious fauna like aloe wood and ngoc linh ginseng.
Exploitation of marine resources and wildlife, destruction of forests, expansion in construction and pollution are seriously threatening the country’s natural resources, including bio-diversity that is vital for the country as well as for the fl ora and fauna. Although it is not possible to determine the contribution of poor sanitation to the deterioration of wildlife, improved sanitation and less polluted water resources will certainly contribute to the protection of bio-diversity.
A3 Environment
The release of waste into the environment has other eff ects besides water pollution, given the unpleasant smells emanating from feces, urine, and other waste products [106, 107]. In countries where open defecation and unoffi cial dumping of waste are common, the quality of land is aff ected, rendering it unattractive and unusable for productive use. Unregulated waste dumping presents a threat to those disposing of waste, those living in the vicinity of the dumping area, as well as the poorest of the poor who often live off the waste (e.g. recycling activities). Waste grounds are also inhabited by stray dogs or other animals, which are diseased and pose a threat to human health. Even where there is a private or public agency taking care of disposal, it is often not performed according to plan. In cities, waste carts stay on the streets for many days, with resulting smell and unsightliness for local inhabitants and tourists. These aesthetic aspects of sanitation cause a loss of welfare for those coming into contact with the waste. However, given the lack of available data on these aspects, there is considerable uncertainty on the overall importance of these impacts.
A3.1 Aesthetics
Aesthetics is not strongly related to productivity or income. Economic evaluation studies do not usually quantify aesthetics such as smell and sight in economic terms. Instead these aspects are described as a potential additional benefi t provided by sanitation programs. Studies assessing user preferences for sanitation options, including willingness to pay studies, tend to limit the focus to the physical boundaries of the household, and hence not assess impacts on the broader environment [108, 109]. Hence, fi ndings aesthetics benefi ts of improved sanitation in this study are presented mainly in qualitative terms.

ANNEXES
91Economic Impacts of Sanitation in Vietnam
A five-country study conducted in Cambodia, Indonesia, Lao PDR, the Philippines and Vietnam under the Economics of Sanitation Initiative (ESI)
A.3.2 Land quality
When it has alternative uses, land is a tradable commodity. Hence, land that is used for improper, unoffi cial disposal of waste will be unusable for other more productive uses, and hence will refl ect an economic loss to society. This present study assesses the solid waste management practices and resulting eff ects on land availability and land quality, and presents economic value using an economic value of land.
Solid waste management can be classifi ed by safe and unsafe disposal practices. Unsafe practices involve open dump and semi-controlled dump with limited or no environmental control. Engineered landfi ll is a safe practice with basic waste accounting and some environmental control. The safest practice is sanitary landfi ll where waste accounting is practiced, waste placement, fencing and staff onsite, regular environmental monitoring and leachate collection and treatment. No waste pickers are allowed to work on a sanitary landfi ll [7].
If a landfi ll or dump is not sanitary, it is necessary that a “buff er zone” is established surrounding its operational portion. The distance in meters from the fence of a landfi ll to the nearest house is the buff er zone required to prevent the household from having seriously negative impact from waste. Within this buff er zone, land areas become temporarily unusable for other purposes, for example for constructing buildings, for agricultural use or for children’s play areas.
The study estimated the amount of land that has been rendered temporarily unusable or unproductive for other uses for all unsanitary landfi lls in Vietnam as a result of unexpected buff er zones. A buff er zone was estimated to extend for 1,000 m around an unsanitary landfi ll. The number of landfi lls and their areas by regions were from Vietnam Environment Monitor 2004 and the Ministry of Construction data.
Annex Table A26. Unsanitary landfi ll and required buff er zone
Region Population (1,000)
Area (km2)
Unsanitary Landfi lls
Sanitary Landfi lls
Area (ha)
Buff er zone (m2)
Red River Delta 18,279 14,812.5 21 3 112.4 41,162,948
North East 9,482 63,629.8 12 4 31.6 27,007,490
North West 2,600 37,336.9 3 - 41.0 12,836,249
North Central Coast 10,761 51,510.8 6 3 93.8 2,202,400
South Central Coast 7,143 33,069.0 12 2 68.5 25,344,171
Central Highlands 4,822 54,473.7 2 1 43.0 5,463,962
South East 13,639 34,743.1 7 3 282.0 25,555,333
Mekong River Delta 17,497 39,738.7 11 1 108.5 30,501,179
Total 84,222 329,314.5 74 17 780.8 170,073,731
Source: VEM 2004
Once the actual surface area of land aff ected was quantifi ed, it is multiplied by an estimated rental value for the aff ected land (per square meter per year). The value taken was the rental of agricultural land, that is the lowest one among diff erent. It is assumed at VND 10,000 per m2 which is the standard land rental price regulated by the government.

ANNEXES
92Economic Impacts of Sanitation in VietnamA five-country study conducted in Cambodia, Indonesia, Lao PDR, the Philippines and Vietnam under the Economics of Sanitation Initiative (ESI)
A4 Other welfare
The type of sanitation facility a household has will have a range of impacts on population welfare. An important but diffi cult to quantify aspect is welfare impact on individuals and families who use a sub-standard, uncomfortable latrine or who have no latrine at all. Except for the disease impact (covered elsewhere), these less tangible aspects of human welfare have limited direct fi nancial implications, but can be quantifi ed as welfare losses using conventional economic techniques. More tangible impacts of sub-standard latrine or no facilities are time impacts due to journeying time or waiting due to insuffi cient shared or public latrines per head of population, security aspects of having no latrine or a remotely located one, especially for women and girls, as well as life decisions such as schooling or choice of employment, which may be linked to the presence of sub-standard or no latrines at schools and workplaces.
A4.1 Intangible user preferences
User preferences which could be described as ‘intangible’ – or diffi cult to quantify – include:• Comfort & acceptability– the acceptability of the squatting or seating position; the ease to perform
personal hygiene functions; the freedom from rushing to complete toilet-going due to unhygienic latrine conditions, fl ies and foul smelling air and pressure from other users.
• Privacy and convenience – the benefi ts of not being seen using the toilet; or being seen walking to access toilet facilities (women) [20].
• Security – the location of the latrine within or near to the home means that excursions to the outdoor do not need to be made for toilet-going needs, in particular at night, where there may be dangers (theft, attack, rape, and injuries sustained from dangerous animals or snakes).
• Confl ict – on-plot sanitation can avoid confl ict with neighbors or the community, where tensions exist on the shared facilities, or fi elds and rivers for open defecation.
• Status and prestige – when visitors come to the house, it gives prestige to the household to be able to off er their guests a clean and convenient toilet to use. Families may hold more social events at their house as a result of a clean latrine.
Annex Table A27 below shows the number of people in Vietnam who are experiencing sub-standard or no latrines according to the various aspects listed above (lack of comfort, lack of privacy, security threats, and confl ict potential). It indicates that more than 2 million households do not have toilets. More than 3 million households have to share toilets with others.
Annex Table A27. Lack of latrine – indicators of defecation conditions
Area No latrine Sharing Using own private latrine
Number %1 Number %1 Number %1
Rural 1,879,526 13.50% 2,380,732 17.10% 9,662,154 69.40%
Urban 205,417 3.78% 723,309 13.31% 4,505,598 82.91%
Total 2,167,954 11.20% 3,135,791 16.20% 14,052,991 72.60%
Source: [8]1 Refers to the % of total households in Vietnam
See Annex Table D11 and D12 for more information about diff erent type of latrines and number of shared latrines by regions.

ANNEXES
93Economic Impacts of Sanitation in Vietnam
A five-country study conducted in Cambodia, Indonesia, Lao PDR, the Philippines and Vietnam under the Economics of Sanitation Initiative (ESI)
A4.2 Access time
Welfare loss from increased access time due to unimproved sanitation can be due to journey time for open defecation or waiting time for shared latrine, and is estimated as shown in the algorithms in Annex B.
As there is no secondary information on this issue in Vietnam, the study assumes 10 minutes as an average additional daily time a person spends to fi nd a private place for defecation. It is assumed that people who share latrines spend 15 more additional minutes per day for the same purpose.
The fi nancial loss is estimated based on a proportion of adults whose time loss refl ects a income loss, while the economic loss is based on the entire population and the average unit of time value for each population group (children time value is worth 50% of adult time value).
A4.3 Impact on life decisions and behavior
Running water supply and sanitary latrines in schools are a luxury in most of the developing world, and in many workplaces latrines are unhygienic, poorly maintained, and do not cater for special needs of women. The presence of hygienic and private sanitation facilities in schools has been shown to aff ect enrolment and attendance, especially for girls [16, 110]. Good latrine access at the workplace has implications for women participation at traditionally male-dominated employment areas. Furthermore, sanitary and adequate latrines in schools and at workplaces not only aff ect participation rates, but it also improves welfare of all pupils and employees.
Given the complex web of causative factors and eventual life decisions, and the many factors determining absenteeism from school or the workplace, it becomes diffi cult to quantify the exact relationship between poor sanitation conditions, education and work decisions, and eventual economic outcomes. Furthermore, there is no study on this issue in Vietnam so far. Hence, a number of assumptions on causal relationship have been made.
Annex Table A28 shows the results from a national survey in 2006 on the situation of toilets and running water in schools and public places. It indicates that the number of schools with adequate latrines is just between 50% and 60%, while there are still 19.9% of primary schools and 7.4% of secondary schools that do not have toilets. On the other hand, the problem of running water is less serious. There is no data on the coverage of toilets in workplaces.
Annex Table A28. Water and sanitation coverage in schools and workplaces
Establishments With toilets Without toilets
Running water supply or well close-by
“Adequate” latrines
Not “adequate” toilets
Adequate Inadequate or none
Primary schools 50.06% 30.04% 19.90% 83.70% 16.30%
Secondary schools 60.10% 32.50% 7.40% 95.90% 4.10%
Workplaces
Source: [111]
Annex Table A29 provides information on male and female participation rates in school and work. There is no breakdown in rates between boys and girls so the same rate is used.
Based on these data sources, the expected impacts of poor sanitation in schools and workplaces are assessed by estimating school days and workdays lost due to poor sanitation:

ANNEXES
94Economic Impacts of Sanitation in VietnamA five-country study conducted in Cambodia, Indonesia, Lao PDR, the Philippines and Vietnam under the Economics of Sanitation Initiative (ESI)
1. School absenteeism: a proportion of pupil absentee days is apportioned to lack of sanitation. The study estimated the number of pupils not enrolling or falling out of school due to poor sanitation assuming sanitation accounts for 2% of the total drop-out and absenteeism in schools. The number of absentee days is assumed at 10 days per pupil per year. As explained earlier, children’s time is estimated at 50% of adults’ time.
2. Employment absenteeism. For those people in workplaces with no or inadequate latrines, the number of days lost from work is assumed at 10 days per person per year. 1% of absentee days are apportioned to lack of sanitation.
Annex Table A29. Male / female participation rates in school and work
Variable Female Male Total
Rural Urban Total Rural Urban Total Rural Urban Total
Primary school (%)1
Enrolment (95.26%) 2,690 1,000 3,691 2,976 1,106 4,083 5,667 2,107 7,773
Completion (96.17%) 2,587 962 3,549 2,862 1,064 3,927 5,450 2,026 7,476
Drop-out (3.83%) 103 38 141 114 42 156 217 81 298
Secondary school (%)1
Enrolment (96.3%) 3,332 1,239 4,571 3,573 1,328 4,902 6,906 2,567 9,473
Completion (93.94%) 3,130 1,164 4,294 3,357 1,248 4,605 6,487 2,412 8,899
Drop-out (6.06%) 202 75 277 217 80 297 418 156 574
Teachers (%)1 540
Workforce participation (%)2
Agriculture 8,994 3,343 12,337 8,690 3,230 11,920 17,683 6,574 24,257
Industry 2,831 1,052 3,884 2,735 1,017 3,752 5,567 2,069 7,636
Services 4,010 1,491 5,501 3,875 1,440 5,315 7,885 2,931 10,816
Not working 888 330 1,218 858 319 1,177 1,746 649 2,395
Total workforce 16,723 6,217 22,940 16,158 6,007 22,164 32,881 12,223 45,104
Source: [23]1 Website of Ministry of Training and Education 2 GSO 2005
A5 Tourism
Tourists are sensitive to their environment, and are less likely to choose destinations which are dirty or where the risk of disease is high. Countries may be losing tourist revenues due to the degraded environment and high infectious disease rates among the general population, as well as actual or perceived health risks to tourists. Hence any initiative to attract more tourists to a country will need to consider the part sanitation plays in this [17-19].
A5.1 Tourism and sanitation
Tourism is a booming industry, and continues to experience double-digit growth in many developing countries around the world [112], fuelled by cheapening airfare costs coupled with the realization of developing country governments and private sector of the potential economic benefi ts of tourism. Tourism is playing an important role in boosting the revenues of governments as well as contributing to much-needed economic growth in the developing world. However, some countries have done better than others at exploiting the growth in tourism. Tourist preferences clearly play a key role in this: there are clearly many factors that determine tourists’ choice of destination, and sanitation will

ANNEXES
95Economic Impacts of Sanitation in Vietnam
A five-country study conducted in Cambodia, Indonesia, Lao PDR, the Philippines and Vietnam under the Economics of Sanitation Initiative (ESI)
be one among many. Tourist growth depends on what the country can off er such as tourist transport infrastructure, quality of accommodation and restaurants, type of experience off ered (culture, climate, culinary, relaxation), and safety. Also, prices of tourist services determine the relative attractiveness of a country for foreign tourists, which is partially determined by the stability and level of the local currency. In addition to these factors, the present study presents the hypothesis that there are important but under-recognized links between tourism and sanitation. Two diff erent sets of economic impacts are assessed in this study: (1) the sub-optimal exploitation of tourism potential in the country, which is partially related to poor sanitation; and (2) the estimated costs to tourists associated with health episodes and welfare losses resulting from poor sanitation. However, to avoid potential double-counting of disease episodes of domestic tourists, and to avoid including welfare losses of foreign tourists in national estimates, the second impact above is not included in the total cost estimates of poor sanitation in section 3.1.
Annex Table A30. Comparative sanitation and travel and tourism statistics for selected Southeast & East Asian countries (%)
Country Pop. Size (m.)
Sanitation coverage
Economic activity 2006 Growth
1990 2004Demand
(US$billion)Jobs
(million)2007 2008-2015
Cambodia 14.8 - 17 1.9 1.1 6.5% 5.7%
China 1,322 23 44 439.8 72 13.3% 9.6%
Indonesia 225.2 46 55 43.5 6.1 3.6% 6.4%
Korea, Republic 48.2 - - 104.1 1.75 3.7% 5.9%
Laos 5.9 - 30 0.45 0.15 7.1% 6.0%
Malaysia 25.3 - 94 33.6 1.2 4.5% 6.6%
Philippines 82.8 57 72 16.3 7.0 7.0% 5.6%
Singapore 4.4 100 100 37.2 0.20 6.3 6.3%
Thailand 64.1 80 99 47.8 4.1 3.3% 5.5%
Vietnam 83.6 36 61 12.2 3.5 10.5% 7.8%
Source: World Travel and Tourism Council.
Tourists are often heavily infl uenced in their choice of destination by the availability of information (positive media) on a destination, the off er of package tours or package deals in their home country, and/or the ease of booking fl ights and hotels on the internet or by phone. Hence there is a self-reinforcing loop, which can – over time – lead to large resort complexes and tourist destinations such as the various coasts and islands of Southern Europe and the Caribbean, coastal areas of Thailand and Malaysia, and well known tropical islands (Zanzibar, Maldives), among others.
What role does sanitation play in a country’s attractiveness for tourists? The environment is one of the key attracting elements of a tourist destination – as a popular refrain goes: “sun, sea and sand” – which are recognized factors for attracting tourists. But if the sea is brown from the pollution released by the country’s rivers, if the sand or roadsides are soiled with the excreta of the local inhabitants, and if food preparation standards are low, then the tourism potential of a location is clearly limited [113]. Tourist perceptions about the sanitary conditions of a potential tourist destination are gathered from their own research and experience, as well as from the stories and perceptions circulating via travel agencies and social networks. Important aspects for sanitary conditions to tourists include, but are not limited to:
• Aesthetics of the local environment (sight, smell)
• Cleanness of water for swimming or sightseeing
• Availability of clean latrines and water, soaps and towels for personal hygiene, in accommodation, restaurants, bus stops etc.
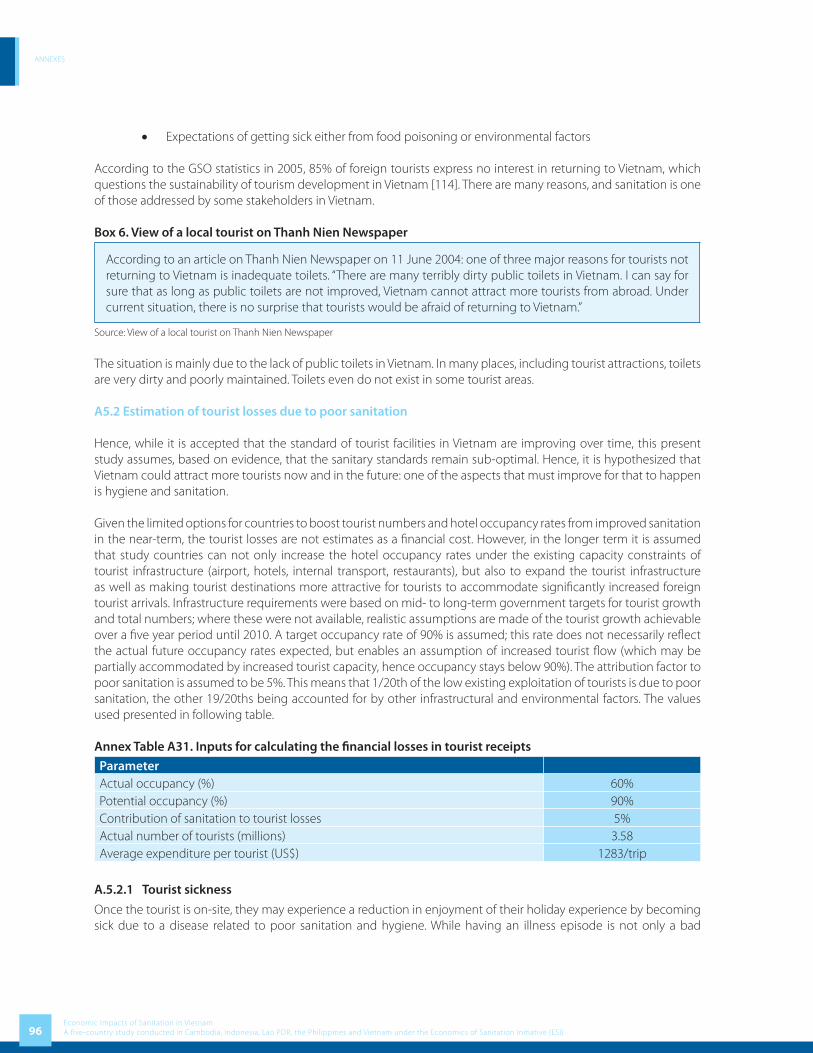
ANNEXES
96Economic Impacts of Sanitation in VietnamA five-country study conducted in Cambodia, Indonesia, Lao PDR, the Philippines and Vietnam under the Economics of Sanitation Initiative (ESI)
• Expectations of getting sick either from food poisoning or environmental factors
According to the GSO statistics in 2005, 85% of foreign tourists express no interest in returning to Vietnam, which questions the sustainability of tourism development in Vietnam [114]. There are many reasons, and sanitation is one of those addressed by some stakeholders in Vietnam.
Box 6. View of a local tourist on Thanh Nien Newspaper
According to an article on Thanh Nien Newspaper on 11 June 2004: one of three major reasons for tourists not returning to Vietnam is inadequate toilets. “There are many terribly dirty public toilets in Vietnam. I can say for sure that as long as public toilets are not improved, Vietnam cannot attract more tourists from abroad. Under current situation, there is no surprise that tourists would be afraid of returning to Vietnam.”
Source: View of a local tourist on Thanh Nien Newspaper
The situation is mainly due to the lack of public toilets in Vietnam. In many places, including tourist attractions, toilets are very dirty and poorly maintained. Toilets even do not exist in some tourist areas.
A5.2 Estimation of tourist losses due to poor sanitation
Hence, while it is accepted that the standard of tourist facilities in Vietnam are improving over time, this present study assumes, based on evidence, that the sanitary standards remain sub-optimal. Hence, it is hypothesized that Vietnam could attract more tourists now and in the future: one of the aspects that must improve for that to happen is hygiene and sanitation.
Given the limited options for countries to boost tourist numbers and hotel occupancy rates from improved sanitation in the near-term, the tourist losses are not estimates as a fi nancial cost. However, in the longer term it is assumed that study countries can not only increase the hotel occupancy rates under the existing capacity constraints of tourist infrastructure (airport, hotels, internal transport, restaurants), but also to expand the tourist infrastructure as well as making tourist destinations more attractive for tourists to accommodate signifi cantly increased foreign tourist arrivals. Infrastructure requirements were based on mid- to long-term government targets for tourist growth and total numbers; where these were not available, realistic assumptions are made of the tourist growth achievable over a fi ve year period until 2010. A target occupancy rate of 90% is assumed; this rate does not necessarily refl ect the actual future occupancy rates expected, but enables an assumption of increased tourist fl ow (which may be partially accommodated by increased tourist capacity, hence occupancy stays below 90%). The attribution factor to poor sanitation is assumed to be 5%. This means that 1/20th of the low existing exploitation of tourists is due to poor sanitation, the other 19/20ths being accounted for by other infrastructural and environmental factors. The values used presented in following table.
Annex Table A31. Inputs for calculating the fi nancial losses in tourist receipts
ParameterActual occupancy (%) 60%Potential occupancy (%) 90%Contribution of sanitation to tourist losses 5%Actual number of tourists (millions) 3.58Average expenditure per tourist (US$) 1283/trip
A.5.2.1 Tourist sickness
Once the tourist is on-site, they may experience a reduction in enjoyment of their holiday experience by becoming sick due to a disease related to poor sanitation and hygiene. While having an illness episode is not only a bad
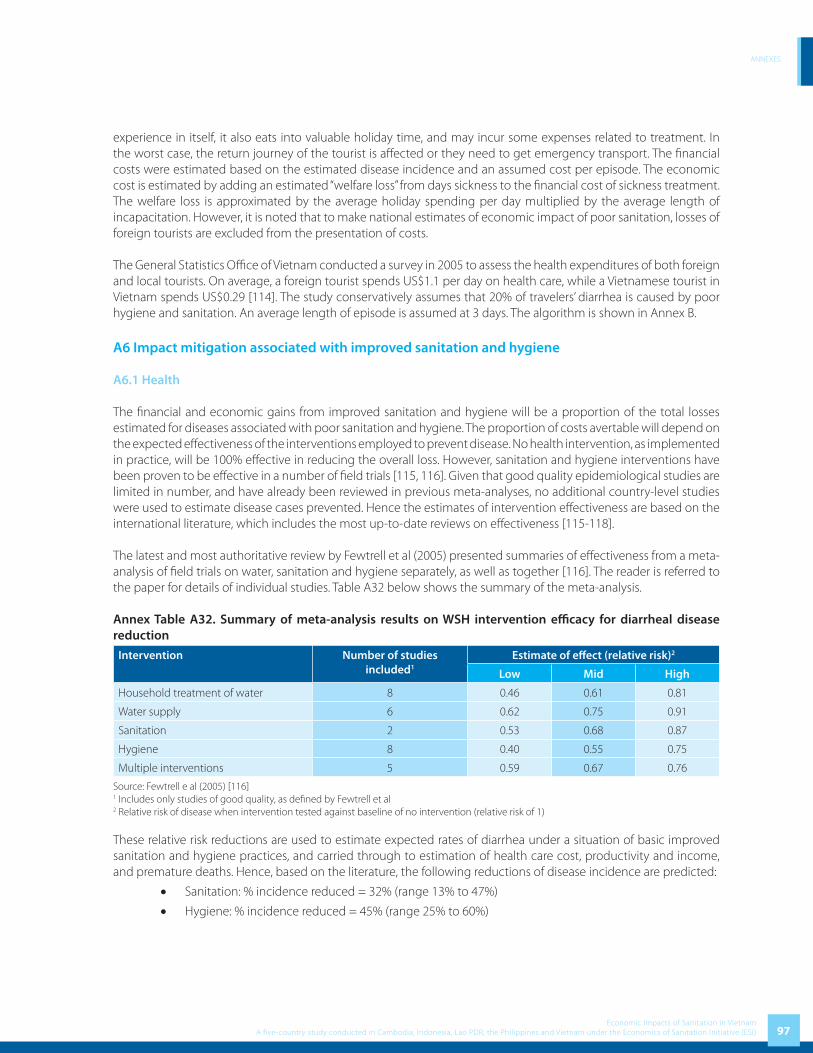
ANNEXES
97Economic Impacts of Sanitation in Vietnam
A five-country study conducted in Cambodia, Indonesia, Lao PDR, the Philippines and Vietnam under the Economics of Sanitation Initiative (ESI)
experience in itself, it also eats into valuable holiday time, and may incur some expenses related to treatment. In the worst case, the return journey of the tourist is aff ected or they need to get emergency transport. The fi nancial costs were estimated based on the estimated disease incidence and an assumed cost per episode. The economic cost is estimated by adding an estimated “welfare loss” from days sickness to the fi nancial cost of sickness treatment. The welfare loss is approximated by the average holiday spending per day multiplied by the average length of incapacitation. However, it is noted that to make national estimates of economic impact of poor sanitation, losses of foreign tourists are excluded from the presentation of costs.
The General Statistics Offi ce of Vietnam conducted a survey in 2005 to assess the health expenditures of both foreign and local tourists. On average, a foreign tourist spends US$1.1 per day on health care, while a Vietnamese tourist in Vietnam spends US$0.29 [114]. The study conservatively assumes that 20% of travelers’ diarrhea is caused by poor hygiene and sanitation. An average length of episode is assumed at 3 days. The algorithm is shown in Annex B.
A6 Impact mitigation associated with improved sanitation and hygiene
A6.1 Health
The fi nancial and economic gains from improved sanitation and hygiene will be a proportion of the total losses estimated for diseases associated with poor sanitation and hygiene. The proportion of costs avertable will depend on the expected eff ectiveness of the interventions employed to prevent disease. No health intervention, as implemented in practice, will be 100% eff ective in reducing the overall loss. However, sanitation and hygiene interventions have been proven to be eff ective in a number of fi eld trials [115, 116]. Given that good quality epidemiological studies are limited in number, and have already been reviewed in previous meta-analyses, no additional country-level studies were used to estimate disease cases prevented. Hence the estimates of intervention eff ectiveness are based on the international literature, which includes the most up-to-date reviews on eff ectiveness [115-118].
The latest and most authoritative review by Fewtrell et al (2005) presented summaries of eff ectiveness from a meta-analysis of fi eld trials on water, sanitation and hygiene separately, as well as together [116]. The reader is referred to the paper for details of individual studies. Table A32 below shows the summary of the meta-analysis.
Annex Table A32. Summary of meta-analysis results on WSH intervention effi cacy for diarrheal disease reduction
Intervention Number of studies included1
Estimate of eff ect (relative risk)2
Low Mid High
Household treatment of water 8 0.46 0.61 0.81
Water supply 6 0.62 0.75 0.91
Sanitation 2 0.53 0.68 0.87
Hygiene 8 0.40 0.55 0.75
Multiple interventions 5 0.59 0.67 0.76
Source: Fewtrell e al (2005) [116]1 Includes only studies of good quality, as defi ned by Fewtrell et al2 Relative risk of disease when intervention tested against baseline of no intervention (relative risk of 1)
These relative risk reductions are used to estimate expected rates of diarrhea under a situation of basic improved sanitation and hygiene practices, and carried through to estimation of health care cost, productivity and income, and premature deaths. Hence, based on the literature, the following reductions of disease incidence are predicted:
• Sanitation: % incidence reduced = 32% (range 13% to 47%)
• Hygiene: % incidence reduced = 45% (range 25% to 60%)
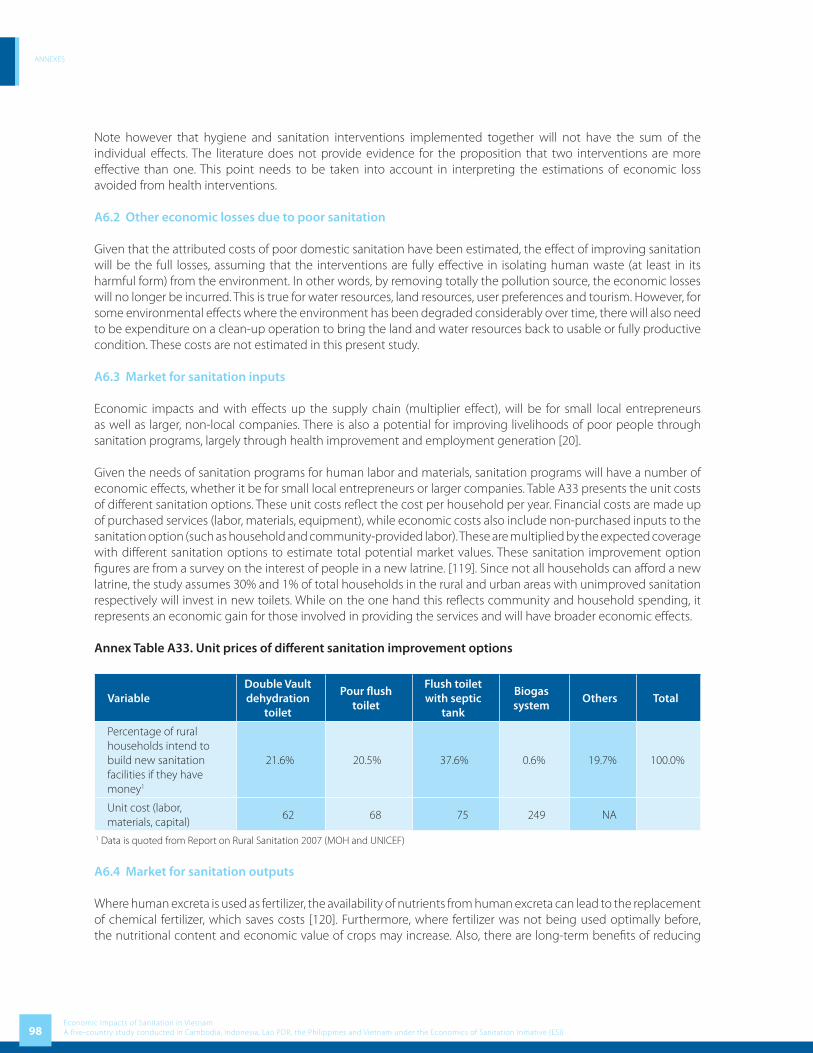
ANNEXES
98Economic Impacts of Sanitation in VietnamA five-country study conducted in Cambodia, Indonesia, Lao PDR, the Philippines and Vietnam under the Economics of Sanitation Initiative (ESI)
Note however that hygiene and sanitation interventions implemented together will not have the sum of the individual eff ects. The literature does not provide evidence for the proposition that two interventions are more eff ective than one. This point needs to be taken into account in interpreting the estimations of economic loss avoided from health interventions.
A6.2 Other economic losses due to poor sanitation
Given that the attributed costs of poor domestic sanitation have been estimated, the eff ect of improving sanitation will be the full losses, assuming that the interventions are fully eff ective in isolating human waste (at least in its harmful form) from the environment. In other words, by removing totally the pollution source, the economic losses will no longer be incurred. This is true for water resources, land resources, user preferences and tourism. However, for some environmental eff ects where the environment has been degraded considerably over time, there will also need to be expenditure on a clean-up operation to bring the land and water resources back to usable or fully productive condition. These costs are not estimated in this present study.
A6.3 Market for sanitation inputs
Economic impacts and with eff ects up the supply chain (multiplier eff ect), will be for small local entrepreneurs as well as larger, non-local companies. There is also a potential for improving livelihoods of poor people through sanitation programs, largely through health improvement and employment generation [20].
Given the needs of sanitation programs for human labor and materials, sanitation programs will have a number of economic eff ects, whether it be for small local entrepreneurs or larger companies. Table A33 presents the unit costs of diff erent sanitation options. These unit costs refl ect the cost per household per year. Financial costs are made up of purchased services (labor, materials, equipment), while economic costs also include non-purchased inputs to the sanitation option (such as household and community-provided labor). These are multiplied by the expected coverage with diff erent sanitation options to estimate total potential market values. These sanitation improvement option fi gures are from a survey on the interest of people in a new latrine. [119]. Since not all households can aff ord a new latrine, the study assumes 30% and 1% of total households in the rural and urban areas with unimproved sanitation respectively will invest in new toilets. While on the one hand this refl ects community and household spending, it represents an economic gain for those involved in providing the services and will have broader economic eff ects.
Annex Table A33. Unit prices of diff erent sanitation improvement options
VariableDouble Vault dehydration
toilet
Pour fl ush toilet
Flush toilet with septic
tank
Biogas system
Others Total
Percentage of rural households intend to build new sanitation facilities if they have money1
21.6% 20.5% 37.6% 0.6% 19.7% 100.0%
Unit cost (labor, materials, capital)
62 68 75 249 NA
1 Data is quoted from Report on Rural Sanitation 2007 (MOH and UNICEF)
A6.4 Market for sanitation outputs
Where human excreta is used as fertilizer, the availability of nutrients from human excreta can lead to the replacement of chemical fertilizer, which saves costs [120]. Furthermore, where fertilizer was not being used optimally before, the nutritional content and economic value of crops may increase. Also, there are long-term benefi ts of reducing

ANNEXES
99Economic Impacts of Sanitation in Vietnam
A five-country study conducted in Cambodia, Indonesia, Lao PDR, the Philippines and Vietnam under the Economics of Sanitation Initiative (ESI)
the use of chemical and mineral fertilizers, especially taking into account the fact that some fossil resources are in increasingly short supply (e.g. phosphorous). Alternatively, families with livestock may instead invest in a biogas reactor, which provides biofuel for cooking, space heating and can even be used for lighting where other improved sources (electricity) are not available [121].
The reuse of human waste for fertilizer or biogas production cannot be assumed to be population-wide, given cultural attitudes towards handling and re-use of human waste, and low practical feasibility in many locations. Success often depends on local perceptions of the expected returns on re-use of human waste, whether it be for biogas or fertilizer. This study assumes this proportion as the number of households re-using human and animal feces for both biogas and fertilizer purposes. The study estimates fecal weight per year and volume of gas produced, and the economic value using existing market prices for these products.
In addition to the above, biogas can bring other benefi ts to the country. The reductions in greenhouse gas emissions from biogas activities are eligible to receive “carbon credits” under the Clean Development Mechanism (CDM) of the United Nations Framework Convention on Climate Change. These credits can be sold in the international market, resulting in revenues for the country. Each biogas tank is equivalent to 2 credits that can be sold at 6 Euro each. According to the biogas project (MARD and SNV), their biogas can bring about 1.8 million Euro per year from 150,000 biogas tanks. However, due to lack of reliable data, this present study does not include this benefi t in total economic impact of improved sanitation. Annex Table A34. Input values for estimation of returns to re-use of human (and animal) waste
Items Unit Rural Urban Total
Total HHs HHs 13,922,412 5,434,324 19,356,737
% HHs applying Ecosan % 1% 0.1%
Number of HHs applying Ecosan HHs 139,224 5,434 144,658
Human waste per year to be used Kg/year 58,266,548 2,166,013 60,432,561
Animal waste per year to be used Kg/year 8,716,835,867 0 8,716,835,867
Total waste volume to be used for biogas Kg/year 8,775,102,415 2,166,013 8,777,268,428
% to be used as fertilizer % 60.0% 60.0%
Volume of fertilizer Kg 5,265,061,449 1,299,608 5,266,361,057
Volume of gas Kg 2,632,530,724 649,804 2,633,180,528
In terms of a market for the outputs from solid waste, the market for recyclables has a large potential for expansion. 32% of municipal waste currently placed in disposal sites in urban areas in Vietnam, or 2.1 million tons per year, consist of commercially recyclable materials such as paper, plastic, metal and glass [7]. This additional recycling could result in a substantial reduction in disposal costs and allow the sector to earn considerable additional revenue.
Composting also has high potential in Vietnam as there is a high proportion of organic matter in municipal wastes. Composting can result in reduction of disposal costs and production of a marketable soil conditioner for use in agriculture and by the public. With the development of a strong market for composting fertilizer and successful source separation, the eff ectiveness of centralized composting facilities could increase considerably. Composting can also reduce landfi ll gas emission, which can result in revenues for the country from selling carbon credits under the Clean Development Mechanism (see above).

ANNEXES
100Economic Impacts of Sanitation in VietnamA five-country study conducted in Cambodia, Indonesia, Lao PDR, the Philippines and Vietnam under the Economics of Sanitation Initiative (ESI)
A7 Uncertainty analysis
Tables A35 and A36 provide alternative input values to refl ect data uncertainty in the present study: (1) Uncertainty in the estimation of overall impacts, such as in the epidemiological and economic variables
(Table A35).(2) Uncertainty in the attribution of the overall impact to poor sanitation (Table A36).
Table A35 presents a selection of uncertain economic variables, and the alternative – low and high values – used in the one-way sensitivity analysis. The selection of basis for lower and upper values of hourly time valued varies by country, due to GDP per capita being higher than compensation of employees in some countries (e.g. Philippines), and lower in others (e.g. Cambodia). The hourly productive time of children was varied from zero to the full adult value. Fish production impact was varied according to the lower and upper bounds presented in Figure A1 (section A3.2.2).
Annex Table A35. Alternative assumptions and values used in one-way sensitivity analysis
Variables selected Low estimate of impact Base case estimateHigh estimate
of impactHealthDiarrhea incidence in children under fi ve
Use of DHS data for under fi ves
70% of diarrheal cases attributed to poor sanitation
Use of DHS data for under fi ves
88% of diarrheal cases attributed to poor sanitation
Use of WHO regional data for under fi ves:< 1 year old: 6.56-10.49 1-4 year old: 2.46-3.93
88% of diarrheal cases attributed to poor sanitation
Hourly value of productive time
30% of average income 30% of GDP per capita GDP per capita
Hourly value of productive time for children
Children given value of zero
Children given 50% value as adults
Children given same value as adults
Premature death Human capital approach, using 2% growth and GDP
per capita
Human capital approach, using 2% growth and compensation of
employees
VOSL benefi t transfer of US$2 million, using 0.6 income
elasticityWaterFish production and DO relationship
Lower range used (fi sh less aff ected by low DO)
Mid range used Higher range used (fi sh more aff ected by low DO)
User preferencesTime access (minutes per day)
5 10 15
Value of time See under ‘health’ above
The Table A36 below provides assumptions on the links between poor sanitation and its impacts.
Annex Table A36. Alternative assumptions for links between poor sanitation and impacts Variables selected Low estimate of
impactBase case estimate of
impactHigh estimate of
impactHealthDiarrheal disease incidence attributed to poor S&H 80% 88% 100%WaterWater pollution attributed to poor sanitation (Table 15)
30% 40% 50%
TourismTourist numbers impact attributed to poor sanitation 2% 5% 10%
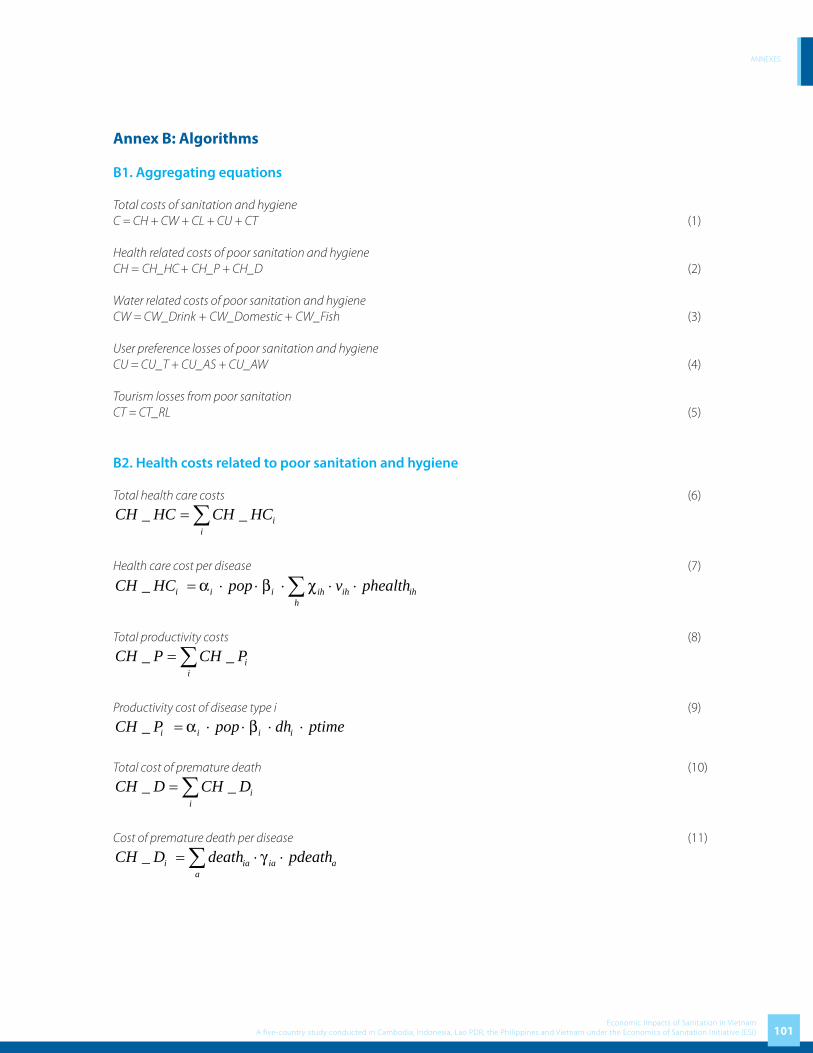
ANNEXES
101Economic Impacts of Sanitation in Vietnam
A five-country study conducted in Cambodia, Indonesia, Lao PDR, the Philippines and Vietnam under the Economics of Sanitation Initiative (ESI)
Annex B: Algorithms
B1. Aggregating equations
Total costs of sanitation and hygieneC = CH + CW + CL + CU + CT (1)
Health related costs of poor sanitation and hygieneCH = CH_HC
+ CH_P + CH_D (2)
Water related costs of poor sanitation and hygieneCW = CW_Drink + CW_Domestic + CW_Fish (3)
User preference losses of poor sanitation and hygieneCU = CU_T + CU_AS + CU_AW (4)
Tourism losses from poor sanitation CT = CT_RL (5)
B2. Health costs related to poor sanitation and hygiene
Total health care costs (6)
_ _ ii
CH HC CH HC= ∑
Health care cost per disease (7)
_ i i i ih ih ihh
CH HC pop v phealthα β χ= ⋅ ⋅ ⋅ ⋅ ⋅∑
Total productivity costs (8)
_ _ ii
CH P CH P= ∑
Productivity cost of disease type i (9)
_ i i i iCH P pop dh ptimeα β= ⋅ ⋅ ⋅ ⋅
Total cost of premature death (10)
_ _ ii
CH D CH D= ∑
Cost of premature death per disease (11)
_ i ia ia aa
CH D death pdeathγ= ⋅ ⋅∑

ANNEXES
102Economic Impacts of Sanitation in VietnamA five-country study conducted in Cambodia, Indonesia, Lao PDR, the Philippines and Vietnam under the Economics of Sanitation Initiative (ESI)
B3. Water related costs associated with poor sanitation and hygiene
Total cost associated with accessing clean drinking water (12)
_ _ mm
CW Drink CW Drink= ∑
Cost of accessing clean drinking water per source/treatment method (13)
_ m m m m mCW Drink h wdrink pwater δ π= ⋅ ⋅ ⋅ ⋅
Total domestic water access cost (excl. drinking water) (14)_ _ m
mCW Domestic CW Domestic= ∑
Domestic water access cost by source/method (15)
_ m m m m mCW Domestic h wdom pwater δ θ= ⋅ ⋅ ⋅ ⋅
Fisheries loss (16)CW Fish AFP PFP= −
Potential fi sh production level (17)AFPPFP
ε=
B4. Land costs
CL ql pland= ⋅ (18)
B5. User preference costs Algorithm
Time access cost for unimproved latrine
_ _ 365CU T pop u taccess ptime= ⋅ ⋅ ⋅ (19)
Cost of days absent from school
_CU AS egirls das pstimeφ= ⋅ ⋅ ⋅ (20)
Cost of days absent from work
_CU AW ewomen daw pwtimeη= ⋅ ⋅ ⋅ (21)
B6. Tourism losses
Lost revenues (22)
_ 1O
A
ocCT RL ta et
ocϕ
⎛ ⎞= ⋅ − ⋅ ⋅⎜ ⎟
⎝ ⎠
Tourist health cost and welfare loss (23)

ANNEXES
103Economic Impacts of Sanitation in Vietnam
A five-country study conducted in Cambodia, Indonesia, Lao PDR, the Philippines and Vietnam under the Economics of Sanitation Initiative (ESI)
( )_CT HT td pahc pawlµ= ⋅ ⋅ +
B7. Variable defi nition summaryTables B1 to B3 present the subscripts, variables and parameters used in the algoritms in Sections B1 to B6 above.
Table B 1. Subscripts used in algorithms
Code Description Elements1
a Age group Less than one year, 1-4 years, 5-14 years, 15-65 years, over65
i Disease types Diahhrea, Cholera, Typhoid, Malnutrition related diseases, etc
h Health care provider Public hospital, private hospital, informal care, self-treatment
m Treatment method Piped water, non-piped water, home-treated, hauled water1 Varies by country.
Table B2. Variables used in algorithmsSymbol DescriptionC Total cost of poor sanitation and hygieneCHC Health costs of poor sanitation and hygieneCH_HC Health care costs of all diseasesCH_HC
iHealth care cost of disease type i
CH_P Productivity costs of diseasesCH_P
iProductivity cost of disease type i
CH_D Premature death costs of diseasesCL Land costCT Tourism losses associated with poor sanitation and hygieneCT_RL Revenue lossesCT_HT Tourist health and welfare lossesCU Use preference losses associated with poor sanitation and hygieneCU_T Time access cost for unimproved latrineCU_AS Cost of days absent from schoolCU_AW Cost of days absent from workCW Water related costs of poor sanitation and hygieneCW_Drink Clean water drinking access costsCW_Drink
mClean water drinking access cost for method m
CW_Domestic Domestic water access costsCW_Domestic
mDomestic water access cost for method m
CW_Fish Fisheries production lossdeath
iaNumber of premature deaths, by disease type i and age group a
dhi
Number of days taken off work or daily activities due to disease idas Days per girl per year taken off school due to poor sanitationdaw Days per woman per year taken off work due to poor sanitationegirls Number of adolescent girls enrolled in schoolet Expenditure per tourist (US$)ewomen Number of women in paid employmenth
mNumber of households using water source or treatment method
oca Actual occupancy rate (%)oco Optimal occupancy rate (%)pahc Average health care cost per case

ANNEXES
104Economic Impacts of Sanitation in VietnamA five-country study conducted in Cambodia, Indonesia, Lao PDR, the Philippines and Vietnam under the Economics of Sanitation Initiative (ESI)
pawl Average welfare cost per casepdeath
aValue of premature death for age group a
PFP Potential fi sh production valuephealth
ihUnit price of care (per visit or day) for disease type i at health facility h
pland Unit value of land per m2
ptime Daily value of timepstime Daily value of school time lostpwtime Daily value of work time lostpwater
mWater price or time value per m3 of water
pop Populationpop_u Population with unimproved access to sanitationql Quantity of land made useable by poor sanitationta Actual number of touriststaccess Average access time (journey or waiting) per daytd Total diseases suff ered by touristsv
ihVisits to or days for disease type i at health facility h
wdrinkm
Consumption per household of drinking water (m3) from water source/treatment method mwdom
mConsumption per household for domestic purposes (m3) from water source/treatment method m
Table B3. Parameters used in algorithms
Symbol Description
iα Incidence rate per person of disease type i
iβ Proportion of episodes attributed to poor sanitation for disease type i
ihχ Proportion of cases seeking care for disease type i and provider h
iaγ Proportion of deaths attributable to poor sanitation, by disease type i and age group a
δ Attributable water pollution to poor sanitation
ε Ratio of the fi sh production at the current DO level to fi sh production at the optimal DO level
φ Proportion of schools with inadequate sanitation facility
η Proportion of work places with inadequate sanitation facilities
µ Proportion of diseases related to sanitation
mπImportance of averting drinking polluted water in relation to overall benefi ts of piped water supply; where
1mπ = for m ≠ piped-water
mθImportance of averting using polluted water in domestic activities in relation to overall benefi ts of piped water
supply; where 1mθ = for m ≠ piped-water

ANNEXES
105Economic Impacts of Sanitation in Vietnam
A five-country study conducted in Cambodia, Indonesia, Lao PDR, the Philippines and Vietnam under the Economics of Sanitation Initiative (ESI)
Annex C: List of Stakeholder and Person met
Annex Table C1. List of Stakeholder and Person met
Stakeholder Person Met
Ministries or government agencies
Health
Department of Preventive Medicine Mr. Tran Dac Phu (Head of Preventive Medicine Department)Mr. Dang Quang Tan (Deputy head of Community Health Division)
Department of Treatment Ms. Tran Thu Thuy
Department of Planning and Finance, Health Policy Unit Mr. Vu Van Chinh
National Institute of. Hygiene and Epidemiology Ms. Nguyen Thi Yen
National Institute of Malaria, Parasitology and Entomology Ms. Nguyen Thi Viet Hoa
National Institute of Nutrition Mr. Nguyen Duc Minh
National Institute of Dermatology and. Venerology Mr. Nguyen Thanh
National Institute of Ophthalmology Mr. Nguyen Quoc Luong
Natural resource & Environment
Department of Environment Mr. Ho Kien Trung
Vietnam Environment Protection Agency Mr. Nguyen Van Thuy, Information Centre
Planning and Investment
Department of Foreign Direct Investment Ms. Le Hai Van
Fisheries Mr. Nguyen Van Ly
Agriculture and rural development Ms. Nguyen Phuong Lam
Construction
Department of Infrastructure Mr. Nguyen Van Thai
Donors and NGOs
WHO Vietnam Dr. Tran Cong Dai (malaria and parasite control)
UNICEF Dr. Marjatta Tolvanen-OjutkangasChief, Health and Nutrition Section Mr. Chander Badloe, Chief – Water, Environment and SanitationMr. Nguyen Dinh Quang, Offi cer – Health and Nutrition Policy
International Trachoma Initiative (ITI) Ms. Nguyen Phuong Mai, Chief Representative
SNV/MARD Biogas Project Mr. Bastiaan Teune, Advisor
Tourism Consulting and Promoting Center (Vietnam Tourism Association)
Mr. Do Tung Lam, Director
Vietnam Water Supply and Sewage Association Mr. Tran Quang Hung, General Secretary
University of Science: Research Center for Environmental Technology
Mr. Vu Van Thang

ANNEXES
106Economic Impacts of Sanitation in VietnamA five-country study conducted in Cambodia, Indonesia, Lao PDR, the Philippines and Vietnam under the Economics of Sanitation Initiative (ESI)
Annex D: Data Inputs
Annex Table D1. Defi nition of ‘improved’ and ‘unimproved’ sanitation and water supply
Intervention Improved Unimproved 1
Sanitation • Flush or pour-fl ush to:• Piped sewer system• Septic tank• Pit latrine
• Ventilated Improved Pit-latrine• Pit latrine with slab• Composting toilet
• Flush or pour-fl ush to elsewhere• Pit latrine without slab or open pit• Bucket• Hanging toilet or hanging latrines• No facilities or bush or fi eld
Water supply • Piped water into dwelling, plot, or yard• Public tap / standpipe • Tubewell/borehole • Protected dug well• Protected spring• Rainwater collection
• Unprotected dug well• Unprotected spring• Cart with small tank/drum• Tanker truck • Bottled water• Surface water (river, dam, lake, pond,
stream, canal, irrigation channels)
Source: This table refl ects the updated defi nition of improved and unimproved sanitation and water supply presented in the 2006 JMP report [4]. 1 Defi ned as being unimproved due to being unsafe or costly
Annex Table D2. Sanitation coverage by region and rural/urban grouping
Regions Improved Unimproved Sanitation
House Connection,Septic tank
(Flush/pour-fl ush)
Ventilated improved pit latrine, pit latrine with slab,
composting toilet etc.,
Total Public or share
toilet,Pit latrine without slab etc.,
Open (No facilities)
Other Total
Rural/Urban
Rural 20.5 29.5 50.0 na 16.3 33.7 50.0
Urban 80.8 8.8 89.6 na 3.2 7.2 10.4
Region
Red River Delta 35.1 36.5 71.6 na 3.1 25.3 28.4
North East 18.1 39.8 57.9 na 3.1 39 42.1
North West 12.4 10.4 22.8 na 5.6 71.6 77.2
North Central Coast 19.9 43.9 63.8 na 2.3 33.9 36.2
South Central Coast 62 18.9 80.9 na 0.8 18.3 19.1
Central Highland 33.9 9.0 42.9 na 2.2 54.9 57.1
South East 74.1 4.8 78.9 na 2 19.1 21.1
Mekong River Delta 28.8 2.6 31.4 na 59.1 9.5 68.6
Total 37.2 23.8 61.0 na 12.7 26.3 39.0
Source: VNHLSS 2004
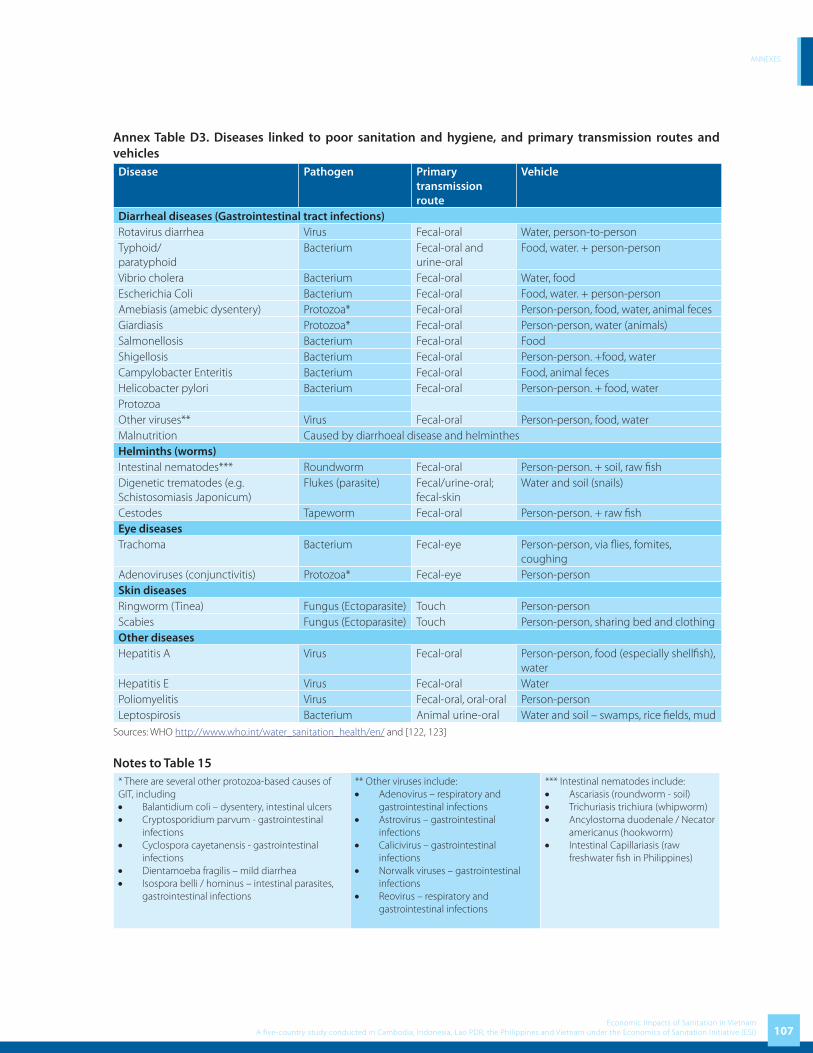
ANNEXES
107Economic Impacts of Sanitation in Vietnam
A five-country study conducted in Cambodia, Indonesia, Lao PDR, the Philippines and Vietnam under the Economics of Sanitation Initiative (ESI)
Annex Table D3. Diseases linked to poor sanitation and hygiene, and primary transmission routes and vehicles
Disease Pathogen Primary transmission route
Vehicle
Diarrheal diseases (Gastrointestinal tract infections)Rotavirus diarrhea Virus Fecal-oral Water, person-to-personTyphoid/paratyphoid
Bacterium Fecal-oral and urine-oral
Food, water. + person-person
Vibrio cholera Bacterium Fecal-oral Water, foodEscherichia Coli Bacterium Fecal-oral Food, water. + person-personAmebiasis (amebic dysentery) Protozoa* Fecal-oral Person-person, food, water, animal fecesGiardiasis Protozoa* Fecal-oral Person-person, water (animals)Salmonellosis Bacterium Fecal-oral FoodShigellosis Bacterium Fecal-oral Person-person. +food, waterCampylobacter Enteritis Bacterium Fecal-oral Food, animal fecesHelicobacter pylori Bacterium Fecal-oral Person-person. + food, waterProtozoaOther viruses** Virus Fecal-oral Person-person, food, waterMalnutrition Caused by diarrhoeal disease and helminthesHelminths (worms)Intestinal nematodes*** Roundworm Fecal-oral Person-person. + soil, raw fi shDigenetic trematodes (e.g. Schistosomiasis Japonicum)
Flukes (parasite) Fecal/urine-oral; fecal-skin
Water and soil (snails)
Cestodes Tapeworm Fecal-oral Person-person. + raw fi shEye diseasesTrachoma Bacterium Fecal-eye Person-person, via fl ies, fomites,
coughingAdenoviruses (conjunctivitis) Protozoa* Fecal-eye Person-person Skin diseasesRingworm (Tinea) Fungus (Ectoparasite) Touch Person-personScabies Fungus (Ectoparasite) Touch Person-person, sharing bed and clothingOther diseasesHepatitis A Virus Fecal-oral Person-person, food (especially shellfi sh),
waterHepatitis E Virus Fecal-oral WaterPoliomyelitis Virus Fecal-oral, oral-oral Person-personLeptospirosis Bacterium Animal urine-oral Water and soil – swamps, rice fi elds, mud
Sources: WHO http://www.who.int/water_sanitation_health/en/ and [122, 123]
Notes to Table 15* There are several other protozoa-based causes of GIT, including• Balantidium coli – dysentery, intestinal ulcers• Cryptosporidium parvum - gastrointestinal
infections• Cyclospora cayetanensis - gastrointestinal
infections• Dientamoeba fragilis – mild diarrhea• Isospora belli / hominus – intestinal parasites,
gastrointestinal infections
** Other viruses include:• Adenovirus – respiratory and
gastrointestinal infections• Astrovirus – gastrointestinal
infections• Calicivirus – gastrointestinal
infections• Norwalk viruses – gastrointestinal
infections• Reovirus – respiratory and
gastrointestinal infections
*** Intestinal nematodes include:• Ascariasis (roundworm - soil)• Trichuriasis trichiura (whipworm)• Ancylostoma duodenale / Necator
americanus (hookworm)• Intestinal Capillariasis (raw
freshwater fi sh in Philippines)

ANNEXES
108Economic Impacts of Sanitation in VietnamA five-country study conducted in Cambodia, Indonesia, Lao PDR, the Philippines and Vietnam under the Economics of Sanitation Initiative (ESI)
Annex Table D4. Health care unit cost studies from the Vietnam
Weighted mean values of direct and indirect costs of rotavirus-specifi c diarrhea in urban and rural Vietnamese health care facilities.
Aspect, type of cost, cost Urban Rural
(Nha Trang)(n = p 60)
(Ninh Hoa)(n = p 30)
1. Hospitalization
1.1 Medical direct costs
Bed cost per day 5.55 1.74
Bed cost per visit1 23.85 8.34
Diagnostics and medicine 3.25 9.25
Sub-total (1.1) 27.09 17.59
1.2 Nonmedical direct costs (transport) 4.74 4.37
1.3 Indirect costs (lost wages) 4.33 9.04
Total (1.1 + 1.2 + 1.3) 36.16 31.00
2. Outpatient visit
2.1 Medical direct costs (cost per visit2)
Hospital outpatient 0.25 0.13
Polyclinic/CHC 0.20 0.17
Private clinic 0.66 0.53
2.1 Diagnostics and medicine3
Hospital outpatient 3.76 3.98
Polyclinic/CHC 2.68 3.00
Private clinic 3.05 3.49
Sub-total: Hospital outpatient (2.1) 4.01 4.11
Sub-total: Polyclinic/CHC (2.1) 2.88 3.17
Sub-total: Private clinic (2.1) 3.71 4.02
2.2 Nonmedical direct costs3
Hospital outpatient 0.58 1.35
Polyclinic/CHC 0.40 0.92
Private clinic 0.47 1.13
2.3 Indirect costs (lost wages)3
Hospital outpatient 1.11 2.75
Polyclinic/CHC 2.48 2.64
Private clinic 4.27 2.70
Total: Hospital outpatient (2.1 + 2.2 + 2.3) 5.70 8.21
Total: Polyclinic/CHC (2.1 + 2.2 + 2.3) 5.76 6.73
Total: Private clinic (2.1 + 2.2 + 2.3) 8.45 7.85
Source: Fischer et al. Health care costs of diarrheal disease and estimates of the cost-eff ectiveness of rotavirus vaccination in Vietnam. Journal of International Development. 2005. 192.1 Calculated by multiplying the bed cost per day by the mean no. of days per stay (4.3 days for Nha Trang and 4.8 days for Ninh Hoa).2 Hospital outpatient (urban, ; rural, ), polyclinic/CHC (urban, np42 np15; rural, ), private clinic (urban, ; rural, ); cost estimates np2 np10 np20 np0; for visits to rural private clinics were extrapolated from costs for visits to urban private clinics by using 80% of the cost of a visit to a public clinic.3 Calculated as the average for rural hospital outpatient and polyclinic/CHC costs.

ANNEXES
109Economic Impacts of Sanitation in Vietnam
A five-country study conducted in Cambodia, Indonesia, Lao PDR, the Philippines and Vietnam under the Economics of Sanitation Initiative (ESI)
An
nex
Tab
le D
5: B
reak
dow
n D
isea
ses
by
Mor
bid
ity
and
Mor
talit
y b
y Re
gio
n
Dis
ease
sIn
cid
ence
/C
ases
Red
Riv
er
Del
taN
orth
Eas
tN
orth
W
est
Nor
th C
entr
al
Coa
stSo
uth
Cen
tral
C
oast
Cen
tral
H
igh
lan
ds
Sout
h E
ast
Mek
ong
R
iver
Del
taTo
tal
Dia
rrhe
alM
orbi
dity
209
,308
10
8,58
3 2
9,76
9 1
23,2
21
81,
797
55,
217
156,
175
200
,351
9
64,4
20
M
orta
lity
9
5
1
5
4
2
7
9
42
Hel
min
ths
Mor
bidi
ty 5
,327
2
,764
7
58
3,1
36
2,0
82
1,4
05
3,9
75
5,0
99
24,
545
M
orta
lity
- -
- -
- -
- -
-
Trac
hom
aM
orbi
dity
112
,595
20
7,16
8 7
4,67
5 3
43,4
83
57,
609
6,3
11
34,
681
146
,147
9
82,6
67
M
orta
lity
- -
- -
- -
- -
-
Scab
ies
Mor
bidi
ty 4
4,73
8 2
3,20
9 6
,363
2
6,33
8 1
7,48
4 1
1,80
2 3
3,38
1 4
2,82
4 2
06,1
37
M
orta
lity
- -
- -
- -
- -
-
Hep
atiti
s A
Mor
bidi
ty 1
,700
8
82
242
1
,001
6
64
449
1
,269
1
,627
7
,834
M
orta
lity
- -
- -
- -
- -
-
Mal
nutr
ition
Mor
bidi
ty 3
40,0
53
235,
212
69,
026
281
,961
1
61,5
92
145
,302
22
5,14
1 3
60,6
50
1,8
18,9
39
M
orta
lity
- -
- -
- -
- -
-
ALR
IM
orbi
dity
60,
320
51,
489
13,
269
39,
701
29,
238
34,
130
174,
633
85,
830
488
,610
M
orta
lity
159
1
79
63
121
1
38
107
1
,454
2
56
2,4
76
Mea
sles
Mor
bidi
ty 1
,771
9
19
252
1
,043
6
92
467
1
,321
1
,695
8
,160
M
orta
lity
- -
- -
- -
- -
-
Mal
aria
Mor
bidi
ty 8
,433
1
8,11
0 1
0,78
1 1
5,22
7 1
2,98
6 1
9,67
7 8
,267
5
,795
9
9,27
6
M
orta
lity
- -
- 1
2
1
3 2
-
18
Tota
lM
orbi
dity
784
,245
64
8,33
4 2
05,1
34
835
,109
3
64,1
45
274
,760
63
8,84
3 8
50,0
19
4,6
00,5
89
M
orta
lity
168
1
83
64
127
1
44
122
1
,462
2
64
2,5
36

ANNEXES
110Economic Impacts of Sanitation in VietnamA five-country study conducted in Cambodia, Indonesia, Lao PDR, the Philippines and Vietnam under the Economics of Sanitation Initiative (ESI)
Annex Table D6: Breakdown of Diseases by AgeDiseases Age Percentage Red River
DeltaNorth East North
WestNorth
Central Coast
South Central Coast
Central Highlands
South East
Mekong River Delta
Total
Diarrheal 0-4 75.00% 156,981 81,437 22,326 92,416 61,348 41,413 117,131 150,264 723,315
5-14 15.00% 31,396 16,287 4,465 18,483 12,270 8,283 23,426 30,053 144,663
15+ 10.00% 20,931 10,858 2,977 12,322 8,180 5,522 15,617 20,035 96,442
Total 209,308 108,583 29,769 123,221 81,797 55,217 156,175 200,351 964,420
Helminths 0-4 70.00% 3,729 1,934 530 2,195 1,457 984 2,782 3,569 17,182
5-14 20.00% 1,065 553 152 627 416 281 795 1,020 4,909
15+ 10.00% 533 276 76 314 208 141 397 510 2,455
Total 5,327 2,764 758 3,136 2,082 1,405 3,975 5,099 24,545
Trachoma 0-4 85.00% 95,705 176,093 63,474 291,960 48,968 5,364 29,479 124,225 835,267
5-14 10.00% 11,259 20,717 7,467 34,348 5,761 631 3,468 14,615 98,267
15+ 5.00% 5,630 10,358 3,734 17,174 2,880 316 1,734 7,307 49,133
Total 112,595 207,168 74,675 343,483 57,609 6,311 34,681 146,147 982,667
Scabies 0-4 75.00% 33,553 17,407 4,772 19,753 13,113 8,852 25,036 32,118 154,603
5-14 15.00% 6,711 3,481 954 3,951 2,623 1,770 5,007 6,424 30,921
15+ 10.00% 4,474 2,321 636 2,634 1,748 1,180 3,338 4,282 20,614
Total 44,738 23,209 6,363 26,338 17,484 11,802 33,381 42,824 206,137
Hepatitis A 0-4 70.00% 1,190 617 169 701 465 314 888 1,139 5,484
5-14 20.00% 340 176 48 200 133 90 254 325 1,567
15+ 10.00% 170 88 24 100 66 45 127 163 783
Total 1,700 882 242 1,001 664 449 1,269 1,627 7,834
Malnutrition 0-4 90.00% 306,048 211,691 62,124 253,765 145,433 130,772 202,627 324,585 1,637,045
5-14 10.00% 34,005 23,521 6,903 28,196 16,159 14,530 22,514 36,065 181,894
15+ 0.00% - - - - - - - - -
Total 340,053 235,212 69,026 281,961 161,592 145,302 225,141 360,650 1,818,939
ALRI 0-4 70.00% 42,224 36,042 9,288 27,790 20,467 23,891 122,243 60,081 342,027
5-14 20.00% 12,064 10,298 2,654 7,940 5,848 6,826 34,927 17,166 97,722
15+ 10.00% 6,032 5,149 1,327 3,970 2,924 3,413 17,463 8,583 48,861
Total 60,320 51,489 13,269 39,701 29,238 34,130 174,633 85,830 488,610
Measles 0-4 85.00% 1,505 781 214 886 588 397 1,123 1,441 6,936
5-14 10.00% 177 92 25 104 69 47 132 170 816
15+ 5.00% 89 46 13 52 35 23 66 85 408
Total 1,771 919 252 1,043 692 467 1,321 1,695 8,160
Malaria 0-4 60.00% 5,060 10,866 6,469 9,136 7,792 11,806 4,960 3,477 59,566
5-14 25.00% 2,108 4,528 2,695 3,807 3,247 4,919 2,067 1,449 24,819
15+ 15.00% 1,265 2,717 1,617 2,284 1,948 2,952 1,240 869 14,891
Total 8,433 18,110 10,781 15,227 12,986 19,677 8,267 5,795 99,276
Total 0-4 645,996 536,868 698,602 299,630 223,792 506,270 700,899 3,781,424
5-14 99,126 79,653 25,364 97,657 46,525 37,377 92,590 107,286 585,577
15+ 39,123 31,813 10,403 38,850 17,989 13,591 39,983 41,835 233,587
Total 784,245 648,334 835,109 364,145 274,760 638,843 850,019 4,600,589

ANNEXES
111Economic Impacts of Sanitation in Vietnam
A five-country study conducted in Cambodia, Indonesia, Lao PDR, the Philippines and Vietnam under the Economics of Sanitation Initiative (ESI)
An
nex
Tab
le D
7: B
reak
dow
n D
isea
ses
by
Reg
ion
Dis
ease
sRe
gio
nRe
d R
iver
D
elta
Nor
th E
ast
Nor
th W
est
Nor
th C
entr
al
Coa
stSo
uth
Cen
tral
C
oast
Cen
tral
H
igh
lan
ds
Sout
h E
ast
Mek
ong
Riv
er
Del
taTo
tal
Dia
rrhe
alU
rban
52,
030
20,
512
4,1
46
16,
887
24,
629
15,
508
85,
025
41,
379
260
,116
Ru
ral
157
,278
8
8,07
0 2
5,62
3 1
06,3
34
57,
169
39,
709
71,
150
158
,972
7
04,3
04
To
tal
209
,308
1
08,5
83
29,
769
123
,221
8
1,79
7 5
5,21
7 1
56,1
75
200
,351
9
64,4
20
Hel
min
ths
Urb
an 1
,324
5
22
106
4
30
627
3
95
2,1
64
1,0
53
6,6
20
Ru
ral
4,0
03
2,2
41
652
2
,706
1
,455
1
,011
1
,811
4
,046
1
7,92
5
To
tal
5,3
27
2,7
64
758
3
,136
2
,082
1
,405
3
,975
5
,099
2
4,54
5
Trac
hom
aU
rban
27,
989
39,
136
10,
400
47,
072
17,
346
1,7
72
18,
881
30,
184
192
,780
Ru
ral
84,
606
168
,032
6
4,27
5 2
96,4
11
40,
264
4,5
38
15,
800
115
,962
7
89,8
87
To
tal
112
,595
2
07,1
68
74,
675
343
,483
5
7,60
9 6
,311
3
4,68
1 1
46,1
47
982
,667
Scab
ies
Urb
an 1
1,12
1 4
,384
8
86
3,6
09
5,2
64
3,3
15
18,
174
8,8
45
55,
598
Ru
ral
33,
617
18,
824
5,4
77
22,
728
12,
219
8,4
87
15,
208
33,
979
150
,540
To
tal
44,
738
23,
209
6,3
63
26,
338
17,
484
11,
802
33,
381
42,
824
206
,137
Hep
atiti
s A
Urb
an 4
23
167
3
4 1
37
200
1
26
691
3
36
2,1
13
Ru
ral
1,2
78
715
2
08
864
4
64
323
5
78
1,2
91
5,7
21
To
tal
1,7
00
882
2
42
1,0
01
664
4
49
1,2
69
1,6
27
7,8
34
Mal
nutr
ition
Urb
an 8
4,53
1 4
4,43
4 9
,613
3
8,64
1 4
8,65
4 4
0,81
0 1
22,5
72
74,
487
463
,742
Ru
ral
255
,523
1
90,7
79
59,
413
243
,320
1
12,9
38
104
,492
1
02,5
69
286
,164
1
,355
,197
To
tal
340
,053
2
35,2
12
69,
026
281
,961
1
61,5
92
145
,302
2
25,1
41
360
,650
1
,818
,939
ALR
IU
rban
14,
994
9,7
27
1,8
48
5,4
41
8,8
03
9,5
86
95,
075
17,
727
163
,201
Ru
ral
45,
326
41,
762
11,
421
34,
260
20,
435
24,
544
79,
559
68,
103
325
,410
To
tal
60,
320
51,
489
13,
269
39,
701
29,
238
34,
130
174
,633
8
5,83
0 4
88,6
10
Mea
sles
Urb
an 4
40
174
3
5 1
43
208
1
31
719
3
50
2,2
01
Ru
ral
1,3
31
745
2
17
900
4
84
336
6
02
1,3
45
5,9
59
To
tal
1,7
71
919
2
52
1,0
43
692
4
67
1,3
21
1,6
95
8,1
60
Mal
aria
Urb
an 2
,096
3
,421
1
,501
2
,087
3
,910
5
,527
4
,501
1
,197
2
4,24
0
Ru
ral
6,3
37
14,
689
9,2
80
13,
140
9,0
76
14,
150
3,7
66
4,5
98
75,
036
To
tal
8,4
33
18,
110
10,
781
15,
227
12,
986
19,
677
8,2
67
5,7
95
99,
276
Tota
lU
rban
194
,948
1
22,4
77
28,
569
114
,446
1
09,6
42
77,
169
347
,801
1
75,5
58
1,1
70,6
10
Ru
ral
589
,297
5
25,8
58
176
,565
7
20,6
63
254
,503
1
97,5
90
291
,042
6
74,4
61
3,4
29,9
79
To
tal
784
,245
6
48,3
34
205
,134
8
35,1
09
364
,145
2
74,7
60
638
,843
8
50,0
19
4,6
00,5
89

ANNEXES
112Economic Impacts of Sanitation in VietnamA five-country study conducted in Cambodia, Indonesia, Lao PDR, the Philippines and Vietnam under the Economics of Sanitation Initiative (ESI)
Annex Table D8: Sources of drinking water for households, 2004
Source of water (%)
Private tap
Public standpipe
Buying water
Deep drill well with
pump
Hand dug well,
Filtered Spring water
Other well
Rain water
River, lake,
spring,pond
Others
WHOLE COUNTRY
15.32 3.76 0.54 23.02 22.75 0.58 8.45 14.76 7.40 3.42
By area
Urban 49.82 7.14 1.10 18.90 10.94 0.16 4.17 4.67 2.06 1.04
Rural 3.71 2.63 0.34 24.40 26.72 0.72 9.90 18.16 9.20 4.22
By region
Red River Delta 17.46 1.58 0.23 29.62 12.21 0.07 0.42 37.89 0.19 0.33
North East 9.78 2.26 0.07 7.75 47.88 0.85 13.92 2.49 3.43 11.57
North West 7.15 3.29 0.00 1.05 23.55 6.10 13.98 2.04 5.41 37.43
North Central Coast
9.36 1.35 0.10 19.96 50.07 0.72 7.97 6.11 0.77 3.59
South Central Coast
12.96 2.91 0.41 23.81 48.85 0.28 7.62 0.00 1.32 1.84
Central Highland
10.04 1.75 0.13 2.38 22.33 1.49 52.06 1.10 3.62 5.10
South East 30.01 5.62 2.23 34.51 10.57 0.41 13.47 0.98 1.15 1.05
Mekong River Delta
12.10 8.31 0.40 24.65 1.29 0.27 0.70 21.13 31.05 0.10
Source: Vietnam Household Living Standard Survey 2004
Annex Table D9: Water quality – Fresh-water quality guidelines for protection of aquatic lifeStandard Detail Information(TCVN 6774:2000)
Standard Code: TCVN 6774:2000
Standard Name: Water quality – Fresh-water quality guidelines for protection of aquatic life
Year of Issuance: 2000
Category: Water quality
Type: Fresh-water quality for protection of aquatic life
Content: Water quality standard

ANNEXES
113Economic Impacts of Sanitation in Vietnam
A five-country study conducted in Cambodia, Indonesia, Lao PDR, the Philippines and Vietnam under the Economics of Sanitation Initiative (ESI)
Maximum value
No. Name Formula Unit A B C D
1 2,4,5T - mg/l <=0.16
2 2,4D - mg/l <=0.45
3 Aldrin/Dielrin - ug/l (microgam) <0.008
4 Amoniac NH3 mg/l <=2.2 <=1.33 <=1.49 <=0.93
5 Asen As mg/l <=0.02
6 B.H.C - ug/l (microgam) <0.13
7 Cacbondioxit CO2 mg/l <12
8 Cadimi Cd ug/l (microgam) 0.8-1.8
9 - mg/l <=05
10 TDS mg/l <=1000
11 Suspended solid SS mg/l <100
12 Lead Pb mg/l 0.002-0.007
13 Clordan - ug/l (microgam) 0.02
14 Crom Cr mg/l <=0.02
15 Grease - - not observable
16 DDT DDT ug/l (microgam) 0.004
17 Copper Cu mg/l 0.002-0.004
18 Endosulfan - ug/l (microgam) 0.01
19 Endrin - ug/l (microgam) <0.014
20 Heptaclo - ug/l (microgam) 0.06
21 Lindan - ug/l (microgam) 0.38
22 Malation - ug/l (microgam) <=0.32
23 Temperature to oC Natural temperature
24Biological Oxygennn Demand
BOD5 mg/l <10
25 Dissolved Oxygen DO mg/l 5
26 Paraquat - mg/l <=1.80
27 Paration - ug/l (microgam) <=0.40
28 pH pH - 6.5-8.5
29 Phenol - mg/l <=0.02
30 Selen Se mg/l <=0.001
31 Mercury Hg ug/l (microgam) <=0.1
32 Cyanide CN- mg/l <=0.005
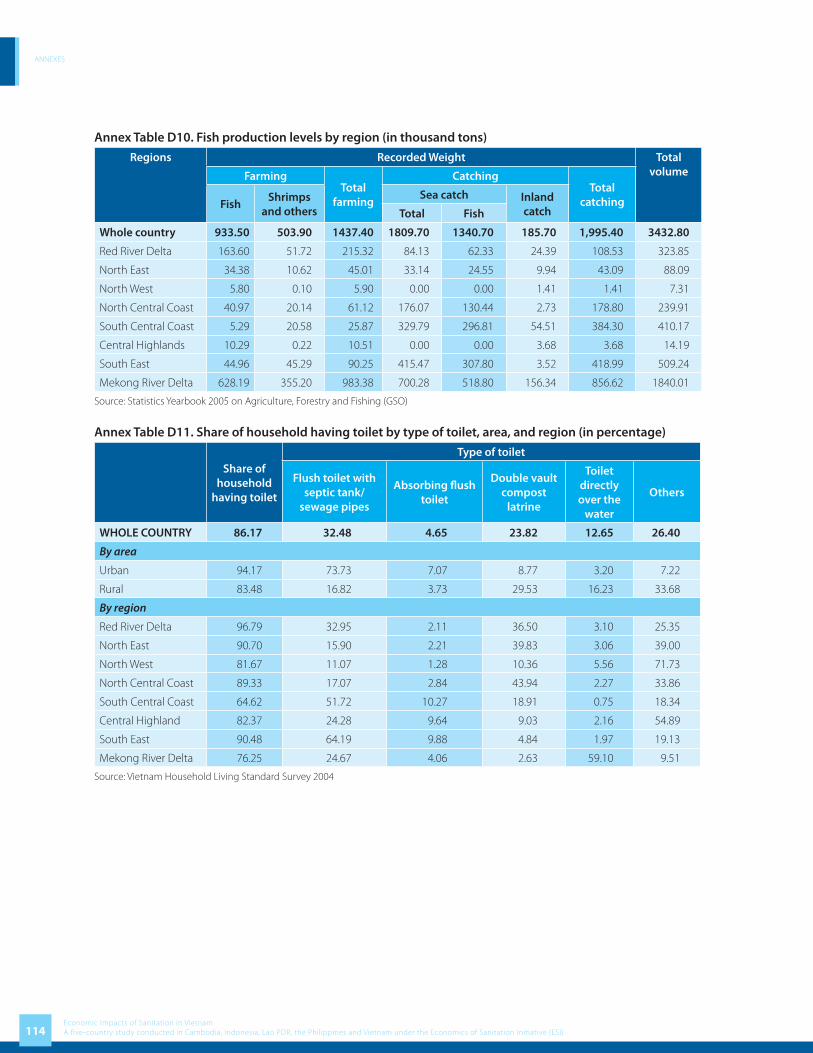
ANNEXES
114Economic Impacts of Sanitation in VietnamA five-country study conducted in Cambodia, Indonesia, Lao PDR, the Philippines and Vietnam under the Economics of Sanitation Initiative (ESI)
Annex Table D10. Fish production levels by region (in thousand tons)
Regions Recorded Weight Total volumeFarming
Total farming
CatchingTotal
catchingFishShrimps
and othersSea catch Inland
catchTotal Fish
Whole country 933.50 503.90 1437.40 1809.70 1340.70 185.70 1,995.40 3432.80
Red River Delta 163.60 51.72 215.32 84.13 62.33 24.39 108.53 323.85
North East 34.38 10.62 45.01 33.14 24.55 9.94 43.09 88.09
North West 5.80 0.10 5.90 0.00 0.00 1.41 1.41 7.31
North Central Coast 40.97 20.14 61.12 176.07 130.44 2.73 178.80 239.91
South Central Coast 5.29 20.58 25.87 329.79 296.81 54.51 384.30 410.17
Central Highlands 10.29 0.22 10.51 0.00 0.00 3.68 3.68 14.19
South East 44.96 45.29 90.25 415.47 307.80 3.52 418.99 509.24
Mekong River Delta 628.19 355.20 983.38 700.28 518.80 156.34 856.62 1840.01
Source: Statistics Yearbook 2005 on Agriculture, Forestry and Fishing (GSO)
Annex Table D11. Share of household having toilet by type of toilet, area, and region (in percentage)
Share of household
having toilet
Type of toilet
Flush toilet with septic tank/
sewage pipes
Absorbing fl ush toilet
Double vault compost
latrine
Toilet directly over the
water
Others
WHOLE COUNTRY 86.17 32.48 4.65 23.82 12.65 26.40
By area
Urban 94.17 73.73 7.07 8.77 3.20 7.22
Rural 83.48 16.82 3.73 29.53 16.23 33.68
By region
Red River Delta 96.79 32.95 2.11 36.50 3.10 25.35
North East 90.70 15.90 2.21 39.83 3.06 39.00
North West 81.67 11.07 1.28 10.36 5.56 71.73
North Central Coast 89.33 17.07 2.84 43.94 2.27 33.86
South Central Coast 64.62 51.72 10.27 18.91 0.75 18.34
Central Highland 82.37 24.28 9.64 9.03 2.16 54.89
South East 90.48 64.19 9.88 4.84 1.97 19.13
Mekong River Delta 76.25 24.67 4.06 2.63 59.10 9.51
Source: Vietnam Household Living Standard Survey 2004

ANNEXES
115Economic Impacts of Sanitation in Vietnam
A five-country study conducted in Cambodia, Indonesia, Lao PDR, the Philippines and Vietnam under the Economics of Sanitation Initiative (ESI)
Annex Table D12. Percentage of household using latrines and types of latrines
Percentage of household using latrine by region (urban area)
Region Separately using Sharing Did not have Total
Red River Delta 84.18 15.37 0.44 100.00
Northeast 88.98 8.21 2.90 100.00
Northwest 91.84 6.95 1.21 100.00
North Central Coast 86.04 9.10 4.86 100.00
South Central Coast 79.08 6.04 14.88 100.00
Central Highlands 90.96 4.88 4.16 100.00
Southeast 89.16 7.92 2.92 100.00
Mekong Delta 61.81 35.25 2.95 100.00
Total 82.91 13.31 3.78 100.00
Percentage of households using latrine by regions (rural area)
Region Separately using Sharing Did not have Total
Red River Delta 84.9 14.0 1.2 100.00
Northeast 75.6 7.9 16.5 100.00
Northwest 69.0 4.9 26.1 100.00
North Central Coast 76.4 12.2 11.4 100.00
South Central Coast 40.4 6.1 53.5 100.00
Central Highlands 69.1 3.8 27.1 100.00
Southeast 74.0 10.4 15.7 100.00
Mekong Delta 52.2 40.0 7.8 100.00
Total 69.4 17.1 13.5 100.00
Source: National Health Survey 2001 – 2002
Annex Table D13. Cottage villages and their waste
Sector Food Recycled waste Pottery, Porcelain and construction
material
Textile, silk germination,
leather
Fine arts and craft
AreaPaper
recyclingPlastic
recyclingMetal
recycling
The North 134 4 5 53 30 138 387
Central 42 23 23 24 103
The South 21 1 5 26 11 77
Total 197 4 6 81 79 173 567
Source: NEPA, MONRE 2003

ANNEXES
116Economic Impacts of Sanitation in VietnamA five-country study conducted in Cambodia, Indonesia, Lao PDR, the Philippines and Vietnam under the Economics of Sanitation Initiative (ESI)
Annex Box D1. Waste from cottage villages
Art wooden object producing
village (broken wood, sawdust, solvent containers)
Weaving -Dying village (small piece of material, dying
chemical containers, detergent containers)
Plastic recycling village (mix plastic waste, coal residue)
Other professional villages (villages making broom from poultry feather; votive paper
production, construction material production
Food processing villages (cassava fiber, starch, bulb
pilling)
Paper recycling villages (packaging material, nylon,
label)
Mechanical and metal recycling villages (mixed
metal, plastic, metal sludge, ash)
SOLID WASTE FROM
COTTAGE VILLAGES

ANNEXES
117Economic Impacts of Sanitation in Vietnam
A five-country study conducted in Cambodia, Indonesia, Lao PDR, the Philippines and Vietnam under the Economics of Sanitation Initiative (ESI)
Annex E: ResultsSelected water quality measurements in rural area by region in 2006
Annex Table E1. Average pH by region and source of water
Region Drilled well Dug well Rain water Surface water Tap water General
Red River Delta 7.32 7.44 7.55 7.09 7.17 7.36
North East 7.38 6.63 7.39 6.91
North West 7.32 6.58 6.83 7.43 7.8 6.89
North Central Coast 6.76 6.79 6.99 7.54 7.14 6.79
South Central Coast 6.55 6.67 6.73 7.31 6.67
Central Highlands 7.4 6.07 6.89 7.39 6.22
South East 4.86 6.16 6.68 7.16 5.79
Mekong River Delta 7.02 7.38 7 7.73 7.18 7
Nationwide 6.49 6.53 7.15 7.19 7.21 6.7
Source: Report on Vietnam Rural Domestic Water Quality 2007.
Annex Table E2. Average Nitrite level by region and source of water (mg/l)
Region Drilled well Dug well Rain water Surface water Tap water General
Red River Delta 0.13 0.12 0 0.1 0.02 0.1
North East 0.06 0 0 0.01
North West 0.01 0.02 0 0 0.01 0.02
North Central Coast 0.04 0.02 0 0 0 0.03
South Central Coast 0.11 0.13 0.03 0.01 0.12
Central Highlands 0.01 0.02 0.1 0.04 0.02
South East 0 0.01 0.04 0 0
Mekong River Delta 0.02 0.04 0 0.03 0.01 0.01
Nationwide 0.06 0.05 0.01 0.02 0.01 0.04
Source: Report on Vietnam Rural Domestic Water Quality 2007.
Annex Table E3. Average Nitrate level by region and source of water (mg/l)
Region Drilled well Dug well Rain water Surface water Tap water General
Red River Delta 4.28 5.61 1.89 1.71 2.53 4.07
North East 2.11 5.72 1.29 4.15
North West 3.9 4.38 2.41 1.66 2.3 3.51
North Central Coast 4.57 8.09 2.57 11.14 2.38 6.19
South Central Coast 7.04 22.01 8.73 0.54 17.2
Central Highlands 19.03 10.29 0.87 2.13 10.31
South East 3.36 20.59 2.28 0.83 6.84
Mekong River Delta 0.35 1.05 1.51 1.84 0.81 1.24
Nationwide 4.68 10.76 1.85 1.61 1.02 6.68
Source: Report on Vietnam Rural Domestic Water Quality 2007.

ANNEXES
118Economic Impacts of Sanitation in VietnamA five-country study conducted in Cambodia, Indonesia, Lao PDR, the Philippines and Vietnam under the Economics of Sanitation Initiative (ESI)
Annex Table E4. Average Amoni level by region and source of water (mg/l)
Region Drilled well Dug well Rain water Surface water Tap water General
Red River Delta 2.59 1.92 0.38 0.62 0.72 2
North East 0.52 0.49 0.43 0.48
North West 0.91 0.59 0.42 0.53 0.42 0.57
North Central Coast 0.53 0.46 0.4 0.49 0.25 0.49
South Central Coast 0.68 0.05 0.01 0.04 0.21
Central Highlands 0.02 0.01 0.52 0.1 0.2
South East 0.09 0.06 0.12 0.02 0.06
Mekong River Delta 0.84 0.56 0.11 0.33 0.06 0.2
Nationwide 1.03 0.36 0.25 0.4 0.11 0.5
Source: Report on Vietnam Rural Domestic Water Quality 2007.
Annex Table E5. Average dissolved oxygen level by region and source of water (mg/l)
Region Drilled well Dug well Rain water Surface water Tap water General
Red River Delta 6.85 7.8 1.08 7.76 4.34 6.17
North East 0.18 0.51 0.31 0.42
North West 0.23 0.78 0.32 0.34 0.1 0.61
North Central Coast 2.34 2.5 1.26 8.16 0.32 2.36
South Central Coast 1.7 1.16 0.2 1.01 1.29
Central Highlands 0.61 0.74 3.53 3.33 0.88
South East 0.14 0.44 0.73 0.22 0.24
Mekong River Delta 1.02 2.28 1.19 1.59 1.36 1.38
Nationwide 2.81 1.38 1.17 1.15 1.09 1.67
Source: Report on Vietnam Rural Domestic Water Quality 2007.
Annex Table E6. Average Clorua level by region and source of water (mg/l)
Region Drilled well Dug well Rain water Surface water Tap water General
Red River Delta 239.6 329.3 11.9 65.1 141.4 217.1
North East 17.5 29.3 10.9 23.2
North West 22 27.9 11.4 8.9 9.2 21.6
North Central Coast 84.7 81.3 14.2 56.8 19.9 78.2
South Central Coast 87.4 96.5 36.9 10.1 90.5
Central Highlands 26.6 13.1 0.6 3 13.3
South East 13.1 36.3 10.8 9.6 17.8
Mekong River Delta 277.3 147.3 3.7 9.5 63.1 48.4
Nationwide 112.6 61.5 8.3 11.4 47.2 63.8
Source: Report on Vietnam Rural Domestic Water Quality 2007.

ANNEXES
119Economic Impacts of Sanitation in Vietnam
A five-country study conducted in Cambodia, Indonesia, Lao PDR, the Philippines and Vietnam under the Economics of Sanitation Initiative (ESI)
Annex Table E7. Average Iron (Fe) level by region and source of water (mg/l)
Region Drilled well Dug well Rain water Surface water Tap water General
Red River Delta 1.02 1.08 0.04 0.46 0.06 0.83
North East 0.13 0.13 0.08 0.12
North West 0.03 0.16 0.04 0.09 0.03 0.13
North Central Coast 0.72 0.74 0.08 0.02 0.34 0.69
South Central Coast 0.39 0.04 0.01 0.04 0.13
Central Highlands 0.04 0.14 0.05 1.12 0.18
South East 0.1 0.04 0.01 0.01 0.06
Mekong River Delta 0.3 0.13 0.01 0.35 0.2 0.21
Nationwide 0.54 0.25 0.03 0.23 0.12 0.29
Source: Report on Vietnam Rural Domestic Water Quality 2007.

ANNEXES
120Economic Impacts of Sanitation in VietnamA five-country study conducted in Cambodia, Indonesia, Lao PDR, the Philippines and Vietnam under the Economics of Sanitation Initiative (ESI)
Annex F: References
1. Esty DC, Cornelius PK. Environmental performance measurement: the global report 2001-2002. 2002. An initiative of World Economic Forum Global Leaders for Tomorrow Environment Task Force.
2. United Nations. State of the Environment in Asia and the Pacifi c. 2000. Economic and Social Commission for Asia and the Pacifi c, Asian Development Bank.
3. Ministry of Natural Resources and the Environment. Vietnam Environment Report 2006. 2007.4. WHO/UNICEF/JMP. Meeting the MDG Drinking Water and Sanitation target: the urban and rural challenge of
the decade. 2006. Joint Monitoring Programme. World Health Organization, Geneva; and the United Nations Children’s Fund, New York.
5. GSO. Result of the Survey on Households Living Standards 2004. 2006.6. World Bank. Water Supply and Sanitation Strategy - Building on a solid foundation. 2006.7. World Bank. Vietnam Environment Monitoring 2004 Series - Solid Waste. 2004.8. Ministry of Health. Vietnam National Health Survey 2001 - 2002. 2002.9. Water and Sanitation Program. A Proposal to develop a Unifi ed Sanitation Sector Strategy and Action Plan (U3SAP
Vietnam). 2007.10. Huong ND. Economics of solid waste from various sources. 2006.11. World Health Organization. Macroeconomics and health: investing in health for economic development. 2001.
Commission on Macroeconomics and Health. 12. Harrington W, Krupnick AJ, Spotford WO. The economic losses of a waterborne disease outbreak. Journal of
Urban Economics. 1989. 25: p. 116-137.13. Levy B, McIntire W. The economic impact of a food-borne salmonellosis outbreak. Journal of the American
Medical Association. 1974. 230: 1281-2.14. United Nations. Water for people, water for life. 2003. World Water Development Report. UN World Water
Assessment Programme. Published by UNESCO and Berghahn Books.15. Hutton G, Haller L. Evaluation of the non-health costs and benefi ts of water and sanitation improvements at global
level. 2004. World Health Organization. WHO/SDE/WSH/04.04.16. United Nations Children’s’ Fund and International Red Cross. Water, Sanitation and Hygiene Education for
Schools. Roundtable Meeting. 2005. Oxford, UK.17. Giannico L. Prevention of the most frequent communicable diseases in tourists, in Tourist Health: A New Branch of
Public Health. Editor: Pasini W. 1988. Volume I, Rimini, Italy; IATM/WHO/WTO.18. Zampieri A. Epidemiology of infections in tourists, in Tourist Health: A New Branch of Public Health. Editor: Pasini
W. 1988. Volume I, Rimini, Italy; IATM/WHO/WTO.19. Frechtling D. Annoted Bibliography on Health and Tourism Issues. 1992. Washington DC: International Institute
of Tourism Studies/The George Washington University.20. Borba M-L, Smet J, Sijbesma C. Enhancing livelihoods through sanitation. 2007. Thematic Overview Paper 19.
IRC International Water and Sanitation Centre.21. Hutton G. Evaluation of the Economic Impacts of Sanitation: Methodology and Guideline. 2007. World Bank,
Water and Sanitation Program. 103 pages.22. Hutton G, Rodriguez UE, Napitupulu L, Thang P, Kov P. Economic impacts of sanitation in Southeast Asia. 2008.
World Bank, Water and Sanitation Program. 23. General Statistics Offi ce. Statistic Yearbook. 2005.24. Hutton G, Haller L. Manual for Conducting Economic Evaluation of Water and Sanitation Interventions in China.
2006. World Health Organization.25. World Bank. Vietnam Environment Monitor 2003 Series - Water. 2003.26. Water and Sanitation Program. Selling Sanitation in Vietnam - What works? 2002.27. Water and Sanitation Program. Vietnam National Handwashing Initiative Consumer Research Results Presentation
2007.28. World Bank. Vietnam Gender Assessment. 2006.29. Maclaren MVW et al. Gender and Waste Management. 2003.

ANNEXES
121Economic Impacts of Sanitation in Vietnam
A five-country study conducted in Cambodia, Indonesia, Lao PDR, the Philippines and Vietnam under the Economics of Sanitation Initiative (ESI)
30. Rural Water Supply, Sanitation and Health in Vietnam - Sector Status Report. 2005.31. Prüss A et al. Estimating the global burden of disease from water, sanitation, and hygiene at the global level.
Environmental Health Perspectives. 2002. 110(5): 537-542.32. Prüss-Üstün A et al. Unsafe water, sanitation and hygiene, in Comparative Quantifi cation of Health Risks: Global
and Regional Burden of Disease due to Selected Major Risk Factors. Editors: Ezzati M et al. 2004. World Health Organization: Geneva.
33. Wagner E, Lanoix J. Excreta disposal for rural areas and small communities. 1958. World Health Organization. Monograph series No.39: Geneva.
34. Frick K. Estimating the burden of trachomatous visual loss. Ophthalmic Epidemiology, 2003.35. International Trachoma Initiative. Survey on trachoma prevalence in Vietnam. 2007.36. Ministry of Health. Health Statistic Book 2005. 2006.37. Ministry of Health. The case-based provider payment mechanism from the perspective of the health system in
Vietnam. 2007.38. Fishman S et al. Childhood and Maternal Underweight, in Comparative Quantifi cation of Health Risks: Global and
Regional Burden of Disease due to Selected Major Risk Factors. Editors: Ezzati M et al. 2004.39. Fischer TK, Lynn Antil DDA, Cat NDL, Kilgore PE, Thiem VD, Rheingans R, Tho RIG, Bresee JS. Health Care Costs
of Diarrheal Disease and Estimates of the Cost-Eff ectiveness of Rotavirus Vaccination in Vietnam. 2005.40. Begoña A, Hanley N, Barberán R. The value of leisure time: a contingent rating approach. Journal of Environmental
Planning and Management. 2001. 44(5): 681-99.41. Isley P, Rosenman R. Using revealed preference to evaluate the reservation wage and the value of leisure. Litigation
Economics Digest. 1998. 3(1): 61-7.42. Lee K, Kim I. Estimating the value of leisure time in Korea. Applied Economics Letters. 2005. 12: 639-41.43. Shaw M. Value of leisure time based on individuals’ mode choice behavior. Journal of Advanced Transportation.
2004. 38(2): 147-62.44. Organisation for Economic Co-operation and Development. Economic Valuation of Environmental Health Risks
to Children. 2006. OECD: Paris.45. Hutton G, Haller L, Bartram J. Global cost-benefi t analysis of water supply and sanitation interventions. Journal of
Water and Health. 2007. 5(4): 481-502.46. The role of nutrition in economic development. Nutrition Reviews. 1996. 54:S66-71.47. Economic Growth, Population Theory, and Physiology: the Bearing of Long-Term Processes on the Making of
Economic Policy. The American Economic Review. 1994. 84:369-395.48. Minh et al. The consequences of malnutrition in Vietnam. 2007.49. Brannon I. What is a life worth? Regulation. 2004.50. Abelson P. The value of life and health for public policy. The Economic Record. 2003. 79(Special Issue 1): s2-s13.51. Jones-Lee M (editor). The value of life and safety. 1982. North-Holland Publishing Co.: Amsterdam.52. Bateman IJ et al. Benefi ts transfer in theory and practice: a review. 2000, CSERGE Working Paper GEC 2000-25.
Centre for Social and Economic Research on the Global Environment, University of East Anglia 53. Persson U. The value of statistical life in transport: fi ndings from a new contingent valuation study in Sweden.
Journal of Risk and Uncertainty. 2001. 23(2): 121-34.54. Smith SV. Jury verdicts and the dollar value of human life. Journal of Forensic Economics. 2000. 13(2): 169-88.55. Georges D, Lanoie P. How to make a public choice about the value of a statistical life: the case of road safety. 2002,
Working Paper 02-02. École des Hautes Études Commerciales (HEC) Montréal.56. Baranzini A, Ferro Luzzi G. The economic value of risks to life: evidence from the Swiss labour market. Swiss Journal
of Economics and Statistics. 2001. 137(2): 149-70.57. Perreira KM, Sloan FA. Living healthy and living long: valuing the nonpecuniary loss from disability and death.
Journal of Risk and Uncertainty. 2002. 24(1): 5-29.58. Bellavance F, Dionne G, Lebeau M. The value of a statistical life: a meta-analysis with a mixed eff ects regression
model. 2007. Canada Research Chair in Risk Management; Working Paper 06-12.59. Kochi I et al. An empirical Bayes approach to combining and comparing estimates of the value of a statistical life
for environmental policy analysis. Environmental and Resource Economics,.2006. 34: 385-406.

ANNEXES
122Economic Impacts of Sanitation in VietnamA five-country study conducted in Cambodia, Indonesia, Lao PDR, the Philippines and Vietnam under the Economics of Sanitation Initiative (ESI)
60. Madheswaran S, Shanmugam KR. Impact of trade unions on the compensation for job risks: evidence from the Indian labor market. International Review of Economics and Business. 2006. 50(1): 121-41.
61. Mrozek J et al. What determines the value of life? A Meta Analysis. Journal of Policy Analysis and Management. 2002. 21(2): 253-70.
62. Black R, Brown K, Becker S. Eff ects of diarrhea associated with specifi c enteropathogens on the growth of children in rural Bangladesh. Pediatrics. 1984. 73: 799-805.
63. Bairagi R et al. The association between malnutrition and diarrhoea in rural Bangladesh. International Journal of Epidemiology. 1987. 16(3): 477-81.
64. Becker S, Black R, Brown K. Relative eff ects of diarrhea, fever, and dietary energy intake on weight gain in rural Bangladeshi children. American Journal of Clinical Nutrition. 1991. 53: 1499-1503.
65. Rowland M, Cole T, Whitehead R. A quantitative study into the role of infection in determining nutritional status in Gambian village children. British Journal of Nutrition. 1977. 37: 441-50.
66. Rowland M, Rowland S, Cole T. Impact of infection on the growth of children from 0 to 2 years in an urban West African community. American Journal of Clinical Nutrition. 1988. 47: 134-8.
67. Martorell R et al. Acute morbidity and physical growth in rural Guatemalan children. Pediatrics. 1975. 129: 1296-1301.
68. Molbak K et al. Cryptosporidium infection in infancy as a cause of malnutrition: a community study from Guinea-Bissau, West Africa. Am J Clin Nutr. 1997. 65(1): 149-52.
69. Kolsteren P, Kusin J, Kardjati S. Morbidity and growth performance of infants in Madura, Indonesia. Annales Tropical Pediatrics. 1997. 17(3): 201-8.
70. Condon-Paoloni D et al. Morbidity and growth of infants and young children in a rural Mexican village. American Journal of Public Health. 1977. 67: 651-6.
71. Checkley W et al. Asymptomatic and symptomatic cryptosporidiosis: Their acute eff ect on weight gain in Peruvian Children. American Journal of Epidemiology. 1997. 145: 156-163.
72. Adair L et al. Growth dynamics during the fi rst two years of life: a prospective study in the Philippines. European Journal of Clinical Nutrition. 1993. 47(1): 42-51.
73. Zumrawi F, Dimond H, t al. Eff ects of infection on growth in Sudanese children. Human Nutrition and Clinical Nutrition. 1987. 41: 453-61.
74. Villamor E et al. Human immunodefi ciency virus infection, diarrheal disease and sociodemographic predictors of child growth. 2004. 93 (3): 372-9.
75. Fishman S et al. Childhood and Maternal Underweight, in Comparative Quantifi cation of Health Risks: Global and Regional Burden of Disease due to Selected Major Risk Factors. Ezzati M, Rodgers A, Lopez A and Murray C (Editors). 2004.
76. Larsen B. Cost of environmental health risk in children under 5: Accounting for malnutrition in Ghana and Pakistan. Background report prepared for the World Bank study on malnutrition and environmental health. 2007. World Bank: Washington DC.
77. Philippines sanitation sourcebook and decision aid. 2005. Government of the Philippines, WSP-EAP, GTZ, Government of Australia.
78. Anon. Proceedings of the 6th International Conference on Diff use Pollution, Amsterdam, Sept 30 - Oct 4 2002. Organized by the International Water Association (IWA) in cooperation with the Netherlands Association on Water Management (NWA) and Aquatech. 2002.
79. World Health Organization. Minimum water quantity needed for domestic uses. 2005. WHO/SEARO Technical Notes for Emergencies; Technical Note No. 9; WHO Regional Offi ce for Southeast Asia.
80. Abromovitz J. Imperiled waters, impoverished future: the decline of freshwater ecosystems. 1996. Worldwatch Paper No. 128. 80 pages. Worldwatch Institute.
81. Calamari D, Naeve H (editors). Review of pollution in the African aquatic environment. 1994. Committee for Inland Fisheries of Africa Technical Paper. No. 25. 118 pages. FAO: Rome
82. Gupta M. Challenges in sustaining and increasing fi sh production to combat hunger and poverty in Asia. 2006. NAGA, WorldFish Center Quarterly Vol. 29 No. 1 & 2.
ANNEXES
123Economic Impacts of Sanitation in Vietnam
A five-country study conducted in Cambodia, Indonesia, Lao PDR, the Philippines and Vietnam under the Economics of Sanitation Initiative (ESI)
83. Food and Agriculture Organization. An evaluation of small-scale rural aquaculture development for poverty reduction. 2005. Food and Agriculture Organization: Technical Guidelines for Responsible Fisheries, No. 10. FAO: Rome.
84. Virdin J et al. Saving fi sh and fi shers: toward sustainable and equitable governance of the global fi shing sector. 2004. The World Bank. Agriculture and Rural Development Department. Report No. 29090-GLB. 109 pages. .
85. Alabaster J. Review of the state of water pollution aff ecting inland fi sheries in Southeast Asia. 1986. Food and Agriculture Organization Fisheries Technical Papers, No. 260. 25 pages.
86. Williamson R, Klamut J. Transport and fate of contaminants in surface water. 2001. University of California Agricultural Extension Service & California Department of Health Services.
87. Escher M et al. The eff ect of sewage plant effl uent on brown trout (Salmo trutta fario): a cage experiment. Aquatic Sciences. 1999. 61: 93-110.
88. Tsai C. Eff ects of chlorinated sewage effl uents on fi shes in Upper Patuxent River, Maryland. Chesapeake Science. 1968. 9(2): 83-93.
89. Tsai C. Changes in fi sh populations and migration in relation to increased sewage pollution in Little Patuxent River, Maryland. Chesapeake Science. 1970. 11(1): 34-41.
90. Al-Muzaini S et al. The quality of marine water around a sewage outfall. Water Science and Technology. 1999. 40(7): 11-15.
91. Bucher F, Hofer R. The eff ects of treated domestic sewage on three organs (gills, kidney, liver) of brown trout (Salmo trutta). Water Research. 1993. 27(2): 255-261.
92. Burkhardt-Holm P, Scheurer K. Application of the weight-of-evidence approach to assess the decline of brown trout (Salmo trutta) in Swiss rivers. Aquatic Sciences. 2007. 69: 51-70.
93. Chambers P et al. Dissolved oxygen decline in ice-covered rivers of northern Alberta and its eff ects on aquatic biota. Journal of Aquatic Ecosystem Stress and Recovery. 2000. 8(1): 27-38.
94. Environmental Quality Center. Dissolved oxygen (website). Environmental Engineering and Earth Sciences Department, Wilkes University, Pennsylvania, US.
95. Meck N. Pond water chemistry. 1996. Koi Club of San Diego.96. Mellergaardl S, Nielsen E. Impact of oxygen defi ciency on the disease status of common dab Limanda limanda.
Diseases of Aquatic Organisms. 1995. 22: 101-14.97. Svobodová Z et al. Water quality and fi sh health. 1993. Food and Agriculture Organization (FAO); EIFAC Technical
Paper No. 54. FAO: Rome. 59 pages 98. Pastorok R, Bilyard G. Eff ects of sewage pollution on coral-reef communities. Marine Ecology. 1985. 21: 175-189.99. Geary P, Davies C. Bacterial source tracking and shellfi sh contamination in a coastal catchment. Water Science
Technology. 2003. 47(7-8): 95-100.100. Burkhardt W, Calci K. Selective accumulation may account for shellfi sh-associated viral illness. Applied
Environmental Microbiology. 2000. 66(4): 1375-8.101. Dommison C, Ross C. Animal and human fecal pollution in New Zealand rivers. New Zealand Journal of Marine
and Freshwater Research. 1999. 33: 119-28.102. Thang VQ. Eff ect of sewage utilization for fi sh farming and irrigation in Vietnam). 1996.103. Emerton L, Bos E. Value: counting ecosystems as water infrastructure. 2004. IUCN The World Conservation Union;
Water and Nature Initiative.104. Machado F, Mourato S. Improving the assessment of water reated health impacts: Evidence from coastal waters in
Portugal. CSERGE Working Paper GEC 99-09. 1999.105. General Statistics Offi ce. Result of the Survey on Households Living Standards (Vietnam) 2002. 2004.106. Brisson I, Pearce D. Benefi ts transfer for disamenity from waste disposal. CSERGE Working Paper. 1995. WM 95-
06.107. Powell JC, Brisson I. The assessment of social costs and benefi ts of waste disposal. CSERGE Working Paper. 1994.
WM 94-06.108. Mukherjee N. Learning what works for sanitation: revisiting sanitation successes in Cambodia. 2002. World Bank
Water and Sanitation Program, East Asia and the Pacifi c.

ANNEXES
124Economic Impacts of Sanitation in VietnamA five-country study conducted in Cambodia, Indonesia, Lao PDR, the Philippines and Vietnam under the Economics of Sanitation Initiative (ESI)
109. Whittington D et al. Household demand for improved sanitation services in Kamasi, Ghana: A contingent valuation study. Water Resources Research. 1993. 29(6): 1539-1560.
110. Doyle B. Increasing education and other opportunities for girls and women with water, sanitation and hygiene. 1995. UNICEF, New York.
111. DPM/UNICEF/WSR. Environment Sanitation at Schools and Public places in rural areas of Vietnam. 2007.112. World Travel and Tourist Association and Accenture, Travel and tourism traveling to new heights. Executive
summary. 2006. 113. U.S. Natural Resources Defense Council, Health risks and economic impacts of beach pollution. 2006.114. General Statistics Offi ce. Tourism Survey 2005. 2006.115. Esrey S, Feachem R, Hughes J. Interventions for the control of diarrhoeal diseases among young children: Improving
water supplies and excreta disposal facilities. Bulletin of the World Health Organization 1985. 63: 757-772.116. Fewtrell L et al. Water, sanitation, and hygiene interventions to reduce diarrhoea in less developed countries: a
systematic review and meta-analysis. Lancet Infectious Diseases. 2005. 5(1): 42-52.117. Clasen T et al. Interventions to improve water quality for preventing diarrhea. 2006. In: The Cochrane Library,
Issue 3, 2006. Oxford: Update Software.118. Cairncross S, Valdmanis V. Water supply, sanitation and hygiene promotion, in Disease Control Priorities in
Developing Countries. D. Jamison et al (Editors). 2006. 2nd Edition. New York: Oxford University Press.119. Ministry of Health and UNICEF. Vietnam Rural Sanitation and Environment. 2007.120. Werner C et al. Reasons for and principles of ecological sanitation. in 2nd International Symposium on Ecological
Sanitation. April 2003. GTZ and IWA: 121. Renwick M, Sagar Subedi P, Hutton G. A cost-benefi t analysis of national and regional integrated biogas and
sanitation programs in sub-Saharan Africa. 2007. Winrock International.122. Dorfman M, Stoner N, Merkel M. Swimming in sewage: the growing problem of sewage pollution and how the
Bush administration is putting our health and environment at risk. 2004. National Resources Defense Council; Environmental Integrity Project.
123. Strickland GT (editor). Hunter’s Tropical Medicine and Emerging Infectious Diseases. 2000. Eighth Edition. W.B. Saunders Company. 1192 pages.

ANNEXES
125Economic Impacts of Sanitation in Vietnam
A five-country study conducted in Cambodia, Indonesia, Lao PDR, the Philippines and Vietnam under the Economics of Sanitation Initiative (ESI)

Economic Impacts of Sanitation in VietnamA five-country study conducted in Cambodia, Indonesia, Lao PDR, the Philippines and Vietnam under the Economics of Sanitation Initiative (ESI)
Research Report February 2008