Embed Size (px)
Citation preview
Economic Inequality and
Inter-group Conflicts in Africa
Hanne Fjelde
Uppsala University [email protected]
& Gudrun Østby
Centre for the Study of Civil War (CSCW), Peace Research Institute Oslo (PRIO)
Abstract There is a rich literature investigating the impact of economic inequality on civil war.. However the way inequality might precipitate inter-group violence, has been largely overlooked in the quantitative literature. Evaluating this claim, we provide the first cross-country disaggregated study of economic inequality and the risk of non-state violence. Based on a set of national Demographic and Health Surveys we use GIS software to construct variables on socioeconomic inequalities between individuals and groups within sub-national regions in Sub-Saharan Africa for the period 1990–2008. We couple these measures with new, annual geo-referenced data on armed conflicts between non-state groups from the Uppsala Conflict Data Project. We find that regions with strong economic inequalities have a significantly higher risk of experiencing inter-group conflict. Paper prepared for presentation at the Democracy as Idea and Practice conference, Oslo, January 12-13, 2012.

1
Introduction
Armed conflict is a prevailing source of vulnerability for many communities in Sub-Saharan
Africa. The costs of armed conflict are staggering, and include both direct losses of human
lives and physical property following violence, displacement and war-related diseases, but
also opportunities foregone for development long after the fighting has ended (Gates et al.
2010). Consequently, the issue of armed conflict is now high on the agenda of policymakers,
development agencies and academics alike (c.f. WDR 2011). The bulk of this attention has
been directed at armed conflicts that involve the state as one of the belligerents. However, for
many population groups in Sub-Saharan Africa, the largest threat of becoming a victim of
political violence does not emanate from the state as such, but rather from violent clashes and
armed disputes between local communities.
A conservative estimate suggests that more than 60 000 people have lost their
lives in Sub-Saharan Africa between 1989 and 2008 in armed conflicts between groups, in
which the state was not a belligerent (Sundberg et al. forthcoming). For the communities
affected, the consequences of this form of political violence can be likened to that of civil
war, in terms of the danger of physical injury, destruction of ones property, the threat of being
displaced and the erosion of social trust. However, the occurrence of inter-group violence
varies greatly, not only across, but also within African states. Whereas some regions, such as
the Rift Valley in Kenya and Jos in Nigeria, see recurring outbreak of inter-group violence,
other areas display no armed hostility in the relationship between societal groups. What
explains this variation? In spite of the immense humanitarian and economic costs of inter-
group violence, large-N studies that seek to answer this question are surprisingly sparse.
2
Addressing this gap, this article evaluates the role of economic inequality in
explaining the risk of armed conflict between groups. Drawing on a long-standing argument
in the literature on contentious politics we argue that large disparities in the distribution of
wealth create feelings of deprivation, which inspire radical action and facilitate violent
mobilization to alter the distribution of wealth. Whereas the large-N studies that evaluate this
claim has focused on armed challenges against the state, we argue that economic inequalities
will also be associated with inter-group conflict. Economic asymmetries are transformed into
grievances through a process of group comparison. Violent attempts to redress the perceived
injustices will also be directed against groups who are the target of resentment.
We evaluate this claim empirically through a sub-national study of local level
inequality and the occurrence of inter-group conflict in Sub-Saharan Africa between 1990 and
2008. Based on a set of national Demographic and Health Surveys we use GIS software to
construct measures on socioeconomic inequalities between individuals and groups within sub-
national regions. We couple these measures with geo-referenced data on armed conflicts
between groups from the Uppsala Conflict Data Project (Melander and Sundberg, 2011). The
statistical results show that regions with high economic inequalities have a significantly
higher risk of experiencing armed conflict between communal groups.
These results not only add an important piece to the scholarly debate on whether
economic inequality leads to various forms of political violence. They also can inform the
policy community which has long seen inter-group violence as a key obstacle for
development.
2. Economic inequality and political violence
Economic inequality figures prominently in the classical literature on contentious politics
(e.g. Davies, 1962; Russett 1964; Gurr, 1970). Countries with a more unequal distribution of
3
wealth or income are held to be more vulnerable to various forms of political violence,
particularly civil war. For almost half a century, scholars have tried to test the assumption that
economic inequality breed political violence, relying on statistical as well as qualitative
methods. These efforts have not produced conclusive findings (Blattman & Miguel, 2010;
Boix, 2008; Lichbach, 1989; Murshed, 2010; Østby, 2011). In line with the earlier critics of
relative deprivation theory (e.g. Skockpol, 1979; Tilly, 1978), many prominent contemporary
statistical studies have largely dismissed the role of economic inequality (e.g. Collier &
Hoeffler, 2004; Fearon & Laitin, 2003).
Many scholars found the rejection of the inequality-conflict linkage premature,
arguing that the conflict inducing inequality cannot be reduced to individual level measures of
income distributions, such as the Gini-coefficient. Most prominently, Oxford-based
development economist Frances Stewart, stated the need to focus on group-based, rather that
individualistic measures of unequal access to economic or political resources. She focuses on
the role of ‘horizontal inequality’ (HI), or systematic economic and political inequality
between ethnic, religious or regional groups, in affecting the likelihood of armed conflict (see
e.g. Stewart, 2002; Stewart, 2008). The concept of horizontal inequality differs from the
conventional definition of inequality, often referred to as ‘vertical inequality’ (VI), because
the latter type lines individuals up vertically and measures inequality over the range of
individuals rather than groups. In brief, the horizontal inequality argument states that
inequalities coinciding with cultural cleavages may enhance group grievances, in turn
facilitating mobilization for political violence. Based on material from several case studies,
Stewart and her collaborators have concluded that horizontal inequality is associated with
armed conflict (2002; 2008).
4
Recently, the horizontal inequality thesis has also gained empirical support in
statistical studies of civil war.1 These studies have developed novel approaches to studying
horizontal inequalities in a statistical set up by, relying on household surveys in developing
countries (Østby 2008a; 2008b Østby et al., 2009) or on group-level measured generated
through overlaying spatial wealth estimates with ethnic group settlements (Buhaug et al.,
2011; Cederman et al. 2011). These statistical corroborations of the inequality-conflict
linkage have helped bridge the mismatch between quantitative and qualitative studies.
Large-N empirical investigations of the inequality-conflict association have
focused on armed conflicts where the state is one of the contenders. Yet, the scope of the
inequality-conflict argument does not restrict itself to these cases. Much of the case-based
literature on horizontal inequality and conflict has also explicitly dealt with violence between
groups, where the state is not one of the contenders (see Stewart, 2008). Yet, there is no
statistical, cross-country work that examines whether a more general relationship exists
between economic inequality and armed conflict between communal groups. We move on to
outline the theoretical argument for such association below.
Economic Inequality and Inter-group Conflict
The existing literature provides a strong theoretical foundation for how disparities in the
distribution of wealth lead to the polarization of group belonging, thereby facilitating group
mobilization for violent collective action. Cederman et al. (2011) for example, note how
objective economic asymmetries are transformed into grievances through a process of group
comparison. Though self-categorization, feelings of economic deprivation become linked to
social identities - such as ethnic affiliation - inviting individuals to make social comparisons
in terms of “us” and “them” (ibid; Stewart, 2002). Tajfel and Turner (1979) describe how
1 For less supportive findings, see Condra (2009).
5
conflicting interests over the distribution of scarce resources reinforces processes of self-
identification with the group, precipitates ethno-centrism, and induce more antagonistic out-
group behavior. Unequal distributions of scarce resources – whether power, prestige or wealth
– are hence likely to intensify inter-group conflict between privileged and non-privileged
groups (ibid: see also Horowitz, 1985). Also Cederman et al. (2011) and Gurr (1993)
conclude that resentments stemming from inter-group comparisons of material well being
often provoke ethnic mobilization. Groups that are disadvantaged in the distribution of
resources share both a common grievance and a common identity, which facilitate recruitment
for radical action to assert and protect group interests (Gurr, 1993; Wimmer 2002; Cederman
and Girardin 2007). 2
While the existing literature on inequality and conflict carefully specifies the
causal story from inequality to group mobilization, it is not clear from the theoretical
argument why violent efforts to assert group interests necessarily will be directed only at the
government. As noted by Cunningham and Lemke (2011) the relative deprivation argument is
primarily about when political violence will occur, and does not explicitly address whether
the state itself is a participant or not. There is arguably a leap in many of the existing accounts
from the notion that grievances derive from inter-group comparisons, but violent attempts to
2 The above argument assumes the presence of groups. While this in itself is not a trivial assumption, most
scholars recognize social categories and group membership as an intrinsic part of social and political life (c.f.
Gellner, 1964; Horowitz 1985; Gurr, 1993; Stewart, 2002). Many scholars adopt a self-consciously group-based
framework, recognizing that the binding agent in group-formation may have multiple sources, including
ethnicity, religious affiliations, regional identities, livelihood, or indigenousness (c.f. Gurr 1993; Stewart 2008).
Yet, ethnicity represents a particularly salient resource in organizing collective political action (Wimmer, 2002;
Wimmer et al. 2009), not least in Sub-Saharan Africa (Bates 1983; Kimenyi 1989; Scarritt & Mozaffar, 1999;
Posner 2004; Fearon 2006).
6
redress them are directed against the state, rather than the group who is the target of
resentment. In fact, Gurr’s (1970) original formulation of relative deprivation theory focused
on explaining race riots in U.S. cities, not civil war.
The focus on the state in the existing literature is premised on the observation
that state policies for the allocation of state resources and deliverance of public goods are
fundamental in explaining the sources of economic inequalities. These policies are rarely
neutral in the allocation of resources between groups. In many states, political coalitions tend
to be structured along ethnic lines, and political elites in control of the government often seek
legitimacy by favoring co-ethnics in the distribution of state patronage public goods (Wimmer
1997; Wimmer et al. 2009). Since many African states, through the pervasiveness of neo-
patrimonial institutions, have monopolized economic resources, group competition for access
to executive power is a zero-sum game (Lindberg, 2003). As a consequence, access to
political and economic goods has come to depend crucially on ethnic belonging, where
political exclusion also breed economic marginalization (Bates, 1983; Fearon, 2006). The
observation that political inclusion and group enrichment is so intimately linked, suggest that
inter-group rivalry over access to scarce goods also becomes centered on the state (Wimmer
et al. 2009; Cederman et al. 2009).
We argue, however, that exactly because group belonging and political power is
so closely aligned and the state is not a neutral agent, but perceived to act in defense of
particular group interests, frustrated aspirations and perceived injustices are likely to be
blamed also on members of the groups that occupy the state. Attacking the groups perceived
to benefit by occupying the state, is an also a radical action against state policies. The ethnic
character of the state implies that violence against groups in power cannot be separated from
the struggle over the state as such. Due to the alignment between political loyalties and ethnic
divisions, political elites also have incentives to exploit such communal divisions and
7
instigate inter-group violence. Putting the blame for the predicament of their ethnic following
on other groups, or portraying other groups as threats to their economic privileges, facilitate
the competitive mobilization of their own ethnic constituency. While this strategy help
entrench the power of the political elites within the system, it also increases the risk of
violence between groups (Wimmer, 1997; Kahl 1998; Bates, 2008).
In this context, armed conflict between communal contenders in Sub-Saharan
Africa becomes one expression of the intense struggle over control of the state and its
resources between ethnic groups and the elites that represent them. Violent campaigns against
other groups will, however, also serve more immediate redistributive purposes. In the face of
wealth disparities, groups can use violence to capture assets controlled by other groups in a
direct attempt to shift the distribution of resources in their own favor. Disputes over control
over economically important areas, such as market places, transportation hubs, fertile land,
water wells or development investments might easily escalate into violence. Surely, violent
appropriation of resources controlled by other communities is more feasible than launching an
insurgency against the state. Starting a rebellion against the state requires substantive
organizational capacity and resources, which economically marginalized population groups
are unlikely to have. Violent mobilization against other groups requires fewer resources,
suggesting that inter-group violence also is a more probable response to inequalities in
distribution of wealth than large-scale rebellion against the state. Our two hypotheses
summarizes the above discussion:
H1: The higher the level of intra-regional economic inequality the higher the likelihood of an inter-group conflict
event.
H2: The higher the level of inequality between ethnic groups the higher the likelihood of an inter-group conflict
event.
8
3. Data and Research Design
The aim of the empirical analysis is to test whether asymmetries in socioeconomic welfare
and political access is linked to the occurrence of armed conflict between groups. Scholarly
work on the association between economic inequality and inter-group violence is limited
(Brown & Langer, 2010). Statistical studies of communal violence in Indonesia and Southern
Philippines find evidence suggesting that economic inequality between groups is associated
with violence (Barron et al., 2004; Barron et al., 2009; Magdalena, 1977; Mancini, 2008).
Yet, we are not aware of any comparative study of the influence of inequality on inter-group
violence across different countries, over time, and we lack general knowledge of the
relationship. Also the broader literature on inter-group violence is dominated by a few well-
researched cases. In particular, several statistical studies have been published on Hindu-
Muslim violence in India, but none of these pay special attention to the role of economic
inequalities.3 Hence, compared to the treatment of civil conflict, the phenomenon of inter-
group violence has received little attention, largely due to a lack of systematic data.
The theoretical framework suggests an association between economic inequality
and armed conflict between local communities. Such inter-group conflicts are local events
that rarely engulf an entire country. Since features of wealth and income distributions also
tend to vary considerably within countries, the use of national level indicators of inequality to
explain variations in inter-group conflict is clearly inappropriate. Since the above discussion
highlights the importance of local level political dynamics, it is moreover important to utilize
3 C.f. Wilkinson, 2004; Varshney, 2002; Justino, 2007. See Fjelde, 2010, for a sub-national study of inter-group
violence in Nigeria, and Tadjoeddin and Murshed, 2007 for a similar study of Indonesia.

9
a unit of analysis that represents an entity that is politically salient. Based on these
considerations, we adopt a sub-national approach.
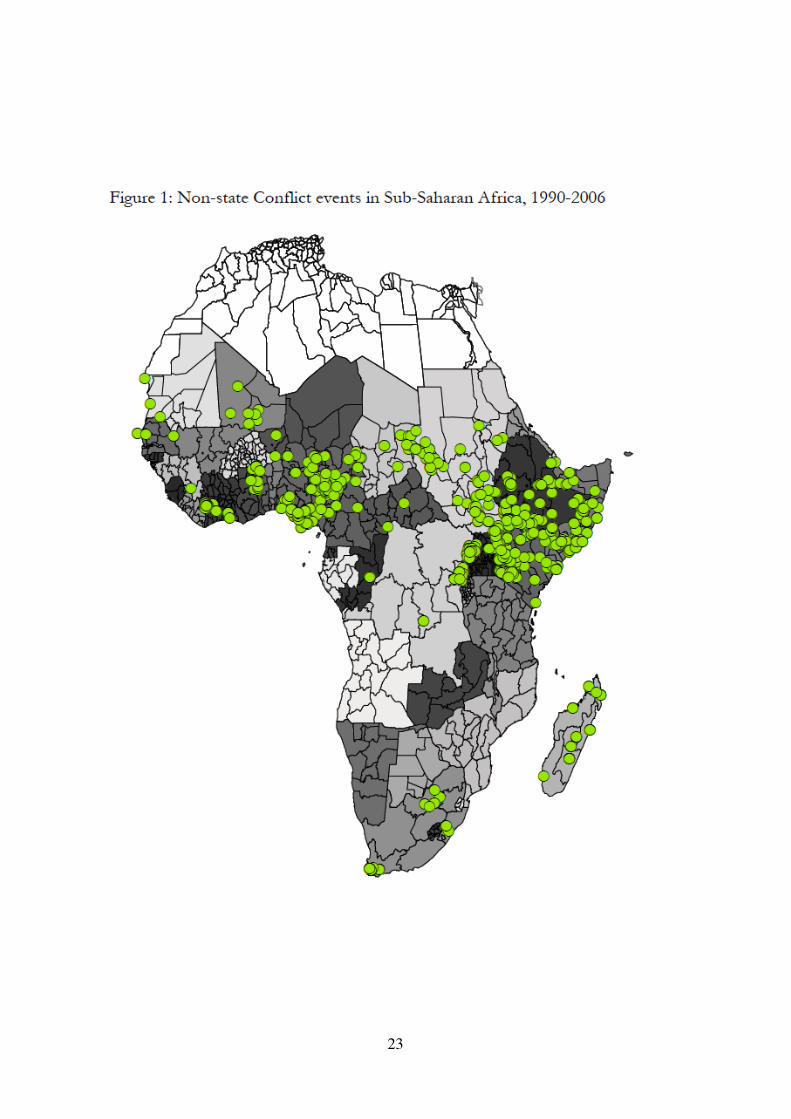
Our spatially disaggregated dataset consists of annual observations of first-order
administrative units in Sub-Saharan Africa between 1990 and 2008. The dataset is based on
time varying data from the Global Administrative Unit Layers (GAUL) (EC-FAO, 2008). The
first order administrative units are shown as black lines on the map in Figure 1, whereas
different countries are identified through different shades of grey. White areas represent areas
(North Africa) that are not included in the analysis. The green circles mark the location of
conflict events. It is within these units, that we examine the association between inequality
and armed conflict between communal groups.
[Figure 1 in here]
The dependent variable
The data for this study comes from UCDP GED beta version 1.0, a geo-coded event-dataset
on collective violence from 1989 and onwards, collected by the Uppsala Conflict Data
Program (Melander and Sundberg 2011). For our dependent variable we focus on the so-
called non-state conflicts, within Sub-Saharan African in the 1990 to 2008 period. A non-state
conflict is defined by the Uppsala Conflict Data Program (UCDP) as “the use of armed force
between two organized armed groups, neither of which is the government of a state, which
results in at least 25 battle related deaths in a year” (Sundberg et al., forthcoming). In UCDP
GED each instance of collective violence with at least one fatality in conflicts that fulfill the
above criteria is coded as a single event, and given exact date and geo-spatial reference. From
this dataset we include all events of all non-state conflict dyads that meet the 25 battle death
criteria at least one year during our period of study, implying that we also include events from
10
dyad years when conflict intensity is below this threshold. Organized groups in the UCDP
data refer both to formally organized rebel groups, ethnic groups, groups denoted by the their
shared livelihood (e.g. pastoralists and herders). We choose to exclude inter-group fighting by
rebel groups engaged in civil war, as this form of organized violence fall outside the
explanatory scope of our theoretical framework and research suggest that other factors are
more likely to explain such violence (see Fjelde & Nilsson forthcoming). Our dependent
variable – Inter-group Violence – takes the value of 1 if there is a non-state conflict event in
the administrative region that year, and 0 otherwise.
Independent Variables
Our explanatory focus is on sub-national asymmetries in the distribution of socio-economic
power and wealth. The estimates are based on data from a total of 704 Demographic Health
Surveys (DHS) conducted in 38 countries during the period (1986-2008). In a standard DHS
survey the definition of a sub-national ‘region’ is often broader and cruder than the official
first-level administrative units. However, during the last decade, the DHS has begun to
include detailed information about the exact location of each sample cluster, providing
geographical coordinates for each enumeration area ‘EA’, or each surveyed location
(village/town/city). This opens up the possibility to aggregate specific region-level measures.
By means of GIS tools we overlay the point data from the DHS surveys with polygons for
administrative boundaries from GAUL, and are hence able to identify the region within which
every EA is located in each year. Next we couple this information with the full DHS surveys
and are hence able to assign the regional affiliation of each survey respondent.
4 59 of these surveys (covering 30 countries) are geo-referenced, i.e. they include geographical coordinates for
each surveyed town/village (‘enumeration area’, or ‘EA’). The remaining 11 surveys (covering 8 countries) are
not geo-referenced, but nonetheless include information of the particular region surveyed.
11
To examine our hypothesis we begin by measuring economic inequalities in
economic welfare using the DHS data by region. First, in order to test whether inter-group
conflict is more likely in regions with high welfare inequality, we calculate regional Gini
coefficients for household assets and education years.5 The DHS survey lack information on
household income or consumption expenditures. Instead we use the questionnaire to generate
a household asset index, based on information on whether the household has electricity, a
radio, a television, a refrigerator, a bicycle, a motorcycle, and/or a car. In low development
countries, where a large share of the population are part of the informal sector, households
assets might better capture variation in welfare than conventional GDP pc measures (Filmer
and Pritchett 2001). As an alternative welfare indicator we use data on highest level of
completed education.
Secondly, we construct measures for regional-level ethnic relative deprivation
and privilege, respectively. We apply the asymmetric inequality measures from Cederman et
al (2011). Their point of departure is a measure for overall horizontal inequality:
lineq2 = [log(g/G)]2
where g is the average wealth of the region’s largest ethnic group and G is the average wealth
of the population of rest of the region. This measure is positive if the largest group’s wealth
deviates from the wealth level of the rest of the population in that region in either direction,
and 0 when there is no difference. Following Cederman et al. (2011) we generate two
variables – intraregional HI (‘low’) and intraregional HI (‘high’) – that measure the wealth of
poor and rich groups separately:
5 This approach is similar to Østby et al. (2009), but the dependent variable in their study is different as they
focus on armed challenges against government authority.
12
low = G/g if g < G,
0 otherwise
high = g/G if g > G,
0 otherwise
The variables low and high measure the deviation the largest ethnic group in terms of wealth
compared to the average of the rest independently of each other. These measures are quite
straightforward and easy to interpret. For example, if the largest group is twice as poor as the
rest category, its low value is 2, while its high value is 0. Conversely, if the largest ethnic
group is three times richer than the rest its low value is 0 while its high value is 3. We
construct these measures for both household assets and education years. For each of the
region years with missing data, the scores on the various inequality measures were copied to
the remaining years in the period 1989–2008.6
Control Variables
To estimate the impact of economic inequality on the risk of non-state conflict it is essential
to control for factors that are likely to be related to inequality and also can influence the
occurrence of non-state violence. Previous research finds a robust, positive relationship
between population and political violence in the context of civil wars (Raleigh and Hegre
2009) and inter-group violence (c.f Tadjoeddin and Murshed 2007; Fjelde 2010). The level of
economic welfare is also associated with the spatial distribution of population settlement. We 6 For our sample, the average number of DHS respondents by subnational region is 662 individuals (ranging
from 13 to 6,348). We censor regions with less than 30 respondents (which constitute less than 1% of our
sample). For strongly ethnically homogeneous regions (in which the rest category consists of 10 individuals or
less we set the HI measures to ‘0’).
13
control for population using data from the gridded population of the world database from
Columbia University. The data are reported for 5-year intervals, beginning in 1990, and we
extrapolate the latest observed value in between the data points.7
Spatial variation across regions in terms of urbanization, industrialization, and
socio-economic development is likely to influence levels of economic inequality (Boix 2008).
Low levels of absolute income also predict the occurrence of political violence (Buhaug et al.
2009; Hegre, 2009; Fjelde, 2010). To parse out the influence of economic inequality, we
include a control for absolute level of income using Nordhaus’ (2008) GECON data, which
calculates gross cell product across the globes’ surface to capture spatial variation in
economic activity.
To control for temporal and spatial autocorrelation in our variables of interest
we include the variable Violencet-1 that identify all first-order administrative regions that fall
within a radius of 50 km from the location where the violence occurred. We include this
spatial lag with a one-year time lag, to also account for the fact that the annual observations of
our units are not independent over time, but likely to be influenced by previous incidents of
violence at the location.
The theoretical framework outlined emphasizes the close association between
political power and economic position within the political economy of the Sub-Saharan state.
We therefore also include a control for the political status of the groups inhabiting the region.
To map political exclusion at the sub-national level we use data on the political status of
ethno-political groups from the Ethnic Power Relations (EPR) dataset. EPR identifies all
politically relevant ethnic groups worldwide since 1945, and provides annual data on the
group’s access to executive power (Cederman et al. 2010b). For our disaggregated analysis
we couple these data with geographical information about the regional base and settlement
7 http://sedac.ciesin.columbia.edu/gpw
14
patterns for each ethnic group included the EPR dataset using the GeoEPR dataset
(Wucherpfennig et al. 2010). Based on these two data sources we code a dummy variable for
Political Exclusion that takes the value of 1 if a group excluded from political power is living
in the administrative unit that year, and 0 otherwise. Political Inclusion takes the value of 1 if
a group with access to executive power is living in the administrative unit that year, and 0
otherwise.
We also include a control for election, aimed to capture political processes that
could influence both the distribution of economic welfare at the local level, as well as the
degree of conflict around the distributional issues, and thus could precipitate communal
mobilization and militarization. The data, in an updated version, is from Lindberg (2006).8
Ethnic divisions play a central role in the literature of inter-group conflict. We
include a control for local configurations in ethnic group settlements using data from the
digitalized Peoples Atlas of Africa, compiled by Marc L. Felix and Charles Meur (2001). We
use the geographically referenced data on the settlement patterns of the ethno-linguistic
groups included in the People Atlas and spatially disaggregated data on population to estimate
the number of people from each respective group living within the administrative regions.
Based on these numbers, we calculate an Ethnic Fractionalization index, denoting the
probability that two randomly drawn people will be of the same group belonging, given by
1 − !2!
!
!!!
where pk indicates the share of group k in the total population.
Last, we control for the potential influence of other forms of organized violence,
since there are reasons to believe that where violence is widespread the cost of using violence 8 The dataset can be downloaded from http://www.clas.ufl.edu/users/sil/downloads.html. We have focused on
the main election within the respective institutional set-up, i.e. the year of the presidential election for
presidential systems, and election to the national assembly for parliamentary systems.
15
for settling disputes is low. Since conflict events also could influence wealth distributions, for
example through the destruction of physical and human infrastructure in parts of a country, it
seems essential to control for the proximity of civil conflict events. The data on violent events
in African civil wars between 1990-2008 is from the Uppsala Conflict Data Program’s geo-
coded conflict dataset (Melander and Sundberg, forthcoming).
4. Empirical Analysis
We proceed to empirically examine the argument that inequality in socio-economic welfare
between individuals and across regions increases the risk of armed conflict between societal
groups. We begin by evaluating our first hypothesis that suggests a relationship between
inequality between individuals and the occurrence of inter-group conflict. The results are
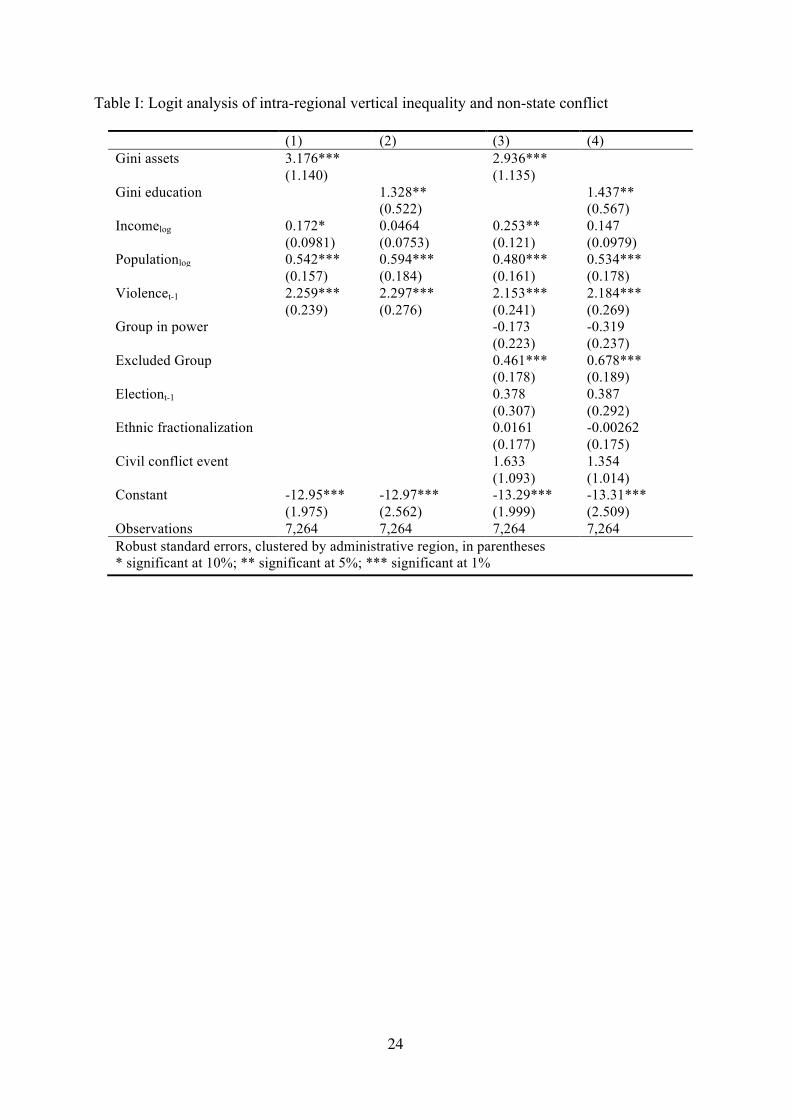
reported in Table I, model 1 to 4. Model 1 and 2 report reduced models with only essential
control variables, whereas Model 3 and 4 report models with a more comprehensive set of
controls.
[Table I about here]
The results support the argument that socio-economic vertical inequality within a region
increases the risk of armed conflict between groups. The coefficient for the asset inequality
measure is positive and statistically significant at the 1% level. The influence of asset
inequality on the risk of armed intra-group conflict is significant also in substantive terms.
With all remaining variables in Model 1 held at their mean, moving from the 25th to the 75th
percentile on the asset inequality variable the predicted annual risk of a non-state conflict in
the region doubles (from 1.1% to 2.2%). The result for education inequality, reported in
Model 2, is also supportive of H1. The coefficient is positive and significant at the 99%
confidence level. Comparing a region at the 25th with a region at the 75th percentile on the
16
education inequality variable, the increase in risk is approximately 83% (From 1.2% to 2.2%).
The results for both measures of intra-regional inequality hold up when a full range of control
variables are included in Model 3 and 4: both coefficients remain significant at the 95%
confidence level.9
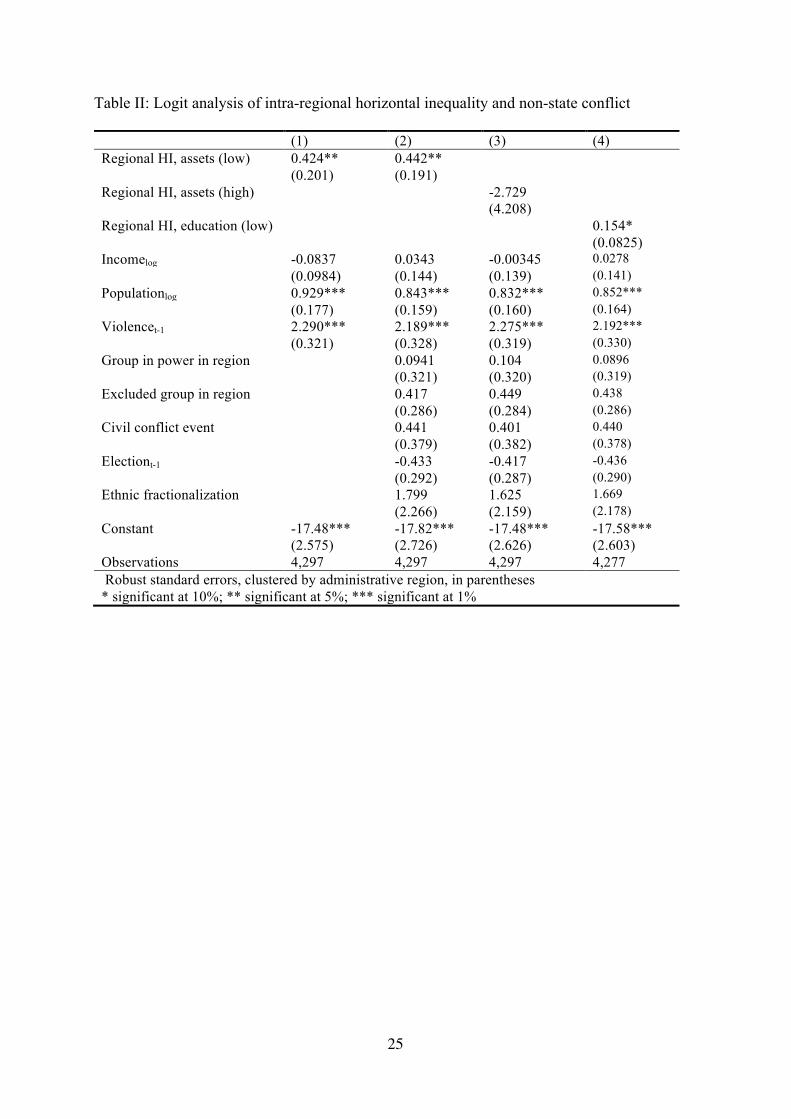
Next, we focus on the effect of intra-regional horizontal inequality between the
largest ethnic group and the rest on the risk of inter-group conflict. Our second hypothesis
suggests that regions in which the largest group is economically marginalized compared to
others are more likely to see inter-group conflict. The statistical results lend clear support to
this expectation, as the coefficient for Regional HI, asset (low) is positive and significant in
both the model with a reduced set of control variables (Table II, Model 1), and in the model
with a more comprehensive set of controls (Table II, Model 2). The substantive effect is
modest, and not as strong as for vertical inequality: moving from the 25th to 75th percentile on
the Regional HI, asset (low) variable increases the predicted annual risk on an inter-group
conflict from 0.9% to 1.0%. For comparison, Model 3 reports the corresponding results when
we look at regions in which the largest ethnic group is wealthy compared to the rest. The
coefficient for Regional HI (high) is negative but not significant. These results thus suggest
that it is marginalization of the largest ethnic groups, rather than regional horizontal inequality
per se that increase the risk of inter-group conflict. The results from using intraregional HI
measures based on education levels are virtually the same, as demonstrated in Model 4.
[Table II about here]
The results reported for the inequality measures in Tables I–II is consistent across a number
of different model specifications. We have examined different clustering options, for example
9 All substantive effects are calculated using CLARIFY (King et al., 2000).
17
accounting for the fact that the administrative regions are interdependent within a country. We
have also examined a number of different control variables, not reported here, including soil-
degradation, natural resource wealth (oil and diamonds), and regime type. None of the control
variables are significant, and do not alter the findings regarding the relationship between
socio-economic inequality and inter-group conflict.
We move on to discuss the impact of the control variables. In line with the
findings on socioeconomic inequality and the conflict inducing effect of economic
marginalization, we find that regions inhabited by politically excluded groups see a higher
risk of inter-group conflict. For regions inhabited by groups included in the political coalition
we find no statistically significant effect. This mirrors the non-finding regarding economic
privilege and inter-group conflict. In sum the results thus points to a significant role of
political and economic grievances in understanding the sources of inter-group conflict.
Many of the models report a positive coefficient for the income. Yet, in most
models the coefficient falls below conventional levels of statistical significance. This
nevertheless seems to contradict the robust association between poverty and political violence
at the country level (c.f. Hegre and Sambanis 2006). Yet, a growing number of disaggregated
studies have found that, when focusing on the low development countries, it is the areas that
are relatively better off in economic terms that seem to attract more violence during civil wars
(c.f. Buhaug et. al. 2009, Hegre et al. 2009). We find that more populous areas have a higher
risk of armed conflict between groups, which is also in line with what we know about the
determinants of civil conflict (Raleigh and Hegre 2009). The election variable is far from
statistical significance, and the general pattern does hence not seem to corroborate the picture
conveyed by studies of individual countries such as Kenya and Nigeria, that election periods
are associated with widespread violence between societal groups. Administrative changes, as
indicated by changes in the first order administrative units the year before, seems to be
18
associated with an increase in the risk of inter-group conflict. Such changes in the
administrative structure both represent opportunities for new elites to gain access to state
patronage and privileges, and risk creating new disadvantaged minorities that become
marginalized within the new political space. Neither the control for conflict events in civil
war fighting, nor the ethnic fractionalization measure attains statistical significance.
5. Conclusions
A closer look at the policy discourse in many low development countries, such as Kenya,
Mali and Nigeria, reveals that inter-group conflict is often considered a key obstacle for
development. Yet, in spite of its high costs in terms of human lives, humanitarian suffering
and destruction of social and physical infrastructure, the phenomena of armed conflict
between societal groups have received surprisingly little attention by quantitative conflict
scholars. Our knowledge about the determinants of this form of violence is largely based on
in-depth study of a few high-profile cases. Addressing this significant gap in the literature on
collective violence, this paper presents the first time-series, cross-country disaggregated study
of inter-group conflict.
Focusing on the political economy of Sub-Saharan African states, we argue that
a main cause of inter-group violence is unequal access to socio-economic welfare between
groups. We argue that a political rule, prevalent across African states, based on combining
corruption and ethnic favoritism create incentives for individuals to mobilize collectively and
violently against other groups in order to secure access to scarce economic benefits. The
larger the difference between the haves and the have-nots, the more competitive these
distributional conflicts will be. We examine the relationship between socio-economic
inequality and conflict between groups in a large-N framework using new geo-coded event
data on inter-group conflict from the Uppsala Conflict Data Program. We utilize variation in
19
household welfare and education at the sub-national level to match the local characteristic of
the dependent variable.
Our results are consistent across a number of different model specifications:
inequality, both between individuals and groups within a region increase the risk of armed
conflict between societal groups. From an academic point of view, these results add an
important piece to the heated debate about the role of inequality in producing collective
political violence. Our paper suggest that inequality is a salient cause of political violence, but
that organizational concerns might lead groups to challenge other groups, rather than the
government. From a policy perspective, our results help enhance our knowledge about the
correlates of inter-group conflict. For poor countries striving to escape a vicious circle where
political violence and low development feed on each other, working to reduce socio-economic
inequalities in terms of basic assets and education attainment might be an important step
forward towards a more stable society.
20
Bibliography
Barron, Patrick, Kai Kaiser, and Menoo Pradhan, 2004. “Local Conflict in Indonesia. Measuring Incidence and Identifying Patterns”. World Bank Policy Research Working Paper 3384, August 2004.
Barron, Patrick, Kai Kaiser, and Menoo Pradhan, 2009. Understanding Variations in Local Conflict: Evidence and Implications from Indonesia. World Development 37 no.3: 698-713.
Bates, Robert. 1983. “Modernization, Ethnic Competition and the Rationality of Politics in Contemporary Africa.” In Donald Rotchild and Victor Olorunsola, eds., State versus Ethnic Claims: African Policy Dilemmas. Boulder: Westview Press.
Bates, Robert H. 2008. When Things Fell Apart. State Failure in Late-Century Africa. New York: Cambridge University Press.
Boix, Carles. 2008. “Economic Roots of Civil Wars and Revolutions in the Contemporary World” World Politics 60(April 2008) 390-437.
Brown, Graham K. and Arnim Langer. 2010. “Horizontal Inequalities and Conflict: A Critical Review and Research Agenda.” Conflict, Security and Development, 10, no. 1: 27-55.
Buhaug, Halvard; Lars-Erik Cederman & Kristian Skrede Gleditsch. 2011. “Square Pegs in Round Holes: Inequalities, Grievances, and Civil War.” Paper presented at the annual meeting of the American Political Science Association, Seattle, WA, September 1–4.
Buhaug, Halvard, Kristian Skrede Gleditsch, Helge Holterman, Gudrun Østby and Andreas Forø Tollefsen. 2009. “Revolt of the Paupers or the Aspiring? Geographic Wealth Dispersion and Conflict.” Unpublished manuscript, Centre for the Study of Civil War.
Butler, Chris and Scott Gates. 2007. Communal Violence and Property Rights. Unpublished manuscript, Centre for the Study of Civil War.
Cederman, Lars Erik, Kristian Skrede Gleditsch and Nils B. Weidemann. 2011 “Horizontal Inequalities and Ethno Nationalist Civil War: A Global Comparison.” American Political Science Review, 1(18).
Cederman, Lars-Erik, Brian Min and Andreas Wimmer, 2010. “Why Do Ethnic Groups Rebel? New Data and Analysis”, World Politics 62(1): 87-119.
Condra, Luke N. 2009. “Ethnic Group Rebellion Against the State. Perils of the Periphery.” Paper presented at the Annual Meeting of the American Political Science Association, Toronto, September 3–6.
Collier Paul and Anke Hoeffler. 2004. “Greed and Grievance in Civil War.” Oxford Economic Paper 56 (2004), 563–595.
Cunningham, David E. and Douglas Lemke. 2011. “Beyond Civil War: A Quantitative Analysis of Sub-state Violence.” Paper presented at the annual meeting of the American Political Science Association, Seattle, WA, September 1–4.
Davies, James C., 1962. “Toward a Theory of Revolution”, American Sociological Review 27 (1): 5-19.
EC-FAO Food Security Programme. 2008. The Global Administrative Unit Layers (GAUL) GAUL/Doc 01, 2008-12-15.
Fearon, James D. 2006. “Ethnic Mobilization and Ethnic Violence”. In Barry R. Weingast and Donald Wittman, eds., Oxford Handbook of Political Economy. Oxford: Oxford University Press.
Fearon, James D. and David D. Laitin. 1996. ”Explaining Interethnic Cooperation.” American Political Science Review Vol. 90(4): 715-35.
Fearon, James D. and David D. Laitin. 2003. “Ethnicity, Insurgency and Civil War.” American Political Science Review, 97, no. 1(February): 75-90.
21
Filmer, Deon and Lant Pritchett. 2001. “Estimating Wealth Effects Without Expenditure Data or Tears: An Application to Education Enrollments in India”. Demography 38(1): 115-132.
Fjelde, Hanne 2010. Patronage Politics and Non-state Conflict: A Sub-national Study of Nigeria. Unpublished manuscript, Uppsala University.
Fjelde, Hanne & Desirée Nilsson. N.d. Rebels Against Rebels. Explaining Violence Between Rebel Groups. Journal of Conflict Resolution.
Gurr, Ted Robert. 1970. Why Men Rebel. Princeton, NJ: Princeton University Press. Gurr, T. R. (1993). Why Minorities Rebel: A Global Analysis of Communal
Mobilization and Conflict since 1945. International Political Science Review, 14(2), 161–201. Gurr, Ted Robert. 2000. Peoples Versus States: Minorities at Risk in the New Century.
Washington, DC: United States Institute of Peace Press. Hegre, Håvard, Gudrun Østby and Clionadh Raleigh. 2009. “Poverty and Civil War
Events: A Disaggregated Study of Liberia.” Journal of Conflict Resolution 53(4): 598–623. Hegre, Håvard, and Nicholas Sambanis. 2006. Sensitivity Analysis of Empirical Results
on Civil War Onset. Conflict Management and Peace Science 50: 341-352. Horowitz, Donald. 1985. Ethnic Groups in Conflict. Berkeley and Los Angeles:
University of California Press. Justino, Patricia. 2007. Carrot or stick? Redistributive transfers versus policing in
contexts of civil unrest. MICROCON Research Working Paper 3, Brighton: MICROCON. Kahl, Colin H. 1998. “Population Growth, Environmental Degradation, and State
Sponsored Violence. The Case of Kenya, 1991-93.” International Security 23(2):80–119. Kalyvas, Stathis. 2003. “The Ontology of ”Political Violence”: Action and Identity in
Civil Wars.” Perspectives on Politics 1(3):475–94. Kimenyi, Mwangi. 1989. “Interest Groups, Transfer-Seeking and Democratization:
Competition for Benefits of Government Power May Explain African Political Instability.” American Journal of Economics and Sociology 48(3):339–349.
Kimenyi, Mwangi S. 1998. “Rent-Seeking, Stability and Institutional Reforms in Sub-Saharan Africa.” in Silvio Borner and Martin Paldam, eds. Political Dimensions of Economic Growth, International Economic Association, London : Macmillan Press, 1998, pp. 324-334.
King, Gary, Michael Tomz, and Jason Wittenberg. 2000. Making the Most of Statistical Analysis: Improving Interpretation and Presentation. American Journal of Political Science 44(2): 347–361.
Magdalena, Federico V. 1977. ”Intergroup Conflict in the Southern Philippines: An Empirical Analysis.” Journal of Peace Research, 14, no. 4: 299–313.
Lindberg, Staffan, 2003. “It’s Our Time to Chop” Do Elections in Africa Feed Neopatrimonialism Rather than Counter-Act it? Democratization, Vol. 10, No. 2, pp. 121-140
Lindberg, Staffan I. 2006. Democracy and Elections in Africa. Baltimore: Johns Hopkins University Press.
Mancini, Luca. 2009. “Horizontal Inequality and Communal Violence: Evidence from Indonesian Districts.” In Frances Stewart ed., Horizontal Inequalities and Conflict: Understanding Group Violence in Multiethnic Societies. New York: Palgrave Macmillan.
Melander, Erik and Ralph Sundberg. (2011), Climate Change, Environmental Stress and Violent Conflict-Tests introducing the UCDP Georeferenced Event Dataset, Paper presented at the International Studies Association, March 16-19, Montreal, Canada.
Nordhaus, William (2008) “New metrics for environmental economics: Gridded economic data” Integrated Assessment, Vol 8, No 1.
Østby, Gudrun. 2008. “Polarization, Horizontal Inequalities and Violent Civil Conflict.” Journal of Peace Research, 45, no.2: 143–162.
22
Østby, Gudrun. 2009. “Inequalities, the Political Environment and Civil Conflict: Evidence from 55 Developing Countries.” In Frances Stewart ed., Horizontal Inequalities and Conflict: Understanding Group Violence in Multiethnic Societies. New York: Palgrave Macmillan
Østby, Gudrun. 2010. “Internal Migration, Inequality and Urban Social Disorder: Evidence from African and Asian Cities.” Paper presented to the international conference on ‘Climate Change and Security’ in Trondheim, 21–24 June.
Østby, Gudrun, Ragnhild Nordås, and Jan Ketil Rød. 2009. “Regional Inequalities and Civil Conflict in Sub-Saharan Africa.” International Studies Quarterly 53(2009): 301-324.
Posner, Daniel N. 2004. “Measuring Ethnic Fractionalization in Africa” American Journal of Political Science. Vol 48(4): 849-863.
Raleigh, Clionadh and Håvard Hegre. 2009. Population size, Concentration and Civil War. Political Geography, 28(4), 224–238.
Raleigh, Clionadh. 2010. “Political Marginalization, Climate Change and Conflict in African Sahel States.” International Studies Review 2010(12):69–86.
Russett, Bruce M. 1964. ”Inequality and Instability: The Relation of Land Tenure to Politics.” World Politics, 16, no. 3: 442–454.
Scarritt, James and Susan Mc Millan, 1995. “Protest and Rebellion in Africa: Explaining Conflicts Between Minorities and the State in the 1980s.” Comparative Political Studies 28: 323-349.
Stewart, Frances, 2002. “Horizontal Inequalities: A Neglected Dimension of Development.” Queen Elizabeth House Working Paper Series 81. University of Oxford.
Stewart, Frances, ed. 2008. Horizontal Inequalities and Conflict: Understanding Group Violence in Multiethnic Societies. New York: Palgrave Macmillan
Sundberg, Ralph., Eck Kristine. & Kreutz Joakim. (2011). ”Fighting Without the State - Introducing the UCDP Non-State Conflict Dataset”. Journal of Peace Research, in press.
Sundberg, Ralph, Mathilda Lindgren & Ausra Padskocimaite (2010) “UCDP Geo-referenced Event Dataset (GED) Codebook, Version 1.0”, www.ucdp.uu.se
Tadjoeddin Mohammad Zulfan and Syed Mansoob Murshed. 2007. “Socio-Economic Determinants of Everyday Violence in Indonesia: An Empirical Investigation of Javanese Districts, 1994-2003.” Journal of Peace Research, 44, No. 6: 689-709.
Varshney, Ashutosh 2001. “Ethnic Conflict and Civil Society. India and Beyond.” World Politics, 53(April 2001) 362-398.
Wilkinson, Steven I. 2004. Electoral Competition and Ethnic Riots in India. Cambridge Studies in Comparative Politics New York: Cambridge University Press.
Wimmer, Andreas 1997. ”Who Owns the State? Understanding Ethnic Conflict in Post-Colonial Societies.” Nations and Nationalism 3(4): 631-665.
Wimmer, A., Cederman, L. E., & Min, B. (2009). Ethnic Politics and Armed Conflict: A Configurational Analysis of a New Global Data Set. American Sociological Review, 74(2), 316–337.
Wucherpfennig, Julian, Nils B. Weidmann, Luc Girardin, Lars-Erik Cederman and Andreas Wimmer. 2010. Politically Relevant Ethnic Groups across Space and Time. Introducing the GeoEPR dataset. Unpublished manuscript ETH Zurich.
23
24
Table I: Logit analysis of intra-regional vertical inequality and non-state conflict
(1) (2) (3) (4) Gini assets 3.176*** 2.936*** (1.140) (1.135) Gini education 1.328** 1.437** (0.522) (0.567) Incomelog 0.172* 0.0464 0.253** 0.147 (0.0981) (0.0753) (0.121) (0.0979) Populationlog 0.542*** 0.594*** 0.480*** 0.534*** (0.157) (0.184) (0.161) (0.178) Violencet-1 2.259*** 2.297*** 2.153*** 2.184*** (0.239) (0.276) (0.241) (0.269) Group in power -0.173 -0.319 (0.223) (0.237) Excluded Group 0.461*** 0.678*** (0.178) (0.189) Electiont-1 0.378 0.387 (0.307) (0.292) Ethnic fractionalization 0.0161 -0.00262 (0.177) (0.175) Civil conflict event 1.633 1.354 (1.093) (1.014) Constant -12.95*** -12.97*** -13.29*** -13.31*** (1.975) (2.562) (1.999) (2.509) Observations 7,264 7,264 7,264 7,264 Robust standard errors, clustered by administrative region, in parentheses * significant at 10%; ** significant at 5%; *** significant at 1%
25
Table II: Logit analysis of intra-regional horizontal inequality and non-state conflict
(1) (2) (3) (4) Regional HI, assets (low) 0.424** 0.442** (0.201) (0.191) Regional HI, assets (high) -2.729 (4.208) Regional HI, education (low) 0.154*
(0.0825) Incomelog -0.0837 0.0343 -0.00345 0.0278 (0.0984) (0.144) (0.139) (0.141) Populationlog 0.929*** 0.843*** 0.832*** 0.852*** (0.177) (0.159) (0.160) (0.164) Violencet-1 2.290*** 2.189*** 2.275*** 2.192*** (0.321) (0.328) (0.319) (0.330) Group in power in region 0.0941 0.104 0.0896 (0.321) (0.320) (0.319) Excluded group in region 0.417 0.449 0.438 (0.286) (0.284) (0.286) Civil conflict event 0.441 0.401 0.440 (0.379) (0.382) (0.378) Electiont-1 -0.433 -0.417 -0.436 (0.292) (0.287) (0.290) Ethnic fractionalization 1.799 1.625 1.669 (2.266) (2.159) (2.178) Constant -17.48*** -17.82*** -17.48*** -17.58*** (2.575) (2.726) (2.626) (2.603) Observations 4,297 4,297 4,297 4,277 Robust standard errors, clustered by administrative region, in parentheses * significant at 10%; ** significant at 5%; *** significant at 1%

26
Appendix A1: Descriptive statistics
Variable Obs Mean Std. Dev. Min Max
Non-state conflict 7,264 0.03 0.18 0 1
Gini assets 7,264 0.48 0.15 0.14 0.96
Gini_ed 7,264 0.56 0.25 0 0.99
Regional HI, assets (low) 4,297 0.16 0.36 0 3.52
Regional HI, assets (high) 4,297 0.03 0.25 0 3.92
Regional HI, education (low) 4,277 0.35 0.93 0 8.32
Regional HI, education (high) 4,277 0.09 0.41 0 6.77
Incomelog 7,264 -1.22 1.56 -9.59 3.66
Populationlog 7,264 13.54 1.29 9.19 17.15
Violencet-1 7,264 0.06 0.25 0 1
Group in power in region 7,264 0.68 0.47 0 1
Excluded group in region 7,264 0.46 0.50 0 1
Civil conflict event 7,264 0.04 0.19 0 1
Electiont-1 7,264 0.18 0.38 0 1
Ethnic fractionalization 7,264 0.76 0.14 0.50 0.99

27
Appendix A2: List of countries included in the analyses
1. Benin 2. Burkina Faso 3. Cameroon 4. Central African Republic 5. Chad 6. Congo 7. Côte d'Ivoire 8. Democratic Republic of the Congo 9. Ethiopia 10. Gabon 11. Ghana 12. Guinea 13. Kenya 14. Lesotho* 15. Liberia 16. Madagascar* 17. Malawi 18. Mali 19. Mozambique 20. Namibia 21. Niger 22. Nigeria 23. Rwanda 24. Senegal 25. Sierra Leone 26. South Africa 27. Sudan* 28. Swaziland* 29. Tanzania* 30. Togo 31. Uganda* 32. Western Sahara* 33. Zambia 34. Zimbabwe*
*Country lacking intraregional HI measures (because ethnicity was not included in any national DHS survey)