Embed Size (px)
Citation preview

Jaka
rta
Tre
nds
PT PricewaterhouseCoopers FAS
In cooperation withPT Paragon Property
1st Quarter 2007
TRENDS SUMMARYOffice: While demand for space is increasing, occupancy levels
remain nearly the same as newly completed buildings addmore market supply.
Retail: Even though lease occupancies remain high, there has beenonly marginal rental rate growth and fixed rate increases.The predictable kiosks oversupply and vacancy crisis hasmaterialized. There are thousands of empty units which willbe very difficult to utilize or re-position for alternative uses.
Apartment: While lease and serviced apartment occupancies are stillbelow ideal levels, more and more investor strata title unitshave been completed and now competing for tenants.
Hotel: Hotel performance continues to improve, but not yet to 1997levels. While the improvement is encouraging, the keyperformance benchmarks are below standard industrylevels.
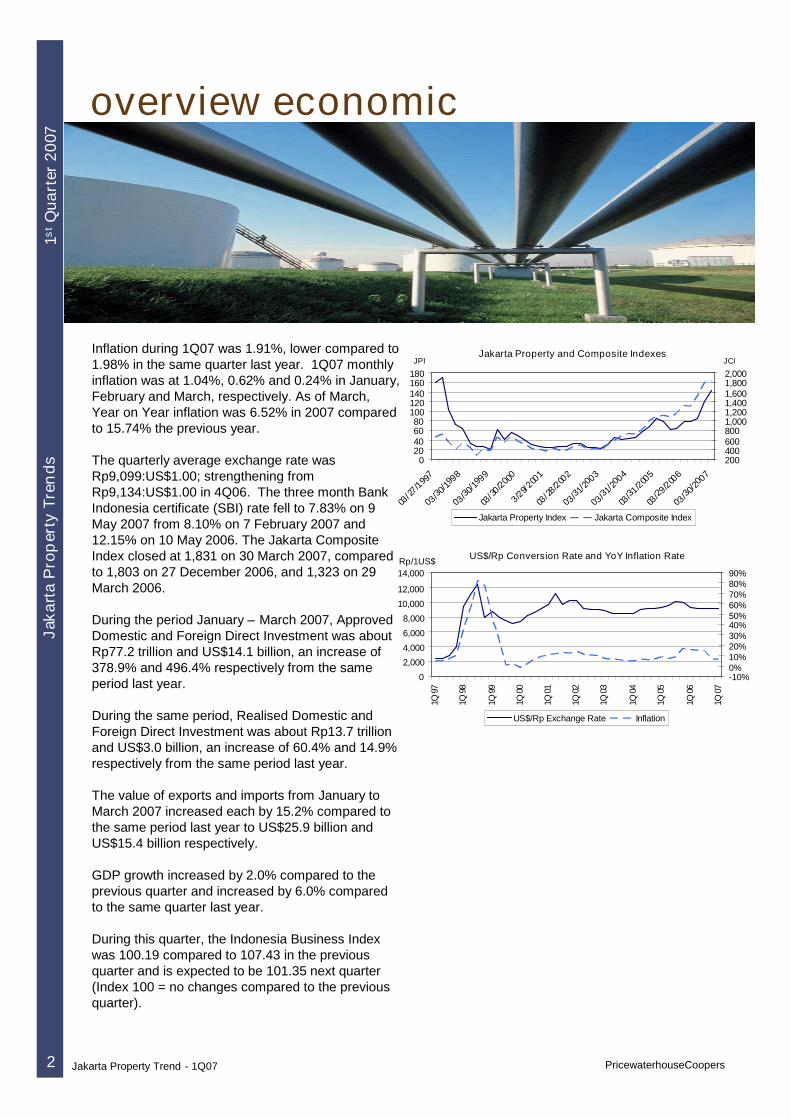
overview economic
Inflation during 1Q07 was 1.91%, lower compared to1.98% in the same quarter last year. 1Q07 monthlyinflation was at 1.04%, 0.62% and 0.24% in January,February and March, respectively. As of March,Year on Year inflation was 6.52% in 2007 comparedto 15.74% the previous year.
The quarterly average exchange rate wasRp9,099:US$1.00; strengthening fromRp9,134:US$1.00 in 4Q06. The three month BankIndonesia certificate (SBI) rate fell to 7.83% on 9May 2007 from 8.10% on 7 February 2007 and12.15% on 10 May 2006. The Jakarta CompositeIndex closed at 1,831 on 30 March 2007, comparedto 1,803 on 27 December 2006, and 1,323 on 29March 2006.
During the period January – March 2007, ApprovedDomestic and Foreign Direct Investment was aboutRp77.2 trillion and US$14.1 billion, an increase of378.9% and 496.4% respectively from the sameperiod last year.
During the same period, Realised Domestic andForeign Direct Investment was about Rp13.7 trillionand US$3.0 billion, an increase of 60.4% and 14.9%respectively from the same period last year.
The value of exports and imports from January toMarch 2007 increased each by 15.2% compared tothe same period last year to US$25.9 billion andUS$15.4 billion respectively.
GDP growth increased by 2.0% compared to theprevious quarter and increased by 6.0% comparedto the same quarter last year.
During this quarter, the Indonesia Business Indexwas 100.19 compared to 107.43 in the previousquarter and is expected to be 101.35 next quarter(Index 100 = no changes compared to the previousquarter).
1stQ
uart
er20
07Ja
kart
aP
rop
erty
Tren
ds
2 Jakarta Property Trend - 1Q07 PricewaterhouseCoopers
Jakarta Property and Composite Indexes
020406080
100120140160180
03/27
/1997
03/30/1998
03/30/1999
03/30
/2000
3/29/200
1
03/28
/2002
03/31/2003
03/31/2004
03/31/200
5
03/29/200
6
03/30/2007
JPI
2004006008001,0001,2001,4001,6001,8002,000JCI
Jakarta Property Index Jakarta Composite Index
US$/Rp Conversion Rate and YoY Inflation Rate
0
2,000
4,000
6,000
8,000
10,000
12,000
14,000
1Q97
1Q98
1Q99
1Q00
1Q01
1Q02
1Q03
1Q04
1Q05
1Q06
1Q07
Rp/1US$
-10%0%10%20%30%40%50%60%70%80%90%
US$/Rp Exchange Rate Inflation
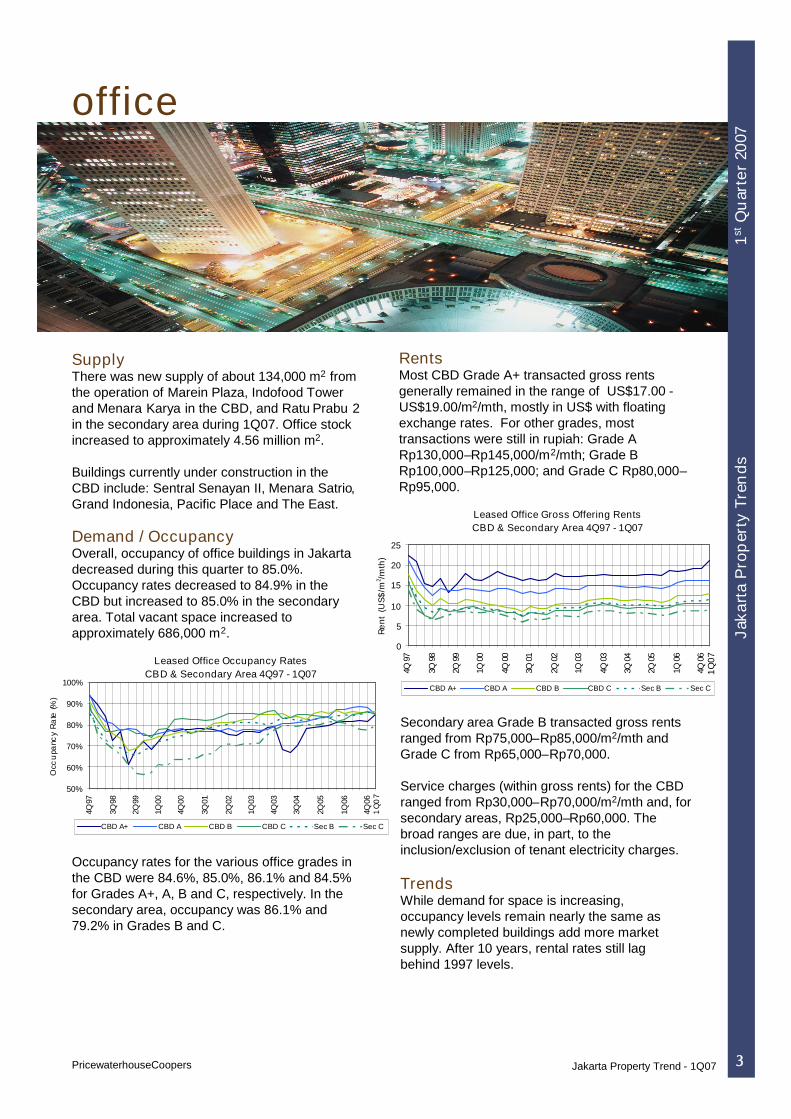
SupplyThere was new supply of about 134,000 m2 fromthe operation of Marein Plaza, Indofood Towerand Menara Karya in the CBD, and Ratu Prabu 2in the secondary area during 1Q07. Office stockincreased to approximately 4.56 million m2.
Buildings currently under construction in theCBD include: Sentral Senayan II, Menara Satrio,Grand Indonesia, Pacific Place and The East.
Demand / OccupancyOverall, occupancy of office buildings in Jakartadecreased during this quarter to 85.0%.Occupancy rates decreased to 84.9% in theCBD but increased to 85.0% in the secondaryarea. Total vacant space increased toapproximately 686,000 m2.
Secondary area Grade B transacted gross rentsranged from Rp75,000–Rp85,000/m2/mth andGrade C from Rp65,000–Rp70,000.
Service charges (within gross rents) for the CBDranged from Rp30,000–Rp70,000/m2/mth and, forsecondary areas, Rp25,000–Rp60,000. Thebroad ranges are due, in part, to theinclusion/exclusion of tenant electricity charges.
3
TrendsWhile demand for space is increasing,occupancy levels remain nearly the same asnewly completed buildings add more marketsupply. After 10 years, rental rates still lagbehind 1997 levels.
office
1stQ
uar
ter
2007
Jaka
rta
Pro
per
tyTr
ends
Occupancy rates for the various office grades inthe CBD were 84.6%, 85.0%, 86.1% and 84.5%for Grades A+, A, B and C, respectively. In thesecondary area, occupancy was 86.1% and79.2% in Grades B and C.
RentsMost CBD Grade A+ transacted gross rentsgenerally remained in the range of US$17.00 -US$19.00/m2/mth, mostly in US$ with floatingexchange rates. For other grades, mosttransactions were still in rupiah: Grade ARp130,000–Rp145,000/m2/mth; Grade BRp100,000–Rp125,000; and Grade C Rp80,000–Rp95,000.
Jakarta Property Trend - 1Q07PricewaterhouseCoopers
Leased Office Gross Offering RentsCBD & Secondary Area 4Q97 - 1Q07
0
5
10
15
20
25
4Q97
3Q98
2Q99
1Q00
4Q00
3Q01
2Q02
1Q03
4Q03
3Q04
2Q05
1Q06
4Q06
Re
nt
(US
$/m
2 /mth
)
CBD A+ CBD A CBD B CBD C Sec B Sec C
Leased Office Occupancy RatesCBD & Secondary Area 4Q97 - 1Q07
50%
60%
70%
80%
90%
100%
4Q97
3Q98
2Q99
1Q00
4Q00
3Q01
2Q02
1Q03
4Q03
3Q04
2Q05
1Q06
4Q06
Occ
upa
ncy
Ra
te(%
)
CBD A+ CBD A CBD B CBD C Sec B Sec C
1Q
07
1Q07
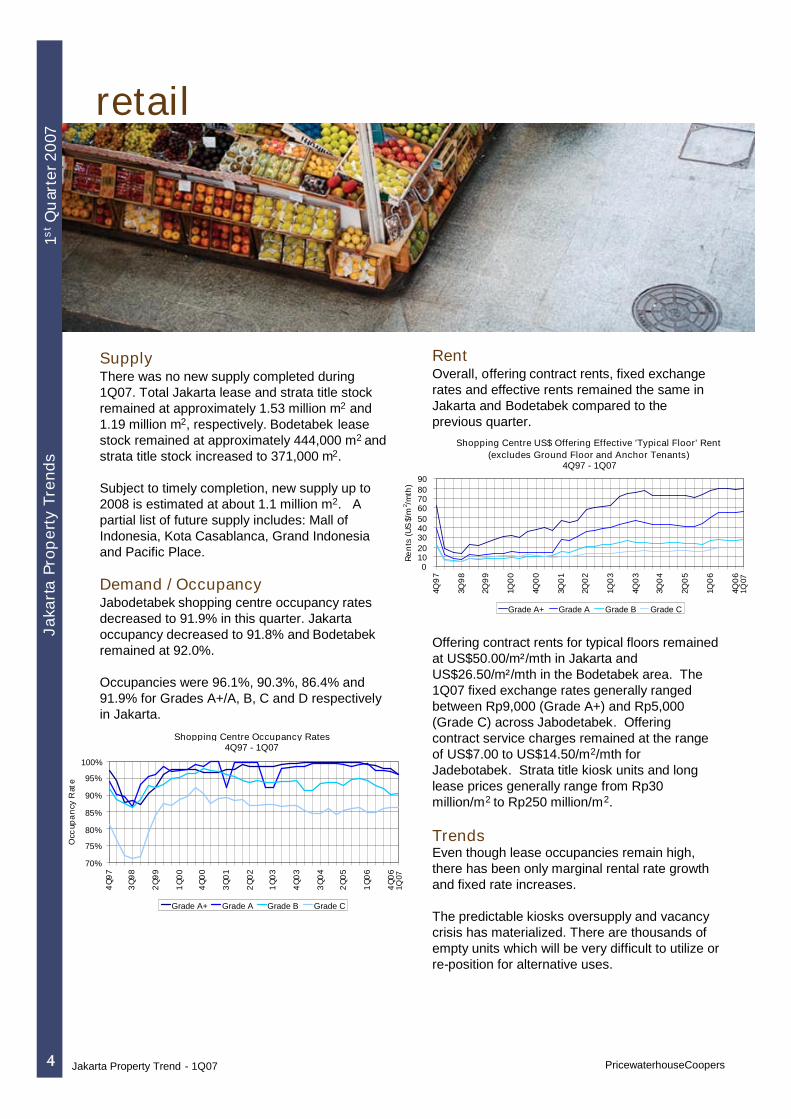
SupplyThere was no new supply completed during1Q07. Total Jakarta lease and strata title stockremained at approximately 1.53 million m2 and1.19 million m2, respectively. Bodetabek leasestock remained at approximately 444,000 m2 andstrata title stock increased to 371,000 m2.
Subject to timely completion, new supply up to2008 is estimated at about 1.1 million m2. Apartial list of future supply includes: Mall ofIndonesia, Kota Casablanca, Grand Indonesiaand Pacific Place.
Demand / OccupancyJabodetabek shopping centre occupancy ratesdecreased to 91.9% in this quarter. Jakartaoccupancy decreased to 91.8% and Bodetabekremained at 92.0%.
Occupancies were 96.1%, 90.3%, 86.4% and91.9% for Grades A+/A, B, C and D respectivelyin Jakarta.
Offering contract rents for typical floors remainedat US$50.00/m²/mth in Jakarta andUS$26.50/m²/mth in the Bodetabek area. The1Q07 fixed exchange rates generally rangedbetween Rp9,000 (Grade A+) and Rp5,000(Grade C) across Jabodetabek. Offeringcontract service charges remained at the rangeof US$7.00 to US$14.50/m2/mth forJadebotabek. Strata title kiosk units and longlease prices generally range from Rp30million/m2 to Rp250 million/m2.
4
Jaka
rta
Prop
erty
Tren
ds
RentOverall, offering contract rents, fixed exchangerates and effective rents remained the same inJakarta and Bodetabek compared to theprevious quarter.
retail1s
tQ
uar
ter2
007
Jakarta Property Trend - 1Q07 PricewaterhouseCoopers
Shopping Centre Occupancy Rates4Q97 - 1Q07
70%
75%
80%
85%
90%
95%
100%
4Q
97
3Q
98
2Q
99
1Q
00
4Q
00
3Q
01
2Q
02
1Q
03
4Q
03
3Q
04
2Q
05
1Q
06
4Q
06
Occ
upa
ncy
Rat
e
Grade A+ Grade A Grade B Grade C
Shopping Centre US$ Offering Effective 'Typical Floor' Rent(excludes Ground Floor and Anchor Tenants)
4Q97 - 1Q07
0102030405060708090
4Q9
7
3Q9
8
2Q9
9
1Q0
0
4Q0
0
3Q0
1
2Q0
2
1Q0
3
4Q0
3
3Q0
4
2Q0
5
1Q0
6
4Q0
6
Re
nts
(US
$/m
2 /mth
)
Grade A+ Grade A Grade B Grade C
1Q07
1Q07
TrendsEven though lease occupancies remain high,there has been only marginal rental rate growthand fixed rate increases.
The predictable kiosks oversupply and vacancycrisis has materialized. There are thousands ofempty units which will be very difficult to utilize orre-position for alternative uses.

SupplyThere was a new supply of approximately 1,770strata title units from the operation of MarriottExecutive Apartments and Setiabudi Residencesin the CBD, and Margonda Residences, TheSummit, Paladian Park Tower G and PondokIndah Square Tower B in the secondary area.
The total stock of apartments increased to about14,100 units in the CBD and 35,900 units in thesecondary area. Leased (non strata title) andserviced apartments account for about 5,640units (48% CBD and 52% secondary) and stratatitle approximately 44,360 units (26% CBD and74% secondary).
New supply up to 2009 is estimated at about44,000 units. A partial list of future supplyincludes: Shangri-la Residences, Pearl Garden,Hollywood Residences, Oakwook Premier, FourSeasons Towers 3 & 4 and Senayan CityResidences.
Occupancy / Sold RateOverall occupancy of lease/serviced apartmentsof all grades decreased in the CBD by 4.5% butincreased in the secondary areas by 1.6%.
The average lease/serviced apartmentoccupancy was about 75.0% in the CBD and72.7% in secondary areas. In the strata market,83.0% of the CBD supply (current stock andprojects under construction/launched) and88.1% in secondary areas was stated bydevelopers as sold. The occupancy rate of thecurrent stock was 66% and 72%, respectively.
5
1stQ
uar
ter2
007
Jaka
rta
Pro
pert
yTr
ends
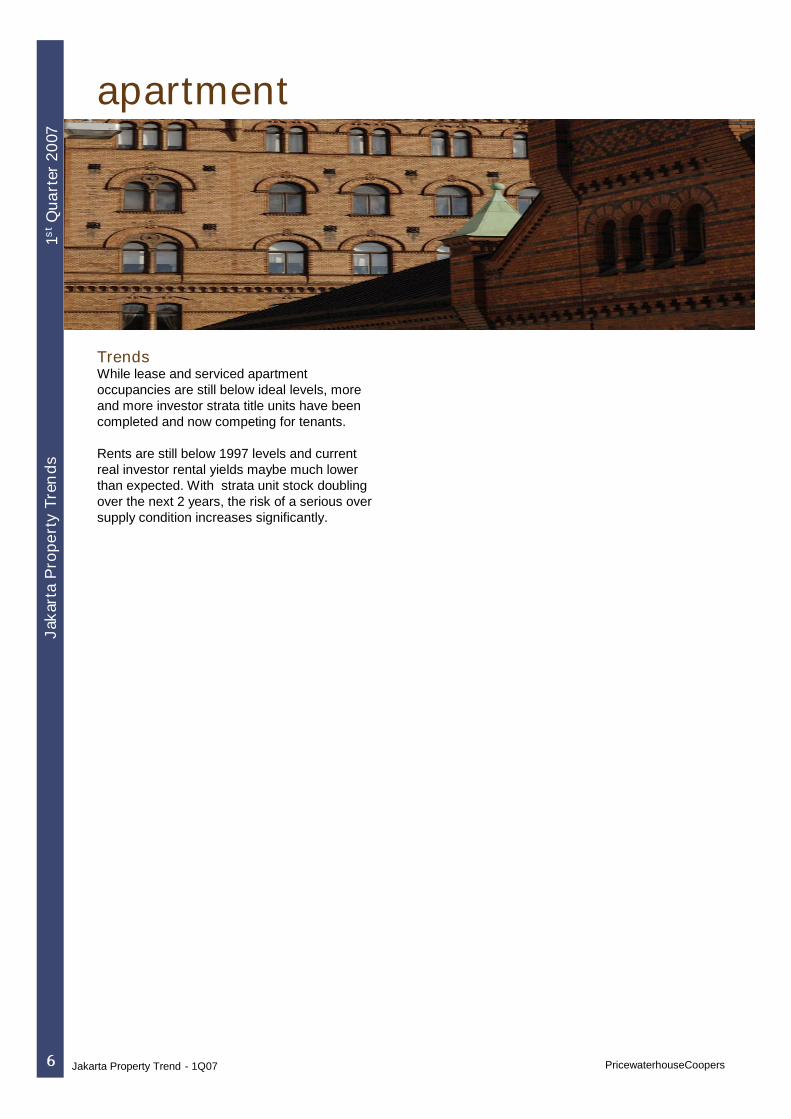
apartment
Average 1Q07 transaction base rents for CBDUpper and Middle Grade lease apartments wereUS$14.60 and US$8.10 respectively and forserviced apartments were US$15.70 andUS$9.80 respectively. Average service chargeswere around US$3.20 and US$1.60 for leaseapartments and US$4.70 and US$3.80 forservice apartments. Average transaction pricesfor strata title apartments were US$1,860/m2 forUpper and effectively US$990/m2 for MiddleGrade apartments.
Rent / PricesOn average, rents for lease/serviced in the CBDand secondary areas remained the samecompared to the previous quarter. Strataapartment offering prices increased in the CBDand in the secondary areas by 2.0% and 6.0%,respectively.
Jakarta Property Trend - 1Q07PricewaterhouseCoopers
CBD Average Occupancy & Sold Rates2Q97 to 1Q07
50%
60%
70%
80%
90%
100%
2Q
97
3Q
98
2Q
99
1Q
00
4Q
00
3Q
01
2Q
02
1Q
03
4Q
03
3Q
04
2Q
05
1Q
06
4Q
06O
cc
up
an
cy
/So
ldR
ate
Serviced Lease Strata
CBD Average Base Rents2Q97 to 1Q07
0
10
20
30
2Q97
3Q98
2Q99
1Q00
4Q00
3Q01
2Q02
1Q03
4Q03
3Q04
2Q05
1Q06
4Q06
US$
/m2/m
th
Serviced Lease
1Q07
1Q07
6
1stQ
uart
er20
07Ja
kart
aP
rope
rty
Tren
ds
apartment
TrendsWhile lease and serviced apartmentoccupancies are still below ideal levels, moreand more investor strata title units have beencompleted and now competing for tenants.
Rents are still below 1997 levels and currentreal investor rental yields maybe much lowerthan expected. With strata unit stock doublingover the next 2 years, the risk of a serious oversupply condition increases significantly.
Jakarta Property Trend - 1Q07 PricewaterhouseCoopers

hotel
SupplyThere was no new supply during 1Q07. Jakartahotel supply totals 22,297 rooms, consisting of8,890 5-star, 8,152 4-star and 5,255 3-starrooms.
New hotels under development include: RitzCarlton Pacific Place and Hotel Indonesia -Kempinski.
Bodetabek hotel supply remains atapproximately 1,030 rooms, consisting of 3705-star, 490 4-star and 170 3-star rooms. Overall,Jadebotabek hotel supply was 23,327 rooms.
Demand / OccupancyOverall, occupancy increased by 2.9% to 61.8%from the previous quarter. The changes were4.0%, 1.7% and 2.3% for 5-star, 4-star and 3-star hotels. The occupancies were 56.8%,64.0% and 71.1%, respectively.
Compared to the same quarter last year, thechanges were 6.6%, 3.6% and 3.7% for 5-star,4-star and 3-star hotels, respectively. Overallsame quarter year on year occupancy increasedby 5.1%.
Room RatesThe overall rate increased from the previousquarter by 4.2% to US$55.00 per night. Thechanges were 4.1%, 4.2% and 3.3% for 5-star,4-star and 3-star hotels. US$ room rates wereUS$73.90, US$45.00 and US$33.30 per night,respectively.
Compared to the same quarter last year, roomrates changed by 5.0% for 5-star, 5.8% for 4-star and 8.8% for 3-star hotels. Overall, roomrates increased by 6.2%.
7
Jaka
rta
Pro
per
tyTr
ends
1stQ
uar
ter
2007
Revenue Per Available RoomOverall RevPAR this quarter was US$34.00 pernight or about 9.1% higher than the previousquarter. Compared to the previous quarter,all-star hotel categories RevPAR increased. Thechanges were 11.9%, 6.5% and 6.2% for 5-star,4-star and 3-star hotels. RevPAR wasUS$42.00, US$28.80 and US$23.60 per night,respectively.
Compared to the same quarter last year,RevPAR changed by 18.8%, 12.1% and 14.9%for each star-category and 15.7% overall.
PricewaterhouseCoopers Jakarta Property Trend - 1Q07
Jabodetabek Hotel Occupancy Rates4Q97 to 1Q07
20%
30%
40%
50%
60%
70%
80%
4Q9
7
3Q9
8
2Q9
9
1Q0
0
4Q0
0
3Q0
1
2Q0
2
1Q0
3
4Q0
3
3Q0
4
2Q0
5
1Q0
6
4Q0
6
Oc
cup
an
cy
Ra
te
5 Star 4 Star 3 Star Overall
Jabodetabek Hotel Average Room Rates4Q97 to 1Q07
020406080
100120140
4Q97
4Q98
4Q99
4Q00
4Q01
4Q02
4Q03
4Q04
4Q05
4Q06
US
$/ni
ght
5 Star 4 Star 3 Star Overall
1Q07
1Q07

hotel
8
Jaka
rta
Pro
pert
yTr
ends
1stQ
uart
er20
07
TrendsHotel performance continues to improve, but notyet to 1997 levels.
While the improvement is encouraging, the keyperformance benchmarks are below standardindustry levels.
Jakarta Property Trend - 1Q07 PricewaterhouseCoopers
Jabodetabek Hotel RevPAR1Q99 to 1Q07
05
1015202530354045
1Q
99
3Q
99
1Q
00
3Q
00
1Q
01
3Q
01
1Q
02
3Q
02
1Q
03
3Q
03
1Q
04
3Q
04
1Q
05
3Q
05
1Q
06
3Q
06
1Q
07
US
$/n
igh
t
5-star 4-star 3-star Overall
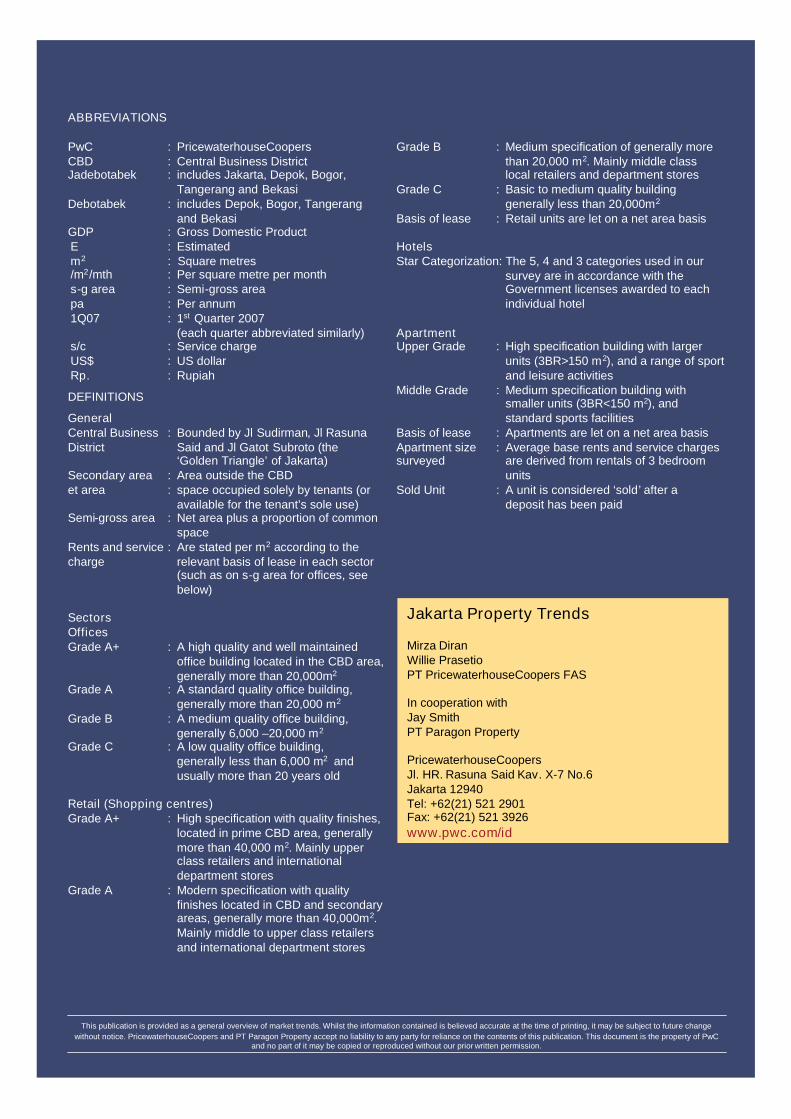
Jakarta Property Trends
Mirza DiranWillie PrasetioPT PricewaterhouseCoopers FAS
In cooperation withJay SmithPT Paragon Property
PricewaterhouseCoopersJl. HR. Rasuna Said Kav. X-7 No.6Jakarta 12940Tel: +62(21) 521 2901Fax: +62(21) 521 3926www.pwc.com/id
ABBREVIATIONS
PwC : PricewaterhouseCoopersCBD : Central Business DistrictJadebotabek : includes Jakarta, Depok, Bogor,
Tangerang and BekasiDebotabek : includes Depok, Bogor, Tangerang
and BekasiGDP : Gross Domestic ProductE : Estimatedm2 : Square metres/m2/mth : Per square metre per months-g area : Semi-gross areapa : Per annum1Q07 : 1st Quarter 2007
(each quarter abbreviated similarly)s/c : Service chargeUS$ : US dollarRp. : Rupiah
DEFINITIONS
GeneralCentral Business : Bounded by Jl Sudirman, Jl RasunaDistrict Said and Jl Gatot Subroto (the
‘Golden Triangle’ of Jakarta)Secondary area : Area outside the CBDet area : space occupied solely by tenants (or
available for the tenant’s sole use)Semi-gross area : Net area plus a proportion of common
spaceRents and service : Are stated per m2 according to thecharge relevant basis of lease in each sector
(such as on s-g area for offices, seebelow)
SectorsOfficesGrade A+ : A high quality and well maintained
office building located in the CBD area,generally more than 20,000m2
Grade A : A standard quality office building,generally more than 20,000 m2
Grade B : A medium quality office building,generally 6,000 –20,000 m2
Grade C : A low quality office building,generally less than 6,000 m2 andusually more than 20 years old
Retail (Shopping centres)Grade A+ : High specification with quality finishes,
located in prime CBD area, generallymore than 40,000 m2. Mainly upperclass retailers and internationaldepartment stores
Grade A : Modern specification with qualityfinishes located in CBD and secondaryareas, generally more than 40,000m2.Mainly middle to upper class retailersand international department stores
Grade B : Medium specification of generally morethan 20,000 m2. Mainly middle classlocal retailers and department stores
Grade C : Basic to medium quality buildinggenerally less than 20,000m2
Basis of lease : Retail units are let on a net area basis
HotelsStar Categorization: The 5, 4 and 3 categories used in our
survey are in accordance with theGovernment licenses awarded to eachindividual hotel
ApartmentUpper Grade : High specification building with larger
units (3BR>150 m2), and a range of sportand leisure activities
Middle Grade : Medium specification building withsmaller units (3BR<150 m2), andstandard sports facilities
Basis of lease : Apartments are let on a net area basisApartment size : Average base rents and service chargessurveyed are derived from rentals of 3 bedroom
unitsSold Unit : A unit is considered ‘sold’ after a
deposit has been paid
This publication is provided as a general overview of market trends. Whilst the information contained is believed accurate at the time of printing, it may be subject to future changewithout notice. PricewaterhouseCoopers and PT Paragon Property accept no liability to any party for reliance on the contents of this publication. This document is the property of PwC
and no part of it may be copied or reproduced without our prior written permission.
![TSKB 1Q07 IR Presentation[1].ppt · 1Q07 BRSA RESULTS INVESTOR PRESENTATION. TSKB BANKING SECTOR vs TSKB APPENDICES 3. TSKB at a Glance... 8.4% Ownership Structure* Main Subsidiaries](https://img.pdfslide.net/doc/110x75/60c679f6b4e6a86db97788d7/tskb-1q07-ir-presentation1ppt-1q07-brsa-results-investor-presentation-tskb-banking.jpg)


![December 2009 Issue [File Type: PDF, ~1.91 MB] - Heavy](https://img.pdfslide.net/doc/110x75/62062e968c2f7b1730053154/december-2009-issue-file-type-pdf-191-mb-heavy.jpg)