Embed Size (px)
Citation preview

HAL Id: hal-01195756https://hal.archives-ouvertes.fr/hal-01195756
Preprint submitted on 8 Sep 2015
HAL is a multi-disciplinary open accessarchive for the deposit and dissemination of sci-entific research documents, whether they are pub-lished or not. The documents may come fromteaching and research institutions in France orabroad, or from public or private research centers.
L’archive ouverte pluridisciplinaire HAL, estdestinée au dépôt et à la diffusion de documentsscientifiques de niveau recherche, publiés ou non,émanant des établissements d’enseignement et derecherche français ou étrangers, des laboratoirespublics ou privés.
Economic integration in ASEAN + 3: A networkanalysis
Thi Nguyet Anh Nguyen, Thi Hong Hanh Pham, Thomas Vallée
To cite this version:Thi Nguyet Anh Nguyen, Thi Hong Hanh Pham, Thomas Vallée. Economic integration in ASEAN +3: A network analysis. 2015. �hal-01195756�

Dale Squires
EA 4272
Economic integration in ASEAN + 3: A network analysis
Thi Nguyet Anh Nguyen*
Thi Hong Hanh Pham*
Thomas Vallée*
2015/21
(*) LEMNA, Université de Nantes
Laboratoire d’Economie et de Management Nantes-Atlantique Université de Nantes
Chemin de la Censive du Tertre – BP 52231 44322 Nantes cedex 3 – France
www.univ-nantes.fr/iemn-iae/recherche
Tél. +33 (0)2 40 14 17 17 – Fax +33 (0)2 40 14 17 49
Do
cum
ent
de
Tra
vail
Wo
rkin
g P
aper

1
Economic integration in ASEAN + 3: A network analysis
(Preliminary version)
NGUYEN Thi Nguyet Anh*, PHAM Thi Hong Hanh, VALLÉE Thomas
LEMNA, Institute of Economics and Management, University of Nantes Chemin de la Censive du Tertre, BP 52231, 44322 Nantes Cedex 3, France
Phone: +33 (0)2 40 14 17 33 / Fax: +33 (0)2 40 14 16 50
Abstract: This paper aims to analytically and graphically explore the characteristics of ASEAN+3’s
trade and FDI integration over the period 1990-2012 by applying the tools of network analysis. Our
results first find evidence that the degree of trade and FDI integration varies among ASEAN+3
member states over the observation period. Second, ASEAN+3’s intra-regional trade network seems to
be more densely connected than its intra-regional FDI network. Third, we reveal that large and/or
advanced countries tend to be better linked and to form a sub-regional bloc of tightly connected
economies. Therefore, ASEAN+3 has been experiencing a widening gap in the trend and patterns of
intra-regional trade and FDI among country members at different levels of economic development.
Keywords: Trade; FDI; network analysis; ASEAN+3
JEL: F02; F14; F21; F40
* Corresponding author. Email address: [email protected] (T.N.A.Nguyen)

2
1. Introduction
Southeast Asian countries formed a political, economic and cultural alliance on 8 August
1967 called Association of Southeast Asia Nations (ASEAN).1 Since its establishment, ASEAN
has promoted an open-regionalism principle in order to ensure trade liberalization among
country members and enhance trade and investment integration with particular non-
members. Based on the principle of open market economy and rule-based system, ASEAN
has become a dynamic trade zone and an important region for foreign investors to put their
real and portfolio investments.
Apart from the initiatives above, ASEAN has also committed to the enlargement of ASEAN
Free Trade Area (AFTA) to non-member countries. According to ASEAN members, who are
opposed to direct Bilateral Free Trade Agreement (BFTA) between an individual member
state and a non-member state, the enlargement of AFTA through an “ASEAN + framework”
has been the best way to strengthen ASEAN’s regional cooperation with non-members. The
ASEAN economic performances in the last decade explained the attractiveness of the
“ASEAN + framework” and the willingness of non-members states to join it. Besides, being
the third largest population in the world, after China and India, ASEAN has an important
potential market demand and a large potential productive labor supply. In addition, the
comparative advantages among ASEAN countries may allow building up complementary
production networks in Southeast Asia. In other words, these features allow ASEAN to
expand its regionalism wings to other Asian countries and then to establish BFTAs with non-
member states in order to join its economic cooperation. Among others, ASEAN+3, which
covers ten ASEAN member states and three East Asian countries (China, Japan and Korea),
has been considered as the most successful model of “ASEAN + framework”. The ASEAN+3
is also the latest development of East Asian regional cooperation from trade, investment to
financial cooperation. According to Urata (2007), free trade arrangements in East Asian
region through ASEAN+3 attempt to generate “trade creation” instead of “trade diversion”.
Still, a better understanding of the integration process and its evolution within the ASEAN
or the “ASEAN + 3” is opportune.
The present paper tends to gain a better understanding of economic integration in ASEAN+3
by employing a network analysis. In the literature, a network analysis has been recently used
to study the relevant issues of international trade (e.g. Fagiolo et al., 2007; Iapadre and Tajoli,
2014). The main argument of network analysis is to show trade relations as a network, in
1 Five ASEAN founding members are Indonesia, Malaysia, the Philippines, Singapore and Thailand. Membership has now extended to include Brunei, Laos, Cambodia, Myanmar and Vietnam.

3
which countries play the role of nodes and a link indicates the presence of an import/export
relation between any two countries. Fagiolo et al. (2007) argue that a network approach
enhances our understanding of international economics because it allows investigating the
whole structure of interactions among countries and to explore connections, paths and
circuits. The authors also indicate that while standard statistics are only able to capture the
first order relationships, a network analysis can analyze the second- and higher-order
relationships. Furthermore, according to Kali and Reyes (2007), the statistical properties of
network analysis can also explain the dynamics of macroeconomic variables related to
globalization, growth and financial contagion.
Employing a network analysis, the present paper has triple purposes. The first one is to
advance our understanding of the interdependence among ASEAN+3 countries through the
construction of a series of network indicators. The second one is to address the question of
which countries play the central role in ASEAN+3 economic network. Lastly, we are
interesting in investigating whether ASEAN and ASEAN+3 are complementary or
substitutionary. On the other hand, our empirical study also seeks to contribute to the related
literature in two ways. To the best of our knowledge, this paper is the first to perform a
detailed network analysis on trade integration in ASEAN+3. Second, we extend the network
approach to analyze the investment connection, which is captured by foreign direct
investment (FDI) flows among ASEAN+3 countries.
The reminder of this paper is organized as follows. Section 2 outlines the concerned
literature on network analysis. Section 3 provides an overview on ASEAN+3’s integration
process in terms of both trade and investment. Section 4 explains the methodological
approach. Section 5 presents and analyzes the empirical results. Concluding remarks are in
Section 6.
2. Network analysis in economic integration
Since long ago, international economists have considered international trade as a network.
From a network perspective, the trade flow of goods and services between two countries can
be simply described by a line connecting two vertices representing the two trading countries.
Looking at trade flows as a network allows to analyze either the relationship between the
countries in the network or the overall network structure. Because of this benefit, the
network analysis has been widely used in the literature to investigate the international trade
relations. In a seminal paper, Snyder and Kick (1979) address world-system/dependency
theories of differential economic growth among countries. The authors present a block-

4
model of the world system basing on four types of international networks: trade flows,
military interventions, diplomatic relations, and conjoint treaty memberships. Through this
model, Snyder and Kick provide strong evidence for a “core-semi-periphery-periphery”
structure of international trade network. Following this work, Smith and White (1992) use a
quantitative network analysis of international commodity trade flows (1965, 1970, and 1980)
to measure the structure of the world economic system and to identify the roles of each
nation in the global division of labor. They find evidence of the change both in the overall
structure of the world economy and in the positions of particular countries. This change can
be characterized by: (i) an enlargement of the core countries; (ii) a reduction of within-core
distance; (iii) and the progressive marginalization of peripheral countries.
Differing from the two above studies, Kim and Shin (2002) focus on the issue of globalization
and regionalization by applying social network analysis for longitudinal data on
international commodity trade. Three important findings can be drawn from this work. First,
the world became increasingly globalized between 1959 and 1996. Second, the structure of
the world trade network became decentralized over time. Third, intra-regional density and
ties are greater than interregional density and ties. In the same vein, Kastelle et al. (2006)
tend to operate and measure the concept of globalization by using complex systems network
analysis with longitudinal trade data over the period 1938-2003. The authors argue that,
while some important aspects of the international trade network have been remarkably
stable over the period of interest, several network measures have changed substantially over
the same time.
The architecture of globalization is also examined in Kali and Reyes (2007), who map the
topology of the international trade network and also provide new network-based measures
of international economic integration, at both global system-wide level and local country-
level. On the one hand, the authors show that in terms of participation and influence in the
network, global trade is hierarchical with a core-periphery structure at meaningful levels of
trade, though smaller countries’ economic integration into the network increased
considerably over the 1990’s. On the other hand, the position of a country in the network has
substantial implications for economic growth. In addition, the network position of a country
is a substitute for its physical capital but a complement to its human capital.
In Benedictis and Tajoli (2010), the tools of network analysis are also used to assess the
characteristics of international trade networks. The authors suggest that the structure of
international trade networks differs across manufacturing industries that employ different
types and amounts of intermediate inputs. Accordingly, the structure of some industries’

5
trade flows gives rise to a dense, widespread network with many links, while others
experience a centered network, organized around hubs that centrally coordinate the flows.
The authors also find evidence of a positive correlation between the use of differentiated
intermediate inputs and the network complexity. In a subsequent work, Benedictis and Tajoli
(2011) analyze the evolution of the world trade structure. On the one hand, they study the
role of the entrance of a number of new important players into the world trading system in
changing the main characteristics of the existing structure of world trade. On the other hand,
the authors aim to address the question of whether the changes in the world trade structure
are related to the multilateral or the regional liberalization policies. The authors find that the
level of world trade integration has been increasing but still far from being complete, with
the exception of some areas, which have experienced a strong heterogeneity in the countries'
choice of partners. Moreover, they also conclude the relevant role of WTO in trade
integration.
More recently, Iapadre and Tajoli (2014) analyze the role played by the BRICs (Brazil, Russia,
India and China) in the world trade network, as well as in their regions. They find that the
regional role played by each of the BRICs is different. China plays a role of export hub in
South-East Asia, importing intermediate goods from the rest of the region and exporting
final goods to the rest of the world, while Brazil, India and Russia seem to be the dominant
local suppliers in their regions, exporting to the region and importing from the rest of the
world. Iapadre and Tajoli (2014) also conclude that the BRICs are the most globalized
countries in terms of connectivity to the world trading system in each of their respective
regions.
In the international economics literature, the network analysis has been also used to study
other relevant issues apart from trade integration. For instance, Fagiolo et al. (2007) exploit
both binary and weighted network approaches to compare the degree and patterns of trade
and financial integration. The authors show that the trade network is almost fully connected
while international financial integration is less pervasive. In addition, the level of
international financial integration varies with asset type: it is highest for long-term debt
contracts, somewhat lower for equities and rather low for short-term debt. Differing from
Fagiolo et al. (2007), Kali and Reyes (2010) use these network-based measures of
connectedness to explain stock market returns during the financial crisis. They find that a
financial crisis is amplified if the epicenter country is better integrated into the trade
network. However, an affected country may dissipate the negative impact if it is well

6
integrated into the network. The authors also conclude the role of network analysis in
providing an improved explanation of financial contagion.
Overall, the existing literature reveals that using network analysis to analyze international
trade issues might yield interesting insights. However, until now the tools of network
analysis are mostly applied to study the trade network structure at the world level.
Therefore, we use network analysis to shed light on the changes in the trade network
structure at the regional level through a case study of ASEAN+3. In addition, the present
paper also tends to contribute to the existing literature by employing network analysis to
gain a better understanding of economic integration in ASEAN+3 in terms of FDI flows.
3. Integration and ASEAN + 3
We begin with a discussion on the globalization level of each country in ASEAN+3. It is
noteworthy that globalization can be interpreted as manifold dimensions. As defined in
Dreher et al. (2008), globalization includes three dimensions: economic globalization2; social
globalization3; and political globalization4. Dreher et al. (2008) also introduce the KOF Index
of Globalization covering all three dimensions of globalization. The KOF index defines
globalization to be the process of creating networks of connections among actors at multi-
continental distances, mediated through a variety of flows including people, information and
ideas, capital and goods.
Figure 1: KOF Globalization index of ASEAN + 3
2 Economic globalization is characterized as long distance flows of goods, capital and services as well as information and perceptions that accompany market exchanges. 3 Social globalization is expressed as the spread of ideas, information, images and people. 4 Political globalization is defined as a diffusion of government policies
0
10
20
30
40
50
60
70
80
90
100
1970 1980 1990 2000 2005 2012
Brunei Darussalam Cambodia China Indonesia
Japan Korea, Rep. Lao PDR Malaysia
Myanmar Philippines Singapore Thailand
Vietnam

7
Source: Authors’ creation from KOF Index
From Figure 1, all ASEAN+3 countries show a substantial increase in the KOF index over the
period 1970-2012. Despite of a common increasing trend, Figure 1 also displays the
heterogeneity of globalization processes among ASEAN+3 countries. Among others, China
has experienced a remarkable change in its KOF index. China’s KOF index started from the
lowest level in 1970 but has been sustained over a longer period. By contrast, the KOF index
of the country with a low economic development level, such as Lao PDR and Myanmar, has
been still small. This is probably due to the fact that the globalization process seems to be
more favored in a country with strong economic performance.
Table 1: Share of ASEAN+3’s trade flows
Year
Exports
Imports
ASEAN
ASEAN+3
ASEAN
ASEAN+3
World (%)
East Asia & Pacific
(%)
World (%)
East Asia & Pacific
(%)
World (%)
East Asia & Pacific
(%)
World (%)
East Asia & Pacific
(%)
1980 3.7 25.5
12.8 88.4
3.4 26.2
12.9 90.7
1990 4.3 25.3
13.3 78.7
4.2 29.7
14.2 80.8
2000 5.7 27.4
16.7 80.9
5.2 32.1
16.1 80.7
2005 6.1 24.8
20.4 83.1
5.6 30.2
18.4 81.6
2010 6.5 22.2
25.0 85.3
6.0 28.1
21.2 82.3
2013 6.7 21.3
26.9 85.8
6.2 26.3
23.6 82.9
Source: Authors’ computation from WDI data
We now turn our attention to ASEAN+3 integration in terms of both trade and FDI flows at
regional level. In fact, ASEAN+3 has long enjoyed a market driven expansion of trade and
FDI. Over the past two decades, the region’s trade and FDI have expanded rapidly. As
shown in Table 1, ASEAN+3’s exports rose from 12.8% of the world total exports in 1980 to
26.9% in 2013, while its imports expanded from 14.2% to 23.6% during 1990-2013. ASEAN+3
has also played a central role in regional trade integration. In 2013, the share of ASEAN+3 in
regional exports and imports reached to 85.8% and 82.9% respectively.
Table 2: Share of ASEAN+3’s FDI inflows
Year
FDI inflows
FDI outflows
ASEAN
ASEAN+3
ASEAN
ASEAN+3
World (%)
East Asia & Pacific
(%)
World (%)
East Asia & Pacific
(%)
World (%)
East Asia & Pacific
(%)
World (%)
East Asia & Pacific
(%)
1980 4.4 47.9
9.2 54.0
- -
- -
1990 6.3 43.3
14.6 64.5
- -
- -
2000 1.8 14.6
12.1 49.8
- -
- -
2005 3.2 22.2
14.2 89.6
1.4 19.0
7.4 99.4
2010 5.8 19.7
29.3 75.5
3.5 23.9
14.5 68.6

8
2013 7.4 20.5
36.1 78.3
3.6 15.9
22.4 81.9
Source: Authors’ computation from WDI data
On the other hand, ASEAN+3 has been also the most important destination of FDI. FDI flows
into ASEAN+3 more than doubled from 14.6% of the world total FDI inflows in 1990 to
29.3% in 2010 and reached the peak of 36.1% in 2013, while outward FDI of ASEAN+3
considerably increased from 7.4% to 22.4% of the world total outflows over the period 2005-
2010.
Table 3: Structure of ASEAN+3 trade activities (% of total trade flows)
Partners
2000
2005
2010
Export Import
Export Import
Export Import
Intra-ASEAN 22.8 21.1
25.3 24.5
28.2 26.6
Extra-ASEAN 77.2 78.9
74.7 75.5
71.8 73.4
China 3.5 5.2
8.1 10.6
11.3 12.4
Japan 12.3 18.8
11.2 14.1
11.1 10.8
Korea 3.5 4.4
3.8 4.1
4.8 5.5
Source: Authors’ computation from ASEAN Secretariat
ASEAN+3’s global expansion of trade has been accompanied by rising intra-regional
concentration of trade activities. As reported in Table 3, ASEAN+3’s trade activities are
significantly characterized by trade flows between the country members. For instance, intra-
regional exports as a share of ASEAN’s total exports increased from 22.8% in 2000 to 28.2%
in 2010, while intra-ASEAN imports also expanded from 21.1%% to 26.6% during 2000-2010.
In addition, the trade flows between ASEAN and China, Japan, and Korea have also
experienced a substantially upward trend over the last decade, which is probably due to the
establishment of ASEAN+3 in 1997.
Table 4: FDI sources of ASEAN+3 (% of total inward FDI)
Country sources 2005 2006 2007 2008 2009 2010
Intra-ASEAN 10.0 13.9 12.7 20.1 13.8 16.1 Extra-ASEAN 90.0 86.1 87.3 79.9 86.2 83.9 China 1.5 1.8 2.3 4.0 10.9 3.8 Japan 16.3 18.4 11.7 8.8 9.8 11.0 Korea 1.3 2.2 3.6 3.4 3.5 4.9 EU 27.7 23.6 24.6 14.9 23.9 22.3 U.S 7.9 5.4 11.0 7.5 10.7 11.3
Source: Authors’ computation from ASEAN Secretariat
Differing from intra-regional concentration of trade activities, the main sources of
ASEAN+3’s inward FDI come from both intra and extra-regional countries. Table 4 shows
that firms from the major industrialized countries are the main investors in ASEAN. Indeed
multinational firms from the European Union (EU), the U.S and Japan provide around 40%

9
of total inward FDI into ASEAN over the period 2005-2010. On the other hand, firms from
ASEAN countries firms have also begun to invest in other member states. For instance, intra-
ASEAN FDI flows peaked at 20.1% in 2008 and then dropped to 16.1% in 2010 due to the
global financial turmoil. Overall, the recent share of intra-ASEAN FDI flows is still lower
than that of extra-ASEAN FDI flows.
According to Kawai and Wignaraja (2007), several factors can explain the expansion of trade
and FDI ASEAN+3 economies. First, ASEAN+3 economies have pursued trade and
investment liberalization as part of their outward-oriented trade and FDI policies within the
multilateral framework. Second, investing into ASEAN+3 allow multinational firms to
former their production networks and supply chains throughout this dynamic region. Third,
improving physical and digital connectivity and developing logistics support services in East
Asia over the past two decade have reduced trade costs of conducting cross-border business
and thus encouraged trade and investment activities in the region. Fourth, the remarkable
economic growth of the largest emerging market, notably China, has also been considered as
an important factor contributing to closer economic linkages among ASEAN+3 member
states.
4. Methodological approach
In this paper, to achieve our research objectives, we employ a broad set of indicators, which
have been widely addressed in the literature.
4.1. Intensity indices
According to Iapadre and Tajoli (2014), the trade intensity is a simpler approach, in which
the intensity indices are measured by a comparison between actual bilateral trade and a
properly defined benchmark. Iapadre and Tajoli (2014) also argue that trade intensity indices
can be used to assess possible hierarchical structures in the geography of international trade,
such as core-periphery or hub-and-spoke patterns. On the other hand, intensity indices also
allow one to investigate the tendency of countries belonging to the same region to trade
relatively more between each other (intra-regional trade) than with the rest of the world
(inter-regional trade) (Iapadre and Plummer, 2011).
The trade intensity can be considered as equivalent with the revealed comparative advantage
index developed by Balassa (1965). In this vein, the trade intensity is formulized as follows:

10
⁄
⁄
(1)
where is a partner country j’s share of the reporting country i’s total trade, is its share
of the word trade, : is total bilateral trade between reporting country i and partner
country j, is trade between reporting country i and the world, is trade between
country j and the world, and is the total world trade.
Contrary to the abundant literature on the trade intensity indices, there is no clear theoretical
foundation for the FDI intensity. So that, to measure the intensity of FDI relationship, we
reuse the idea of bilateral trade intensity index to construct our FDI intensity indices as
follows:
⁄
⁄
(2)
where is a partner country j’s share of the reporting country i’s total FDI, is its share
of the word FDI, : is total FDI flows between reporting country i and partner country j,
is FDI flows between reporting country i and the world, is FDI flows between
country j and the world, and is the total world FDI.
To calculate the FDI intensity, we use FDI stocks instead of FDI flows for two reasons. First,
FDI stocks represent the long-term investment position of host and home country, while FDI
flows represent the annual investment position, especially in the case of small countries.
Second, the value of FDI stock, which is accumulated flows, in almost cases is positive. By
contrast, calculating the FDI intensity in the case of disinvestment, in which the value of FDI
flows is negative, is not an easy task. According to Iapadre (2006), the traditional
specifications of intensity indices as formularized above suffer from some limitations: (i) the
range of bilateral intensity indices is not homogeneous across region and is asymmetric
around the geographic neutrality threshold; (ii) it is difficult to interpret the dynamic
changes in intensity indices. To resolve these problems, Iapadre (2006) and Iapadre and
Tajoli (2014) present another indicator, namely the bilateral revealed trade preference index
(RTP) among the country members of a region. This index is constructed from the
homogeneous bilateral intensity index (HIij) and the complementary extra-bilateral intensity
index (HEij).
{
⁄
⁄
(3)

11
where Toj is trade flows between the rest of the word (excluding country i) and country j, Tow
is trade flows between the rest of the world and the world. Basing on the value of HIij and
HEij, the RTP index is given as follows:
( )( ) (4)
The RTP index varies from -1 (no bilateral trade) to +1 (only bilateral trade) and is equal to
zero in the case of geographic neutrality. According to Iapadre and Tajoli (2014), this index is
perfectly symmetric across partner countries and independent of country size. The authors
also argue that the RTP index can be also used to map the intensity of trade within a region r.
In this case, Formulas 4 becomes:
( )( ) (5)
On the other hand, we can also determine separately the revealed import and export
preference indices (RXPir and RMPir, respectively). These two indicators are used to calculate
the revealed trade leadership index (Iapadre and Tajoli, 2014) as follows;
(6)
The index allows one to determine the role (local supplier versus export hub) of each
country member in a specific region.
4.2. Weighted network analysis’ indicators
Network analysis is an application of network theory to analyze the relational data. De
Benedictis et al. (2013) show that network analysis provides the fundamental information on
the dyad ij. That is, network analysis is a useful approach to assess the relationship between
countries in terms of both trade and FDI.
In ASEAN+3 framework, we consider its trade network as a weighted network, since in the
binary trade matrix, 100% of links are bilateral and each node has exactly the same number
of links. By contrast, concerning FDI network, we refer to both binary and weighted network
analysis, because in the binary FDI matrix, there is approximately 55% of bilateral relations
and each node has different number of links. In addition, both trade and FDI networks are
considered as directed complete networks. The main reason is that in ASEAN+3 trade and
FDI network, every node (or every country) is directly connected to every other node (or
other country) in both direction.
To gain better understanding of the connectivity in ASEAN+3 network, we use a broad set of
centrality measures, which have been widely used in the concerned literature (e.g. Freeman,
1978; Newman, 2001; Bogartti, 2005; and Opsahl, 2010). The centrality approach, which is
12
based on the number of trade or FDI links of a given country (binary or unweighted
network) and their strength (weighted network), assesses how well connected a country is to
the rest of the network, and how influential a country is for a specific region. According to
Jackson (2010), centrality measures can be classified into four main groups: i) degree
centrality assessing how a node is connected to others; ii) closeness centrality showing how
easily a node can be reached by other nodes; iii) betweenness centrality describing how
important a node is in terms of connecting other nodes; and iv) eigenvector centrality
measure (or the Bonacich centrality) referring to how important, central, influential and
tightly clustered a node’s neighbors are. In this paper, we only focus on two indicators,
notably the degree centrality and the eigenvector centrality, for several reasons. First, all
links in ASEAN+3 network are directed between two countries. Second, the transactions
between countries are independent. Third, there is no node (or country) being a part of
transactions among two nodes.
Finally, in the weighted networks, we calculate either the absolute values (e.g. flows of
exports and stocks of FDI) or the relative ones (e.g. flows of exports by GDP and stocks of
FDI by GDP), which allow us to avoid the excessive impact of the country size. Moreover, it
also allows better determining the specialization in the overall process of production.
Degree centrality
Degree centrality is the simplest measure of a node’s position in a network. In a binary
network, the degree centrality corresponds to the number of connections of each node. In a
weighted network, the links between nodes are not equivalent and weighted according to
their strength.
In a given network, N is the total number of nodes (countries), and aij is the element in the
trade adjacency matrix A, in which i is the row-indicator corresponding to exporting
countries, and j is the column-indicator corresponding to importing countries. If aij = 1, the
two countries i and j are trade partners. If aij = 0, the two countries i and j are not trading
partners. In a weighted network described by N x N with the weight matrix A = [aij], in
which aij > 0 if the link i to j exists, otherwise aij = 0.
In an unweighted (or binary) network, the centrality of node is measured by the number of
the connections between nodes.
CD =∑ ij (7)
Due to the dependence of degree centrality measure on the number of existing nodes in a
network, it is difficult to compare networks of different node-size. According to De

13
Benedictis et al. (2013), it is usually better to calculate the normalized version of CD as
follows:
=
∑
( ) (8)
This indicator ranges from 0 to 1, implying that the more is the degree centrality close to 1,
the more a country is directly connected to the rest of the network. In a directed network, we
distinguish in-degree centrality and out-degree centrality. In our case, the out-degree is the
total number of countries to which country i exports its products, the in-degree is the total
number of countries that export their products to country i.
{
∑
( )
∑
( )
(9)
The ratio of these two indicators indicates the relative connectivity of a country in terms of
inflows (with a ratio greater than 1) or outflows (with a ratio smaller than 1). Normalizing
the number of links in Equation 7 by the total number of links L in the network gives the
following measures:
{
∑
∑
(10)
In a weighted network, we can also determine the strength centrality (CS) regarding to trade
volumes between two countries as follows:
{
∑
( )
∑
( )
(11) and
{
∑
∑ ∑
∑
∑ ∑
(12)
where wij is, for example, the exports or the exports by GDP from country i to country j while
wji imports of country i from country j, and ∑ ∑ ∑ ∑ is the in-strength and out-
strength by total network trade. In general, the degree and the strength centrality take into
consideration the direct links of a node and its nearest neighborhood, but ignore the position
of a node in the network’s structure.
Eigenvector centrality
The eigenvector centrality index, which is initialed by Bonacich (1972), measures the
importance of a node in terms of its connection to other central nodes (Iapadre and Tajoli,
2014). That is, it assigns relative scores to all nodes in the network based on the principal
that connections to high-scoring nodes contribute more to the score of the node in question

14
than equal connections to low-scoring nodes. Mathematically, the eigenvector centrality of
country i is defined as the sum of the centrality of its neighbors j scaled by a constant . In an
undirected network with adjacency matrix A, the measure (CE) is computed as follows:
CE(i) = ∑ CE(j) (13)
In a directed network, we can also distinguish:
- hub centrality: this indicator allows one to determine the high “hub” score country,
which is the key exporter or investor in the network.
CE-hub(i) = β∑ CE-autho(j) (14)
- authority centrality: this indicator allows one to determine the high “authority” score
country, which is the key importer of main destination of investment in the network.
CE-autho(i) = α∑ CE-hub(j) (15)
Overall, we use the listed above indicators to analyze the structure of ASEAN+3 network in
terms of both trade and FDI integration.
5. Results
In this section, we report and analyze the network analysis’ results on trade and FDI
integration in ASEAN+3. To calculate all network analysis’ indicators listed above, we collect
our panel data from different international data sources: UN Comtrade; Organization for
Economic Co-operation and Development (OECD); ASEAN; and United Nations Conference
on Trade and Development (UNCTAD).
5.1. Trade integration
As mentioned above, we use the network analysis to first study the structure of trade
integration in ASEAN+3. In Table 5, we report the trade intensity indices. We also report the
values of trade balance in order to compare the role of each ASEAN+3 member state in
regional trade system and the world trade system. First, looking at ASEAN’s RTL indices,
Singapore, Thailand, Malaysia and Indonesia can be seen as intra-regional local suppliers. This
is because their intra-regional trade leadership are positive, especially over the period 1990 -
1997. By contrast, small and less developed countries, such as Cambodia and Lao, have been
considered as intra-regional export hubs. Interestingly, Malaysia has experienced a
downward trend in intra-regional trade introversion, since the country is exporting more to
the world and becoming export hub in ASEAN. For instance, since 1998 Malaysia’s RTL value

15
has been slightly negative, while its trade balance with the world has been significantly
positive.
Second, the participation of China, Korea and Japan has influenced the picture of intra-
regional trade relations. China and Japan have been important intra-regional export hub but
played a relevant role in supplying goods and services to the rest of the world (except the
case of Japan from 2011 to 2013). Over the period 2011-2013, we also observe that Korea,
which was an intra-regional export hub, turned into a local supplier due to opposite change in
its intra-regional import and export preferences. Regarding the role of founding ASEAN
country members, Singapore maintains its role as local supplier and its strong trade
integration at regional and global levels. On the other hand, after the implement of
ASEAN+3, both intra-regional import and export preferences of most ASEAN countries have
dropped due to the market share with large economies (China, Japan and Korea), with the
exception of Brunei Darussalam.
<Insert Table 5>
The patterns of ASEAN+3’s trade network are also reflected through a set of centrality
indices. As mentioned in the methodological section, each country in ASEAN+3 has the
bilateral trade relationship with other member states. So that, we only compute the weighted
degree centrality index, which is formulated in Equation 11. The result is reported in Table 6,
in which the weighted degree centralities are summarized in columns n-outdegree and n-
indegree. For instance, the average flow of Japan’s exports and imports is 7,915.29 and
6,111.64 million US dollars respectively over the period 1990 -1997. Together with the
weighted degree centrality indices, their ranking indicates the integration level of each
country in ASEAN+3’s trade network. Furthermore, we can also observe the changes in
ASEAN+3’s trade structure over the observation period. According to Table 6a, and using
the flows of exports as the weights for the network, China, Japan and Korea are the most
integrated country in the regional trade network. In particular, Japan and Korea have always
played a central role in the trade network in both cases with or without ASEAN+3 creation.
Not surprisingly, the role of China in the regional trade network has changed since 2006 due
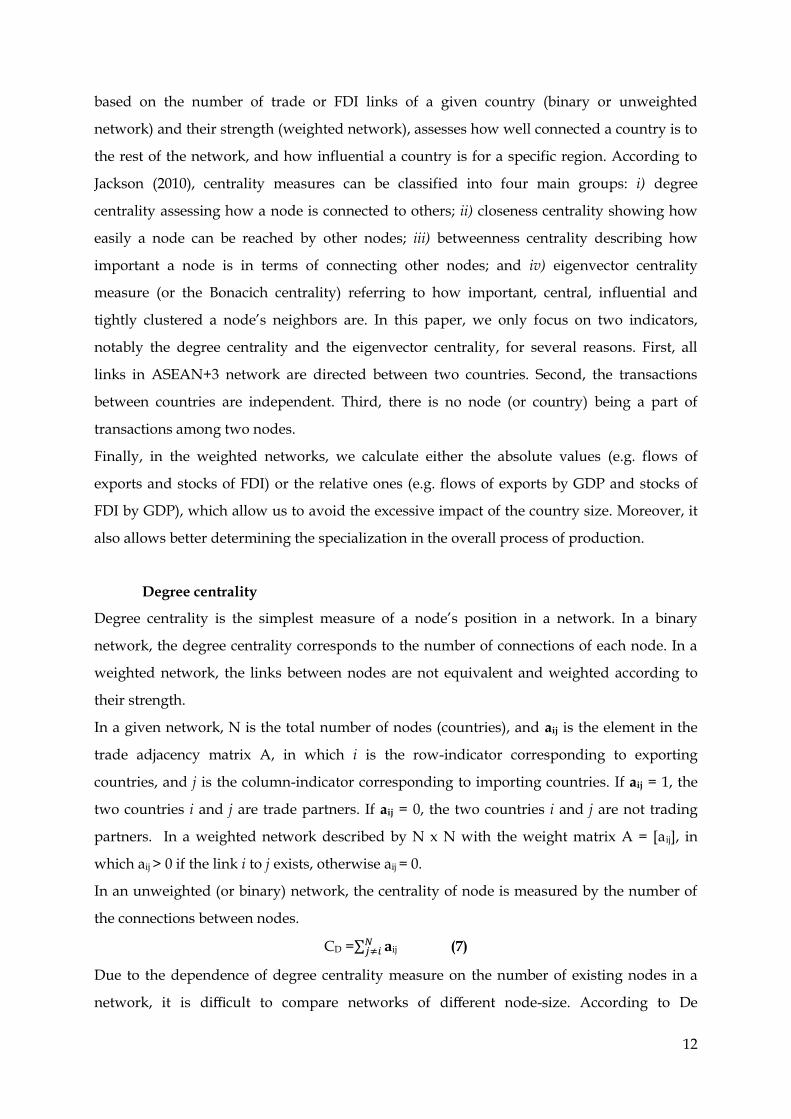
to its official integrated activities into ASEAN+3. As shown in Table 6b, when taking in
account the flows of exports by GDP, the role of China and Japan appears much more
asymmetric. They rank respectively second and first in terms of In-Degree but 12th and 13th
for the Out-Degree. This result clearly shows that China and Japan are main importers from
the ASEAN+3 area, but they mainly export outside the ASEAN+3. So, China and Japan due
to the importance of their exports and imports are the more central countries in the network

16
with an outside ASEAN strategy for their sales in foreign markets. These results confirm the
previous ones and their role of an intra-regional export hub.
Regarding other member states, founding ASEAN country members, such as Singapore and
Malaysia, have also maintained an important position in the regional trade system. The trade
position of Singapore in the weighted network is opposite to the Chinese one (see Table 6b
and Figure 2) being an important exporter to the ASEAN+3 countries and a less central
importer. Comparing to Singapore, Brunei Darussalam is not a central country in terms of
absolute values of exports and imports from and to ASEAN+3 Countries, but the country
also experiences a strong asymmetric position by ranking second in the out-degree measure
and 13th in the in-degree. By contrast, Figure 2 shows a more symmetric position in the Trade
Network of other ASEAN+3 countries, such as Korea, which however tends to be out-
ASEAN market oriented as China and Japan. Regarding the case of Indonesia, the country
moved from an export oriented position within the ASEAN+3 to an import oriented one, as
China. Meanwhile, with the small value of degree centrality indices, less developed
countries, such as Cambodia, Lao and Myanmar, have only played a peripheral in ASEAN+3
network with no clear positions.
<Insert Table 6a and 6b and Figure 2>
The center-periphery picture of ASEAN+3’s trade network is also drawn by the weighted
eigenvector index. This index allows us to analyze the interdependence among ASEAN+3
countries and resolve the question of which countries play the most central role in ASEAN+3
economic network. We present the results of eigenvector centrality indices in Tables 7a and
7b, in which the country with the highest value of eigenvector centrality is the most
connected one in the network.
<Insert Table 7a and 7b>
Again, two stories can be set out depending on the ways we weight the network. Using the
absolute values of exports from a country to another one, the eigenvector, hub and authority
indices are reproduced in Table 7a. In Table 7b, similar calculations are made using the
relative values (e.g. X/GDP) in order to take in account the country size. We first discuss the
results reported in Table 7a, then those reported in Table 7b.

17
As expected, looking at the eigenvector centrality index in table 7a, Japan is ranked first
during the period from 1990 to 2005, meaning that this country is very well connected to all
other countries in the region. From 1990 to 1997, with the value of normalized index of 55.53,
Korea ranks second because of its strong link with Japan, the most important node in the
network. Following Korea, the third position of Singapore confirms that this country is well
connected to with Japan, Korea as well as other central countries in ASEAN+3. Over the
period 1998 - 2005, China improved its positions in the network, from the fourth to the
second most central node. Since 2006 with the official integration in ASEAN+3, China has
occupied the most central role. By contrast, small countries, such as Cambodia, Lao,
Myanmar and Vietnam, are still far from the influence of China as well as of Japan and
Korea. Besides the eigenvector index, Table 7b also reports the values of hub and authority
centrality indices describing the trade flows’ direction: country with a high hub value is a key
exporter, while country with high authority value is a main imports destination. In this
regard, Japan plays a role as the first hub in ASEAN+3, following by China and Korea and
Singapore. Regarding the authority index, again top dominated countries with highest score
are the triangle China – Japan – Korea.
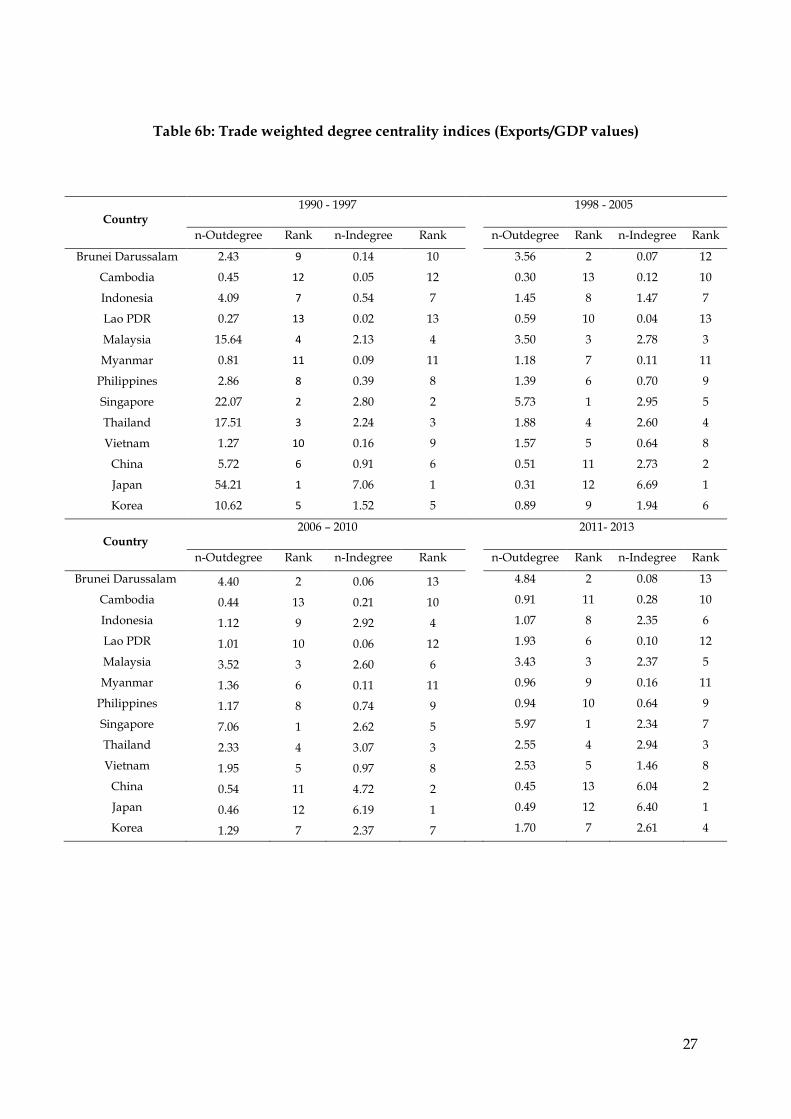
The results on authority index and eigenvector index reported in Table 7b does not change
the main previous conclusions. . However, with respect to the Hub index, and as measured
by their values of exports by GDP, China, Japan and to a less extent Korea, are no more
exporters to the ASEAN+3 countries. They are strongly specialized as a hub but for outside
the ASEAN+3 region. Philippines, Malaysia, Vietnam and Brunei are the key exporters to the
region, while the positions of Cambodia, Lao PDR, Thailand and Myanmar are more
symmetric.
<Insert Figure 2>
Apart from the results discussed above, intra-regional trade connectivity can be also
visualized through the use of mapping, which shows the intense relationships among
country members. As displayed in Figure 2, each country is represented by a node and
labeled with its name. The arrows present the direction of links, exports or imports. The size
of ties is strength of trade flow between two countries. the picture of ASEAN+3’s trade
relationships highlights some significant trend through three milestones 1995, 2005 and 2013:
(i) the leading role of China, Japan and Korea in intra-regional trade; (ii) the change in trade

18
structure before and after official implement of ASEAN+3; (iii) an increasing trend in
connectivity to the network of peripheral countries such as Philippines, Vietnam and
Cambodia. Figure 2 also shows that in 1995, founding ASEAN countries, notably Singapore,
Malaysia and Thailand were still closed to the triangle China – Japan – Korea, and
dominated ASEAN trade system. However, ten years later, these three countries moved
farther from the central places. Similarly, the group of small countries has remained such an
important distance from the central network. Overall, despite a rising trend in intra-regional
trade integration level, the participation of large and/or advanced countries, notably Japan,
China and Korea, in a common trade bloc – ASEAN+3, seems to dominate trade flows of
small and less developed countries.
5.2. FDI integration
As mentioned in the introduction section, this paper also tends to apply the tools of network
analysis to investigate intra-regional FDI connections. We start with a discussion on the FDI
intensity indices of ASEAN. First, as reported in Table 8, the level of intra-regional FDI
integration is quite different across the ten country members. For instance, Brunei
Darussalam and Singapore’s linkages in terms of FDI inflows with ASEAN country members
appear relatively weak, as the indices of intra-regional inward FDI preference are negative,
while the main FDI destinations of these two countries are ASEAN regions. By contrast,
Thailand has experienced a robust connection with ASEAN, since both indices of intra-
regional FDI preferences are strongly positive. Second, there is no common and pronounced
tendency of regional FDI integration. For instance, intra-regional FDI preferences have
declined Singapore, particularly on the outward FDI side, while the opposite trend is true in
the case of Malaysia. Third, our empirical results confirm the dominant role of five ASEAN
founding members as FDI local suppliers, as the preference index is higher for outward FDI
than for inward FDI.
We now turn our attention to the changes in intra-regional FDI integration due to an
enlargement of ASEAN AFTA (from ASEAN to ASEAN+3). On the one hand, as showed in
Table 4, ASEAN+3 is characterized by extremely high rates of intra-regional inward FDI
preference (except the case of Brunei Darussalam). On the other hand, the enlargement of
ASEAN seems to alter the structure of FDI introversion in East Asia. First, the participation
of China, Korea and Japan in the “ASEAN + framework” model has modified the position of
some ASEAN countries in the regional FDI mapping. For instance, instead of being a main

19
FDI supplier in ASEAN, Thailand has become a FDI destination in ASEAN+3. Second, the
new comer countries, in particular China, have become the main rivals of ASEAN countries
in attracting intra-regional FDI. Third, China can be seen as a FDI hub in ASEAN+3, which
could be explained by the fact that larger host country’s market may be associated with
higher FDI due to larger potential demand and lower costs due to scale economies.
<Insert Table 8>
While the results of intensity indices allow us to detect the tendency of intra-regional FDI,
those of centrality indices are used to assess whether FDI connectivity in the network is
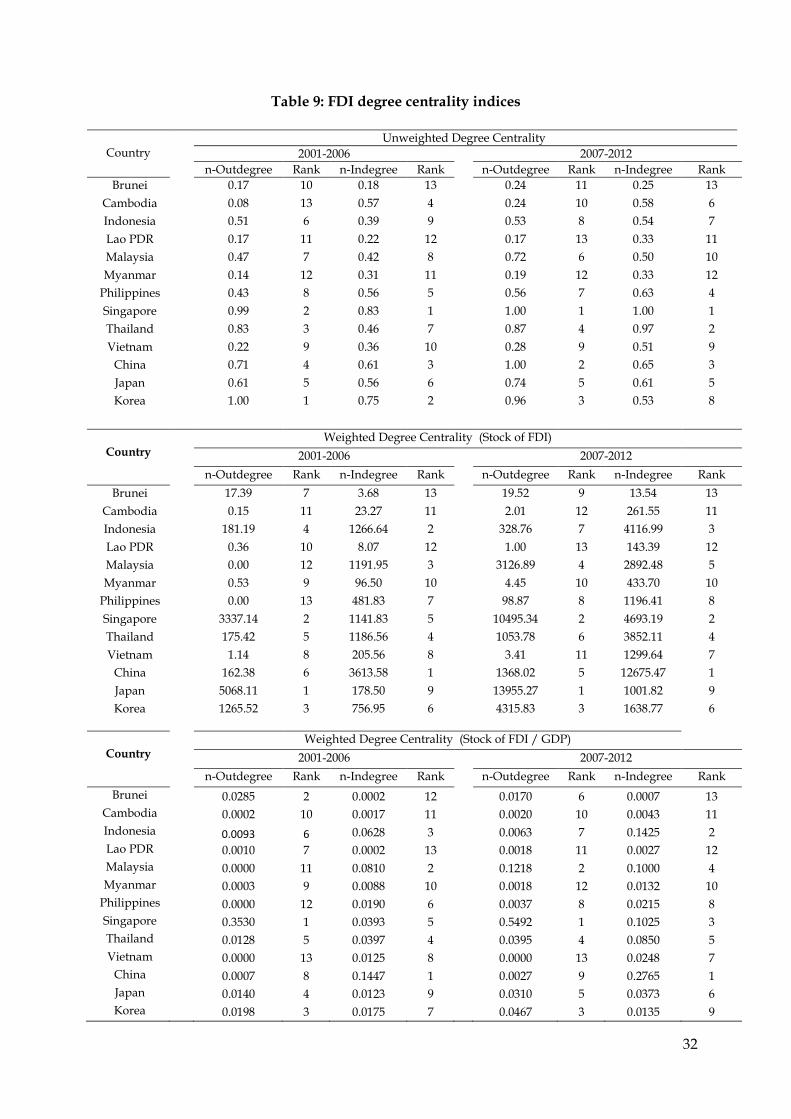
evenly distributed. To begin with, we report the degree centrality measures in Table 9, in
which we distinguish weighted and unweighted network. The first index is degree centrality
measuring how well connected a country to the rest of ASEAN+3 network. We find that in
terms of both inward and outward FDI, large and/or advanced economies are ranked in the
first positions. Among others, Singapore has experienced the best place in the network.
Differing from advanced countries, developing countries appear less connected to the system
due to their less open economies. On the other hand, Table 9 shows that the FDI position of
each country in ASEAN+3 do not change much over the time (except the case of Korea).
<Insert Table 9>
The second index is strength centrality, which weights the FDI links according their value in
current U.S. dollars. Table 9 draws a slightly different picture about FDI positions in
ASEAN+3 network. On the one hand, in terms of inward FDI, China has maintained the first
rank throughout the observation period, followed by Indonesia over 2001-2006 and by
Singapore over the recent period. On the other hand, Japan and Singapore plays a central
role in supplying FDI flows to ASEAN+3 network. In addition, we also reveal that the most
important FDI flows are mainly transferred between large and/or advanced country
members. In other words, small and less developed countries are only considered as the
satellites in regional FDI network.
A look at the weighted network as measured by the stock of FDI by GDP does not change
the previous results (see the last part of Table 9). The potential asymmetric position is
enforced. Hence China, who ranks 5 in Out-degree and 1 in In-Degree, ranks now 9 and 1
respectively. The position of Japan is more strongly impacted, moving from the first position
in terms of main capital supplier to the ASEAN+3 Region, to the 5th one when taking in
account its level of wealth as measured by GDP. Singapore now becomes the first capital
exporter in ASEAN+3.

20
The last set of centrality indicators, which are reported in Tables 10a and 10b, assesses not
only the number and amount of connections, but also the influence of each country on a
specific network. The values of eigenvector centrality confirm the most important FDI
positions in FDI network of large and/or advanced economies, in particular China and
Japan. Nevertheless the position is not as so strong when looking at the absolute values
(Table 10a) rather than the relative ones (Table 11b). Anyway, it means that these countries
are not only very well connected, but also have FDI link with most of relevant players in the
regional network. By contrast, developing countries are only considered as relatively
peripheral countries (such as Cambodia, Lao PDR, Myanmar) with such a small eigenvector
centrality index. Singapore is the more connected when taking in account the country size.
<Insert Table 10a and 10b>
Eigenvector centrality is also decomposed into hub score and authority score. This
decomposition allows one to determine the role in supplying or receiving of a country, in
FDI network. Not surprisingly, China has been ranked first in terms of authority, implying
that China has been the most important FDI destination in ASEAN+3. As suggested in a
survey work released by OECD (2000), the main factors, which make China become an
attractive destination for foreign investors, can be classified into six sub-categories: (i)
China’s market size and economic growth performance; (ii) natural and human resource
endowments; (iii) the infrastructure quality; (iv) the degree of trade openness and access to
international markets; (v) the institutional quality; and (vi) the investment policies. In terms
of being a Hub, the position of China is not so good, being at the 7th position in absolute
value and the 11th one in relative value. After China, ASEAN emerging countries, notably
Indonesia, Thailand and Singapore, have occupied the following positions in terms of FDI
recipients. Looking at the values of hub score, Japan has been the first hub in ASEAN+3 FDI
network, followed by Korea and Singapore. Taking in account the GDP, Singapore moved to
the first position. In general, China and Japan play a central role in ASEAN+3’s FDI network:
China is a leading authority, while Japan is by far the most important supplier.
<Insert Figure 3>
Eigenvector centrality indices also allows us to map FDI distribution in ASEAN+3. The
width of the link between two countries is proportional to their eigenvector centrality. As

21
displayed in Figure 3, ASEAN+3’s FDI looks geographically segmented, with the central role
played by three new-comer countries (Japan, Korea, and China), on one side, and ASEAN
founding member states (Indonesia, Thailand, Malaysia, and Singapore), on the other side. In
other words, ASEAN+3’s FDI activities are quite dominated by large and/or advanced
economies, while developing country members seem to stand outside the crowd. Overall, the
asymmetry of the FDI map results in an open question about the role of ASEAN+3 in
coordinating regional FDI flows in order to reduce the inequality of FDI distribution among
country members.
Finally, when comparing the results of the exports and FDI networks, the following facts can
be highlighted. First, as shown in Table 11b, the correlations between the Out measures (Out-
Degree and Hub) and the In measures (In-Degree and Authority) are strongly negatives
within the trade network and between trade and financial networks. Within the financial
network, Out-Degree and In-Degree are not negatively correlated, meaning that ASEAN+3
countries have a more symmetric position in the financial network. Such a strong
specialization does not appear in the network weighted by the absolute values (see Table
11a). Figure 4 highlights that no country is a hub (resp. Authority) for exports and an
authority (resp. Hub) for FDI. The asymmetry in the network is measured first by the
difference between the ranks in Out-degree and In-Degree. A positive (resp. negative) value
means that the country is mainly an exporter (resp. importer) in the ASEAN+3 area. The
second measure is the difference between the rankings as a Hub or an Authority. A positive
value means that the country is mainly a Hub (resp. Authority). As shown in Figure 4 and
reported in Table 11, no country, except Thailand, appears in the top left and bottom right
spaces. This implies that no country is at the same time a Hub and an importer, or an
Authority and an exporter. Regarding the the trade and financial networks’ specialization,
China’s position, which is clearly in the bottom right space in both networks, means that
China is importing from the ASEAN+3 countries both goods and capital, while exporting
outside the Region. By contrast, the position of Japan is not identical in goods and capital
networks. While Japan is importing goods from ASEAN+3 as China in order to export
outside the region (e.g. an intra-regional “export hub” for getting outside), in terms of capital
flows its relationship with the other ASEAN+3 Countries is more symmetric. To a lesser
extent, Korea is opposite to Japan, being in a more neutral position in the trade network, and

22
a provider of financial capital to the region. At the opposite, Vietnam is mainly an exporter
of goods to the region, but a capital receiver.
6. Conclusion
The present paper has investigated the properties of ASEAN+3’s economic integration by
using both weighted and unweighted network analysis. To the best of our knowledge, this
paper is also the first one employing the network approach to study FDI integration’s issues
in a specific economic region. In this regard, our empirical research provides a number of
important findings.
First, the level of trade and FDI integration varies among ASEAN+3 member states over the
observation period. Second, ASEAN+3’s intra-regional trade network is more densely
connected than its intra-regional FDI network. Third, comparing to standard statistics,
network analysis allows one to explore not only the first-order but also the second- and
higher-order trade and FDI relationships of any given country in the world or in a specific
region. Therefore, following the results of network analysis, we reveal that large and/or
advanced countries tend to be better linked and to form a sub-regional bloc of tightly
connected economies. In other words, this paper supports a major evidence that larger and
richer countries are central players in ASEAN+3’s trade and FDI network. Consequently,
ASEAN+3 has experienced a widening gap in the trend and patterns of intra-regional trade
and FDI among country members.
On the other hand, we also find that the enlargement from ASEAN to ASEAN+3 can be seen
as a main factor altering the structure of economic integration in East Asia. However, this
enlargement seems only strengthen trade and FDI connections among large and/or
advanced economies. This result suggests that ASEAN+3 does not complement, but is
gradually substituting ASEAN in terms of economic integration, only in favor of founding
ASEAN countries (Singapore, Thailand, Indonesia, and Malaysia) and three new comer
countries (China, Korea, and Japan).
A set of policy implications can be derived from our empirical findings. First, ASEAN+3
policy makers should revisit the existing intra-regional trade and investment agreements in
order to restructure trade and FDI connections among country members. Second, poorly
connected nodes (developing countries) should be facilitated to connect to central ones
(central countries in regional trade and FDI map) and use them as hubs to link with the rest
of ASEAN+3 network.

23
To conclude, our present research basing on the network approach provides a better
understanding of the properties of ASEAN+3’s economic integration, but it does not link the
empirical results with trade and FDI theory. In other words, this work does not attempt to
test empirically a theoretical model or to address specifically a trade and FDI issue.
Therefore, investigating the properties of ASEAN+3’s economic integration via a theoretical
model will be carried out in our future research.
References
Balassa, B., 1965. “Trade Liberalization and “Revealed” Comparative Advantage”, The Manchester School, 33, pp. 99–123.
Bonacich, P., 1972. “Factoring and weighting approaches to status scores and clique identification”, Journal of Mathematical Sociology, 2, pp.113–120.
Bonacich, P., 1987. “Power and Centrality: A Family of Measures”, American Journal of Sociology, 92, pp. 1170–1182.
Borgatti, S.P., Everett, M.G. and Freeman, L.C. 2002. “Ucinet for Windows: Software for Social Network Analysis“, Harvard, MA: Analytic Technologies.
Borgatti, S.P., 2002. “NetDraw Software for Network Visualisation“, Analytic Technologies: Lexington, KY.
Clark, William C., 2000, Environmental Globalization, in: Joseph S. Nye and John D. Donahue (eds.), Governance in a Globalizing World, Brookings Institution Press, Washington, D.C.: 86-108.
De Benedictis, L., and Tajoli, L., 2010. “International Trade networks and intermediate inputs”, Paper presented at The 8th Annual Conference of the Euro-Latin study network on Integration and Trade, CEPII, Paris, France, October 15-16.
De Benedictis, L., and Tajoli, L., 2011. “The World Trade network”, The World Economy, 34(8), pp. 1417-54.
De Benedictis, L., Nenci, S., Santoni, G., Tajoli, L., and Vicarelli, C., 2013. « Network Analysis of World Trade using the BACI-CEPII database”, CEPII Working Paper, N°2013-24.
Dreher, A., Gaston, N. and Martens, P. (2008) Measuring Globalization: Gauging its Consequence, Springer, New York.
Fagiolo, G., Reyes, J., and Schiavo, S., 2007. “International trade and financial integration:
a weighted network analysis”, Documents de Travail de l’OFCE 2007-11, Observatoire
Français des Conjonctures Economiques.
Freeman, L.C., 1978. “Centrality in social networks conceptual clarification”, Social Networks, 1, pp. 215–239.
Garlaschelli, D. and M. Loffredo, 2004, “Fitness-Dependent Topological Properties of the
World Trade Web”, Physical Review Letters, 93: 188701.
Garlaschelli, D. and M. Loffredo, 2005, “Structure and evolution of the world trade
network”, Physica A, 355, pp. 138–44.
Iapadre, L. 2006. “Regional integration agreements and the geography of world trade: statistical indicators and empirical evidence”, in P.De Lombaerde (Ed), Assessment and Measurement of Regional Integration, 66-85. London: Routledge.
Iapadre, L., and Plummer, M., 2011. “Statistical measures of regional trade integration”, in Lombaerde, R.F., Iapadre, L., and Schulz, M., (Eds), The regional integration manual: quantitative and qualitative methods, 98-123. London: Routledge.

24
Iapadre, P.L., and Tajoli, L., 2014. “Emerging countries and trade regionalization. A network analysis”, Journal of Policy Modeling, 36, pp. 89–110.
Kali, R., and Reyes, J., 2007. “The Architecture of Globalization: A Network Approach to
International Economic Integration”, Journal of International Business Studies, 38(4), pp. 595-
620.
Kali, R., and Reyes, J., 2010. “Financial contagion on the International Trade Network”,
Economic Inquiry, 48(4), pp. 1072-1101.
Kastelle, T., J. Steen and P. Liesch (2006), “Measurig globalisation: an evolutionary
economic approach to tracking the evolution of international trade”, Paper presented at the
DRUID Summer Conference on Knowledge, Innovation and Competitiveness: Dynamycs of
Firms, Networks, Regions and Institutions - Copenhagen, Denemark, June 18–20.
Kawai, M., and Wignaraja, G., 2007. “ASEAN+3 or ASEAN+6: Which Way Forward?”, ADBI Discussion Paper, N° 77 (September), Asian Development Bank Institute, Tokyo.
Kim, S. and E.-H. Shin, 2002, “A Longitudinal Analysis of Globalization and
Regionalization in International Trade: A Social Network Approach”, Social Forces, 81: 445–
71.
Li, X., Y. Y. Jin and G. Chen, 2003, “Complexity and synchronization of the World trade
Web”, Physica A: Statistical Mechanics and its Applications, 328: 287–96.
Newman, M.E.J., 2001. “Scientific collaboration networks. II. Shortest paths, weighted networks, and centrality”, Physical Review, 64, pp. 1-7.
Norris, Pippa, 2000, Global Governance and Cosmopolitan Citizens, in: Joseph S. Nye and John D. Donahue (eds.), Governance in a Globalizing World, Brookings Institution Press, Washington, D.C.: 155-177.
OECD, 2000. “Main determinants and impacts of foreign direct investment on China’s
economy”, Working paper on International Investment, N.2000/4.
Opsahl, T., Agneessens, F., and Skvoretz, J., 2010. “Node centrality in weighted networks: Generalizing degree and shortest paths”, Social Networks, 32, pp. 245–251.
Smith, D. and D. White, 1992, “Structure and Dynamics of the Global Economy: Network
Analysis of International Trade, 1965-1980”, Social Forces, 70: 857–93.
Snyder, D. and E. Kick, 1979, “Structural position in the world system and economic
growth 1955-70: A multiple network analysis of transnational interactions”, American
Journal of Sociology, 84: 1096–126.
Urata, S., 2007. “Competitive Regionalism in East Asia: An economic analysis”, GIARI
Working Paper, Vol.2 2007-E-2, Waseda University.

25
Table 5: Trade intensity indices
Country 1990 - 1997 1998 - 2005 2006-2010 2011 - 2013
RIP REP RTL TB RIP REP RTL TB RIP REP RTL TB RIP REP RTL TB
ASEAN
Brunei Darussalam -0.10 -0.22 -0.06 8.57 0.64 0.42 -0.11 25.13 0.89 0.57 -0.16 44.54 0.88 0.47 -0.21 48.32
Cambodia - - - -15.01 0.81 -0.15 -0.48 -10.21 0.81 0.17 -0.32 -5.88 0.67 0.35 -0.16 -6.39
Indonesia 0.25 0.46 0.11 1.02 0.67 0.54 -0.07 7.39 0.77 0.58 -0.09 0.34 0.71 0.61 -0.05 -0.72
Lao PDR - - - -13.74 -0.06 -0.15 -0.05 -10.84 0.95 0.85 -0.05 -8.55 0.93 0.83 -0.05 -2.98
Malaysia 0.61 0.75 0.07 -0.45 0.71 0.68 -0.02 20.37 0.71 0.68 -0.01 3.39 0.70 0.67 -0.01 12.42
Myanmar - - - -0.96 0.90 0.86 -0.02 -0.15 0.89 0.89 0.00 0.00 0.86 0.86 0.00 0.00
Philippines 0.35 0.42 0.04 -6.92 0.57 0.48 -0.04 -6.19 0.69 0.50 -0.09 -1.46 0.62 0.49 -0.07 -3.60
Singapore 0.64 0.74 0.05 13.59 0.75 0.73 -0.01 21.00 0.72 0.77 0.02 26.30 0.62 0.73 0.06 23.95
Thailand 0.43 0.61 0.09 -4.84 0.59 0.57 -0.01 7.60 0.61 0.63 0.01 6.48 0.52 0.65 0.07 2.99
Vietnam - - - -8.11 0.73 0.50 -0.12 -5.97 0.67 0.47 -0.10 -9.74 0.52 0.40 -0.06 1.15
ASEAN+3
Brunei Darussalam -0.17 -0.03 0.07 8.57 0.54 0.65 0.05 25.13 0.80 0.84 0.02 44.54 0.79 0.83 0.02 48.32
Cambodia - - - -15.01 0.70 -0.57 -0.64 -10.21 0.74 -0.43 -0.59 -5.88 0.60 -0.17 -0.38 -6.39
Indonesia 0.52 0.67 0.07 1.02 0.64 0.61 -0.02 7.39 0.69 0.60 -0.05 0.34 0.68 0.61 -0.03 -0.72
Lao PDR - - - -13.74 -0.10 -0.41 -0.16 -10.84 0.90 0.56 -0.17 -8.55 0.90 0.50 -0.20 -2.98
Malaysia 0.68 0.61 -0.04 -0.45 0.70 0.50 -0.10 20.37 0.67 0.53 -0.07 3.39 0.62 0.57 -0.02 12.42
Myanmar - - - -0.96 0.92 0.68 -0.12 -0.15 0.90 0.73 -0.08 0.00 0.90 0.79 -0.05 0.00
Philippines 0.53 0.38 -0.08 -6.92 0.62 0.43 -0.10 -6.19 0.61 0.50 -0.06 -1.46 0.55 0.56 0.00 -3.60
Singapore 0.65 0.48 -0.08 13.59 0.67 0.52 -0.07 21.00 0.60 0.58 -0.01 26.30 0.45 0.51 0.03 23.95
Thailand 0.66 0.49 -0.09 -4.84 0.68 0.47 -0.11 7.60 0.64 0.49 -0.08 6.48 0.57 0.50 -0.04 2.99
Vietnam - - - -8.11 0.77 0.50 -0.13 -5.97 0.76 0.37 -0.20 -9.74 0.73 0.36 -0.19 1.15
China 0.09 -0.06 -0.07 1.77 0.53 0.19 -0.17 3.07 0.36 -0.03 -0.19 6.48 0.15 -0.08 -0.11 2.62
Japan 0.34 0.20 -0.07 1.46 0.51 0.25 -0.13 1.49 0.46 0.35 -0.05 0.94 0.39 0.39 0.00 -1.91
Korea 0.50 0.38 -0.06 -1.20 0.56 0.38 -0.09 6.27 0.50 0.40 -0.05 1.95 0.35 0.44 0.04 3.12
Notes: RIP: Revealed import preference; REP: Revealed export preference; RTL: Revealed trade leadership; TB: Trade balance (% of GDP)

26
Table 6a: Trade weighted degree centrality indices (Export values)
Country
1990 - 1997 1998 - 2005
n-Outdegree Rank n-Indegree Rank n-Outdegree Rank n-Indegree Rank
Brunei Darussalam 179.75 10 131.04 10 225.77 10 103.76 12
Cambodia 12.23 12 57.38 12 12.62 12 142.70 11
Indonesia 1,759.33 6 1,201.02 7 2,658.31 6 2,316.98 7
Lao PDR 6.82 13 25.54 13 10.95 13 85.80 13
Malaysia 2,181.13 5 2,679.15 4 3,603.64 5 4,136.91 5
Myanmar 44.87 11 116.82 11 110.12 11 196.23 10
Philippines 426.23 8 855.67 8 1,179.28 8 1,811.18 8
Singapore 3,158.96 2 3,849.24 2 5,596.99 3 5,021.33 4
Thailand 1,412.85 7 2,107.35 6 2,592.02 7 2,920.31 6
Vietnam 187.67 9 305.49 9 631.78 9 1,010.23 9
China 2,767.77 4 2,413.49 5 7,960.26 2 8,156.67 2
Japan 7,915.29 1 6,111.64 1 11,390.39 1 10,014.26 1
Korea 2,815.25 3 3,014.34 3 5,581.44 4 5,637.21 3
Country
2006 – 2010
2011- 2013
n-Outdegree Rank n-Indegree Rank n-Outdegree Rank n-Indegree Rank
Brunei Darussalam 541.52 10 277.59 12 802.83 12 553.74 12
Cambodia 43.35 13 466.62 10 129.38 10 961.27 11
Indonesia 5,655.49 7 6,473.36 6 9,207.84 6 10,865.27 6
Lao PDR 56.83 12 172.42 13 191.26 13 424.94 13
Malaysia 7,284.98 5 8,174.90 5 10,391.51 5 11,490.16 5
Myanmar 329.12 11 460.41 11 588.65 11 1,158.32 10
Philippines 1,864.76 8 3,206.95 9 2,340.38 9 4,690.03 9
Singapore 13,431.71 3 9,941.89 4 17,065.32 4 12,806.40 4
Thailand 6,148.57 6 6,421.43 7 9,323.44 7 10,186.52 7
Vietnam 1,811.87 9 3,691.17 8 3,911.22 8 7,493.02 8
China 22,642.83 1 24,385.59 1 37,135.44 1 35,790.92 1
Japan 21,999.93 2 18,783.33 2 27,315.86 2 26,170.32 2
Korea 13,194.96 4 12,550.25 3 21,120.07 3 16,932.27 3
27
Table 6b: Trade weighted degree centrality indices (Exports/GDP values)
Country
1990 - 1997 1998 - 2005
n-Outdegree Rank n-Indegree Rank n-Outdegree Rank n-Indegree Rank
Brunei Darussalam 2.43 9 0.14 10 3.56 2 0.07 12
Cambodia 0.45 12 0.05 12 0.30 13 0.12 10
Indonesia 4.09 7 0.54 7 1.45 8 1.47 7
Lao PDR 0.27 13 0.02 13 0.59 10 0.04 13
Malaysia 15.64 4 2.13 4 3.50 3 2.78 3
Myanmar 0.81 11 0.09 11 1.18 7 0.11 11
Philippines 2.86 8 0.39 8 1.39 6 0.70 9
Singapore 22.07 2 2.80 2 5.73 1 2.95 5
Thailand 17.51 3 2.24 3 1.88 4 2.60 4
Vietnam 1.27 10 0.16 9 1.57 5 0.64 8
China 5.72 6 0.91 6 0.51 11 2.73 2
Japan 54.21 1 7.06 1 0.31 12 6.69 1
Korea 10.62 5 1.52 5 0.89 9 1.94 6
Country
2006 – 2010
2011- 2013
n-Outdegree Rank n-Indegree Rank n-Outdegree Rank n-Indegree Rank
Brunei Darussalam 4.40 2 0.06 13 4.84 2 0.08 13
Cambodia 0.44 13 0.21 10 0.91 11 0.28 10
Indonesia 1.12 9 2.92 4 1.07 8 2.35 6
Lao PDR 1.01 10 0.06 12 1.93 6 0.10 12
Malaysia 3.52 3 2.60 6 3.43 3 2.37 5
Myanmar 1.36 6 0.11 11 0.96 9 0.16 11
Philippines 1.17 8 0.74 9 0.94 10 0.64 9
Singapore 7.06 1 2.62 5 5.97 1 2.34 7
Thailand 2.33 4 3.07 3 2.55 4 2.94 3
Vietnam 1.95 5 0.97 8 2.53 5 1.46 8
China 0.54 11 4.72 2 0.45 13 6.04 2
Japan 0.46 12 6.19 1 0.49 12 6.40 1
Korea 1.29 7 2.37 7 1.70 7 2.61 4

28
Figure 2: Evolution of the asymmetry in the rank of the weighted degree centrality indexes
(Rank in Out-degree – Rank in In-degree)
-13
-8
-3
2
7
12
Brunei Darussalam
Cambodia
China
Indonesia
Japan
Korea
Lao PDR
Malaysia
Myanmar
Philippines
Singapore
Thailand
Vietnam

29
Table 7a: Trade centrality indices (X Network)
Country
1990 - 1997 1998 - 2005
Eigenvec nEigenvec Rank Hub Rank Authority Rank Eigenvec nEigenvec Rank Hub Rank Authority Rank
Brunei 0.03 4.32 10 0.02 9 0.01 10 0.02 2.28 10 0.01 12 0.01 13
Cambodia 0.00 0.63 12 0.00 12 0.00 12 0.01 0.71 12 0.00 13 0.01 12
Indonesia 0.21 29.92 7 0.20 6 0.18 7 0.17 24.29 6 0.21 6 0.17 7
Lao PDR 0.00 0.23 13 0.00 13 0.00 13 0.00 0.43 13 0.03 11 0.02 11
Malaysia 0.28 39.45 5 0.24 5 0.32 5 0.22 30.79 5 0.26 4 0.27 5
Myanmar 0.01 1.31 11 0.00 11 0.01 11 0.01 1.44 11 0.05 9 0.06 10
Philippines 0.09 12.96 8 0.04 8 0.12 8 0.11 15.72 8 0.06 8 0.11 8
Singapore 0.38 53.99 3 0.26 4 0.46 2 0.28 40.20 4 0.24 5 0.29 4
Thailand 0.24 34.41 6 0.14 7 0.31 6 0.17 23.63 7 0.13 7 0.17 6
Vietnam 0.03 4.59 9 0.02 10 0.03 9 0.05 7.75 9 0.04 10 0.07 9
China 0.33 47.06 4 0.28 2 0.35 4 0.52 72.96 2 0.49 2 0.52 1
Japan 0.63 88.44 1 0.81 1 0.39 3 0.59 82.76 1 0.59 1 0.46 2
Korea 0.39 55.53 2 0.27 3 0.50 1 0.43 60.47 3 0.33 3 0.40 3
Country
2006 - 2010 2010 - 2013
Eigenvec nEigenvec Rank Hub Rank Authority Rank Eigenvec nEigenvec Rank Hub Rank Authority Rank
Brunei 0.02 2.61 10 0.01 10 0.01 12 0.02 3.10 10 0.01 10 0.01 12
Cambodia 0.01 0.99 12 0.00 13 0.01 11 0.01 1.67 12 0.00 13 0.01 11
Indonesia 0.17 24.36 6 0.14 6 0.15 7 0.19 27.48 5 0.17 6 0.19 7
Lao PDR 0.00 0.32 13 0.00 12 0.00 13 0.00 0.69 13 0.00 12 0.00 13
Malaysia 0.18 25.39 5 0.17 5 0.19 5 0.19 27.19 6 0.18 5 0.19 6
Myanmar 0.01 1.51 11 0.01 11 0.01 10 0.02 2.76 11 0.01 11 0.02 10
Philippines 0.07 10.56 9 0.05 8 0.08 9 0.08 11.43 9 0.05 9 0.09 9
Singapore 0.26 36.68 4 0.27 4 0.23 4 0.24 34.26 4 0.26 4 0.22 4
Thailand 0.16 22.16 7 0.14 7 0.17 6 0.18 24.84 7 0.15 7 0.19 5
Vietnam 0.09 12.70 8 0.04 9 0.09 8 0.14 20.04 8 0.07 8 0.15 8
China 0.59 83.19 1 0.45 2 0.73 1 0.60 85.05 1 0.53 2 0.69 1
Japan 0.54 76.59 2 0.67 1 0.40 2 0.50 70.95 2 0.56 1 0.46 2
Korea 0.44 62.21 3 0.45 3 0.38 3 0.44 62.21 3 0.49 3 0.35 3
30
Table 7b: Trade centrality indices (X/GDP Network)
Country
1990 - 1997 1998 - 2005
Eigenvec nEigenvec Rank Hub Rank Authority Rank Eigenvec nEigenvec Rank Hub Rank Authority Rank
Brunei 0.34 47.82 4 0.53 2 0.01 12 0.34 47.82 4 0.53 2 0.01 12
Cambodia 0.03 3.64 13 0.03 12 0.01 11 0.03 3.64 13 0.03 12 0.01 11
Indonesia 0.22 30.83 7 0.19 5 0.20 7 0.22 30.83 7 0.19 5 0.20 7
Lao PDR 0.04 5.15 12 0.04 11 0.00 13 0.04 5.15 12 0.04 11 0.00 13
Malaysia 0.40 57.06 3 0.36 3 0.40 2 0.40 57.06 3 0.36 3 0.40 2
Myanmar 0.09 12.48 11 0.11 8 0.01 10 0.09 12.48 11 0.11 8 0.01 10
Philippines 0.14 19.88 9 0.18 7 0.08 8 0.14 19.88 9 0.18 7 0.08 8
Singapore 0.47 66.16 2 0.60 1 0.25 4 0.47 66.16 2 0.60 1 0.25 4
Thailand 0.26 36.28 5 0.22 4 0.24 5 0.26 36.28 5 0.22 4 0.24 5
Vietnam 0.14 19.41 10 0.19 6 0.05 9 0.14 19.41 10 0.19 6 0.05 9
China 0.22 31.13 6 0.07 10 0.25 3 0.22 31.13 6 0.07 10 0.25 3
Japan 0.48 68.01 1 0.02 13 0.70 1 0.48 68.01 1 0.02 13 0.70 1
Korea 0.20 27.94 8 0.10 9 0.23 6 0.20 27.94 8 0.10 9 0.23 6
Country
2006 - 2010 2010 - 2013
Eigenvec nEigenvec Rank Hub Rank Authority Rank Eigenvec nEigenvec Rank Hub Rank Authority Rank
Brunei 0.34 48.23 4 0.57 2 0.0078 12 0.38 54.17 3 0.64 1 0.01 12
Cambodia 0.04 5.13 13 0.02 13 0.0162 10 0.08 10.58 12 0.07 11 0.02 10
Indonesia 0.30 41.71 6 0.11 8 0.4076 3 0.22 31.61 9 0.11 8 0.27 4
Lao PDR 0.05 7.09 12 0.05 11 0.0038 13 0.12 16.76 10 0.14 7 0.01 13
Malaysia 0.36 50.34 3 0.30 3 0.3458 4 0.32 45.66 5 0.32 3 0.25 5
Myanmar 0.08 11.90 11 0.09 9 0.0108 11 0.07 9.17 13 0.08 10 0.01 11
Philippines 0.11 15.60 10 0.12 7 0.0748 9 0.09 12.95 11 0.11 9 0.06 9
Singapore 0.48 67.28 1 0.65 1 0.1496 7 0.40 56.64 2 0.51 2 0.15 7
Thailand 0.23 33.06 7 0.22 4 0.1824 6 0.24 33.84 7 0.24 5 0.19 6
Vietnam 0.16 22.09 9 0.19 5 0.078 8 0.23 31.93 8 0.27 4 0.12 8
China 0.33 46.66 5 0.05 10 0.4168 2 0.36 51.44 4 0.04 12 0.46 2
Japan 0.41 58.53 2 0.04 12 0.6232 1 0.44 61.59 1 0.04 13 0.70 1
Korea 0.23 32.64 8 0.13 6 0.2564 5 0.27 37.99 6 0.18 6 0.29 3

31
Table 8: FDI intensity indices
Country
Revealed inward stock preference
Revealed outward stock preference
Revealed FDI leadership
2001-2006 2007-2012 2001-2006 2007-2012 2001-2006 2007-2012
ASEAN
Brunei Darussalam -0.74 -0.65 0.94 0.93 0.84 0.79
Cambodia 0.90 0.81 -0.75 0.37 -0.82 -0.22
Indonesia -1.00 0.17 0.16 0.89 0.58 0.36
Lao PDR 0.14 0.83 -0.14 0.79 -0.14 -0.02
Malaysia -1.00 0.36 -1.00 0.61 0.00 0.15
Myanmar 0.79 0.78 0.00 0.00 -0.40 -0.39
Philippines 0.43 0.04 -1.00 -0.17 -0.72 -0.11
Singapore -0.13 -0.28 0.88 0.31 0.51 0.55
Thailand 0.52 0.59 0.92 0.92 0.20 0.16
Vietnam 0.23 0.26 0.00 0.00 -0.11 -0.13
ASEAN+3
Brunei Darussalam -0.75 -0.52 0.73 0.69 0.74 0.60
Cambodia 0.93 0.95 -0.93 -0.35 -0.93 -0.65
Indonesia -1.00 0.25 0.18 0.88 0.59 0.32
Lao PDR 0.49 0.98 -0.36 0.65 -0.42 -0.20
Malaysia -1.00 0.32 -1.00 0.35 0.00 0.01
Myanmar 0.50 0.72 0.00 0.00 -0.25 -0.36
Philippines 0.96 0.93 -1.00 -0.30 -0.98 -0.62
Singapore 0.71 0.59 0.70 0.69 -0.01 0.05
Thailand 0.95 0.97 0.73 0.80 -0.11 -0.09
Vietnam 0.78 0.91 0.00 0.00 -0.39 -0.45
China 0.75 0.54 -0.62 -0.70 -0.69 -0.62
Japan -0.23 0.16 0.06 0.09 0.15 -0.03
Korea 0.92 0.93 0.69 0.46 -0.12 -0.23
32
Table 9: FDI degree centrality indices
Country
Unweighted Degree Centrality
2001-2006 2007-2012
n-Outdegree Rank n-Indegree Rank n-Outdegree Rank n-Indegree Rank
Brunei 0.17 10 0.18 13 0.24 11 0.25 13
Cambodia 0.08 13 0.57 4 0.24 10 0.58 6
Indonesia 0.51 6 0.39 9 0.53 8 0.54 7
Lao PDR 0.17 11 0.22 12 0.17 13 0.33 11
Malaysia 0.47 7 0.42 8 0.72 6 0.50 10
Myanmar 0.14 12 0.31 11 0.19 12 0.33 12
Philippines 0.43 8 0.56 5 0.56 7 0.63 4
Singapore 0.99 2 0.83 1 1.00 1 1.00 1
Thailand 0.83 3 0.46 7 0.87 4 0.97 2
Vietnam 0.22 9 0.36 10 0.28 9 0.51 9
China 0.71 4 0.61 3 1.00 2 0.65 3
Japan 0.61 5 0.56 6 0.74 5 0.61 5
Korea 1.00 1 0.75 2 0.96 3 0.53 8
Country
Weighted Degree Centrality (Stock of FDI)
2001-2006 2007-2012
n-Outdegree Rank n-Indegree Rank n-Outdegree Rank n-Indegree Rank
Brunei 17.39 7 3.68 13 19.52 9 13.54 13
Cambodia 0.15 11 23.27 11 2.01 12 261.55 11
Indonesia 181.19 4 1266.64 2 328.76 7 4116.99 3
Lao PDR 0.36 10 8.07 12 1.00 13 143.39 12
Malaysia 0.00 12 1191.95 3 3126.89 4 2892.48 5
Myanmar 0.53 9 96.50 10 4.45 10 433.70 10
Philippines 0.00 13 481.83 7 98.87 8 1196.41 8
Singapore 3337.14 2 1141.83 5 10495.34 2 4693.19 2
Thailand 175.42 5 1186.56 4 1053.78 6 3852.11 4
Vietnam 1.14 8 205.56 8 3.41 11 1299.64 7
China 162.38 6 3613.58 1 1368.02 5 12675.47 1
Japan 5068.11 1 178.50 9 13955.27 1 1001.82 9
Korea 1265.52 3 756.95 6 4315.83 3 1638.77 6
Country
Weighted Degree Centrality (Stock of FDI / GDP)
2001-2006 2007-2012
n-Outdegree Rank n-Indegree Rank n-Outdegree Rank n-Indegree Rank
Brunei 0.0285 2 0.0002 12 0.0170 6 0.0007 13
Cambodia 0.0002 10 0.0017 11 0.0020 10 0.0043 11
Indonesia 0.0093 6 0.0628 3 0.0063 7 0.1425 2
Lao PDR 0.0010 7 0.0002 13 0.0018 11 0.0027 12
Malaysia 0.0000 11 0.0810 2 0.1218 2 0.1000 4
Myanmar 0.0003 9 0.0088 10 0.0018 12 0.0132 10
Philippines 0.0000 12 0.0190 6 0.0037 8 0.0215 8
Singapore 0.3530 1 0.0393 5 0.5492 1 0.1025 3
Thailand 0.0128 5 0.0397 4 0.0395 4 0.0850 5
Vietnam 0.0000 13 0.0125 8 0.0000 13 0.0248 7
China 0.0007 8 0.1447 1 0.0027 9 0.2765 1
Japan 0.0140 4 0.0123 9 0.0310 5 0.0373 6
Korea 0.0198 3 0.0175 7 0.0467 3 0.0135 9

33
Table 10a: FDI centrality indices in the weighted Networks (FDI)
Country
2001-2006 2007-2012
nEigenvec Rank
Hub Rank
Authority Rank
nEigenvec Rank
Hub Rank
Authority Rank
Brunei Darussalam
0.400 11
0.002 7
0.001 13
0.164 13
0.001 9
0.001 13
Cambodia
0.411 12
0.000 10
0.003 11
1.225 11
0.000 13
0.005 11
Indonesia
30.024 5
0.042 5
0.295 4
24.738 6
0.022 6
0.236 3
Lao PDR
0.134 13
0.000 10
0.001 12
0.792 12
0.000 12
0.002 12
Malaysia
26.871 7
0.000 10
0.277 5
23.027 7
0.058 4
0.210 5
Myanmar
1.603 10
0.000 9
0.012 10
2.552 10
0.000 10
0.016 10
Philippines
10.958 8
0.000 10
0.120 7
8.473 8
0.002 8
0.091 7
Singapore
67.351 3
0.524 2
0.310 2
65.905 3
0.577 2
0.220 4
Thailand
27.830 6
0.017 4
0.306 3
29.541 5
0.032 5
0.304 2
Vietnam
3.150 9
0.000 8
0.024 9
6.521 9
0.000 11
0.059 8
China
72.186 2
0.006 6
0.760 1
80.112 1
0.022 7
0.849 1
Japan
79.308 1
0.812 1
0.027 8
76.075 2
0.758 1
0.047 9
Korea 37.144 4 0.250 3 0.207 6 35.700 4 0.289 3 0.140 6

34
Table 10b: FDI centrality indices in the weighted Networks (FDI/GDP)
Country
2001-2006 2007-2012
nEigenvec Rank
Hub Rank
Authority Rank
nEigenvec Rank
Hub Rank
Authority Rank
Brunei Darussalam
17.1327 6
0.0003 8
0.0023 11
5.9227 9
0.0015 9
0.0022 13
Cambodia
0.7010 12
0.0002 9
0.0072 10
0.7415 12
0.0010 11
0.0040 11
Indonesia
36.5607 4
0.0253 4
0.3545 3
39.2337 4
0.0103 6
0.3623 2
Lao PDR
0.2617 13
0.0005 6
0.0022 12
0.6235 13
0.0020 7
0.0028 12
Malaysia
46.6070 3
0.0000 10
0.4867 2
40.0742 3
0.0832 3
0.3408 3
Myanmar
3.8705 11
0.0000 12
0.0368 9
3.6512 11
0.0003 12
0.0363 9
Philippines
10.0818 8
0.0000 11
0.1035 5
6.1740 8
0.0015 8
0.0610 6
Singapore
98.7752 1
0.9972 1
0.0020 13
96.9638 1
0.9893 1
0.0232 10
Thailand
22.7742 5
0.0162 5
0.2210 4
26.7727 5
0.0332 5
0.2447 4
Vietnam
5.1215 10
0.0000 13
0.0495 8
4.6872 10
0.0000 13
0.0393 7
China
73.2335 2
0.0005 7
0.7437 1
78.7878 2
0.0010 10
0.8152 1
Japan
9.4148 9
0.0298 3
0.0685 7
15.0883 6
0.0472 4
0.1140 5
Korea 15.3870 7 0.0635 2 0.0977 6 12.3627 7 0.0930 2 0.0387 8

35
Figure 3: Changes in ASEAN+3’s trade mapping
Source: Authors’ creation’
1995
2005
2013

36
Figure 4: Changes in ASEAN+3’s FDI mapping
Source: Authors’ creation
2001
2006
2012

37
Table 11a: Pearson Correlation Matrix of the measures of the 2012 weighted network
(Flows of X or stock of FDI).
X FDI
OutDeg InDeg Eig. Hub Auth. OutDeg InDeg Eig Hub Auth
X
OutDeg 1
InDeg 0.987 1
Eig. 0.984 0.97 1
Hub 0.948 0.907 0.978 1
Auth. 0.982 0.994 0.979 0.917 1
FDI
OutDeg 0.779 0.798 0.681 0.554 0.775 1
InDeg 0.504 0.428 0.571 0.709 0.421 -0.051 1
Eig. 0.96 0.931 0.93 0.914 0.912 0.763 0.604 1
Hub 0.783 0.802 0.688 0.56 0.782 1 -0.053 0.762 1
Auth. 0.501 0.43 0.561 0.685 0.423 -0.008 0.985 0.627 -0.01 1
Table 11b: Pearson Correlation Matrix of the measures of the 2012 weighted network
(Flows of X to GDP, or stock of FDI to GDP).
X/GDP FDI/GDP OutDeg InDeg Eig. Hub Auth. OutDeg InDeg Eig Hub Auth
X/GDP
OutDeg 1
InDeg -0.29 1
Eig. 0.434 0.663 1
Hub 0.934 -0.326 0.463 1
Auth. -0.353 0.952 0.642 -0.361 1
FDI/GDP
OutDeg 0.716 0.085 0.416 0.474 -0.003 1
InDeg -0.118 0.614 0.358 -0.175 0.408 0.167 1
Eig. 0.325 0.496 0.514 0.156 0.298 0.695 0.82 1
Hub 0.671 0.071 0.377 0.432 -0.015 0.984 0.151 0.685 1
Auth. -0.314 0.613 0.272 -0.296 0.437 -0.123 0.944 0.61 -0.158 1
Source: Authors’ creation

38
Figure 5: Specialization as measured by asymmetry in network rankings in 2012
Source: Authors’ creation