Embed Size (px)
Citation preview
DRAFT, FOR COMMENTS ONLY NOT FOR CITATION
Economic integration, inequality and growth: Theory and comparative assessment
Giovanni Andrea Cornia University of Florence
Background paper World Economic and Social Survey2010
First complete but preliminary draft (23-1-10), for comments only, not for citation
Economic integration, inequality and growth: Theory and comparative assessment
by Giovanni Andrea Cornia1,
University of Florence 1. Introduction. In every respect, the world economy is far more integrated today than in 1980, the conventional year used to mark the beginning of the current globalization. Such growing economic, social, political and cultural integration is to a large extent the result of endogenous changes in the field of transport, information, and telecommunication technologies and in demographic trends (large population deficits and surpluses in different regions of the world). Yet, the public policies that have dominated the scene until the onset of the recent financial crisis (and that for convenience will be referred to as the Washington Consensus) did contribute to accelerating and spreading economic integration by promoting the liberalization of all types of international transactions with the exception of the free circulation of labour. The same three decades have also been accompanied by a gradual spread of liberal democracy in many regions (most notably in the former socialist countries of Europe and Latin America). Surprisingly, however, these favourable technological, economic and political changes that occurred over the 1980s and 1990s were accompanied by a widespread increase in income inequality and a decline in GDP growth rates with the exception of China, India, Vietnam and a few others countries which developed home-grown policy approaches to liberalization. In contrast, before the onset of the financial crisis in 2008, the current decade has witnessed a recovery in practically all developing and transitional regions while – contrary to expectations - inequality declined markedly in Latin America, while continuing to increase (if less generally and only moderately) in all other regions. How can one explain these trends? What is the relation between international economic integration, growth and inequality? Are there policies that can help moving towards an equitable and efficient model of economic integration? Is the recent experience of countries which followed an home-grown approach to development of any use to guide future policy making? These are the main issues discussed in the paper. Part 1 briefly reviews what economic theory has to say about the causes of inequality in developing countries. In turn, Part 2 analyzes the trends in domestic income inequality over 1980-2000 and over 2000- 2008. Part 3 discusses the theory and empirical evidence of the impact of international trade, FDI, portfolio flows and migration. Part 4, compares the different approaches to economic integration followed in Latin America and the European economies in transition. Finally, Part 5 suggests domestic policies which could help countries benefitting from global economic integration while avoiding the problems of inequality and instability that have characterized the last three decades.
1 The author would like to thank Bruno Martorano for invaluable research assistance.
2. Theories of domestic income inequality What are the main determinants of income inequality? Before answering this question is necessary to underscore three points are relevant to the current theoretical discussion of inequality. First, classical (e.g. Ricardian) and neo-classical (e.g. Solow’s) theories focus on ‘positive’ explanations of changes in the ‘factor shares’ (i.e. the shares of wages, profits and rents in total income), due to endogenous changes in factor endowments, ageing, migration, and technology, given existing institutions. The main limitations of these models is their reliance on representative agents (i.e. homogeneous groups of land owners, capitalists, wage earners) with all members of each group receiving the same remuneration. Yet, while it is necessary to pay attention (as often ignored these days) to changes in factor shares, the empirical evidence shows that a large part of income inequality and of its changes over time is explained by variations in the distribution of income among wage earners, rentiers, and profit recipients. In many economies, wages accounts for between 50-80 percent of total income and changes in wage inequality do explain a large part of the dispersion of the distribution of personal income. It is therefore necessary to explain wage polarization as well as the changes in the distribution of profits, rents and other capital incomes2. Secondly, while very insightful, most ‘dualistic models’ à la Kuznets (characterized by a ‘modern’ and ‘backward’ sector, or in their modern reformulation of ‘unskilled’ versus ‘skilled’ workers able to use the new technologies)3 help little in explaining the evolution of inequality. Thirdly, these positive models of income inequality ignore the role of public policies and of changes in institutions which as - shown by many studies - can improve inequality (as in the case of egalitarian land, credit, educational and social security reforms) or worsen it (as in the case of financial deregulation) by affecting either the factor shares or the distribution of wages, capital incomes and public transfers. The explanation of changes in the distribution of the net disposable income requires therefore taking into consideration both positive, normative and institutional factors. 2.1. A framework to explain income inequality changes over time and across countries A general framework capable to take into account inequality changes due to both the factorial and within-factorial distribution of income with heterogeneous agents, decomposes the income of household ‘i’ as the sum of the products of its factors endowments of unskilled labor (LF), human capital (HC), physical capital (K), and land and other non reproducible assets (L) by their returns, i.e. ‘uw’ (unskilled wage), ‘sw’ (skilled wage), ‘rk (return on capital), and ‘r’ (the rent of the land, mines, etc. In symbols:
yi = uw LFi + sw HKi + r Li + rk Ki
Assuming the state taxes all these incomes at different rates and that it redistributes some of the revenue so obtained in the form of income transfers to households the posts tax- and transfer income of person ‘i’ becomes:
2 Recent work by Piketty and Atkinson shows for instance that much of the recent increase in inequality in the US and UK is due to the polarisation of the distribution of wages and salaries, with the emergence of a class of ‘working super-rich’ rather than to changes in factor shares. 3 Kanbur (1998, p. 12) notes on the basis of a review of the post-war literature on income distribution that “Despite the huge amount of resources devoted to the development-distribution relationship in the (cross-sectional) Kuznetsian approach, it has to be said that the harvest is meager”.

yi = uw LFi (1-tuw)+ sw HKi(1-tsw) + r Li (1-tr) + rk Ki(1- trc) + TRi
The evolution over time of the income share of household ‘i’ (yi/Y) (and therefore – if considering all households - of the Gini coefficient of disposable income) depends on the: - evolution of the distribution of production factors (LF, HK, L, K) among households - remuneration of production factors (uw, sw, r, rc), - the changes transfers (TR) received less the taxes (‘t’) paid by each household on different income types where the bottom percentiles yi generally receive most of their incomes from unskilled labor and transfers and the top ones from skilled labor and capital income. Such simple framework can be used to understand cross-country differences in inequality as well as its evolution during the recent period of fast global economic integration. For instance, a high concentration of the distribution of L, HC and K traditionally explains the high levels of inequality in developing countries. In turn, the dominant ‘North-Atlantic’ explanation of the rise of inequality during the 1980s and 1990s focuses on the ‘skill premium’ (i.e. the in ratio ‘sw/uw’) caused either by an increase in the demand for HK due to technological change, or migration of unskilled labor (which increases the supply of LF and reduce ‘uw’), and so on. And in the USA, during the Reagan era, a rise in capital returns (rk) and decline of tax rates on capital income (trc) raised inequality. 2.2. Traditional determinants of domestic income inequality The above framework can be used to discuss first the determinants of income inequality in an economy with a low international economic integration, and then how its main components are affected by the external liberalization. Before the onset of the ‘second globalization of 1980-2007, differences in inequality levels and trends could be traced to three sets of causes: factors supply (LF, HC, L, K) and their distribution, returns to each of them (uw, sw, r, rc) and redistribution by the state (t, TR). 2.2.1. inequality and aggregate supply and distribution of endowments (LF, HC, K, L) (i) aggregate supply and distribution of LF. Overall LF supply is mainly influenced by demographic trends. It increases rapidly – with a lag of about 15 years – until the onset of the first demographic transition, then it stabilizes gradually, while declining – also with a lag – with the onset of the second demographic transition, as shown by the recent experience of most European countries. The distribution of LF across households is not uniform, as it depends on family composition and activity rates. It is much lower in female headed and incomplete households and families with a high dependency ratios and low activity rate (which depends on the female labor force participation). Except for a handful of advanced economies, the latter is much smaller than that of men. The impact of an increase in FLFP has ambiguous effects on income inequality. If the ‘assortative mating’ hypothesis (according to which people marry a spouse broadly of the same level of education and skills) is verified, the impact on the distribution of household money income
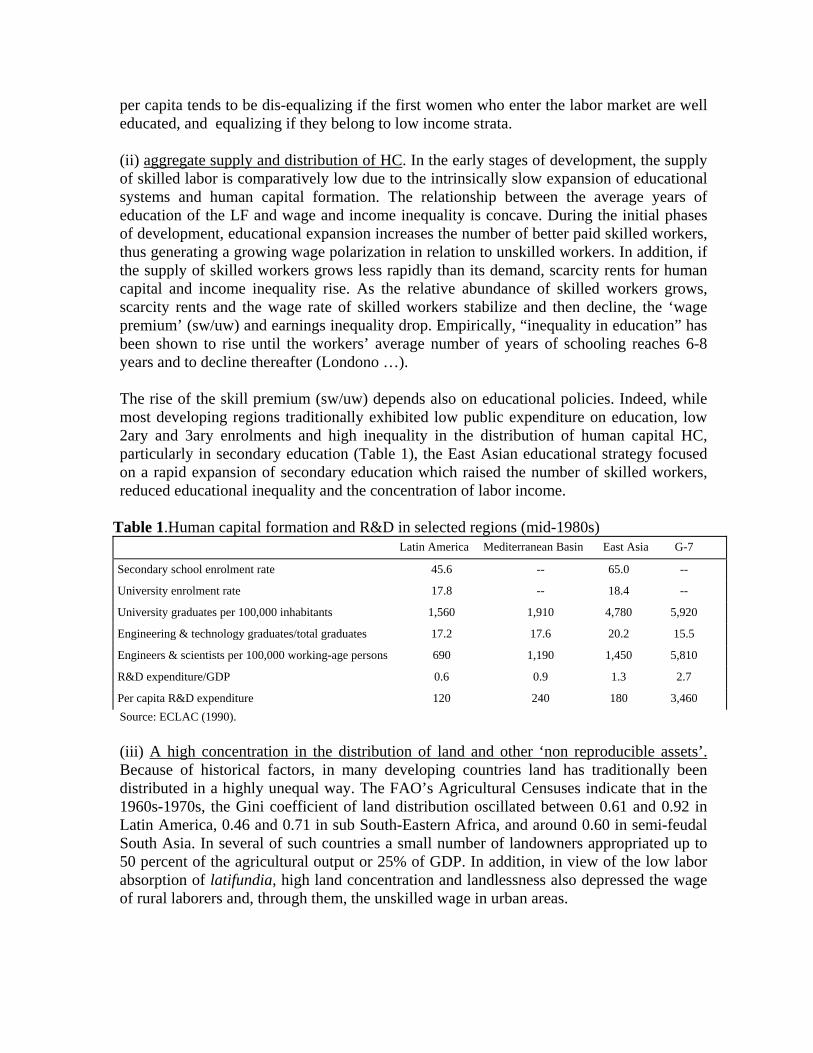
per capita tends to be dis-equalizing if the first women who enter the labor market are well educated, and equalizing if they belong to low income strata. (ii) aggregate supply and distribution of HC. In the early stages of development, the supply of skilled labor is comparatively low due to the intrinsically slow expansion of educational systems and human capital formation. The relationship between the average years of education of the LF and wage and income inequality is concave. During the initial phases of development, educational expansion increases the number of better paid skilled workers, thus generating a growing wage polarization in relation to unskilled workers. In addition, if the supply of skilled workers grows less rapidly than its demand, scarcity rents for human capital and income inequality rise. As the relative abundance of skilled workers grows, scarcity rents and the wage rate of skilled workers stabilize and then decline, the ‘wage premium’ (sw/uw) and earnings inequality drop. Empirically, “inequality in education” has been shown to rise until the workers’ average number of years of schooling reaches 6-8 years and to decline thereafter (Londono …). The rise of the skill premium (sw/uw) depends also on educational policies. Indeed, while most developing regions traditionally exhibited low public expenditure on education, low 2ary and 3ary enrolments and high inequality in the distribution of human capital HC, particularly in secondary education (Table 1), the East Asian educational strategy focused on a rapid expansion of secondary education which raised the number of skilled workers, reduced educational inequality and the concentration of labor income.
Table 1.Human capital formation and R&D in selected regions (mid-1980s) Latin America Mediterranean Basin East Asia G-7
Secondary school enrolment rate 45.6 -- 65.0 --
University enrolment rate 17.8 -- 18.4 --
University graduates per 100,000 inhabitants 1,560 1,910 4,780 5,920
Engineering & technology graduates/total graduates 17.2 17.6 20.2 15.5
Engineers & scientists per 100,000 working-age persons 690 1,190 1,450 5,810
R&D expenditure/GDP 0.6 0.9 1.3 2.7
Per capita R&D expenditure 120 240 180 3,460 Source: ECLAC (1990). (iii) A high concentration in the distribution of land and other ‘non reproducible assets’. Because of historical factors, in many developing countries land has traditionally been distributed in a highly unequal way. The FAO’s Agricultural Censuses indicate that in the 1960s-1970s, the Gini coefficient of land distribution oscillated between 0.61 and 0.92 in Latin America, 0.46 and 0.71 in sub South-Eastern Africa, and around 0.60 in semi-feudal South Asia. In several of such countries a small number of landowners appropriated up to 50 percent of the agricultural output or 25% of GDP. In addition, in view of the low labor absorption of latifundia, high land concentration and landlessness also depressed the wage of rural laborers and, through them, the unskilled wage in urban areas.
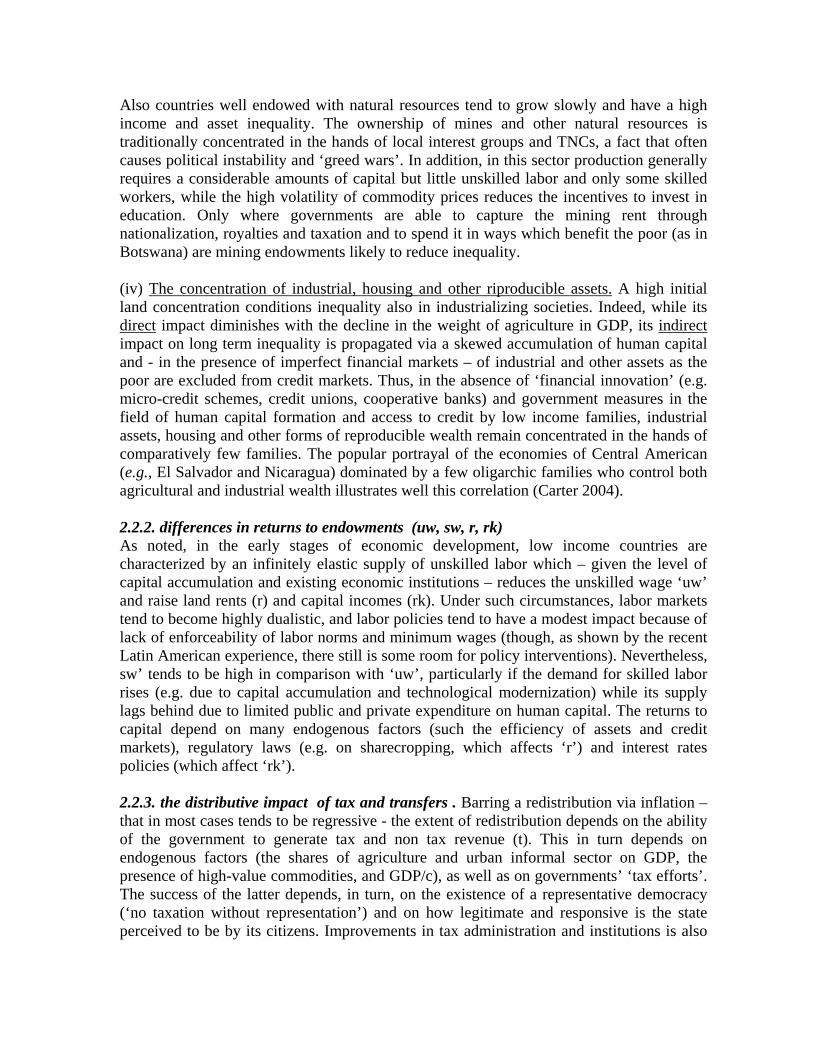
Also countries well endowed with natural resources tend to grow slowly and have a high income and asset inequality. The ownership of mines and other natural resources is traditionally concentrated in the hands of local interest groups and TNCs, a fact that often causes political instability and ‘greed wars’. In addition, in this sector production generally requires a considerable amounts of capital but little unskilled labor and only some skilled workers, while the high volatility of commodity prices reduces the incentives to invest in education. Only where governments are able to capture the mining rent through nationalization, royalties and taxation and to spend it in ways which benefit the poor (as in Botswana) are mining endowments likely to reduce inequality. (iv) The concentration of industrial, housing and other riproducible assets. A high initial land concentration conditions inequality also in industrializing societies. Indeed, while its direct impact diminishes with the decline in the weight of agriculture in GDP, its indirect impact on long term inequality is propagated via a skewed accumulation of human capital and - in the presence of imperfect financial markets – of industrial and other assets as the poor are excluded from credit markets. Thus, in the absence of ‘financial innovation’ (e.g. micro-credit schemes, credit unions, cooperative banks) and government measures in the field of human capital formation and access to credit by low income families, industrial assets, housing and other forms of reproducible wealth remain concentrated in the hands of comparatively few families. The popular portrayal of the economies of Central American (e.g., El Salvador and Nicaragua) dominated by a few oligarchic families who control both agricultural and industrial wealth illustrates well this correlation (Carter 2004). 2.2.2. differences in returns to endowments (uw, sw, r, rk) As noted, in the early stages of economic development, low income countries are characterized by an infinitely elastic supply of unskilled labor which – given the level of capital accumulation and existing economic institutions – reduces the unskilled wage ‘uw’ and raise land rents (r) and capital incomes (rk). Under such circumstances, labor markets tend to become highly dualistic, and labor policies tend to have a modest impact because of lack of enforceability of labor norms and minimum wages (though, as shown by the recent Latin American experience, there still is some room for policy interventions). Nevertheless, sw’ tends to be high in comparison with ‘uw’, particularly if the demand for skilled labor rises (e.g. due to capital accumulation and technological modernization) while its supply lags behind due to limited public and private expenditure on human capital. The returns to capital depend on many endogenous factors (such the efficiency of assets and credit markets), regulatory laws (e.g. on sharecropping, which affects ‘r’) and interest rates policies (which affect ‘rk’). 2.2.3. the distributive impact of tax and transfers . Barring a redistribution via inflation – that in most cases tends to be regressive - the extent of redistribution depends on the ability of the government to generate tax and non tax revenue (t). This in turn depends on endogenous factors (the shares of agriculture and urban informal sector on GDP, the presence of high-value commodities, and GDP/c), as well as on governments’ ‘tax efforts’. The success of the latter depends, in turn, on the existence of a representative democracy (‘no taxation without representation’) and on how legitimate and responsive is the state perceived to be by its citizens. Improvements in tax administration and institutions is also
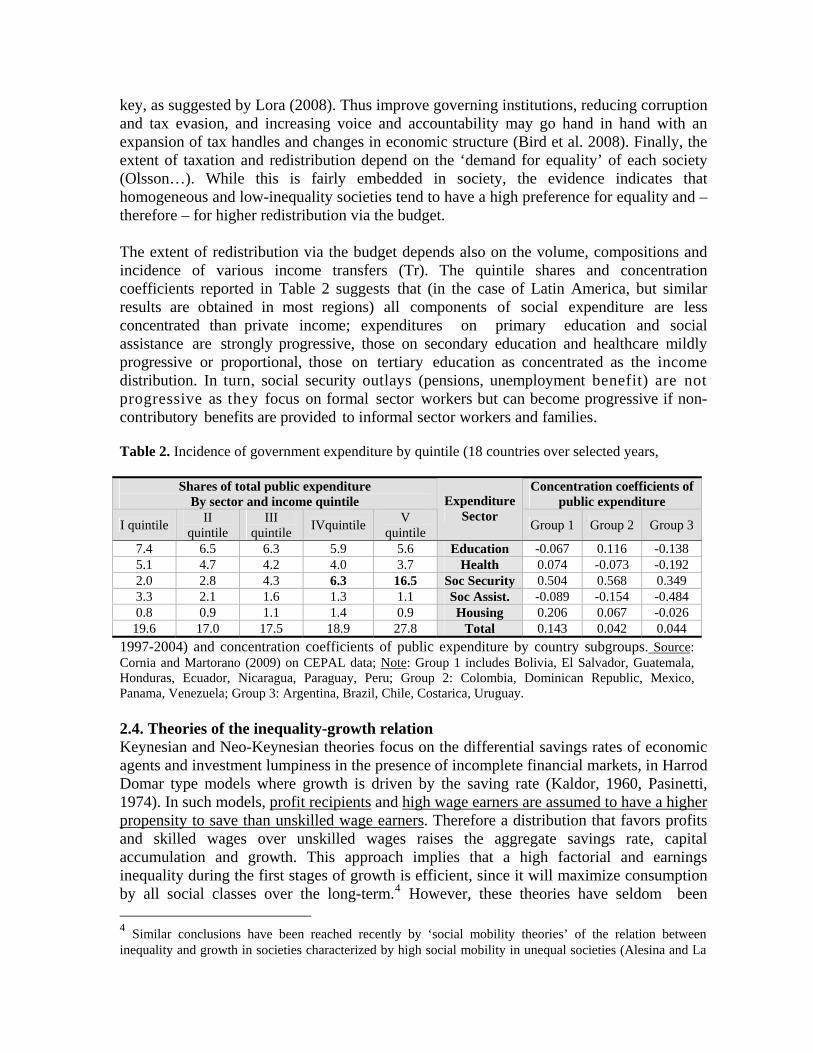
key, as suggested by Lora (2008). Thus improve governing institutions, reducing corruption and tax evasion, and increasing voice and accountability may go hand in hand with an expansion of tax handles and changes in economic structure (Bird et al. 2008). Finally, the extent of taxation and redistribution depend on the ‘demand for equality’ of each society (Olsson…). While this is fairly embedded in society, the evidence indicates that homogeneous and low-inequality societies tend to have a high preference for equality and – therefore – for higher redistribution via the budget. The extent of redistribution via the budget depends also on the volume, compositions and incidence of various income transfers (Tr). The quintile shares and concentration coefficients reported in Table 2 suggests that (in the case of Latin America, but similar results are obtained in most regions) all components of social expenditure are less concentrated than private income; expenditures on primary education and social assistance are strongly progressive, those on secondary education and healthcare mildly progressive or proportional, those on tertiary education as concentrated as the income distribution. In turn, social security outlays (pensions, unemployment benefit) are not progressive as they focus on formal sector workers but can become progressive if non-contributory benefits are provided to informal sector workers and families. Table 2. Incidence of government expenditure by quintile (18 countries over selected years,
Shares of total public expenditure By sector and income quintile
Concentration coefficients of public expenditure
I quintile II quintile
III quintile IVquintile V
quintile
ExpenditureSector
Group 1 Group 2 Group 3
7.4 6.5 6.3 5.9 5.6 Education -0.067 0.116 -0.138 5.1 4.7 4.2 4.0 3.7 Health 0.074 -0.073 -0.192 2.0 2.8 4.3 6.3 16.5 Soc Security 0.504 0.568 0.349 3.3 2.1 1.6 1.3 1.1 Soc Assist. -0.089 -0.154 -0.484 0.8 0.9 1.1 1.4 0.9 Housing 0.206 0.067 -0.026
19.6 17.0 17.5 18.9 27.8 Total 0.143 0.042 0.044 1997-2004) and concentration coefficients of public expenditure by country subgroups. Source: Cornia and Martorano (2009) on CEPAL data; Note: Group 1 includes Bolivia, El Salvador, Guatemala, Honduras, Ecuador, Nicaragua, Paraguay, Peru; Group 2: Colombia, Dominican Republic, Mexico, Panama, Venezuela; Group 3: Argentina, Brazil, Chile, Costarica, Uruguay. 2.4. Theories of the inequality-growth relation Keynesian and Neo-Keynesian theories focus on the differential savings rates of economic agents and investment lumpiness in the presence of incomplete financial markets, in Harrod Domar type models where growth is driven by the saving rate (Kaldor, 1960, Pasinetti, 1974). In such models, profit recipients and high wage earners are assumed to have a higher propensity to save than unskilled wage earners. Therefore a distribution that favors profits and skilled wages over unskilled wages raises the aggregate savings rate, capital accumulation and growth. This approach implies that a high factorial and earnings inequality during the first stages of growth is efficient, since it will maximize consumption by all social classes over the long-term.4 However, these theories have seldom been 4 Similar conclusions have been reached recently by ‘social mobility theories’ of the relation between inequality and growth in societies characterized by high social mobility in unequal societies (Alesina and La
successfully tested. Indeed, econometric analyses of surveys data from developing countries shows that the marginal propensity to save is only weakly influenced by income level, and that other factors play an important factor in savings formation (Cornia and Jerger, 1982). For instance, rural families consistently show higher propensities to save than their urban counterparts as – ceteris paribus – small-medium self-employed peasant households include in their consumption-savings decisions the planned maintenance or increase of their capital stock, and the limited development of rural capital markets. In addition, for an equal level of current income, the transitory component is higher for rural than urban incomes. As most of the latter is saved, for the same level of total income, rural households save more than urban households. A further problem arises from the fact that the ‘old growth theory’ model at the basis of such approach disregards human capital and other growth factors. If we add to the savings of workers their expenditures on health and education, it might appear that they do have higher savings rates than the capitalists. And finally, these models ignore that (as in the East Asian and Chinese experience) an important part of the savings and capital accumulation was carried in highly egalitarian societies by public institutions (such as the Provident Fund in Singapore, or state banks in China). In summary, for all these reasons, the conclusions of this class of models are seldom verified. In contrast, the theoretical models and empirical works developed over the last two decades shows that inequality is bad for growth. A first class of ‘political economy models’ argues that, under democracy, high initial inequality leads to the election of governments that favor redistribution through high tax rates which depress private investment and growth (Alesina and Rodrik, 1994; Persson and Tabellini, 1994), In this model, the lower the income the median voter relative to the mean, the higher the tax rate, and the lower investment and growth. In this model redistribution is therefore seen as harmful to growth, as the implicit assumption is that private investment generates higher returns than public investment. However, these models are problematic. First, there is no sufficiently general evidence that inequality leads to redistribution. In fact, highly unequal countries (both democratic and non-democratic) are often characterized by below-average tax rates and regressive fiscal systems5. Second, there is no evidence of a negative relation between taxation and growth. If anything the relation is positive (Perotti 1996) while returns on well designed investments in infrastructure, health and education are often very high. In a second group of new models, high inequality, incomplete capital markets and the lumpiness of industrial investments harm growth as it leads to slow human capital formation and – given concave production functions - locks investments by the rich in low return activities. With limited ability to borrow, the poor cannot finance education and engage in activities with higher productivity. Thus, unless the capital (credit and insurance) markets are deepened or the wealthy are taxed to subsidize the public education of the poor,
Ferrara ). In turn, Forbes (2000) making use of panel data and using a estimation technique different from that generally used so far identifies a significant monotonically positive linear relation between inequality and growth. The paper, however, does not provide any theoretical explanation of the empirical results found. 5 A major exception to this rule is the case of Latin America, where the election of Left-of –Centre (LOC) regimes in highly unequal Latin American countries has indeed led to some redistribution (Cornia 2010).

human capital accumulation remains lower than under a more egalitarian regime and investment remains concentrated in low return activities. A third strand of this literature emphasizes ‘social instability’. It argues that high initial inequality, and in particular polarization, may force the poor into criminal activities, street protests, violent rioting and other actions that raise uncertainty among investors, reduce the certainty of property rights and depress growth (Venieris and Gupta 1986, Bourguignon 1998). In extreme cases, social tensions lead to conflicts which cause large drops in output, the destruction of infrastructure and human capital losses through death, displacement or forced migration. Conflicts may arise in particular when ‘horizontal inequality’ (i.e. inequality between religious, ethnic and social groups) is high or rises. In this group of models the rich can face large losses and may thus have an incentive to reduce instability by redistributing in favor of the rich as these measures may indeed be less costly and more pro-growth than the instability of high inequality. However, such strategies are seldom observed in real life, and rebellion is the more common outcome in high inequality societies (as, for instance, in Central America). A fourth group of new models emphasizes policy distortions and government failures. Indeed, high inequality may reduce the scope for conducting rational economic policies, and lead to the adoption of unsustainable fiscal policies, large external borrowing, and default on the international debt, as governments monetize their deficit or borrow rather than taxing the elites. Yet, the resulting inflation and crowding out of private investment undermined growth and more than offset the initial inequality gains. Finally, Birdsall (2000) emphasizes that high inequality may restrict the access to pro-growth public goods —such as law and order, certainty of contracts, property rights, and human capital formation. As social distance widens, the disparity of interests among social groups increases, taxation and the provision of public goods decline, residential segregation rises and political participation and the efficacy of government institutions diminish. The last group of models (Banerjee and Duflo 2001, Cornia et al. 2005) emphasizes ‘microeconomic ad social incentives’ and argues that the inequality-growth relation is concave. When the earnings distribution is too compressed and does not adequately reflect differences in talent and effort (as in former Soviet factories), growth may be inhibited by loss of work incentives, the introduction of costly labor-monitoring arrangements and free-riding. An increase in incentives and inequality may thus increase growth. Further increases of inequality have no impact on growth which remains broadly invariant within a given growth-maximizing range. Beyond a given threshold, further rises in inequality misaligned with the latent distribution of income based on talent and effort affect microeconomic incentives, and increase shirking, free riding and supervision costs, and may force the poor to over-exploit common goods such as grazing land, thereby reducing growth. Furthermore, at a very high level of inequality, one observes also an erosion of the social contract, as shown by the rise of predatory and criminal activities, which raise the cost for business security and contract enforcement. The literature suggests a strong relation between inequality and unemployment on the one side and the crime rate (homicide rate in particular) on the other. Fajnzylber et al.(1999) find evidence to suggest that income inequality is consistently associated with violence levels across countries.
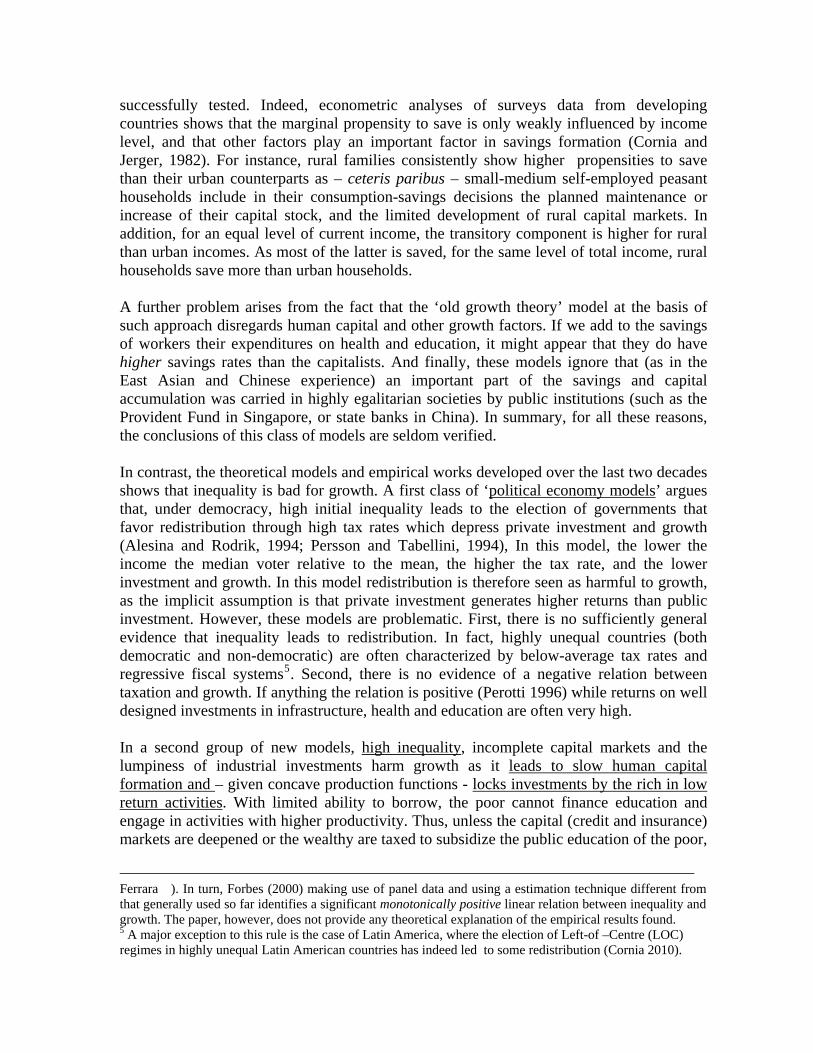
3. Observed inequality trends over 1980-2000, and 2000-2008 3.1 1960-2000 trends: a widespread U-shaped increases in inequality It is now broadly accepted (Cornia 2004, Bourguignon…. ) that domestic income inequality declined in several countries between the 1950s and the mid-late 1970s as a result of the rapid growth of employment following postwar reconstruction, the development of the welfare state in the OECD and socialist countries and of institutional reforms (e.g. land and social security reform) in a number of developing countries. In contrast, inequality rose in the majority of the developed, developing and transitional countries between 1980 and 2000. With an initial decline and subsequent increase, between 1960-2000 income inequality followed a more or less symmetric and pronounced U-trend (Figure 1), with the inequality rise stabilizing in some cases during the 1990s, as in the case of Great Britain.
Figure 1- Different trends in the Gini coefficients of the distribution of income, 1960-2000
Bulgaria India
China G.Britain
Source: Cornia and Rosignoli(2007) on WIDER’s WIID2a data
Cornia and Rosignoli (2007) documents in details this broad trend over 1960-2000 on the basis of WIDER’s WIID2a database (dated 28 June 2005), updating the prior work of Cornia (2004). WIID2a included 4464 Gini coefficients for 154 countries. These were
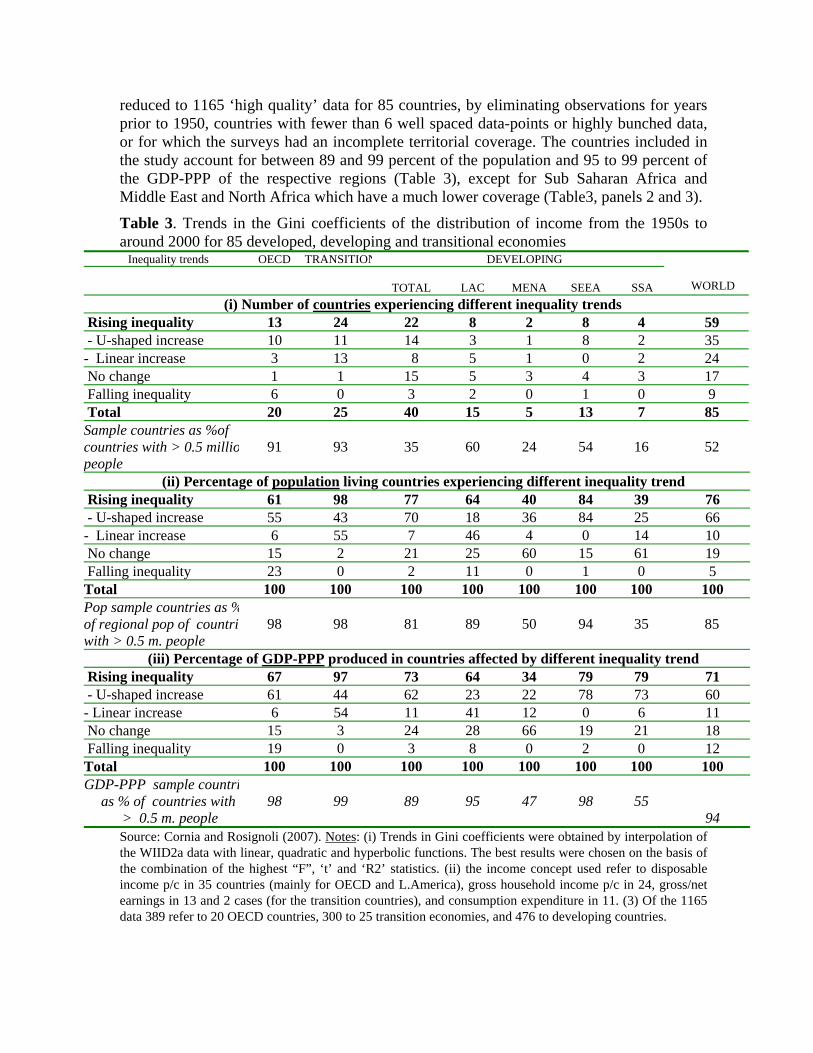
reduced to 1165 ‘high quality’ data for 85 countries, by eliminating observations for years prior to 1950, countries with fewer than 6 well spaced data-points or highly bunched data, or for which the surveys had an incomplete territorial coverage. The countries included in the study account for between 89 and 99 percent of the population and 95 to 99 percent of the GDP-PPP of the respective regions (Table 3), except for Sub Saharan Africa and Middle East and North Africa which have a much lower coverage (Table3, panels 2 and 3).
Table 3. Trends in the Gini coefficients of the distribution of income from the 1950s to around 2000 for 85 developed, developing and transitional economies
Inequality trends OECD TRANSITION DEVELOPING
TOTAL LAC MENA SEEA SSA WORLD (i) Number of countries experiencing different inequality trends
Rising inequality 13 24 22 8 2 8 4 59 - U-shaped increase 10 11 14 3 1 8 2 35 - Linear increase 3 13 8 5 1 0 2 24 No change 1 1 15 5 3 4 3 17 Falling inequality 6 0 3 2 0 1 0 9 Total 20 25 40 15 5 13 7 85 Sample countries as %of countries with > 0.5 milliopeople
91 93
35 60 24 54 16 52
(ii) Percentage of population living countries experiencing different inequality trend Rising inequality 61 98 77 64 40 84 39 76 - U-shaped increase 55 43 70 18 36 84 25 66 - Linear increase 6 55 7 46 4 0 14 10 No change 15 2 21 25 60 15 61 19 Falling inequality 23 0 2 11 0 1 0 5 Total 100 100 100 100 100 100 100 100 Pop sample countries as %of regional pop of countriewith > 0.5 m. people
98 98
81 89 50 94 35 85
(iii) Percentage of GDP-PPP produced in countries affected by different inequality trend Rising inequality 67 97 73 64 34 79 79 71 - U-shaped increase 61 44 62 23 22 78 73 60 - Linear increase 6 54 11 41 12 0 6 11 No change 15 3 24 28 66 19 21 18 Falling inequality 19 0 3 8 0 2 0 12 Total 100 100 100 100 100 100 100 100 GDP-PPP sample countri
as % of countries with > 0.5 m. people
98 99
89 95 47 98 55 94
Source: Cornia and Rosignoli (2007). Notes: (i) Trends in Gini coefficients were obtained by interpolation of the WIID2a data with linear, quadratic and hyperbolic functions. The best results were chosen on the basis of the combination of the highest “F”, ‘t’ and ‘R2’ statistics. (ii) the income concept used refer to disposable income p/c in 35 countries (mainly for OECD and L.America), gross household income p/c in 24, gross/net earnings in 13 and 2 cases (for the transition countries), and consumption expenditure in 11. (3) Of the 1165 data 389 refer to 20 OECD countries, 300 to 25 transition economies, and 476 to developing countries.

This analysis (as well as several country studies and regional trend reviews) indicate that income inequality rose over 1980-2000, in 59 of the 85 countries analyzed, including most large economies such as the USA, UK, China, Brazil, Argentina and Russia, though in 16 of them, the rising trend stabilized in the late 1990s. Inequality remained broadly constant in 17 countries (including large ones as Japan, Bangladesh, Mexico, Nigeria, Indonesia, Thailand and Turkey) and declined in nine including some small European countries and a few medium ones. The inequality increase was near universal in the economies in transition and very common in the OECD but less general in the developing countries, particularly in Sub-Saharan Africa and MENA (where the analysis is affected by data problems). It might be argued that the worsening of income inequality over 1980-2000 was due to the poor GDP growth performance that characterized the ‘lost decade’ of the 1980s and in some regions (such as SSA, Latin America, Japan and economies in transition) the 1990s. Rising inequality, in other words, might have been caused by a slow or negative growth rather than other factors including, possibly, greater global economic integration. Yet, a look at the GDP-growth relationship suggests that in 40 percent of the 85 countries analyzed changes in inequality varied inversely (as expected on the basis of labour market changes) with changes in GDP growth (Figure 2, panel (c) concerning South Korea), and that therefore some of them experienced a rise in inequality due poor growth. Yet, in 38 percent of the cases, inequality rose in a completely orthogonal way to growth (panel b), meaning that other factors are responsible for the inequality rise, while in 22 percent (panel a) growth entailed a rise in inequality including during years of rapid growth. Thus, in about 60 percent of the cases, inequality was due to other than cyclical factors. Figure 2. Relation between yearly % changes in GDP (x-axis) and % changes in the Gini coefficient of the distribution of household income (y-axis), 1980-2000
(a) Tunisia (immiserizing growth) (b) Bolivia (neutral growth) (c) S.Korea (pro-poor growth)
Source: author’s calculations on WIDER’s WIID2a 3.2 A bifurcation of inequality trends across regions during the 2000s Between 2000-8, most transitional and developing regions (including ‘laggards’ SSA and Latin America) experienced a favourable break in the growth trend experienced during the prior two decades. The last decade marks also a clear bifurcation in inequality trends across regions. On the one side, Latin America, and to a much lesser extent SSA6, recorded a clear
6 Data for this region refer however to short period and may be – still – affected by quality problems.

decline in income inequality (Table 4) while in the other regions inequality rose – if more moderately than in the past – more frequently than it declined. This trend is evident in the OECD, transition, MENA and South East-East Asian countries. Outside Latin America and SSA, inequality fell in 19 countries, while it rose in 33 and stagnated in 20, as confirmed also by the recent literature (OECD 2008, Mitra and Yemtsov 2006, Koujanou-Goldberg and Pavcnik 2007). The reasons of this ‘trend bifurcation’ will be explored in Section 5 which compares the policy experiences of Latin America and eastern Europe and the Former Soviet Union (EE-FSU). Table 4. Trends in the Gini coefficients of the distribution of income from 2000 to 2008 or latest available year in 114 developed, developing and transitional economies
Inequality trends OECD TRANSITION DEVELOPING
TOTAL LAC MENA SEEA SSA
WORLD
Rising inequality 8 12 21 3 4 7 7 41 No change 10 7 15 3 1 2 9 32 Falling inequality 5 7 29 12 2 5 10 41 Total 23 26 65 18 7 14 26 114
Source: author’s elaboration on data reported in Cornia and Martorano (2009) for Latin America and Solt (2009) on the basis of WIDER’s SWIID Version 2.0, July 2009. 4. Global economic integration and income inequality Starting from the beginning of the 1980s, most developing countries abandoned the ISI development paradigm and introduced radical changes in their policies. The new measures aimed first at stabilizing macroeconomic imbalances and reducing inflation by means of the ‘monetary approach to the balance of payment’ (Mabop). Economic reforms then focused on the liberalization of domestic markets for goods, labor and finance, the privatization of state companies, and an overall reduction of the role of the state in the economy. These policies paved the way to the liberalization of foreign trade, opening up to foreign direct investments (FDI), liberalization of portfolio flows, adoption of a standardized patent regime on intellectual property embodied in the TRIPS agreement, and the simplification of all forms of international exchange, except for the free circulation of labor.
The proponents of this theoretical approach have long claimed that Mabop-type stabilization restore the conditions for growth, and that domestic and external liberalization generate more competition, reduce domestic prices, increase specialization and efficiency, improve inequality in nations exporting labor-intensive goods, channel world savings to developing countries with low capital accumulation but high rates of return on investment, and accelerate the transfer of technology to backward regions. The empirical literature claimed in contrast that the distributive impact internal and external liberalization was likely to be, on the whole, neutral (or positive in areas with a surplus of educated labor) and that income inequality appeared broadly stable over the long-term (Deininger and Squire, 1996)7, that there is no strong association between growth and inequality and that, thus, poverty is best reduced through growth-oriented, rather than distributive, policies. During the last few years, however, the IMF and World Bank which have supported the move
7 These authors argued that decadal regional averages of Gini coefficients over the 1960-2000 period showed hardly any variation, with the exception of the economies in transition over the 1990s.
towards greater liberalization and globalization have shown growing concern for the impact of these measures, and placed growing emphasis on social safety nets to safeguard the poor and the protection of health and education programs during structural adjustment, and on the achievement of MDGs, without – at the same time – changing their stance in favor of an unconditional rapid internal and external liberalization. Yet, as shown in section 2, this drive towards global economic integration coincided with an increase in domestic income inequality in some 70 percent of the countries analyzed.
4.1. Distributive impact of trade liberalization Neoclassical trade theory embodied in Hercksher-Ohlin (HO) theorem predicts that trade liberalization leads to greater specialization and a rise in national income in participating countries, following a rational allocation of production inspired by comparative advantages. In labor-abundant countries, trade liberalization is expected to switch production from capital-intensive and inefficient import-substitutes towards labor-intensive exports. In addition, the Stolper-Samuelson (SS) corollary to HO posits that such shift leads to the convergence in the prices of goods and factors’ remuneration. Thus, domestic inequality is expected to decline in countries endowed with an abundant labor supply and to rise in capital rich countries, as the demand for and remuneration of the latter (which is unequally distributed) will increase, while the demand and remuneration of labor will fall. The evidence on the distributive impact of trade liberalization on inequality is, however, mixed, at best. As predicted by HO-SS, the trade liberalization of the 19th century raised domestic inequality in the rich New World and reduced it in the poor Old World. Likewise, Bourguignon and Morisson (1989) found that in 35 small developing countries trade liberalization reduced the income of the richest 20 percent of the population and raised that of the bottom 60 percent. Similar conclusions are arrived at by Wood (1984) in the case of the East Asian exporters of labor-intensive manufactured goods during the 1960s and 1970s. Yet, an equally important body of literature points to opposite conclusions for a broad range of countries. For instance, wage inequality was found to have increased in six of seven Latin American countries that liberalized trade, as well as in the Philippines and Eastern Europe (Lindert and Williamson 2001). In turn, a study of 38 developing countries for the years 1965-1992 found that trade liberalization benefited the top 40 percent of the population while affecting negatively the bottom 40 percent who was hit by the greater terms of trade fluctuations typical of an open economy (Lundberg and Squire, 1999). And Savvides (1999) shows that the most open developing countries experienced a rise in inequality between the 1980s and early 1990s and that there is a positive correlation between the income share of the poorest quintile and trade protection. Finally, a recent review of the evidence for Mexico, Colombia, Chile, Brazil, Argentina, Hong-Kong and India during the 1980s and 1990s (Koujanou-Goldberg and Pavcnik 2007) confirms a contemporaneous increase in economic integration and inequality, and that there is no evidence that trade openness favours the less fortunate, due to short run factors immobility, trade-induced skilled biased technological change, the confounding effects of simultaneous capital flows and exchange rate fluctuations, and other factors. How can one explain these conflicting findings and – most of all - the discrepancy between empirical results and theoretical predictions? To start with, it must be underscored that the

HO-SS theorem holds under restrictive assumptions, i.e. trade between two countries producing two goods with two factors (capital and labor) using a technology that remains constant over time. The model also assumes no economies of scale, efficient factors markets (characterized by no restrictions to factors mobility and their full employment), balanced trade, and symmetric trade liberalization by all partners. Yet, in the real world, trade takes place in a multi-country, multi-factors and multi-goods context in which most of the of the above assumptions do not hold. Hereafter alternative explanations of why inequality may rise on occasion of trade liberalisation are tentatively provided: - Changing relative endowments of countries participating in multi-country, multi-factor and multi-goods trade. The limitations of the 2x2x2 HO model are most obvious when considering the case of trade among countries whose relative comparative advantage and production structures evolve over time because of the decision of other countries to change their trade policy. Country A, for instance, may have a comparative advantage in terms of unskilled labor in relation to B but not of C which has – however – not yet liberalized its trade. Thus, the decision to liberalize exports by C is likely to displace A’s exports to B with adverse equity effects. It may even happen that – because of C’s decision to liberalize - A will shift to the production of goods with a medium-high skill and capital content with the effect of worsening her wage distribution. This is what happened in the 1990s on occasion of the entry into the world market for labor-intensive manufactures by China and other low-wage economies that affected the exports and comparative advantage of middle-income countries from Latin America, Eastern Europe and South East Asia in these sectors. - Liberalization in countries specializing in the export of primary commodities. Considerable price shocks over the past two decades reduced the trade/GDP ratio in most commodity-producing countries despite the liberalization of their trade regime (Birdsall and Hamoudi 2002). These price collapses reduced not only export receipts but also import capacity, inducing in this way a decline in jobs and earnings in the import substituting sector without a corresponding rise in the export sector. This problem is often compounded by the rigidities faced in these countries when having to reallocate resources towards the export sector following trade liberalisation, owing to weak institutions, lack of infrastructure and human capital, narrow credit markets and poor governance. - Trade liberalization in countries with an unequal distribution of the abundant factor. The standard model fails also in the case of countries exporting primary commodities produced by means of an abundant factor that is unequally distributed. While an increase in land–intensive agricultural exports may reduce inequality in countries with egalitarian agrarian structures, it would raise it in countries dominated by latifundia. Indeed – due to the labor surplus prevalent in the rural labor market – it is unlikely that an increase in the demand for agricultural workers raises the subsistence salary in line with the increase in export receipts. - Trade liberalization and the import of skill-enhancing investment goods. One of the key assumption of the HO theorem is that the production technologies utilized by the trading countries are not affected by trade itself. Yet, trade liberalization can enlarge the access to previously restricted technologies or, by relaxing foreign exchange rationing, raise the imports of capital intensive investment goods. Because of capital-skill complementarities,

this “skill-enhancing trade” causes an increase in the demand for and wages of skilled workers and a fall in the demand for and wage of the unskilled ones. - asymmetric trade liberalization and protectionism among the trading partners. Another assumption of the basic trade model is that trade liberalization concerns all trading partners. However, in the case of low-tech African and Asian exporters, trade liberalization has led to unsatisfactory export growth not only because of weak domestic conditions but also because of persistent protectionism in OECD countries. Furthermore, the latter countries have not abandoned the policy – forbidden under WTO rules – of subsidizing part of their agriculture and of exporting its products at prices lower than their cost of production. Thus, unilateral liberalization combined with restrictive trade practices in the trading partners can raise inequality and poverty in low tech exporters from developing countries.
- Trade reorientation following capital account liberalization. Another explanation that has received so far little attention concerns the interaction between trade and capital account liberalization. Sudden inflows of foreign capital can entail the appreciation and increasing instability of the exchange rate, shifting in this way the composition of domestic demand towards cheap imports and away from domestic products while rendering exports less competitive (Taylor 2000). All this, encourages the restructuring of production via a reduction in formal employment and wages and greater reliance on outsourcing, i.e. measures that reduce the absorption of unskilled labor and increase wage inequality.
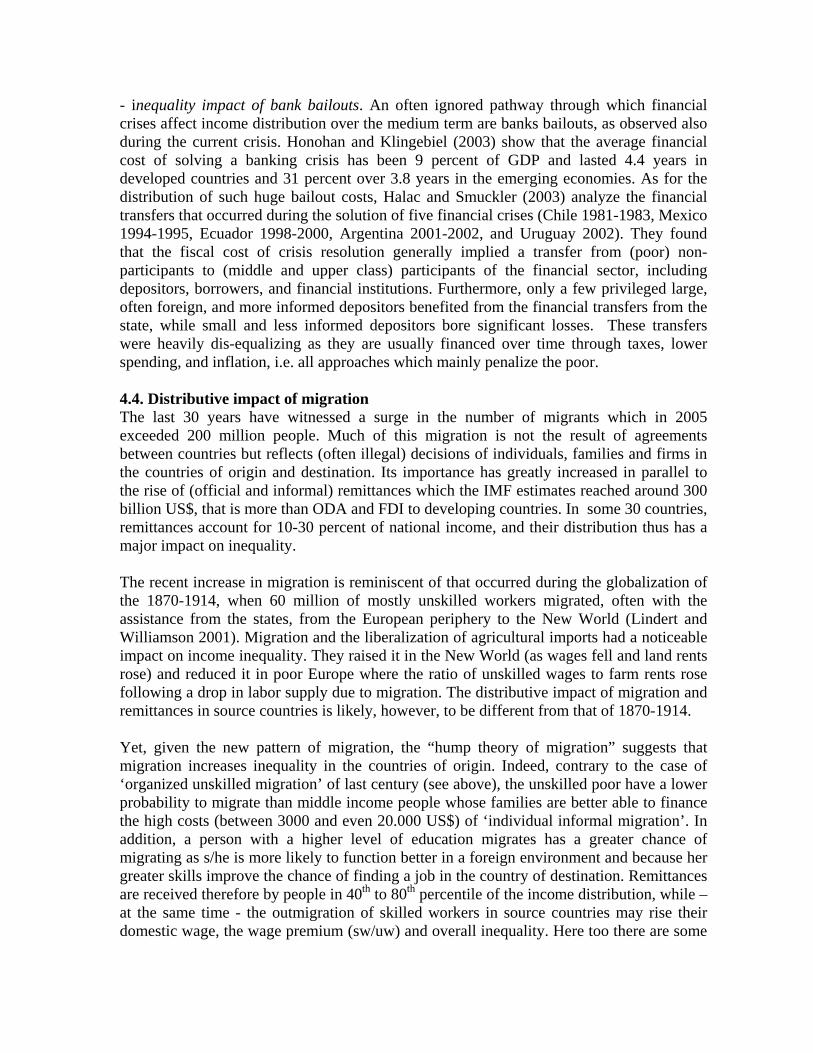
4.2. Distributive impact of the liberalization of FDI During the last thirty years, FDI increased steadily, while accelerating between 1990 and 2000 on occasion of the wave of acquisitions of state enterprises that from Latin America and EE-FSU, and the opening up of investment opportunities in the fast growing East Asia. In contrast, between 2000 and 2004 foreign investments in developing countries stagnated and those in the OECD declined (Figure 3) following the bursting of the dotcom bubble. Yet, between 2004 and 2006 FDIs to developing economies rose faster than the total (ibid), following legal changes that allowed the introduction of majority ownership by foreign investors, liberalization of profit remittances and gradual elimination of clauses on minimum domestic content, minimum export requirements, exclusion of strategic sectors and indigenization of management (UNCTAD 2007, Table 1.8). Figure 3. FDI inflows, total and by groups of economies, 1980-2006 (US$ billions)
Most theories of the distributive impact of FDI implicitly refer to the case of green-field investments in labour intensive manufacturing in new industries, arriving in this way to the conclusion that FDIs reduce income inequality in low-wage, labour-abundant countries, as they accelerate capital accumulation, raise the demand of unskilled workers and generally offer higher wages than in the informal or domestic formal sector. Furthermore, FDI are assumed to generate dynamic gains by contributing to technological and human capital upgrading in backward countries, which would take decades to develop all alone the technology transferred by the TNCs to their countries. Thus, the FDIs enhance the medium term manufacturing, growth, export capacity and income distribution of host countries. What does the empirical evidence show about the impact of FDI on wage and income inequality? Evaluations of wage changes and employment conditions in TNCs-controlled firms and export processing zones provide mixed results. Te Velde and Morrissey (2002) found that FDI raised wages of different skill levels in four of the five East Asian countries analyzed, though they said nothing in terms of the overall wage and income distribution. In contrast, in Mexico the increase in wages due to FDI was significantly lower for the unskilled than the skilled workers (Alarcon and McKinley 1996). And a study by Milanovic (2002) found no significant relation between the FDI/GDP ratio of the recipient countries and the income shares of various deciles. In turn, Benassy-Queré and Salins (2005) claim on the basis of both panel and cross-country regressions that opening up to FDI tends to favor the wealthiest quintile of the population though, at the same time, FDI reduce the rural-urban income gap, as migrants working in urban-based TNCs remit money home to poorer rural areas. Finally, an analysis of a panel of 18 Latin America countries for the period 1990-2007 shows that the FDI/GDP stock correlates closely and significantly with income inequality (Cornia and Martorano, 2009). Also in this case, one is faced with the task of reconciling the predictions of theory with inconclusive evidence. In this regard, it is obvious that the predictions reached by the naive theoretical model illustrated above needs to be qualified in the following ways: - FDI composition: While the flow of FDIs increased in all regions8, their sectoral composition has changed steadily, with a growing share of them going to resource- and capital-intensive mining and manufacturing (chemicals, metallurgy and machinery), and to capital and/or skilled-labor intensive services such as utilities, telecommunications, finance, transport, and business-related services. Comparatively fewer FDIs were directed to unskilled-labor intensive manufacturing textile, shoes, apparel, food processing, furniture, toys, beverages, simple assembly operations, motor vehicle construction, and services such as trade, restaurants, hotels and so on (Table 5) where the impact of FDIs is equalizing. Thus, the developing countries rich in unskilled labor which experienced an FDI shift towards resource-, capital-, and skilled labor-intensive sector experienced, ceteris paribus, an increase in income inequality both through labor market effects and – where democratic institutions are weaker - political economy mechanisms.
8 The ratio of the worldwide stock of inward FDI rose from 4.62 per cent of world GDP in 1980 to 24.7 in 2006 when such ration ranged from a minimum of 23.5 percent of GDP in MENA to a maximum of 30.4 in Latin America (with all regions falling within this narrow range), as opposed to the 1980 when the FDI/GDP stock ranged from 4.5 per cent in Latin America to 9.5 in SSA.

Table 5. Structure of the stock of M&A (1990-2006) and total FDI (1990-2005) by sector Mergers & Acquisitions
Stock (?) Total FDI
Stock 1990 2006 1990 2005 PRIMARY (of which) 6.6 9.8 8.2 8.7 - Mining, quarrying and petroleum 6.5 9.5 6.4 7.8 SECONDARY (of which) 46.5 31.0 43.0 31.0 - Food, beverages and tobacco 8.4 2.8 2.9 1.7 - Chemicals and chemical products 8.1 6.7 13.1 3.6 - Metal and Metal Products 2.9 5.5 4.3 1.5 - Machinery 1.2 2.2 2.8 1.2 - Electrical and electronic equipment 4.1 4.5 5.0 3.6 - Motor vehicles and other transport equipment 4.9 1.8 2.1 1.7 TERTIARY (of which) 46.4 59.0 46.0 58.0 - Electric, Gas, and Water Distribution 0.4 2.6 0.8 2.3 - Trade 5.1 2.6 7.2 7.9 - Transport, storage and communications 9.6 16.0 3.6 5.7 - Finance 14.4 14.9 26.0 14.7
telecommunications,- Business activities 7.9 12.4 4.1 22.4
UNSPECIFIED 0.5 0.2 2.8 2.3 TOTAL 100.0 100.0 100.0 100.0
Source: author’s elaboration on UNCTAD’s Database (left panel) and Table A.I.9, UNCTAD (2009) - Greenfield FDIs vs mergers and acquisitions (M&A): Particularly during the 1990s and early 2000s, the share of cross-border M&A in the total grew steadily (Table 6). M&A entail an improvement in foreign exchange availability but not in capital stock, employment and consumer welfare. Most often, their effect is negative, as M&A by foreign companies entail cuts in employments and increases in tariffs, or consolidations among firms leading to net job losses (Baldwin, 1995) which generate ceteris paribus an adverse distributive effect. For instance, the equity effect of the acquisition of public utilities during the 1990s in Latin America depended on the sale price of state assets, the rise in the prices of services supplied by the foreign-controlled utilities and the employment impact of restructuring. Morley (2000) argues that the impact was felt mainly by the middle class who was at the same time the main user and producer of the subsidized services of the state enterprises.
Table 6. Share of Mergers and Acquisitions on total FDI, 1995-2006
1995 2000 2006 World 0.54 0.81 0.67 Developed economies 0.76 0.94 0.83 Developing economies 0.14 0.26 0.34 MENA 0.06 0.28 0.29 SSA 0.19 0.36 0.92 LAC 0.28 0.43 0.45 SEEA 0.08 0.15 0.27 EE – FSU 0.39 0.50 0.68
Source: author’s calculation on UNCTAD (2007)

- Substitution effect and ‘business stealing’. Even when FDI flow to the unskilled labor-intensive sector, their net effect on employment and income distribution has to take into account the changes in employment and wages in the rest of the economy. This is particularly the case when the new FDI enter in markets which are already supplied by domestic firms. To determine the final distributive impact of the FDI, one must therefore consider the possible effect of the new FDI in terms of losses of jobs and wages in the unskilled-labor-intensive (often informal) domestic enterprise sector. Things are much better if the goods produced by the TNCs were imported or create a new demand. - N-S plant relocation and skill-biased technical change. A further refinement of the basic model concerns the kind of technology that the FDI tends to bring with it. This point is well illustrated by Feenstra and Hanson (1997) who consider the case in which - in order to cut costs – a multinational shifts parts of its production to a developing country where wages are lower. While these productions usually have a low skills intensity for an advanced nations, they might be relatively skilled intensive in the developing country hosting the new FDI. For instance, the outsourcing of production through the FDI from the US to the maquiladora sector in Mexico generated a drop in the demand for unskilled labour in the US (and so contributed to the rise in the skilled/unskilled wage gap) and a simultaneous increase in the demand of what is considered skilled labour in the Mexican context, thus raising wage and overall income inequality in both countries. While these conclusions hold also in the case of neutral technical progress, they hold a fortiori if the productions transferred entailed a shift towards a capital- or skilled-biased technology. Also in this case, therefore, the predictions of the standard theory are overturned. - systemic effects. The mobility of capital and immobility of labor may generate a competition among developing countries simultaneously attempting to attract a fixed amount of FDI. These countries may thus engage in a 'race to the bottom' in which all of them make concessions in the field of taxation and subsidies to foreign firms, labor and social security legislation, and so on that – in the end – affect the distribution of private and public consumption among workers. Indeed, while wages in the multinationals tend to be higher than among local employers, these benefits will be felt only in the countries where FDI have finally decided to go. In those bypassed by them, the ex-ante concessions made to attract them will have generated a cost unmatched by benefits. However, the actual evidence of ‘race to the bottom’ is limited. For instance, in Latina America tax/GDP ratios rose steadily during periods of stagnant and growing FDIs (Cornia and Martorano 2009) In any case, though total FDI reached 1.3 trillion US$ in 2006, only 29 percent of the total flow is directed to the developing world9 (Table 7). While this percentage is rising steadily, the share directed to the OECD countries and few large middle income countries remains dominant and that of low income countries, particularly in Sub-Saharan Africa, remains marginal. This pattern has a clear negative effect on the distribution of income between-countries. Second, among the developing countries a few of them get the lion’s share of the FDI flows. The first ten countries absorb three quarters of the FDI directed to the developing countries. Finally, the historical evidence shows that FDI generally ‘follow’ 9 In 2006, FDI flows to developing countries ranged from a minimum of 2.1 per cento of GDP in SSA, to 5 percent in MENA with an average of 3.1 percent (UNCTAD 2007)
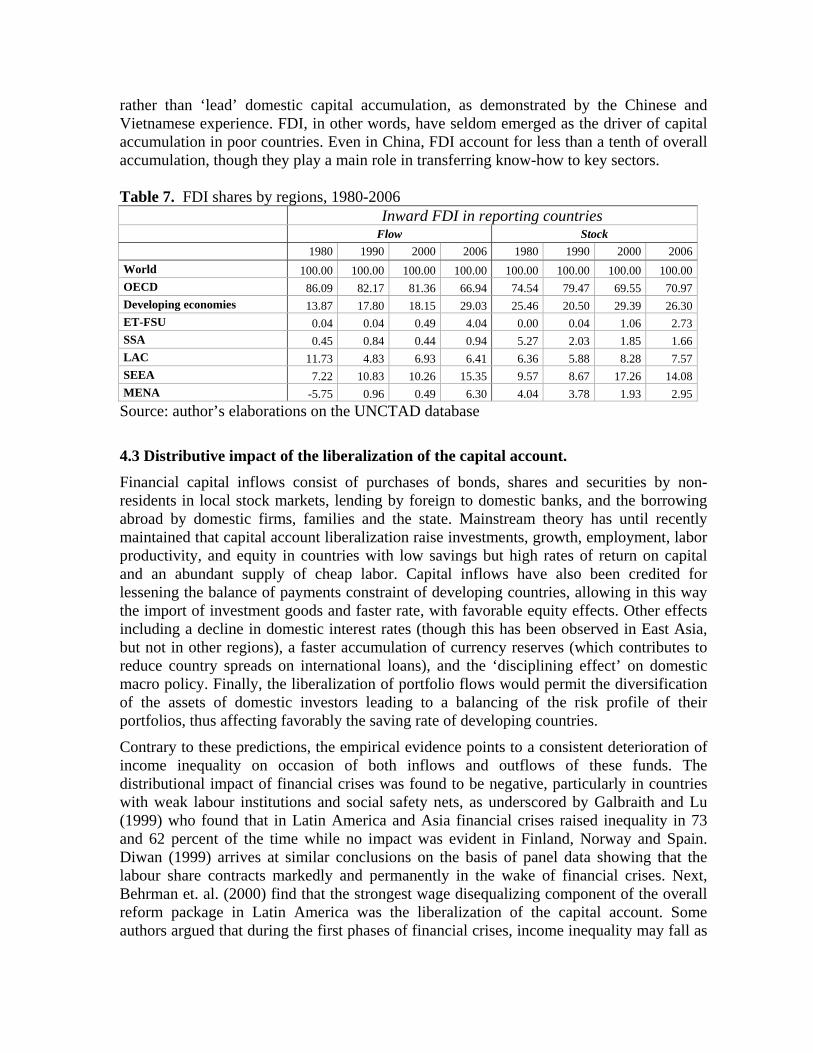
rather than ‘lead’ domestic capital accumulation, as demonstrated by the Chinese and Vietnamese experience. FDI, in other words, have seldom emerged as the driver of capital accumulation in poor countries. Even in China, FDI account for less than a tenth of overall accumulation, though they play a main role in transferring know-how to key sectors. Table 7. FDI shares by regions, 1980-2006
Inward FDI in reporting countries Flow Stock 1980 1990 2000 2006 1980 1990 2000 2006
World 100.00 100.00 100.00 100.00 100.00 100.00 100.00 100.00OECD 86.09 82.17 81.36 66.94 74.54 79.47 69.55 70.97Developing economies 13.87 17.80 18.15 29.03 25.46 20.50 29.39 26.30ET-FSU 0.04 0.04 0.49 4.04 0.00 0.04 1.06 2.73SSA 0.45 0.84 0.44 0.94 5.27 2.03 1.85 1.66LAC 11.73 4.83 6.93 6.41 6.36 5.88 8.28 7.57SEEA 7.22 10.83 10.26 15.35 9.57 8.67 17.26 14.08MENA -5.75 0.96 0.49 6.30 4.04 3.78 1.93 2.95Source: author’s elaborations on the UNCTAD database
4.3 Distributive impact of the liberalization of the capital account. Financial capital inflows consist of purchases of bonds, shares and securities by non-residents in local stock markets, lending by foreign to domestic banks, and the borrowing abroad by domestic firms, families and the state. Mainstream theory has until recently maintained that capital account liberalization raise investments, growth, employment, labor productivity, and equity in countries with low savings but high rates of return on capital and an abundant supply of cheap labor. Capital inflows have also been credited for lessening the balance of payments constraint of developing countries, allowing in this way the import of investment goods and faster rate, with favorable equity effects. Other effects including a decline in domestic interest rates (though this has been observed in East Asia, but not in other regions), a faster accumulation of currency reserves (which contributes to reduce country spreads on international loans), and the ‘disciplining effect’ on domestic macro policy. Finally, the liberalization of portfolio flows would permit the diversification of the assets of domestic investors leading to a balancing of the risk profile of their portfolios, thus affecting favorably the saving rate of developing countries. Contrary to these predictions, the empirical evidence points to a consistent deterioration of income inequality on occasion of both inflows and outflows of these funds. The distributional impact of financial crises was found to be negative, particularly in countries with weak labour institutions and social safety nets, as underscored by Galbraith and Lu (1999) who found that in Latin America and Asia financial crises raised inequality in 73 and 62 percent of the time while no impact was evident in Finland, Norway and Spain. Diwan (1999) arrives at similar conclusions on the basis of panel data showing that the labour share contracts markedly and permanently in the wake of financial crises. Next, Behrman et. al. (2000) find that the strongest wage disequalizing component of the overall reform package in Latin America was the liberalization of the capital account. Some authors argued that during the first phases of financial crises, income inequality may fall as
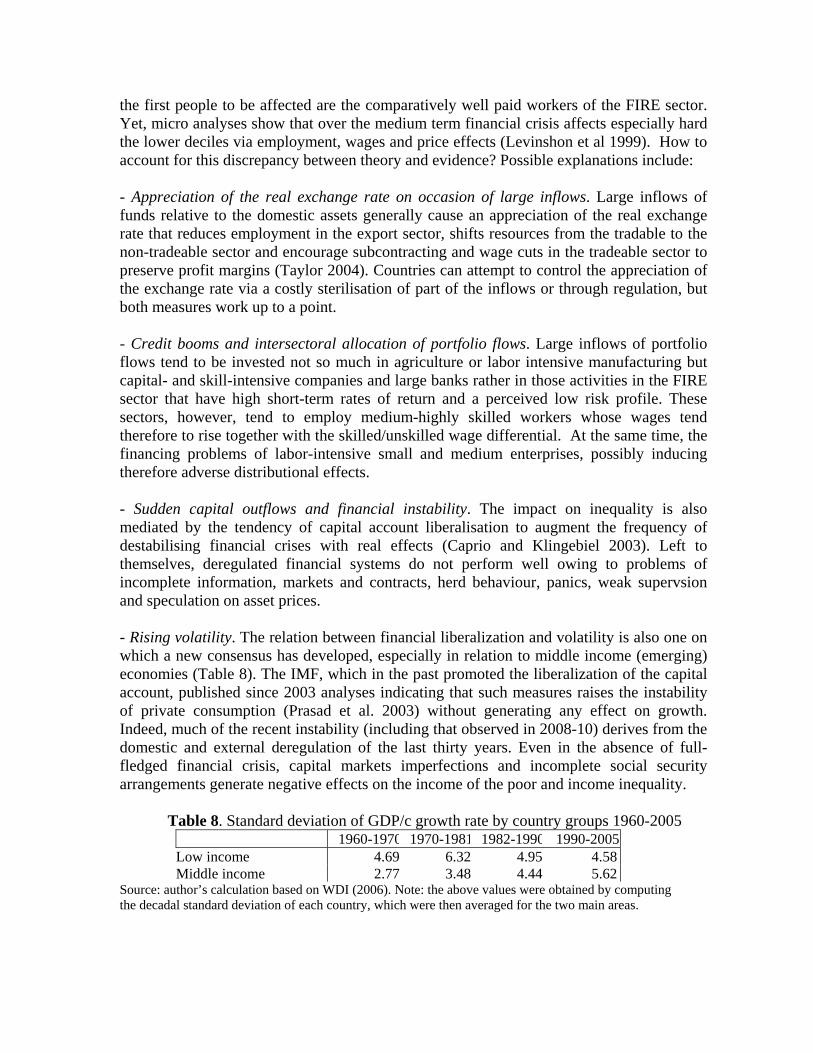
the first people to be affected are the comparatively well paid workers of the FIRE sector. Yet, micro analyses show that over the medium term financial crisis affects especially hard the lower deciles via employment, wages and price effects (Levinshon et al 1999). How to account for this discrepancy between theory and evidence? Possible explanations include: - Appreciation of the real exchange rate on occasion of large inflows. Large inflows of funds relative to the domestic assets generally cause an appreciation of the real exchange rate that reduces employment in the export sector, shifts resources from the tradable to the non-tradeable sector and encourage subcontracting and wage cuts in the tradeable sector to preserve profit margins (Taylor 2004). Countries can attempt to control the appreciation of the exchange rate via a costly sterilisation of part of the inflows or through regulation, but both measures work up to a point. - Credit booms and intersectoral allocation of portfolio flows. Large inflows of portfolio flows tend to be invested not so much in agriculture or labor intensive manufacturing but capital- and skill-intensive companies and large banks rather in those activities in the FIRE sector that have high short-term rates of return and a perceived low risk profile. These sectors, however, tend to employ medium-highly skilled workers whose wages tend therefore to rise together with the skilled/unskilled wage differential. At the same time, the financing problems of labor-intensive small and medium enterprises, possibly inducing therefore adverse distributional effects. - Sudden capital outflows and financial instability. The impact on inequality is also mediated by the tendency of capital account liberalisation to augment the frequency of destabilising financial crises with real effects (Caprio and Klingebiel 2003). Left to themselves, deregulated financial systems do not perform well owing to problems of incomplete information, markets and contracts, herd behaviour, panics, weak supervsion and speculation on asset prices. - Rising volatility. The relation between financial liberalization and volatility is also one on which a new consensus has developed, especially in relation to middle income (emerging) economies (Table 8). The IMF, which in the past promoted the liberalization of the capital account, published since 2003 analyses indicating that such measures raises the instability of private consumption (Prasad et al. 2003) without generating any effect on growth. Indeed, much of the recent instability (including that observed in 2008-10) derives from the domestic and external deregulation of the last thirty years. Even in the absence of full-fledged financial crisis, capital markets imperfections and incomplete social security arrangements generate negative effects on the income of the poor and income inequality.
Table 8. Standard deviation of GDP/c growth rate by country groups 1960-2005 1960-1970 1970-1981 1982-1990 1990-2005 Low income 4.69 6.32 4.95 4.58 Middle income 2.77 3.48 4.44 5.62
Source: author’s calculation based on WDI (2006). Note: the above values were obtained by computing the decadal standard deviation of each country, which were then averaged for the two main areas.
- inequality impact of bank bailouts. An often ignored pathway through which financial crises affect income distribution over the medium term are banks bailouts, as observed also during the current crisis. Honohan and Klingebiel (2003) show that the average financial cost of solving a banking crisis has been 9 percent of GDP and lasted 4.4 years in developed countries and 31 percent over 3.8 years in the emerging economies. As for the distribution of such huge bailout costs, Halac and Smuckler (2003) analyze the financial transfers that occurred during the solution of five financial crises (Chile 1981-1983, Mexico 1994-1995, Ecuador 1998-2000, Argentina 2001-2002, and Uruguay 2002). They found that the fiscal cost of crisis resolution generally implied a transfer from (poor) non-participants to (middle and upper class) participants of the financial sector, including depositors, borrowers, and financial institutions. Furthermore, only a few privileged large, often foreign, and more informed depositors benefited from the financial transfers from the state, while small and less informed depositors bore significant losses. These transfers were heavily dis-equalizing as they are usually financed over time through taxes, lower spending, and inflation, i.e. all approaches which mainly penalize the poor. 4.4. Distributive impact of migration The last 30 years have witnessed a surge in the number of migrants which in 2005 exceeded 200 million people. Much of this migration is not the result of agreements between countries but reflects (often illegal) decisions of individuals, families and firms in the countries of origin and destination. Its importance has greatly increased in parallel to the rise of (official and informal) remittances which the IMF estimates reached around 300 billion US$, that is more than ODA and FDI to developing countries. In some 30 countries, remittances account for 10-30 percent of national income, and their distribution thus has a major impact on inequality. The recent increase in migration is reminiscent of that occurred during the globalization of the 1870-1914, when 60 million of mostly unskilled workers migrated, often with the assistance from the states, from the European periphery to the New World (Lindert and Williamson 2001). Migration and the liberalization of agricultural imports had a noticeable impact on income inequality. They raised it in the New World (as wages fell and land rents rose) and reduced it in poor Europe where the ratio of unskilled wages to farm rents rose following a drop in labor supply due to migration. The distributive impact of migration and remittances in source countries is likely, however, to be different from that of 1870-1914. Yet, given the new pattern of migration, the “hump theory of migration” suggests that migration increases inequality in the countries of origin. Indeed, contrary to the case of ‘organized unskilled migration’ of last century (see above), the unskilled poor have a lower probability to migrate than middle income people whose families are better able to finance the high costs (between 3000 and even 20.000 US$) of ‘individual informal migration’. In addition, a person with a higher level of education migrates has a greater chance of migrating as s/he is more likely to function better in a foreign environment and because her greater skills improve the chance of finding a job in the country of destination. Remittances are received therefore by people in 40th to 80th percentile of the income distribution, while – at the same time - the outmigration of skilled workers in source countries may rise their domestic wage, the wage premium (sw/uw) and overall inequality. Here too there are some

(if fewer) discrepancies between the hump theory of migration and the evidence. A recent review of the empirical studies on the impact of migration on inequality in source countries does not offer, in fact, a decisive conclusion as to whether international migration increased or decreased economic inequality at origin (Docquier and Rapoport 2003), suggesting that actual results depend on some of the factors mentioned hereafter: - Migrant networks reduce the costs of individual migration. Recent evidence shows that the dis-equalizing impact of migration in the countries of origin may decline in those cases when migration is state-sponsored or when sufficiently dense migrant networks emerge. These networks have in fact the effect of reducing some migration costs (e.g. those faced when arriving to a new country), thus making it affordable to low-income households (Bertoli 2009). High density of family networks in sources country may also moderate the impact of remittances on inequality, whenever considerable redistribution takes place among families members of networks in the villages from which migration originated; - Long term growth effects. Remittances may stimulate overall long term growth in source countries10 by lessening the balance of payments constraint (and therefore allowing the import of capital goods), via a greater formation of human capital – (as the children staying behind have a greater chance to graduate from primary or secondary education, as observed in Mexico), or if poorer households receiving remittances can access productive assets (land) and complementary inputs. Returning migrants who acquired technical and entrepreneurial skills in advanced countries (as observed by studies on Egypt and Turkey by McCormick and Wahba 2001) may also contribute to this growth acceleration. As for the impact of migration on the countries of destination, the IMF (2007) argues that the effective global labor supply in OECD countries increased four times during last two decades via imports of labor-intensive manufactured goods, outsourcing of production, and migration of unskilled and skilled workers. While this increased unskilled and semi-skilled labor supply does not appear to have generated (with rare exceptions) a displacement but rather a replacement of domestic workers (due to a decline of the local labor force, higher education of local workers and expectations of finding employment in higher paid jobs), migration may have contributed to the observed rise in the skilled/unskilled wage ratio (sw/uw) via a nominal stagnation of unskilled wages in countries of destination (as observed in Italy). Yet, the literature offers also other explanations of the deterioration in the skilled/unskilled wage ratio, including a limited supply of skilled workers relative to a fast technology-driven increase in its demand (though this is less true in country where college education is mainly state-financed), unfavorable changes in labor institutions (e.g. collective bargaining, minimum wages, hiring-firing costs, greater flexibility, and so on) , and changes in social norms (explained by ‘winner takes all’ theories) as in the case of the large increases in the wages of top managers and performers.
10 The evidence in this regard is contradictory: Faini (2002, 2004) finds a positive but weak relation between migration and growth, Chami et al (2003) finds a negative relation, while the IMF (2005) finds no relation and shows that the investment rate does not increase in countries with high remittances/GDP ratios.

5. Public policy, distribution and growth: comparing the recent experience of Latin America and EE-FSU Section 3 argued that during the current decade of rapid economic integration inequality dropped significantly in Latin America and rose further (if in fewer countries and at a slower pace) in EE-FSU. How can we reconcile these divergent trends in the light of the findings of Part 4, i.e. that economic integration (via trade, FDI and migration) has often be dis-equalizing, while financial integration has always been dis-equalizing? A first observation useful to answer this question is the observation that over 2000-8 the EE-FSU growth pattern was un-equalizing while that of Latin America (Figure 4). A second is that EE-FSU is the region most affected during the current financial crisis, while Latin America was affected on average. What factors explain these differences? This section therefore compares the sources inequality decline recorded in Latin America with those that further raised it in EE-FSU, with the purpose of drawing some lessons for future policy making. Figure 4. Comparison between the relations ‘rate of growth of GDP - Gini coefficient of income inequality’ (top 2 charts) and ‘growth rate of GDP and growth rate of Gini coefficient’ (bottom 2 charts) in EE-FSU (left side) and Latin America (right side), 2000-8.
4045
5055
6065
gini
-10 -5 0 5 10 15Growth GDP
LAC
-10
010
20G
row
th G
INI
-5 0 5 10 15Growth GDP
ET - FSU
Source: author’s calculation on the basis of WIID2a and WDI
2025
3035
4045
gini
-10 0 10 20 30Growth GDP
EE - FSU-2
0-1
00
10G
row
th G
INI
-10 -5 0 5 10 15Growth GDP
LAC

5.1. Similarities and differences in economic and political structures EE-FSU and Latin America are both middle income regions, though a few Central American, Caribbean, Balkan and Central Asian countries have a low-income per capita. Both regions are also highly heterogeneous in terms of economic structures. Latin America includes a group of semi-industrialized countries (the Southern Cone and Mexico), one of commodity exporters (the Andean countries), one depending on migrant remittances (most Central American and Caribbean countries, Ecuador, Peru), while only Haiti depends on aid. Likewise, EE-FSU comprises a cluster of industrialized countries (the Central European, Romania and Bulgaria), another of commodity exporters (Russia, Azerbaijan, Turkmenistan, Kazakhstan, Uzbekistan), a third where high- and low-tech services (transit fees, tourism, and others) play a key economic role, and a fourth (Tajikistan, Kyrgyzstan, Moldova, Albania, Bosnia, Armenia) dependent on remittances. The two regions appear therefore ‘similarly heterogeneous’. Structural differences cannot therefore explaining their differences in terms of growth, inequality, volatility during the last decade. Indeed, til mid 2008, both of them benefitted from favourable trends in commodity prices, access to global finance and remittances, and both were hit by the 2008-2009 reversal in all these areas. In contrast, the political history of the two regions has been very different. The EE-FSU countries emerged in 1989 from decades of communist rule, state dominance in every sphere of life, and an overly compressed income distribution. Though important transformations were achieved between 1989 and 2000 (if at a cost of greater than expected inequality rises), it is possible that some political and economic decisions of the last ten years were still influenced by the perceived need to reduce the role of the state in the economy, introduce more incentives and moderate the spirit of egalitarianism inherited from the past, as suggested for instance by the few and declining left of centre (LOC) and nationalist right-of centre (ROC) and the parallel rise of pragmatic ‘independent’ regimes (Figure 5) lacking a distributive agenda (except in Central Europe) but focussing on sound macroeconomics, joining the EU, greater domestic liberalization and global economic integration. Figure 5. Changes in political orientation in 24 EE-FSU countries, 1990 - 2009 Source: author’s compilation on Keefer (2006) and national data reported by Wikipedia for the years 2006-9.
0
2
4
6
8
10
12
14
1990
1991
1992
1993
1994
1995
1996
1997
1998
1999
2000
2001
2002
2003
2004
2005
2006
L
R
C
ind

The political trajectory of Latin America has been quite different. For long, the region has been a symbol of authoritarianism, unequal distribution of assets and income, and limited or no redistribution by the state. However, during the last twenty years, the political landscape has been dominated by a steady drive towards democratization and, starting from the mid-late 1990s, by a steady shift in political orientation towards LOC regimes (Figure 6) both social-democratic and national-populist. Matters of social justice and economic development are at the core of the new LOC parties’ identity. However, in the pursuit of such objectives, the LOC parties avoided the ill-conceived approach to budget deficits and inflation typical of the populist experiments of the 1980s. In fact, the LOC economic model incorporates into its paradigm liberal elements such as a prudent fiscal policy and low inflation, an awareness of the inefficiencies associated with some state intervention, the primacy of the market in fixing prices, regional trade integration and openness to foreign investment. At the same time, its concern for poverty and inequality, recognition of market failures and the importance assigned to strengthening state institutions are in stark contrast with the neo-liberal emphasis on shrinking the state and the self-sustained role of markets (Panizza 2005a). Figure 6. Changes in political orientation in 18 Latin American countries, 1990 - 2009
0
3
6
9
12
15
1990 1991 1992 1993 1994 1995 1996 1997 1998 1999 2000 2001 2002 2003 2004 2005 2006 2007 2008 2009
RightCentreLeft
Source: Cornia and Martorano (2009) 5.2 Differences in policy models The two regions adopted some common policies but clearly differed in other areas: (i) Budget deficit, public debt, inflation and current account balance During the last decade, Latin America abandoned its traditional pro-cyclical fiscal and monetary policies. In all countries there was a decline in budget deficit which typically fell below one percent of GDP or were turned into surpluses. LOC governments attempted also to reduce their dependence on foreign borrowing. Brazil and Argentina prepaid their outstanding IMF debt, a few countries restructured their foreign debt at considerable discount, and others benefitted from the HIPC program. As a result, the gross public foreign debt net of fast growing currency reserves fell from 33 to 8 percent of GDP. Meanwhile, inflation fell to between 4 and 9 percent except in Venezuela.

EE-FSU followed a similar approach in the fiscal area but not in that of the current account balance. Since the mid 1990s, convergence in fiscal and monetary policies lead to a fall of deficits/GDP from 3 percent in 2000 to a balanced budget by 200711, public debt/GDP ratio (from 47 to 25 percent) and inflation (from 18 to 7 percent) (Cornia 2009). In contrast, the deficit of the current account balance rose sharply, particularly in the Baltics, Hungary, Bulgaria, Romania, Belarus, Ukraine and Moldova where it reached 10-25% of GDP12, as opposed to between 3 and 6 percent in Central Europe and 1.6 per cent recorded in Latin America (Figure 7)13. Figure 7. Average current account deficit/GDP over 2000-7 Source:
-1.6
2.62
-3.95
-6.81
-10.33-12
-10
-8
-6
-4
-2
0
2
4
group I group II group III group IV group BC
Source: author’s calculation on official data. Notes: group I: Latin America; group II: Kazakhstan, Kyrgyzstan, Russia, Tajikistan, Turkmenistan, Uzbekistan. group III: Armenia, Azerbaijan, Georgia, Ukraine. group IV: Albania, Bulgaria, Croatia, Czech Republic, Estonia, Hungary, Latvia, Lithuania, Macedonia, Moldova, Poland, Romania, Slovak Republic, Slovenia, group BC: Estonia, Latvia, Lithuania.
These huge current account deficits were not due to public profligacy but to a surge in foreign private debt financed by a massive inflow of FDI and easy access to “cheap money”, i.e. hard-currency loans (both corporate loans and for household mortgages) at low interest rates provided by local subsidiaries of foreign banks. In the Baltics, Bulgaria, Romania and Hungary, between 50 and 85 percent of bank loans were made in foreign currency causing in this way a major currency mis-match (Aslund 2009), rising dependence on decisions of global players, and high external indebtedness. By 2008, five countries (Bulgaria, Estonia, Hungary, Latvia, and Slovenia) had foreign debts in excess of 100 percent of GDP. While, it is often argued that current account deficit do not pose a problem as long as they are financed by FDI, in the case of EE-FSU a high reliance on FDI turned out to be not only a source of growth but also an element of fragility, as a very high proportion of the output of foreign investments was exported to Western Europe. This is particularly important as EE-FSU became a major recipient of FDI from EU countries. Indeed, Table 9 confirms that over 2000-2008, EE-FSU received on average 6.5 percent of its GDP per year
11 Only Hungary incurred an average deficit/GDP ratio of over 7 percent over 2005-7. 12 In Bulgaria the deficit of the current account balance exceeded 25% of GDP in 2007 and 2008 13 Except for the crisis years of 2001-2 the current account balance has always been positive.
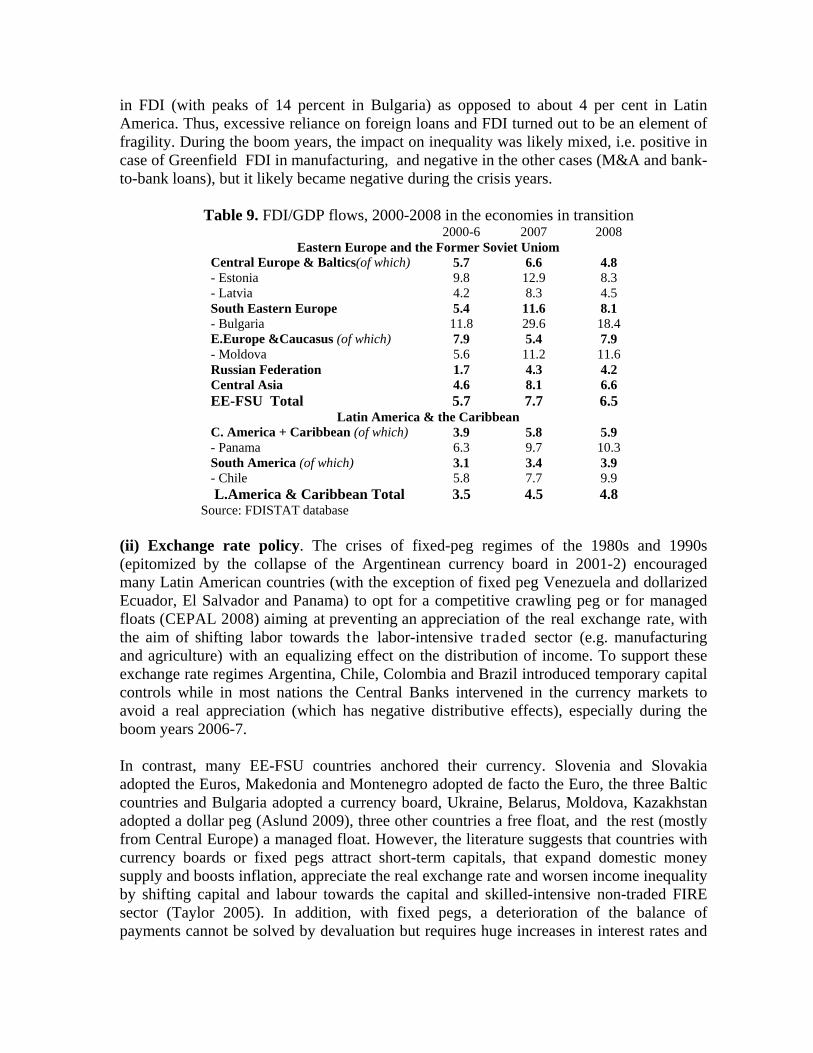
in FDI (with peaks of 14 percent in Bulgaria) as opposed to about 4 per cent in Latin America. Thus, excessive reliance on foreign loans and FDI turned out to be an element of fragility. During the boom years, the impact on inequality was likely mixed, i.e. positive in case of Greenfield FDI in manufacturing, and negative in the other cases (M&A and bank-to-bank loans), but it likely became negative during the crisis years.
Table 9. FDI/GDP flows, 2000-2008 in the economies in transition 2000-6 2007 2008
Eastern Europe and the Former Soviet Uniom Central Europe & Baltics(of which) 5.7 6.6 4.8 - Estonia 9.8 12.9 8.3 - Latvia 4.2 8.3 4.5 South Eastern Europe 5.4 11.6 8.1 - Bulgaria 11.8 29.6 18.4 E.Europe &Caucasus (of which) 7.9 5.4 7.9 - Moldova 5.6 11.2 11.6 Russian Federation 1.7 4.3 4.2 Central Asia 4.6 8.1 6.6 EE-FSU Total 5.7 7.7 6.5
Latin America & the Caribbean C. America + Caribbean (of which) 3.9 5.8 5.9 - Panama 6.3 9.7 10.3 South America (of which) 3.1 3.4 3.9 - Chile 5.8 7.7 9.9 L.America & Caribbean Total 3.5 4.5 4.8
Source: FDISTAT database (ii) Exchange rate policy. The crises of fixed-peg regimes of the 1980s and 1990s (epitomized by the collapse of the Argentinean currency board in 2001-2) encouraged many Latin American countries (with the exception of fixed peg Venezuela and dollarized Ecuador, El Salvador and Panama) to opt for a competitive crawling peg or for managed floats (CEPAL 2008) aiming at preventing an appreciation of the real exchange rate, with the aim of shifting labor towards the labor-intensive traded sector (e.g. manufacturing and agriculture) with an equalizing effect on the distribution of income. To support these exchange rate regimes Argentina, Chile, Colombia and Brazil introduced temporary capital controls while in most nations the Central Banks intervened in the currency markets to avoid a real appreciation (which has negative distributive effects), especially during the boom years 2006-7. In contrast, many EE-FSU countries anchored their currency. Slovenia and Slovakia adopted the Euros, Makedonia and Montenegro adopted de facto the Euro, the three Baltic countries and Bulgaria adopted a currency board, Ukraine, Belarus, Moldova, Kazakhstan adopted a dollar peg (Aslund 2009), three other countries a free float, and the rest (mostly from Central Europe) a managed float. However, the literature suggests that countries with currency boards or fixed pegs attract short-term capitals, that expand domestic money supply and boosts inflation, appreciate the real exchange rate and worsen income inequality by shifting capital and labour towards the capital and skilled-intensive non-traded FIRE sector (Taylor 2005). In addition, with fixed pegs, a deterioration of the balance of payments cannot be solved by devaluation but requires huge increases in interest rates and

fiscal surpluses which in turn, cause dis- equalizing huge contractions of GDP while further attracting short-term foreign capital. The countries most affected by the current crisis (Table 11) are precisely countries that adopted this type of exchange regime. (iii) Labor market policies. Latin America’s LOC regimes explicitly addressed the problems of unemployment, informalization, falling unskilled wages, and weakening of institutions for wage negotiations. Most countries introduced large scale public work programs, attempted to extend the coverage of formal employment, and strengthened the institution for wage bargaining. They also decreed hikes in minimum wages (Figure 8) which were generally found to be associated with lower earnings dispersion in both the formal and informal sector (Cornia and Martorano 2009 and references therein). Yet, despite the revival of unions, average wages rose slowly (ibid), possibly signaling the greater concern of policy makers for creating jobs than for improving earnings. Figure 8. Trend in Minimum Wage/ Average Wage ratio, 1997-2006, in LAC and EE–FSU
0.2
0.25
0.3
0.35
0.4
0.45
0.5
0.55
0.6
1997 1998 1999 2000 2001 2002 2003 2004 2005 2006
ET _ FSU LAC
Source: ILO. Note: LAC countries : Argentina, Brazil, Chile, Colombia, Costa Rica, Honduras, Mexico , Panama, Paraguay, Peru, Uruguay and Venezuela. EE–FSU countries: Albania, Armenia, Azerbaijan, Belarus, Bulgaria, Croatia, Czech Rep., Estonia, Georgia, Hungary, Kazakhstan, Kyrgyzstan, Latvia, Lithuania, Poland, Romania, Russia, Slovakia, Tajikistan, Ukraine, Uzbekistan
These policies and the growth recorded between 2003-8 lead to a drop in unemployment of 5.5 points in LOC and 2 points in NO-LOC countries, and a fall in informal and self-employment, while the wage premium (sw/uw) often declined (Table 10) due to a growing supply of educated workers (see below) and a shift in production towards the unskilled labor-intensive tradable sector, with positive effects on inequality. Table 10. Ratio of hourly wage by high/medium educational groups
Arg Bol Bra Chi Col C.R E.S. Pan Par Peru R.D. Uru Ven 1992 1.86 1.74 1.72 2.52 1.93 2.03 2.14 1.65 1.84 2002 2.08 2.71 2.78 2.16 2.22 2.44 2.03 2.16 1.96 2.20 1.82 2007 1.73 2.14 2.37 2.54 2.85 2.44 2.13 2.41 1.79 2.00 1.89 2.09 1.57
Source: author’s elaboration on the CEDLAS database In EE-FSU the rapid growth of 2000-7 reduced sharply unemployment which declined by between 3 points (in the Czech Rep.) to 10 in Poland – while only Hungary, Romania and

Georgia, Serbia, Macedonia exhibited a rise in joblessness (Transmonee database 2009). In almost half the countries of the region, including top-performer Poland, the decline in unemployment was facilitated by a large outmigration. In contrast, minimum/average wage ratio stagnated at a low level (Figure 8). At the same time, the skill premium (sw/uw) may have risen because of the decline in human capital formation recorded during the 1990s (see point (v) below). Finally, the liberal model of economic reforms adopted during the transition did not develop those institutions (collective bargaining, unemployment insurance, public works) and safety nets that moderate earnings inequality14 particularly during crisis periods like the recession that started in late 2008. (iv) tax policy and redistribution. Both regions improved revenue collection during the last decade. In Latin America tax/GDP ratios started rising since 199515 to accelerate further since 2003 (Figure 8, right panel). Increases of 6 to10 GDP points were recorded in Argentina, Brazil, Colombia, Bolivia and Venezuela which reached in this way a level of taxation similar to that of the US. Such increase is of structural nature and reflects improved tax administration and collection. Also, of the additional tax revenue collected more than half came from direct taxes, a third from TVA and the rest from other taxes. Overall, while tax reform has still a long way to go, these changes rendered the tax system a bit more equitable. In addition, the countries benefiting from gains in terms of trade appropriated part of these windfall gains (CEPAL 2007) by raising non-tax revenue by half a point of GDP on average, and by 3-4 points in the key commodity exporters. Figure 9. Tax/GDP ratios in EE-FSU (left panel) and L. America (right panel), 1995-2007
17
17.5
18
18.5
19
19.5
20
1995
1996
1997
1998
1999
2000
2001
2002
2003
2004
2005
2006
2007
12
13
14
15
16
17
18
1995
1996
1997
1998
1999
2000
2001
2002
2003
2004
2005
2006
2007
EE- FSU countries: Armenia, Azerbaijan, Bulgaria, CzecRepublic, Estonia, Georgia, Hungary, Kazakhstan, KyrgyzstanLatria, Poland, Romania, Slovakia, Slovenia, TajikistanUzbekistan
LAC countries: Argentina, Bolivia, Brazil, Chile, ColombiaCosta Rica, Dom. Rep., Ecuador, El Salvador, GuatemalaHonduras, Mexico, Nicaragua, Panama, Paraguay, PeruUruguay, Venezuela
Source: author’s calculations on IMF Government of Finance Satistics
14 The evidence shows that between 2000 and 2007, earnings inequality rose in one third of the countries, stagnated in another third and fell in the rest (Transmonee 2009). Yet, detailed research emphasizes that returns to education rose following wage decompression, technological modernisation and growing informalisation (Mitra and Yemtsov, 2006) . 15 Regression analysis (Cornia and Martorano 2009) confirms that tax/GDP ratio rose on average by 0.20-0.22 GDP points a year in all countries due to greater tax effort, a formalization of the economy, and tax buoyancy in 2003-7. The test shows also that while an increase in GDP/c lead to higher tax/GDP in LOC countries, no effects was observed in NO-LOC countries.

The evolution of tax/GDP ratio in EE-FSU was affected by an initial decline coinciding with a deep and long transformational recession. In their effort to raise tax revenue (which rose by 1.2 GDP point, against 2.5 for Latin America), the EE-FSU countries relied on administrative simplifications and reduced tax rates, focusing in particular on VAT and a ‘flat tax’. While the three Baltic retained the pre-reform tax rates and generally increased the no-tax area (thus making the tax schedule more progressive), all others adopted very low rates (i.e. 10-15 percent for the personal income tax, and 9-25 percent for the corporate income tax) equal to the lowest pre-reform tax rates (Table 10). In this case, the ex-ante effect of the reform is dis-equalizing while there is no evidence of Laffer-type behavioral responses generating revenue increases (Kim et al. 20008, IMF…). While it is important to avoid generalizations, and while the effects of flat taxes are not necessarily regressive, it appears that these changes likely reduced tax progressivity in all but the Baltic countries. Table 10. Countries adopting the Flat Tax in EE- FSU
Personal Income TaRates
Corporate Income TaRate
Country Year oadoption Before After Before After
Basic allowance
Estonia 1994 16 - 33 26 35 26 Increase Lithuania 1994 18 - 33 33 29 29 Increase Latvia 1997 25 and 10 25 25 25 Reduction Russia 2001 12- 30 13 30 35 Increase Ukraine 2004 10 -40 13 30 25 Increase Slovak Rep. 2004 10 -38 19 25 19 Increase Georgia 2005 12 -20 12 20 20 Eliminated Romania 2005 18 -40 16 25 16 Increase Kyrgyzstan 2006 10 - 20 10 20 10 Unchanged Macedonia 2007 15- 24 12 15 12 Unchanged Kazakistan 2007 5- 20 10 30 30 Increase Albania 2007 1 -20 10 20 20 Increase Monetegro 2007 15- 23 15 15- 20 9 Increase Czech Rep. 2008 12 -25 15 24 22 Increase Bulgaria 2008 10-24 10 10 10 Eliminated
Source: Keen, Kim and Varsano (2008) In Latin America, the last decade has seen improvements in the field of social transfers (Tr), with favorable redistributive effects. During the 2000s, public expenditure on social security and social assistance rose, and there is evidence that its incidence became more progressive (CEPAL 2005). Yet, there has been a shift from social insurance for the relatively few employed in the formal sector plus a small spending on social assistance, towards a better financed social assistance (Barrientos and Santibanez 2009). This new emphasis entailed the development of large scale poverty reduction programs pivoting around unconditional cash transfers, conditional cash transfers, and integrated anti-poverty programs which absorbed between 0.5 to 1 percent of GDP and covered a high share of the population at risk. Several studies document their favorable impact on human capital formation, while a study on Brazil found that non-contributory pensions and Bolsa Família explained one third of the inequality decline over 2000-6 (see IPEA in CEPAL 2006).
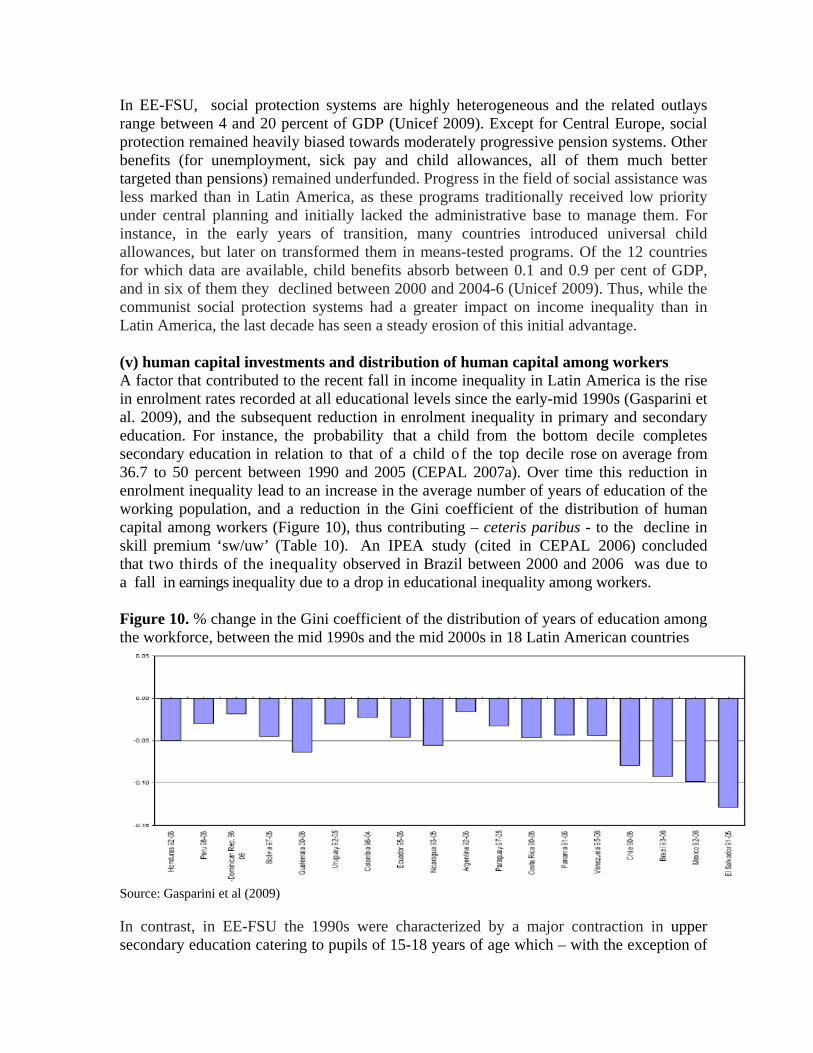
In EE-FSU, social protection systems are highly heterogeneous and the related outlays range between 4 and 20 percent of GDP (Unicef 2009). Except for Central Europe, social protection remained heavily biased towards moderately progressive pension systems. Other benefits (for unemployment, sick pay and child allowances, all of them much better targeted than pensions) remained underfunded. Progress in the field of social assistance was less marked than in Latin America, as these programs traditionally received low priority under central planning and initially lacked the administrative base to manage them. For instance, in the early years of transition, many countries introduced universal child allowances, but later on transformed them in means-tested programs. Of the 12 countries for which data are available, child benefits absorb between 0.1 and 0.9 per cent of GDP, and in six of them they declined between 2000 and 2004-6 (Unicef 2009). Thus, while the communist social protection systems had a greater impact on income inequality than in Latin America, the last decade has seen a steady erosion of this initial advantage. (v) human capital investments and distribution of human capital among workers A factor that contributed to the recent fall in income inequality in Latin America is the rise in enrolment rates recorded at all educational levels since the early-mid 1990s (Gasparini et al. 2009), and the subsequent reduction in enrolment inequality in primary and secondary education. For instance, the probability that a child from the bottom decile completes secondary education in relation to that of a child o f the top decile rose on average from 36.7 to 50 percent between 1990 and 2005 (CEPAL 2007a). Over time this reduction in enrolment inequality lead to an increase in the average number of years of education of the working population, and a reduction in the Gini coefficient of the distribution of human capital among workers (Figure 10), thus contributing – ceteris paribus - to the decline in skill premium ‘sw/uw’ (Table 10). An IPEA study (cited in CEPAL 2006) concluded that two thirds of the inequality observed in Brazil between 2000 and 2006 was due to a fall in earnings inequality due to a drop in educational inequality among workers. Figure 10. % change in the Gini coefficient of the distribution of years of education among the workforce, between the mid 1990s and the mid 2000s in 18 Latin American countries
Source: Gasparini et al (2009) In contrast, in EE-FSU the 1990s were characterized by a major contraction in upper secondary education catering to pupils of 15-18 years of age which – with the exception of

Central Europe and, in part, the Baltic states - lasted till the mid 2000s (Figure 11). The enrolment decline was very marked among the pupils of vocational schools from low and middle income groups but was observed also (till the mid 1990s) the enrollments in general secondary and tertiary education. Enrolments in the latter have since recovered steadily (except in Bulgaria and a few Central Asian and Caucasus countries), mostly because of an expansion in comparatively costly private universities affordable only to well off families. The decline in enrolment was mostly due to the introduction of school fees, lower family incomes, perceived low returns to technical education, and deteriorating quality of educational institutions Figure 11. Trends in gross enrolment rates in upper secondary education in sub-regions of EE-FSU (as a percentage of the population aged 15-18)
Source: Unicef (2009)
This trend suggests that a growing number of youth did not complete their education, that after 5-10 years the supply of skilled and semi-skilled labour was smaller than expected, that the average level of education of the labour force stagnated or declined during the 2000s, i.e. years of fast growth and modernisation during which the demand for skilled labour rose. All this possibly pushed upwards skilled and semi-skilled wages, and raised the Gini coefficient of the distribution of human capital among the members of the workforce.
5.3. Differential impact of policies on growth, inequality and instability The hyper-liberal reforms introduced in EE-FSU during the transition and deepened during the current decade – which include the early liberalization of trade, FDI, capital flows and migration, fixed nominal pegs, flat tax, targeted social security, user fees in public services, rapid privatization and so on - generated over 2000-7 a GDP growth faster than in Latin America. Indeed, FDI and foreign lending were a welcome addition to the domestic investment and enhanced growth performance (Table 11). In addition the EE-FSU, particularly Central Europe and the Baltic, became much more integrated in the global economy than any other regions. Yet, this policy model has lead to four main problems. Firstly, while the external economic integration of the region rose, its diversification remained limited, while in Latina America,

exports destination were gradually diversified by increasing trade with the Asia-Pacific region and away from the US. In contrast in EE-FSU, the close integration with the Western Europe, which accounts for 60-90 percent of the trade and financial transactions, except for Central Asia (Nuti 2009) increased its vulnerability to shocks originating from Western Europe. Secondly, EE-FSU has been the only emerging region to collectively run a persistent and large current account deficit (Figure 7), while over 2003-8 Latin America consistently run a surplus. This situation increased its susceptibility to capital flows reversal16. As a result of these two factors, EE-FSU grew as a whole by 7.1 percent over 2000-6 as opposed to 3.7 percent of Latin America over the same period (5.4 over 2003-6), but this advantage disappeared in 2008 and was sharply reversed in 2009-10, especially in the Baltic countries, Hungary, Ukraine, Russia and so on. In Latin America, only Mexico (whose trade relations are also little diversified) recorded in 2009 a similar GDP decline. In this sense, the recent EE-FSU crisis is a repeat of the L. American debt-lead growth and debt accumulation of the 1970s- which in the end lead to the crisis of the 1980s. In the case of EE-FSU the accumulation of foreign debt was proportionately greater and likely to cause considerable medium term negative effect. Table 11. GDP growth in Eastern Europe-Former Soviet Union, Latin America and the countries most affected by the 2009 crisis , 2000-2010 2000-6 2007 2008 2009 2010
EE-FSU Central Europe & Baltics(of which) 5.6 7.0 1.7 -8.3 -0.4 - Estonia 8.5 7.2 -3.6 -14.0 -2.6 - Hungary 4.3 1.2 0.6 -6.7 -0.9 - Latvia 8.6 10.0 -4.6 -18.0 -4.0 - Lithuania 7.3 8.9 3.0 -18.5 -4.0 South Eastern Europe (of which) 5.1 7.2 6.6 -3.6 0.5 - Bulgaria 5.4 6.2 6.0 -6.5 -2.5 - Romania 5.6 6.2 7.1 -8.4 0.5 East. Europe &Caucasus (of which) 9.1 12.1 5.9 -7.0 2.6 - Moldova 6.0 3.0 7.2 -9.0 0.0 - Ukraine 7.4 7.9 2.1 -14.0 2.7 Russian Federation 6.9 8.1 5.6 -7.5 1.5 Central Asia 8.9 9.3 7.6 2.5 6.0 Total EE-FSU 7.1 8.7 5.5 -4.8 2.1
Latin America and the Caribbean C. America + Caribbean (of which) 3.9 6.5 4.2 -1.4 3.0 - Mexico 3.0 3.4 1.3 -6.7 3.5 South America (of which) 3.5 6.5 5.9 -0.1 4.7 - Chile 4.3 4.7 3.2 -1.8 4.5 - Paraguay 2.0 6.8 5.8 -3.5 3.0 - Venezuela 4.1 8.2 4.8 -2.3 2.0 Total L. America & Caribbean 3.7 6.5 5.2 -0.7 4.3 Source : IMF, World Economic Outlook Database, October 2009, CEPALSTAT and ECLAC (2009) Thirdly, the neoliberal policies adopted in much of the region reduced the policy space (in the fiscal, monetary and exchange rate areas) for responding to the external shocks that hit 16 Auer and Wehrmuller 2009 (quoted in NUti 2009) estimate in 250 $ billion the foreign debt of the region, much of which became sub-prime as many local currencies were devalued.
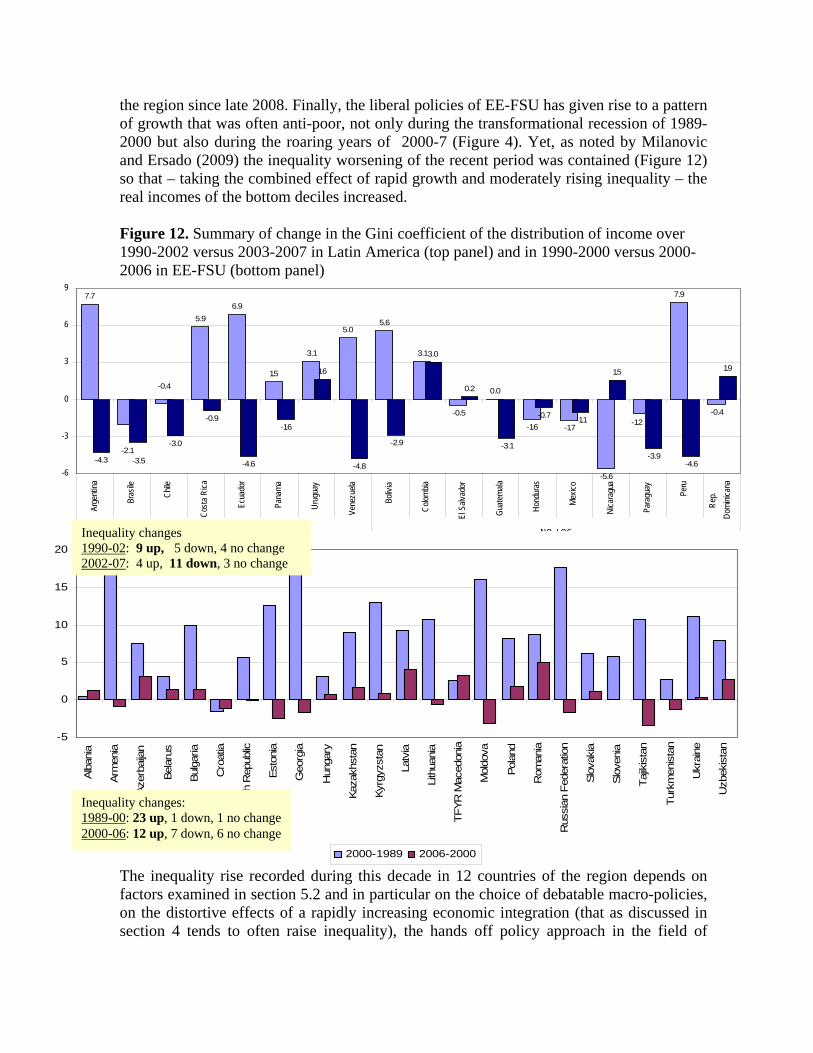
the region since late 2008. Finally, the liberal policies of EE-FSU has given rise to a pattern of growth that was often anti-poor, not only during the transformational recession of 1989-2000 but also during the roaring years of 2000-7 (Figure 4). Yet, as noted by Milanovic and Ersado (2009) the inequality worsening of the recent period was contained (Figure 12) so that – taking the combined effect of rapid growth and moderately rising inequality – the real incomes of the bottom deciles increased. Figure 12. Summary of change in the Gini coefficient of the distribution of income over 1990-2002 versus 2003-2007 in Latin America (top panel) and in 1990-2000 versus 2000-2006 in EE-FSU (bottom panel)
7.7
5.96.9
1.5
3.1
5.05.6
3.1
-0.5
0.0
-1.6 -1.7
-5.6
7.9
-0.4
-4.3
-3.0
-0.9
-4.6
-1.6
1.6
-4.8
-2.9
3.0
0.2
-3.1
-0.7 -1.1
1.5
-3.9-4.6
1.9
-1.2
-0.4
-2.1-3.5
-6
-3
0
3
6
9
Arge
ntina
Bras
ile
Chile
Cost
a Ri
ca
Ecua
dor
Pana
ma
Urug
uay
Vene
zuela
Boliv
ia
Colom
bia
El S
alvad
or
Guat
emala
Hond
uras
Mex
ico
Nica
ragu
a
Para
guay
Peru
Rep.
Dom
inica
na
LOC NO_LOC
2002 - 1990 2007 - 2003
The inequality rise recorded during this decade in 12 countries of the region depends on factors examined in section 5.2 and in particular on the choice of debatable macro-policies, on the distortive effects of a rapidly increasing economic integration (that as discussed in section 4 tends to often raise inequality), the hands off policy approach in the field of
-5
0
5
10
15
20
Alba
nia
Arm
enia
Azer
baija
n
Bela
rus
Bulg
aria
Cro
atia
Inequality changes 1990-02: 9 up, 5 down, 4 no change 2002-07: 4 up, 11 down, 3 no change
Cze
ch R
epub
lic
Esto
nia
Geo
rgia
Hun
gary
Kaza
khst
an
Kyrg
yzst
an
Latv
ia
Lith
uani
a
TFYR
Mac
edon
ia
Mol
dova
Pola
nd
Rom
ania
Rus
sian
Fed
erat
ion
Slov
akia
Slov
enia
Tajik
ista
n
Turk
men
ista
n
Ukr
aine
Uzb
ekis
tan
Inequality changes: 1989-00: 23 up, 1 down, 1 no change 2000-06: 12 up, 7 down, 6 no change
2000-1989 2006-2000
labour and educational policies and the limited interventions in the field of social transfers (always with the exception of the Central European countries). Other factors not discussed in this paper that are often cited as having contributed to the inequality increase concern the privatization and introduction of user fees in former public utilities, and inflation (which however remained comparatively low during the last decade). These changes have, of course to be seen in relative terms, as in Central Europe and the Baltic, the inequality rise of the last decade does not cancel the fact that their income inequality remains well below Latin American levels, largely due to a much larger redistributive impact of direct taxes and public transfers (Zaidi 2009). Latin America introduced – thanks also to favorable external conditions – economic reforms broadly inspired by a ‘prudent redistribution with growth’ committed to reducing the social debt inherited from the colonial past and exacerbated by the liberal policies of the 1980s and 1990s. With few exceptions, the new policy model did not introduce a radical redistribution. Rather, it emphasized orthodox objectives such as macro-stability, fiscal prudence, and the preservation of free trade and capital movements. Yet, in a clear departure from the 1990s, LOC and to some extent NO-LOC governments opted for managed exchange rates, a neutral or countercyclical fiscal policy, reduced dependence on foreign capital, rapid accumulation of currency reserves, and a more active role of thee state in the field of taxation, labor and social policies. 6 Policies to control inequality and promote growth in an open economy What policy making lessons can one draw from the literature on the inequality impact of international economic integration, and the comparison of the development experiences of Latin America and the EE-FSU? Leaving aside the adjustment policies to be adopted during the current crisis, which development policies should be used in an increasingly open economy in which – as the literature reviewed (section 4.1 to 4.4) suggests – economic integration increases instability, the probability of crisis and adverse distributional effects? The suggestions provided below – inspired in good part by the above regional comparison – are of general nature, while specific measures will differ according to the size, economic specialization, level of development, and institutions of the country considered. Their rationale is to avoid crisis and promote growth (which – ceteris paribus – reduces inequality indirectly) while in several cases the measures proposed reduce inequality directly. (i) Limiting foreign indebtedness and mobilize domestic savings. The LA vs EE-FSU comparison confirms once more that while the liberalization of the capital account offers an opportunity to access a global pool of savings, this policy entails several risks if it is accompanied by large and persistent capital account deficits financed with rising public or private foreign indebtedness. Such risk declines but does not disappears if the capital inflows are mainly FDI. Thus, the recourse to foreign resources should be sustainable and selective — for example, focused on the traded sector — while countries with large foreign debt should gradually reduce it, as illustrated by the recent Latin American experience. This means that capital accumulation should be mainly funded by mobilizing domestic private and public savings through the development of the domestic banking network, as shown by the experience of Malaysia, China and, recently, by a number of Latin American countries.

The empirical evidence shows that open economies with larger domestic banking systems have smaller portfolio inflows than those with smaller domestic banking systems. A policy of moderate financial restraint could also be used to raise domestic savings and capital accumulation.
(ii) Controlling capital inflows and harnessing their sectoral allocation. Capital inflows can increase capital accumulation and (under certain conditions) exports, but can cause also a number of perverse effects. In countries with a large labour supply, an opening to greenfield FDI in manufacturing is likely to generate positive growth and distributional effects, as shown by the past experience of Malaysia, Mauritius and a few Central American countries which attracted FDI to priority manufacturing sectors which employed unskilled and semi-skilled workers and raised export earnings. The impact of FDI in other sectors needs closer assessment (see part 3) as its effect may generate trade-offs and therefore require compensatory measures (e.g. public work schemes in the areas left behind). In contrast, even in the presence of sound macroeconomic conditions and good regulatory institutions, countries should be free to impose market-based or administrative controls on capital inflows and outflows which cause large swings in the real exchange rate and generally affects negatively the distribution of income (see section 4.3). Such types of measures have been introduced recently in Agentina, Brazil, Colombia and in the 1990s in Colombia, Spain, Chile and other countries. In addition, the central bank can set limits on the foreign exchange exposure of domestic banks and the volume hard currency loans in the domestic sector, forbid banks them to borrow internationally or to extend loans to the non-tradable sector. The IMF supports the introduction of temporary controls during crisis periods, but countries may consider extending such measures as long as they are needed, as in the case of China. (iii) Choosing an appropriate exchange rate regime. Such a regime should minimize the risk of currency crises, and at the same time provide adequate incentives to the expansion of the traded sector, where the majority of the poor is often (not always) employed. This means rejecting the view about the superiority of ‘two corner solutions’ over intermediate regimes. Indeed, as shown by Table 11, the EE-FSU countries that suffered the largest GDP falls in 2009 and 2010 are those with currency boards and fixed pegs. It is obviously difficult to generalize, but in medium-small developing countries an intermediate regime aiming at credibly stabilizing the real exchange rate and its expectations is the best option. An example of such exchange rate regime is the BBC (basket, band and crawl) regime adopted in Chile in the 1990s and in Argentina during the 2000s. Empirical research has shown that a stable and competitive exchange rate has been a key factor to kick-start growth (Rodrik 2003) and improve long-term performance. This approach leads to a slower decline of inflation, and needs to be supported by countercyclical fiscal and monetary policies and measures that control capital inflows. In addition, it may not help improving the distribution of income in countries where the poor are located in the non-traded sector (as in the urban informal sector), where the traded sector is skilled labour intensive or where the benefits of nominal devaluation are only in part passed-through to the people employed in the traded sector. Also, in very small economies with highly volatile terms of trade and difficulties in diversifying their exports, dollarization may be an option. Finally, in large developing economies, a competitive exchange rate is less necessary for growth,

poverty alleviation and reducing inequality as these objectives can equally be pursued through an expansion of the domestic components of aggregate demand driven by fiscal policy (Bhaduri 2005).
(iv) Countercyclical fiscal policy and stabilization funds. In many developing countries government revenue oscillates widely because of fluctuations in the demand and prices of their exports and climatic shocks. Capital markets behave pro-cyclically and so reduce the possibility of stabilizing consumption in bad years. All this leads to large public expenditure cuts that exacerbate the shocks and worsen inequality. As the recent experience of some Latin American countries shows, this problems can be tackled with countercyclical fiscal policies. Indeed, during the current crisis these countries were in a position to follow a more flexible monetary policy and a countercyclical fiscal policy entailing a sizeable fiscal stimulus and substantial deficits. All this was made possible by the budget surpluses, the subsequent decline of the public debt, large accumulation of currency reserves, and decline in inflation realized during the boom years. In countries with valuable commodities, countercyclical policies can be achieved via the creation of ‘stabilization funds’ as done in Chile and Venezuela and in EE-FSU by Russia, Kazahkstan and Azerbadjian. The rules that regulate their functioning must be set ex ante by law and not left to the discretionary decisions of policy makers. Countries that have such ‘fiscal space’ and make good use of it can control the rise of inequality observed during crisis, as well as the negative distributive effects of the Dutch Disease on occasion of large currency inflows. The good use of such stabilization funds is not, however, to be taken for granted as indicated by the recent Kazak experience where much of the funds drawn down were used to recapitalize failing domestic banks. (v) trade measures. As noted in 4.1 – in many case trade liberalization has unexpectedly lead to increases in inequality mainly due to short run factors immobility (meaning that the capital and labour in the sector being penalized by trade liberalization do not move to the new sectors of specialization), trade-induced skilled biased technological change, the confounding effects of simultaneous capital flows and exchange rate fluctuations, and other factors. Any further liberalization must therefore consider both the growth and inequality impact of these measures and avoid any further opening when the expected results in both areas appear negative or highly uncertain. In contrast, if trade liberalization promotes growth (e.g. via technological modernisation) but affects inequality (e.g. by making redundant unskilled workers), the trade measures must be accompanied by compensatory programs (e.g. active labour market policies) to reduce the impact on inequality. (vi) supportive domestic policies. These measures have to be introduced for two reasons: first to compensate the adverse distributive effects of some international measures that may be desirable in terms of growth but not in terms of their distributive impact; second, these distribution-enhancing measures can generate positive effects on growth (see section 2.4) while reducing the dis-equalizing effect of some measures (e.g. as when a substantial increase in the supply of skilled workers offsets the dis-equalizing effects of a trade liberalization which increases the skill bias of production)
Among the domestic measures, that those that are more directly impacting the distribution of income are those in the field of taxation and income transfers, income policies, and human capital formation. Space limitation forbids to illustrate in detail the rationale and impact of these policies which are merely mentioned hereafter. - Tax policy has to aim to a gradual increase in tax/GDP ratios which allows providing public goods, effect the transfers that society considers ‘socially desirable‘, and to finance the compensatory programs required to offset with safety nets the possible adverse effects of greater economic integration. Several countries in both Latin America and EE-FSU have already moved in this direction, but in most cases there is a need to increase the progressivity of the tax instruments used and, to enhance the horizontal equity of taxation, so as to have a greater impact on income distribution. As noted, this can be done not only with traditional progressive income and wealth tax but also with a flat tax with a sufficiently high rate and considerable no tax areas, as well as with an appropriate taxation of mining rents to capture part of windfall profits. Greater taxation is important also to avoid a large accumulations of public debt or inflation due to monetization. - Income transfers generally induce strong redistributive effects, as already observed in Central Europe and a few Latin American countries. Their intensification depends on progress in the field of both social insurance and social assistance. Indeed, the recent evidence seems to suggest an approach of ‘walking on two legs’. In a country with limited formal sector, social security expenditure is not progressive, as it mainly covers few formal sector workers with stable employment. This raises the question of how best can government expand social security coverage, whether by actively extending the formal sector (the evolution of which depends on many factors) or by setting up solidarity-based, non-contributory, universal or targeted funds providing basic benefits to informal sector workers and their families, including also consitional and non-conditional cash transfers. In middle income countries, both approaches should be pursue at once. - labor market (or income) policies are also required, and in both regions there is a need to strengthen the ‘labor institutions’ which help regulating to some degree the distribution of earnings, by addressing the problems of unemployment, informalization, minimum wages, and weakening of institutions for wage negotiations and dispute settlements. Specific programs in this area include passive and active labor market policies, such as unemployment insurance, retraining programs to readjust to the new labor market conditions, reducing working hours, and self-targeting public-work schemes. Minimum wages – which most literature shows reduce inequality – need also to be raised to adequate levels as suggested by the empirical literature. And finally, wage bargaining institutions need to be strengthened after having been weakened substantially in most countries during the last three decades of liberal policies. Efforts at ‘formalizing employment’, even if at the cost of greater employment flexibility, may also be needed. - finally, the recent evidence suggests that an improvement in the distribution of educational achievements among the workforce has a major impact on the distribution of income, as it increases the supply of skilled workers and so reduces the rise of the skill premium (sw/uw). In many developing countries this means rising the completion rates in

secondary education and to a lesser extent broadening the access to subsidized tertiary education. The effects on inequality of rising secondary enrolments is lagged by several years (at least 5-10) but the long term effect can be quite powerful. The impact on inequality is not automatic either, as an expansion of the stock of human capital leads to an increase in employment and drop in wage inequality only if additional jobs are created. Bibliographic references Aslund, A. (2009), ”The East European Financial Crisis », CASE Network Studies and
Analysis, No 395/2009, Warsaw Benassy-Queré, A. and V. Salins. 2005. Impact de l’ouverture Financière sur les Inégalités
internes dans les Pays Emergents. Working Paper No. 11/05, Centre d’études prospectives et d’informations internationales, Paris. July.
Birdsall, N. (2000) ‘Why Inequality Matters: The Developing and Transitional Economies’ (mimeo, February), Carnegie Endowment for International Peace, Washington DC.
Caprio, G and D. Klingebiel (2003) “Database of systemic and borderline financial crises”, The World Bank, Washington D.C.
Cornia, G.A. (2006), “Pro-Poor Macroeconomics: Potential and Limitations”, Palgrave, London.
Cornia, G.A. (2005), Inequality, Growth and Poverty in an Era of Liberalisation and Globalisation, Oxford University Press, Oxford.
Cornia, G.A. (2009),” Transition, Structural Divergence, and Performance: Eastern Europe and the former Soviet Union over 2000-2007” forthcoming in G. Roland (ed. 2010) “Eastern Europe and the Former Soviet Union 20 years after the fall of the Berlin Wall”, Palgrave
Cornia, G.A., T.Addison with S.Kiiski (2005), ‘Income Distribution Changes and Their Impact in the Post-World War II Period’, in G.A. Cornia (2005), op.cit.
Cornia, G.A. and B. Martorano (2009), “ External shocks, policy changes, and income distribution: Latin America during the last decade” Conference in honor of Frances Stewart, Oxford Department of International Development (17-18 September 2009), http://www.qeh.ox.ac.uk/pdf/pdf-stewart/cornia%20and%20martorano.pdf
Docquier, F. and I. Rapoport (2003), “Remittances and inequality: A dynamic migration model”, IZA Working Paper . 808. June 2003.
ECLAC (1990), Changing Production Patterns with Social Equity: The Prime Task of Latin American and Caribbean Development in the 1990s. Santiago, Chile: United Nations Economic Commission for Latin America and the Caribbean.
Keen, M., Kim Y, and R. Varsano (2008),”The “flat tax(es)”: principles and experience”, International Tax Public Finance (2008) 15: 712–751
Koujianou Goldberg P and N. Pavcnik (2007), “Distributional effects of globalization in developing countries” , Working paper 12885, NBER Working Papers series, NBER, Cambridge.
Lora, Eduarado (2008), “La Revoilucion Silenciosa de las Instituciones y la Estabilidad Macroeconomica”, Documento de Trabajo n. 649, InterAmerican Development Bank, Wasjhington D.C, November 2008.
OECD (2008), “Growing Unequal”, OECD, Paris.
Prasad, E., K.Rogoff, Shang-Jin Wei and M.Kose (2003) “Effects of Financial Globalisation on Developing Countries: Some Empirical Evidence”, IMF Occasional Paper 220, IMF, Wadhington D.C:
Solt, F. (2009). “Standardizing the World Income Inequality Database.” Social Science Quarterly 90(2):231-242. SWIID Version 2.0, July 2009.
UNCTAD (2007), “World Investment Report”, UNCTAD, Geneva. UNICEF (2009), “Innocenti Social Monitor”, IRC Unicef, Florence. Zaidi, S. (2009), “Main Drivers of Income Inequality in Central European and Baltic
Countries: Some Insights from Recent Household Survey Data”, Policy Research Working Paper 4815, The World Bank, January 2009.