Embed Size (px)
Citation preview
Economic Issues
COVID-19: An Opportunity to Reset Policy Levers for Better Gender Equality in Economy
and Society
South Australian Centre for Economic Studies
University of Adelaide


Economic Issues
No. 53
COVID-19: An Opportunity to Reset Policy Levers for Better Gender Equality in Economy
and Society
Authors: Dr Tania Dey, Research Economist
Associate Professor Michael O’Neil, Executive Director
October 2020
South Australian Centre for Economic Studies University of Adelaide

Economic Issues
Page ii The SA Centre for Economic Studies, University of Adelaide
ISSN 1445-6826 Copyright: All rights reserved. The Copyright Act 1968 permits fair dealing for study, research, news reporting, criticism or review.
Selected passages, tables or diagrams may be reproduced for such purposes provided acknowledgement of the source is included. Otherwise, no part of this publication may be reproduced, stored or transmitted in any form or by any means without the prior permission in writing of the Publisher.
Disclaimer: While embodying the best efforts of the investigators this Issue Paper is but an expression of the issues considered
most relevant, and neither SACES, the investigators, nor the University of Adelaide can be held responsible for any consequences that ensue from the use of the information in this report. Neither SACES, the investigators, nor the University of Adelaide make any warranty or guarantee regarding the contents of the report, and any warranty or guarantee is disavowed except to the extent that statute makes it unavoidable.
The views expressed in this paper are the views of the author(s), and should not be taken to represent the views of
the South Australian Centre for Economic Studies nor the University of Adelaide. Published by: South Australian Centre for Economic Studies University of Adelaide SA 5005 AUSTRALIA Telephone: (61+8) 8313 5555 Facsimile: (61+8) 8313 4916 Internet: http://www.adelaide.edu.au/saces Email: [email protected] © SA Centre for Economic Studies, 2020 Subscription and Corporate Membership: Information on Corporate Membership of the SA Centre for Economic Studies may be obtained by contacting SACES
or at our website, www.adelaide.edu.au/saces

Economic Issues
The SA Centre for Economic Studies, University of Adelaide Page iii
Executive Director’s Note
Welcome to the fifty third issue of Economic Issues, a series published by the South Australian Centre for Economic Studies as part of its Corporate Membership Program. The scope of Economic Issues is intended to be broad, limited only to topical, applied economic issues of relevance to South Australia and Australia. Within the scope, the intention is to focus on key issues – public policy issues, economic trends, economic events – and present an authoritative, expert analysis which contributes to both public understanding and debate. Papers will be published on a continuing basis, as topics present themselves and as resources allow. This paper presents a discussion on economic and social norms that have contributed to the changing participation of women in the Australian labour market. While that participation continues to increase there is still more that can be done to improve equality and equity in the workforce that will contribute to national productivity and income. COVID-19 offers the opportunity of a fresh look at many social norms (that continue to change) and our economic policies to maintain and reward the participation of women in the labour market. Australia as a nation will be better off and families and children likewise. The views expressed in the report are the view of the authors. We would like to thank the following individuals, Leonora Risse, Duygu Yengin, Danielle Wood, Owain Emslie and Anthony Kosturjak for their comments.
Michael O’Neil Executive Director
SA Centre for Economic Studies October 2020

Economic Issues
Page iv The SA Centre for Economic Studies, University of Adelaide

Economic Issues
The SA Centre for Economic Studies, University of Adelaide Page v
Recent Issues Papers
52. “Skilled Migration to South Australia 2010-2014: profile and employment outcomes of recent permanent and
temporary migrants”, by Andreas Cebulla and George Tan, September 2019. 51. “Insights from the 2016 Census”, by Anthony Kosturjak, March 2018. 50. “To Ignore Reform is to Ignore Opportunity: Creating a more effective and sustainable public sector”, by Michael
O’Neil and Darryl Gobbett, February 2018. 49. “Development Strategy for Reinventing South Australia”, by Michael O’Neil and Darryl Gobbett, January 2018. 48. “EFTPOS In Gaming Areas: Wrong Way – Go Back!”, by Michael O’Neil, April 2016. 47. “The Aged Structure of the Population and Economic Growth – Does it Matter?, by Michael O’Neil and Lauren Kaye,
February 2016. 46. “The Regulatory Load in South Australia and Impact on Economic Activity”, by Darryl Gobbett, Michael O’Neil and
Steve Whetton, February 2016. 45. Where Do We Go From Here? South Australia’s Economic Prospects Going Forward and the Role of Government”,
by Michael O’Neil, Steve Whetton, Darryl Gobbett and Christopher Findlay AM, July 2015. 44. “Should South Australians Really Be ‘Down in the Mouth’? Macroeconomic Performance”, by Michael O’Neil, Steve
Whetton, Darryl Gobbett and Christopher Findlay AM, June 2015. 43. “Exceeding the Limit: How Excessive Speeding Fines May Undermine Community Engagement with Government
Road Safety Policies”, by Michael O’Neil and Lauren Kaye, June 2015. 42. “Structural Change: Lessons from Port Augusta’s Experience in the 1990s”, by Michael O’Neil, July 2014. 41. “The Labour Market, Competitiveness, Employment and Economic Prospects”, by Michael O’Neil, Lauren Kaye and
Mark Trevithick, June 2014. 40. “Providing Local Economic Stimulus and Promoting Local Economic Development: Possibilities for Councils in
South Australia”, by Michael O’Neil, Cliff Walsh, Anthony Kosturjak and Mark Trevithick, October 2013. 39. “The Task of Strengthening Regional Development”, by Michael O’Neil, September 2013. 38. “Localism: Learning from Federal Nation Building (Economic Stimulus) Projects”, by Michael O’Neil, Steve Whetton
and Suraya Abdul Halim, September 2013. 37. “Re-Thinking Social Policy: Place-Shaped As Well As People-Focussed”, by Cliff Walsh and Michael O’Neil, May
2013. 36. “South Australian Centre for Economic Studies: 30 Year Anniversary”, by Gary Banks AO and Gary Sturgess AM,
April 2013. 35. “Is Adelaide a University City?”, by Michael O’Neil and Mark Trevithick, April 2013. 34. “Assisting Regions and Communities to Cope with Structural Change: Context, Objectives, Principles and Good
Practice”, by Cliff Walsh and Michael O’Neil, August 2011. 33. “The Economic Consequences of the Euro” by Colin Rogers, July 2011. 32. “Banking Competition: The Rhetoric and the Reality” by Dr Penny Neal, May 2011. 31. “South Australian Labour Markets: 2000 to 2010” by Michael O’Neil and Mark Trevithick, February 2011. 30. “Migration Trends in South Australia, 1998/99 to 2008/09” by Mark Trevithick, January 2011. 29. “Decline and Rejuvenation: The Provincial Cities of South Australia” by Michael O’Neil, Mark Trevithick, Daisy
McGregor and Antony Pietsch, January 2011. 28. “Re-Thinking the Approach to Regional Development in South Australia”, by Michael O’Neil and Cliff Walsh,
December 2010. 27. “Identifying the Main Economic Issues Facing the South Australian Wine Industry”, by Nicola Chandler, April 2010. 26. “Nuclear Power in Southeast Asia: Implications for Australia and Non-Proliferation”, by Andrew Symon, April 2009. 25. “The Global Economic Crisis of 2008: Some Thoughts on Causes and Remedies”, by Colin Rogers, January 2009. 24. “Assisting Injured Workers Return to Work: The Economy Needs You!”, by Michael O’Neil and Peter Lumb,
November 2008. 23. “A Review of the Literature of Active Labour Market Policies”, by Michael O’Neil and Penny Neal, June 2008. 22. “Self-Managed Superannuation Funds: Some Public Policy Issues Regarding Their ‘Decumulation’ Phase, by
Owen Covick, April 2008. 21. “Australia’s Productivity Growth in the 21st Century”, by Dean Parham, September 2007. 20. “Building a Local Defence Industry: Workforce Requirements 2006-2010”, by Michael O’Neil, Steve Whetton and
Edwin Dewan, March 2007. 19. “Running on Empty: The Risk of Continuing to Dither While the Empty Light is Flashing”, by Professor Peter Cullen,
AO, FTSE, January 2007. 18. “South Australia’s Recent Productivity Performance” by Jim Hancock and Wing Hsieh, April 2006. 17. “Mining the Labour Market: The Estimated Demand for Labour in the SA Mining Sector, 2006-2014” by Michael
O’Neil and Paul Huntley, April 2006. 16. “Australia’s New Trade Agreements: Beneficial Liberalisation or Harmful Policy?” by Andrew Symon, November
2005. 15. “Wind Generation and the South Australian Economy” by Stephen Nelson, April 2005. 14. “South Australia’s Overseas Exports” by Paul Huntley, March 2005. 13. “The 2004/05 South Australian Budget” by Jim Hancock, July 2004. 12. “The Relative Decline of Manufacturing Employment in South Australia” by Anthony Kosturjak and Joshua Wilson-
Smith, July 2004. 11. “An Ageing Australia: Small Beer or Big Bucks?” by Gary Banks, May 2004. 10. “Enhancing Trust in Australia’s Tax System” by Owen Covick, April 2004. 9. “Inquiry into the Management of Electronic Gaming Machine Numbers” by Michael O’Neil and Steve Whetton, April
2004.

Economic Issues
Page vi The SA Centre for Economic Studies, University of Adelaide
8. “Review of the South Australian Economy, 1990-2003” by Michael O’Neil, Penny Neal and Anh Thu Nguyen, March 2004.
7. “Darwin: A Gateway to Asia?” by Andrew Symon, March 2004. 6. “Innovation Activity and Income Levels: A Summary of Indicators” by Jim Hancock, Marianne Herbert and Steve
Whetton, April 2003. 5. “The SA Labour Market Through the 1990s” by Anthony Kosturjak, February 2003. 4. “The 2002/03 Commonwealth Budget” by Owen Covick, August 2002. 3. “An Assessment of the Impact of Gaming Machines on Small Regional Economies” by Michael O’Neil and Steve
Whetton, May 2002. 2. “Timor Sea Natural Gas Development: Still in Embryo” by Andrew Symon, August 2001. 1. “The 2001/02 South Australian Budget” by Jim Hancock, August 2001.

Economic Issues
The SA Centre for Economic Studies, University of Adelaide Page vii
Executive Summary
The starting principle with respect to gender should be in our view the principle of equality. Promoting equality between men and women ought to be the bedrock of public policy. From that basis it follows that the promotion of gender equality in the workplace is a subset of, but linked to, gender equality in society; we can go one step further to suggest that gender equality in the workplace is a key policy objective to promote gender equality overall. In our efforts to achieve a ‘work-life balance’, promoting equality while eliminating inequality necessarily involves support for change for both men and women. From the perspective of equality objective indicators with respect to the workplace include:
workforce participation rates for men and women;
part-time work, un- and under-employment rates;
gender pay gaps and barriers to career progression;
occupational segregation; and
assumptions and practices around caring roles for children and ageing elders.
Participation rates for women with dependent children have increased over time, while participation rates for men with dependent children haven’t changed much. Cultural and social attitudes likely play a role but policy has a role to play in workplace and gender equality. Lower workforce participation rates for women with dependent children can largely be explained by:
unbalanced design of work-life policies based on gender;
the interplay between earnings, income tax and the childcare subsidy;
availability and affordability of suitable childcare;
career disruption and change in work patterns following pregnancy; and
a higher share of unpaid household work and caring roles. In our brief review of the gender pay gap in Australia we find that it is more pronounced for women in mature age groups, which can be partly attributed to the “motherhood penalty”. Contributing factors include the predominance of part-time work, gender discrimination, career disruption, industrial and occupational segregation, imbalance in the share of unpaid work and other behavioural factors. Recent estimates show that Australia’s GDP could increase by $60 billion in the next 20 years (between December 2018 to December 2038) and Australia’s living standards (household consumption) can be raised by $140 billion through increasing female participation in the workforce (KPMG, 2018). It would be unwise to disregard the knowledge, experience and productivity of women who form such a large segment of the workforce. There are economic and social implications inherent in this for women (e.g. lower pay, less financial empowerment, lower superannuation balance) and for government in the short run (e.g. lower tax revenue) and the long-run (e.g. demand on pensions and allowances). The European Commission neatly summarises the linear path of inequality that has an individual/personal dimension and a much broader societal dimension as the ‘gender employment gap … leading to the gender pay gap … leading to the gender pension/superannuation gap’. This description suggests the Australian public policy with respect to children and families, childcare, responsibilities for aged care, parenting leave and employment and workforce participation requires a radical re-think. Currently the design of public policy is compartmentalised and haphazard. Both major political parties have used the term “working families” to shore-up their constituency and it is “working families” that need farsighted policies to reconcile employment and family responsibilities. In thinking about the family unit (that is not homogenous) parental leave, support for children, the sharing of responsibilities and return to employment apply equally to men as they do to women. Gendered division thinking is too often the unstated assumption underlying public policy design.

Economic Issues
Page viii The SA Centre for Economic Studies, University of Adelaide
We reiterate that the ‘end objective’ of society, workplaces and government should be to achieve ‘work-life balance’ for individuals and families. ‘Facilitating and supporting’ women return to the workforce and offering ‘flexibility and incentives’ to men so that they have the option to spend more time with their children are equal policy objectives to achieve a ‘work-life balance’.

COVID-19: An Opportunity to Reset Policy Levers for Better Gender Equality in Economy and Society
The SA Centre for Economic Studies, University of Adelaide Page 1
1. Introduction
In this paper we analyse key issues and potential barriers impacting women’s career progression in Australia and ask:
why it is important to increase female’s participation in the paid workforce?;
how increasing full-time participation of women can contribute to the three Ps of economic growth/ prosperity i.e. population, participation and productivity as well as the general wellbeing of Australians?;
consider how education, employment, occupational outcomes and gender inequality issues impact women’s earnings both now and in the future?;
is gender inequality only a workplace issue?; and
can promoting gender equality enrich women financially and men socially?
The backdrop to any review or understanding of trends in the Australian population is that the general population is ageing, fertility rates continue to be at a low level and overseas migration is a significant component of population growth. In a post-COVID-19 environment migration to Australia will be significantly curtailed. We commence our discussion with an examination of women’s increased participation in the workforce as one of the driving forces behind economic growth. We conclude with a general discussion of policy options to increase women’s participation in the workforce. It should be noted that detailed modelling of the economic impact of increasing female participation at the national and state level is beyond the scope of this paper. The primary objective of this paper is to consider policies that lead to an increase in workforce participation.
2. Women and the Three Ps of Economic Growth
Population, participation and productivity are the three key drivers of economic growth/prosperity. A steady improvement in these areas – and we ask to what extent can increasing the full-time participation of women in the workforce contribute to each of these – will ensure that a nation continues on its path to prosperity. A related and important issue is equality in the workforce, and we cite research that equality in the workforce is a contributor to economic growth.
2.1 Population
Australia’s population is projected to increase from 25 million in 2017 to between 37 and 49 million by 2066 under the various scenarios examined in the latest ABS population projections. According to the latest ABS population projections, if recent trends in birth rates (currently 1.8 births per female), life expectancy and net overseas migration1 continue into the future – the so-called scenario B assumptions, then Australia’s population will reach 42.6 million in 2066, growing at an average annual growth rate of 1.1 per cent. This is a respectable rate of population growth. However, the age structure of the population is expected to change. Our analysis of ABS data indicates that between 2017 and 2066 there will be fewer children to refresh the population and fewer income earners will be responsible for taking care of a higher proportion of aged population. This remains true even under the ABS assumptions of a high birth rate of 1.95 births per female and high net overseas migration (Scenario A) and lower fertility rates of 1.65 births per female and lower net overseas migration (Scenario C). Under an extreme scenario where fertility rates and life expectancy follow the current trend (Scenario B) but net overseas migration is zero i.e. Australia relies solely on natural increase, then Australia’s population is projected to decline from 2040 onwards to 25 million in 2066. At the time of writing, this may be a more plausible scenario in a COVID-19 environment than previously anticipated. The Productivity Commission (2016) confirmed that between 2002 and 2005 natural increase contributed more than half the total population growth in Australia in comparison to net overseas migration. However, this trend has reversed since 2006. This is consistent with the early period of John Howard’s Prime Ministership which was characterised by a period of low migration. However, the latter years of the Howard government saw an increase in net overseas migration due to the importance of points tested skilled stream visas, while employer-sponsored permanent visas also contributed significantly to net overseas migration. According to ABS Demographic Statistics, in the year ended 30 June 2018, net overseas migration contributed 61 per cent to total population growth whereas natural increase contributed 39 per cent.

Economic Issues
Page 2 The SA Centre for Economic Studies, University of Adelaide
The Baby Bonus provided evidence that fertility rates are responsive to policy influences. After the Australian fertility rate fell to a low of 1.7 in 2001 the Baby Bonus scheme was introduced by Treasurer Costello in 2002 to simulate population growth via natural increase. Subsequently, the fertility rate in Australia increased and reached a record 2.0 births per female in 2007 and remained at that level till 2010. The following year saw a record number of babies being born. However, fertility rates started declining after 2011, and fell further after dissolution of the scheme in 2014 to its current low level of 1.7 in 2017 (ABS, Births). The Baby Bonus was successful in increasing the birth rate. Australia could solely rely on net overseas migration for population growth but it may be desirable to facilitate some growth through natural increase, in order to mitigate population ageing. Australia needs a policy which encompasses migration rates and fertility rates. That said, if Australia wants to rely on population growth as a driver of economic growth/prosperity then Australia needs policies that enable women to have children without having to trade-off their employment opportunities, i.e. policies that support their dual role of parenthood and work – both for mothers and fathers. It becomes even more necessary under the current circumstances when not only Australian economy but Australia’s demographic composition is also suffering due to stalling migration inflicted by COVID-19. According to ANU demographer Dr Liz Allen the pandemic could lead to lower birth rates. Retail sales data for home pregnancy kits are already indicating that women are being more cautious to avoid pregnancy. Postponing certain IVF treatments are also contributing towards lower birth rates (Allen 2020). In a situation of economic doldrums when people are either undergoing pay cuts or losing jobs it is evident that women will delay having children or alter their desired family size. This can be disastrous for generations to come. If Australia’s birth rate (which is already low) drops to 1.5 or below which is considered well below the replacement level then there will be more people who would need to be cared for but less people to work towards a tax base for adequate delivery of services (Allen 2020).
2.2 Participation
We note that ABS projections shows that a smaller proportion of the working age population will be available to work over the period ending 2066 which has potential implications for economic growth. It follows that a suite of policy options will need to be explored to maintain and increase the participation rate of those who currently have relatively low participation rates at this time. Participation rates are declining for both men and women. Hence in a post-pandemic world government stimulus is needed in both male dominated sectors such as construction and mining as well as female dominated sectors such as education and health and social services sector to create jobs for both men and women alike. Global estimates highlight the importance of women’s labour force participation. Modelling shows that under the most negative scenario, in which women experience disproportionate unemployment during COVID-19 and no action is taken to account for this, global GDP would be $1 trillion (USD) lower in 2030 than if COVID-19 had the same effect on men’s and women’s employment. However, by taking action on gender equality now and throughout the next decade, global GDP estimates at 2030 are $13 trillion above the most negative scenario. The Australian Government has used various policy levers to bring about increased workforce participation among older cohorts especially in terms of the age pension and superannuation. For example:
eligibility for the Age Pension was increased from 65 to 67 years from 2017 onwards;
a proposed increase to 70 years to take effect between 2025 and 2035 by the Abbott government is currently being debated for fairness by the Morrison government;
the superannuation preservation age will gradually increase from 55 to 60 years from 2015 to 2024; and
the age at which superannuation benefits can generally be accessed tax free was fixed at 60 years. These policies can influence an individual’s decision to retire, potentially impacting the participation rate of older Australians for longer. There are benefits to the individual and the economy from the knowledge and experience accumulated by older Australians over their working life. However, increasing participation from older Australians is not a sustainable option for economic growth in the long run. In the same vein the 2015 Intergenerational Report was clear in support for “boosting opportunities for women to reap the economic benefits of increased participation by women”. The report points out that even though the overall proportion of working age population is projected to decline over time, female employment is projected to continue to increase. It points out that Australia’s female participation rates are lower than Canada and New Zealand and argues that there is further opportunity to encourage women to enter and stay in the workforce. The report recommends that policies that help boost female participation will help Australia achieve an even higher level of future prosperity2.

COVID-19: An Opportunity to Reset Policy Levers for Better Gender Equality in Economy and Society
The SA Centre for Economic Studies, University of Adelaide Page 3
Government policies will have a role to play. Childcare subsidies are one example, a subsidy to support and encourage women with young children to return and/or stay in the workforce. Affordability and accessibility of childcare is an ongoing issue for parents with young children who are currently in the work force and who wish to be in the workforce. The ABS Consumer Price Index (CPI) shows that childcare costs (out of pocket expenses only) have been increasing well in advance of overall inflation over an extended period. The eight capitals CPI indicates that prices for childcare grew at an annual average rate of 5.8 per cent over the decade to 2018/19 whereas the overall CPI rose at an average rate of 2.1 per cent over this period (ABS, 2019). Productivity Commission (2015) estimated that if childcare-related barriers were removed for the number of parents (working part time or not working) who reported having difficulties with the affordability and accessibility of suitable childcare, then 165,000 FTE workers could have been added to the labour supply in July 2014. The Commission explains that, “these ‘additional’ workers are predominantly made up of mothers who are marginally attached to the labour force. That is, they are not currently working or actively looking for work but would like to enter the workforce if suitable childcare became available”. There is general agreement that access to childcare and cost thereof does impact a woman’s decision to engage in the work force at the early years of a child or even during the primary school years. It might be expected that the participation gap would disappear once the children are in high school. However, the evidence points to the persistence of the participation gap. Analysis of the new Childcare Subsidy3 (CCS) which came into effect on 1 July 2018 shows that secondary income earners, who are mostly mothers face a high effective marginal tax rate for increasing their workdays from part-time to full-time. And this effective marginal tax rate is higher than that faced by high earning full-time workers. Hence, families as a unit decide that it is not rational for the secondary income earner, who in most cases are mothers to work full-time while the family has to bear the cost of formal childcare (Stewart, 2018). In the post pandemic world when family units are undergoing job losses and pay cuts, childcare becomes even dearer and hence families may choose to opt out of childcare and in most cases women will undertake the caring responsibilities. On the other hand childcare is a service which is essential such as individuals can explore job opportunities. A recent report by Grattan Institute shows that the more government spends on childcare subsidy higher is women’s participation in the workforce and so is the economic impact in terms of GDP (Wood, Griffiths and Emslie, 2020). Women have the right to return to the same occupation after maternity leave (Fair Work Act 2009). This Act presses for retention in the workforce and outlaws discrimination against mothers who wish to return to work after the birth of a child. Yet according to the Australian Human Rights Commission (2014) one in two mothers reported experiencing workplace discrimination as a result of pregnancy, parental leave or on return to work and one in five mothers indicated they were being made redundant, dismissed, their position restructured or experienced non-renewal of contract.
Minimising childcare related barriers and reducing workplace discrimination will help to increase women’s participation in the workforce.
2.3 Productivity
Productivity is the third lever of economic growth. Higher productivity means working efficiently so that more goods and services can be produced using the same amount of resources. The economic reforms of the 1980s and 1990s led to higher productivity growth in Australia which in turn contributed to growth in incomes and higher living standards. The 2015 Intergenerational Report states that, “For every hour average Australians work today, they produce twice as many goods and services as they did in the early 1970s. It is no coincidence that average income per person has also broadly doubled in this period.” However, the report estimates that average annual productivity growth will be 1.5 per cent per year for the next 40 years, which is substantially lower than the higher productivity growth of 2.2 per cent observed in the 1990s. The report acknowledges recent advancements in technologies and suggests that both quality of life and productivity can be improved if technology is harnessed appropriately and proper reforms are undertaken. Harnessing technology for economic growth and boosting women’s participation in the workforce offer two pathways to sustained economic growth and if appropriately implemented, will provide a boost to living standards (economic objective) and quality of life (social objective).

Economic Issues
Page 4 The SA Centre for Economic Studies, University of Adelaide
That said, it is worthwhile to look at the future skill composition that will be demanded of the workforce as a driver of productivity in Australia. A key driver of productivity improvements in Australia’s economy will come from high-level skills (innovation, technology) which requires investment in the knowledge/technical capabilities of people/human capital, but also will heighten demand for the people-oriented skills needed to complement these technical skills (e.g. change management, entrepreneurship). This means less demand for traditional male domains (e.g. manual labour) and more demand for skills that are knowledge and people based that may favour women in the workforce. Furthermore, to support Australia’s changing age structure, we need sustained investment in human services (health, aged care, childcare, education/training) – industries that are predominantly delivered by the female workforce - hence female workforce participation is critical to support Australia’s ongoing productivity. During the pandemic we have harnessed technology at a rapid rate. We have set up remote work spaces at our homes, cut back on commuting times and established a new work from home culture which was perhaps not so widely practiced before the pandemic. Even though these are early days, work from home has been found to increase productivity (Dockery and Bawa 2020).
Policies that promote women’s participation will help Australia achieve higher prosperity in future.
3. Women and GDP- A Macroeconomic Perspective
“Closing the gap between male and female employment would have huge economic implications for the global economy, boosting US GDP by as much as 9 per cent, Eurozone GDP by 13 per cent and Japanese GDP by 16 per cent ... Encouraging more women into the labour force has been the single biggest driver of Eurozone’s labour market success, much more so than conventional labour market reforms. The US and Japan, while starting from very different positions, have both made little progress in narrowing the gap between male and female employment in the past 10 years.” – Goldman Sachs (2007)
The significance of women’s labour force participation and utilisation is not limited to the impact on individual and household incomes and future earnings potential. Access Economics (2006) analysed the 2002 Intergenerational Report and showed that changes in the percentage of women in the workforce has implications for Australia’s output and productivity. Both will significantly affect Australia’s capacity to meet the challenges of an ageing population. Access Economics (2006) estimated the potential gains to the Australian economy from an increase in women’s workforce participation. The report considered four different scenarios and forecast estimates on employment and real output for 2041-42. The report found that female participation rates have increased from that reported in the 2002 Intergenerational Report. In particular, while younger women were spending more time in education, older women were preferring to work longer rather than retiring early. In addition, the report also found an increase in workforce participation of teenagers. Hence the baseline was adjusted to reflect these changes which happened since those forecasted in the 2002 Intergenerational Report. Under the baseline scenario, the total workforce was predicted to be 13.4 million and real output to be $2,226 billion in 2041/42 (2005-06 dollars). In each of the cases estimated below participation of men do not change from the baseline scenario. They estimated that:
if female participation increase such that the gender gap between male and female participation rates are halved then 2.9 per cent higher output or additional $65 billion will be generated in the economy compared to the baseline;
if female participation increase such that the gender gap in participation rates is halved as before, but part-time participation rates remain unchanged so that all changes occur in full-time participation for women, then additional output of $98 billion will be generated in the economy. Under both scenarios the Australian workforce will increase by 3.5 per cent compared to the baseline scenario;
if part-time participation increases while full-time participation remains unchanged then output will decrease by 1.9 per cent or $43 billion. The Australian workforce will shrink by 1.6 per cent compared to the baseline scenario; and

COVID-19: An Opportunity to Reset Policy Levers for Better Gender Equality in Economy and Society
The SA Centre for Economic Studies, University of Adelaide Page 5
if female participation rates remain constant instead of rising then the economy will suffer a loss in output by 2.8 per cent or $62 billion. The Australian workforce will shrink by 3.2 per cent compared to the baseline scenario.
Thus, narrowing the gender gap in the participation rates of women and boosting full time employment of women can lead to an increase in national income. The report noted that more women than men are year 12 graduates and obtain tertiary education. If a country fails to utilise its valuable human capital it is essentially losing out on potential productivity gains. This issue will be discussed later in this report. International studies by the World Bank, United Nations and Goldman Sachs have found significant statistical correlation between gender equality and the level of development of countries. According to Daly (2007), reducing gender inequality could play a key role in addressing the twin problems of population ageing and pension sustainability. Birth rates and female employment both tend to be higher in countries where it is relatively easy for women to work and have children. This presents a challenge for economies such as Japan and Italy, which are characterised by population ageing and low female employment levels. In rapidly aging economies, higher female labour force participation can boost growth and mitigate the impact of a shrinking workforce. For example, in Japan, annual potential growth could rise by about one-quarter of a percentage point if female labour force participation were to reach the average for the Group of Seven advanced economies, resulting in a 4 per cent permanent rise in GDP per capita compared with the baseline scenario (IMF 2012). Aguirre et al (2012) estimated that increasing the female labour force participation rate to equal those of men would boost GDP by 5 per cent in the United States, 9 per cent in Japan, 12 per cent in the United Arab Emirates, and 34 per cent in Egypt. Grattan Institute estimated that in 2012 if Australia could boost female workforce participation to the level of Canada (which at that time had six per cent higher women in the workforce) then Australia’s GDP would be $25 billion higher. In a recent report, advocating for cheaper childcare, Grattan Institute estimated that under various proposed childcare subsidy schemes costing between $5 billion to $12 billion, women’s participation would increase by 13 per cent (hours) to 27 per cent (hours) with an increase in GDP ranging from $11 billion to $27 billion. The more government spends towards boosting women’s participation in the workforce, higher is the economic impact of such policies (Wood, Griffiths and Emslie 2020). KPMG (2018) modelling suggests that if the gap between Australia’s male and female workforce participation rates could be halved then Australia’s annual GDP would be $60 billion greater in 20 years’ time (from December 2018 to December 2038). Estimates by McKinsey Global Institute (2015) shows that in a full-potential scenario in which women play an identical role in labour markets as men, as much as $28 trillion, or 26 per cent, could be added to global annual GDP in 2025. If all countries were to match the progress toward gender parity of the best performer in their region, it could produce a boost to annual global GDP of as much as $12 trillion in 2025. This $12 trillion of incremental GDP represents a doubling of the output likely to be contributed by female workers globally between 2014 and 2025 in a business-as-usual scenario. If female participation in Australia matched the best in region there would be a 12 per cent increase in GDP by 2025 or $225 billion (MGI, 2018). While the results from economic modelling and the time period over which the benefits would occur, the benefits from increasing women’s participation rate all point in the same direction so it is of practical significance to explore option for increasing the participation of female in the workforce if Australia hopes to continue on the path of uninterrupted economic growth and enjoy high living standards.

Economic Issues
Page 6 The SA Centre for Economic Studies, University of Adelaide
4. Labour Force Characteristics For Women
Identifying patterns in female labour market participation can be useful in identifying gaps where female participation can be encouraged or working conditions can be improved. Table 4.1 Labour force (15-64 years) characteristics by status and gender, 2018
Persons Male Female
Total civilian population (000) 16,325 8,104 8,221
Labour force total (000) 12,738 6,717 6,021
Not in labour force (000) 3,587 1,387 2,200
Total employed (000) 12,044 6,351 5,692
Full time employed (000) 8,350 5,254 3,096
Part time employed (000) 3,694 1,098 2,597
Participation rate (per cent) 78.0 82.9 73.2
Employment to population ratio (per cent) 73.8 78.4 69.2
Unemployment rate (per cent) 5.5 5.5 5.5
Unemployment rate looked for full-time work (per cent) 5.5 5.0 6.2
Unemployment rate looked for only part-time work (per cent) 5.4 7.4 4.6
Underemployment rate (per cent) 14.3 14.1 14.6
Underemployment rate full time (prefer more hours) (per cent) 4.8 6.7 2.7
Underemployment rate part time (prefer more hours) (per cent) 8.2 5.9 10.6
Underutilization rate (per cent) 19.8 19.5 20.1
Source: ABS (2018), Labour Force Australia, December. Cat. No. 6202.0.
ABS labour market data shows that in 2018, the total labour force in Australia consisted of 6,717,000 men (53 per cent) and 6,021,000 women (47 per cent). A moderately larger proportion of men (78 per cent) than women (69 per cent) were employed – Table 4.1. Among those who were employed:
8,350,000 persons (69 per cent) were working full time and 3,694,000 persons (31 per cent) part-time;
among those who were working full-time, 5,254,000 (63 per cent) were men and 3,096,000 (37 per cent) were women; and
among those who were working part-time, 1,098,000 (30 per cent) were men and 2,597,000 (70 per cent) were women.
4.1 Participation rate
Female participation rates for the working group aged 15 to 64 years have increased since 1990 by 11.4 percentage points to 73.2 per cent in 2018. Over the same period male participation rates have decreased by 2.1 percentage points to 82.9 per cent. The gender participation rate gap has narrowed from 23.2 per cent in 1990 to 9.6 per cent in 2018 – Figure 4.1. The participation rate gap is narrowing with scope to improve still further. It should be noted that while participation rates for men have been declining in part due to the decline in manufacturing employment, the development of labour saving technology, global trade in goods and national events (i.e. financial crisis and ebbing of the mining boom), the participation rate for women has continued to increase over time. A narrowing gender participation gap is the result of:
more women joining the labour force as a result of government policies on childcare, parental leave, flexible work arrangements etc.;
more women are delaying having children or opting out of having children to join the labour force as indicated by declining fertility rates;
female’s higher educational qualifications over time;
broader societal change (e.g. erosion of the ‘male breadwinner’ status); and
structural changes in the labour market (e.g. shift from manufacturing to services).

COVID-19: An Opportunity to Reset Policy Levers for Better Gender Equality in Economy and Society
The SA Centre for Economic Studies, University of Adelaide Page 7
Figure 4.1 Participation rate by gender, Australia, 1990 to 2018
Note: Rates and ratios have been calculated as an annual average of the original series Source: ABS (2018), Labour Force Australia, December, Cat. No. 6202.0.
ABS Gender Indicators shows that participation rates for women with preschool and primary school aged children have increased over the ten years to 2017/18 while participation rates for men with dependent children haven’t changed much – Table 4.2. Even though participation rates for women have increased in the past ten years a gender gap in participation still exists and the pace of change has been slow. This indicates that policies that were aimed at retaining women in the workforce or increasing women’s workforce participation have been effective but there has been limited success with respect to economic and social supports to facilitate gender flexibility for men in combining work and family responsibilities. A recent article by Crabb (2019) highlights the following as an explanation for this anomaly:
fathers think that workplaces have gendered viewpoints about flexibility, part-time work and taking time off to care for children;
men think that if they do not use flexible workplace arrangements then they would be viewed as a diligent worker;
in cases where men were doing more caring work than the average Australian male they viewed themselves as exceptions or outliers as opposed to social norms and they thought that they could use the flexible work as a privilege owing to their seniority in the organisation or having a good rapport with their boss and not because the rules are in place;
men seem to attach more to their significance in work and the need to provide for their families in comparison to caring responsibilities; and
more men would like to increase their involvement in caring for children and housework. Even though the Australian society is changing, many workplaces still run on an age-old 9 to 5 model where men are expected to be omnipresent. Even though society’s needs are changing, workplaces often fail to accommodate for expensive childcare costs, school hours and numerous school engagement. And as if by an unspoken rule women are expected to take care of all these discrepancies in time and adapt once they have a family. Crabb (2019) states that it is normal for a female to be asking for flexibility, work-part time and earn-less but not for men. Table 4.2 shows that while participation rates for women increase when children reach school age, unemployment does not change much, but underemployment rises moderately.
0.0
10.0
20.0
30.0
40.0
50.0
60.0
70.0
80.0
90.0
100.0
199
0
199
1
199
2
199
3
199
4
199
5
199
6
199
7
199
8
199
9
200
0
200
1
200
2
200
3
200
4
200
5
200
6
200
7
200
8
200
9
201
0
201
1
201
2
201
3
201
4
201
5
201
6
201
7
201
8
Pe
r ce
nt
Male Female Participation gap

Economic Issues
Page 8 The SA Centre for Economic Studies, University of Adelaide
Table 4.2 Labour force statistics for men and women with dependent children, 2007/08 and 2017/18
2007-08 2017-18
Male Female Male Female
Age of youngest child Age of youngest child
0-5 years 6-14 years 0-5 years 6-14 years 0-5 years 6-14 years 0-5 years 6-14years
Participation rate 94.5 92.8 54.2 77.5 93.9 92.9 62.4 80.4
Employment to population ratio 92.2 90.9 51.5 73.7 91.6 90.3 59.2 76.2
Proportion not in labour force 5.5 7.3 45.8 22.5 6.1 7.1 37.6 19.6
Proportion employed part time 7.0 7.4 66.5 55.1 7.9 8.8 61.4 50.0
Unemployment rate 2.4 2.0 5.0 4.9 2.4 2.8 5.2 5.3
Underemployment rate 3.1 3.0 7.8 10.0 3.7 4.0 8.7 10.6
Underutilisation rate 5.5 5.1 12.9 15.3 6.2 6.9 13.9 15.9
Source: ABS (2018), Gender Indicators Australia, September, Cat. No. 4125.0.
4.2 Unemployment and underemployment rates
Figure 4.2 shows that underemployment rates are consistently higher than unemployment rates for women with dependent children. Reducing underemployment rates among women with dependent children would require both social and cultural change. Figure 4.2 Unemployment and underemployment rate for women by age of dependent children
Source: ABS (2018), Gender Indicators Australia, September, Cat. No. 4125.0.
According to Stewart (2017) Australia has “entered an equilibrium in which women who have children work part time, producing a family model of 1.5 earners.” In 2017-18:
61 per cent of women with preschool aged children worked part time compared to 7.9 per cent of men; and
50 per cent of women with primary school age children worked part time compared to 8.8 per cent of men.
The 5.5 per cent unemployment rate was the same for men and women in the labour force aged 15 to 64 years in 2018 – Table 4.1. However, the unemployment rate for women looking for full-time work is higher than men, in contrast, the unemployment rate for women looking for part-time work is lower than men. This indicates the barriers faced by women in full-time employment and those faced by men in part-time employment. In contrast to the unemployment rate, the national underemployment rate was 14.3 per cent in 2018 for those aged 15 to 64 years – Table 4.1. Overall the underemployment rate is higher for women and the underemployment rate among female who work part time is higher than underemployment rate for men who
2
4
6
8
10
12
14
2007-08 2008-09 2009-10 2010-11 2011-12 2012-13 2013-14 2014-15 2015-16 2016-17 2017-18
Pe
r ce
nt
Females Unemployment rate Females Underemployment rate
0 to 5 Unemployment rate 0 to 5 Underemployment rate
6 to 14 Unemployment rate 6 to 14 Underemployment rate
COVID-19: An Opportunity to Reset Policy Levers for Better Gender Equality in Economy and Society
The SA Centre for Economic Studies, University of Adelaide Page 9
work part time. This indicates that women who work part time would like to work more hours but are unable to do so either due to financial reasons or social norms.
5. Education, Industry and Occupation
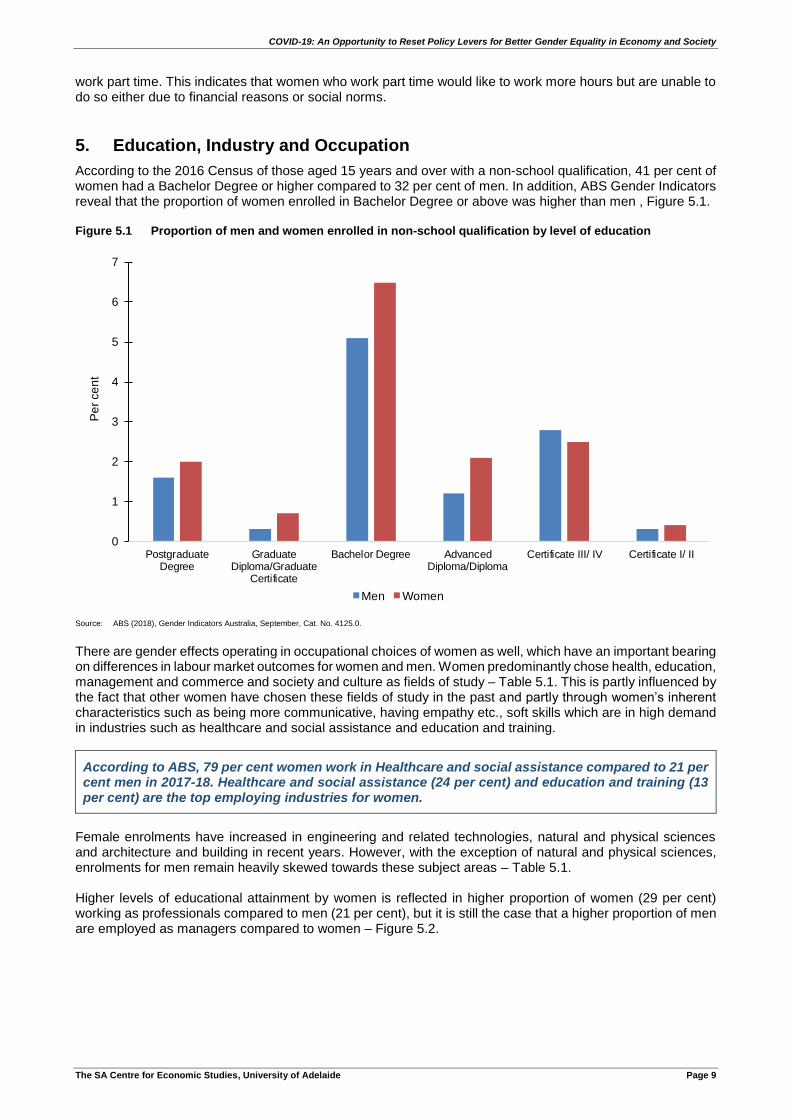
According to the 2016 Census of those aged 15 years and over with a non-school qualification, 41 per cent of women had a Bachelor Degree or higher compared to 32 per cent of men. In addition, ABS Gender Indicators reveal that the proportion of women enrolled in Bachelor Degree or above was higher than men , Figure 5.1. Figure 5.1 Proportion of men and women enrolled in non-school qualification by level of education
Source: ABS (2018), Gender Indicators Australia, September, Cat. No. 4125.0.
There are gender effects operating in occupational choices of women as well, which have an important bearing on differences in labour market outcomes for women and men. Women predominantly chose health, education, management and commerce and society and culture as fields of study – Table 5.1. This is partly influenced by the fact that other women have chosen these fields of study in the past and partly through women’s inherent characteristics such as being more communicative, having empathy etc., soft skills which are in high demand in industries such as healthcare and social assistance and education and training.
According to ABS, 79 per cent women work in Healthcare and social assistance compared to 21 per cent men in 2017-18. Healthcare and social assistance (24 per cent) and education and training (13 per cent) are the top employing industries for women.
Female enrolments have increased in engineering and related technologies, natural and physical sciences and architecture and building in recent years. However, with the exception of natural and physical sciences, enrolments for men remain heavily skewed towards these subject areas – Table 5.1. Higher levels of educational attainment by women is reflected in higher proportion of women (29 per cent) working as professionals compared to men (21 per cent), but it is still the case that a higher proportion of men are employed as managers compared to women – Figure 5.2.
0
1
2
3
4
5
6
7
PostgraduateDegree
GraduateDiploma/Graduate
Certificate
Bachelor Degree AdvancedDiploma/Diploma
Certificate III/ IV Certificate I/ II
Pe
r ce
nt
Men Women

Economic Issues
Page 10 The SA Centre for Economic Studies, University of Adelaide
Table 5.1 Field of study of enrolment for 15-64 year olds, per cent
Men Women
2007 2017 2007 2017
Natural and physical sciences 4.3 4.8 3.9 4.2
Information technology 5.9 6.3 1.9 0.8
Engineering and related technologies 21.9 18.8 1.6 2.4
Architecture and building 9.1 8.7 1.5 1.8
Agriculture, environmental and related sciences 2.7 1.7 1.7 1.6
Health 6.5 9.5 15.5 19.6
Education 3.9 3.4 10 10.6
Management and commerce 23.9 23.9 26.3 22
Society and culture 12.7 13.7 23.1 25.9
Creative arts 4.4 4.8 7.3 5.2
Food, hospitality and personal services 3.4 2.2 4.9 3.6
Source: ABS (2018), Gender Indicators Australia, September, Cat. No. 4125.0.
Figure 5.2 Occupation by gender, 2017-18, per cent
Source: ABS (2018), Gender Indicators Australia, September, Cat. No. 4125.0.
6. Gender Pay Gap
If there was no shortcoming in Australia’s Industrial Relations system we would expect to see equal pay rates for men and women at the start of their careers. On the contrary, ABS Gender Indicators indicates that median undergraduate salary for women in their first full-time occupation is $59,000 whereas for men it is $60,100 – Figure 6.1. This gap while relatively small cannot be explained by structural differences in choice of industry – the gender pay gap exists for women in all streams of employment related to study with the exception of engineering where women earn $1,500 more than men at the start of their career4. Small differences exist in medicine, nursing, rehabilitation and social work. The largest pay gap for women exists in dentistry where men earn $19,500 more compared to women. The pay gap for women is lowest in social work where women earn $700 less than men. Communications is the only area apart from engineering where there is no gender pay gap. This is most likely a legacy of history, a hangover from the days of the ‘male breadwinners’. The concept of male breadwinner model was ingrained in Australian society when Justice Higgins set higher wages for men based on the notion that men need to provide for their wife and children whereas women’s wages can be lower since they have to provide only for themselves and not the whole family. Wages for men and women were set equal only for those jobs where women directly competed with men for fear of women throwing men out of job if their wages were set at a lower rate. This institutional establishment of idea of male breadwinner eventually got instilled into social norms, where it is expected that men will bear the burden of being the primary income earners and women will do most of the domestic work and undertake part-time work.
0 5 10 15 20 25 30
Managers
Professionals
Technicians and trades workers
Community and personal service workers
Clerical and administrative workers
Sales workers
Machinery operators and drivers
Labourers
Per cent
Women Men

COVID-19: An Opportunity to Reset Policy Levers for Better Gender Equality in Economy and Society
The SA Centre for Economic Studies, University of Adelaide Page 11
According to KPMG (2019) rising gender discrimination is the single biggest factor which leads to gender pay gap in Australia. They found that “stubborn gender stereotypes” negatively impact a women’s career especially if women undertake caring roles. There is an important lesson to be learned here. Social norms can be influenced by policy. Risse (2019b) points out how today’s Fair Work Commission has inherited the legacy of its past decisions. In particular, Fair Work Act was built on the premises of “equal pay for work of equal value”, with a single rate for a job, regardless of gender. However, measuring “work of equal value” poses a challenge even today since men and women gravitate towards work that varies widely in nature. Figure 6.1 Gender pay gap for undergraduates in their first full-time employment by study area, all ages, 2017
Source: ABS (2018), Gender Indicators Australia, September, Cat. No. 4125.0.
The ABS Average Weekly Earnings reveals that, full-time adult ordinary time earnings for men is $1,695 per week whereas for women it is $1,455. Some caution needs to be exercised when comparing gender differences in incomes when using average weekly earnings since differences may reflect compositional variations, including differences in occupations, industries and experience levels. Nonetheless, ABS data shows that the gender pay gap has been narrowing over time. The gender pay gap5 has decreased from 17.6 per cent in November 2012 to 14.1 per cent in November 2018. Figure 6.2 shows that the gender pay gap is least pronounced (14.2 per cent) in the younger age groups aged 20 years and under (1.9 per cent) and 21 to 34 years (14.2 per cent), beyond which it becomes more pronounced. A widening in the pay gap with increases in age can be largely attributed to penalties women experience as a consequence of bearing children in terms of subsequent impacts on labour force participation, occupation, hours of work and promotion (for example see Kleven et al 2018). A subsequent study of male’s and female’s earnings in six countries (Austria, Germany, Sweden, Denmark, the US and the UK) shows that men and women’s earnings follow a similar pattern before parenthood (Kleven et al 2019). However, after the birth of the first child women experience a massive drop in their earnings while male earnings remain unaffected. Differences remained and “plateaued” even ten years after child birth. Analysis shows that Scandinavian countries have the smallest long-run child penalties followed by English- speaking countries. German-speaking countries recorded the highest penalties. Child penalties or penalty for parenthood can originate from lower female employment hence reduction in labour supply, number of hours worked and wage rate. Kleven et al (2019) found that parental leave and childcare policies could not explain the magnitude of these penalties. On the contrary, they found that gender norms have an important role to play in determining child penalties.
-5.0
0.0
5.0
10.0
15.0
20.0
25.0
Sc
ien
ce
an
d M
ath
em
atics
Co
mp
uting
and
In
form
atio
n S
yste
ms
En
gin
ee
rin
g
Arc
hite
ctu
re a
nd
bu
ilt e
nvi
ron
me
nt
Agri
cultu
ral a
nd
en
viron
me
nta
l st
udie
s
He
alth
se
rvic
es a
nd
su
pp
ort
Me
dic
ine
Nu
rsin
g
Ph
arm
acy
De
ntist
ry
Re
ha
bili
tatio
n
Te
ac
he
r e
du
ca
tio
n
Bu
sin
ess
an
d m
an
ag
em
en
t
Hu
ma
nit
ies
, c
ultu
re a
nd
so
cia
l s
cie
nc
e
So
cia
l w
ork
Ps
ych
olo
gy
La
w a
nd
pa
rale
ga
l s
tud
ies
Cre
ative
art
s
Co
mm
un
ica
tion
s
To
urism
, h
osp
ita
lity,
pers
ona
l se
rvic
es,
sp
ort
an
d r
ecr
ea
tio
n
Me
dia
n s
tart
ing
sa
lary
(a
ll s
tud
y a
rea
s)
Per
cent

Economic Issues
Page 12 The SA Centre for Economic Studies, University of Adelaide
Figure 6.2 Average weekly full-time earnings and gender pay gap by age, May 2018
Source: ABS (2019), Employee Earnings and Hours, Australia, May, Cat. No. 6306.0.
Currently, the gender pay gap in Australia is - 14.1 per cent with women earning $239.8 less than men per week in full time positions. A gender gap of - 25.8 per cent exists in healthcare and social assistance industry - the largest employer of women in Australia. Gender gap is lowest in public administration and safety (5.1 per cent) and highest in financial and insurance services (26.9 per cent). Census data shows that 50 per cent of women in Australia do not earn more than minimum wages.
According to the Grattan Institute (2018),
“the gender pay gap is narrowing as women’s workforce participation rate increases over time and they spend more time in the workforce, they gain more experience and earn higher pay, which further encourages them to work … Progress is slow, but as successive cohorts of young graduates have careers that are less disrupted by motherhood, the gender earnings gap will continue to decline”.
In terms of the disruptive effect of motherhood on workforce participation, research is growing that shows that it’s not just about women taking a break from the workforce, it’s also about the way in which this “career break” is disfavourably viewed by workplaces/employers in unconscious ways, e.g. when women take longer maternity leave, they are viewed by the colleagues as being “less agentic/career-oriented”, which then makes them less likely to be considered for future promotions. However if men take parental leave, they are not subject to this change in perception (see Fuegen et al 2004, Burgess 2013 and Verniers and Vala 2018). Figure 6.3 shows that a gender pay gap exists across all industries irrespective of whether they are male or female dominated. For example, in terms of industries with high levels of female employment, the female to male rate ratios of mean full-time adult ordinary time average weekly earnings are 0.75 for healthcare and social assistance and 0.89 for education and training. In terms of occupations where a higher proportion of women are employed compared to men, the rate ratio for hourly ordinary time cash earnings is 0.86 for clerical and administrative support workers, 0.82 for community and personal service workers, 0.87 for sales workers and 0.86 for professionals. The rate ratios for these occupations falls further for weekly total cash earnings where difference in total hours worked between men and women has a direct impact on total earnings – see Table 6.1. A recent report by Financy Women’s Index found that the pandemic has widened the full-time employment gap between men and women in Australia. The report predicted that employment parity will not be reached for another 36 years, economic equality in terms of unpaid work for another 32 years, gender pay gap for 26 years, participation rate for 21 years and superannuation gap for another 18 years (Financy Women’s Index 2020).
0
2
4
6
8
10
12
14
16
18
20
20 years and under 21 to 34 years 35 to 44 years 45 to 54 years 55 years and over
Pe
r ce
nt

COVID-19: An Opportunity to Reset Policy Levers for Better Gender Equality in Economy and Society
The SA Centre for Economic Studies, University of Adelaide Page 13
Figure 6.3 Female to male rate ratio of mean full time adult ordinary time average weekly earnings, by Industry, May 2018
Note: Pink indicates industries where a higher proportion of women work. Source: ABS (2018), Gender Indicators Australia, September, Cat. No. 4125.0.
Table 6.1 Female to male rate ratio of adult ordinary time cash earnings and weekly total cash earnings by
occupation, 2016
Occupation Hourly ordinary time cash earnings Weekly total cash earnings
Managers 0.87 0.83
Professionals 0.86 0.75
Technicians and trades workers 0.78 0.60
Community and personal service workers 0.82 0.68
Clerical and administrative workers 0.86 0.78
Sales workers 0.87 0.73
Machinery operators and drivers 0.86 0.75
Labourers 0.85 0.62
Source: ABS (2018), Gender Indicators Australia, September, Cat. No. 4125.0.
Our analysis of ABS Census data shows that:
fewer men than women earn equal to or below minimum wage6 (36 vs 50 per cent);
more men than women earn greater than minimum wage and equal to average wage (18 vs 15 per cent);
more men than women earn greater than average wage and equal to average full-time wage (13 vs 9 per cent); and
more men than women earn wages which are higher than average full-time wage (16 vs 7 per cent) This type of proportional income distribution is important to take into account for policy considerations.
0.00 0.10 0.20 0.30 0.40 0.50 0.60 0.70 0.80 0.90 1.00
Mining
Manufacturing
Electricity, gas, water and waste services
Construction
Wholesale trade
Retail trade
Accommodation and food services
Transport, postal and warehousing
Information media and telecommunications
Financial and insurance services
Rental, hiring and real estate services
Professional, scientific and technical services
Administrative and support services
Public administration and safety
Education and training
Health care and social assistance
Arts and recreation services
Other services
Total (all industries)

Economic Issues
Page 14 The SA Centre for Economic Studies, University of Adelaide
Table 6.2 Proportion of men and women earning total weekly personal income at various levels, 2016 Census
Total weekly personal income (annual income)
Men Women
Aggregated wage range
Male (aggregated percentage)
Female (aggregate percentage) Persons Per cent Persons Per cent
Negative income 48,307 0.5 50,636 0.5 Negative income 0.5 0.5
Nil income 691,508 7.4 1,015,956 10.4 Zero income 7.4 10.4
$1-$149 ($1-$7,799) 308,775 3.3 492,602 5.1
$150-$299 ($7,800-$15,599) 560,165 6.0 783,960 8.1
$300-$399 ($15,600-$20,799) 686,216 7.4 933,311 9.6
$400-$499 ($20,800-$25,999) 598,523 6.4 955,580 9.8
$500-$649 ($26,000-$33,799) 555,893 6.0 869,438 8.9
$650-$799 ($33,800-$41,599) (Minimum wage range)
633,309 6.8 793,211 8.2 Greater than zero equal to minimum wage 35.9 49.6
$800-$999 ($41,600-$51,999) 797,881 8.6 756,945 7.8
$1,000-$1,249 ($52,000-$64,999) (Average wage in Australia)
876,605 9.4 711,907 7.3 Greater than minimum wage equal to average wage
18.0 15.1
$1,250-$1,499 ($65,000-$77,999) 621,260 6.7 468,474 4.8
$1,500-$1,749 ($78,000-$90,999) (Average full-time wage)
546,477 5.9 376,331 3.9 Greater than average wage and equal to average full-time wage
12.5 8.7
$1,750-$1,999 ($91,000-$103,999) 402,420 4.3 236,543 2.4
$2,000-$2,999 ($104,000-$155,999) 670,312 7.2 291,453 3.0
$3,000 or more ($156,000 or more) 448,427 4.8 148,101 1.5 Greater than average full-time wage 16.3 6.9
Notes: 1) Calculations exclude “not stated” and “not applicable” hence the percentages do not add up to a 100 per cent. Source: ABS (2016), Census of Population and Housing, Employment, Income and Education, Tablebuilder.

COVID-19: An Opportunity to Reset Policy Levers for Better Gender Equality in Economy and Society
The SA Centre for Economic Studies, University of Adelaide Page 15
A recent report found that gender discrimination, years off-work due to interruptions, industrial and occupational segregation are the major factors responsible for a pay gap. The following factors were identified as contributing to the current gender pay gap in Australia (KPMG, 2019):
gender discrimination (39 per cent);
years not working due to interruptions (25 per cent);
occupational segregation (8 per cent);
industrial segregation (9 per cent);
part-time employment (7 per cent);
unpaid care and work (7 per cent);
age (3 per cent);
tenure with current employer (1 per cent); and
working in government or NGO (1 per cent). An article by Risse (2019a) identifies the following factors as resulting in lower pay for women in Australia:
higher engagement in part-time work;
working in industries which pay less;
working in lower risk occupations;
working in more junior roles;
lack ambition and confidence; and
poor negotiation skills. Lower pay results in less financial empowerment, less money in their name for home loans and less superannuation to cover their retirement years. One of the solutions suggested for reducing/ eliminating gender pay gap is to recognise that gender pay gap exists in the first place. Other solutions that can be adopted by organisations are increased transparency about current rates of pay, salary bands and being clear about items that can be negotiated. Also reviewing and adopting strategies to remove “unconscious bias” in hiring and rewarding employees can ensure that employees are hired and remunerated on the basis of merit and value. In addition, Australia’s Fair Work Legislation needs to consider how to meaningfully measure and compare the value of jobs done by men and women that are so different in nature (Risse 2019b).
6.1 Non-government sector
Research has shown that having more women on Company Boards can enhance a company’s financial performance (Wiley and Monllor-Tormos, 2018). Further, the diversity prediction theorem states that diversity is the key to success, whereby a group of diverse problem solvers can outperform a group of high-ability problem solvers (Hong and Page, 2004). It would appear that the diversity prediction theorem has yet to take hold in Australia as to note, the number of male CEOs are five times higher than women, number of male directors are three times higher than women and number of male chairs are six times higher than women. Interestingly, women are poorly represented at the leadership level in industries such as education and training, healthcare and social assistance and administrative and support services where a higher proportion of women are employed.
6.2 Government
The proportion of Parliamentarians and Ministers at the Federal level remains heavily skewed towards men, and this difference has narrowed only modestly in the ten years to 2018. Under-representation of women is also present at the State level; 34 per cent of State/Territory Parliamentarians are women and 36 per cent of the State/Territory Government Ministers are women. Only 32 per cent of positions on Commonwealth Government Boards and Bodies and Chair/Deputy Chair Positions are held by women. Meanwhile, greater equity in terms of employment in Australian Public Service was observed in 2017 at the Senior Executive and Managerial levels.

Economic Issues
Page 16 The SA Centre for Economic Studies, University of Adelaide
7. Financial Resources
Disadvantages experienced during working life and career interruptions can have a profound impact on women’s financial situation leading to a higher reliance on public resources later on in life and a higher chance of being exposed to poverty7. Women rely more on government pensions and allowances (76 per cent vs. 70 per cent) as well as investment income (8.4 per cent vs. 6.8 per cent) upon retirement compared to men. According to the ABS Gender Indicators, Superannuation balances for women are only 66 per cent of that of men. This gender imbalance in superannuation might increase further due to government’s policy of Early Release Scheme for superannuation where people can access their super funds ahead of their retirement. Labour market data from ABS (2020) showed that of the 235,000 jobs lost in April, 55 per cent were jobs held by women. In addition, work hours for women have also reduced more than men’s hours. Also, occupations which have suffered most due to the pandemic are those that are held by women. In addition, free childcare policy was withdrawn three months before it was actually due. All these have probably accentuated the financial need of women and they are probably more likely to access their superannuation funds to make ends meet compared to men. Analysis of applications of clients by financial services company AMP shows that women are withdrawing a greater proportion of their super balance as part of the Government’s Early Release Scheme. On average, women have withdrawn more of their super balances compared with men and 14 per cent of women are clearing out their entire super balance compared to 12 per cent of men (see McKeown 2020). Early Release Scheme may have been a quick fix for many who found themselves cash poor during the pandemic and helped the government to keep their debt levels low in this way, but this scheme has aggravated the gendered impacts of COVID-19 and in the long term will leave women super poor upon retirement. According to the figures calculated by Industry Super Australia (ISA), a 20 year old worker who accessed $20,000 (full amount of the scheme) would retire with $120,000 less. A 30-year-old who withdrew $20,000 could lose more than $100,000 from their retirement, while a 40-year-old stood to lose $63,000, according to ISA. Since COVID-19 has impacted women and young people more than others the impact of Early Release Scheme will be felt very far into the future. Superannuation guarantee is legislated to increase from 9.5 per cent to 10 per cent in 2021, then to 12 per cent by 2025, an increase that will boost retirement savings by an estimated $20 billion each year. Australian Council of Trade Unions is advocating for a 15 per cent increase in superannuation guarantee for all, however according to the Union this should be “fast-tracked” for women. According to ABS Gender Indicators, of those who are living in low economic resource households and belong to the age cohort 15 to 44 years, more are female as well as lone parents. In addition, the proportion of women who belong to the lowest income quintile and are also single parents is higher compared to men in an equivalent situation. A significant proportion of women in this later cohort report that they face multiple cash flow problems and fail to raise $2,000 during an emergency. Women who are divorced are worse off in terms of employment, household income, asset holdings including home ownership, superannuation and debt levels compared to divorced men and married women (NATSEM 2016). Even though divorced women (without dependent children) participate more in the workforce their earnings from wages are 10 per cent lower than married women. A divorced woman (without dependent children) has assets values at 90 per cent less than a married woman due to change in factors such as home ownership and superannuation. The differences are noticeable in terms of superannuation balance as well. A divorced woman with no children has 75 per cent less superannuation compared to a married woman. Divorced women with children suffer more from financial hardship since they earn less than men and in majority of cases after a divorce, women get the custody of children. So their expenditure on basic items increases. Divorced mothers participate more in the workforce following a divorce but earn 83 per cent less than a woman without dependent children. And they spend majority of their income on necessities. Even though divorced or separated fathers contribute 68 per cent of the cost of childcare for young children, most divorced women struggle with the cost of childcare. The report (NATSEM 2016) also states that divorced mothers are more likely to experience financial stress compared to divorced fathers or couple families. All these lead to poor education outcomes for children in divorced families. Meanwhile, the HILDA survey conducted by Melbourne Institute (2018) found that women in general are less financially literate than men. Data from ABS Gender Indicators further shows that, women who are lone parents are much more resource poor and are economically vulnerable.

COVID-19: An Opportunity to Reset Policy Levers for Better Gender Equality in Economy and Society
The SA Centre for Economic Studies, University of Adelaide Page 17
8. Barriers to Women’s Participation in the Workforce
8.1 Value of unpaid work
Unpaid work is not accounted for in GDP calculations and would consequently provide a sizeable boost to the economy if it were. A majority of this unpaid work is done by women. It is important to take these facts into account when formulating policies to incentivise women’s participation in paid employment. The ABS (1997) estimated that the value of unpaid work (91 per cent household work and 9 per cent volunteer
and community work) in 1997 was $261 billion. A more recent analysis by PwC (2017) estimated the value of
unpaid work in Australia was $566 billion (in 2016 terms) and if this was accounted for in the national accounts
then Australia’s economy would be as big as $2.2 trillion. In other words, technically the GDP in Australia is
this high – it’s just that the unpaid component is not currently recognised.
Unpaid work and social norms
Geospatial analysis conducted by PwC (2017) shows that if the value of unpaid work is included in formal calculations of GDP then the actual size of the Australian economy would be one third bigger than formal measurements. Analysis by PwC (2017) shows that childcare comprises the highest valued component of unpaid work in the economy. In total, in comparison to men, women conduct:
76 per cent of childcare;
67 per cent of domestic work;
69 per cent of care of adults; and
57 per cent of volunteering. PwC (2017) found that mothers across all levels of socio-economic status are likely to take time away from paid employment to perform unpaid childcare. Interestingly, the analysis shows that even though more advantaged areas may substitute unpaid work for paid domestic help, the remainder of the unpaid work is still distributed in the same proportion between men and women:
“An indicative illustration of this would be if a household usually has 20 hours of unpaid work a week, a woman would conduct 15 hours of it and a man five hours. However, if they pay someone to take ten hours of that household work, although the woman would halve her unpaid hours to 7.5, the man would also reduce his to 2.5 hours.”
Geospatial analysis reveals that, people in locations with higher education levels are more likely to spend more time on unpaid childcare. This is due to household earning capacity and ability of a mother to take time away from paid work and for the household to live off one income. This partly explains why despite being more educated than men women’s participation rate is lower than men.
Distribution of unpaid work
A time of use study by the ABS (2006) shows that women do twice the unpaid work than men per day and men do twice the employment related work compared to women each day. Melbourne Institute (2018)’s report on HILDA data also confirms that women spend more time in housework and caring for others and less time in paid employment compared to men. HILDA analysis on time spent each week on employment, housework and care related activities between 2002 and 2016 shows the amount of time spent by men and women on paid work and various forms of unpaid work. Average time spent by men on employment remained the same at 35.9 hours per week between 2002 and 2016. In contrast, average time spent by women on employment increased from 22.8 hours in 2002 to 24.9 hours in 2016. In terms of unpaid work, men did 13.3 hours of housework per week in 2016 compared to 20.4 hours for women. Men spent 5.4 hours in caring activities per week while women spend 11.3 hours. This gendered division of labour where women spend more time in caring and housework and men spend more time in formal employment is more pronounced in families with children. HILDA track couples for a period of time and hence is able to track whether the birth of the first child triggers more traditional divisions of labour. The survey found that:
five years before the birth of the first child each partner’s share of time spent on paid and unpaid work was approximately equal;
the birth of the first child is a turning point in couples’ division of labour towards a highly gendered, long-term pattern;
as more children are born a more gendered division of labour becomes the norm; and

Economic Issues
Page 18 The SA Centre for Economic Studies, University of Adelaide
total time spent on paid and unpaid work in total is same for couples with children even though the distribution of paid and unpaid work differs.
HILDA data suggest that couples might be negotiating the division of paid and unpaid work among themselves. In that case more equitable arrangements regarding care and housework should be observed among couples where both partners do equivalent shares of paid work. It was also observed that women do the least housework in the anti-traditional model where they are the only ones employed. However, they still end up doing almost half of the housework and half of the caring work if they have children and more than half of the caring work if they do not have children. In households where both partners are employed full-time, women do more housework and caring for children than men. As female’s participation in the labour market has increased over time, the distribution of unpaid work between men and women has become an increasingly important issue. This is potentially a social issue which involves taking non-market decision between partners such as a decision to hire a cleaner and make more time available for paid employment. The unbalanced share of unpaid work done by women limits their availability in the labour market and can also act as a deterrent, forcing them to reduce their hours of paid work further or quit the labour market altogether. There are economic and social implications inherent in this for women and for government in the short run (e.g. lower tax revenue) and the long-run (e.g. demand on pensions and allowances).
8.2 Pregnancy
Our analysis so far shows that the birth of a child is a major turning point in a women’s professional life (in terms of employment options), earnings and personal life. Hence it is worth analysing more closely how pregnancy affects a women’s life.
Women are delaying having children. A higher proportion of women now work in high skill occupations. In addition, a higher proportion of women are working full time at the time of birth of their first child but the proportion almost halves once they have two or more children, such that they instead work part time. There is also an increasing share of women who are choosing not to have children due to a number of reasons including the impact of being compelled to make a trade-off between children and career (ABC Life, 2019).
There have been some notable changes in the demographic and behavioural characteristics related to pregnancy over recent years. The ABS Pregnancy and Employment Transitions Survey shows that between November 2011 and November 2017:
women are delaying having children and hence the average age of women having children is increasing;
more women in de facto relationships are having children;
more women from young migrant families are having children compared to non-migrant Australian women; and
more women are preferring smaller families. The social trend in Australia is that women increasingly shift to part-time work as they have children reinforcing the fact that childbirth is indeed a turning point in a woman’s career. This trend is illustrated by Figure 8.1 which shows that women who already had at least one child were more likely to be working part-time hours, i.e. less than 35 hours per week immediately before stopping for the birth of a child compared to women having their first child. In November 2017 more than 53 per cent of women with more than one child were working part time before immediately giving birth compared to 17 per cent of women with one child. According to ABS and HILDA data, female workforce participation in Australia declines dramatically once a woman has a child and it never fully recovers. This has been explained as a “double whammy effect” on a women’s career by the Grattan Institute (2018).
“During the years that they work fewer hours, women take home less pay. And this has a long-term effect: because women spend fewer hours working, they have less experience and are therefore less likely to win pay rises and job promotions. It’s a vicious cycle. The lower pay reduces the incentive to return to work, especially given the high cost of childcare. And this in turn means women with children accumulate less experience and gain fewer promotions.”

COVID-19: An Opportunity to Reset Policy Levers for Better Gender Equality in Economy and Society
The SA Centre for Economic Studies, University of Adelaide Page 19
ABS data shows that a higher proportion of women who were surveyed were working in higher skilled occupations when they were pregnant (60 vs 40 per cent) compared to lower skilled occupations. Yet once they have children their contribution to the workforce declines significantly and they revert to working part-time, a pattern which a majority of women continue for the rest of their career. So in summary, significant numbers of highly qualified women are falling out of the workforce either partially or fully once they have children. Figure 8.1 Usual weekly hours worked in occupation while pregnant immediately before stopping for birth of
child, by number of children, November 2017
Source: ABS (2018), Pregnancy and employment transitions, Australia, November 2017. Cat. No. 4913.0.
8.3 Childcare
Childcare is another reason that prevents women from increasing participation in the labour market. ABS has collected data on whether childcare affected parents’ labour force participation, focussing on parents with children aged 0 to 12 years and who do not work full time but would prefer to do more work. Overall 40 per cent of women in this cohort were prevented from working more hours due to childcare responsibilities. Table 8.1 highlights the proportion of women who were affected by childcare by various characteristics. The key impacts were:
a significant proportion of women were affected by childcare irrespective of their household income or the type of childcare used;
women working as an employee and women who have an unincorporated business were significantly affected; and
irrespective of family composition, women reported being affected due to childcare. When parents were asked about the main reason that childcare affected their labour force participation:
39 per cent agreed that childcare costs were too expensive;
27 per cent responded that they prefer to look after their child;
12 per cent cited availability and flexibility of childcare as the main reason; and
23 per cent cited other reasons.
0
10
20
30
40
50
60
70
Nov-11 Nov-17 Nov-11 Nov-17
One child Two or more children
Per
cent
Fewer than 35 hours 35 hours and over Permanently left job/Did not work during pregnancy

Economic Issues
Page 20 The SA Centre for Economic Studies, University of Adelaide
Table 8.1 Impact of childcare on women by various characteristics
Characteristics Impact of childcare
Equivalised disposable household income quintiles 34 per cent of women belonging to lowest income quintile were affected 41-43 per cent of women belonging to second, third, fourth and fifth income quintiles were affected
Type of childcare 46 per cent women of using formal childcare were affected 45 per cent of women using informal care were affected 52 per cent of women using both types of care were affected
Main source of household income 42 per cent of women whose main source of income is employment 41 per cent of women whose main source of income is unincorporated business reported as affected by childcare
Contribution of government pensions and allowances to gross household income
46 per cent of women in households who receive 1 per cent to less than 20 per cent in government contributions reported being affected 34 per cent of women who receive more than 90 per cent in government contributions reported being affected
Family composition of households In one family households 57 per cent of women belonging to families where both parents were working reported being affected In a one parent families 55 per cent women reported being affected due to childcare.
Note: (a) Estimates with relatively high standard errors have not been reported here; (b) See Table A24-A28 for detailed data. Source: ABS (2015-16), Household income and wealth, September 2017, Cat. No. 6523.0.
Income tax and childcare subsidy arrangements currently prevent women from increasing their number of work days per week. Under the current tax and subsidy scheme it is not optimal for a women on an average wage to work more than three days a week. A women working four days or five days a week takes home daily wages which are well below minimum wages after paying tax and childcare costs.
8.4 Income tax and childcare subsidy
The tax system in Australia creates negative incentives for women to increase their workforce participation. Census data shows that 50 per cent of women in Australia earn a wage which is either less than or equivalent to the minimum wage range in Australia. From 1 July 2018 the childcare benefit (CCB) and childcare rebate (CCR) were replaced by a childcare subsidy (CCS). CCS successively lowers the level of subsidy based on household income. Under this scheme the cap has been increased to $10,190. There is an underlying problem here. For income tax purposes the individual is the taxing unit. However, the childcare subsidy is assessed based on household income. Hence, when a women decides to increase the number of work days the individual cost benefit analysis done by the family is based on the female’s income not on household income. Our calculations show that if a female works three days a week she pays a total tax of $138 per week and her daily take home pay after tax is $245 – Table 8.1. If she increases her work week to five days then her tax liability more than doubles and her daily after tax take home pay per hour decreases in comparison to if she was working three days ($31 vs $28 per hour). In short, the tax system does not provide incentives to women to increase their participation in the workforce. Table 8.2 also shows how tax as well as childcare costs in combination can impact a female’s decision to increase work days. We assume a household where the male member of the household earns male full-time adult average weekly ordinary time earnings and the female member of the household earns female full-time adult average weekly ordinary time earnings. We have also assumed a childcare cost of $120 per day. We have then calculated the childcare subsidy based on household income. It should be noted that we haven’t included the effects of withdrawal of benefits such as family tax benefit, rent assistance, parenting payment in our analysis. Including these will have a stronger effect on the take home pay of women. Table 8.2 shows that if a female increases her work day from three to four days or five days then her marginal wage from the fourth day is $121 and from fifth day is $110. Although her take home pay may be larger in aggregate if she works more days, the marginal decline in her daily take home pay is a strong disincentive to working more days. The situation worsens if a family has two children who go to childcare.

COVID-19: An Opportunity to Reset Policy Levers for Better Gender Equality in Economy and Society
The SA Centre for Economic Studies, University of Adelaide Page 21
Table 8.2 Tax, childcare subsidy and female wages
Working days per week Wages Tax/ per week(b) Wages after tax/
per week Wages after tax/
per day
Out of pocket childcare cost/ per week (after
subsidy)©
Wages after tax and
childcare cost/ per week
Marginal wage after tax and
childcare cost
Pay per hour after
tax ($)
Wages after tax and
childcare cost per hour, one
child ($)
Wages after tax and
childcare cost per hour, two children ($)
Three days per week 873 138 735 245 133 602 31 25 20
Four days per week 1,165 240 925 231 202 723 121 29 23 16
Five days per week(a) 1,456 341 1,115 223 282 833 110 28 21 14
Note: (a) Wages for Five day work week is female full-time adult average weekly ordinary time earnings; (b) Tax per week is calculated from ATO's tax withheld calculator; (c) childcare subsidy calculated from Centrelink estimates assuming the male member of household earns a full-time adult ordinary time earnings and calculating the household income accordingly. Calculations done assuming an eight hour work day.
Source: (a) ABS (2018), Average Weekly earnings, Australia, February 2019, Cat. No. 6302; (b) based on an average daily wage of $291(c) ATO; (d) Centrelink.

Economic Issues
Page 22 The SA Centre for Economic Studies, University of Adelaide
9. Future of Employment for Women
The future of work is changing with advancements in technology and automation. McKinsey Global Institute (2019) states that occupations requiring physical activities in highly structured environments and in data processing or occupations that are repetitive will decline since these tasks can be done by machines much more efficiently. In contrast occupations that are difficult to automate will grow. Demand for social and emotional skills, such as communication and empathy, will grow almost as fast as does demand for many advanced technological skills. Automation will also spur growth in the need for higher-level cognitive skills, particularly critical thinking, creativity, and complex information processing. According to the Australian Jobs Report 2019 industries such as Healthcare and Social Assistance, Education and Training and Professional, Scientific and Technical Services are projected to grow fastest in the five years to 2023. And occupations such as community and personal service workers and professionals are projected to have highest growth rates.
Female occupations are less susceptible to automation and will have higher demand in future.
Analysis by ABC News8 shows that men’s occupations are at a higher risk of automation compared to women’s occupations. This implies that women will be less susceptible to job losses due to automation compared to men. In a recent report Deloitte (2019b) analysed the shift in the nature of occupations from “hand” to “head” to non-routine occupations which require use of both “head” and “heart”. They state that, “These trends reveal something else: they tell us that future of work is female. Women currently dominate the fastest growing occupations – the non-routine occupations of the head … The existing female workforce is at the right place at the right time to benefit from these changes ...”. However, many of the occupations expected to be created, such as teachers and nursing aides, typically have lower wage structures although it could be argued they create high social value. In the UK and other advanced economies occupations in education and social care which are dominated by women are expected to become important – Frontier Economics (2018). These occupations require higher levels of interpersonal skills, empathy and extensive human interactions and are less susceptible to automation.
Employment conditions, pay scales and social value in these occupations will require reviews and rewards in future years. This could entail a role for Fair Work Commission and equivalent state jurisdictions to reconsider how these awards are determined and the case for gender pay equity principles can be addressed in conjunction with wage inequality issues (see Gillian Whitehouse 2001). COVID-19 has further shown that frontline jobs held by women are essential even in times of crisis.
10. What Can Be Done by Government, Organisations and at Societal Level
Recent estimates (KPMG, 2018) show that Australia’s GDP could increase by $60 billion in the next 20 years and Australia’s living standards (household consumption) can be raised by $140 billion by increasing female participation in the workforce. In addition, the value of unpaid work in the economy is 51 per cent of formal GDP calculations (ABS, 2006) of which women do about $340 billion or 65 per cent (SACES calculations) of unpaid work. There is a need for re-balancing family life, with more equitable distribution of caring for children, amount of domestic chores etc. with paid employment. These are matters of public policy, social change and equity.
Changes that can be made in female and male education and career choices
While women are equally, if not more educated than men, women still face gender discrimination at the very start of their career. Both unconscious bias against women as well as their lack of confidence in their abilities compared to men plays a role here. Studies using HILDA data shows that women over-invest in workplace capabilities. Women have the equivalent of one and a half years extra education, and nearly a full year’s extra workforce experience, than what is required for their occupation. While men over-invest by 4 per cent, women over-invest by 11 per cent (The Conversation, 2018). In addition gender-linked stereotypes, roles and norms also prevent women from negotiating freely in the workplace leading to inequalities in pay and promotions (Wade, 2001). Women are also susceptible to encountering penalties and backlash for demonstrating too much ambition and assertiveness in the workplace (see Bowles 2007 and Bowles 2019).

COVID-19: An Opportunity to Reset Policy Levers for Better Gender Equality in Economy and Society
The SA Centre for Economic Studies, University of Adelaide Page 23
Merely promoting tertiary education for women is not enough; better mentoring programs for women who are young graduates and an end to ‘pay discrimination’ based on gender is required. For example, Women in Economics Network which is part of the broader Economic Society of Australia has launched state based mentoring programs for female undergraduate students studying economics to provide them with a better perspective as they enter the profession of economics. Similar programs are required in other fields of study. Women choose fields of study which ultimately orientates them to work in industries which mostly employ women and in low paid occupations. More women should be encouraged to take up fields of study which culminate in higher paid occupations such as STEM. However, given the demanding nature of occupations (e.g. STEM), more flexible work arrangements in careers for parents with young children will help women retain and pursue their STEM careers even during the child bearing and rearing stages of their lives and while provide men in STEM with the option to spend more time with their children. Having said that, it is also important that industries such as Healthcare and Social Assistance, Education and Training etc. which employ mostly women overcome their notion of gender stereotypes and provide equal employment opportunities for both men and women. These industries will be the growth industries of the future as structural changes in Australia continue to transition from more male dominated industries such as manufacturing to service oriented industries where majority of women work (DJSB, 2019). Breaking the gender stereotype in occupational roles will not only increase employment opportunities for men but also ensure future supply of labour force in “caring roles” (WGEA 2016). There is also scope for public policy intervention here to promote educational choices and career choices in such future growth industries for men. Women in leadership roles are also important. A female in a senior management can have an important influence on career development through careful mentoring, illustrating leadership and management and productive workplace relationships. When a female in a junior position sees that all the leadership roles are occupied by men then she is less influenced as compared to if there are more women in senior positions (Gould et al, 2018). The underlying mechanism here is that men tend to progress up the career ladder at a faster pace than women. Workplaces need to carefully scrutinise how they decide on promotional decision so they are not swayed by subjective/unconscious/institutional biases that favour men and redesign their organisational practices to be more objective and ensure the most competent candidate is appointed to the position (see Bohnet 2016). Also workplace policies that unintentionally/inadvertently disadvantage workers with parental duties e.g. scheduling meeting times that collide with school/childcare pick up times should be carefully considered. In addition, allowing remote access to participate in meetings while not in the office; providing flexibility/on-site care for children during school holidays can also help bridge the gap in participation.
Government policies to be considered
Given that women have certain attributes which are hard to automate, occupations that require these attributes may provide women with an edge over men in future. Occupations such as carers, education workers etc. will have higher demand in future. Many of these occupations are categorised as low paid. Moreover, it would be unwise to ignore the positive externality to society that occupations like teachers, carers etc. generate. Higher wages negotiated through conventional industrial relations channels will be much more desirable as compared to pre-election boosts to wages in low paid female dominated sectors such as child care (Wood and Chivers 2019). Unions will have to play a stronger role in wage setting. Another option is to lower tax rate for low paid occupations which have high ongoing demand – Risse (2019b). The current policies on parental leave payments in Australia are also designed with women as the primary caregiver in mind. For example, if a woman earns more than a certain income threshold ($150,000 per annum) while her partner earns less, the couple is not eligible to receive parental leave payment. On the contrary if the earnings are reversed in terms of gender then the woman can receive parental leave payments. Caring is not a single gender prerogative. 'Care givers' are male and female. The focus of policy makers should be to design policies that respond to and influence culture and attitudes and are able to catch up with today's world. The current policy in regard to ‘care givers’ is reinforcing social attitudes when inclusive parental leave policies are required that reinforce gender equality. Equal treatment in policy and hence opportunities would reinforce equality in the labour market and promote non-discrimination. This requires balance in the design of leave between genders for a start.
Economic Issues
Page 24 The SA Centre for Economic Studies, University of Adelaide
Important lessons can be learned from other OECD countries, which provide different options of parental leave for mothers, fathers and a separate provision where a couple can share parental leave between themselves (Crabb, 2019b). Parental leave policies are a crucial determinant of future labour supply. Income tax and childcare subsidy arrangements currently prevent women from increasing their number of work days per week. Under the current tax and subsidy scheme it is not optimal for a female on an average wage to work more than three days a week. A female working four days or five days a week takes home daily wages which are well below minimum wages after paying tax and childcare costs. KPMG (2018) has analysed four disincentives for women to increase their participation in the workforce. These are their marginal tax rate, loss of family tax benefit, loss of childcare subsidy and extra out of pocket childcare expenses. Making well researched changes to the tax system and childcare subsidies to ensure women don’t face financial disincentives can help boost female participation in the workforce. Our analysis of ABS data shows that part-time work for women in Australia is entrenched across all sectors of the labour market. Policies such as childcare subsidies should be based on gender equity analysis (as is done by the European Commission and countries like, Austria, Denmark, Belgium, Finland and Sweden) rather than taking household income as a yardstick for measuring subsidies. In addition, in a country which is characterised by an ageing population, policy prescription might be required so that fertility rates do not fall further. Women are increasingly delaying having children or opting out altogether. This might be a rational choice guided by preferences of women. However, if women prefer not having children due to the detrimental effect on their career and a higher share of unpaid work then that reflects a market failure which then requires policy intervention. Policies which are built around the right incentives and which take into account socio-economic circumstances should be able to incentivise women to work full-time or increase their participation in the workforce. Paid parental leave as well as current childcare subsidies are practical and functional tools but they need amendment and more government investment such that men can spend more time with their family and women can increase their participation in the workforce to strike a balance between work and life. In addition further scope exists to modify or introduce superannuation payments for low paid marginalised female workforce who work intermittently in casual employment.
Changes in work-place for women and men, social changes and non-market arrangements
It is true that the Australian governments have sought to address maternity leave and workforce retention. Paid maternity leave has become more widely available, from both employers and the government. So when women have children they are increasingly choosing to take maternity leave instead of quitting the workforce. As mothers who take maternity leave are more likely to return to work, female workforce participation has increased. However, women face new challenges when they return to work from maternity leave. They face workplace discrimination, the high cost of childcare and report lower life satisfaction. The good news is that society is slowly adapting traditional parental roles and responsibilities. Social norms are in transition with fathers wanting to be more involved in caring. Between 1996 and 2017, a father’s use of flexible work arrangements and working from home to care for children has doubled (ABS, 2017). However, while some men still experience difficulties when trying to access flexible working arrangements, research also shows that men are more unwilling to use family-friendly work arrangements due to factors such as perceived or actual impact on their occupation, personal identities and career progression (Bittman et al 2004). More gender neutral policies and incentives for men to utilise workplace flexibility are challenges for the future. Non-market arrangements between couples regarding household and caring responsibilities cannot be enforced by government. If couples choose to participate in the work force then new occupations such as cleaning, cooking, picking up children and other daily responsibilities can be outsourced. There are opportunities for development of a more structured market for these occupations which are usually categorised as low-skilled. Laws against workplace discrimination must continue to be enforced. One approach that workplaces can adopt is to focus on achieving targets, timely completion of deadlines and looking at how productive their employees are rather than how much time they spend at work. Offering flexibility with regards to start and finish time at work may be useful in certain occupations but families with young children need more than that. Working collaboratively at workplaces is important but it is equally important to have the option of working from home. This balance can help young families to meet deadlines at work without being physically present at work and at the same time engage more in family activities. For example, some companies are paying full-time salary for a nine-day fortnight in recognition of the changing work patterns and requirements for flexibility9.

COVID-19: An Opportunity to Reset Policy Levers for Better Gender Equality in Economy and Society
The SA Centre for Economic Studies, University of Adelaide Page 25
Gender equality at the workplace is very much linked to gender equality in society. Soft campaigns targeted towards more equitable share of unpaid work done by men and women can be effective in changing the mindset in Australian society. Soft campaigns should also be targeted towards changing workplace perspectives on flexibility not just for working mothers but ‘working fathers’ (a term which doesn’t exist). The ultimate objective is to balance childcare and family life while ‘capturing and supporting’ women’s incentives and return to the workforce. No society can afford to disregard the knowledge, experience and productivity of such a large segment of the workforce. Culture in workplace, parental and roles within families are socially defined – they are malleable and can be changed for the better. While economic prosperity is important for a family as well as a country, the importance of well-being is increasingly being recognised globally (New Zealand’s Well-Being Budget). Policies need to recognise that "quality of life, relationships and hence caring" are the key to a happy life, not just consumerism or spending (Brisbane Times 2020)
11. COVID-19 and the “Pink-Collar Recession”
Between 14th March and 2nd May 2020 most job losses occurred in the serviced based sector including accommodation and food services (down 27 per cent), arts and recreation services (down 19 per cent), rental, hiring and real estate (down 13 per cent), professional and technical services (down 11 per cent) and other services (down 10 per cent). During the previous recession the government took measures to boost fiscal spending in infrastructure construction projects and provided tax incentives to businesses to expand and hire. The IMF discusses the important role public investment spending can play in the fiscal response to the COVID-19 pandemic. It emphasises that in the immediate crisis and the recovery phase, there is a need for strong prioritisation and project selection processes, accompanied by clear policy objectives, dedicated coordination mechanisms, and high transparency. In Australia, the government would do well to look closely at the composition of the unemployed before taking further action. According to the HILDA Survey data analysed by the Melbourne Institute approximately 3.5 million people (28 per cent) employed in the industries most impacted by COVID-19 tended to be low-wage workers, many in short term casual jobs and disproportionately female and/or young. According to the OECD policy action should be based on:
protecting people and places left behind;
supporting small businesses and vulnerable workers; and
responsive and coordinated governance. The COVID-19 pandemic placed women at the frontline with women making up 70 per cent of the health care workforce, exposing them to a greater risk of infection. Women are also mostly involved in caring responsibilities in response to school closures an care of elderly relatives (Cooper and Mosseri 2020). There is some evidence as to a heightened risk of family violence, abuse or harassment during times of crisis and quarantine (Boxall et.al. 2020). Job losses as well as safety concerns have led many parents to keep children out of childcare. The Government bailout of childcare centres announced in April ensured childcare centres survived10. This arrangement was to be in place for six months. However the government ended the scheme on the 13th July 2020 ahead of the six month period initially announced. A recent survey of 2,200 parents revealed that more than half (60 per cent) of Australian households currently using childcare will have a parent forced to reduce work when full childcare fees return. Given the current labour market with many second earners being affected, it is likely that many households will not be able to afford childcare fees. There is a need to address the superannuation guarantee for all. Notably, women already have lower super balance compared to men and the recent Early Super Release has accentuated this gender imbalance with more women (and low income earners) withdrawing from their superannuation. The risk of poverty in future is obvious unless steps are taken to boost superannuation balances. The pandemic saw a more rapid uptake and adoption of technology as many jobs were able to shift from the office to the home. The latest data from the ABS Household Impacts of COVID-19 survey shows 46 per cent of the workforce worked from home in late April and early May. By comparison, the ABS’s 2019 data showed slightly less than a third saying they “regularly worked from home.”

Economic Issues
Page 26 The SA Centre for Economic Studies, University of Adelaide
Perhaps it is time to rethink our National Employment Standards to roll out wider flexibility and provision to work from home than was accorded in the pre-pandemic era. Reduction in commuting times and meetings has freed up more time for productive work as well as contributed to improved work life balance. A recent survey by Metova showed that 48 per cent of those surveyed agree that they are more productive working from home while 57 per cent would prefer to work from home in the future. Some 76 per cent used video conferencing as their daily work. As the restrictions are lifted we need to rethink the way we work and review/reset our existing policies to increase national productivity.

COVID-19: An Opportunity to Reset Policy Levers for Better Gender Equality in Economy and Society
The SA Centre for Economic Studies, University of Adelaide Page 27
Bibliography
ABC Life (2019), “More women are choosing not to have kids, and society can’t cope”, by Kellie Scott for Ladies, We Need to Talk. Published on 18 June. Available at: https://www.abc.net.au/life/more-women-are-choosing-not-to-have-kids-and-society-cannot-cope/11160788
Access Economics (2006), “Meeting Australia’s Ageing Challenge: The Importance of Women’s Workforce Participation”, report commissioned by The House of Representatives Standing Committee on Family and Human Services, November. Available at: https://apo.org.au/sites/default/files/resource-files/2007/01/apo-nid2544-1102886.pdf
Aguirre, DeAnne, Leila Hoteit, Christine Rupp, and Karim Sabbagh. (2012), “Empowering the Third Billion. Women and the World of Work in 2012” Briefing Report. Booz and Company, New York, October. Available at: https://www.strategyand.pwc.com/report/empowering-third-billion-women-world
Allen, Liz (2020), “COVID-19 could see thousands of women miss out on having kids, creating a demographic disaster for Australia”, The Conversation. Available at: https://theconversation.com/covid-19-could-see-thousands-of-women-miss-out-on-having-kids-creating-a-demographic-disaster-for-australia-142174
alphaBeta (2017), “The automation advantage.” Report commissioned by Google. Available at: https://www.alphabeta.com/wp-content/uploads/2017/08/The-Automation-Advantage.pdf
Australian Bureau of Statistics (ABS) (2020), Labour force, Australia, Apr 2020, Cat no 6202.0, May 2020.
__________________(2020), Household Impact of COVID-19 Survey, May 2020.
__________________(2019), Consumer Price Index, Australia, June, Cat. No. 6401.0.
_______________ (2018), Australian National Accounts: National Income, Expenditure and Product, Australia,
September, Cat. No. 5206.0. Available at: http://www.abs.gov.au/
_______________ (2018), Population Projections, Australia, 2017 (base) – 2066. Cat. No. 3222.0. Available at:
http://www.abs.gov.au/
_______________ (2018), Australian Demographic Statistics, June, Cat. No. 3101.0. Available at:
http://www.abs.gov.au/
_______________ (2007, 2018), Birth, Australia, December, Cat. No. 3301.0. Available at: http://www.abs.gov.au/
_______________ (2018), Labour Force Australia, December, Cat. No. 6202.0. Available at: http://www.abs.gov.au/
_______________ (2018), Gender Indicators Australia, September, Cat. No. 4125.0. Available at:
http://www.abs.gov.au/
_______________ (2018), Average Weekly Earnings, November, Cat. No. 6302.0. Available at: http://www.abs.gov.au/
_______________ (2018), Pregnancy and Employment Transitions, Australia, November, Cat. No. 4913.0. Available at:
http://www.abs.gov.au/
_______________ (2017), Childhood Education and Care, Australia, June, Cat. No. 4402. Available at:
http://www.abs.gov.au/
_______________ (2016), Census of Population and Housing, Employment, Income and Education, Tablebuilder.
Available at: http://www.abs.gov.au/
_______________ (2015-17) Life Tables, States, Territories and Australia, September, Cat. No. 3302.0. Available at:
http://www.abs.gov.au/
_______________ (2015-16), Household income and wealth, September, Cat. No. 6523.0. Available at:
http://www.abs.gov.au/
_______________ (1997), Unpaid work and the Australian Economy, October, Cat. No. 5240.0. Available at:
http://www.abs.gov.au/
Australian Human Rights Commission (2014), “Supporting Working Parents: Pregnancy and Return to Work National Review”, October. Available at:
https://www.humanrights.gov.au/sites/default/files/document/publication/SWP_Report_2014.pdf
Bittman, M., Hoffman, S. and D. Thompson (2004), “Men’s uptake of family-friendly employment provisions”, Australian Department of Family and Community Services. Policy Research Paper No. 22. Available at: file:///C:/Users/a1225025/Downloads/SSRN-id1728590.pdf
Bohnet, Iris (2016), “What Works: Gender Equality by Design”, Belknap Press.
Bowles, Hannah Riley, Babcock, Linda and Lei Lai (2007), “Social Incentives for Gender Differences in the Propensity to Initiate Negotiations: Sometimes It Does Hurt to Ask”, Organisational Behaviour and Human Decision Processes,
103 (1) 84-103. Available at: https://www.researchgate.net/publication/222513313_Social_Incentives_for_Gender_Differences_in_the_Propen
sity_to_Initiate_Negotiations_Sometimes_It_Does_Hurt_to_Ask
Bowles, Hannah Riley, Thomason, Bobbi and Julia Bear (2019), “Reconceptualizing What and How Women Negotiate for Career Advancement”, The Academy of management Journal, in Press. Available at: file:///C:/Users/a1225025/Downloads/BowlesThomasonBear_AMJinpress.pdf
Boxall, Hayley, Morgan, Anthony and Rick Brown (2020), “The prevalence of domestic violence among women during the COVID-19 pandemic”, Statistical Bulletin 28, Australian Institute of Criminology. Available at: https://www.aic.gov.au/sites/default/files/2020-07/sb28_prevalence_of_domestic_violence_among_women_during_covid-19_pandemic.pdf

Economic Issues
Page 28 The SA Centre for Economic Studies, University of Adelaide
Brisbane Times (2020), “Another year of getting and spending – but why do we bother?” by Ross Gittins, January 2020. Available at: https://www.brisbanetimes.com.au/business/the-economy/another-year-of-getting-and-spending-but-why-do-we-bother-20200126-p53us6.html?ref=rss
Burgess, Noël (2013), “The Motherhood Penalty: How Gender and Parental Status Influence Judgements of Job Related Competence and Organizational Commitment”, University of Rhode Island, Digital Commons @URI, Schmidt
Labour Research Center, Seminar Research Paper Series. Available at: https://digitalcommons.uri.edu/cgi/viewcontent.cgi?referer=https://www.google.com/&httpsredir=1&article=1035&c
ontext=lrc_paper_series
Business Council of Australia (2017), “Future-Proof: Protecting Australians through education and skills”. Available at: https://www.voced.edu.au/content/ngvper cent3A77837
Cech, Erin A. and Mary Blair-Loy (2019), “The changing career trajectories of new parents in STEM”, PNAS March, 116 (10) 4182-4187; . Available at: https://doi.org/10.1073/pnas.1810862116
Conversation, The (2019), “No surplus, no share market growth, no lift in wage growth. Economic survey points to bleaker times post-election” by Peter Martin, January. Available at: https://theconversation.com/no-surplus-no-share-market-growth-no-lift-in-wage-growth-economic-survey-points-to-bleaker-times-post-election-110315
_______________ (2018), “The Gender Qualification Gap: women over-invest in workforce capabilities” by Leonora
Risse, November. Available at: https://theconversation.com/the-gender-qualification-gap-women-over-invest-in-workplace-capabilities-105385
Cooper, Rae and Sarah Mosseri (2020), “Pandemic has impacted on women most significantly”, The Sydney Morning
Herald, 5 June 2020. Available at: https://www.smh.com.au/business/workplace/pandemic-has-impacted-women-
most-significantly-20200604-p54ziu.html
Crabb, Annabel (2019a), “Why don’t more dads take parental leave? The answer is in their heads”, ABC News, 8 September. Available at: https://www.abc.net.au/news/2019-09-08/parental-leave-for-fathers/11471762.
_______________ (2019b), Men at Work: Australia’s Parenthood Trap, Quarterly Essay: 75.
Daley, John and Cassie McGannon (2014), “Submission on Productivity Commission Inquiry on Childcare and Early Childhood Learning”, Grattan Institute. Available at: https://grattan.edu.au/wp-content/uploads/2014/05/228_daley_mcgannon_submission_pc_childcare.pdf
Daly, Kevin (2007), “Gender Inequality, Growth and Global Ageing”, Global Economics, Paper No. 154, published by Goldman Sachs, April. Available at: https://www.empowerwomen.org/en/resources/documents/2013/8/global-economics-paper-no-154-gender-inequality--growth-and-global-ageing?lang=en
Dayaram, Kantha and Scott Fitzgerald (2020), Working from home remains a select privilege: it’s time to fix our national employment standards, published on The Conversation on 3 June 2020.
Deloitte (2019a), “Modelling the value of unpaid work and care”, report commissioned by Office for women, Department of Health and Human Services. Available at: https://www.abc.net.au/news/2019-07-08/value-of-unpaid-work-to-the-economy/11282840
_______________ (2019b), “The Path to prosperity: Why the future of work is human?”, Building the lucky country No.
7. Available at: https://www2.deloitte.com/au/en/pages/building-lucky-country/articles/path-prosperity-future-work.html
_______________ (2017), “Women in Boardroom: Global Perspective”, fifth edition. Available at:
https://www2.deloitte.com/au/en/pages/risk/articles/women-in-the-boardroom.html
Department of Jobs and Small Business (DJSB) (2019), Australian Jobs 2019. Available at: https://www.employment.gov.au/australian-jobs-publication
Dent, Georgia (2020), Why I’m fronting a campaign asking the Prime Minister to extend free childcare past June 28, published in The Women’s Agenda on 6 May 2020.
Dockery, Mike and Sherry Bawa (2020), Working from home in the COVID-19 Lockdown, Bankwest Curtin Economics Centre Research Brief COVID 19 #5.
Dwyer, R.E. (2013), “The Care Economy? Gender, Economic Restructuring, and Job Polarization in the U.S. Labor Market”. American Sociological Review 78(3). Available at:
https://journals.sagepub.com/doi/pdf/10.1177/0003122413487197
Equal Opportunity Commission (2006), “Britain’s hidden brain drain: the EOC’s investigation into flexible and part-time working”, July. Available at:
https://content.next.westlaw.com/Document/Ic4b5f0d5e83311e398db8b09b4f043e0/View/FullText.html?contextData=(sc.Default)&transitionType=Default&firstPage=true&bhcp=1
Evans, A and E Gray (2005), ‘What makes an Australian family?’ in S Wilson, G Meagher, R Gibson, D Denemark & M Western (eds), Australian Social Attitudes: The first report, pp 12–29, v 27.
Financy Women’s Index (2020), “The pandemic impacts progress and timeframe to economic equality”, June quarter 2020.
Frontier Economics (2018), “The impact of artificial intelligence on work”, an evidence review prepared for the Royal Society and British Academy, September. Available at: https://royalsociety.org/~/media/policy/projects/ai-and-work/frontier-review-the-impact-of-AI-on-work.pdf
Fuegen, Kathleen, Biernat, Monica, Haines, Elizabeth and Kay Deaux (2004), “Mothers and Fathers in the Workplace: How Gender and Parental Status Influence Judgements of Job-Related Competence”, Journal of Social Issues, 60
(4) 737-754. Available at: https://www.researchgate.net/publication/229866757_Mothers_and_Fathers_in_the_Workplace_How_Gender_an
d_Parental_Status_Influence_Judgments_of_Job-Related_Competence

COVID-19: An Opportunity to Reset Policy Levers for Better Gender Equality in Economy and Society
The SA Centre for Economic Studies, University of Adelaide Page 29
Grattan Institute (2018), “Good News and Bad News for Women in Australia”, September. Available at: https://grattan.edu.au/news/good-news-and-bad-news-for-the-women-of-australia/
Gould, Jill A., Kulik, Carol T and Sardeshmukh, R. Shruti (2018), “Trickle-down effect: The impact of female board members on executive gender diversity”, Human Resource Management, 57 (4) 931-945. Available at: https://onlinelibrary.wiley.com/doi/full/10.1002/hrm.21907
Haar, Jarrod (2020), A four-day working week could be the shot in the arm post-coronavirus tourism needs, published in The Conversation on 28 May 2020.
Hong, Lu and Scott E. Page (2004), “Groups of Diverse Problem Solvers can outperform groups of high ability problem solvers”, 101 (46) 16385-16389. Available at: https://www.pnas.org/content/101/46/16385
International Monetary Fund (IMF) (2012), Country Report No. 12/208: Japan. International Monetary Fund, Washington, August. Available at: https://www.imf.org/external/pubs/ft/scr/2012/cr12208.pdf
_______________ (2020), Managing Public Investment Spending During the Crisis, Special Series on COVID-19.
_______________ (2020), Options to Support Incomes and Formal Employment During COVID-19, Special Series on
COVID-19.
Kleven, H., Landais, C., Posch, J., Steinhauer, A. and J. Zweimüller (2019), “Child penalties across countries: Evidence and Explanations”, NBER working paper series. Available at: https://www.nber.org/papers/w25524.pdf
Kleven, H., Landais, C., and SØgaard, J.E. (2018), “Children and gender inequality: Evidence from Denmark”, NBER working paper series. Available at: https://www.nber.org/papers/w24219.pdf
KPMG (2018), “Ending workforce discrimination against women”, April. Available at: https://home.kpmg/au/en/home/insights/2018/04/ending-workforce-discrimination-against-women.html
McKeown, Warren (2020), Kicking Australia’s Superannuation problem into the future. Available at: https://pursuit.unimelb.edu.au/articles/kicking-australia-s-superannuation-problem-into-the-future
McKinsey Global Institute (2019), “Navigating a world of disruption” by Jacques Bughin and Jonathan Woetzel, January. Available at: https://www.mckinsey.com/featured-insights/innovation-and-growth/navigating-a-world-of-disruption
_______________ (2015), “The Power of Parity: How advancing Women’s equality can add $12 trillion to Global
Growth”, September. Available at: https://www.mckinsey.com/featured-insights/employment-and-growth/how-advancing-womens-equality-can-add-12-trillion-to-global-growth
Melbourne Institute of Applied Economic and Social Research (Melbourne Institute) (2018), “The Household Income and Labour Dynamics in Australia (HILDA) Survey: Selected Findings from Waves 1 to 16”. Available at:
https://melbourneinstitute.unimelb.edu.au/__data/assets/pdf_file/0005/2839919/2018-HILDA-SR-for-web.pdf
Melbourne Institute (2020), Who’s hit hardest by the economic effects of COVID-19.
NATSEM (2016), “For Richer For Poorer”. Available at: https://www.natsem.canberra.edu.au/storage/1-December%2013%20-%20AMP.NATSEM39%20-%20For%20Richer%20For%20Poorer%20-%20Report%20-%20FINAL%20(2).pdf
O’Leary, J. and G. Russell (2012), “Men Get Flexible! Mainstreaming flexible work in Australian business”, The Diversity Council of Australia. Available at:
https://xyonline.net/sites/xyonline.net/files/Russell%2C%20Men%20Get%20Flexible%202012.pdf
OECD (2020), Evaluating the initial impact of COVID-19 containment measures on economic activity, Tackling Coronavirus Series.
_______________ (2020), Supporting livelihoods during the COVID-19 crisis: closing the gaps in safety nets, Tackling
Coronavirus Series.
_______________ (2020), Women at the core of the fight against COVID-19 crisis, Tackling Coronavirus Series.
_______________ (2020) Protecting people and societies, Tackling Coronavirus Series.
Parliament of Australia (2002), “Commonwealth Support for Childcare”, E-Brief, July. Available at: https://www.aph.gov.au/About_Parliament/Parliamentary_Departments/Parliamentary_Library/Publications_Archive/archive/childcaresupport
Productivity Commission (2016), “Migrant intake into Australia”, report commissioned by the Australian Government. Available at: https://www.pc.gov.au/inquiries/completed/migrant-intake/report
_______________ (2015), “Childcare and Early Childhood Learning: Public Inquiry”, February. Available at:
https://www.pc.gov.au/inquiries/completed/childcare/report
PwC, (2017), “Understanding the unpaid economy”, March. Available at: https://www.pwc.com.au/australia-in-transition/publications/understanding-the-unpaid-economy-mar17.pdf
Risse, Leonora (2019a), “Myth busting: The Gender Pay Gap Edition”, Women’s Agenda. Available at: https://womensagenda.com.au/latest/myth-busting-the-gender-pay-gap-edition/
_______________ (2019b), “50 years after Australia’s historic ‘equal pay’ decision, the legacy of ‘women’s
work’ remains”, The Conversation. Available at: https://theconversation.com/50-years-after-australias-historic-equal-pay-decision-the-legacy-of-womens-work-remains-118761
Stewart, Miranda (2018), “Personal income tax cuts and the new Childcare Subsidy: Do they address high effective marginal tax rates on women’s work?”, Tax and Transfer Policy Institute, Crawford School of Public Policy, Australian National University, Policy Brief 1/2018, August. Available at: https://taxpolicy.crawford.anu.edu.au/sites/default/files/publication/taxstudies_crawford_anu_edu_au/2018-08/complete_gender_tax_cuts_m_stewart_august_2018.pdf

Economic Issues
Page 30 The SA Centre for Economic Studies, University of Adelaide
_______________ (2017), Tax, Social Policy and Gender: Rethinking Equality and Efficiency, ANU Press, Canberra,
November. Available at: https://press.anu.edu.au/publications/tax-social-policy-and-gender
Thwing Eastman, Meggin (2017), Women on Boards: Progress Report 2017 MSCI, December.
Ruppaneer, Leah, Caitlyn Collins and William Scarborough (2020), “COVID-19 is a disaster for mothers’ employment. And no, working from home is not the solution”, The Conversation.
Verniers, Catherine and Jorge Vala (2018), “Justifying gender discrimination in the workplace: The mediating role of motherhood myths”, PLOS ONE 13(7): e0201150. Available at: https://doi.org/10.1371/journal.pone.0201150
Wade, Mary E. (2001), “Women and Salary Negotiation: The Costs of Self-Advocacy”, Psychology of Women Quarterly, 25, p. 65-76. Available at: https://journals.sagepub.com/doi/pdf/10.1111/1471-6402.00008
Whitehouse, Gillian (2001), “Recent Trends in pay Equity: Beyond the Aggregate Statistics”, The Journal of Industrial Relations, 43 (1) 66-78. Available at: https://journals.sagepub.com/doi/pdf/10.1111/1472-9296.00005
Wiley, Carolyn and Mireia Monllor-Tormos (2018), “Board Gender Diversity in the STEM&F Sectors: The Critical Mass Required to Drive Firm Performance”, Journal of Leadership & Organizational Studies, vol. 25, no. 3, January.
Workplace Gender Equality Agency (2016), “Stereotypes about women’s work, men’s work threaten innovation”, Media Release. Available at: https://www.wgea.gov.au/sites/default/files/documents/78071_media-release-womens-work-mens-work.pdf
Wood, Danielle and C. Chivers (2019), “The gaping holes in Labor's 20% pay boost for childcare workers”, published in
The Sydney Morning Herald. Available at: https://www.smh.com.au/politics/federal/the-gaping-holes-in-labor-s-20-
percent-pay-boost-for-childcare-workers-20190502-p51jh7.html.
Wood, Danielle (2020), What’ll happen when the money’s snatched back? Our looming coronavirus support cliff, Published in The Conversation on 14 May 2020.
Wood, Danielle, Kate Griffiths and Owain Emslie (2020), “Childcare won’t remain free after the pandemic, but it should be reformed”, published in The Conversation on 27 April 2020.
Wood, Danielle, Kate Griffiths and Owain Emslie (2020), “Cheaper Childcare, A practical plan to boost female workforce participation”, Grattan Institute.
Yu Liu, Zuobao Wei, and Feixue Xie (2014), “Do Women Directors Improve Firm Performance in China?” Journal of Corporate Finance, vol. 28: p. 169-184;

COVID-19: An Opportunity to Reset Policy Levers for Better Gender Equality in Economy and Society
The SA Centre for Economic Studies, University of Adelaide Page 31
Endnotes
1 Actual net overseas migration in the year 2016-2017 was 262,489 which far exceeds the estimates used in the population projection.
2 There is a recent divergence in thinking in terms of measuring growth by a more holistic “well-being” and inclusive growth which also accounts for the distribution of growth/inequalities as opposed to through GDP alone. See https://www.weforum.org/agenda/2014/05/growing-disconnect-gdp-wellbeing/
3 Information on the new Childcare Subsidy Scheme can be found here: https://www.servicesaustralia.gov.au/individuals/services/centrelink/child-care-subsidy
4 We calculate the pay gap using the typical approach used in the literature, which is the difference between male and female earnings expressed as a proportion of male earnings.
5 Gender pay gap can be calculated in different ways, from full- time adult average weekly ordinary time earnings, adult hourly ordinary time cash earnings.
6 Minimum wage in 2015-16 was $656.90 whereas minimum wage in 2018-19 is $719.20. For the purpose of this analysis weekly income range of $650 to $799 has been assumed as the minimum wage range in Australia. $1,000-$1,249 ($52,000-$64,999) has been assumed as average wage range in Australia. $1,500-$1,749 ($78,000-$90,999) has been assumed as average full time wage in Australia
7 According to 2017 HILDA Survey, single elderly women in Australia are at high risk of living in poverty 8 ABC News. See data here: https://www.abc.net.au/news/2017-08-09/ai-automation-men-and-lower-paid-
workers/8741518 9 A similar pay policy is adopted by a company called Grace Papers in an article in The Sydney Morning Herald. See
https://www.smh.com.au/lifestyle/life-and-relationships/the-four-day-fallacy-busting-the-myth-of-part-time-working-mums-20190906-p52ou1.html
10 Under the new system parents won’t have to pay any out of pocket childcare fees. The government would provide centres with 50 per cent of their pre-COVID19 fees and the job-keeper package would help cover the wages of educators and staff.