Embed Size (px)
Citation preview
Economic Management Thematic Report
Mid-Term Review of the Uganda National Development Plan Final Report
Prepared by Delta Partnership in Association with REEV Consult for the National Planning Authority
i | P a g e
Contents
ACRONYMS .......................................................................................................................... iii
EXECUTIVE SUMMARY ........................................................................................................ v
1 INTRODUCTION ............................................................................................................ 1
1.1 Background ................................................................................................................................. 1
1.2 Context ......................................................................................................................................... 2
1.3 Study approach / methodology ................................................................................................ 3
1.4 Organisation of the report ......................................................................................................... 5
2 MACROECONOMIC POLICY AND PERFORMANCE ...................................................... 6
2.1 Overview ...................................................................................................................................... 6
2.2 Macro-economic performance and review of assumptions ................................................. 6
2.3 Balancing macro-economic stability and growth ................................................................. 15
2.4 Macroeconomic outlook .......................................................................................................... 20
3 NDP AND ALIGNMENT OF PUBLIC EXPENDITURE MANAGEMENT SYSTEMS .......... 21
3.1 Overview of public expenditure management systems ...................................................... 21
3.2 Challenges around budget implementation .......................................................................... 22
3.3 Alignment of the budget process with NDP priorities ......................................................... 23
3.4 Alignment of the MTEF with NDP priorities .......................................................................... 25
3.5 Other public expenditure management systems ................................................................. 28
3.6 Public investment planning and the NDP ............................................................................. 30
3.7 Immediate opportunities to improve public expenditure management ............................ 34
4 ENHANCING GROWTH AND PROMOTING COMPETITIVENESS AND PRIVATE
SECTOR DEVELOPMENT................................................................................................... 37
4.1 Review of sector performance and growth ........................................................................... 37
4.2 Competitiveness and improving environment for “doing business” in Uganda .............. 46
ii | P a g e
4.3 Private sector performance, progress and challenges ....................................................... 48
5 FINANCING OF THE NDP ............................................................................................ 55
5.1 NDP financing strategy ............................................................................................................ 55
5.2 Progress on implementation of financing strategy .............................................................. 56
6 CROSS-CUTTING ISSUES ........................................................................................... 69
6.1 Social protection ....................................................................................................................... 69
6.2 Democracy and political governance .................................................................................... 70
6.3 Environment .............................................................................................................................. 71
6.4 Gender ....................................................................................................................................... 73
7 KEY FINDINGS, CONCLUSIONS AND RECOMMENDATIONS ..................................... 75
7.1 Key Findings ............................................................................................................................. 75
7.1.1 Macroeconomic performance and policy ...................................................................... 75
7.1.2 Public expenditure management ................................................................................... 77
7.1.3 Growth and socio-economic transformation, promoting competitiveness and
private sector development ............................................................................................................. 78
7.1.4 Financing of the NDP ....................................................................................................... 82
7.2 Recommendations ................................................................................................................... 84
7.2.1 Recommendations for the current NDP ........................................................................ 84
7.2.2 Recommendations for the next NDP ............................................................................. 86
Annex 1. District case studies ............................................................................................. 90
iii | P a g e
ACRONYMS
BFP Budget Framework Paper
BoU Bank of Uganda
CSO Civil Society Organisation
DDP District Development Plan
EAC East African Community
EPRC Economic Policy Research Centre
FBO Faith Based Organisation
GAPR Government Annual Performance Report
GDP Gross Domestic Product
GoU Government of Uganda
IFC International Finance Corporation
IGG Inspectorate of Government
JBSF Joint Budget Support Framework
LDPG Local Development Partners Group
LGDP Local Government Development Plan
LGFC Local Government Finance Commission
MDA Ministry / Department / Agency
MoAAIF Ministry of Agriculture, Animal Industries and Fisheries
MoD Ministry of Defence
MoEACA Ministry of East African Community Affairs
MoEMD Ministry of Energy and Minerals Development
MoES Ministry of Education & Science
MoFPED Ministry of Finance, Planning and Economic Development
MoGLSD Ministry of Gender, Labour and Social Development
MoH Ministry of Health
MoIA Ministry of Internal Affairs
MoICT Ministry of Information and Communications Technology
MoJCA Ministry of Justice and Constitutional Affairs
MoLHUD Ministry of Lands, Housing and Urban Development
MoTIC Ministry of Trade, Industry and Commerce
MoTWH Ministry of Tourism, Wildlife and Heritage
MoWE Ministry of Water and Environment
MoWT Ministry of Works and Transport
iv | P a g e
MPS Ministerial Policy Statement
MTEF Medium Term Expenditure Framework
MTR Mid Term Review
NDP National Development Plan
NDR National Development Report
NPA National Planning Authority
OBT Output Based Tool
OoP Office of the President
OPM Office of the Prime Minister
PEAP Poverty Eradication Action Plan
PIP Public Investment Plan
PPP Public Private Partnership
PSFU Private Sector Foundation of Uganda
SACCO Savings and Credit Cooperative
SIP Sector Investment Plan
SMEs Small and Medium Enterprises
STA Science and Technology Agency
SWG Sector Working Group
ToR Terms of Reference
UAAU Urban Authorities Association of Uganda
UBOS Uganda Bureau of Statistics
URA Uganda Revenue Authority
v | P a g e
EXECUTIVE SUMMARY
When the NDP was conceived, its goals in the economic management area were ambitious
but deemed realistic based on past performance. However, over the last 3 years the global
economic environment has changed and multiple commodity price shocks, combined with
domestic supply side rigidities resulted in escalating inflation and macro-economic instability.
This was further exacerbated by the global downturn which dampened export demand. For
a large part of the implementation period of the NDP, corrective measures were put in place
to contain aggregate demand and inflation but this came at a cost as growth decelerated.
The Government of Uganda (GoU) has generally adopted relatively conservative fiscal policy
and this has constrained available resources to support implementation of the NDP.
Implementation of the NDP was further complicated by lack of alignment with expenditure
management systems. The annually revised medium term expenditure framework (MTEF)
has not been fully consistent with the NDP owing to the initial expenditure framework being
very ambitious and the changing macroeconomic conditions including the availability of
resources. Other expenditure management systems including the output based budgeting
system and the Chart of Accounts were not used to fully align resources with the high level
goals in the NDP. Additional challenges that have complicated the smooth implementation
of the NDP include the introduction of new spending priorities and supplementary budgets
which have distorted the allocations and reduced funding for core NDP priorities.
Sustaining growth in the high priority sectors in the NDP remains a serious challenge. In
particular, agriculture has consistently underperformed and growth in services has slowed.
With limited growth and increasing population pressures, the goal of reaching middle income
status by 2017 is looking increasingly ambitious. There has also been limited socio-
economic transformation to date demonstrated by limited growth in exports and a low level
of urbanisation. There are encouraging signs of growth in the information, communications
and technology (ICT) sector and some good progress in roads, transport and financial
services. However, many core projects have been delayed as they are not “investment
ready”. Whilst GoU has and is taking action to make it easier to do business in Uganda,
there is much to be done to enhance competitiveness, and in some areas the cost of doing
business has increased.
A critical implementation challenge for the NDP is financing. Domestic resource mobilisation
has stagnated over the NDP implementation period, expected efficiency savings have not
vi | P a g e
been realised, donor support has reduced and progress on developing innovative financing
instruments has been slow. Many projects that were expected to be implemented through
Public Private Partnership (PPP) arrangements have not materialised as envisaged, partly
due to lack of progress on the regulatory framework governing PPPs.
For the remainder of this NDP, it is recommended that the Ministry of Finance, Planning and
Economic Development (MoFPED) works with the Bank of Uganda (BoU) and the National
Planning Authority (NPA) to agree what additional measures need to be addressed to justify
expected higher levels of spending to support NDP implementation. These should focus on
some of the following areas:
A strategy to improve domestic resource mobilisation;
Greater rigour in public expenditure management and enhanced budget discipline at all
levels of government to enhance budget credibility;
Demonstrated improvements in absorptive capacity in critical sectors - this will require
decisive action to improve procurement and skills development to strengthen technical
and financial management of large projects;
More rigorous procedures to appraise projects to ensure that priority projects in the NDP
are “investment ready”;
Robust financing strategies for existing and new projects which appraise the costs and
benefits of alternative financing strategies including crowding out effects (if financed
through higher domestic borrowing).
The budget preparation process should focus more explicitly on aligning resources to
support NDP implementation. In particular, the budget process should be strategically
aligned and guided by the NDP. For the remaining period of the NDP, the Budget
Framework Paper should be shaped to deliver more against agreed critical NDP priorities.
All priority projects included in the Public Investment Plan (PIP) should be “investment
ready” and derived from the NDP. Action is needed to improve budget credibility,
transparency and public financial management – this should build on proposals already
included in the draft Public Finance Bill. There is a need to expedite the establishment of a
“Contingencies Fund” to enhance budget discipline. This will improve transparency, control
spending and should halt the introduction of supplementary budgets which undermine
budget credibility.
vii | P a g e
Recent debt sustainability suggests that there is still significant room for prudent borrowing
for productive investments. The government is already taking steps in this direction and is
preparing to issue long-term bonds to finance its development agenda. However, this
approach has to be implemented without compromising debt sustainability. Debt levels and
key ratios must be monitored carefully.
There is an urgent need to fast track action to improve domestic resource mobilisation to
finance the full range of priorities included in the NDP. This is particularly important given
budget support and direct donor financing of government expenditure is declining. A
strategy to expand the tax base should include measures to make it easier to start up and
run “compliant” businesses and to encourage formalisation. Immediate areas for action
include: (i) a continued push to streamline and improve access to business registration
services including systems covering the informal sector; (ii) streamlining tax exemptions
including a clearer set of principles to guide exemptions which should focus on maximising
tax collection and minimising abuse of the tax system. In addition, greater attention could be
given to enhancing the collection of non-tax revenues by Ministries, Departments and
Agencies (MDAs).
Many of the above actions would also help to strengthen preparation and implementation of
the next NDP. More specifically, greater attention should be placed on aligning sector
investment plans and district development plans with the next NDP. This should be an
iterative two way process which creates space for some adjustment and refinement in the
course of NDP implementation, whilst keeping the major development project priorities
intact. In addition, action should be agreed up front on how to align better expenditure
management systems (e.g. budget preparation process, output based budgeting, chart of
accounts, performance measures included in Ministerial Policy Statements) with the new
NDP to enhance accountability and to strengthen an “all of government” focus on a set of
key results and performance measures.
In addition to these findings, the report includes the key points from six reports that were
commissioned separately alongside the core mid-term review to assess the degree to which
cross-cutting issues have been addressed during NDP implementation. The cross-cutting
reports identify a number of issues that have implications for the management of the
economy during NDP implementation. For example, weak governance has been linked to
poor financial management, including the persistence of supplementary budgets. The
environment reports states that the potential negative environmental impacts of oil are being
viii | P a g e
considered by environmental impact assessments. In terms of water, pollution has
increased the cost of water for urban areas, and the destruction of wetlands has been linked
to a shortage of water in Kampala. It is reported that gender is not adequately considered in
certain GoU activities, for example, in agriculture where many activities do not optimally
benefit women. This serves to restrict the contribution of women to the economic growth.
To address these and other issues, the cross-cutting reports identify a number of
recommendations. These include increasing the autonomy and amount of information
available to the legislature in relation to the budget process; improving the financing for
environment related activities by establishing an environment fund and establishing PPPs for
environment services payment systems; and, ensuring key services such as agricultural
credit are specifically tailored to the needs of female and male users.
1 | P a g e
1 INTRODUCTION
1.1 Background
The NDP 2010/11-2014/15, which is the first of six plans that comprise the Vision 2040,
builds on the successes of the last two decades. Growth during the 2000’s averaged 7 per
cent which was higher than many other Sub-Saharan African economies. Per capita income
growth averaged 4 per cent over the last 20 years. Poverty reduction was at the heart of
successive Poverty Eradication Action Plans (PEAPs), the predecessors to the NDP. These
have generated impressive results with the poverty headcount falling from 56.4 per cent in
1992/3 to 24.5 per cent in 2009/10. Over much of this period Uganda combined prudent
economic management with high levels of growth. Until very recently inflation had been
successfully contained at single digit levels. All this suggests that many elements of the
government’s approach to growth and development has been working well.
The NDP maintains a strong focus on sustaining progress in areas such as health, education
and access to water. However, this NDP focuses strategically on action required to support
economic diversification and modernisation of the economy. It aims to support export led
growth with a focus on value addition and transformation of agriculture. It recognises the
contribution of emerging sectors such as tourism, oil and mining which can potentially spur
growth. The NDP anticipates the need to put the necessary regulatory frameworks and
institutions in place, especially with respect to development of the oil industry. The NDP
recognizes the need to have a diversified economy to circumvent the “Dutch disease
syndrome” associated with economies endowed with natural resources such as oil.
A key objective of this NDP is to enhance competitiveness through strategic investments in
infrastructure and action to raise productivity. The agenda presented in the NDP is broader
than previous frameworks such as the PEAP and includes many challenging reforms to be
implemented simultaneously, e.g. improvements in skills, action to address the full range of
supply side constraints and improved efficiency in the public sector. All of these areas will
take time to address and many may spill over into subsequent planning frameworks. Whilst
the private sector is vibrant and growing it is still small and largely comprises micro, small
and medium sized enterprises (SMEs). Many SMEs need to upgrade skills, knowledge and
gain access to new technology and finance to modernise. This level of transformation will
2 | P a g e
take more than a five year period. As the June 2013 Budget speech states “The Journey
Continues towards Socio-Economic Transformation for Uganda”.
When reviewing progress on NDP implementation it is useful to consider whether, and how,
the current NDP is helping to achieve broad based inclusive growth as well as social
economic transformation. Infrastructure development is critical but it may not be enough to
achieve the step change required in key sectors, such as agriculture, which touch on so
many Ugandans lives. What is evident is that these challenges cannot be overcome by the
government alone. The government must embrace the “National” element of the NDP. It
needs to focus on supporting innovation, new ways of working and mind-set change. It
should proactively engage the general population and the private sector so that together,
these ambitious goals can be realised.
The NDP recognises that the core foundation for growth is macro-economic stability. The
NDP macro-economic strategy aims to “maintain a balance between macroeconomic
stability, acceleration of growth and continued progress towards achievement of social
development goals”. It presumes that greater government efficiency and growth will
generate new resources that can be invested in infrastructure which will help improve the
performance of productive sectors.
1.2 Context
Uganda has an established history of national plans designed to improve the lives of people
living in poverty. The PEAP started in 1997 and was revised in 2000 and 2003. It predates
the World Bank sponsored Poverty Reduction Strategy Papers which were implemented
across Africa. The PEAP helped to build national consensus by embracing participation and
providing a strategic framework for the Government of Uganda (GoU) to work with its
development partners who provided significant funding for PEAP implementation. The
PEAP contributed to sustained growth in gross domestic product (GDP), reduced
dependency on donors and increased confidence areas such as economic management.
Headcount poverty reduced, but the target of reducing poverty to 10 per cent by 2017 was
not seen as achievable based on the status quo. A national evaluation of the PEAP
identified a number of constraints to human and economic development in Uganda as well
as increasing evidence of corruption and weak accountability. It was in this context that the
first NDP was launched in 2010.
3 | P a g e
Two major conceptual differences distinguish the NDP from its PEAP predecessor; the NDP
places much greater emphasis on the:
Need for economic growth to create jobs that generate additional employment
opportunities for the population, increasing per capita income and providing the financial
resources needed to continue to fund the pro-poor social policies;
Emulation of the successes enjoyed by many East Asian economies where the state
adopted a strong central planning mandate, while at the same time recognising the role
of the private sector as the engine of growth.
The NDP economic strategy seeks to support improved productivity in the agricultural sector
and anticipates that the workforce, released through productivity gains, would be absorbed
by newer, higher value, export focused sectors of the economy. This transformation would
be led by the private sector. Continued macroeconomic stability is identified as critical to
providing an appropriate environment within which private sector development can flourish.
The main sources of economic growth were expected to come from the 8 ‘primary growth
sectors’ which are agricultural development, forestry, tourism, mining, oil and gas,
manufacturing, information and communications technology (ICT) and housing development.
The NDP identifies the need for significant improvements in complementary sectors of the
economy; most notably energy, water, transport and financial services. The Plan outlines
the need for more trained professionals and better quality infrastructure to increase the
potential for Uganda’s health and education systems to boost Uganda’s human capital and
to create a workforce that is well equipped to support economic development. Special
attention is afforded to tackling high levels of population growth, gender inequality and the
corroding impact of HIV/AIDS on society. The NDP acknowledges that a key constraint to
further economic development is the performance of “enabling sectors”, including the public
sector. It outlines improvements required in public sector administration and management to
address criticism in the previous national evaluation of the PEAP.
1.3 Study approach / methodology
It was agreed as part of the inception report that the Economic Management thematic report
will cover the following review questions:
EM1 Are we on track to achieve the macro-economic objectives / targets articulated in the NDP?
EM2 How well have macro policy instruments been used to achieve economic stability and
4 | P a g e
growth?
EM3 To what extent have public expenditure and related accountability systems changed to
ensure alignment of budgets, spending and financial reporting with the NDP objectives
EM4 How has the NDP influenced macro-economic strategy and related reforms in Uganda?
EM5 What progress has there been on unlocking the key economic constraints to growth?
EM6 How has NDP implementation so far contributed to improvements in productivity, private
sector development and competitiveness?
EM7 To what extent is deregulation taking place and how well is this facilitating private sector
growth and competitiveness?
EM8 To what extent and how have additional private sector funds been harness to finance NDP
priorities?
EM9 From an EM perspective, what can be done to improve the next version of the NDP?
EM10 To what extent is the NDP an effective mechanism for ensuring that economic growth does
not have a detrimental impact on the environment?
The overall approach to the mid-term review has included:
• A three week inception period to hold introductory meetings, to collect and review
background documentation, to refine and agree the review questions, and to populate
review matrices showing how evidence would be collected and analysed;
• Discussion forums with representatives of 13 sectors, the private sector, civil society
organisations (CSOs) and development partners;
• A series of key informant meetings in each thematic area, focused on the review
questions;
• Supplementary analysis of data and collation of documented evidence;
• Review of 10 relevant research reports of the Economic Policy Research Centre
produced over the past 2 to 3 years;
• Assessment of the national development planning experiences in the four comparator
countries mentioned in the NDP itself – Kenya, Ghana, Malaysia and South Korea;
• Visits to 12 districts / municipalities to obtain data and opinion surrounding NDP
implementation at local government level;
• Two meetings with a Technical Committee to present and get feedback on progress;
• Internal meetings to peer review the quality and robustness of analysis and
interpretation;
• Preparation of the zero draft thematic reports;
5 | P a g e
• Presentation of draft thematic findings and recommendations to the extended
management team of the NPA;
• Conduct of meetings with the NPA review manager to obtain and incorporate verbal
comments into the first draft thematic reports;
• Presentation of updated drafts reports to the Ministry of Finance, Planning and Economic
Development (MoFPED), the Extended NPA Board and the committee of Permanent
Secretaries chaired by the Cabinet Secretary;
• Incorporation of comments on the updated draft reports.
1.4 Organisation of the report
This Economic Management thematic report is structured as follows.
• Section 2 reviews macro-economic performance and policy and assesses progress on
implementation of the NDP macro-economic strategy;
• Section 3 looks at the alignment of Public Expenditure Management with the NDP;
• Section 4 reviews the extent to which NDP implementation is supporting and promoting
economic transformation with a focus on private sector development and action to
improve competitiveness;
• Section 5 assesses the assumptions underpinning the NDP financing strategy and
progress on mobilising new finance for the NDP;
• Section 6 looks at cross-cutting issues which were commissioned as separate studies;
• Section 7 summarises the key findings and policy implications.
6 | P a g e
2 MACROECONOMIC POLICY AND PERFORMANCE
2.1 Overview
The macroeconomic policy stance pursued over the last 20 years has delivered economic
growth and stability. The period 1990-2010 can be divided into two distinctive growth
episodes. The 1990 to 1999 phase was characterised by sustained positive growth rates far
above the sub-Saharan average. The Uganda Bureau of Statistics (UBOS) estimates trend
growth over this period at about 6.8 percent per year with all sectors of the economy
growing relatively fast during the period 1990-1999. This high growth rate was partly
explained by the recovery process where the country was growing from a low base.
Similarly, the period 2000-2008 was very impressive. For example, estimates by UBOS
show that average GDP growth rate (at factor prices) for the five years (2003/04-2007/08)
was as high as 7.9 per cent, with the economy posting a growth rate of 8.9 per cent in
2007/08. However, the economy slowed to 6 percent in real terms in 2008 due to the turmoil
in the world economy and regional instability. Between the period 2009 and 2010, growth
was hit further by a combination of internal and external shocks.
In light of past performance, the NDP strived to achieve the objective of sustaining high
levels of growth whilst at the same time maintaining macroeconomic stability. This section
takes stock of progress against macro-economic objectives and targets articulated in the
NDP. It cross checks the assumptions made when formulating these targets and assesses
which have held true. It reviews the extent to which macro-economic policy over the
implementation period has balanced the NDP’s goals of macro-economic stability and
growth.
2.2 Macro-economic performance and review of assumptions
Implementation of the NDP during the first two years was characterised by an unstable
macro-economic environment which meant that many of the key assumptions underpinning
the NDP did not hold true over the period. In particular, the growth rate realised in 2011/12
was much lower than projected, inflation increased significantly in 2011 due to a combination
of shocks. In response there was a significant tightening of monetary policy through
increased interest rates. Fiscal policy was tighter than the NDP anticipated in 2011/12. This
was due to weak global economic conditions and related uncertainty about global economic
7 | P a g e
prospects, high domestic interest rates, and slow implementation of key NDP investment
projects. Given this macro-economic context it became increasingly difficult to deliver
resources in line with NDP expectations. In addition to tight monetary policy, structural
rigidities within the banking sector have kept interest rates high despite recent easing of
monetary policy. This combination of shocks and policy choices limited growth and private
sector development over the period under review.
The NDP was underpinned with an average real growth rate of 7.2 percent ranging from 6.7
percent in 2010/11 to 7.5 percent in 2014/15 (Table 1). This high growth rate was based on
two assumptions: (i) it was expected that there would be recovery in agriculture growth with
the sector growing at 5.6 percent over the period; (ii) growth in the industrial sector would be
sustained between 6 and 7 percent annually and; (iii) key binding constraints including the
reduction in the cost of energy and transport would have an impact especially on the
manufacturing sector. However, the growth outcome for the first 2 years of the
implementation fell short of expectations. Real growth in 2011/12 decelerated to 3.4 percent
compared to the 7 percent that anticipated in the NDP. For 2012/13 it is now projected that
growth will be about 4.3 percent compared to the 7.3 percent in the NDP.
There are various factors explaining why real growth has decelerated over the past two
years. The first is spill-over effects due to the global economic downturn which resulted in
deteriorating terms of trade as commodity prices declined while fuel prices, a key input for
most sectors, continued to increase. The second factor was slow implementation of NDP
projects that aimed to unlock the key binding constraints to growth. The third factor was the
prolonged drought which had an impact on agriculture production—a key sector where
growth was expected to increase 2010-15.
8 | P a g e
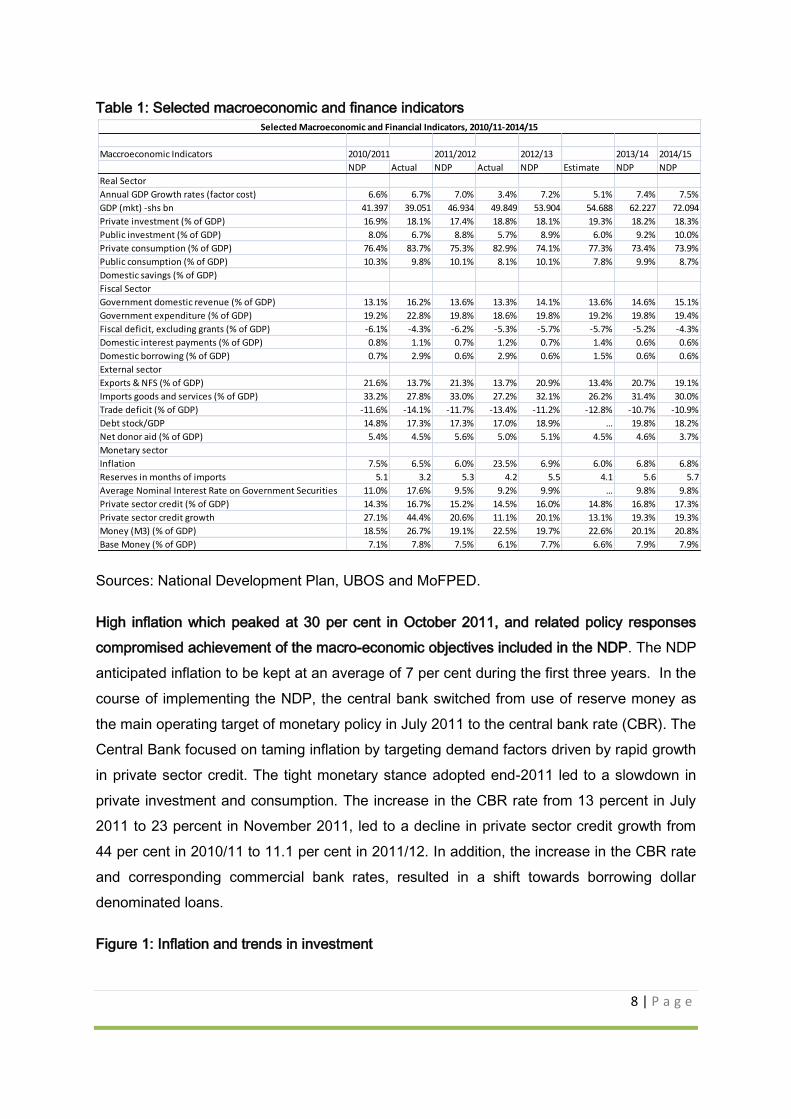
Table 1: Selected macroeconomic and finance indicators
Sources: National Development Plan, UBOS and MoFPED.
High inflation which peaked at 30 per cent in October 2011, and related policy responses
compromised achievement of the macro-economic objectives included in the NDP. The NDP
anticipated inflation to be kept at an average of 7 per cent during the first three years. In the
course of implementing the NDP, the central bank switched from use of reserve money as
the main operating target of monetary policy in July 2011 to the central bank rate (CBR). The
Central Bank focused on taming inflation by targeting demand factors driven by rapid growth
in private sector credit. The tight monetary stance adopted end-2011 led to a slowdown in
private investment and consumption. The increase in the CBR rate from 13 percent in July
2011 to 23 percent in November 2011, led to a decline in private sector credit growth from
44 per cent in 2010/11 to 11.1 per cent in 2011/12. In addition, the increase in the CBR rate
and corresponding commercial bank rates, resulted in a shift towards borrowing dollar
denominated loans.
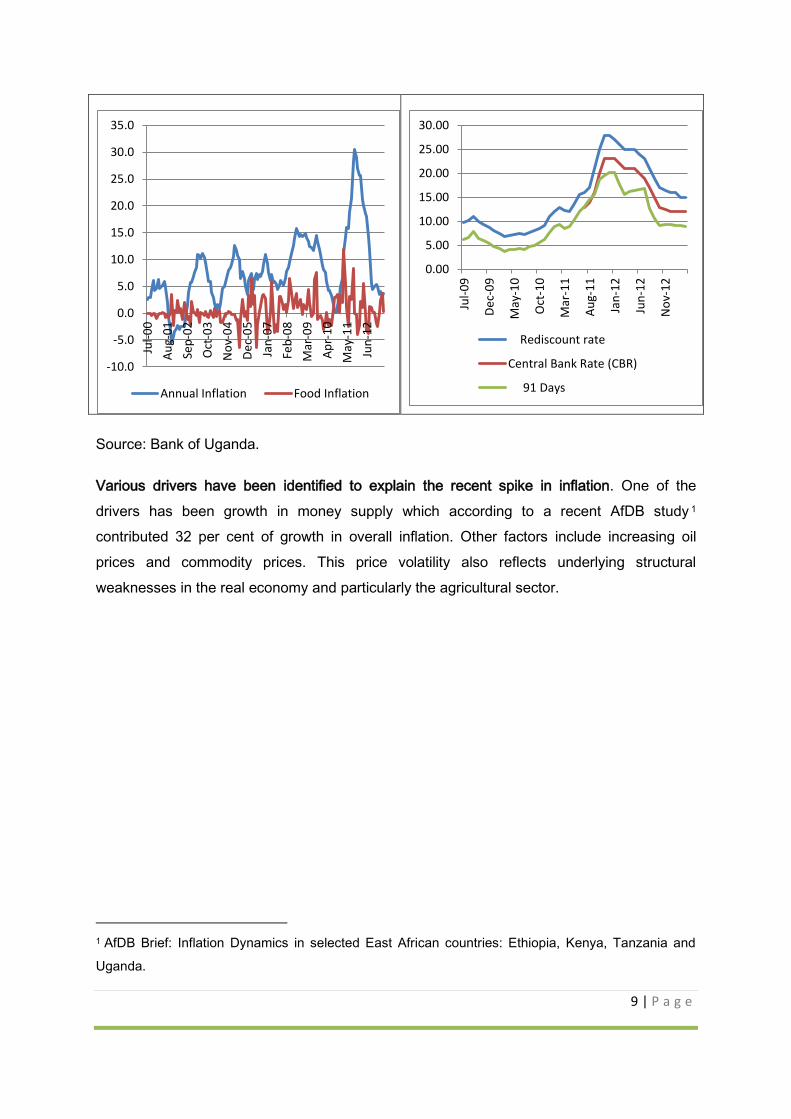
Figure 1: Inflation and trends in investment
Maccroeconomic Indicators 2010/2011 2011/2012 2012/13 2013/14 2014/15
NDP Actual NDP Actual NDP Estimate NDP NDP
Real Sector
Annual GDP Growth rates (factor cost) 6.6% 6.7% 7.0% 3.4% 7.2% 5.1% 7.4% 7.5%
GDP (mkt) -shs bn 41.397 39.051 46.934 49.849 53.904 54.688 62.227 72.094
Private investment (% of GDP) 16.9% 18.1% 17.4% 18.8% 18.1% 19.3% 18.2% 18.3%
Public investment (% of GDP) 8.0% 6.7% 8.8% 5.7% 8.9% 6.0% 9.2% 10.0%
Private consumption (% of GDP) 76.4% 83.7% 75.3% 82.9% 74.1% 77.3% 73.4% 73.9%
Public consumption (% of GDP) 10.3% 9.8% 10.1% 8.1% 10.1% 7.8% 9.9% 8.7%
Domestic savings (% of GDP)
Fiscal Sector
Government domestic revenue (% of GDP) 13.1% 16.2% 13.6% 13.3% 14.1% 13.6% 14.6% 15.1%
Government expenditure (% of GDP) 19.2% 22.8% 19.8% 18.6% 19.8% 19.2% 19.8% 19.4%
Fiscal deficit, excluding grants (% of GDP) -6.1% -4.3% -6.2% -5.3% -5.7% -5.7% -5.2% -4.3%
Domestic interest payments (% of GDP) 0.8% 1.1% 0.7% 1.2% 0.7% 1.4% 0.6% 0.6%
Domestic borrowing (% of GDP) 0.7% 2.9% 0.6% 2.9% 0.6% 1.5% 0.6% 0.6%
External sector
Exports & NFS (% of GDP) 21.6% 13.7% 21.3% 13.7% 20.9% 13.4% 20.7% 19.1%
Imports goods and services (% of GDP) 33.2% 27.8% 33.0% 27.2% 32.1% 26.2% 31.4% 30.0%
Trade deficit (% of GDP) -11.6% -14.1% -11.7% -13.4% -11.2% -12.8% -10.7% -10.9%
Debt stock/GDP 14.8% 17.3% 17.3% 17.0% 18.9% … 19.8% 18.2%
Net donor aid (% of GDP) 5.4% 4.5% 5.6% 5.0% 5.1% 4.5% 4.6% 3.7%
Monetary sector
Inflation 7.5% 6.5% 6.0% 23.5% 6.9% 6.0% 6.8% 6.8%
Reserves in months of imports 5.1 3.2 5.3 4.2 5.5 4.1 5.6 5.7
Average Nominal Interest Rate on Government Securities 11.0% 17.6% 9.5% 9.2% 9.9% … 9.8% 9.8%
Private sector credit (% of GDP) 14.3% 16.7% 15.2% 14.5% 16.0% 14.8% 16.8% 17.3%
Private sector credit growth 27.1% 44.4% 20.6% 11.1% 20.1% 13.1% 19.3% 19.3%
Money (M3) (% of GDP) 18.5% 26.7% 19.1% 22.5% 19.7% 22.6% 20.1% 20.8%
Base Money (% of GDP) 7.1% 7.8% 7.5% 6.1% 7.7% 6.6% 7.9% 7.9%
Selected Macroeconomic and Financial Indicators, 2010/11-2014/15
9 | P a g e
Source: Bank of Uganda.
Various drivers have been identified to explain the recent spike in inflation. One of the
drivers has been growth in money supply which according to a recent AfDB study 1
contributed 32 per cent of growth in overall inflation. Other factors include increasing oil
prices and commodity prices. This price volatility also reflects underlying structural
weaknesses in the real economy and particularly the agricultural sector.
1 AfDB Brief: Inflation Dynamics in selected East African countries: Ethiopia, Kenya, Tanzania and
Uganda.
-10.0
-5.0
0.0
5.0
10.0
15.0
20.0
25.0
30.0
35.0
Jul-
00
Au
g-0
1
Sep
-02
Oct
-03
No
v-0
4
De
c-0
5
Jan
-07
Feb
-08
Mar
-09
Ap
r-1
0
May
-11
Jun
-12
Annual Inflation Food Inflation
0.00
5.00
10.00
15.00
20.00
25.00
30.00
Jul-
09
De
c-0
9
May
-10
Oct
-10
Mar
-11
Au
g-1
1
Jan
-12
Jun
-12
No
v-1
2
Rediscount rate
Central Bank Rate (CBR)
91 Days
10 | P a g e
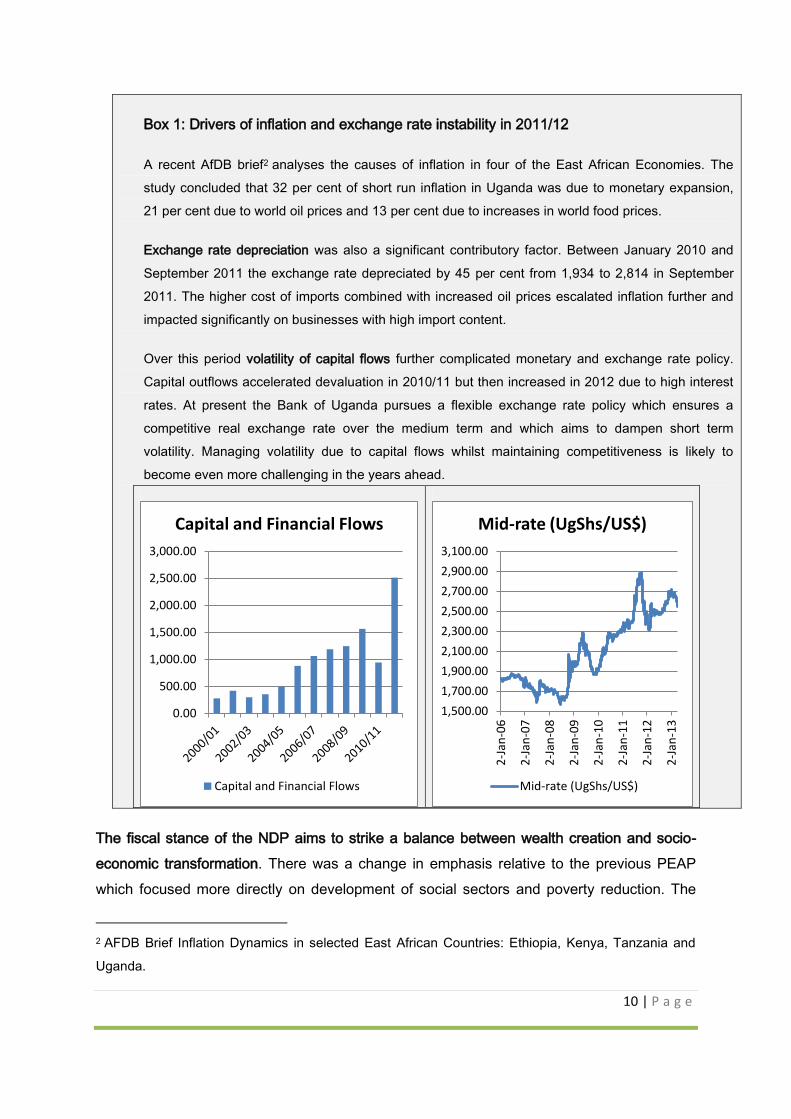
Box 1: Drivers of inflation and exchange rate instability in 2011/12
A recent AfDB brief2 analyses the causes of inflation in four of the East African Economies. The
study concluded that 32 per cent of short run inflation in Uganda was due to monetary expansion,
21 per cent due to world oil prices and 13 per cent due to increases in world food prices.
Exchange rate depreciation was also a significant contributory factor. Between January 2010 and
September 2011 the exchange rate depreciated by 45 per cent from 1,934 to 2,814 in September
2011. The higher cost of imports combined with increased oil prices escalated inflation further and
impacted significantly on businesses with high import content.
Over this period volatility of capital flows further complicated monetary and exchange rate policy.
Capital outflows accelerated devaluation in 2010/11 but then increased in 2012 due to high interest
rates. At present the Bank of Uganda pursues a flexible exchange rate policy which ensures a
competitive real exchange rate over the medium term and which aims to dampen short term
volatility. Managing volatility due to capital flows whilst maintaining competitiveness is likely to
become even more challenging in the years ahead.
The fiscal stance of the NDP aims to strike a balance between wealth creation and socio-
economic transformation. There was a change in emphasis relative to the previous PEAP
which focused more directly on development of social sectors and poverty reduction. The
2 AFDB Brief Inflation Dynamics in selected East African Countries: Ethiopia, Kenya, Tanzania and
Uganda.
0.00
500.00
1,000.00
1,500.00
2,000.00
2,500.00
3,000.00
Capital and Financial Flows
Capital and Financial Flows
1,500.00
1,700.00
1,900.00
2,100.00
2,300.00
2,500.00
2,700.00
2,900.00
3,100.00
2-J
an-0
6
2-J
an-0
7
2-J
an-0
8
2-J
an-0
9
2-J
an-1
0
2-J
an-1
1
2-J
an-1
2
2-J
an-1
3
Mid-rate (UgShs/US$)
Mid-rate (UgShs/US$)
11 | P a g e
NDP’s goal is social economic transformation with a focus on unlocking the binding
constraints to wealth creation, especially in the energy and transport sectors. This is
combined with continued support to the social sectors but with a strong focus on achieving
efficiency gains in the public sector to release resources to fund higher levels of public
investment.
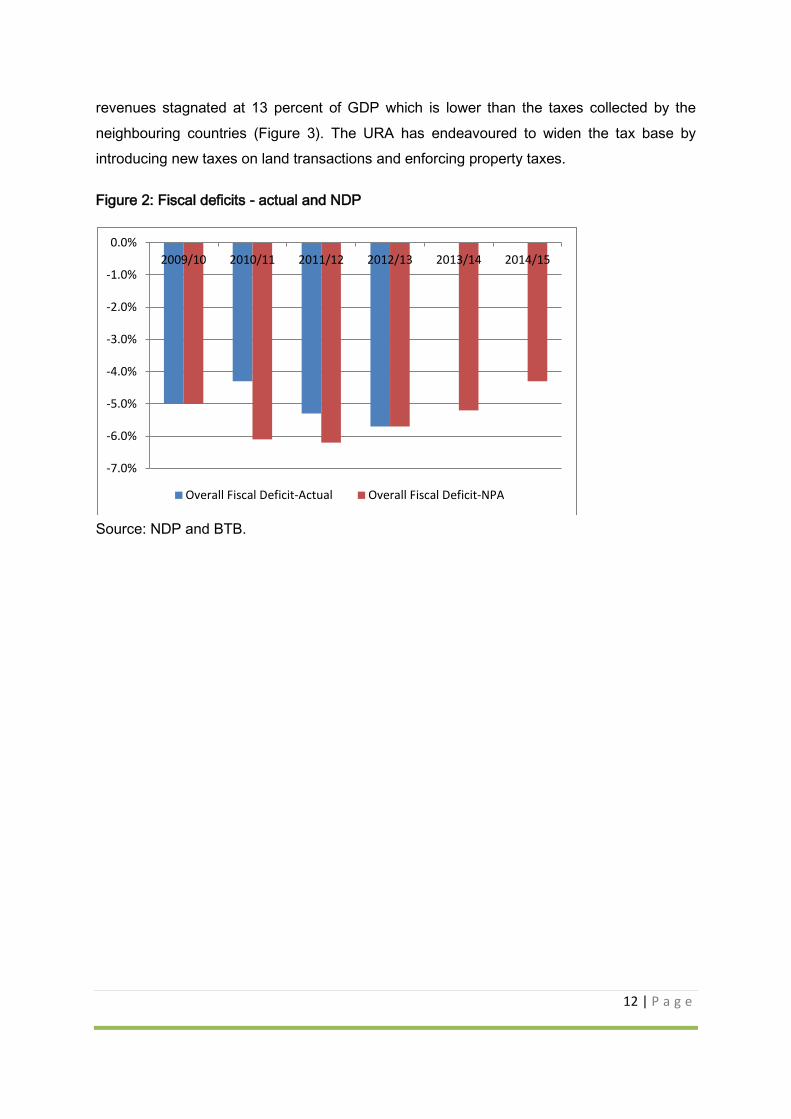
The fiscal stance has also been guided by Uganda’s ambition to participate in the East
African Monetary Union which targets the fiscal deficit of member countries at 5 per cent or
less of GDP. This puts limitations on public investment and spending over the medium term.
As shown in Figure 2, the fiscal deficit for the first year of the implementation of the NDP
2010/11 was on target at 6.3 percent of GDP (compared to 6.1 percent in the NDP).
However, much of this was due to a revenue windfall (16.3 percent actual collection
compared to 13.1 percent of GDP in the NDP) generated by capital gains tax realised from
oil transactions. The first year of NDP implementation coincided with the global financial
crisis and spending increased to 22.8 percent of GDP compared to the 19 percent in the
NDP. This was justified as a mitigation measure through counter cyclical spending.
However, in the course of 2010/11, the implementation of the budget was compromised by
election and defence spending which reduced resources available to support NDP priority
sectors. This damaged the credibility of the budget and undermined government
commitment to implementing the NDP.
The fiscal year 2011/12 witnessed some fiscal consolidation with total spending declining to
18.6 per cent of GDP compared to 19.8 per cent envisaged in the NDP. This reduction is
partly explained by delays in the implementation of the Karuma dam, a key NDP project.
Slow implementation of this resulting from weak planning and procurement irregularities, led
to a reduction in the deficit to 5.3 percent of GDP. In 2012/13 it was recognised that fiscal
policy needed to be more expansionary to boost aggregate demand. As a result financing for
capital spending was increased. The budget targeted increased spending with a focus on
roads, rehabilitation of water ferries, investments in the standard gauge rail and construction
of the Karuma hydro-electricity dam. This was perhaps the first fiscal year where there was
a very conscious effort to align the budget with key NDP priorities.
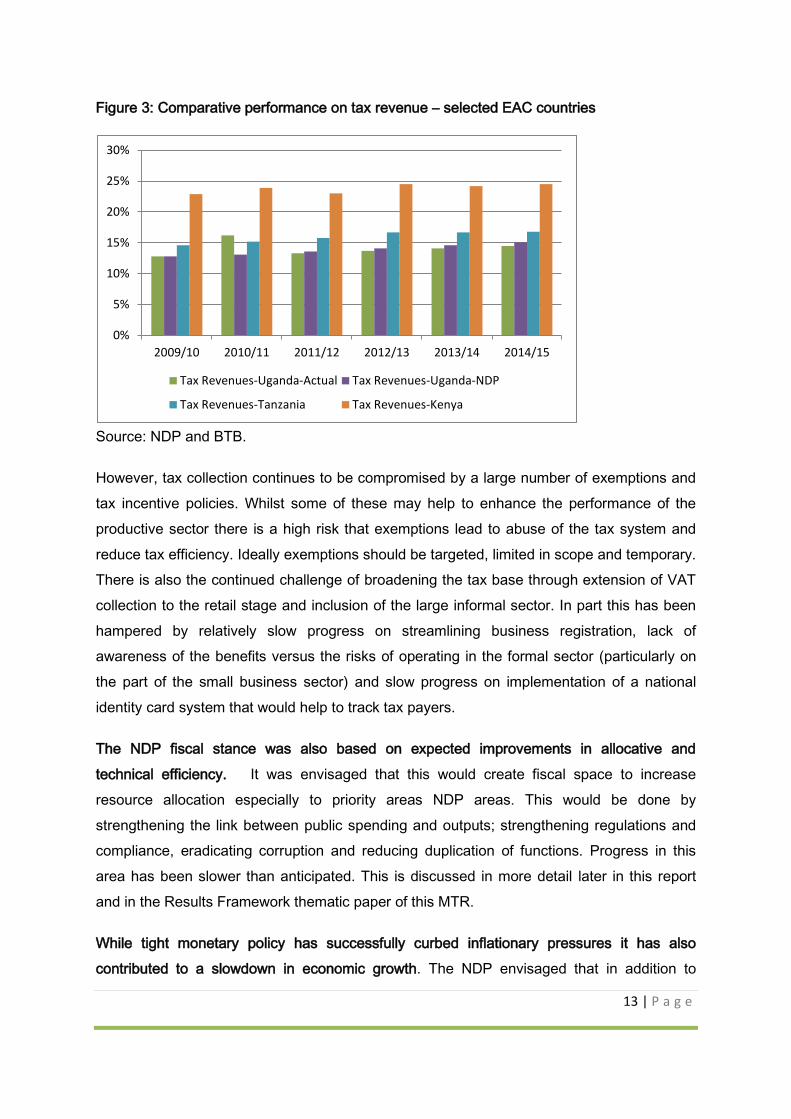
Spending ambitions have also been held back by poor performance on domestic resource
mobilisation. The NDP envisaged increasing domestic resource mobilisation effort by 0.5
percent of GDP. This would be achieved by expansion of the tax base, reforming the
structure of taxation and improving tax collection efficiency and compliance. However,
12 | P a g e
revenues stagnated at 13 percent of GDP which is lower than the taxes collected by the
neighbouring countries (Figure 3). The URA has endeavoured to widen the tax base by
introducing new taxes on land transactions and enforcing property taxes.
Figure 2: Fiscal deficits - actual and NDP
Source: NDP and BTB.
-7.0%
-6.0%
-5.0%
-4.0%
-3.0%
-2.0%
-1.0%
0.0%
2009/10 2010/11 2011/12 2012/13 2013/14 2014/15
Overall Fiscal Deficit-Actual Overall Fiscal Deficit-NPA
13 | P a g e
Figure 3: Comparative performance on tax revenue – selected EAC countries
Source: NDP and BTB.
However, tax collection continues to be compromised by a large number of exemptions and
tax incentive policies. Whilst some of these may help to enhance the performance of the
productive sector there is a high risk that exemptions lead to abuse of the tax system and
reduce tax efficiency. Ideally exemptions should be targeted, limited in scope and temporary.
There is also the continued challenge of broadening the tax base through extension of VAT
collection to the retail stage and inclusion of the large informal sector. In part this has been
hampered by relatively slow progress on streamlining business registration, lack of
awareness of the benefits versus the risks of operating in the formal sector (particularly on
the part of the small business sector) and slow progress on implementation of a national
identity card system that would help to track tax payers.
The NDP fiscal stance was also based on expected improvements in allocative and
technical efficiency. It was envisaged that this would create fiscal space to increase
resource allocation especially to priority areas NDP areas. This would be done by
strengthening the link between public spending and outputs; strengthening regulations and
compliance, eradicating corruption and reducing duplication of functions. Progress in this
area has been slower than anticipated. This is discussed in more detail later in this report
and in the Results Framework thematic paper of this MTR.
While tight monetary policy has successfully curbed inflationary pressures it has also
contributed to a slowdown in economic growth. The NDP envisaged that in addition to
0%
5%
10%
15%
20%
25%
30%
2009/10 2010/11 2011/12 2012/13 2013/14 2014/15
Tax Revenues-Uganda-Actual Tax Revenues-Uganda-NDP
Tax Revenues-Tanzania Tax Revenues-Kenya
14 | P a g e
controlling inflation within manageable levels, monetary policy would continue to support
growth especially through financial intermediation with private sector credit anticipated to
grow from 12 to 17 per cent by the end of plan period. This would be achieved by reducing
government domestic borrowing. However, the first year of implementation of the NDP was
characterised by monetary expansion which contributed to inflationary pressure. Tight
monetary policy followed to curb inflation and although CBR rates were reduced to 12 per
cent to boost growth, this has not yet been fully translated into lower commercial bank rates.
Commercial banks continue to charge high interest rates and the spread between lending
and borrowing rates is the highest in East Africa. This appears to be due to a combination of
factors including high operating costs, increases in banks financing costs due to high interest
rates over the last 2 years, an increase in non-performing assets and structural market
deficiencies within the financial system.
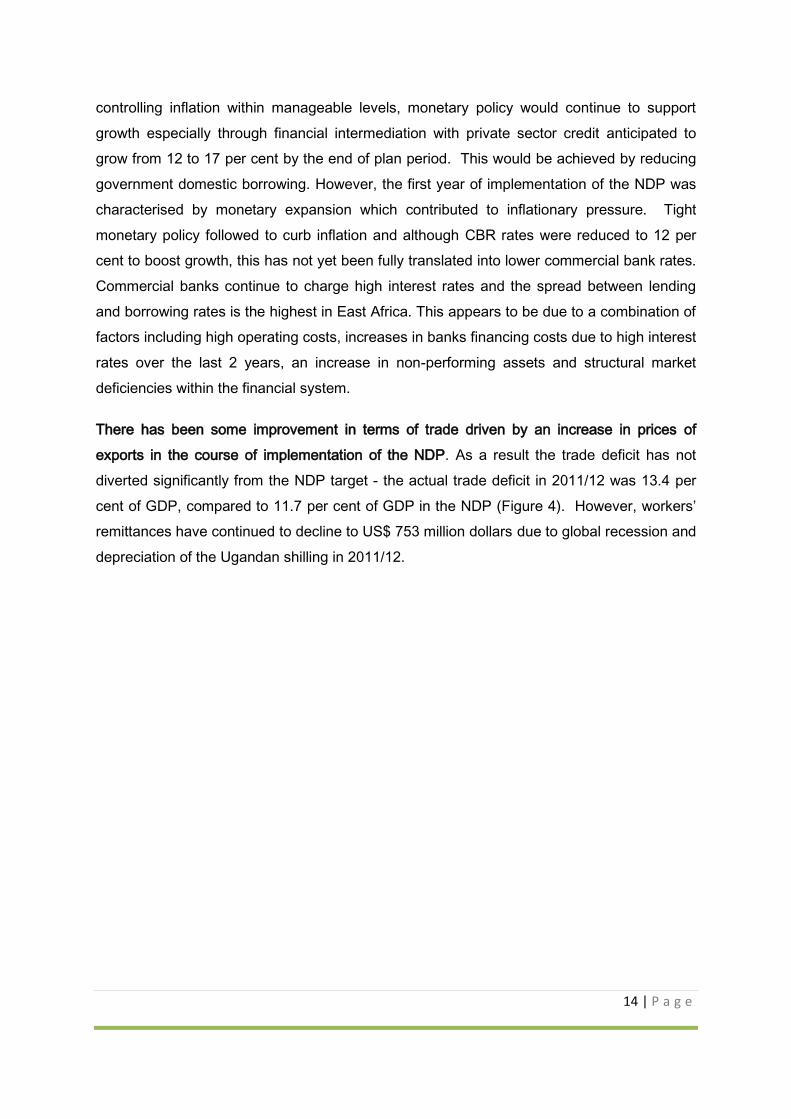
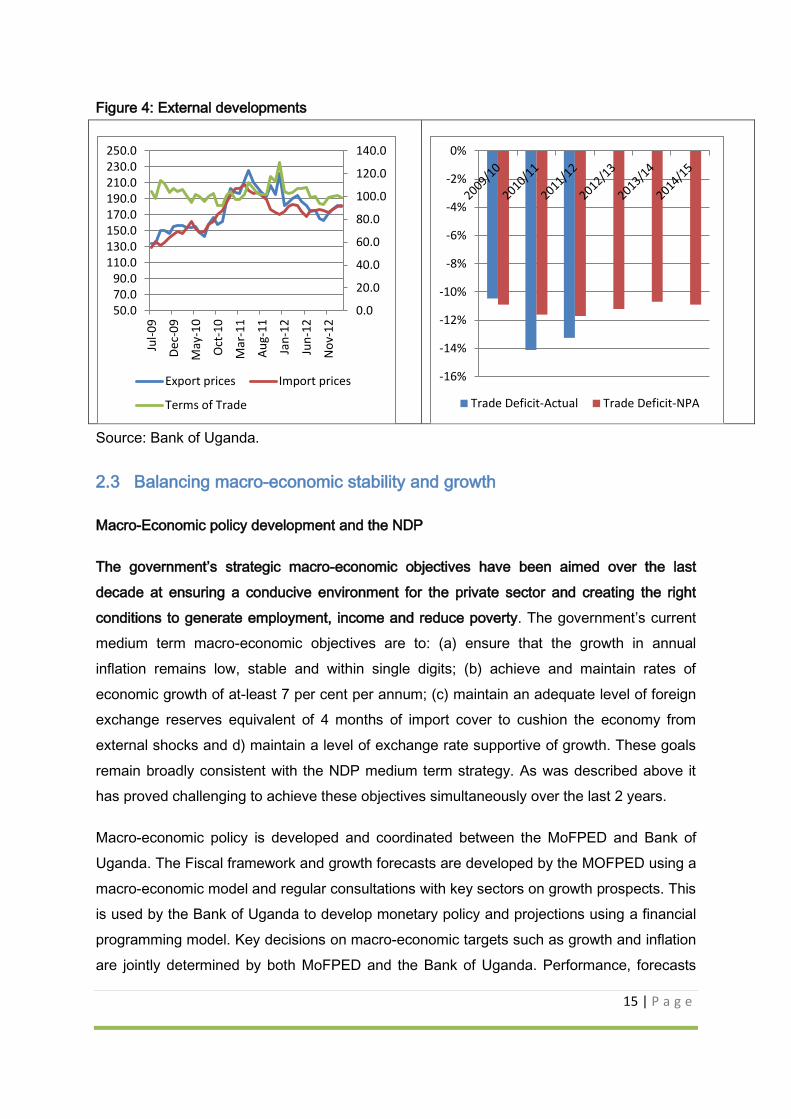
There has been some improvement in terms of trade driven by an increase in prices of
exports in the course of implementation of the NDP. As a result the trade deficit has not
diverted significantly from the NDP target - the actual trade deficit in 2011/12 was 13.4 per
cent of GDP, compared to 11.7 per cent of GDP in the NDP (Figure 4). However, workers’
remittances have continued to decline to US$ 753 million dollars due to global recession and
depreciation of the Ugandan shilling in 2011/12.
15 | P a g e
Figure 4: External developments
Source: Bank of Uganda.
2.3 Balancing macro-economic stability and growth
Macro-Economic policy development and the NDP
The government’s strategic macro-economic objectives have been aimed over the last
decade at ensuring a conducive environment for the private sector and creating the right
conditions to generate employment, income and reduce poverty. The government’s current
medium term macro-economic objectives are to: (a) ensure that the growth in annual
inflation remains low, stable and within single digits; (b) achieve and maintain rates of
economic growth of at-least 7 per cent per annum; (c) maintain an adequate level of foreign
exchange reserves equivalent of 4 months of import cover to cushion the economy from
external shocks and d) maintain a level of exchange rate supportive of growth. These goals
remain broadly consistent with the NDP medium term strategy. As was described above it
has proved challenging to achieve these objectives simultaneously over the last 2 years.
Macro-economic policy is developed and coordinated between the MoFPED and Bank of
Uganda. The Fiscal framework and growth forecasts are developed by the MOFPED using a
macro-economic model and regular consultations with key sectors on growth prospects. This
is used by the Bank of Uganda to develop monetary policy and projections using a financial
programming model. Key decisions on macro-economic targets such as growth and inflation
are jointly determined by both MoFPED and the Bank of Uganda. Performance, forecasts
0.0
20.0
40.0
60.0
80.0
100.0
120.0
140.0
50.070.090.0
110.0130.0150.0170.0190.0210.0230.0250.0
Jul-
09
De
c-0
9
May
-10
Oct
-10
Mar
-11
Au
g-1
1
Jan
-12
Jun
-12
No
v-1
2
Export prices Import prices
Terms of Trade
-16%
-14%
-12%
-10%
-8%
-6%
-4%
-2%
0%
Trade Deficit-Actual Trade Deficit-NPA
16 | P a g e
and any changes to fiscal and monetary policy are reviewed at technical and Ministerial /
Governor at least 3 times a year as part of the process of preparing the budget and in the
course of IMF programme reviews. Roles and mandates of the MoFPED and the Bank of
Uganda are laid out in the 1995 Constitution of Uganda (Article 162) and a Memorandum of
Understanding between the two organisations which articulates statutory responsibilities,
information exchange requirements and policy coordination. Terms of Reference are laid out
for each relevant committee including a high level Apex Policy Committee which is
responsible for overall coordination of policy and operational matters between the
Government and Bank at senior level (Minister of Finance and Governor Level). This
Committee is mandated to meet quarterly.
At the end of 2012 coordination processes were also introduced for senior level meetings on
a monthly basis. This was in part due to the need to develop more sophisticated instruments
to support government borrowing. This provides a solid framework for strategic coordination
of policy and discussions on policy trade-offs in response to shocks or other unforeseen
developments.
A number of external factors influence policy. The IMF assessments are critical as they are
watched closely by donors and investors and are used to judge the effectiveness of
Uganda’s macro-economic management. These reviews assess progress and shape targets
for macro-economic policy and structural reforms. The focus of structural reforms will vary
over time. For example the most recent PSI Review puts a strong emphasis on
strengthening public financial management reforms following misappropriation of donor
funds from a major project in Northern Uganda. A High Level PFM Reform Action Plan
Matrix has been developed to improve the integrity of the public expenditure management
and to promote transparency.
Other factors that shape policy making include global developments and EAC requirements.
The Protocol on the EAC Monetary Union which is currently being negotiated requires
convergence around key macro-economic indicators. This will constrain fiscal policy over the
medium term through limitations on the size of budget deficits.
Macroeconomic Implementation and the NDP
17 | P a g e
When the NDP was conceived growth had been favourable for many years and despite
global shocks macro-economic stability and growth had been sustained. The macro strategy
formulated in the NDP seemed reasonable and relevant at the time. It assumed that fiscal
policy would be slightly expansionary and resources would be allocated to support higher
growth of the productive sectors. Higher spending in the middle years would be financed
through increases in domestic revenue, modest domestic borrowing and other financing
mechanisms such as public private partnerships, external financing and new innovative
instruments (sovereign bonds for infrastructure). Monetary policy would maintain low inflation
and facilitate private sector growth and investment.
Fiscal Policy
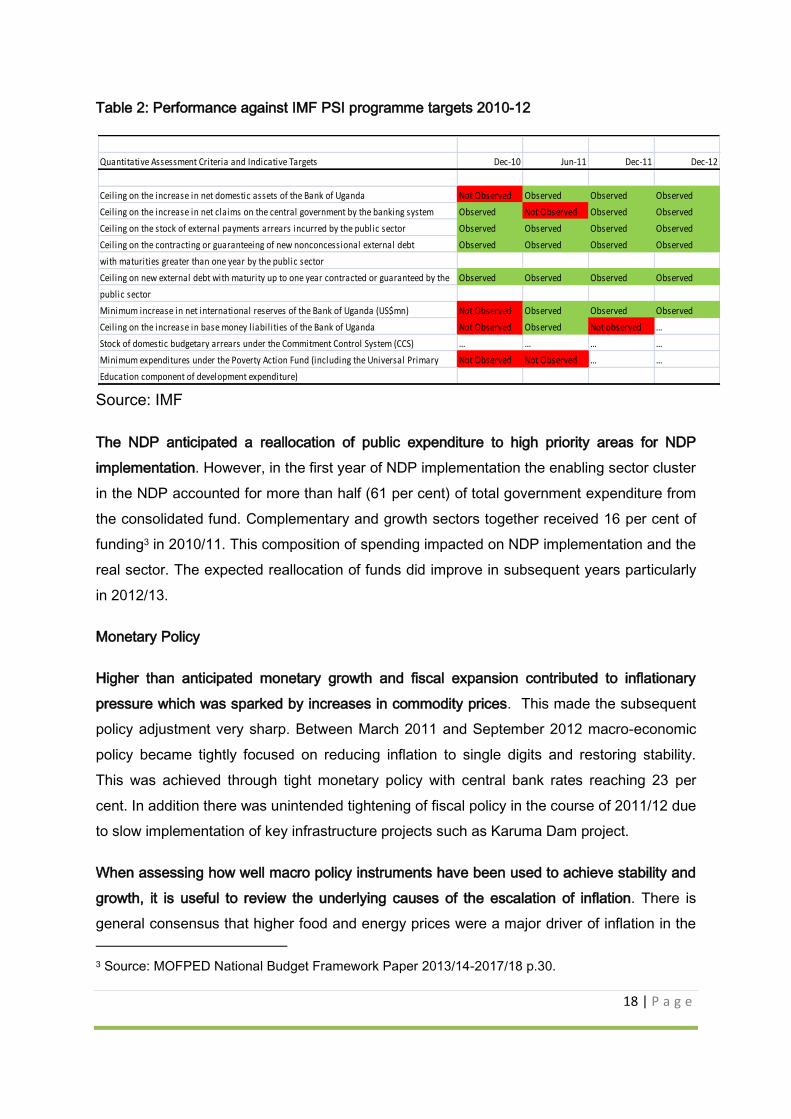
Fiscal policy stance implemented during 2010/11 was characterized by spending that was
not originally catered for in the NDP (Table 2). The fiscal stance was influenced by higher
than anticipated spending on the elections and defence. A supplementary budget was
introduced which was equivalent to 1.3 per cent of GDP for security related expenditures.
This spending, on police, security and other election-related activities, led to cuts in spending
in other sectors. It also compromised implementation of the domestically financed
development budget. As a result a number of performance targets were missed including the
floor on net international reserves and the ceiling on net domestic assets as set out under
the PSI program. In addition, base money was higher than the indicative target by 0.4 per
cent of GDP and spending related to poverty reduction was lower than planned. This higher
spending was largely financed by higher net domestic financing which compromised several
targets under the PSI program. Towards the end of the first year of NDP implementation in
June 2011, net credit to the government was breached by 0.9 per cent due to over spending
in the roads sector and higher wage and interest payments which were not planned for.
Overall, the fiscal policy stance during the period 2010-12 was not conducive to NDP
implementation. In an effort to contain the deficit in 2011/12 and to limit expensive domestic
financing, tight cash ceilings were imposed on spending. This led to a squeeze on non-wage
recurrent spending and delayed implementation of a number of development projects. The
second year of 2011/12 was characterised by relatively tight fiscal policy and tight monetary
policy to address inflation and safeguard medium-term growth prospects and poverty
reduction. The actual deficit realised was 3 per cent of GDP compared to 6 per cent planned
in the NDP. This further compressed recurrent and capital expenditure.
18 | P a g e
Table 2: Performance against IMF PSI programme targets 2010-12
Source: IMF
The NDP anticipated a reallocation of public expenditure to high priority areas for NDP
implementation. However, in the first year of NDP implementation the enabling sector cluster
in the NDP accounted for more than half (61 per cent) of total government expenditure from
the consolidated fund. Complementary and growth sectors together received 16 per cent of
funding3 in 2010/11. This composition of spending impacted on NDP implementation and the
real sector. The expected reallocation of funds did improve in subsequent years particularly
in 2012/13.
Monetary Policy
Higher than anticipated monetary growth and fiscal expansion contributed to inflationary
pressure which was sparked by increases in commodity prices. This made the subsequent
policy adjustment very sharp. Between March 2011 and September 2012 macro-economic
policy became tightly focused on reducing inflation to single digits and restoring stability.
This was achieved through tight monetary policy with central bank rates reaching 23 per
cent. In addition there was unintended tightening of fiscal policy in the course of 2011/12 due
to slow implementation of key infrastructure projects such as Karuma Dam project.
When assessing how well macro policy instruments have been used to achieve stability and
growth, it is useful to review the underlying causes of the escalation of inflation. There is
general consensus that higher food and energy prices were a major driver of inflation in the
3 Source: MOFPED National Budget Framework Paper 2013/14-2017/18 p.30.
Quantitative Assessment Criteria and Indicative Targets Dec-10 Jun-11 Dec-11 Dec-12
Ceiling on the increase in net domestic assets of the Bank of Uganda Not Observed Observed Observed Observed
Ceiling on the increase in net claims on the central government by the banking system Observed Not Observed Observed Observed
Ceiling on the stock of external payments arrears incurred by the public sector Observed Observed Observed Observed
Ceiling on the contracting or guaranteeing of new nonconcessional external debt Observed Observed Observed Observed
with maturities greater than one year by the public sector
Ceiling on new external debt with maturity up to one year contracted or guaranteed by the Observed Observed Observed Observed
public sector
Minimum increase in net international reserves of the Bank of Uganda (US$mn) Not Observed Observed Observed Observed
Ceiling on the increase in base money liabilities of the Bank of Uganda Not Observed Observed Not observed …
Stock of domestic budgetary arrears under the Commitment Control System (CCS) … … … …
Minimum expenditures under the Poverty Action Fund (including the Universal Primary Not Observed Not Observed … …
Education component of development expenditure)
19 | P a g e
course of 2011. However, what is often given less attention is the rapid growth in the money
supply (linked to growth in defence and election related spending) over this period.
Government expenditure rose to 22.8 per cent compared with NDP forecasts of 19.2 per
cent due to the aforementioned higher spending on defence and security.
Growth in private sector credit slowed in July 2011 when the Bank of Uganda introduced the
new inflation targeting lite (ITL) monetary policy framework which uses the Central Bank rate
as the operating target and inflation as the nominal anchor. This was introduced in part due
to concerns about the effectiveness of targeting base money due to increased volatility in
monetary growth. There were some reservations about introducing this new target at this
time. The general public, private sector and political leaders in Uganda have a very strong
aversion to inflation due to past experience and concerns about the detrimental impact of
high inflation on the poor, on competitiveness and longer term growth. For these reasons
there was a political consensus that bold action needed to be taken to curb inflationary
pressures. As a result the CBR progressively raised interest rates to 23 per cent which
slowed growth in credit and aggregate demand and drove down inflation. This combination
of relatively loose spending not targeted at the productive sectors, followed by tight monetary
policy during a period of instability was not an ideal setting for the NDP implementation.
The balance between rapidly reducing inflation through tight monetary policy and
maintaining growth could have been mitigated if progress had been faster on addressing
drivers of inflation from the supply side. The rapid increase of the CBR rate contributed to
the slowdown of growth during the first two years of implementing the NDP. For instance,
given that some of the inflation was driven by supply-side factors, it can be argued that more
robust action to address supply side constraints (e.g. setting up the irrigation schemes,
action to help farmers enhance productivity etc.) could help to mitigate inflationary pressure.
In practice these reforms take time and shocks often require quick decisive action. However,
given the NDP’s focus on stability and growth it is reasonable to expect that during a period
of volatility there should be very strong coordination on policy decisions being taken by the
MoFPED and BoU. It has not been possible to ascertain to what extent there were formal
high level discussions on the range of short and medium term policy options available to
tackle inflation during this difficult period.
However, what is clear is that macro-economic policy coordination procedures have
subsequently improved. Since the end of 2012 there are now monthly discussions between
the Governor of the Bank of Uganda and the Minister of Finance. This is a positive step
20 | P a g e
forward as it provides a more formal framework to review policy impact, trade-offs and
progress on overall macro-economic objectives.
2.4 Macroeconomic outlook
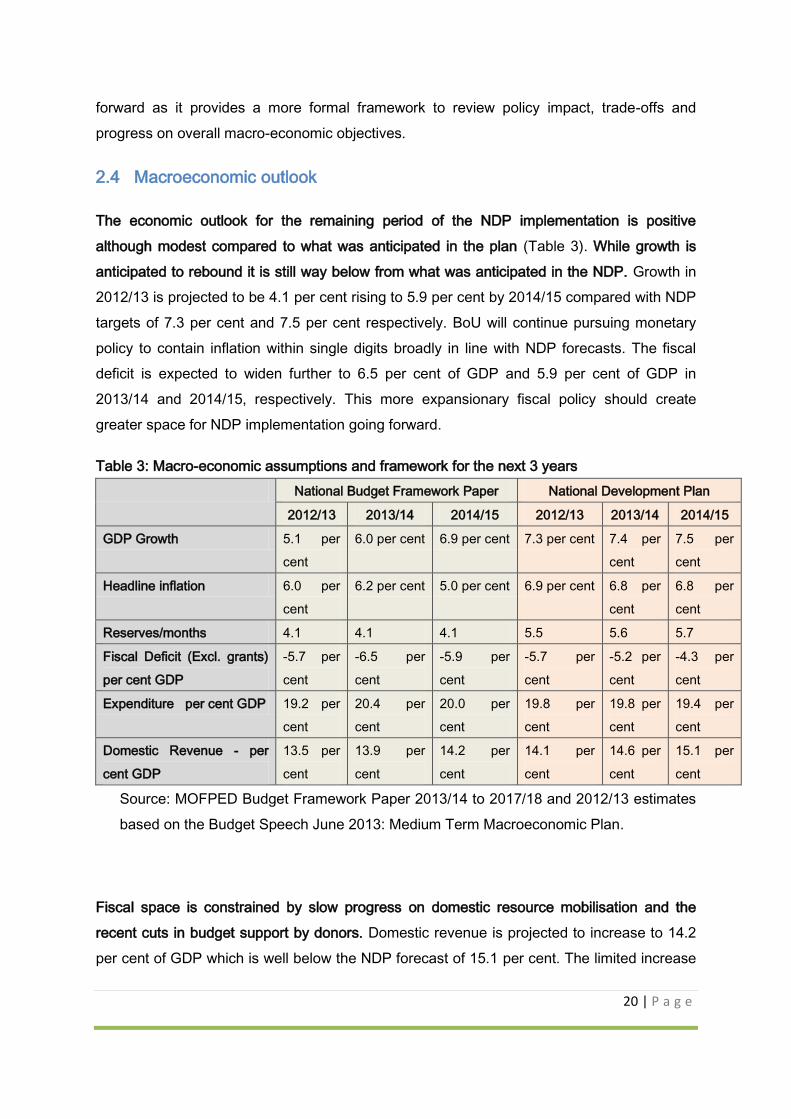
The economic outlook for the remaining period of the NDP implementation is positive
although modest compared to what was anticipated in the plan (Table 3). While growth is
anticipated to rebound it is still way below from what was anticipated in the NDP. Growth in
2012/13 is projected to be 4.1 per cent rising to 5.9 per cent by 2014/15 compared with NDP
targets of 7.3 per cent and 7.5 per cent respectively. BoU will continue pursuing monetary
policy to contain inflation within single digits broadly in line with NDP forecasts. The fiscal
deficit is expected to widen further to 6.5 per cent of GDP and 5.9 per cent of GDP in
2013/14 and 2014/15, respectively. This more expansionary fiscal policy should create
greater space for NDP implementation going forward.
Table 3: Macro-economic assumptions and framework for the next 3 years
National Budget Framework Paper National Development Plan
2012/13 2013/14 2014/15 2012/13 2013/14 2014/15
GDP Growth 5.1 per
cent
6.0 per cent 6.9 per cent 7.3 per cent 7.4 per
cent
7.5 per
cent
Headline inflation 6.0 per
cent
6.2 per cent 5.0 per cent 6.9 per cent 6.8 per
cent
6.8 per
cent
Reserves/months 4.1 4.1 4.1 5.5 5.6 5.7
Fiscal Deficit (Excl. grants)
per cent GDP
-5.7 per
cent
-6.5 per
cent
-5.9 per
cent
-5.7 per
cent
-5.2 per
cent
-4.3 per
cent
Expenditure per cent GDP 19.2 per
cent
20.4 per
cent
20.0 per
cent
19.8 per
cent
19.8 per
cent
19.4 per
cent
Domestic Revenue - per
cent GDP
13.5 per
cent
13.9 per
cent
14.2 per
cent
14.1 per
cent
14.6 per
cent
15.1 per
cent
Source: MOFPED Budget Framework Paper 2013/14 to 2017/18 and 2012/13 estimates
based on the Budget Speech June 2013: Medium Term Macroeconomic Plan.
Fiscal space is constrained by slow progress on domestic resource mobilisation and the
recent cuts in budget support by donors. Domestic revenue is projected to increase to 14.2
per cent of GDP which is well below the NDP forecast of 15.1 per cent. The limited increase
21 | P a g e
in domestic revenues is partly explained by the continuation of tax incentives that have
undermined the tax base and a large informal sector that is difficult to tax in the absence of a
credible identification system to monitor tax payers. This is also partly explained by the weak
audit systems available to URA targeting registered tax payers. Higher domestic borrowing
was required last year to minimise disruptions to service delivery and the recent budget
projections indicate that there will be greater reliance on deficit financing to support NDP
implementation. There are concerns that sustained high levels of borrowing will increase
interest rates and crowd out private sector activity. It will therefore be important to monitor
the impact of higher borrowing on private sector credit.
There are positive developments and opportunities that could help accelerate growth if given
the right stimulus. Some NDP related investments are beginning to bear fruit. Progress is
being made on implementation of roads projects and national generation capacity has
improved from 425MW in 2010 to 778MW in 2011/124. Kenyan elections went smoothly and
this has improved the general outlook for the EAC in the coming years. Oil companies have
reached agreement with Government on constructing an oil refinery and pipeline which
enhances medium to longer term economic prospects. In addition Uganda’s debt position is
sound. A debt sustainability and risk analysis carried out in 2012 concluded that Uganda’s
debt is below solvency ratios. This creates space for higher domestic/external borrowing
over the medium term.
3 NDP AND ALIGNMENT OF PUBLIC EXPENDITURE MANAGEMENT
SYSTEMS
3.1 Overview of public expenditure management systems
Before the implementation of the NDP, the government relied on a number of systems to
formulate and execute its budget which included the Medium Term Expenditure Framework,
Output-Oriented Budget Tool, Government Chart of Accounts and the Integrated Financial
Management Information System (IFMIS). For the budgetary process, this was
complemented by the Sector Wide Approach with Sector Working Groups (SWGs). Planning
processes are supported by Sector Investment Plans (SIP), District Development Plans
(DDPs), Sub-County and District and Sector Work-Plans.
4 See MOFPED national budget framework paper 2013/14-2017/18 p.26.
22 | P a g e
Despite the presence of all these instruments and tools, there is a challenge that they are
not all fully aligned to the NDP which undermines implementation. When the NDP was being
drafted, it was recognised that modification to (or in the use of) existing systems would be
required to support execution of the NDP. In practice progress on modifying these systems
has been limited and they often measure different outputs and outcomes that those specified
within the NDP.
This section reviews alignment of Public Expenditure Management with the NDP including
recent and planned reforms. It examines what is working well and what could be improved.
The key Economic Management Review question covered in this chapter the extent to which
public expenditure and related accountability systems changed to ensure alignment of
budgets, spending and financial reporting with NDP objectives.
3.2 Challenges around budget implementation
Despite the fact that the MTEF is prepared for five years, the revenues, expenditures and
sector allocations are frequently revised based on recent macroeconomic developments and
with limited involvement of the NPA or other MDAs. Typically the budget ceilings for overall
expenditure and sector allocations do not match earlier MTEF forecasts. In part this is due to
the introduction of supplementary budgets in the course of the budget year that has had
knock on effects across the budget. This has undermined the credibility of the budget over
the last few years (See Box 2).
Box 2: The Impact of Supplementary Budgets on Budget Credibility
Despite the various PFM reforms, budget credibility and control has not been effective over the past
two years of NDP implementation. By comparing the originally approved budget and actual
expenditures there are wide divergences especially during the year 2010/11. Owing to various factors,
several sectors overspent beyond their budget lines. These included:
Ministry of Defence (UGX 1,501.5 billion) to buy fighter jets and pay salary shortfalls;
State House (UGX 94.9 billion) to meet operational shortfalls;
Ministry of Energy and Mineral Development (UGX 92 billion) to meet shortfalls in payment for
thermal power electricity;
Uganda Police (UGX 81.9 billion) to police the 2011 General Elections among others.
In principal, it is illegal for any vote to overspend more than the approved budget. However, this has
usually been legitimised through supplementary authorisation by parliament. Despite the challenge of
23 | P a g e
using supplementary budgets which lead to overspending by some MDAs, government is initiating
remedies to enhance the credibility of the budget through the Public Finance Bill.
Under this bill it is a contingency fund will be established that will be equivalent to 3.5 percent of the
total budget to cater for supplementary expenditures and emergencies. The bill also proposes
stringent conditions to access the fund and for MDAs that overspend with penalties of deductions for
subsequent allocations.
In addition, MoFPED has been in discussion with IMF on the introduction of a single Treasury account
(STA) arrangement with BoU and the commercial banks. This would enable MoFPED to make cash
releases more in line with MDA work plans. Even if MDAs were unable to absorb the releases their
bank balances would be consolidated at the close of each working day and debt will be minimised.
There are also challenges with the unpredictable and late release of funds to the MDAs and
LGs. This sometimes led to under spending or rushed spending at the end of the financial
year. The low absorption rate of funds is also partly explained by the unpredictable budget
releases. The Budget Performance Report 2010/11 identifies nine priority roads which could
not commence because of delays in the release of funds. These delays also contribute to
the MDAs accumulating arrears. In addition the tighter reporting requirements based on
performance reporting using the Output Based Budgeting system (OBT) may also have
contributed to unnecessary delays. On average it takes about 100 days between submitting
a quarterly request and receiving the last instalment of funds. The unpredictability of the
budget provides MDAs with justification for not delivering on priorities which undermines the
planning process within MDAs. Unpredictability of the budget also affects the district
activities and their planning processes.
There are several positive initiatives under way to strengthen the effectiveness of the
budget. These initiatives include the introduction of performance contracting, budget
reporting and budget monitoring all aimed at improving accountability and service delivery.
Performance contracts will ensure accountability in public spending and specify how public
funds are going to be used. Budget reports will be used to guide decision making and show
areas of underperformance. Spending agencies are required to submit quarterly
performance reports showing progress against their work plans.
3.3 Alignment of the budget process with NDP priorities
Engagement of the NPA with MoFPED and sector ministries to link planning and budgeting
for NDP implementation has been limited. There were intensive consultations between the
24 | P a g e
NPA and sectors as the NDP was being prepared. Also the NPA engaged in various
consultations with the MoFPED and BoU to agree on the macroeconomic framework for the
NDP. However, as execution of the plan and distribution of resources is mainly done by the
MoFPED with sector Ministries, the NPA has not played a direct role in influencing resource
allocation. In addition, the NDP was approved in 2010 and was introduced too late to
significantly influence the budget cycle for the financial year 2010/11. For the subsequent
budget cycles, the NPA has not actively or strategically worked with the MoFPED and sector
MDAs to ensure the NDP is effectively mainstreamed within the budget. However, the
2012/13 budget documentation does clearly emphasise the need to align sector priorities
and resources towards strategic interventions included in the NDP.
There are process challenges around aligning the budget with sector / district and NDP
planning and review processes. At present the budget and sector / district planning and
review processes are not well aligned. The budget cycle does not put sufficient emphasis on
assessing progress over the preceding year. This makes it difficult to modify and adapt
budget priorities in line with past performance or new emerging challenges. In addition, NDP
district planning processes are carried out every 5 years whereas the budget is developed
annually and sector plans timelines are not necessarily aligned with the NDP planning
period. At present there is no formal process in place to review district development plans.
Various modelling tools were used by the NPA, BoU and MoFPED to formulate the
macroeconomic framework. The analysis of the NDP was underpinned by the MAMS
(Marquette for MDG – Millennium Development Goal – Simulations) model which is a
dynamic-recursive computable general equilibrium (CGE) model.5. The model comprises the
real, fiscal and external sector and its well linked to social sectors to provide policy scenarios
of poverty, MDG2, MDG4, MDG5 and MDG 7a and 7b. This framework also differentiates
between government activities and private sector activities in education and health. The
macroeconomic department of MoFPED and BoU currently use a combination of locally
developed models, consultation with key sectors and a financial programming model to
develop growth targets and monetary forecasts respectively. While the financial
programming model covers all sectors, it does not link with the social sector outcomes which
were a key input for the NDP. Despite differences in the modelling frameworks used by the
5 MAMS has been applied to more than 35 developing countries, primarily in the context of work undertaken
to assess the resource requirements for countries to meet their MDGs.
25 | P a g e
NPA, BoU and MoFPED, efforts were made to reconcile the figures from the various
modelling frameworks before the NDP was adopted by the government.
Over the last year progress has been made on improving integration across modelling
frameworks. A new macro-econometric-general equilibrium model is being developed that
will be used collaboratively between the MoFPED, BoU and NPA. In addition, under the new
Public Finance Bill (2012), the Charter of Fiscal Responsibility shall provide a detailed
statement of the Medium Term Fiscal Framework which will lay down measureable
objectives of government, local government, state enterprises and public corporations for a
period of not less than five financial years. Each financial year Ministers will need to prepare
a Budget Framework Paper that will need to be consistent with the NDP and the Charter of
Fiscal Responsibility.
This new modelling framework will enable greater convergence between the NDP macro-
economic strategy and the annual framework used to develop the MTEF. In addition the
Charter of Fiscal Responsibility will need to be fully compatible with future NDP planning
frameworks. This will require close coordination between NPA, the MoFPED and BoU during
preparation of the next NDP.
3.4 Alignment of the MTEF with NDP priorities
Government fiscal policy stance in the medium term is underpinned by the priorities of the
five years NDP 2010/11-2014/15. Indeed, the NDP provides guidance over the period on
how resources should be mobilised and spent on the various sectors. Based on this
framework, the MoFPED prepares a five-year MTEF which forecasts revenues and grants,
expenditure (sectoral allocations) and financing. The MTEF is prepared on a rolling annual
basis based on the recent economic developments.
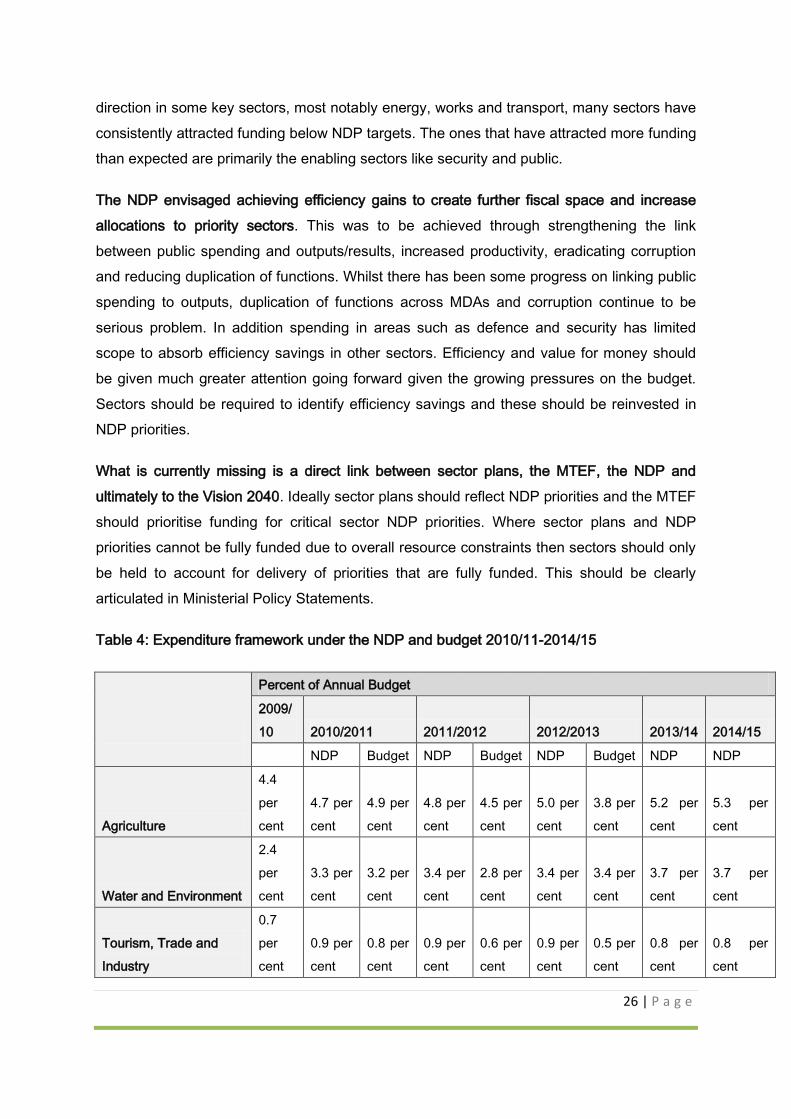
Each year’s budget has tended to diverge to some extent from the NDP in terms of
composition of spending (Table 4). In part this is due to the fact that the NDP is a fixed five
year development plan whose projections were based on the premise that growth would
continue at 7 per cent and the macroeconomic environment would remain stable. Both of
these assumptions were not realised and this impacted on available resources for NDP
implementation. While it is implausible to have an MTEF that would directly mirror NDP
expenditure priorities, it is reasonable to expect that the composition of spending would be
broadly maintained in the MTEF and the NDP. Whilst there has been movement in the right
26 | P a g e
direction in some key sectors, most notably energy, works and transport, many sectors have
consistently attracted funding below NDP targets. The ones that have attracted more funding
than expected are primarily the enabling sectors like security and public.
The NDP envisaged achieving efficiency gains to create further fiscal space and increase
allocations to priority sectors. This was to be achieved through strengthening the link
between public spending and outputs/results, increased productivity, eradicating corruption
and reducing duplication of functions. Whilst there has been some progress on linking public
spending to outputs, duplication of functions across MDAs and corruption continue to be
serious problem. In addition spending in areas such as defence and security has limited
scope to absorb efficiency savings in other sectors. Efficiency and value for money should
be given much greater attention going forward given the growing pressures on the budget.
Sectors should be required to identify efficiency savings and these should be reinvested in
NDP priorities.
What is currently missing is a direct link between sector plans, the MTEF, the NDP and
ultimately to the Vision 2040. Ideally sector plans should reflect NDP priorities and the MTEF
should prioritise funding for critical sector NDP priorities. Where sector plans and NDP
priorities cannot be fully funded due to overall resource constraints then sectors should only
be held to account for delivery of priorities that are fully funded. This should be clearly
articulated in Ministerial Policy Statements.
Table 4: Expenditure framework under the NDP and budget 2010/11-2014/15
Percent of Annual Budget
2009/
10 2010/2011 2011/2012 2012/2013 2013/14 2014/15
NDP Budget NDP Budget NDP Budget NDP NDP
Agriculture
4.4
per
cent
4.7 per
cent
4.9 per
cent
4.8 per
cent
4.5 per
cent
5.0 per
cent
3.8 per
cent
5.2 per
cent
5.3 per
cent
Water and Environment
2.4
per
cent
3.3 per
cent
3.2 per
cent
3.4 per
cent
2.8 per
cent
3.4 per
cent
3.4 per
cent
3.7 per
cent
3.7 per
cent
Tourism, Trade and
Industry
0.7
per
cent
0.9 per
cent
0.8 per
cent
0.9 per
cent
0.6 per
cent
0.9 per
cent
0.5 per
cent
0.8 per
cent
0.8 per
cent
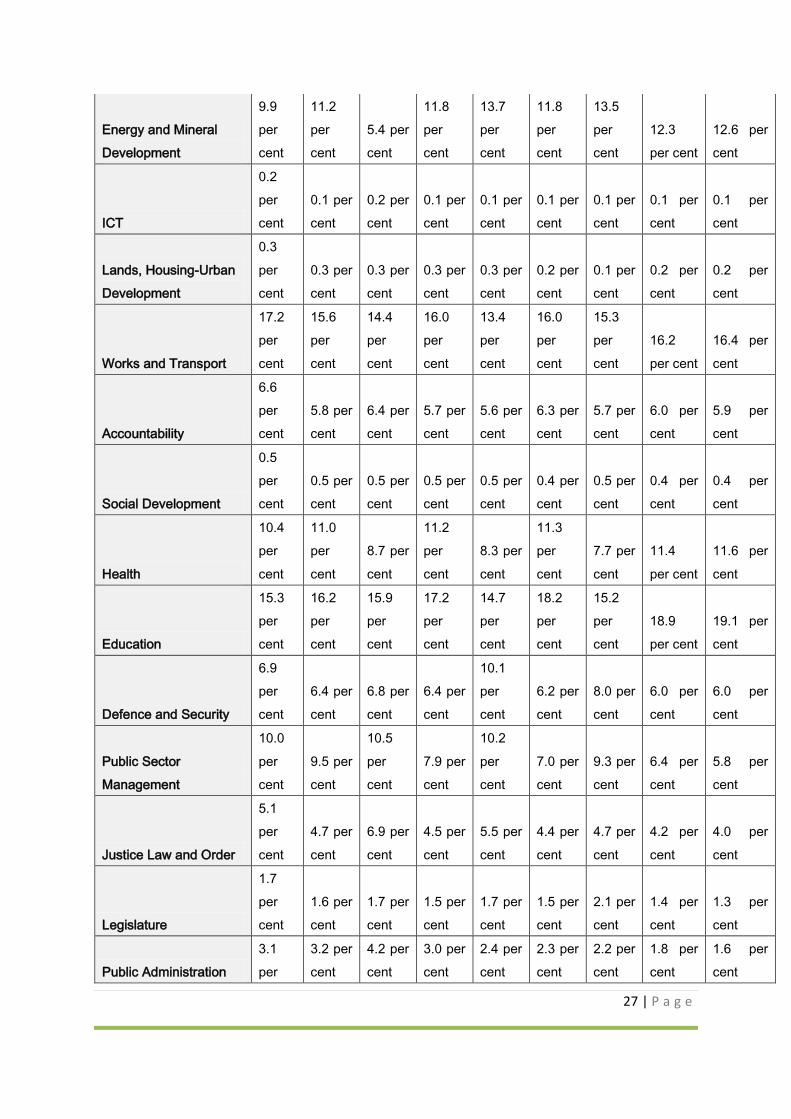
27 | P a g e
Energy and Mineral
Development
9.9
per
cent
11.2
per
cent
5.4 per
cent
11.8
per
cent
13.7
per
cent
11.8
per
cent
13.5
per
cent
12.3
per cent
12.6 per
cent
ICT
0.2
per
cent
0.1 per
cent
0.2 per
cent
0.1 per
cent
0.1 per
cent
0.1 per
cent
0.1 per
cent
0.1 per
cent
0.1 per
cent
Lands, Housing-Urban
Development
0.3
per
cent
0.3 per
cent
0.3 per
cent
0.3 per
cent
0.3 per
cent
0.2 per
cent
0.1 per
cent
0.2 per
cent
0.2 per
cent
Works and Transport
17.2
per
cent
15.6
per
cent
14.4
per
cent
16.0
per
cent
13.4
per
cent
16.0
per
cent
15.3
per
cent
16.2
per cent
16.4 per
cent
Accountability
6.6
per
cent
5.8 per
cent
6.4 per
cent
5.7 per
cent
5.6 per
cent
6.3 per
cent
5.7 per
cent
6.0 per
cent
5.9 per
cent
Social Development
0.5
per
cent
0.5 per
cent
0.5 per
cent
0.5 per
cent
0.5 per
cent
0.4 per
cent
0.5 per
cent
0.4 per
cent
0.4 per
cent
Health
10.4
per
cent
11.0
per
cent
8.7 per
cent
11.2
per
cent
8.3 per
cent
11.3
per
cent
7.7 per
cent
11.4
per cent
11.6 per
cent
Education
15.3
per
cent
16.2
per
cent
15.9
per
cent
17.2
per
cent
14.7
per
cent
18.2
per
cent
15.2
per
cent
18.9
per cent
19.1 per
cent
Defence and Security
6.9
per
cent
6.4 per
cent
6.8 per
cent
6.4 per
cent
10.1
per
cent
6.2 per
cent
8.0 per
cent
6.0 per
cent
6.0 per
cent
Public Sector
Management
10.0
per
cent
9.5 per
cent
10.5
per
cent
7.9 per
cent
10.2
per
cent
7.0 per
cent
9.3 per
cent
6.4 per
cent
5.8 per
cent
Justice Law and Order
5.1
per
cent
4.7 per
cent
6.9 per
cent
4.5 per
cent
5.5 per
cent
4.4 per
cent
4.7 per
cent
4.2 per
cent
4.0 per
cent
Legislature
1.7
per
cent
1.6 per
cent
1.7 per
cent
1.5 per
cent
1.7 per
cent
1.5 per
cent
2.1 per
cent
1.4 per
cent
1.3 per
cent
Public Administration
3.1
per
3.2 per
cent
4.2 per
cent
3.0 per
cent
2.4 per
cent
2.3 per
cent
2.2 per
cent
1.8 per
cent
1.6 per
cent
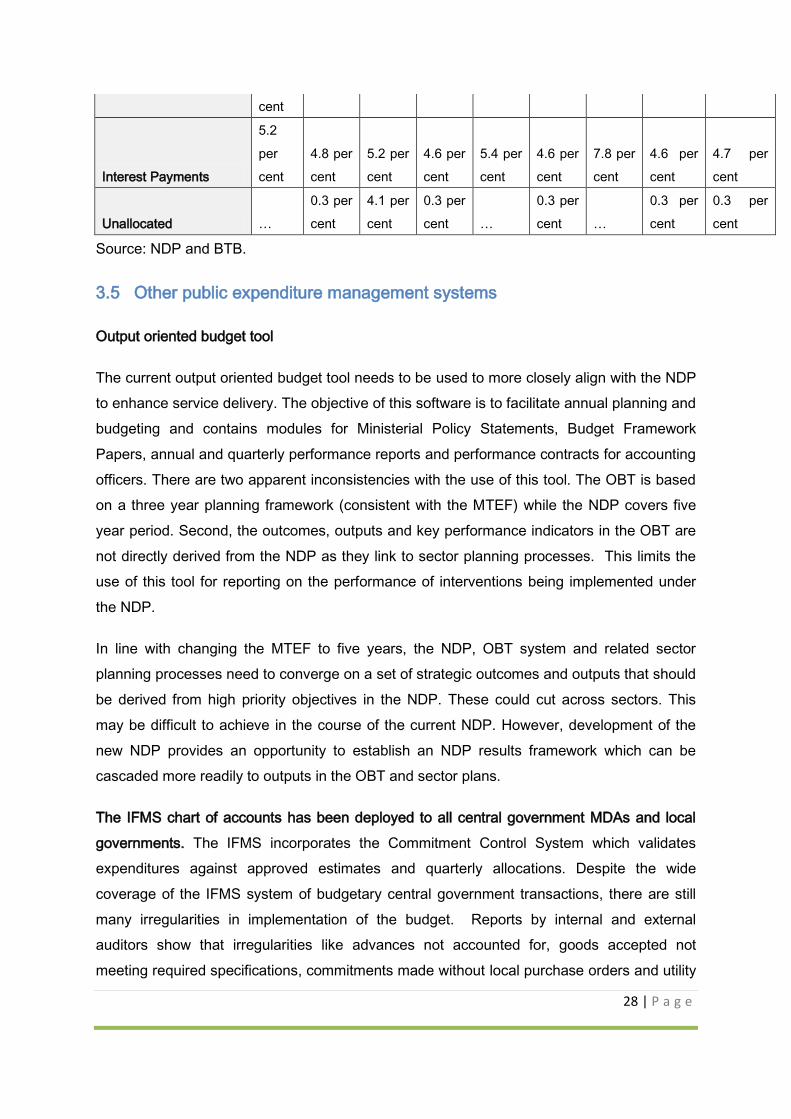
28 | P a g e
cent
Interest Payments
5.2
per
cent
4.8 per
cent
5.2 per
cent
4.6 per
cent
5.4 per
cent
4.6 per
cent
7.8 per
cent
4.6 per
cent
4.7 per
cent
Unallocated …
0.3 per
cent
4.1 per
cent
0.3 per
cent …
0.3 per
cent …
0.3 per
cent
0.3 per
cent
Source: NDP and BTB.
3.5 Other public expenditure management systems
Output oriented budget tool
The current output oriented budget tool needs to be used to more closely align with the NDP
to enhance service delivery. The objective of this software is to facilitate annual planning and
budgeting and contains modules for Ministerial Policy Statements, Budget Framework
Papers, annual and quarterly performance reports and performance contracts for accounting
officers. There are two apparent inconsistencies with the use of this tool. The OBT is based
on a three year planning framework (consistent with the MTEF) while the NDP covers five
year period. Second, the outcomes, outputs and key performance indicators in the OBT are
not directly derived from the NDP as they link to sector planning processes. This limits the
use of this tool for reporting on the performance of interventions being implemented under
the NDP.
In line with changing the MTEF to five years, the NDP, OBT system and related sector
planning processes need to converge on a set of strategic outcomes and outputs that should
be derived from high priority objectives in the NDP. These could cut across sectors. This
may be difficult to achieve in the course of the current NDP. However, development of the
new NDP provides an opportunity to establish an NDP results framework which can be
cascaded more readily to outputs in the OBT and sector plans.
The IFMS chart of accounts has been deployed to all central government MDAs and local
governments. The IFMS incorporates the Commitment Control System which validates
expenditures against approved estimates and quarterly allocations. Despite the wide
coverage of the IFMS system of budgetary central government transactions, there are still
many irregularities in implementation of the budget. Reports by internal and external
auditors show that irregularities like advances not accounted for, goods accepted not
meeting required specifications, commitments made without local purchase orders and utility
29 | P a g e
arrears are still a common occurrence in MDAs and local governments (PFM report, 2012).
The Chart of Accounts was designed before the NDP (during PEAP) and has been reviewed
before, but some items in it are not consistent with accountability and monitoring
requirements of the NDP. There is a need to address these inconsistencies to enhance
accountability and improve alignment with the NDP.
Ministerial statements
The main instrument used by sectors and MDAs to report their annual performance and
plans for the following year for assessment and approval by Parliament are Ministerial Policy
Statements. These policy statements are currently well integrated with the OBT. However,
given that OBT outcomes are not derived from the NDP, these statements are not always
well aligned to the NDP. This means that the Policy Statements are not fully able to serve
the original purpose of synthesised reporting on planning and implementation of planning by
sectors and MDAs. Closer alignment of the OBT with the NDP would enable government to
use Ministerial Statements more effectively to track progress on NDP implementation.
Budget performance contracts
The review also found that the Budget Performance Contracts for Accounting Officers are
generated from the OBT. These Contracts relate to the Accounting Officers’ requirement to
effectively and prudently produce outputs for which resources in the OBT have been
provided. Again, the lack of full alignment of OBT and the NDP means that these contracts
do not necessarily bind senior officers to deliver on NDP priorities. In addition, the coverage
of performance contracts is limited to a few senior accounting officers rather than being
extended to all civil servants with collective responsibility of outcomes.
Sector investment plans
When the NDP was being developed, some MDAs did not have Sector Investment Plans
(SIPs) to guide annual planning and budgeting over the medium term period (5 years). SIPs
are a critical input to guide the use of the OBT. In the absence of some SIPs, MDAs were
guided by the NPA top prepare background papers as inputs to the NDP. The absence of
SIPs complicates planning processes and creates a vacuum for other tools such as the
OBT. All sectors should be have SIPs in place as a basis for informing planning for the next
NDP and to enhance links between planning and budgeting including tools such as the OBT.
Ideally, all SIPs should cover the same 5 year period at the NDP.
30 | P a g e
3.6 Public investment planning and the NDP
For the first two years of implementing the NDP, there was a dis-connect between the Public
Investment Plan (PIP) and the NDP. The projects that were identified in the NDP are not
fully reflected in the first two annual PIP documents. The process and criteria used to include
projects in the PIP has not been very transparent. In addition there is no clear link between
investment planning and recurrent expenditure requirements in the PIP process. This can
lead to disconnect between the recurrent and development budget. The government is
planning to review the PIP and this provides an opportunity to improve the process going
forward. This review could explore some of the issues below that have come up repeatedly
in the course of this MTR. Two recent developments are very positive steps in the right
direction. A committee has been set up to scrutinise projects to be included in the PIP and
this includes NPA representation. Clearer guidelines have also been developed which
include prioritisation of NDP projects.
A number of core and sector projects were included in the NDP without being fully
appraised. As a result the technical and financial feasibility of these projects had not been
fully tested and they were not yet “investment ready”. In addition the NDP did not bring out
clearly the planned sequencing of investment projects taking into account technical and
financial capacity to design and implement projects. These appraisals take considerable time
and cost and require high levels of expertise especially for the more complex and ambitious
projects. As a result many projects are running behind schedule and some MDAs are
struggling to implement a large number of complex projects simultaneously.
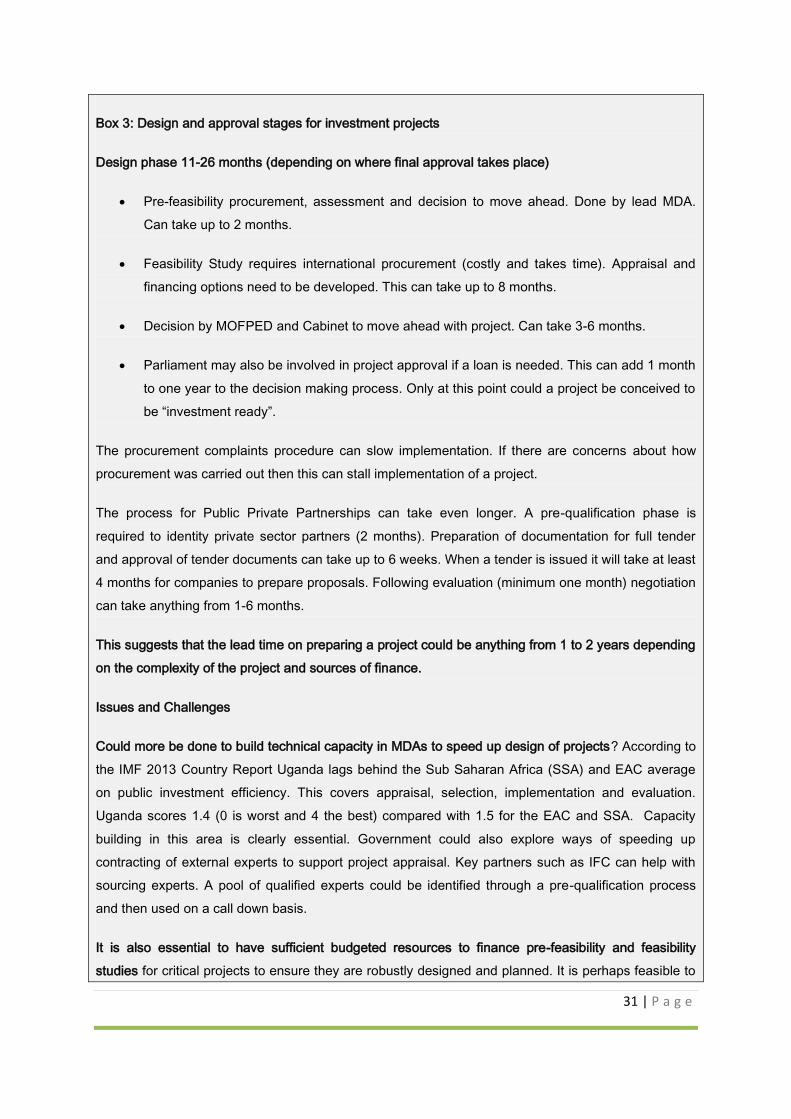
31 | P a g e
Box 3: Design and approval stages for investment projects
Design phase 11-26 months (depending on where final approval takes place)
Pre-feasibility procurement, assessment and decision to move ahead. Done by lead MDA.
Can take up to 2 months.
Feasibility Study requires international procurement (costly and takes time). Appraisal and
financing options need to be developed. This can take up to 8 months.
Decision by MOFPED and Cabinet to move ahead with project. Can take 3-6 months.
Parliament may also be involved in project approval if a loan is needed. This can add 1 month
to one year to the decision making process. Only at this point could a project be conceived to
be “investment ready”.
The procurement complaints procedure can slow implementation. If there are concerns about how
procurement was carried out then this can stall implementation of a project.
The process for Public Private Partnerships can take even longer. A pre-qualification phase is
required to identity private sector partners (2 months). Preparation of documentation for full tender
and approval of tender documents can take up to 6 weeks. When a tender is issued it will take at least
4 months for companies to prepare proposals. Following evaluation (minimum one month) negotiation
can take anything from 1-6 months.
This suggests that the lead time on preparing a project could be anything from 1 to 2 years depending
on the complexity of the project and sources of finance.
Issues and Challenges
Could more be done to build technical capacity in MDAs to speed up design of projects? According to
the IMF 2013 Country Report Uganda lags behind the Sub Saharan Africa (SSA) and EAC average
on public investment efficiency. This covers appraisal, selection, implementation and evaluation.
Uganda scores 1.4 (0 is worst and 4 the best) compared with 1.5 for the EAC and SSA. Capacity
building in this area is clearly essential. Government could also explore ways of speeding up
contracting of external experts to support project appraisal. Key partners such as IFC can help with
sourcing experts. A pool of qualified experts could be identified through a pre-qualification process
and then used on a call down basis.
It is also essential to have sufficient budgeted resources to finance pre-feasibility and feasibility
studies for critical projects to ensure they are robustly designed and planned. It is perhaps feasible to
32 | P a g e
seek some external funding to support design of feasibility studies for priority projects. Funding is
likely to be available from the World Bank and potentially other donors – particularly for Public Private
Partnership projects.
Importance of good governance and transparent procurement. If procurement does not run smoothly
then it can delay implementation of projects. Is the new procurement legislation fit for purpose? What
could be done to improve speed, transparency and independence of the procurement process? Is
there an effective strategy in place to improve procurement capacity in MDAs?
As Box 3 demonstrates, a critical factor slowing project design and implementation is the
procurement process. Some of the concerns raised in the course of this Review include: the
complexity of the legal framework and procedures governing public procurement, weak
technical capacity in MDAs, and weak governance/oversight of procurement which can open
the door to corruption.
Potential ways of improving Investment Planning and links in the next NDP
As the next NDP is developed it is worth exploring how to improve investment planning and
links between critical NDP projects, sector investment plans and the PIP. This could draw on
other countries experiences in driving forward flagship projects as part of their national
planning process (See Box 4).
Box 4: Presentation, coordination and financial planning of strategic flagship projects in comparative
NDPs
The Kenyan Vision 2030 (published 2007) identifies around 50 Flagship Projects that are to be
implemented in the medium term (2008-2012) in order to meet the long-term strategies and
objectives. Both the Vision 2030 and the first medium term plan (MTP) (2008-2012) are organised
across 3 pillars – the economic, social and political. These pillars are anchored on macroeconomic
stability; continuity in governance reforms; enhanced equity and wealth creation opportunities for the
poor; infrastructure; energy; science; technology and innovation; land reform; human resource
development security and public sector reforms. The Vision 2030 maps out the Flagship Projects that
will be implemented to ensure progression on each of these areas. At the completion of this period
another five year MTP will be produced covering the period 2013-2017, 2018-2022 and 2023-2027 up
to 2030. Over successive five year terms, the MTPs will implement the Flagship Projects identified
under Vision 2030, various programmes and key policies.
The national monitoring framework for The Vision 2030 gives timelines for completion of key outputs
associated with the flagship projects. The progress of the Flagships is monitored against these
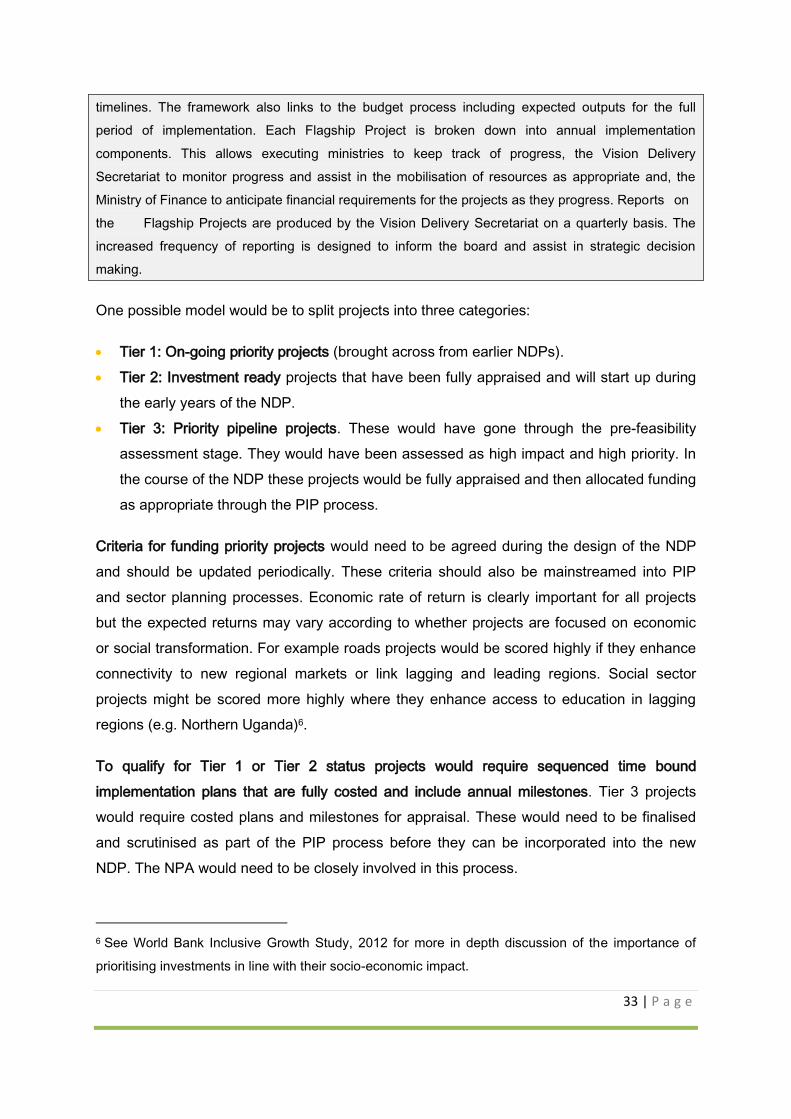
33 | P a g e
timelines. The framework also links to the budget process including expected outputs for the full
period of implementation. Each Flagship Project is broken down into annual implementation
components. This allows executing ministries to keep track of progress, the Vision Delivery
Secretariat to monitor progress and assist in the mobilisation of resources as appropriate and, the
Ministry of Finance to anticipate financial requirements for the projects as they progress. Reports on
the Flagship Projects are produced by the Vision Delivery Secretariat on a quarterly basis. The
increased frequency of reporting is designed to inform the board and assist in strategic decision
making.
One possible model would be to split projects into three categories:
Tier 1: On-going priority projects (brought across from earlier NDPs).
Tier 2: Investment ready projects that have been fully appraised and will start up during
the early years of the NDP.
Tier 3: Priority pipeline projects. These would have gone through the pre-feasibility
assessment stage. They would have been assessed as high impact and high priority. In
the course of the NDP these projects would be fully appraised and then allocated funding
as appropriate through the PIP process.
Criteria for funding priority projects would need to be agreed during the design of the NDP
and should be updated periodically. These criteria should also be mainstreamed into PIP
and sector planning processes. Economic rate of return is clearly important for all projects
but the expected returns may vary according to whether projects are focused on economic
or social transformation. For example roads projects would be scored highly if they enhance
connectivity to new regional markets or link lagging and leading regions. Social sector
projects might be scored more highly where they enhance access to education in lagging
regions (e.g. Northern Uganda)6.
To qualify for Tier 1 or Tier 2 status projects would require sequenced time bound
implementation plans that are fully costed and include annual milestones. Tier 3 projects
would require costed plans and milestones for appraisal. These would need to be finalised
and scrutinised as part of the PIP process before they can be incorporated into the new
NDP. The NPA would need to be closely involved in this process.
6 See World Bank Inclusive Growth Study, 2012 for more in depth discussion of the importance of
prioritising investments in line with their socio-economic impact.
34 | P a g e
All projects falling in Tier 1, 2 or 3 would be accorded the highest priority in SIPs and the
annual PIP. These would be regarded as Uganda’s flagship projects. They would be
rigorously tracked at the highest level. Sector MDAs would be held fully to account for
ensuring they are accorded priority for implementation. The MOFPED would be held to
account for ensuring funding is available to support design and implementation of these
projects.
The investment planning horizon for projects may need to be extended so a pipeline of
projects is always being worked on in readiness for the next NDP. This requires a good
understanding of the required sequencing of investments which should be informed by
Vision 2040 and a clear theory of change to achieve socio-economic transformation in
Uganda.
3.7 Immediate opportunities to improve public expenditure management
The Public Finance Management bill is before parliament and is being debated. This
provides a good framework for improving public financial management. The overall objective
of the PFB is to improve value for money by strengthening checks and balances and
accountability. It also aims to improve public service delivery with a view to sustaining and
supporting higher levels of economic growth and development. There are some positive
aspects about the bill as summarized in the Box 5.
35 | P a g e
Key Highlights of the Public Financial Management Law
i. Consolidate the Public Financial Management Law which is currently scattered in the
PFAA 2003; Budget Act 2001; the 2008 MoU between MFPED and BOU; and other
laws like the 2004 Local Governments Act, the 2008 National Audit Act, the Uganda
Revenue Authority Act and other acts governing State owned and Public institutions
ii. Provide for good practices Uganda has developed over the past decade but which are
not fully reflected in the current legislation
iii. Address gaps, inconsistencies and weaknesses encountered during implementation of
both the Budget Act and the PFAA
iv. Make provisions to operationalise the Contingencies Fund – Article 157 of the
Constitution to provide stability of funds released through the Financial Year
v. Establish Institutional Framework for the Petroleum Revenues and make provisions
for prudent management and accountability of Petroleum Revenues
vi. Integrates the public financial management cycle (fiscal, budget, treasury and
accounts) in one document
vii. Changing in the national budget cycle to rhyme implantation with the financial year i.e.
releases are effective July not September as having been the experience
viii. Introducing the Charter of Fiscal Responsibility which is signed by Parliament that
coincides with the Presidential Electoral Cycle
ix. Providing a Legal Framework for the prudent management of oil resources that is
consistent with the National Oil and Gas Policy (2008) and the Oil and Gas Revenue
Management Policy (2012) and ensuring that oil resources benefit both the current
and future generations
x. Prescribes a single framework for management of all government revenues both oil
and non-oil
Box 5: Summary of public financial management bill
However, the bill could be strengthened by clearly emphasising the role and importance of
the NPA in the planning paradigm. The NPA should guide medium term resource plan
through the NDP process and this should be used as the basis for setting annual budget
priorities. The annual rolling BFP should also be broadly consistent with the NDP to
enhance the implementation of the plans. The MDAs / LGs should use the NDP as the basis
for their annual plans and budgets rather than engaging in multiple planning processes.

36 | P a g e
Essentially the NDP should act as the framework for guiding annual priorities and budgets
and these should be signed off by Cabinet at the start of the budget process.
37 | P a g e
4 ENHANCING GROWTH AND PROMOTING COMPETITIVENESS AND
PRIVATE SECTOR DEVELOPMENT
As this is a MTR and the NDP has only been operational for a relatively short period of time
it is not feasible to assess the direct impact of the NDP on private sector development and
competitiveness. However, this section reflects on the performance of some key NDP
sectors and prospects for the next two years. It explores issues around competitiveness and
ease of doing business and comments on progress to date. It also draws on recent surveys
and a consultation with the private sector carried out in the course of this MTR.
4.1 Review of sector performance and growth
Between 1990 and 2007, real GDP growth averaged close to 8 percent, compared with 3
percent in the rest of Sub-Saharan Africa (SSA). The early years of the growth episode was
largely driven by significant capital accumulation as the country was recovering from civil
strife. More recently growth has decelerated during 2009-2012 due to external shocks
including the volatile commodity prices and global recession which has greatly put pressure
on the current account and the domestic exchange rate. As shown in Table 5, it was
envisaged that agriculture would contribute on average 5.8 percent to overall GDP, while
industry would contribute about 6.5 percent and services which is the dominant sector would
contribute about 7.5 percent. On the contrary, agriculture performed poorly growing on
average at about 1 percent owing to various factors illustrated below. Industry on the other
recovered after poor performance in 2011/12, it rebounded in 2012/13 to the growth level
that was anticipated in the NDP. There has also been a slowdown in the growth of services
particularly in 2011/12 and 2012/13.
The growth that has been witnessed in the past years has been accompanied by some
significant changes in the composition of GDP. Uganda’s strong economic growth since
1992 has been driven mainly by the services, manufacturing and construction sectors (Table
5). Within the period 2008 to 2012, the share of value added contributed by the services
sector has remained almost half of total gross domestic product (GDP) from about 32 per
cent in 1990 and that of agriculture diminished steadily from 50.3 per cent to about 23.9 per
cent in the same period.
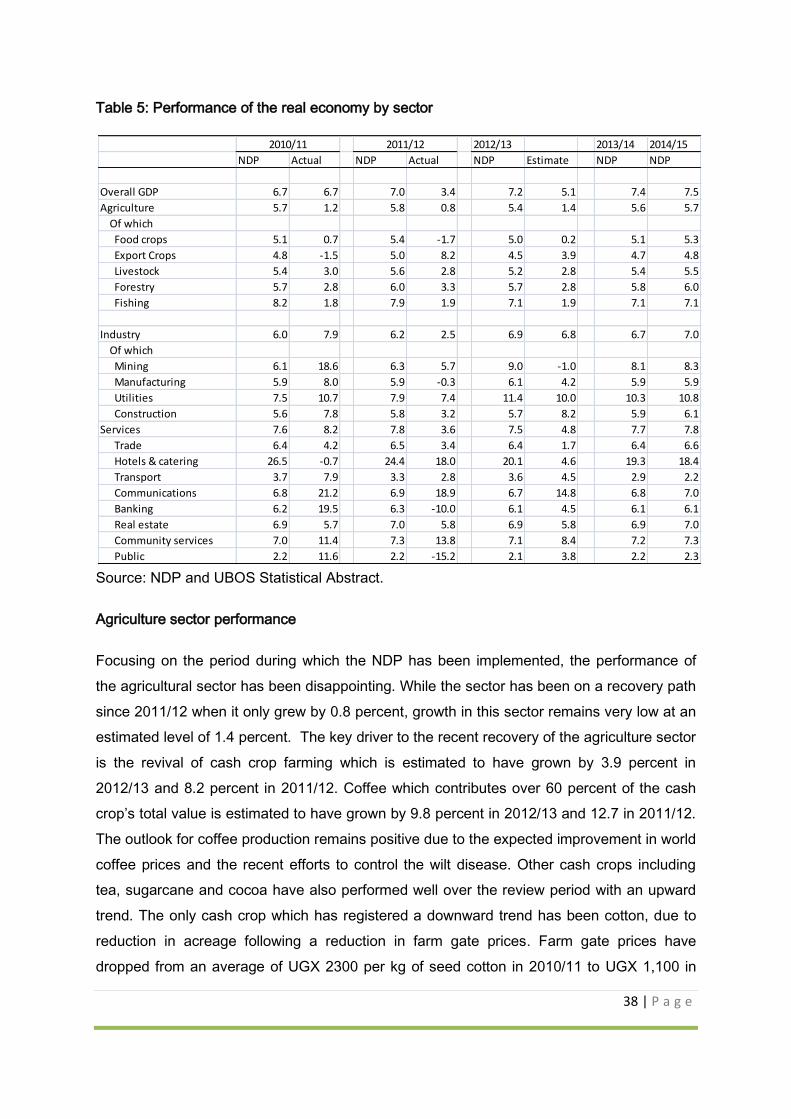
38 | P a g e
Table 5: Performance of the real economy by sector
Source: NDP and UBOS Statistical Abstract.
Agriculture sector performance
Focusing on the period during which the NDP has been implemented, the performance of
the agricultural sector has been disappointing. While the sector has been on a recovery path
since 2011/12 when it only grew by 0.8 percent, growth in this sector remains very low at an
estimated level of 1.4 percent. The key driver to the recent recovery of the agriculture sector
is the revival of cash crop farming which is estimated to have grown by 3.9 percent in
2012/13 and 8.2 percent in 2011/12. Coffee which contributes over 60 percent of the cash
crop’s total value is estimated to have grown by 9.8 percent in 2012/13 and 12.7 in 2011/12.
The outlook for coffee production remains positive due to the expected improvement in world
coffee prices and the recent efforts to control the wilt disease. Other cash crops including
tea, sugarcane and cocoa have also performed well over the review period with an upward
trend. The only cash crop which has registered a downward trend has been cotton, due to
reduction in acreage following a reduction in farm gate prices. Farm gate prices have
dropped from an average of UGX 2300 per kg of seed cotton in 2010/11 to UGX 1,100 in
2012/13 2013/14 2014/15
NDP Actual NDP Actual NDP Estimate NDP NDP
Overall GDP 6.7 6.7 7.0 3.4 7.2 5.1 7.4 7.5
Agriculture 5.7 1.2 5.8 0.8 5.4 1.4 5.6 5.7
Of which
Food crops 5.1 0.7 5.4 -1.7 5.0 0.2 5.1 5.3
Export Crops 4.8 -1.5 5.0 8.2 4.5 3.9 4.7 4.8
Livestock 5.4 3.0 5.6 2.8 5.2 2.8 5.4 5.5
Forestry 5.7 2.8 6.0 3.3 5.7 2.8 5.8 6.0
Fishing 8.2 1.8 7.9 1.9 7.1 1.9 7.1 7.1
Industry 6.0 7.9 6.2 2.5 6.9 6.8 6.7 7.0
Of which
Mining 6.1 18.6 6.3 5.7 9.0 -1.0 8.1 8.3
Manufacturing 5.9 8.0 5.9 -0.3 6.1 4.2 5.9 5.9
Utilities 7.5 10.7 7.9 7.4 11.4 10.0 10.3 10.8
Construction 5.6 7.8 5.8 3.2 5.7 8.2 5.9 6.1
Services 7.6 8.2 7.8 3.6 7.5 4.8 7.7 7.8
Trade 6.4 4.2 6.5 3.4 6.4 1.7 6.4 6.6
Hotels & catering 26.5 -0.7 24.4 18.0 20.1 4.6 19.3 18.4
Transport 3.7 7.9 3.3 2.8 3.6 4.5 2.9 2.2
Communications 6.8 21.2 6.9 18.9 6.7 14.8 6.8 7.0
Banking 6.2 19.5 6.3 -10.0 6.1 4.5 6.1 6.1
Real estate 6.9 5.7 7.0 5.8 6.9 5.8 6.9 7.0
Community services 7.0 11.4 7.3 13.8 7.1 8.4 7.2 7.3
Public 2.2 11.6 2.2 -15.2 2.1 3.8 2.2 2.3
2010/11 2011/12
39 | P a g e
2011/12. This has also exacerbated with adverse weather conditions specifically drought
during planting season and the heavy rains.
For the period 2011/12 and 2012/13, food crops which account for 50 percent of total
agriculture and key to the food basket as well as exports especially within the region
contracted by 1.7 percent in 2011/12 and only grew by 0.2 percent in 2012/13 respectively.
The contraction was largely attributed to the severe draught in 2011/12. The level of
agricultural exports, including maize, beans, and flowers, increased significantly during the
first half of 2012/13, largely due to higher international prices and increased volume of trade.
Overall the level of growth in the sector has not been enough to compensate for the
reductions in growth in other sectors especially manufacturing and services. The recent
decline in agriculture partly reflects the fall in productivity of the sector, deterioration in
farming methods synonymous with poor technologies and resources especially in form of
labour being reallocated to services. Other structural problems include the use of inferior
inputs and lack of value addition to raw materials that have limited productivity and
profitability of the sector have contributed to the low growth of the sector. Other generic
factors constraining growth include lack of coherent land reforms, dysfunctional land market,
lack of mechanisation, weak infrastructure, lack of agriculture financing and weak marketing
infrastructure.
In order to improve productivity of the sector, the following set of objectives were supposed
to be implemented:
Improved agricultural research and technology development;
Better delivery of advisory services and improved technology;
Improved disease, pest and vector control;
Enhanced productivity of land through sustainable management of soil and water
resources;
Increased use of water for agricultural production;
Promotion of labour saving technologies and mechanisation;
Improved agricultural livelihoods in Northern Uganda; and
Promoting strategic enterprises.
However, to meet these objectives there are various challenges over the last two years that
would require to be addressed. Among them highlighted in the recent sector reviews
include:
40 | P a g e
Low Medium Term Expenditure Framework (MTEF) ceiling relative to the ATAAS project
budget provisions resulting into a substantial financing gap for implementing programme
activities thereby affecting operational/activity budgets;
Less than expected pace of flow funds through the financial arrangements leading to late
arrival of funds at the sub county level relative to the growing / agricultural seasons;
High level of expectations and demands from the stakeholders way beyond the available
resource (National Technology Fund) at the NAADS secretariat;
Low commitment and/or inadequate capacity of local governments and farmers to meet
their co-funding obligations towards NAADS programme implementation thereby
constraining implementation of activities as well as threatening sustainability;
Inadequate availability of appropriate financial institutions limiting the ability of farmer
groups to open bank accounts to facilitate their financial transactions;
Preference of farmers for technology/material inputs (often received at individual level)
compared to advisory services and related joint learning activities;
Protracted process of filling the positions at the NAADS Secretariat according to the new
staffing structure;
Inadequate number of sub county NAADS coordinators and frontline agricultural advisory
service providers (AASPs) as well as uncertainty about the future type of extension
system; as well as inadequate budget for facilitating their operations;
There is lack of efficient early warning systems. Disease outbreaks are reported long
after they have occurred and spread to wider geographical areas. In addition although
disease surveillance is a prerequisite for effective animal disease control, it is not
routinely and effectively done;
Climate change has resulted in un-favourable weather conditions during the production
period, leading to loss of planted acreage and drop in yields. Farmers experienced
drought at time of planting (May – June 2011) and excessive rains from end of August to
October 2011 which resulted into flooding in parts of Busoga, Butaleja, Pallisa, Teso,
Bugisu and parts of Lango sub-region. The excess rain also made weeding and pest
control difficult and costly to the farmers since activities had to be repeated at very short
intervals;
Inputs have steadily increased in cost due to weakening of the shilling. To exacerbate
this problem a drop in cotton prices from an average of UGX 2,300 per kg of seed cotton
received by farmers in 2010/11 to an average of UGX 1,100 per kg in 2011/12. This
demoralised farmers and made them reluctant to buy pesticides and implement the
recommended agronomic practices especially for the late planted crop.
41 | P a g e
Industry Sector Performance
There was strong recovery of the industrial sector during the period 2012/13. Growth in this
sector is estimated at 6.8 percent relative to the growth rate of 2.5 percent in the fiscal year
2011/12. The key driver for this growth was recovery of the construction sector which grew
by 8.2 percent and accounted for 61 percent of the value added to the sector. The slow
growth of the construction sector in 2011/12 could be attributed to the unstable
macroeconomic environment during that financial year that was characterized by high
inflation, high interest rates and a slowdown in private sector credit to finance the sector.
Manufacturing also recovered in 2012/13 with a growth rate of 4.2 percent during 2012/13
compared to 0.3 percent in 2011/12. This is consistent with the growth in electricity provided
which could have helped to unlock one of the key binding constraint for industry. The recent
completion of Bujagali Hydropower Dam and other mini-hydropower stations has greatly
improved the availability and stability of electricity (See RF).
For 2011/12, the manufacturing sector faced various challenges which included power
shortages and higher electricity prices, financing constraints resulting from tighter liquidity,
and lower demand from global markets. The low electricity generation which was combined
with expensive thermal generators being switched off due to insufficient funding resulted into
increased tariffs. This considerably increased the cost of manufacturing.
Services Sector Performance
Overall weak economic growth recorded in 2011/12 is explained by the deceleration of the
services, which account for approximately 52 percent of Uganda’s GDP. This previously
booming sector lost about 5 percentage points of growth. Financial and trade services
decelerated due to increasing uncertainty in the business environment and tighter liquidity
conditions that led to higher interest rates and more prudent behaviour by commercial
banks. Notwithstanding these negative developments, services have since registered some
recovery of 4.8 percent, albeit still low compared to previous years. The recovery has been
mainly driven by transport, communications and financial services. Financial services have
particularly been boosted due to increased loan uptake after a recent reduction of interest
rates. In addition, the real estate sector has also rebounded and estimated to have grown by
5.8 percent in 2012/13.
There are various challenges constraining the performance of the services sector. In a
recent investment survey, it was found that many businesses are currently operating below
42 | P a g e
capacity due to low demand (40.4 per cent) followed by unreliable supply of production
inputs (19.1 per cent) and lack of working capital (13 per cent). The high cost of credit (83.3
per cent) coupled with poor infrastructure (79 per cent) and limited access to credit (77 per
cent) was considered the main non-regulatory factors which constrained growth. Over half
of the businesses in the survey indicated that interest rates had a negative impact on
business operations. Volatility of exchange rates also resulted in payment delays where
customers had been negatively affected by exchange rate losses. In terms of quality of
services, the survey indicated that electricity, railway transport and health care were the
most poorly delivered. The most effectively delivered services were banking services, air
transport and insurance services. Electricity, air transport, banking and road transport were
all rated to be expensive.
The investment survey concluded that poor infrastructure in the energy and transport sectors
are the major constraints to business expansion. Macro-economic and political stability are
positive drivers of investment in Uganda. Many businesses indicated that they are not
formally registered as the processes are too bureaucratic. Government is encouraged to
support investment across the country, not just in Central Region and to promote investment
partnerships to boost investment and exports. It should exploit opportunities offered by trade
and regional agreements with the EU, EAC and COMESA.
Growth and Socio-Economic Transformation
Uganda’s structural changes have not been associated with significant improvement in
income levels and social transformation. This is partly because the structural transformation
in Uganda is currently taking place through the expansion of non-tradeables especially
services at the expense of the tradeables sectors especially agriculture and industry.
Economic transformation has been defined as a combination of accelerated growth, rapid
growth of exports, economic diversification, and structural change. It also involves the
evolution of labour productivity. It’s synonymous with transformation from a traditional to a
modern one through high capital accumulation, technological change and productivity
growth. In the Vision 2040, transformation is defined as changing from peasant economy to
a modern and prosperous country. This would involve changing from a predominantly low
income to a competitive upper middle income country. Much needs to change to achieve this
transformation and to ensure growth delivers benefits across the country and population.
43 | P a g e
Due to the high population growth rate estimated at 3.2 percent and the modest growth
achieved over the past two years, per capita GDP has deteriorated to about US$ 487, a
decline from the 2010 when it was registered at US$ 502. The targeted per capita income of
US$ 1,000 by 2017 should qualify the country to be of a middle income status. However,
given current obstacles to achieving high levels of broad based growth and the pressures of
high population growth, it will be very difficult to achieve middle income status by 2017
notwithstanding the expected oil resources. The Vision 2040 goal of increasing per capita
income to US$ 9,400 also looks very ambitious.
Growth of exports has been limited over the past two years. Uganda’s export basket remains
narrow and dominated by primary products (around 85 per cent), including coffee, fish,
tobacco, gold, and flowers. Reliance on these exports has made the export sector vulnerable
to fluctuations in world market prices and the vagaries of weather. Indeed, Uganda has
faced a significant long-run term decline in its terms of trade. This suggests that economic
transformation driven by value added export growth is not yet taking place.
Other indicators of socio-economic transformation include the level of urbanisation. Vision
2040 describes the importance of urbanisation and development of regions. Uganda also
has one of the lowest urbanisation rates in Africa (16 per cent). Kampala accounts for one
third of Uganda’s urban population. Even though Ugandans are mobile, most people move
from one rural area to another in search of fertile land. More needs to be done to urbanize
Ugandan cities by increasing their economic activities so as to attract more labour and
related infrastructure and institutions. Action to develop “regional economic hubs” would
concentrate services and facilitate trade into new markets. UIA are working on developing
industrial parks that could fit into this kind of model. The World Bank Inclusive Growth
study7 includes proposals on how this could be done including: greater focus on equitable
provision of services across regions; infrastructure investments to link leading and lagging
regions; improved land management systems and institutions including planning and
management of urban areas; improved transport services in urban areas to reduce
congestion; strategic interventions in lagging regions to improve economic development
opportunities e.g. development of transport routes into Southern Sudan in Northern Uganda.
Growth Opportunities
7 Uganda Promoting Inclusive Growth Synthesis Report, February 2012, World Bank.

44 | P a g e
More could be done to strengthen governments focus on harnessing growth opportunities
offered by regional integration. The recent World Bank Economic Outlook8 reviews what
needs to be done to unleash Uganda’s regional trade potential. At present Uganda is under-
exporting and over-importing to many countries including its neighbours. The study indicates
that more needs to be done to encourage farmers and businesses to make better choices
regarding what to produce and how to produce products that meet standards expected in
regional markets. The Ministry of Trade and Export Promotion Board have recently been
highly fiscally constrained and many businesses are not even aware of trade opportunities
on their doorsteps. The concluding recommendations of the WB study are that Uganda
should be doing more to leverage its agricultural exports within the region. It should support
diversification of the export base with a focus on value addition and its contribution to trade
in specific tasks or parts to build regional supply chains. Diversification into services is also
recommended.
Greater emphasis on strategic investments focused on linking leading and lagging regions
and improving transport corridors to regional markets could also have a strong catalytic
effect on facilitating regional trade. For example, development of trade routes into South
Sudan would help improve competitiveness, enhance development in Northern Uganda and
open up a very large new market.
Many of the policy measures proposed to maximise returns from regional integration
resonate with NDP priorities. However, at present this is a treated as a “stand alone” area
rather than an integral part of the NDP. Specific areas for action that the WB Review focused
on include: (i) action to reduce transportation costs; (ii) a stronger focus on addressing non-
tariff barriers including mutual recognition of procedures applied in each member state to
ensure products meet agreed EAC standards; (iii) accelerating regulatory reform and action
to open up trade in services; (iv) streamlining trade across borders; (v) addressing supply
constraints in sectors with significant EAC export potential and facilitating diversification into
higher value added production and trade; (vi) more proactive awareness raising to promote
opportunities and manage concerns around the negative impacts of integration particularly in
8 Uganda Economic Update, Bridges across Borders – Unleashing Uganda’s regional trade potential,
World Bank February 2013.
45 | P a g e
relation to the small business sector. All these areas could fairly straightforwardly be
strategically integrated into current and future NDPs.
Harnessing the potential of Micro Small and Medium Sized Enterprises (MSMEs). The
private sector in Uganda is largely driven by growth of MSMEs. According to the Uganda
Private Sector Foundation9 MSMEs employ 2.5 million people and contributes 75 per cent of
the country’s GDP. Many MSMEs are small, young and informal. Less than 10 per cent of
Ugandan enterprises have operated for more than 20 years. In the course of this review
many challenges have arisen that are particularly relevant to SMEs (access to finance,
access to appropriate skills, technology and inputs) and any focus on agricultural
transformation will need to recognise that the majority of agri-businesses are MSMEs.
There are various initiatives across government to support SMEs that are sector based or sit
within cross cutting ministries such as the Ministry of Trade and the Uganda Investment
Authority. There are also many SME support initiatives operating outside government
including Enterprise Uganda and a host of NGO initiatives. The private sector is also active
in providing consultancy and business development advice to SMEs. What is lacking is an
over-arching strategy to address constraints to SME development and growth. Some of the
constraints highlighted include the increasing cost of production especially energy, the lack
of financing and its increasing costs and a lack of supporting infrastructure for SME growth.
Also of importance is the lack of a policy on SMEs. More recently, the costs of formalising
businesses have also tremendously increased and thereby encouraging SMEs to remain
informal. Enhancing the competitiveness of MSMEs will help generate inclusive growth and
employment across Uganda.
Investment performance
Another indicator of progress is the extent to which Uganda has attracted new investment
over the last few years. According to the World Bank Economic Outlook 2013 levels of
foreign direct Investment increased significantly. Uganda was the largest recipient of FDI in
East African. FDI increased from US$ 719 million in 2011/12 to US$ 1,405 million in 2012/13
which is equivalent to 8.3 per cent of GDP. However, much of this was focused on oil
exploration and tourism which will not necessarily have a transformational impact across the
9 PSFU Private Sector Platform for Action, March 2012.
46 | P a g e
wider economy. The need to attract investment to support diversification and investment to
support value addition particularly in agriculture is still pertinent.
Box 6: Snapshot of Investment Survey Findings (2012)
The Investors Survey presents the results of a survey carried out by the Uganda Bureau of Statistics
(UBOS) in collaboration with the Ugandan Investment Authority. Some of the key findings from the
2012 survey were as follows:
Only 46 per cent of licensed projects actually took off;
About 888 projects attracted investment worth US$2,861 million at implementation with
average actual investment per project estimated at $3.2 million. 53.5 per cent of the licenses
projects were foreign and 42.4 per cent domestic and 4.1 per cent were joint ventures. Nearly
46 per cent of foreign investment came from Asia and nearly 22 per cent from Europe. Most
projects were concentrated in the Central Region (78 per cent) and focused on manufacturing
(29 per cent), wholesale and retail (18 per cent) and accommodation and food service activity
(9 per cent);
Domestic Investors had 375 licensed projects attracting $1,284 million or an average per
project of $3.4 million. This compares with an average project size of $3.2 million for foreign
projects;
Total planned employment across the 888 projects was 123,144 of which casual/unskilled
labour constitutes about 67 per cent of the workforce;
Micro-Small and Medium Scale enterprises form the majority of the projects in numbers (653)
compared with large scale enterprises (235). Unsurprisingly their average investments were
$2.15 million per project compared with $6.2 million for large enterprises. Large scale
enterprises generated more jobs (61,069) compared with SMES (12,713);
Most firms finance their investment through retained earnings and equity finance (71 per
cent). The major bottleneck to investment financing was identified as high interest rates which
make acquisition of credit very difficult.
Source: Investors Survey Report 2012, UBOS and UIA.
4.2 Competitiveness and improving environment for “doing business” in
Uganda
The NDP and government policy place a strong premium on action to enhance
competitiveness and improving the business environment. The two benchmark surveys on
competitiveness are the World Bank Doing Business Report and the Global Competitiveness
Report of the World Economic Forum.
Doing Business Report findings
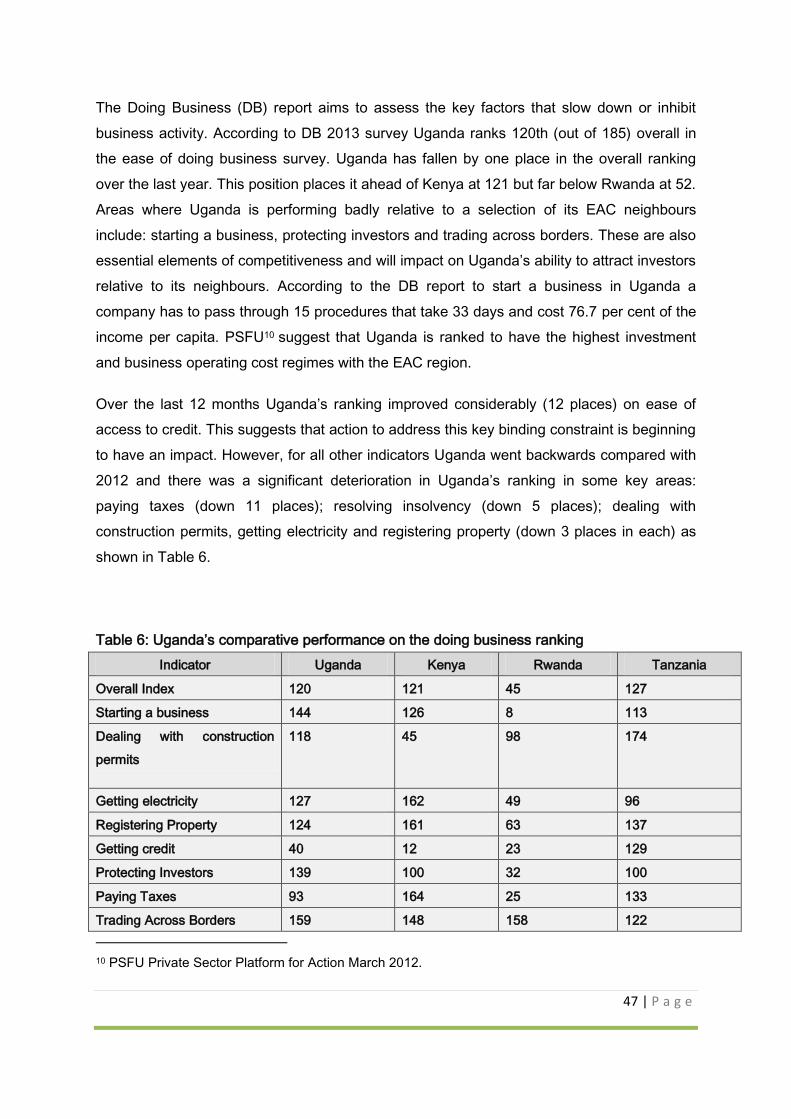
47 | P a g e
The Doing Business (DB) report aims to assess the key factors that slow down or inhibit
business activity. According to DB 2013 survey Uganda ranks 120th (out of 185) overall in
the ease of doing business survey. Uganda has fallen by one place in the overall ranking
over the last year. This position places it ahead of Kenya at 121 but far below Rwanda at 52.
Areas where Uganda is performing badly relative to a selection of its EAC neighbours
include: starting a business, protecting investors and trading across borders. These are also
essential elements of competitiveness and will impact on Uganda’s ability to attract investors
relative to its neighbours. According to the DB report to start a business in Uganda a
company has to pass through 15 procedures that take 33 days and cost 76.7 per cent of the
income per capita. PSFU10 suggest that Uganda is ranked to have the highest investment
and business operating cost regimes with the EAC region.
Over the last 12 months Uganda’s ranking improved considerably (12 places) on ease of
access to credit. This suggests that action to address this key binding constraint is beginning
to have an impact. However, for all other indicators Uganda went backwards compared with
2012 and there was a significant deterioration in Uganda’s ranking in some key areas:
paying taxes (down 11 places); resolving insolvency (down 5 places); dealing with
construction permits, getting electricity and registering property (down 3 places in each) as
shown in Table 6.
Table 6: Uganda’s comparative performance on the doing business ranking
Indicator Uganda Kenya Rwanda Tanzania
Overall Index 120 121 45 127
Starting a business 144 126 8 113
Dealing with construction
permits
118 45 98 174
Getting electricity 127 162 49 96
Registering Property 124 161 63 137
Getting credit 40 12 23 129
Protecting Investors 139 100 32 100
Paying Taxes 93 164 25 133
Trading Across Borders 159 148 158 122
10 PSFU Private Sector Platform for Action March 2012.
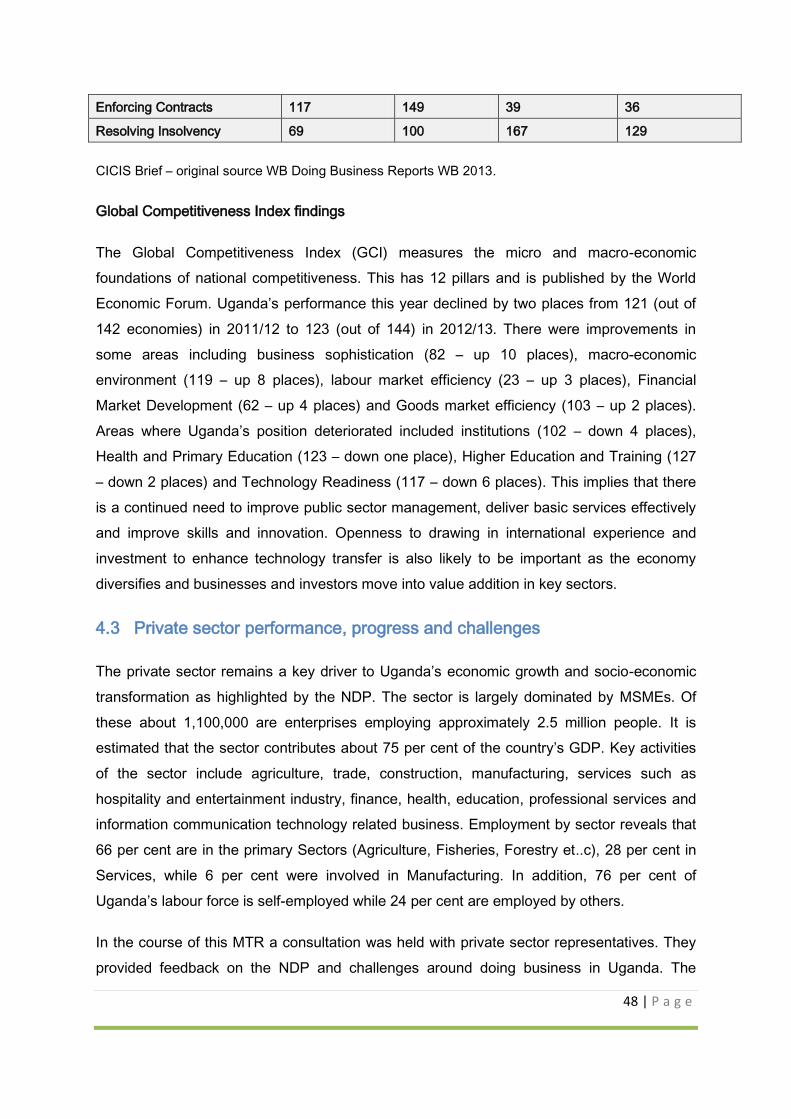
48 | P a g e
Enforcing Contracts 117 149 39 36
Resolving Insolvency 69 100 167 129
CICIS Brief – original source WB Doing Business Reports WB 2013.
Global Competitiveness Index findings
The Global Competitiveness Index (GCI) measures the micro and macro-economic
foundations of national competitiveness. This has 12 pillars and is published by the World
Economic Forum. Uganda’s performance this year declined by two places from 121 (out of
142 economies) in 2011/12 to 123 (out of 144) in 2012/13. There were improvements in
some areas including business sophistication (82 – up 10 places), macro-economic
environment (119 – up 8 places), labour market efficiency (23 – up 3 places), Financial
Market Development (62 – up 4 places) and Goods market efficiency (103 – up 2 places).
Areas where Uganda’s position deteriorated included institutions (102 – down 4 places),
Health and Primary Education (123 – down one place), Higher Education and Training (127
– down 2 places) and Technology Readiness (117 – down 6 places). This implies that there
is a continued need to improve public sector management, deliver basic services effectively
and improve skills and innovation. Openness to drawing in international experience and
investment to enhance technology transfer is also likely to be important as the economy
diversifies and businesses and investors move into value addition in key sectors.
4.3 Private sector performance, progress and challenges
The private sector remains a key driver to Uganda’s economic growth and socio-economic
transformation as highlighted by the NDP. The sector is largely dominated by MSMEs. Of
these about 1,100,000 are enterprises employing approximately 2.5 million people. It is
estimated that the sector contributes about 75 per cent of the country’s GDP. Key activities
of the sector include agriculture, trade, construction, manufacturing, services such as
hospitality and entertainment industry, finance, health, education, professional services and
information communication technology related business. Employment by sector reveals that
66 per cent are in the primary Sectors (Agriculture, Fisheries, Forestry et..c), 28 per cent in
Services, while 6 per cent were involved in Manufacturing. In addition, 76 per cent of
Uganda’s labour force is self-employed while 24 per cent are employed by others.
In the course of this MTR a consultation was held with private sector representatives. They
provided feedback on the NDP and challenges around doing business in Uganda. The
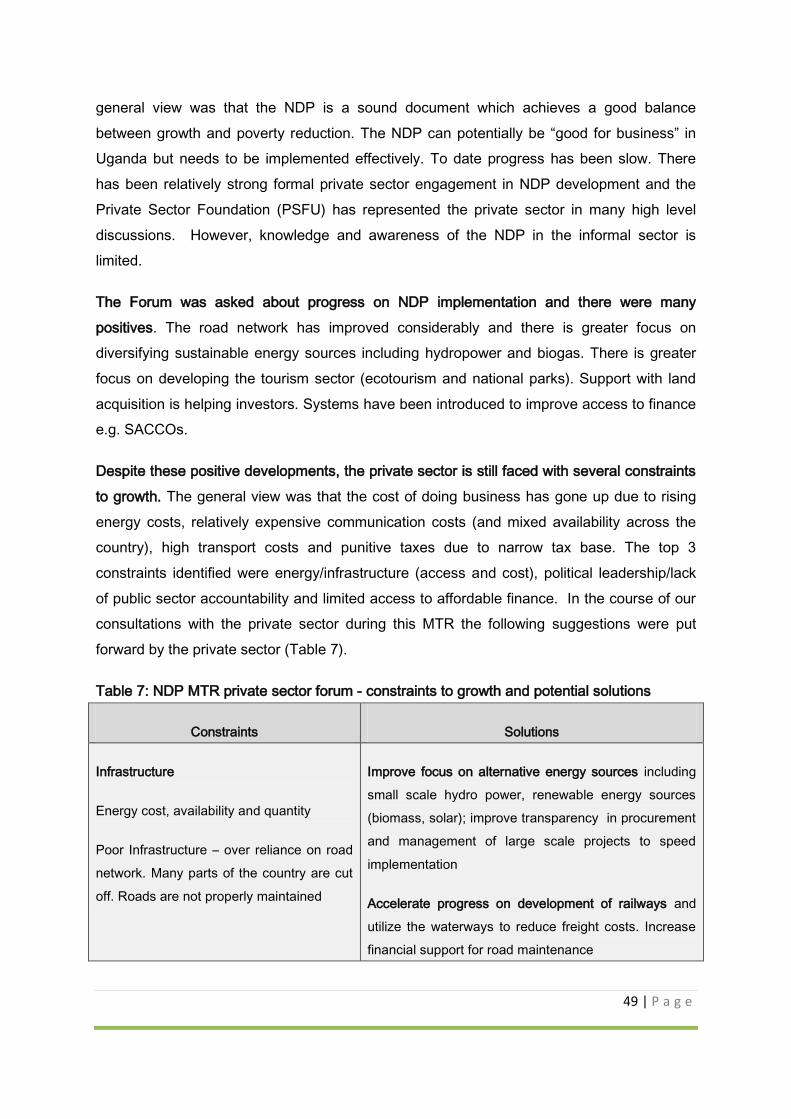
49 | P a g e
general view was that the NDP is a sound document which achieves a good balance
between growth and poverty reduction. The NDP can potentially be “good for business” in
Uganda but needs to be implemented effectively. To date progress has been slow. There
has been relatively strong formal private sector engagement in NDP development and the
Private Sector Foundation (PSFU) has represented the private sector in many high level
discussions. However, knowledge and awareness of the NDP in the informal sector is
limited.
The Forum was asked about progress on NDP implementation and there were many
positives. The road network has improved considerably and there is greater focus on
diversifying sustainable energy sources including hydropower and biogas. There is greater
focus on developing the tourism sector (ecotourism and national parks). Support with land
acquisition is helping investors. Systems have been introduced to improve access to finance
e.g. SACCOs.
Despite these positive developments, the private sector is still faced with several constraints
to growth. The general view was that the cost of doing business has gone up due to rising
energy costs, relatively expensive communication costs (and mixed availability across the
country), high transport costs and punitive taxes due to narrow tax base. The top 3
constraints identified were energy/infrastructure (access and cost), political leadership/lack
of public sector accountability and limited access to affordable finance. In the course of our
consultations with the private sector during this MTR the following suggestions were put
forward by the private sector (Table 7).
Table 7: NDP MTR private sector forum - constraints to growth and potential solutions
Constraints Solutions
Infrastructure
Energy cost, availability and quantity
Poor Infrastructure – over reliance on road
network. Many parts of the country are cut
off. Roads are not properly maintained
Improve focus on alternative energy sources including
small scale hydro power, renewable energy sources
(biomass, solar); improve transparency in procurement
and management of large scale projects to speed
implementation
Accelerate progress on development of railways and
utilize the waterways to reduce freight costs. Increase
financial support for road maintenance
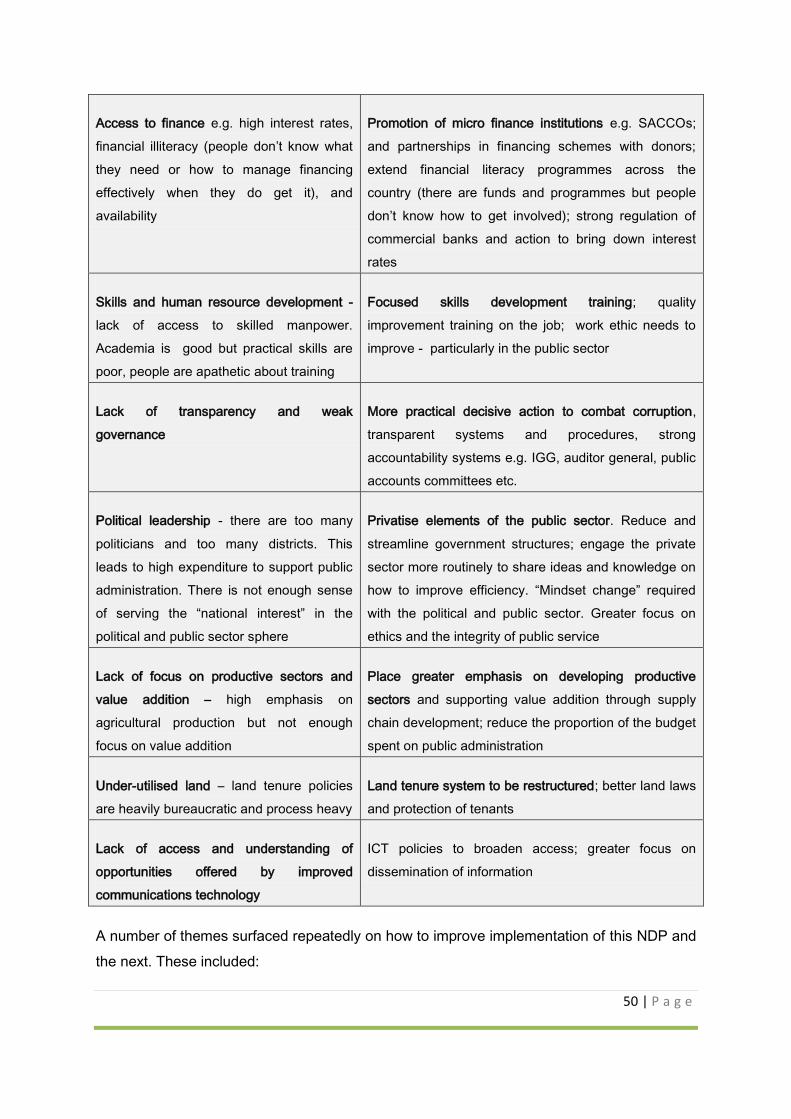
50 | P a g e
Access to finance e.g. high interest rates,
financial illiteracy (people don’t know what
they need or how to manage financing
effectively when they do get it), and
availability
Promotion of micro finance institutions e.g. SACCOs;
and partnerships in financing schemes with donors;
extend financial literacy programmes across the
country (there are funds and programmes but people
don’t know how to get involved); strong regulation of
commercial banks and action to bring down interest
rates
Skills and human resource development -
lack of access to skilled manpower.
Academia is good but practical skills are
poor, people are apathetic about training
Focused skills development training; quality
improvement training on the job; work ethic needs to
improve - particularly in the public sector
Lack of transparency and weak
governance
More practical decisive action to combat corruption,
transparent systems and procedures, strong
accountability systems e.g. IGG, auditor general, public
accounts committees etc.
Political leadership - there are too many
politicians and too many districts. This
leads to high expenditure to support public
administration. There is not enough sense
of serving the “national interest” in the
political and public sector sphere
Privatise elements of the public sector. Reduce and
streamline government structures; engage the private
sector more routinely to share ideas and knowledge on
how to improve efficiency. “Mindset change” required
with the political and public sector. Greater focus on
ethics and the integrity of public service
Lack of focus on productive sectors and
value addition – high emphasis on
agricultural production but not enough
focus on value addition
Place greater emphasis on developing productive
sectors and supporting value addition through supply
chain development; reduce the proportion of the budget
spent on public administration
Under-utilised land – land tenure policies
are heavily bureaucratic and process heavy
Land tenure system to be restructured; better land laws
and protection of tenants
Lack of access and understanding of
opportunities offered by improved
communications technology
ICT policies to broaden access; greater focus on
dissemination of information
A number of themes surfaced repeatedly on how to improve implementation of this NDP and
the next. These included:
51 | P a g e
Role of the Public Sector: address political patronage and reduce political interference.
Government should focus on provision of social services and enhance support to
develop the productive sectors of the economy (e.g. agriculture, skills) and infrastructure.
Streamline the public sector and improve governance. Encourage mind-set change. The
public sector need to do business “unusually” and apply a more “business minded”
approach to service delivery which focuses on the customer, efficiency quality and value
for money.
Enhance Public Private Partnership (PPP) approach: look for ways to enhance dialogue
with the private sector recognising that the private sector is the “engine of growth”.
Accelerate progress on the PPP Bill. Through a PPP model sectors (public, private, civil
society) can work together to enable proper provision of goods and services and
effective implementation. Government needs to facilitate this. More examples of effective
PPPs are presented later in this report.
Investor Views on Key Constraints
Recent Investors Surveys also provide information on constraints to business operations and
growth. The key findings from the 2011 survey are included in Box 7. These reaffirm the
importance of improving infrastructure and simplification of the regulatory environment facing
businesses.
As PSFU succinctly state in their 2012 Private Sector Platform for Action “the need for an
enabling business environment to boost investment growth cannot be over-emphasised…the
Government of Uganda must hence forth give priority consideration to the competitiveness
and growth barriers in its distribution of development resources if indeed Uganda is to
remain a private sector led economy”.
Recognising the importance of addressing problems identified in the Doing Business Survey
the Government established a Doing Business Reform Task force in August 2009 which
continues to work on promoting action to improve competitiveness across government. This
Task Force has representation across government and the private sector and is mandated to
review performance, make recommendations and lobby for appropriate reform action. It
monitors progress on reform and coordinates information flows across government
agencies.
The Government has also developed a Competitiveness and Investment Climate Strategy
(CICS) which has focused on accelerating progress on action to improve the business
52 | P a g e
environment including business registration and land reform. This approach has been
supported by the World Bank. CICs work is now beginning to bear fruit in some key areas
including business licensing and land registration.
Business registration is getting easier and quicker, but more costly especially to small
business owners. The legal framework governing the Uganda Registration Services Bureau
(URSB) was established in 1998 but it did not become an operational semi-autonomous
body until 2012. According to the Registrar General the time taken to register with the right
documentation is now 2-5 days as compared with the 33 days cited in the Doing Business
Report. They have taken various measures to speed up the process including partnering
with a Bank to speed payment and development of an e-portal for business licenses. This
currently only provides information but over time it will become a transactional system.
URSB is also setting up regional satellite offices although their operations will be constrained
by very limited running costs. Since 2011/12 revenues generated by URSB have increased
by 500 per cent and they have potential to increase their outreach with additional running
costs for communications and development of regional operations. They have benefited from
increased funding already but argue that higher funding would help bring more businesses
into the formal sector with positive knock on effects on growth and government revenues.
Over the next year the URSB will be working with other parts of government and the World
Bank to implement a range business licensing reforms.
Other recent encouraging reforms include computerisation of the land registry and support to
improve operations of 6 zonal land offices, approval of the companies act and insolvency act
which both come into effect in July 2013.
There are other good examples of where government departments have embraced the
competiveness challenge posed in the NDP. The Uganda National Standards Bureau
(UNBS) is an example of where they have strongly aligned their policy and practices with the
NDP (Box xx). In 2012 they finalised a new National Standards and Quality policy that
embraces priorities highlighted in the NDP. They are making progress but face a number of
challenges around mainstreaming a “quality and standards” culture both within the private
sector and across government.
Overall it is evident that there has been progress on action to improve competitiveness but
there have also been some steps backwards and businesses continue to find the operating
environment in Uganda very challenging. Progress on developing and implementing the
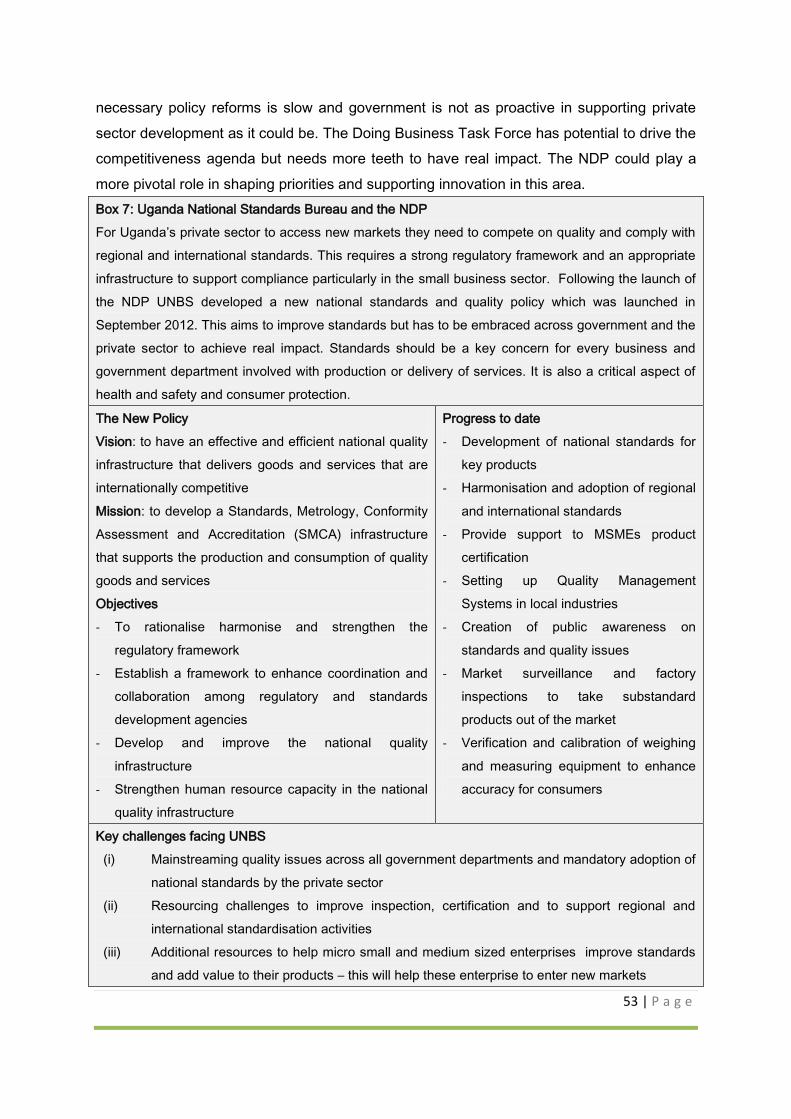
53 | P a g e
necessary policy reforms is slow and government is not as proactive in supporting private
sector development as it could be. The Doing Business Task Force has potential to drive the
competitiveness agenda but needs more teeth to have real impact. The NDP could play a
more pivotal role in shaping priorities and supporting innovation in this area.
Box 7: Uganda National Standards Bureau and the NDP
For Uganda’s private sector to access new markets they need to compete on quality and comply with
regional and international standards. This requires a strong regulatory framework and an appropriate
infrastructure to support compliance particularly in the small business sector. Following the launch of
the NDP UNBS developed a new national standards and quality policy which was launched in
September 2012. This aims to improve standards but has to be embraced across government and the
private sector to achieve real impact. Standards should be a key concern for every business and
government department involved with production or delivery of services. It is also a critical aspect of
health and safety and consumer protection.
The New Policy
Vision: to have an effective and efficient national quality
infrastructure that delivers goods and services that are
internationally competitive
Mission: to develop a Standards, Metrology, Conformity
Assessment and Accreditation (SMCA) infrastructure
that supports the production and consumption of quality
goods and services
Objectives
- To rationalise harmonise and strengthen the
regulatory framework
- Establish a framework to enhance coordination and
collaboration among regulatory and standards
development agencies
- Develop and improve the national quality
infrastructure
- Strengthen human resource capacity in the national
quality infrastructure
Progress to date
- Development of national standards for
key products
- Harmonisation and adoption of regional
and international standards
- Provide support to MSMEs product
certification
- Setting up Quality Management
Systems in local industries
- Creation of public awareness on
standards and quality issues
- Market surveillance and factory
inspections to take substandard
products out of the market
- Verification and calibration of weighing
and measuring equipment to enhance
accuracy for consumers
Key challenges facing UNBS
(i) Mainstreaming quality issues across all government departments and mandatory adoption of
national standards by the private sector
(ii) Resourcing challenges to improve inspection, certification and to support regional and
international standardisation activities
(iii) Additional resources to help micro small and medium sized enterprises improve standards
and add value to their products – this will help these enterprise to enter new markets
54 | P a g e
(iv) A standards awareness campaign across government, industry and consumers to spark
mind set change and create a “quality culture” across Uganda11
Source: UNBS Briefing Note for Mid Term Review, May 2012 and National Standards and
Quality Policy, September 2012.
11
UNBS briefing note prepared for the NDP Mid Term Review.
55 | P a g e
5 FINANCING OF THE NDP
This section reviews the financing assumptions underpinning the NDP and looks at the
scope for harnessing additional finance to accelerate progress. It also looks at opportunities
and constraints to enhancing Public Private Partnerships and other innovative financing
mechanisms. The section also focuses on the extent to which additional private sector and
public investment funds been harnessed to finance NDP priorities.
5.1 NDP financing strategy
The NDP when conceived was based on an ambitious but quite clear financing strategy. It
assumed that funding would be provided through the following sources:
Efficiency gains in spending: reallocating resources to priority sectors and achieving
efficiency gains through strengthening the link between public spending and output/results,
strengthening regulations and compliance, increasing public sector productivity, reducing
corruption and red tape, reducing duplication of functions.
Domestic revenue mobilisation would increase through: (i) expansion of the tax base
through bringing the informal sector into the tax bracket; (ii) reform of the structure of
taxation and (iii) extensive re-organisation of the institutions that administer taxes to improve
tax collection efficiency and compliance with a focus on enhancing Vat returns; (iv)
expansion of non-tax revenues including a review of all its rates and (v) streamlining existing
exemptions and tax incentive policies.
Public Private Partnerships: promoting and encouraging PPP in various forms. Careful
analysis will be made in deciding the form of PPP that has the highest economic benefit to
the country and is most suitable for the public and private sector before any form of PPP is
recommended. These will be particularly encouraged and promoted in infrastructure and
energy.
Grants and loans: in the long run the government will seek to fund its budget purely from
domestic revenues and this will be made more achievable when oil and gas revenues come
on stream. However, in the short to medium term government will continue to seek foreign
assistance to support budget implementation. The strategy for this will be guided by the
Government Aid Policy. Government will also continue to seek out concessional loans and
explore the scope for enhancing private sector investment in priority areas working with UIA.
56 | P a g e
Borrowing from capital markets: a potential new innovation in the NDP was the proposal to
seek financing through capital markets. As well promoting and developing capital markets
through sound regulation the NDP proposed to develop the appropriate framework to
facilitate issuance of sovereign bonds to raise the necessary funds for investment in the
priority sectors – particularly infrastructure and energy. The NDP also anticipated that
liberalisation of the pension sector could act as a source of finance. This would focus on
ensuring adequate protection of savings whilst leveraging domestic private savings in the
form of pension and related to funds to provide long term finance for investments in the
domestic economy.
5.2 Progress on implementation of financing strategy
Earlier sections of this report and other thematic reports address different elements of this
financing strategy. Progress on harnessing additional foreign assistance is covered in the
Development Partnerships Thematic Report. This section therefore focuses on domestic
revenue mobilisation, the potential to expand borrowing and progress on innovative
financing mechanisms such as PPPs and instruments that can draw in funding from capital
markets.
The structure of government financing is changing. It is clear from Table 8 is that Uganda is
going through a period of fiscal adjustment. This year and in the future there will be an
increasing need to finance core expenditure and new investments through own resources.
This trend is being felt across East Africa as donors are both reducing levels of funding and
changing the instruments they are using to support countries such as Uganda. In 2009/10
budget and project support constituted 2.4 per cent GDP. This is estimated to fall to 1.7 per
cent in 2012/13. In addition a higher proportion of funding (1.4 per cent GDP, 77 per cent of
grants) will be in the form of project rather than budget support. This compares with project
funds amounting to 1.1 per cent GDP and 44 per cent of grant funding in 2009/10.
Disbursement rates on projects tend to be lower than budget support and government has
less control and influence over where and how these funds are spent. The Development
Partnerships thematic report explores more fully what might be done to enhance and align
donor funds in support of the NDP. Nevertheless, government programmes and new
investment projects will increasingly need to be financed through a combination of efficiency
savings, taxes, higher borrowing and innovative financing mechanisms.
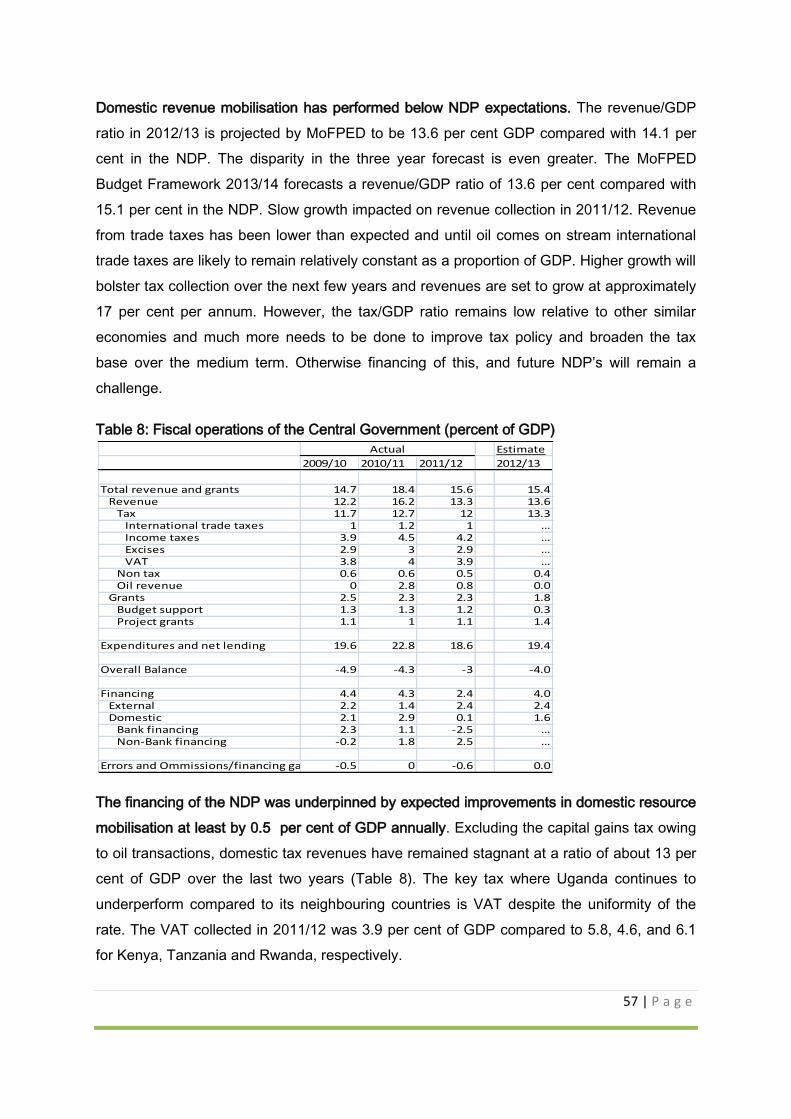
57 | P a g e
Domestic revenue mobilisation has performed below NDP expectations. The revenue/GDP
ratio in 2012/13 is projected by MoFPED to be 13.6 per cent GDP compared with 14.1 per
cent in the NDP. The disparity in the three year forecast is even greater. The MoFPED
Budget Framework 2013/14 forecasts a revenue/GDP ratio of 13.6 per cent compared with
15.1 per cent in the NDP. Slow growth impacted on revenue collection in 2011/12. Revenue
from trade taxes has been lower than expected and until oil comes on stream international
trade taxes are likely to remain relatively constant as a proportion of GDP. Higher growth will
bolster tax collection over the next few years and revenues are set to grow at approximately
17 per cent per annum. However, the tax/GDP ratio remains low relative to other similar
economies and much more needs to be done to improve tax policy and broaden the tax
base over the medium term. Otherwise financing of this, and future NDP’s will remain a
challenge.
Table 8: Fiscal operations of the Central Government (percent of GDP)
The financing of the NDP was underpinned by expected improvements in domestic resource
mobilisation at least by 0.5 per cent of GDP annually. Excluding the capital gains tax owing
to oil transactions, domestic tax revenues have remained stagnant at a ratio of about 13 per
cent of GDP over the last two years (Table 8). The key tax where Uganda continues to
underperform compared to its neighbouring countries is VAT despite the uniformity of the
rate. The VAT collected in 2011/12 was 3.9 per cent of GDP compared to 5.8, 4.6, and 6.1
for Kenya, Tanzania and Rwanda, respectively.
Estimate
2009/10 2010/11 2011/12 2012/13
Total revenue and grants 14.7 18.4 15.6 15.4Revenue 12.2 16.2 13.3 13.6
Tax 11.7 12.7 12 13.3International trade taxes 1 1.2 1 …Income taxes 3.9 4.5 4.2 …Excises 2.9 3 2.9 …VAT 3.8 4 3.9 …
Non tax 0.6 0.6 0.5 0.4Oil revenue 0 2.8 0.8 0.0
Grants 2.5 2.3 2.3 1.8Budget support 1.3 1.3 1.2 0.3Project grants 1.1 1 1.1 1.4
Expenditures and net lending 19.6 22.8 18.6 19.4
Overall Balance -4.9 -4.3 -3 -4.0
Financing 4.4 4.3 2.4 4.0External 2.2 1.4 2.4 2.4Domestic 2.1 2.9 0.1 1.6
Bank financing 2.3 1.1 -2.5 …Non-Bank financing -0.2 1.8 2.5 …
Errors and Ommissions/financing gap -0.5 0 -0.6 0.0
Actual
58 | P a g e
The poor performance can be attributed to the wide spread use of tax incentives on
intermediate goods targeted to attract investors. Exemptions cover a range of areas and link
to supply of specialist products linking to power generation, ICT and inputs to agriculture and
agro-processing12. These incentives have undermined VAT collections and the estimated
losses from these exemptions are about 2 per cent of GDP. In addition, there are tax
holidays on corporate income tax (CIT) for export businesses and agro-processing firms.
There is scope over the medium term to also extend VAT to the retail sector which would
significantly boost revenues.
Some effort was made to streamline tax incentives in 2012/13 and the 2013 budget
announces a number of areas where VAT exemptions are being eliminated including hotel
accommodation, supply of water, wheat and flour. Whilst these exemptions may aim to
boost performance of primary and complementary sectors they create distortions,
inefficiencies and are subject to abuse. Alternative policy measures need to be explored to
boost productivity so these exemptions can be phased out in the very near term. As a
general rule tax incentives should be used sparingly and where they are used they should be
temporary. Some areas where tax incentives can make sense are tax holidays to support
investment in infant industries or presumptive tax measures for start-up businesses to
improve their profitability in the early years. The rationale underpinning exemptions should
be clear and transparent. In the near term the government should focus on developing a
more structured approach to reducing exemptions, extending VAT coverage and firming up
key principles that would govern use of tax incentives.
12 Exemptions include: (i) supply of petroleum fuels subject to excise duty, except for kerosene (motor
spirit, gas oil, spirit type jet fuel, kerosene type jet fuel, as well as residual oils for use in thermal
power generation to the national grid); (ii) Supply of any goods and services to the contractor and
subcontractors of hydro-electric power projects; (iii) Supply of specialized vehicles, plant and
machinery, feasibility studies, engineering designs, consultancy services and civil works related to
hydro-electric power, roads and bridges construction, public water works, agriculture, education and
health sectors; (iv) Supply of computers, computer parts and accessories, computer software and
software licenses, printers and accessories; (v) supply of machinery used for the processing of
agricultural or dairy products; (vi) supply of packaging material exclusively used by the milling
industry for packing milled products or used by the dairy industry for packing milk; and (vii) supply of
feeds for poultry and livestock.
59 | P a g e
The audit function of the URA may require further strengthening to enhance collection of
revenues from especially the medium and large tax payers. To strengthen the audit function
of the URA, the Authority will need to intensify its efforts to enforce compliance on the
different types of taxpayers (large, medium and small), to continue expansion of the audit
coverage to include the bulk of the largest traders and to conduct joint audits in the domestic
tax and customs departments to detect and sanction non-compliance and fraud in a number
of taxes.
The government is taking a number of other measures to improve tax compliance. The
Uganda Revenue Authority (URA) has taken action to improve its performance. There is a
strong focus in this year’s budget around expanding the coverage of audit and giving URA
greater powers to determine taxpayers’ liability. URA is introducing e-tax modernisation
strategies (e-registration, e-filing, e-payment etc.) and other measures to improve tax
administration. The establishment of a national identification system will also help to curb tax
evasion. Many of these measures will help improve compliance. However, Uganda needs to
balance a rigid focus on compliance with measures to broaden the tax base.
Already the Doing Business Report is sending warning signals that the tax regime in Uganda
is not as conducive as it could be to “doing business”. If companies are taxed too heavily or
businesses evaluate that tax compliance comes at too high cost in terms of time spent
dealing with the tax authorities, then they may choose to locate their business elsewhere or
move below the tax radar.
In order to bring more businesses into the tax net the government needs to take an all of
government approach. They need to ensure that the benefits of formalisation outweigh the
costs of compliance. This links to reforms required to make it easier to do business in
Uganda e.g. simplifying registration, licensing, ensuring appropriate, efficient enforcement
and compliance, ensuring the private sector is treated as a client and demonstrating the
benefits of compliance in terms of new business opportunities. ICT is a valuable tool to help
modernise government systems and services and there are many examples of how this is
being used innovatively to good effect. Expansion of the tax base is not just a matter of tax
policy and administration it is about taking an “all of government approach” to incentivising
formalisation.
Another potential source of revenue going forward is non-tax revenues. Fees and licenses
are currently the major source of NTR and whilst these constitute a small proportion of total
60 | P a g e
revenues there is potential for them to grow as the private sector expands. The Ugandan
Registration Services Bureau has seen impressive growth in revenues since it became
operational in 2012. It increased revenue by 500 per cent in the course of 2012/13 through a
focus on improving services to clients and a strong focus on efficiency. If this performance
could be emulated in other agencies then there is scope for NTR to become a growing
source of government finance.
Another trend over the last 2 years has been to centralise collection of NTRs. From a budget
efficiency and control perspective it makes sense to centralise NTR collections and to
allocate resources through the consolidated budget. However, there is a risk that this could
reduce incentives for MDAs to maximise NTRs if they see no concrete benefit from
improving their performance on NTR collections. Different business models or performance
contracts could be considered for agencies that have significant revenue raising potential.
They could be allowed to retain some portion of revenues to support expansion of NTRs if
the business case is clear. Alternatively incentives could be built into the budget process.
Budget allocations could be increased if a clear business case is presented that shows that
increased funding will generate additional revenues over and beyond the budgetary cost. In
short there is a strong case for exploring further how non tax revenues could be enhanced
by increased their scope, or using innovative business models to incentivise higher collection
rates.
Local government taxation is a potential future source of revenue to enhance service
provision at the local level. At present the tax system is highly centralised whereas many
services and functions are handled at the district level. Lack of funding to support NDP
priorities and service delivery have been flagged as problems in districts (see Annex 1) and
local governments are currently dependent on receiving necessary transfers from central
government as they have no authority to raise revenue locally. One potential source of local
revenue would be property taxes. However, land management systems and institutions
would need to be much more effective and regionalised for this to be implemented effectively
outside of urban areas. It is beyond the scope of the Thematic Paper to explore the pros and
cons of local taxation as this is a complex issue. It also links to wider more fundamental
questions around whether the current structure of government is fit for purpose in terms of
delivering high quality services in support of NDP priorities. However, this may be an issue
to return to over the medium term.
61 | P a g e
As with the overall budget, the first step should be to explore efficiency and value for money
savings. If core NDP priorities cannot be financed through efficiency savings then options for
increasing local government funding should be explored further as part of the financing
strategy for the next NDP. One option could be local taxation including property taxes but
this would need to be weighed against other alternatives. However, a clear finding from the
district visits is that when District Development Plans were formulated there was insufficient
linkage with the budget process and the wider financing strategy for the NDP.
New measures to enhance revenue mobilisation need to go hand in hand with improved
service delivery and public sector performance. Every taxpayer has a strong stake in
implementation of the National Development Plan. If they are being asked to contribute
funds to finance new programmes and projects they need to be convinced that money is
being spent on the right things and is achieving tangible results in terms of provision of
higher quality services, improved infrastructure, a more responsive and efficient public sector
and lower levels of corruption. Individuals and businesses should be kept well informed on
how additional taxes are being used to improve livelihoods, economic development and
competitiveness. Otherwise tax evasion, avoidance and weak compliance will undermine
efforts to increase domestic resource mobilisation.
Scope for increasing domestic and external borrowing
There is still scope to finance the priorities of the NDP through borrowing especially at
concessional terms externally and the domestic market. Section 2 explored in some detail
the challenges around increasing levels of borrowing to support NDP implementation.
However, in terms of financing opportunities there is good evidence to suggest that Uganda
could potentially increase borrowing and remain viable in terms of debt sustainability. In May
2012 a joint IMF/World Bank Debt Sustainability Analysis (DSA) was completed. The general
conclusion was:
“Uganda continues to be assessed as low risk of debt distress based on the low income
country debt sustainability analysis despite recent challenges to the economy from high
inflation, weakening external demand and slower growth.”13
Whilst debt sustainability deteriorated slightly compared to the 2011 DSA, the debt
sustainability indicators suggest Uganda is below the required thresholds and that there is
13
Joint IMF/World Bank Debt Sustainability Analysis 2012 Update – May 18 2012.
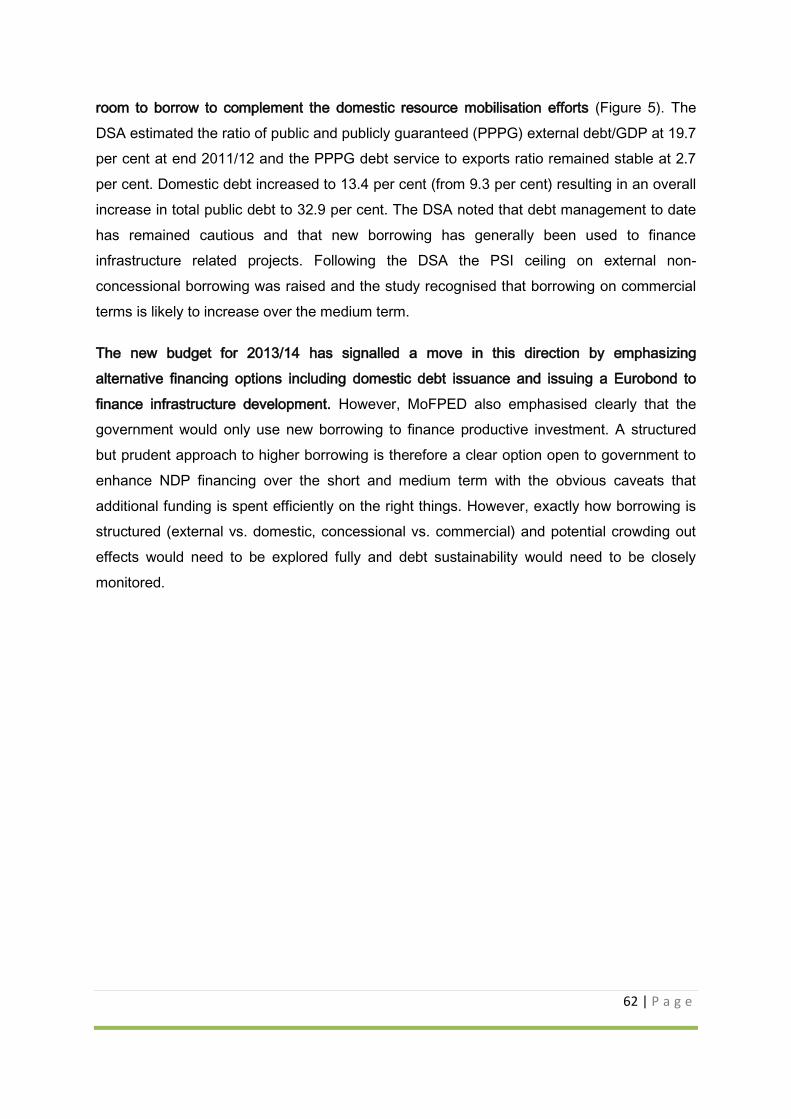
62 | P a g e
room to borrow to complement the domestic resource mobilisation efforts (Figure 5). The
DSA estimated the ratio of public and publicly guaranteed (PPPG) external debt/GDP at 19.7
per cent at end 2011/12 and the PPPG debt service to exports ratio remained stable at 2.7
per cent. Domestic debt increased to 13.4 per cent (from 9.3 per cent) resulting in an overall
increase in total public debt to 32.9 per cent. The DSA noted that debt management to date
has remained cautious and that new borrowing has generally been used to finance
infrastructure related projects. Following the DSA the PSI ceiling on external non-
concessional borrowing was raised and the study recognised that borrowing on commercial
terms is likely to increase over the medium term.
The new budget for 2013/14 has signalled a move in this direction by emphasizing
alternative financing options including domestic debt issuance and issuing a Eurobond to
finance infrastructure development. However, MoFPED also emphasised clearly that the
government would only use new borrowing to finance productive investment. A structured
but prudent approach to higher borrowing is therefore a clear option open to government to
enhance NDP financing over the short and medium term with the obvious caveats that
additional funding is spent efficiently on the right things. However, exactly how borrowing is
structured (external vs. domestic, concessional vs. commercial) and potential crowding out
effects would need to be explored fully and debt sustainability would need to be closely
monitored.
63 | P a g e
Figure 5: Debt sustainability indicators
Innovative Financing Mechanisms
Public Private Partnerships (PPPs) were expected to be an important source of private
sector financing for the NDP. Within the MTEF underpinning the NDP there was an
unfunded segment amounting to 18 per cent of the total funding envelope for the NDP – it
was expected that some of this funding would come from the private sector. Even more
significantly the financing envelope for National Core projects anticipated that nearly 62 per
cent of funding would come from the private sector including public private partnerships.
0
10
20
30
40
50
60
2011 2012 2013 2014 2015 2016 2017 2018
Nominal Debt/GDP
Nominal Debt/GDP-Threshold
0
20
40
60
80
100
120
140
160
2012 2013 2014 2015 2016 2017 2018
PV of Debt to GDP
PV of Debt to GDP-Threshold
0
50
100
150
200
250
300
350
2012 2013 2014 2015 2016 2017 2018
PV of Debt to Revenue
PV of Debt to Revenue-Threshold
0
5
10
15
20
25
30
35
40
20112012201320142015201620172018
Debt Service to Revenue Threshold
64 | P a g e
These investments would be focused in particular on development of regional projects linked
to development of the energy sector, construction of hydro power plants and projects linked
to industrial development. As Chapter 5 described many of the planned energy projects have
proceeded slowly and private sector financing has been hampered by slow progress on
establishing the legal framework for public private partnerships.
Other countries, including Kenya and Malaysia have used PPPs to support financing of their
National Development Plans. PPPS require good planning and evaluation capacity for
feasibility studies, availability of the necessary technical skills at sector and government
level, strong oversight and leadership both centrally and in sectors to drive development and
implementation of PPPs, competitive and transparent procurement, well organised public
agencies and strong M&E capacity. In addition there needs to be a conductive
macroeconomic environment, an appropriate regulatory framework in place, predictability in
the policy environment and adequate protection of investors.
Box 9 Public Private Partnerships in Malaysia
PPPs have existed in various guises in Malaysia since the 1980s but it was under the 9th National
Plan (2006-2010) that the Government officially announced the implementation of public projects
using the PPP or Private Finance Initiative (PFI) scheme. PPPs have proven integral to the socio-
economic development of Malaysia and have resulted in the completion of numerous large-scale
infrastructure projects such as the series of PLUS expressways 9973km), the privatisation of Penang
Port, and the high speed KLIA express and transit rail lines. In 2012 there were 52 projects, totalling
RM62.7b ($20bn), in the planning or implementation stage.
The importance of trade in the Malaysian economy has made it imperative for the Government to
provide an environment that is conducive to doing business. Recognising that the traders’ ability to
move goods across borders rapidly, reliably and cost effectively leads to enhanced export
competitiveness, Malaysia has taken concrete steps, over the last three decades, to evolve and
implement various trade facilitation initiatives.
The Government is encouraging the private sector to invest in development projects whether through
PPP or through direct investment by the private sector in the country’s development programme.
Public-private sector collaborative mechanisms have contributed to making it easier to do business in
Malaysia. There have been continued improvements on many fronts, specifically in enhancing
transparency and streamlining procedures and practices. Public-private sector consultations have
also provided useful inputs during the review of the existing policies such as the Distributive Trade
Guidelines, Competition Policy, Government Procurement and Foreign Investment Committee
65 | P a g e
Guidelines.
A pipeline of PPP projects was developed with World Bank in 2012 which included some
NDP projects. The projects that look most likely to move forward as PPPs include
development of Kampala-Jinja Road, construction of an oil refinery, Kigo Prision, Office
accommodation for the Ministry of Lands, Housing and Urgan Development and
development of Entebbe Airport. Some of the pipeline projects are now likely to be funded
through bilateral arrangements including the hydro-power projects in Ayago and Isimba.
Some mini-hydro projects are moving forward and the design of these projects and a
number of roads projects has been facilitated by IFC. The World Bank has signalled that
they stand ready to support financing of PPPs once the appropriate framework is in place.
Strong leadership and commitment is needed at the top of government to drive this forward
so PPPs can become a key source of finance for the next NDP.
In addition the right institutions and regulatory framework need to be established quickly.
Box 10 describes some of the longer term challenges around extending use of PPPs drawn
from emerging experience in Uganda. The PPP policy has already been approved and forms
the basis of the bill that is currently with Parliament. Some of the key challenges to be
addressed include establishing an institutional lead on PPPs which would most likely be
based in the MoFPED. This body would lead, drive and support development and delivery of
PPPs. MDAs need training on how to manage and regulate PPPs and project and financial
management skills need to be upgraded across government. This capacity development
work would need to begin now for more PPPs to be investment ready for the next NDP.
Box 10: Challenges to extending the scope of PPPs in Uganda
Unpredictable investment environment. This was also reflected in Uganda’s ranking in the
Doing Business Report.
Lack of a clear legislative framework. A policy was approved and a law has been developed
but progress through Parliament needs to be accelerated.
Limitations on foreign ownership and restrictive regulatory conditions on project rates of
return.
Excessive bureaucracy and poor coordination between government departments. Lack of
technical skills and awareness of PPPs in government. This needs to be addressed
strategically to ensure all necessary departments are equipped with the skills they need to
help design and manage PPPs.
Lack of long term financing. It remains challenging to access long term finance through
Capital Markets and local finance institutions. This leads to a heavy reliance on foreign capital
66 | P a g e
which introduces exchange rate risk.
Source: State of Uganda Population Report 2012
However, there are examples of success stories that Uganda can learn from. The recent
State of Uganda Population Report 2012 produced by UNFPA and the Population
Secretariat provides a summary of progress on developing and implementing PPPs across a
range of sectors (see Box 11). Many of these pre-date the NDP but what is clear is that there
is an emerging body of good practice on PPPs across a range of sectors. It will be critical to
learn from and build on these success stories.
Health is often held up as a PPP success story. A National Policy on Public Private
Partnership has been developed and submitted to Cabinet. This establishes the institutional
and legal framework to formalise PPPs across the health sector. Approval of this policy
needs to be fast tracked and complemented with an innovative health financing strategy that
will draw in new sources of finance and service providers. The Uganda Health Care
Federation has been established and this acts as an umbrella organisation which brings
together private sector organisations in the health sector. It helps to coordinate, lobby and
represent private sector associations. So far 27 associations have enrolled into UHCF.
Some innovative PPP pilots are now being scaled up (see Box 11). These innovative
projects are leading to improvements in service delivery efficiency and value for money.
What is clear is that there is potential to extend PPP models across government to improve
access and quality of services, efficiency and value for money and to energise private sector
provision of goods and services in support of NDP goals and priorities. Government needs to
have strong oversight of new service delivery arrangements and must robustly monitor and
audit service provision. However, there is scope for the private sector to deliver more and
better services in support of key NDP priorities. In addition the PPP framework provides a
basis for engaging donors, NGOs and civil society organisations that support or deliver
services in areas such as health, education, water. This approach is also being used to
support delivery of vocational training and could be extended to areas such as business
development support and agricultural extension services. The next NDP could potentially
make PPPs a centre piece of both its financing and delivery strategy.
Box 11: Good Practice on PPPs in Uganda
Health
PPP-H policy launched in 2012 by the Minister of Health. Many Ugandans access services through
private providers, NGOs and faith based organisations. NGOs account for 41 per cent of hospitals, 22
67 | P a g e
per cent of lower health facilities and with government financial support the NGO sector operates 70
per cent of health training institutions.
A Uganda Reproductive Health Vouchers Programme was run in 20 districts in Western Uganda
between 2006 and 2012. This was a joint initiative financed by KfW and the Global Partnership on
Output-Based Aid (GPOBA) with the close involvement of the Ministry of Health and the World Bank.
Marie Stopes were involved in management of the scheme. Vouchers were financed through the
project and distributed to mothers who contributed a small fee and used them to purchase maternal
health care services from a range of local private sector providers. As a result more women received
timely effective support and the scheme created a new market for services. This meant that private
sector providers could increase pay of health workers and upgrade equipment. Higher quality services
were provided at a low cost. The success of this project has been widely acknowledged and the
Ministry of Health is exploring with development partners how to scale up the scheme. A similar
Family Planning voucher scheme is being rolled out countrywide with funding from DFID and USAID.
USAID is also implementing a safe delivery voucher scheme in four districts.
Another example is the use of mobile technology to improve awareness and preventative health
measures. The Dutch organisation involved, Text to Change (TTC) sends messages about Malaria,
HIV and other medical topics for international NGOs and private companies. It brings together small
and international NGOs, major African mobile telephony providers, the Ministry of Foreign Affairs, the
Dutch Embassy in Kampala and the pharmaceutical company Merck and Company.
Education
The Ministry of Education has integrated public private partnerships into its education policy
framework. The private sector now actively participates in sector planning and review processes. One
example of a PPP in this sector is the Business Technical and Vocational Education and Training
(BTVET). As part of the government’s wider strategy to enhance skills development BTVET is going
through a series of reforms to revive and revitalise BTVET (add in figures from NDR on growth in
BTVET). Progress in this area will be critical to expand the reach of vocational training across
Uganda.
Water
The National Water and Sewerage Company (NWSC) has gone through various iterations of PPP
frameworks. The most recent management contract applies private sector principles to enhance
efficiency and accountability. Sharp financial incentives have been introduced where the operating
teams either gain or lose financially depending on how they perform. Each privately incorporated
business partner has a deed of partnership detailing the duties, rights and obligations. Remuneration
depends on performance based on a set of key indicators including cash operating margin, bill
collection and percentage of inactive connections.
Electricity
A potential growth area for PPPs is the energy sector. Bujagali Hydropower dam in Jinja is one
example of where a high level strategic PPP is delivering results. This was done in partnership with
68 | P a g e
IFC. It is a 30 year project where the consortium will receive profits for 17 years whereas government
will realise profits for 13 years. This project took many years to reach fruition but the impact on
enhancing the supply of electricity has been considerable.
Telecommunications
Following the Uganda Communications Act in 1997 new entities were formed – Uganda Telecom
Limited (UTL), Uganda Posts Limited (UPL) and the Uganda Post Bank. UTL rapidly attracted
investment and tapped into the growing mobile phone industry. Services are now widely available
across Uganda and mobile phone technology is increasingly being used to share information, build
awareness (health and agriculture tips, weather info, news etc.) and to advance access to financial
services. The potential for this sector to improve connectivity and enhance inclusive development
should not be underestimated.
Source: The State of Uganda Population Report 2012: Uganda at 50 years: Challenges, Opportunities
and Prospects – Population Secretariat and UNFPA and Uganda Healthcare Federation (various
documents).
Improved coordination and investment promotion to align private investment with NDP
priorities and PPPs. At present the Uganda Investment Authority (UIA) provides general
advice and support to all investors with a focus on NDP priority sectors including tourism,
agriculture, oil and gas and mineral development. UIA promotes Uganda as an investment
destination. It has established a one stop centre to support investors. Ideally this will evolve
so that all licences and approvals can be obtained from one location. Overtime this could be
an internet based service. UIA also leads on action required to improve the environment for
investors in Uganda. UIA is increasingly focused on SME development and is exploring
reducing the threshold requirement for domestic investors below US$50,000 so more SMEs
can benefit from obtaining investment licences. This provides a good foundation to improve
the environment for investors in Uganda. However, at present the link between UIA’s
investment promotion activity and the NDP investment planning is weak.
There is very limited strategic coordination between the NDP planning, the PIP and private
sector investment promotion. This is likely to change as the use of PPPS to finance
investments becomes more widespread. However, it is worth planning ahead and
considering how UIA can support and leverage private sector investment towards NDP
priority projects with a focus on PPPs. For example, once a project has been identified as a
potential PPP then UIA could help to seek out financing partners and provide support to help
these investments proceed quickly and smoothly. This comes back to the urgent need to
improve coordination across government on investment planning.
69 | P a g e
There are new opportunities to harness savings and finance through capital markets. As
earlier set out, there has been significant progress on pension reform and establishing the
regulatory framework governing pension funds. This provides a potential source of finance
that can be harnessed through capital markets to support NDP implementation
The NDP envisaged that sovereign bonds would be developed that would finance
infrastructure investments in the energy and roads sector in particular. These would be
traded on capital markets. This has been done in other countries such as Kenya. Progress
over the last 2 years has been relatively slow although the Bank of Uganda, the MoFPED
and Capital Markets Authority are now beginning to look more closely and how this might be
developed. This analysis could usefully be accelerated as part of the preparation of the next
NDP. It would be useful to learn from other countries experiences in this area and design of
this new instrument could potentially focus in particular on raising additional finance for
PPPs.
6 CROSS-CUTTING ISSUES
This section outlines issues related to economic management that have been taken from a
series of six cross-cutting reports that were commissioned separately alongside the NDP
mid-term review. The section is organised so that there is a sub-section for each cross-
cutting theme in which issues relevant to economic management were discussed.
6.1 Social protection
The social protection report states that there have been insufficient resources dedicated to
implementing social protection programmes which is reflective of a weak national
commitment to the sub-sector. The Senior Citizens Grant (SCG) is currently being piloted
with funding predominantly from development partners. For this programme to be a
success, it will be critical that government fully engages with interested stakeholders to
ensure that the programme is nationally representative and also sustainable over the long
term. The most evolved and successful social protection interventions, such as the Old Age
Pension in Brazil, are nationally funded and owned. To address this, the report recommends
expanding the tax base to make commitments to the Senior Citizen Grant. This is
70 | P a g e
particularly critical at the local level where implementation occurs, as the reduction in local
revenues during the NDP period has impacted negatively on the ability of the local
governments to fully participate in such programmes.
6.2 Democracy and political governance
The democracy and political governance report finds that weak financial management has
been a large constraint to the effectiveness of GoU interventions during the NDP
implementation period. This is reflected in the persistent supplementary budget approvals,
and more broadly in the way MDAs manage funds. During FY2010/11, it is reported that
UGX 7,897.99b were released against an approved budget of UGX 7,036.96b. Public
resources amounting to UGX 861.03b were mobilised outside of the original budget resource
envelope, while a further UGX 870.35b were reallocated away from their original planned
use. Variations in the budgetary allocations resulted in 40 MDAs experiencing reduced
financial releases, ranging from -2 per cent to -75 per cent of their approved budget, at an
average of 22 per cent less than approved. Among the affected MDAs were those in charge
of the public sector management and accountability areas which are critical for governance.
Budget variance between allocations and releases in Joint Budget Support Framework
sectors is reported as 11 per cent, against a target of not more than 5 per cent. The
measures used to assess the Government’s compliance with accountability policies,
standards and regulations show mixed results, but improved performance compared to FY
2010/11. The percentage of clean audit reports in local governments remained unchanged
at 45 per cent, against a target of 45 per cent. At central government level, the percentage
was 59 per cent against a target of 55 per cent, some way above the 40 per cent for FY
2010/11. For statutory bodies, the figure was 61 per cent by year-end, against a target of 65
per cent but much improved on 27 per cent in the previous year.
Further, a mid-term assessment for FINAMP (2013) found serious structural and process
issues that affect financial management. Central to these problems has been the role of the
legislature, which is reported to have not been involved in the budget making process to the
optimal degree.
The following are the key recommendations from the perspective of democracy and political
governance:
Ensure effective public financial governance which is key to development and poverty
reduction in Uganda. This will require robust implementation of transparent and efficient
71 | P a g e
systems for management of public financial resources. The public financial management
bill should be designed with an intention to create strong systems.
Strengthen the autonomy of the legislature through its increased involvement in the
budget making processes. The role of the ruling party caucus is critical as it can
undermine the role of the legislature. There is also need to legislate on the qualifications
for elective positions to the legislature.
Support the initiatives intended to reform the constituency demarcation process with a
focus on merging constituencies to reduce the number of representatives at the central
government level. Further, more representation should be encouraged at the lower
council levels.
Strengthen the overall legislative oversight role in Uganda, by the Executive giving
Parliament its budget proposals at least six weeks before debate. Parliament should
also be given the legal mandate to amend those budget proposals.
Initiate and implement measures intended to consolidate the gains made in public
financial management system in order to improve efficiency and effectiveness of public
expenditure management. This can be through the operationalisation of the e-
government initiative which will ensure that all workflow processes are computerized,
improve responsiveness and reduce corruption.
Re-focus the mechanisms for coordination, implementation, monitoring and evaluation
systems at national, sector and local government levels involving the participation of all
players including the private sector, the media, civil society, cultural leaders, religious
leaders and citizens.
Implement open engagement between government and civil society with flow of
information.
6.3 Environment
Uganda is reported to have made some progress with regards to environmental
management, particularly in adopting renewable energy. Government’s move to cut taxes
on solar equipment is noteworthy in this regard and the proliferation of energy efficient
stoves and briquettes by the NGOs, the private sector and government is said to have been
a success story. During the implementation of NDP 2, Government should invest in bigger
and on-going campaigns to educate the people about energy efficient alternatives.
The report finds that traditional crops are being progressively driven to extinction as a result
of intensifying commercialisation that focuses on new crop varieties. Therefore, it is said to
72 | P a g e
be critical that strategies and interventions for agricultural biodiversity and indigenous
technical knowledge in nutrition, propagation, food security and biodiversity conservation are
incorporated in agricultural sector strategies.
The NDP proposes a number of strategies to realise the objective of enhancing forest cover.
Restoration of forest cover is premised on greater emphasis on tree planting and forest
plantations. Restoration of degraded natural forests is expected to be achieved through
preparation of a landscape restoration plan and enforcement of a sustainable forest
management regime. Increased protection is also mentioned as one of the strategies to
ensure a healthy forest cover. An interesting strategy is the promotion of eco-tourism as a
means of ensuring forest protection. Forest loss is happening at time when forest based
ecotourism is increasing in volume. Uganda is reported to have a competitive advantage in
forest based tourism over its sister nations in the East African region and therefore the
government should invest more in forest protection if the country is to realise the full benefits
of forest based ecotourism. Unfortunately, wildlife does not feature significantly in the
forestry sector discussion; great apes, on which most of the existing eco-tourism is based,
are not even mentioned.
There is rampant poverty particularly around the protected areas. It is reported that this calls
for the need to deliver communities out of poverty in order to conserve the protected areas.
It is important to note that illegal activities in protected areas cannot take place without the
knowledge and support of the local residents and their leaders. Effective conservation will
only take place if the two parties change their practices. Government could help achieve this
practice through support to alternative livelihoods for the local people to divert their attention
from the protected areas. Most of the adjacent communities to protected areas are said to
not be interested in enterprises like eco-tourism or bee keeping because they are long-term
ventures. Therefore it is important to provide residents with enterprises to help them
generate income in the short-term. The Uganda Wildlife Authority is already pursuing such
strategies with its revenue sharing scheme with the adjacent communities. This could be
built upon to develop more strategies to support communities located within close proximity
to wildlife parks to generate alternative sources of income of a short term nature.
In terms of water management, the report finds that water pollution has increased the cost of
water for users of piped water in certain urban areas, and further, that the destruction of the
wet lands has been linked to an increasing shortage of water in Kampala.
73 | P a g e
The report articulates the important role of the environment in sustaining Uganda’s tourism
sector but highlights the challenges to the sector. The report finds that a major challenge
facing the tourism sector emanates from incomplete reviews of laws and policies. For
example, the Tourism Policy that has been successfully reviewed but cannot be concluded
for onward submission to Cabinet due to funding shortfalls; the Tourism Master plan which
has been funded by development partners is still work-in-progress; the Uganda Wildlife
Policy has been reviewed and now before Cabinet; the first ever Museums and Monuments
Policy was formulated and has been in Parliament for some time; the review of the National
Wildlife Act was completed in FY2010/11 with a draft amendment bill that was still
undergoing consultation during FY2012/13; the Uganda Wildlife Education Centre Bill has
been drafted and is before Cabinet; the Review of the Museums and Monuments Act has
just been initiated during FY2012/13; domestication of the CITES is on-going and not yet
complete; review of the Uganda Wildlife Training Institute Act just commenced in FY2012/13;
the review of the Hotel and Tourism Training Institute Act just commenced during the
FY2012/13; operationalisation of the Tourism Development Levy and Fund did not
commence since FY2011/12 when it was submitted to MoFPED.
The report makes a number of recommendations on how environmental issues related to
economic management could be considered during the implementation of the existing NDP
and in the development of the next NDP. The report finds that there is a need for new
environmental financing mechanisms that are transparent to ensure that funds generated
from environment related tariffs are then used to fund NDP-related environmental activities.
The report also recommends that more attention be given to PPPs for environmental
services payment systems, especially for climate change management (for example, carbon
management strategies, hydrocarbon pollution management, and carbon sinks). Lastly, a
further recommendation is that eco-tourism be part of a strategy to improve forest cover, and
that the next NDP could include a strategy to maintain the fisheries resource base.
6.4 Gender
The gender report finds that the NDP does not adequately consider or address the
constraints for women to effectively engage in the economy. For example, within the
agriculture sector, the report finds that government support to the sector does not
adequately benefit women, who generally engage in less commercial agriculture. The
findings indicate that the agriculture sector which is the backbone of Uganda’s economy still
employs the majority of the labour force, with a large share being women. Despite the
74 | P a g e
challenges highlighted in this report, including lack of markets, lack of storage facilities and
high interest rates on loans etc, there is still limited focus on the capacity for increased
agricultural production and productivity among women. It is evident in the research that
women provide the biggest labour required for agricultural production; however, the
possibility of extensive commercial farming is limited among that gender.
It is reported that a deliberate national strategy should be developed to consciously address
the slow pace of attainment of women’s economic empowerment. The strategy should
mainly focus on the key growth sectors of the economy which include agriculture,
manufacturing, tourism, ICT business, oil and gas, mineral development and facilitating
sectors such as trade and employment services among others. This strategy should be
informed by a detailed analysis of women’s economic position as compared to men.
75 | P a g e
7 KEY FINDINGS, CONCLUSIONS AND RECOMMENDATIONS
7.1 Key Findings
7.1.1 Macroeconomic performance and policy
The evidence presented in section 2 suggests that the NDP is not currently on track to
achieve its key macro-economic objectives and targets. Many indicators are out of line with
NDP targets including growth, revenue/GDP ratios, inflation, interest rates and export
performance. Public investment, public expenditure and fiscal policy have been inconsistent
with plans in the NDP for much of the period although there was closer alignment in the last
year. Key reasons why the strategy went off track were policy choices made at the beginning
of the NDP and external shocks in 2010/11. Domestic policies that were pursued and did not
fully support the NDP included rapid growth in money supply and increases in public
expenditure to finance the elections and defence spending including global recession.
External shocks included commodity price increases coupled with rapid depreciation of the
exchange rate (influenced by capital outflows). This together caused inflation to escalate to
30 per cent in October 2011.
Following the introduction of new monetary policy instruments in mid-2011 interest rates
reached 23 per cent by November 2011. This policy was very successful in adjusting
inflationary expectations and restoring macro-economic stability. Inflation fell back to 5.5 per
cent in 2012 and the Central Bank rate was reduced to 12 per cent but commercial bank
lending rates did not follow suit and continue to remain high. Tight monetary policy combined
with unplanned fiscal tightening led to growth falling to 3.2 per cent in 2011/12. When donors
suspended budget support in 2012 further fiscal adjustment was required. According to the
2013/14 macro-forecasts the economy is set to recover with growth increasing to just under
6 per cent by the end of the NDP period. Inflation is expected to remain in single digits.
However, borrowing and the fiscal deficit are projected to be significantly below NDP
forecasts. Although general economic prospects for the remainder of the NDP
implementation period are now more positive it will be very difficult to make up lost ground
during the remaining period.
When the NDP was formulated the assumptions and forecasts included in the macro-
economic strategy were deemed ambitious but not wholly unrealistic. The most ambitious
assumptions were the expected efficiency gains in government and reallocation of
76 | P a g e
expenditure towards infrastructure development particularly roads. Progress on efficiency
gains has however been limited owing to the limited savings attained from sectors like public
administration and defence. Policy for much of the period has focused on restoring macro-
economic balance. Whilst this is critical to facilitate growth over the medium term, there is
scope for greater pragmatism backed up by improvements in Public Financial Management,
investment planning and appraisal.
The NDP is premised on the need to strategically balance macro- economic stability and
growth. The government’s medium term macro-economic objectives reflect this. However,
the mix of policy instruments especially in 2010/11 and the corrective measures that followed
did not support growth. Relatively loose fiscal policy combined with rapid growth in the
money supply and private sector credit in 2011 contributed to rising inflation. The
introduction of a new monetary policy instrument in July 2011 and the subsequent increase
in interest rates were necessary to bring down inflation but this had a detrimental impact on
the real economy.
Fiscal policy has been relatively conservative for much of the period. Although public
expenditure increased in 2010/11 this was mainly due to higher than anticipated spending on
elections and defence. There is evidence of more expansionary fiscal policy in 2012/13 and
for the remainder of the NDP period. It will be critical to structure any additional borrowing to
minimise potential crowding out effects. Higher borrowing can only be justified if existing
funds are spent efficiently and effectively on high priority growth enhancing projects (e.g.
infrastructure). This will require much tighter investment planning and rigid control of public
expenditure.
The high level budget process and NDP have not yet been effectively integrated. The
development of the NDP was very much a joint process involving NPA, MoFPED, BoU,
Sector Ministries and Districts. However, this close cooperation has not been sustained in
the course of NDP implementation. Some alignment is occurring at a very high level (e.g.
prioritisation of spending on infrastructure). NPA have not been involved at strategic points
during the budget preparation process. Spending decisions at the sector level are not
routinely informed by progress on NDP implementation and priorities in advance of budget
preparation. One underlying reason is the lack of full alignment of budgetary systems
including the OBT, SIPs, BFPs, MPSs, Chart of Accounts and DDPs.
77 | P a g e
There is positive progress on aligning macro-economic modelling frameworks used by NPA,
the MOFPED and Bank of Uganda. When the NDP was conceived the model used was very
different to the financial programming model used by the Bank of Uganda. There were
extensive consultation and agreement on the NDP model and forecasts. However, the
annual budget and MTEF continue to be based on the MOFPED and Bank of Uganda
models rather than the more complex general equilibrium model used in the NDP. There are
plans in place to merge these models and this will make it easier to align NDP and annual
macro-economic planning frameworks going forward.
7.1.2 Public expenditure management
For the first two years there was limited alignment of the MTEF and budget implementation
with the NDP. Based on an analysis of allocations and actual expenditure in the course of
the NDP period there has been mixed progress on alignment of NDP with the budget. Whilst
allocations to many key sectors have increased significantly in nominal terms, eight out of
sixteen sectors have consistently attracted funding below projected NDP allocations.
Supplementary budgets have had a negative impact on budget implementation and
credibility. There has been considerable improvement in budget alignment in 2012/13. It
should also be noted that the NDP medium term expenditure framework was also largely
diverging from the past trends and allocations which greatly complicated the implementation
of the NDP.
Expenditure management systems and sector planning systems are not closely aligned with
the NDP. At present the output based tool is based on a rolling 3 year planning framework
compared with the 5 year fixed NDP framework. This makes it difficult to align the two
processes. In addition OBT outputs do not fully map onto the strategic objectives included in
the NDP as they are defined differently and sometimes relate more directly to previous
sector plans. Sector plans in cases where they are available also often have different time
horizons to the NDP which also makes it difficult to fully align them with NDP objectives. In
addition, the IFMIS chart of accounts, MPSs and the BFPs are not fully aligned with the
NDP.
Weak investment planning and lack of integration of NDP priorities into the annual PIP and
SIP process has limited alignment. A large number of core projects were included in the
NDP but not all of these were thoroughly assessed prior to their inclusion. NDP core projects
are not automatically ranked as the highest priority projects in the annual PIP and SIP
78 | P a g e
processes. The exceptions to this are flagship energy and roads projects. Other factors that
influence the decision making process around which project receive funding, include sectors’
views of priorities, the MoFPED’s view of priorities and higher level political decisions. The
lack of a clear framework on the criteria used to include projects in the PIP has contributed
to the misalignment of the PIP with the NDP. A planned review of the PIP process led by
NPA working with the MOFPED provides an opportunity to reflect on how to improve links
between the NDP and routine investment planning going forward.
There was a very high level of ambition regarding the number of core projects that could be
implemented in the course of the NDP and many of these projects have not moved forward
as planned. This is due to a number of factors: (i) lack of planning, prioritisation and
sequencing of investments; (ii) limited technical analysis and appraisal prior to inclusion of
projects in the NDP which delayed implementation; (iii) limited analysis of the financing
requirements of individual projects in advance of inclusion in the NDP; (iv) weak technical
capacity in MDAs to develop, manage and implement complex projects; (v) slow
procurement. Notwithstanding these problems, there is also an apparent practice by the
GoU to introduce spending activities which are politically influenced that are outside the
planning processes. This has compromised on the available resources for the projects that
were identified in the NDP.
7.1.3 Growth and socio-economic transformation, promoting competitiveness and private
sector development
Sector Growth Performance
Growth outcomes over the past three years have been way below from what was envisaged
in the NDP. The poor performance in growth has partly been a combination of external factor
and domestic factors. The volatility of commodity prices combined with a reduction in export
demand due to the global recession contributed to the slow growth of the economy. On the
domestic front, the corrective measures that were put in place to contain inflationary
pressures combined with the unpredictable weather conditions also contributed significantly
to the slow growth of the economy. The slowdown in growth was largely driven by the
services sector which contributes about half of total GDP. Key sectors that contracted within
services included financial and real estate. The composition of GDP remains the same with
services contributing about 50 percent of total GDP and agriculture and industry contributing
24 and 26 percent respectively.
79 | P a g e
The agriculture sector continues to face challenges of unpredictable weather conditions,
declining productivity and limited mechanization. As a result the sector continues to perform
significantly below expectations growing on average at about 1 percent. Agriculture is the
major employer in Uganda and has the most potential for value addition in the short to
medium term. Growth and productivity in agriculture is highly dependent on climatic
conditions. The continued sluggish performance of this sector remains a cause for concern.
If it continues to operate below its potential then it will be very hard to achieve inclusive
growth or make progress on socio-economic transformation. For the period 2011/12 and
2012/13, food crops which account for 50 per cent of total agriculture and key to the food
basket as well as exports especially within the region contracted by 1.7 per cent in 2011/12
and only grew by 0.2 per cent in 2012/13 respectively. The contraction was largely attributed
to the severe draught in 2011/12. The level of agricultural exports, including maize, beans,
and flowers, increased significantly during the first half of 2012/13, largely due to higher
international prices and increased volume of trade.
Overall the level of growth in the sector has not been enough to compensate for the
reductions in growth in other sectors especially manufacturing and services. There are many
factors that constrain agricultural performance including lack of coherent land reforms,
dysfunctional land market, lack of mechanization, weak infrastructure to support and
enhance productivity (storage, irrigation etc.), access to high quality inputs, lack of
agriculture financing and weak marketing infrastructure.
For 2010/11 and 2011/12, the manufacturing sector faced various challenges which included
power shortages and higher electricity prices, financing constraints resulting from tighter
liquidity, and lower demand from global markets. The low electricity generation which was
combined with expensive thermal generators being switched off due to insufficient funding
resulted into increased tariffs. This considerably increased the cost of manufacturing.
However, there has been some strong recovery of the sector with growth estimated at 6.8
percent in 2012/13. This is consistent with the growth in electricity provided which could
have helped to unlock one of the key binding constraint for industry. The recent completion
of Bujagali Hydropower Dam and other mini-hydropower stations has greatly improved the
availability and stability of electricity.
80 | P a g e
The overall weak performance of the economy in 2010/11 and 2011/12 was due to a decline
in growth of the most dominant services sector. The under-performance in this sector was
partly driven by domestic developments especially the tight liquidity conditions that
characterized the period due to the corrective tight monetary policy stance that was being
pursued. Financial and trade services decelerated due to increasing uncertainty in the
business environment. Notwithstanding these negative developments, services have since
recovered, albeit still low compared to previous years. The recovery has been mainly driven
by transport, communications and financial services. Financial services have particularly
been boosted due to increased loan uptake after a recent reduction of interest rates. In
addition the outlook for the real estate sector remains positive with increased financing by
commercial banks.
Socio-Economic Transformation
The recent sluggish growth has not been associated with significant improvement in income
levels and socio-economic transformation as was envisaged in the NDP. This is partly
because the structural transformation taking place in Uganda is through the expansion of
non-tradeables especially services at the expense of the tradeables sectors especially
agriculture and industry. Due to the high population growth rate estimated at 3.2 per cent
and the modest growth achieved over the past two years, per capita GDP declined to US$
453 compared to US$ 506 in 2010. The targeted per capita income by 2017 should qualify
the country to be of a middle income status. However, given current the range of challenges
to be addressed to accelerate growth and pressures of high population growth, it will be very
difficult to achieve middle income status by 2017 notwithstanding the expected oil resources.
The rapid growth of exports as a sign of transformation has also been limited over the past
two years. Uganda’s export basket remains narrow and dominated by primary products
(around 85 per cent), including coffee, fish, tobacco, gold, and flowers. Reliance on these
exports has made the export sector vulnerable and Uganda has faced a significant long-run
term decline in its terms of trade.
Other indicators of socio-economic transformation include the level of urbanisation. Vision
2040 describes the importance of urbanisation and development of regions. Uganda also
has one of the lowest urbanization rates in Africa (16 per cent). More needs to be done to
urbanize Ugandan cities by increasing their economic activities so as to attract more labour
81 | P a g e
and related infrastructure and institutions. Action to develop “regional economic hubs” would
concentrate services and facilitate trade into new markets.
Competitiveness
Overall it is evident that there has been progress on action to improve competitiveness but
there have also been some steps backwards and businesses continue to find the operating
environment in Uganda challenging. The global competitive index suggests that there has
been some improvement in the competitiveness of Uganda. Improvements include business
sophistication, macro-economic environment, labour market efficiency, financial market
development and goods market efficiency. Areas where Uganda’s position deteriorated
included public institutions, health and primary education, higher education and training and
technology uptake. This implies that there is a continued need to improve public sector
management, deliver basic services effectively and improve skills and innovation. Other
indicators where Uganda has registered slow progress include resolving insolvency, dealing
with construction permits, getting electricity and registering property.
There are significant initiatives in place to enhance the business environment. There has
been good progress on improving roads, transport and access to ICT. Telecommunications
is facilitating development in many ways. It is improving access to information and perhaps
even more critically, access to finance. Continued public and private sector investment in
these areas and support for innovation around use of mobile technology will continue to
generate high returns in terms of economic development and inclusive growth. Steps have
been taken to reduce red tape in areas like business and land registration by automating
land and business registration. However, challenges remain as key legislation to improve the
business environment takes a long time to go through Cabinet and Parliamentary approval
processes. In addition, lack of comprehensive land reform remains a large constraint for
investors.
Private Sector Development
The private sector remains a key driver to Uganda’s economic growth and socio-economic
transformation as highlighted by the NDP. The sector is largely dominated by micro small
and medium Scale Enterprises. Of these about 1,100,000 are enterprises employing
approximately 2.5 million people. It is estimated that the sector contributes about 75 per cent
of the country’s GDP. Key activities of the sector include agriculture, trade, construction,
manufacturing, services such as hospitality and entertainment industry, finance, health,
82 | P a g e
education, professional services and information communication technology related
business. Employment by sector reveals that 66 per cent are in the primary Sectors
(Agriculture, Fisheries, Forestry etc.), 28 per cent in Services, while 6 per cent were involved
in Manufacturing. In addition, 76 per cent of Uganda’s labour force is self-employed while 24
per cent are employed by others.
Despite the importance of the sector many businesses are currently operating below
capacity due to low demand followed by unreliable supply of production inputs and lack of
working capital. The high cost of credit coupled with poor infrastructure and limited access to
credit is considered to be one of the main non-regulatory factors which constrained growth of
the private sector. Over half of the businesses in the survey indicated that interest rates had
a negative impact on business operations. Volatility of exchange rates also resulted in
payment delays where customers had been negatively affected by exchange rate losses. In
terms of quality of services the private sector also indicated that electricity, railway transport
and health care were the most poorly delivered. The most effectively delivered services were
banking services, air transport and insurance services.
In summary the private sector is still faced with several constraints to growth. The general
view was that the cost of doing business has gone up due to rising energy costs, relatively
expensive communication costs (and mixed availability across the country), high transport
costs and punitive taxes due to narrow tax base. The top 3 constraints identified were
energy/infrastructure (access and cost), lack of public sector accountability and limited
access to affordable finance.
7.1.4 Financing of the NDP
Lack of financing remains a problem for the successful execution of NDP. When conceived
the NDP had anticipated significant increases in domestic revenue mobilisation as a
proportion of GDP which has not been realised. Donor support has reduced and
development of new innovative financing instruments such as infrastructure bonds has been
slow. Cost of finance and availability of long term finance remains a major problem. The
spread between Commercial and Central Bank lending bank rates is very high due in part to
high financing, operating costs and an increase in non-performing loans. Small businesses
are not fully aware of financing opportunities or are not equipped with the skills or collateral
to access loans. A functioning Credit Reference Bureau has reduced risk for banks but
83 | P a g e
perceived risk remains high especially for the small business sector and agricultural
businesses.
Domestic revenue mobilisation has been hit by disruptions to growth. The revenue/GDP
ratio is forecast to be 13.5 per cent in 2012/13 compared with the NDP forecast of 14.1 per
cent. Areas where policy reforms have been slow include: extension of VAT to the retail
sector; streamlining and reductions in tax exemptions which distort the current system and
greater focus on broadening the tax base and enhancing non tax revenues.
The challenge on domestic resource mobilisation is to balance tax collection with private
sector growth and development. A large part of the private sector which is informal remains
untaxed. The tax burden therefore disproportionately affects the formal sector firms. A major
downward shift in the Doing Business Report ranking on tax suggests that taxation is
perceived as a growing problem for businesses in Uganda.
Progress on development of innovative financing mechanisms has been slower than
expected. Progress on harnessing private sector finance in support of NDP implementation
has been slow partly due to slow progress on finalising the legal framework governing Public
Private Partnerships (PPP). However, a policy has been adopted and there is a good
understanding of what needs to be done to make the new law effective. There are examples
of success on PPPs. Perhaps the most dynamic examples include Bujagali dam and the
health sector where a range of pilot projects and partnerships have been developed to
improve service delivery and enhance public awareness on health issues. It will be important
to learn from PPP success stories going forward. There is potential to harness new private
sector financing for NDP implementation. However, this will require strong leadership at the
highest level to fast track the regulatory framework for private financing, capacity building in
government to ensure PPPs are well managed and regulated and better strategic planning
to determine financing requirements and potential sources of finance.
Capital markets have continued to develop despite the slowdown in growth. Capital markets
provide new opportunities for long term financing for the private sector and potentially
government. However, at present there is no long term strategy to develop capital markets
and limited awareness within the private sector of the financing opportunities offered by
capital markets. There has been slow progress on developing new instruments such as long
term bonds although the Bank of Uganda is now working with the MoFPED and Capital
Markets Authority to make this happen. Similar bonds have been used as a source of
84 | P a g e
funding for government investment projects in other countries including Kenya. It is a
potential source of funding for PPPs and/or high return infrastructure projects. The regulatory
authority that will oversee pension funds is now in place. This improved regulatory
framework should improve access to pension funds through capital markets. The
Government needs to move quickly to design appropriate financing instruments that meet
international standards. It is unlikely that this type of financing instrument will be available to
support investment under the current NDP.
7.2 Recommendations
7.2.1 Recommendations for the current NDP
Macroeconomic policy and public expenditure management
The macro-economic framework governing the NDP requires strategic coordination of fiscal
and monetary policy objectives to achieve both growth and macroeconomic stability. The
monthly coordination mechanism established in 2012 between the Bank of Uganda and the
MoFPED provides a strong basis for evaluating policy options and trade-offs going forward.
It will be important that this technical committee has focused discussions on striking a
balance between maintaining macroeconomic stability and sustaining growth in the year
ahead on how to refine and improve the inflation targeting instrument as part of the
preparations for the next IMF Policy Support Instrument. The adjustment costs especially for
growth of reducing inflation should be balanced properly with the need for macroeconomic
stability. It is also important that NPA should be part of this coordination committee.
It is recommended that the MOFPED working with the Bank of Uganda and NPA agree what
additional measures need to be taken to justify expected higher levels of spending to
support NDP implementation. These additional measures should focus on some of the
following areas:
A strategy to improve domestic resource mobilisation;
Greater rigour in public expenditure management and enhancing budget discipline at
all levels of government to enhance budget credibility;
Demonstrated improvements in absorptive capacity: this will require decisive action
to improve procurement and skills development to improve technical and financial
management of large projects;

85 | P a g e
More rigorous procedures to appraisal of projects to ensure that projects in the NDP
are investment ready.
Robust financing strategies for any existing and new projects which weigh up the
pros and cons of alternative sources of finance including crowding out effects (if
financed through higher domestic borrowing).
The budget preparation process should focus more explicitly on aligning resources to
support NDP implementation. In particular, the budget process should be fully aligned and
guided by the NDP. For the remaining period of the NDP, there should also be some attempt
to align the BFP to the NDP. One option would be for NPA liaising with OPM and MOFPED
to lead on development of a short position paper that summarises progress and identifies top
priorities for the year ahead. This could draw on information on performance from sectors
and where possible districts. To have strategic impact it would need to be reviewed by
Cabinet in advance of preparation of the Budget Framework paper submitted to Parliament
in December each year. NPA could also play a role in scrutinising Ministerial Policy
Statements and the PIP for alignment with NDP priorities.
Accelerate action to improve budget credibility, transparency and public financial
management. There is a need to establish a “Contingencies Fund” that would essentially
replace supplementary budgets. This will improve transparency and control of spending and
should halt use of supplementary budgets which currently undermine budget credibility.
Financing of the NDP
The current debt sustainability analysis shows that there is significant room for borrowing
especially for productive investments. For the fiscal year 2013/14, the government has
already taken a step in this direction by preparing to issue sovereign bonds to finance its
development agenda. However, this approach has to be enforced without compromising the
sustainability of debt.
Increase efficiency gains. Establish an efficiency and value for money programme across
government to ensure scarce public sector funds are being spent effectively on the right
things. Ministries should be encouraged to fund a proportion of new spending priorities
through efficiency savings. There should be a firm commitment to reduce spending on public
administration. This will require decisive action to streamline government structures and
reduce duplication of functions. Restructuring of the public sector and scaling back local
government senior staff could also enhance efficiency gains.
86 | P a g e
There is an urgent need to fast track domestic resource mobilisation to finance the
development needs of the NDP. This is particularly so given that the financing of the budget
from donors continues to decline. Expansion of the tax base would include enhancing the
registration businesses especially in the informal sector. In addition streamlining of tax
exemptions would help to enhance tax collection and minimize abuse of the tax system.
There is a need to fast track approval of the Public Private Partnership Bill. This would
involve developing and implementing an action plan to establish the appropriate institutional
and regulatory framework to lead, support and regulate PPPs. There is also need to build
awareness and capacity in key sector ministries on PPPs on how to manage contracts and
partnerships with the private sector. It might also be beneficial to establish one body that
coordinates all the PPPs rather than every Ministry seeking out relevant private sector
partners.
7.2.2 Recommendations for the next NDP
Macroeconomic Policy and Public Expenditure Management
Use of the same modelling framework by the NPA and MOFPED and BOU would enhance
ownership of the macroeconomic framework across the three institutions. Work is already in
place to review and improve the economic modelling framework used by MOFPED and BOU
for macroeconomic forecasting. NPA is also involved in the process. Ideally a single
model/approach should be developed that is suitable both for annual forecasting and multi-
year forecasting so the same model can be used to develop the framework for the next NDP.
For the future NDP, there is a strong need to ensure that the NDP guides and is aligned to
the SIPs and the DDPs which are the basis for the BFPs and hence the National Budget
Framework Paper. For this to materialize, MDAs and districts should be provided ample time
to prepare their SIPs so that these could be used as part of a two way process to inform
development of the new NDP.
There is a need to ensure that all expenditure management systems are well aligned to the
new NDP. The expenditure management systems that need to be reviewed and used to
align more closely to the NDP include the OBT, the IFMS Chart of Accounts and Ministerial
Policy Statements. There is need to explore the scope for programme based budgeting and
setting priorities that might cut across various sectors. For example a high level objective
87 | P a g e
might be to enhance productivity in primary sectors. Action required would cut across sector
ministries and complementary sectors.
After the planned review of PIP, the is need to develop a long term investment planning
framework that will help target high priority projects to be included in the next NDP. This
should comprise 3 levels of projects. Tier 1 projects will be high priority projects carried over
from the last NDP. Tier 2 would be new high priority investment ready projects. Tier 3 would
be priority project in the pipeline. This new planning framework should ensure all selected
projects are costed and sequenced in line with availability of finance and absorptive
capacity.
Growth, Competitiveness and Private Sector Development
Given the high proportion of the population in agriculture, the challenges of the sector need
to be addressed if growth is to remain inclusive. Some of the key challenges and constraints
that need to be prioritized include coherent land reforms, promote mechanization of the
sector, support the infrastructure and enhance the productivity of the sector (e.g. storage,
irrigation etc.), provide effective extension services to all farmers and increase necessary
inputs (for example seed varieties that can withstand changing weather conditions). In
addition, implementation of the fertilizer plant in Tororo through the PPP arrangement would
greatly enhance the productivity of the sector.
While there has been some progress in addressing some of the key binding constraints,
more effort should be put in addressing some of the key concerns of the private sector
identified in this report. Key among them is the poor infrastructure in the energy and
transport sectors. Other constraints include the high cost of financing, volatile exchange
rates and the overall poor quality of services provided by government. The low capacity
utilisation in the industrial sector is also a reflection of low demand and high operating costs
linked to weak supporting infrastructure.
Urgent action needs to be undertaken to address the growing concern that Uganda is
increasingly becoming a difficult place to do business. Some of the areas identified include:
Uganda being one of the most difficult place to start a new business; difficulties in getting
construction permits; installing electricity and trading across borders. Progress should be
accelerated on streamlining regulations and systems and improving one stop facilities for
investors and businesses so they can get all the required documentation and permits quickly
88 | P a g e
to start a business. All institutions and local authorities would closely work with one stop
facilities to streamline and simplify doing business in Uganda.
Financing the next NDP
Financing strategies including sources of finance should be specified more precisely in the
next NDP. In the short term we have recommended an assessment of the pre-conditions
required to increase government borrowing. This should be completed quickly and should
inform development of a forward looking strategy for domestic and external borrowing which
also ensures debt sustainability over the medium term.
The next NDP should focus on building consensus on a medium term strategy to broaden
the tax base which will aim to bring more informal sector businesses into the tax net. This
should be backed up with a strong NDP communication strategy which spells out action
planned to improve value for money, quality of service delivery, infrastructure development
and anti-corruption measures in the public sector. Tax administration should continue to be
improved but with a stronger focus on enhancing client services and minimising the burden
of tax collection, particularly for small businesses. Specific measures in this strategy might
include:
Broaden scope and improve incentives to enhance collection of non-tax revenues. This
could be explored further with the MoFPED in the course of NDP preparation. There may
be scope to expand user fees or charges for government services in exchange for higher
quality service delivery. More research and analysis would be needed on good practice
and how best to encourage MDAs to collect non-tax revenues if they cannot retain these
earnings directly.
Government wide action required to make it easier for businesses to formalise and
operate competitively. This could include embedding improvements to simplify business
registration. Review use of presumptive tax measures to reduce the tax burden on small
businesses and provide better tax education for small and informal businesses.
Explore the feasibility of introducing local government revenue raising measures to
enhance resources for local development e.g. through property taxes
Leadership, oversight and promotion of PPPs. This would build on short term measures to
build the institutional and regulatory capacity to manage PPPs. It should ensure this
knowledge and expertise is embedded in government. Lessons derived from successful
implementation of PPPs should be promoted across government. An investment promotion
89 | P a g e
strategy should be developed with UIA which focuses in particular on promoting potential
PPPs as well as wider investments which complement new NDP priorities.
Promotion and implementation of innovative financing mechanisms. This should build on
proposed short term measures to liberalise pension funds and to introduce new forms of
bond financing to support infrastructure investments and PPPs. These will need to be tightly
managed, regulated and actively promoted. These should be linked to the highest return
investments to build confidence in these new instruments.
90 | P a g e
Annex 1. District case studies
Bushenyi District Report
Bushenyi is an old district which has turned out to be one of the model districts in Uganda
given that it has excelled in various fronts of its economic development. The district is
endowed with high level of literacy rates, good roads through the district, unique landscape
with abundant water sources and a competitive labour force. As a result, the district has
diversified into various economic activities including livestock, crop farming, agro processing
through value addition of crops like matooke, tea and coffee, and increased direct trade with
countries like Rwanda. Due to these economic activities in the district the average household
income is estimated at 6 million while the expenditure of household is on average about 8
million the difference being attributed to borrowing or under reporting of income. This is
relatively high compared to the overall per capita income of the country.
Despite these successes, Bushenyi also has some challenges in implementation of its
district development plan (DDP). Key among them is its limitations in collection of local
revenue which therefore impedes implementation of its programmes. The second challenge
is the poor road network especially for community roads. The flexibility of grants also ties the
implementation process of the district.
The DDP identifies various objectives which were fully aligned with the NDP. Key objectives
included: (i) reduction of poverty and improving household incomes, (ii) provision of basic
social services especially for education and health care, (iii) keeping all roads in motor able
condition especially the community roads, (iv) modernizing agriculture by providing advisory
services and infrastructure for marketing farm inputs, and (iv) restoring and protecting
natural resources and encouraging land owners to acquire land titles. Unfortunately most of
these objectives do not have any underlying performance targets.
Successes and Challenges in the District
Successes Challenges
Agriculture
Increased production of tea, honey and
banana and their value addition.
Increased technical uptake and use of modern
farming methods.
Increased access to financing for farmers
Outbreak of the banana bacterial wilt which
has affected yields.
Land fragmentation which is limiting
mechanization and commercial agriculture
Poor and substandard farm and livestock
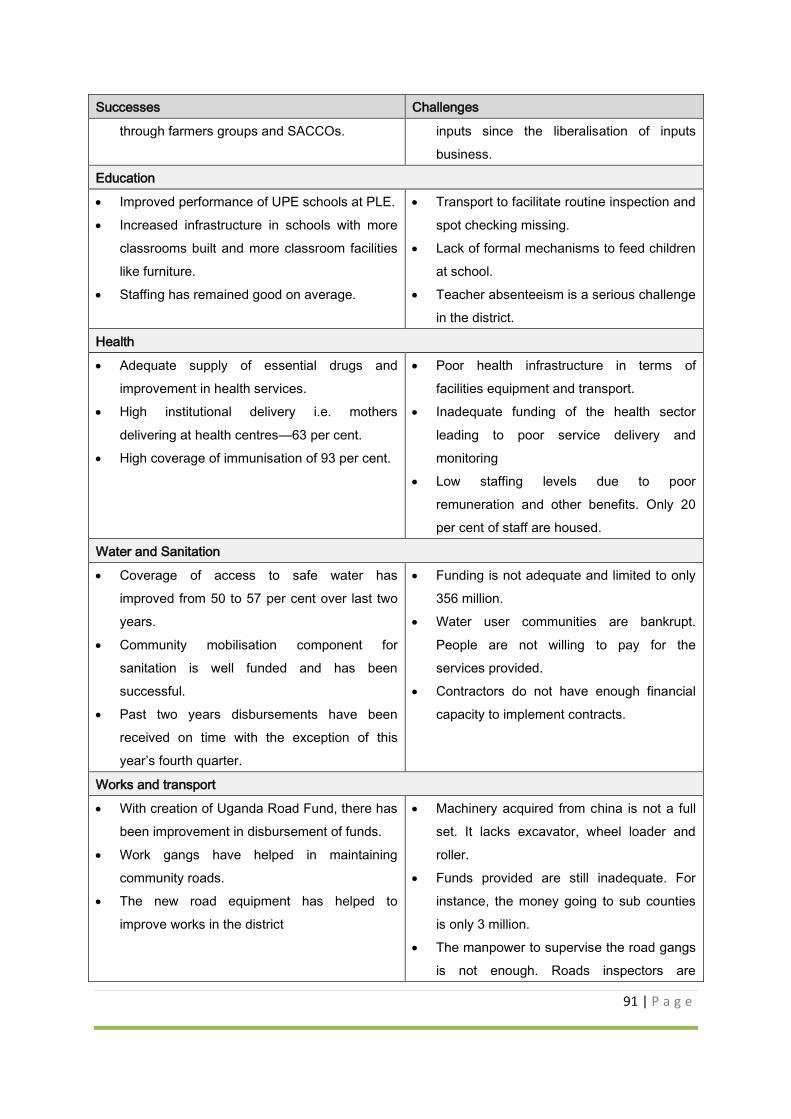
91 | P a g e
Successes Challenges
through farmers groups and SACCOs. inputs since the liberalisation of inputs
business.
Education
Improved performance of UPE schools at PLE.
Increased infrastructure in schools with more
classrooms built and more classroom facilities
like furniture.
Staffing has remained good on average.
Transport to facilitate routine inspection and
spot checking missing.
Lack of formal mechanisms to feed children
at school.
Teacher absenteeism is a serious challenge
in the district.
Health
Adequate supply of essential drugs and
improvement in health services.
High institutional delivery i.e. mothers
delivering at health centres—63 per cent.
High coverage of immunisation of 93 per cent.
Poor health infrastructure in terms of
facilities equipment and transport.
Inadequate funding of the health sector
leading to poor service delivery and
monitoring
Low staffing levels due to poor
remuneration and other benefits. Only 20
per cent of staff are housed.
Water and Sanitation
Coverage of access to safe water has
improved from 50 to 57 per cent over last two
years.
Community mobilisation component for
sanitation is well funded and has been
successful.
Past two years disbursements have been
received on time with the exception of this
year’s fourth quarter.
Funding is not adequate and limited to only
356 million.
Water user communities are bankrupt.
People are not willing to pay for the
services provided.
Contractors do not have enough financial
capacity to implement contracts.
Works and transport
With creation of Uganda Road Fund, there has
been improvement in disbursement of funds.
Work gangs have helped in maintaining
community roads.
The new road equipment has helped to
improve works in the district
Machinery acquired from china is not a full
set. It lacks excavator, wheel loader and
roller.
Funds provided are still inadequate. For
instance, the money going to sub counties
is only 3 million.
The manpower to supervise the road gangs
is not enough. Roads inspectors are
92 | P a g e
Successes Challenges
required.
EM5 Progress on meeting the Binding Constraints
Despite the challenges above, these are some of the key binding constraints being
addressed through the District Development plans and National Development Plan while
other challenges there is not much attention devoted to them.
The roads infrastructure is being addressed through the conditional grants provided by
the MOFPED albeit the fact that the resources are very inadequate. For the community
roads each sub county receives about 3 million shillings which cannot be enough to
maintain roads in good condition.
Access to finance constraint has been addressed through the proliferation of SACCOs in
the district. These are also supported by village banks. The challenge to these SACCOs
is that they are not well regulated yet some of them have assets valued at more than
UGX 1 billion shillings.
Access to electricity is being addressed through the rural electrification program. There
has been an increase of other activities like welding which never used to exist before.
Improved education access is being improved through the UPE and USE government
programs. The challenge to these programs is that they are not well supervised due to
lack of transport by district officials.
Increased income and employment opportunities in the district have been adequately
addressed through value addition programs spearheaded by the NAADS programs.
There are various value addition activities especially in the areas of honey, tea and milk.
Despite some progress to address some of these challenges, the district is also faced with
some challenges of retaining staff and mobilising local tax revenues.
The inadequate staffing (human resource) at the district and inability to retain staff after
splitting into various districts is a challenge which is not adequately addressed through
the current NDP
The district has very limited local tax revenues to implement its programs. The URA left
the district with the hard to tax areas. Yet within the NDP, it’s not clear how domestic
revenue mobilisation at the district level was expected. The conditional grants provided
from the central government also limit the flexibility of the district authorities.
93 | P a g e
EM3: Relationship between NDP and Planning Process at the District
The key observation by the district planner is that the egg concept and the sectors in the egg
yolk relative to their allocation do not tally. An example is the budget that goes to agriculture
and ICT sectors yet they are considered to be the most important core sectors. This implies
that what was planned for in the NDP is completely different from what is being implemented
by the MOFPED.
Resources should also be allocated based on the importance of sectors and there should be
room to readjust the NDP as sometimes activities planned can be overtaken by events.
While there was some effort to align the DDP with the NDP, business continued as usual in
terms of allocation of resources and that indirectly affects the implementation of the DDP at
the district level. There should therefore be a harmonized NDP with the budget and a clear
mandate of the NPA.
The fact that the government is also moving away from outputs to outcome, this should be
reflected in the NDP, OBT and sector plans.
EM6: How has NDP implementation so far contributed to improvements in productivity,
private sector development and competitiveness?
There has been tremendous growth of the private sector whether in business activities,
industry and agriculture. Processing alone is now wide spread in Bushenyi district for tea,
coffee, honey etc. This has mainly been driven by two factors. First, the district has been at
the forefront of promoting SMEs and building their capacity through training activities. The
district has also been at the forefront of promoting access to finance through SACCOs and
groups.
For the last two years the district has put much emphasis on value addition to traditional
products grown in the area. These products include barley wine, tea, honey which can be
done at a small scale. The district has also been working closely with the SMEs to help them
get UNBS certification and opening of markets at national and international levels.
Despite some progress, there are still some challenges facing the private sector
development in Bushenyi district. These include:
The cost of production is very high due to high electricity tariffs.
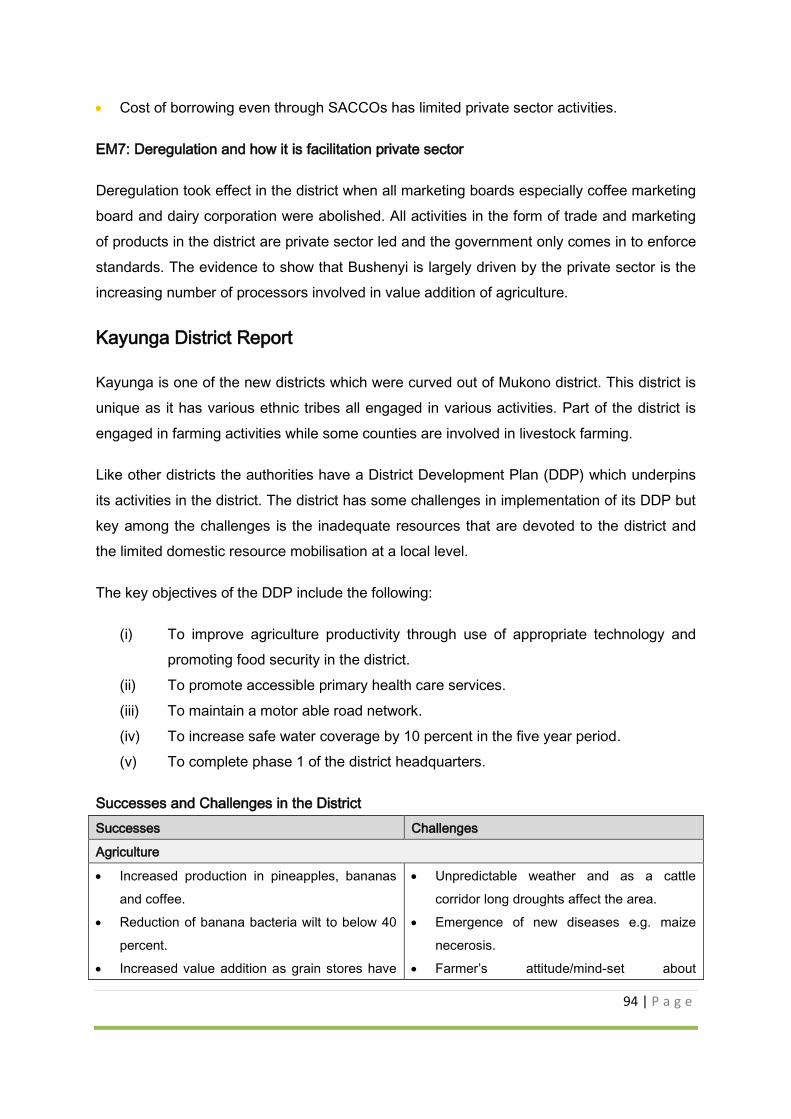
94 | P a g e
Cost of borrowing even through SACCOs has limited private sector activities.
EM7: Deregulation and how it is facilitation private sector
Deregulation took effect in the district when all marketing boards especially coffee marketing
board and dairy corporation were abolished. All activities in the form of trade and marketing
of products in the district are private sector led and the government only comes in to enforce
standards. The evidence to show that Bushenyi is largely driven by the private sector is the
increasing number of processors involved in value addition of agriculture.
Kayunga District Report
Kayunga is one of the new districts which were curved out of Mukono district. This district is
unique as it has various ethnic tribes all engaged in various activities. Part of the district is
engaged in farming activities while some counties are involved in livestock farming.
Like other districts the authorities have a District Development Plan (DDP) which underpins
its activities in the district. The district has some challenges in implementation of its DDP but
key among the challenges is the inadequate resources that are devoted to the district and
the limited domestic resource mobilisation at a local level.
The key objectives of the DDP include the following:
(i) To improve agriculture productivity through use of appropriate technology and
promoting food security in the district.
(ii) To promote accessible primary health care services.
(iii) To maintain a motor able road network.
(iv) To increase safe water coverage by 10 percent in the five year period.
(v) To complete phase 1 of the district headquarters.
Successes and Challenges in the District
Successes Challenges
Agriculture
Increased production in pineapples, bananas
and coffee.
Reduction of banana bacteria wilt to below 40
percent.
Increased value addition as grain stores have
Unpredictable weather and as a cattle
corridor long droughts affect the area.
Emergence of new diseases e.g. maize
necerosis.
Farmer’s attitude/mind-set about
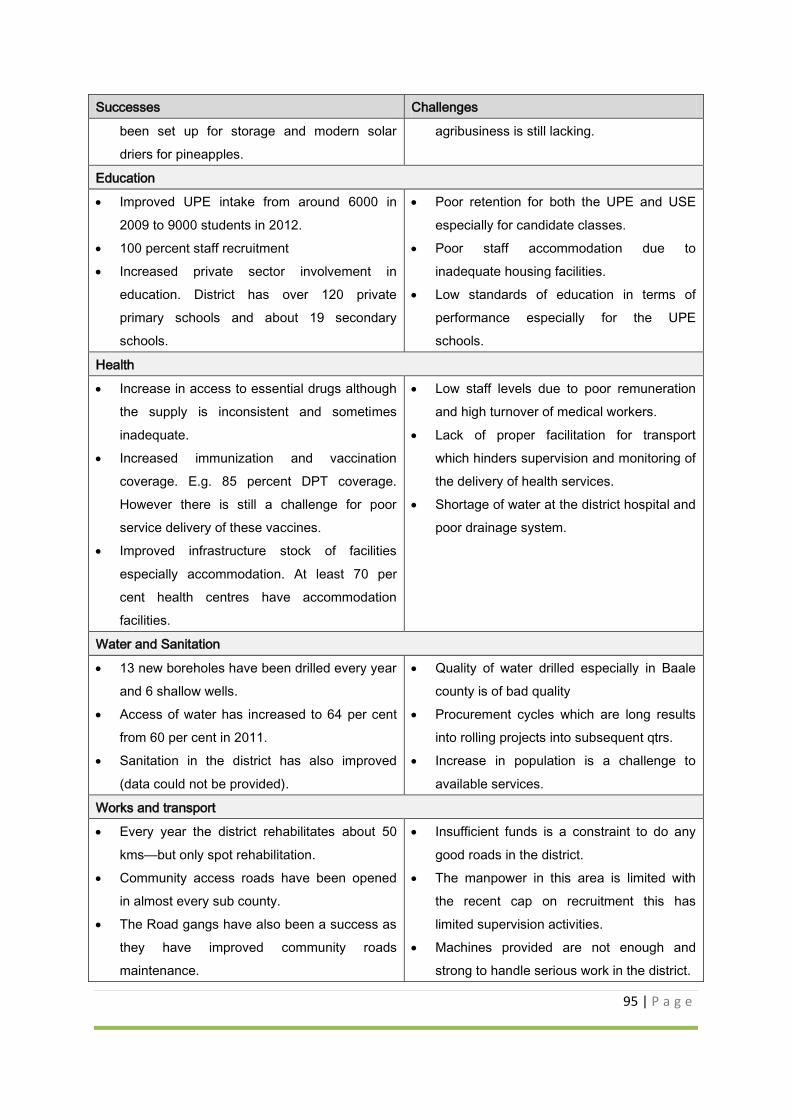
95 | P a g e
Successes Challenges
been set up for storage and modern solar
driers for pineapples.
agribusiness is still lacking.
Education
Improved UPE intake from around 6000 in
2009 to 9000 students in 2012.
100 percent staff recruitment
Increased private sector involvement in
education. District has over 120 private
primary schools and about 19 secondary
schools.
Poor retention for both the UPE and USE
especially for candidate classes.
Poor staff accommodation due to
inadequate housing facilities.
Low standards of education in terms of
performance especially for the UPE
schools.
Health
Increase in access to essential drugs although
the supply is inconsistent and sometimes
inadequate.
Increased immunization and vaccination
coverage. E.g. 85 percent DPT coverage.
However there is still a challenge for poor
service delivery of these vaccines.
Improved infrastructure stock of facilities
especially accommodation. At least 70 per
cent health centres have accommodation
facilities.
Low staff levels due to poor remuneration
and high turnover of medical workers.
Lack of proper facilitation for transport
which hinders supervision and monitoring of
the delivery of health services.
Shortage of water at the district hospital and
poor drainage system.
Water and Sanitation
13 new boreholes have been drilled every year
and 6 shallow wells.
Access of water has increased to 64 per cent
from 60 per cent in 2011.
Sanitation in the district has also improved
(data could not be provided).
Quality of water drilled especially in Baale
county is of bad quality
Procurement cycles which are long results
into rolling projects into subsequent qtrs.
Increase in population is a challenge to
available services.
Works and transport
Every year the district rehabilitates about 50
kms—but only spot rehabilitation.
Community access roads have been opened
in almost every sub county.
The Road gangs have also been a success as
they have improved community roads
maintenance.
Insufficient funds is a constraint to do any
good roads in the district.
The manpower in this area is limited with
the recent cap on recruitment this has
limited supervision activities.
Machines provided are not enough and
strong to handle serious work in the district.
96 | P a g e
EM5 Progress on meeting the Binding Constraints
Kayunga district is attempting to address the various constraints through its DDP as follows:
The roads infrastructure is being addressed through the conditional grants provided by
the MOFED albeit the fact that the resources are very inadequate. The CAAIP project
has also helped to improve the road projects in the district.
The issue of mind-set in the district of Kayunga features in the perspective of low
participation of men in any development programmes which has contributed to the low
productivity in the district. Most development programs are largely dominated by women
and there is not much effort done to address this problem through the DDP or NDP.
Access to electricity is being addressed through the rural electrification program.
There is a high dropout rate in the district however; this is being partly addressed
through the UPE program.
Despite some progress to address some of these challenges, the district is also faced with
some challenges.
There is a high turnover of health personnel. When the district advertises they get
applicants who are appointed but only stay for a short period of time.
The high output of pineapples in the district has not been well vertically integrated to
promote more value addition. Some investors were identified to set up a factory for
pineapple processing but the district failed to identify the required land for the investors
and the investors relocated.
Like in other districts, Kayunga has a very limited local tax revenues and this limits their
flexibility in the implementation of district programs.
EM3: Relationship between NDP and Planning Process at the District
Increased allocations should be given to districts since they implement most of the
government programs rather than the ministries.
The government has to innovate on how to enhance the domestic revenue mobilisation
efforts at the district level.
There should also be a link between the outputs expected from the districts and the
inputs provided from a resource perspective.
97 | P a g e
Each district should forward one project which should be fully implemented in the NDP.
Much as there were some consultations, it is not clear whether the district inputs where
fully taken on board.
There is a need for support at district level in writing of the DDP. The district authorities
are not even sure whether what was prepared for the DDP was adequate. Planners
should therefore be supported by the NPA.
The next NDP should also take into consideration the high fertility rates which have
resulted into high population growth rate in the district. High population growth rate also
stretches provision of social services.
EM6: How has NDP implementation so far contributed to improvements in productivity,
private sector development and competitiveness?
UNCDF/MOLG has spearheaded the local economic finance initiative to ensure building
linkages between the private sector and the district to address issues blocking development
and exploitation of opportunities in the private sector. The district investment committee is
supposed to take lead in identifying the links and how to strengthen them. This initiative is
also linking local investors to sources of finance and sharing information. The key areas
where they have succeeded are as follows:
They have been able to enhance local economic development by facilitating PPP. Examples
of this include the “Patience Pays” which is involved in pineapple drying using solar
technology; Kangulumira area cooperative enterprise which is involved in pineapple wine
making, and Katikanyonyi Farmers Produce a marketing association which produces, adds
value and markets maize. As a result of these increased private sector activities, there has
been reduction in losses by farmers due to increased value addition and improved
marketing.
There are also some challenges to enhance private investments in the district. Underfunding
within the private sector and cost of financing are some of the hindrances to private sector
development. There is also lack of political will in the district where genuine investors are
viewed as land grabbers while the tenants are viewed as voters.
Kiruhura District Report
Kiruhura district which was recently curved out as a new district has had some successes
and faces challenges in the course of its NDP implementation. The key successes that have
98 | P a g e
been realized recently in the district are the transformation of their farming methods where
most livestock has now been converted from the local breeds to cross or Friesian breeds. In
addition, the district has also managed to diversify from livestock farming to crop farming
through various NAADS programs. The other key success in the district is the tremendous
improvement of their health indicators over the past two years. The third success has been
the increased market for milk produced which is evidenced by the number of coolers in the
district. Notwithstanding these achievements, the district is also constrained by some
challenges. The first key challenge in the district relates to being a water stressed district
despite some efforts to provide water for production. The second key challenge in the district
is the fact that it’s sparsely populated and therefore this makes it very difficult to provide
social services. A summary of the key successes and challenges in the district is provided in
the table below.
99 | P a g e
Table on key constraints
Successes Challenges
Agriculture
Move away from pure Ankole cattle to cross
breeds and fresians.
Diversification into crop production which has
led into increase in herd sizes.
Increased market for milk due to increase in
coolers now estimated at 169.
East coast fever which is attributed to
changes in breeds less susceptible to
disease.
Water stress levels in the district remain very
high
Close proximity to the park leads to being
susceptible to animals.
Education
Increased enrolments especially at UPE.
Performance of students at primary level has
greatly improved.
Improvement in quality of teachers after
abolition of licensed teachers.
Infrastructure for education is the biggest
challenge
Sparse population in the area also hinders
enrolments
Retention of teachers is a challenge given
that it’s a hard to reach area.
Health
District was voted the best improved in TB
capture in Uganda in 2011/12
Immunization coverage has been maintained
at close to 100 per cent for last two years.
Improvement in EID from 0 to 35 per cent
then to 72 per cent.
Underfunding for the recurrent expenditure.
70 per cent of recurrent needs not funded.
Understaffing at 41 per cent
Inadequate supply of drugs and lack of a
district hospital.
Water and Sanitation
Increased access to water through
construction of 3 valley dams, 5 shallow wells
and 64 household tanks.
Increased stability of households with more
water accessible.
Sanitation has improved from 70 to 83 per
cent especially latrines.
Expansion of water facilities does not match
the scarcity of the population.
Limitations in the use of technologies as
using pumped systems require extension of
power.
Mind-set of people used to move to start
using safe water.
Works and transport
Introduction of forced accounts has greatly
improved the ability of districts to do their
work.
Work gangs have helped in maintaining
community roads.
Machinery acquired from china breaks down
often and does not have enough
maintenance budget.
Inadequate staffing to supervise work gangs
Inadequate funding from the centre greatly
100 | P a g e
Successes Challenges
The new tarmac road has improved the
quality of the road network in district.
undermines work in progress.
PPDA is also a challenge in execution of
works.
EM5 Binding Constraints progress towards unlocking them
Despite the challenges above, some of the key binding constraints are being addressed
through the District Development plans and National Development Plan.
The poor infrastructure especially through the sparsely populated areas is partly being
addressed through the Community Agriculture Infrastructure Improvement Programme
(CAIIP) project. The recent adoption of the use of road gangs has improved the quality of
the community roads despite the limited funding.
Water for production is still a challenge being that the district is one of the water stressed
areas and yet it depends a lot on water given that most inhabitants are livestock farmers.
To extend water for production is being addressed through various programmes under
the water projects through provision of valley dams and water harvesting.
The limited employment opportunities in the district are being addressed through NAADS
and other stakeholders like SAMEER whose diary infrastructure has created
employment opportunities.
The limited access to electricity is being addressed through the rural electrification
program. However, this has also been hindered by the costs to use this power and the
fact that most people in this area keep on migrating as they search for water.
EM3 Relationship between NDP and Planning Process at the District
There is a complete disconnect between the District Development Plans, National
Development Plan and the budgeting process spearheaded by the Ministry of Finance
Planning and Economic Development. While there was some effort to align the district
development plans with the National Development Plan, there is less attention put on the
DDP at the district level while implementing work plans. The resources provided by the
MOFPED are the basis used to dictate what is done every financial year. In addition, there is
challenge that the DDP or NDP are not living documents which can be changed along the
way to accommodate the changing needs of the district.
101 | P a g e
While the NPA provided some guidance at the beginning for the development of the DDP,
there has been no follow up from the NPA since then to ensure the quality of the DDP and
the extent to which these documents are being implemented in the district. The monitoring
and evaluation aspect of the DDP is still lacking.
The sensitisation of the NDP at the district level by the NPA was also not adequate. This
explains why the district authorities until now they don’t own the document and largely
assume that it is an NPA document.
The district authorities are also of the view that the plan should guide the resource allocation
and should be adopted at all levels. There seems to be no link between the sector priorities
identified in the plan and the allocations provided by MoFPED. This also affects the districts
in the implementation of their DDPs.
There is also limited mentoring provided by the NPA at the district level in preparation of the
DDP to ensure that this is fully aligned with the NDP.
EM6: Private Sector Development and Competitiveness
Kiruhura district is a very rural and hard to reach area. The key activity in the area is
livestock farming. The recent improvement in the distribution of milk in the area has helped
to increase more value added activities especially in the extension of shelf life of milk.
However, beyond diary there are very limited private sector activities. The challenge for the
private sector to operate in the district is largely due to its remoteness and sparse
population. Indeed private sector development was mentioned as one of the key challenges
hindering development in the district. In addition, owing to its proximity to two large towns
(Lyantonde and Mbarara) private sector players find it more ideal to locate in these two
towns rather than a small place like Rushere town. The key driving private sector activities in
other towns include trading, banking and telecommunication outlets which all appear to be
missing in Kiruhura district. Despite these limitations, there are possible opportunities in the
district. One of the areas identified is in the tourism given that part of the district is a park.
EM7: Deregulation and Private Sector Development
The deregulation of milk activities has completely revamped this sector where before there
was only one major buyer of milk in the district (formerly Dairy Cooperation now Sameer).
However, after deregulation, the numbers of players have significantly increased which has

102 | P a g e
resulted into so many milk coolers being installed in district. It is estimated that they are over
300 milk coolers with capacity of about 3000 litres.


![Motor unit MTR-DCI€¦ · Description MTR-DCI-...IO Description 539616 en 1209d [763197] Motor unit MTR-DCI](https://img.pdfslide.net/doc/110x75/5f50cafd0ff31e4afa1c4f9b/motor-unit-mtr-dci-description-mtr-dci-io-description-539616-en-1209d-763197.jpg)


![Motor MTR-DCI - Festo · Descripción MTR-DCI-...-CO Descripción 539631 es 1209a [763214] Motor MTR-DCI](https://img.pdfslide.net/doc/110x75/5f777c2db26ccf0a2d169545/motor-mtr-dci-festo-descripcin-mtr-dci-co-descripcin-539631-es-1209a-763214.jpg)


![Grupo motor MTR-DCI...Manual MTR-DCI-...IO Manual 539 617 es 1201c [761 421] Grupo motor MTR-DCI](https://img.pdfslide.net/doc/110x75/5f50b60cf149462795018d10/grupo-motor-mtr-manual-mtr-dci-io-manual-539-617-es-1201c-761-421-grupo.jpg)