Embed Size (px)
Citation preview
ECONOMIC OPENNESS AND INCOME GROWTH: A
REASSESSMENT OF THE RELATIONSHIP FOR DEVELOPING
COUNTRIES
RICHARD N.B. YEBOAH
Bachelor of Arts, University of Ghana, 2010
A Thesis
Submitted to the School of Graduate Studies
of the University of Lethbridge
in Partial Fulfillment of the
Requirements for the Degree
MASTER OF ARTS
Department of Economics
University of Lethbridge
LETHBRIDGE, ALBERTA, CANADA
© Richard N.B Yeboah, 2016

ECONOMIC OPENNESS AND INCOME GROWTH: A
REASSESSMENT OF THE RELATIONSHIP FOR DEVELOPING
COUNTRIES
RICHARD N.B. YEBOAH
Date of Defence: October 16, 2015
Dr. A. Darku Associate Professor Ph.D.
Thesis Co-Supervisor
Dr. D. Rockerbie Associate Professor Ph.D.
Thesis Co-Supervisor
Dr. S. Malla Associate Professor Ph.D.
Thesis Examination Committee Member
Dr. K. Tran Associate Professor Ph.D.
Thesis Examination Committee Member
Dr. P. Ghazalian Associate Professor Ph.D.
Chair, Thesis Examination Committee
[iii]
Abstract
This study analyzes the economic growth differentials among developing countries across
Sub-Saharan Africa (SSA), Latin America and the Caribbean (LAC), South and East Asia
(SEA) and High Performing Asian Economies (HPAEs), in the context of economic
openness. We also investigate economic growth differences between developing
countries that opened up their economy early (1960s) and those that opened up later
(1980s). The results, using the SYS-GMM estimator show that, economic openness as
measured by foreign direct investment positively affects economic growth in SSA and
HPAEs. In LAC and SEA, it has no effect on growth. Openness as measured by
international trade positively affects growth in SSA and HPAEs. In SEA, the effect is
mixed while in LAC, trade has no effect on growth. The HPAEs recorded higher positive
trade effect on growth relative to the other countries on account of efficiently managed
inflation and well developed human capital.

[iv]
Acknowledgements
My utmost gratitude to God Almighty, without whom none of this would have been
possible. I would like to express a special appreciation to my supervisors Dr. Alexander
Darku and Dr. Duane Rockerbie. I have been fortunate to have supervisors who gave me
the freedom to explore on my own and the guidance to recover when my steps faltered.
You have been tremendous mentors to me. Thank you for your insightful comments and
constructive criticisms which were thought-provoking and helpful in enabling me focus
my ideas. I am grateful to you for holding me to a high research standard and teaching me
how to conduct research. I would also like to thank Dr. Kien Tran and Dr. Stavroula
Malla for serving as my committee members. I am also indebted to my colleagues at the
University of Calgary and the University of Lethbridge. You have helped me stay sane
through these difficult years. Your support and friendship helped me overcome setbacks
and to stay focused on my studies. I greatly value your friendship and I deeply appreciate
your belief in me.
I also acknowledge and appreciate the love, patience and sacrifice of my family.
My family, to whom this thesis is dedicated, has been a constant source of love, concern,
support and strength to me through all these years. Mum and Dad, your prayers have
sustained me thus far. I do extend my heart-felt gratitude to you my brothers for all the
sacrifices you made for me. And to you little sister, I am grateful for your love and
support. A special thanks to you Adriana, Eric and Dela for supporting me in writing, and
incenting me to strive towards my goal. And to all friends and loved ones who played a
part in getting me this far, I say thank you.
[v]
Table of Contents
Approval/Signature Page ii
Abstract iii
Acknowledgements iv
Table of Contents v
List of Tables vi
List of Figures vii
1.1 Introduction 1
1.2 Background and objectives…………………………………………………... 8
1.3 Thesis Contribution…………………………………………………………... 15
1.4 Thesis Organisation………………………………………………………….. 17
2.1 Economic Openness and Growth: A Review of the Literature 19
2.1.1 Comparative Studies……………………………………………………….. 23
2.1.2 Regional Studies …....................................................................................... 24
3.1 Regional Trends in Trade, Foreign Direct Investment and Growth 27
3.1.1 International Trade…………………………………………………............. 28
3.1.2 Foreign Direct Investment ………………………….……………………… 30
3.1.3 Economic Growth ………………………………………………………….. 33
3.1.4 Growth Trends between ‘Early’ and ‘Late’ openers ….………………… … 36
4.1 Methodology and Model Specification 40
4.1.1 Model Specification and Variables……………………………………….… 40
4.1.2 Econometric Estimation ….………………………………………………... 47
4.1.3 Data Description and Scope of Study………………………………………. 50
5.1 Estimation and Econometric Results 51
5.2 The Growth-Openness Model………………………………………………... 51
5.3 Openness Effects on Income Growth for ‘Early’ and ‘Late Openers’…………64
6.1 Summary and Conclusion 78
6.2 Policy Recommendation……………………………………………................ 81
References 83
Appendix 87
[vi]
List of Tables
3.1 Real GDP Growth, Trade and Foreign Direct Investment by Regions...………… 38
5.1A Openness (measured by Trade) and Income Growth in Developing Countries:
Pooled Regression………………………………………………………………..52
5.1B Openness (measured by FDI) and Income Growth in Developing Countries:
Pooled Regression………………………………………………………………..54
5.2A Openness (measured by Trade) and Income Growth in Developing Countries
(1980-2012): Regional Specific Regression ………………………………….....55
5.2B Openness (measured by FDI) and Income Growth in Developing Countries
(1980-2012): Regional Specific Regression….………………………………….61
5.3A Effects of Openness to Trade on Income Growth………………………………... 66
5.3B Effects of Openness to FDI on Income Growth……………………………….......68
5.4 Results from the extended Openness-Growth model ……………………………….72
A.1.1 List of Selected Countries...…………………………………..………………….. 87
[vii]
List of Figures
3.1 International Trade Trends in Developing Regions ………..…………………….29
3.2 Trends in Foreign Direct Investment in Developing Regions ……………….…...31
3.3 Real GDP Per Capita Growth Trends among Developing Regions………………33
3.4 Real GDP Per Capita Growth Trends between ‘Early’ and ‘Late’ Openers ……..37
[1]
CHAPTER ONE
1.1 Introduction
The developing world has been characterized by economic growth differentials and
persisting regional income inequalities over the past four decades. Countries in Latin
America and the Caribbean (LAC), South and East Asia (SEA), Sub-Saharan Africa
(SSA) and the high performing Asian economies (HPAEs) have witnessed different
levels of growth performances. Although countries in these regions performed similarly
well in the 1960s when most of them adopted import substitution industrialization as a
medium of attaining accelerated growth in per capita income, their performances varied
after the 1960s. The differences in economic performance across the regions have
attracted interests in determining their causes. While some attribute the differences to
international debt (Sachs, 1985), others attribute it to the financial repression (Roubini
and Sala-i-Martin, 1992). Many more have traced it to the degree of openness to
international trade, and it is in this context that this thesis seeks to explain the growth
differentials recorded in developing countries.1 The empirical investigation of the
economic openness and real GDP growth relationship dates back to the 1970s with the
works of Kruger (1978) and Balassa (1982) among others. These studies project
economic openness as an ‘engine’ of growth and a means to improving living standards.
During the 1970s and early 1980s, it was widely held among economists and
policymakers that, opening up the economy of developing countries was a better way to
achieve accelerated growth relative to the adoption of an inward-oriented economy.
1 See Balassa and Associates (1978), Kessides (1991), Dollar (1992), Chen (1999), Frankel and
Romer (1999) and Dollar and Kraay (2003)
[2]
Though this view was widely accepted, findings of empirical studies on the exact
openness-growth effect have remained uncertain. While some studies predict a positive
effect (Hansen and Rand, 2004), others have cast doubts on the robustness of this positive
effect (Rodriguez and Rodrik, 2001). The impact of external sector openness on
economic growth has therefore been and still remains uncertain among economists and
policy makers.
Economic theory explains why and how openness to trade and foreign direct
investment (FDI) generate improvement in growth performance. First, openness allows
economies to specialize in the production of goods for which they have comparative
advantage, either due to factor endowment or technological advancement. Specialization
ensures efficient allocation of scarce resources, yielding increased output, higher income
and improved standards of living. Secondly, openness to international trade leads to
increased market size and competition which yields efficient allocation of scarce
resources. Thirdly, opening up the external sector facilitates the transfer of technological
know-how and managerial expertise from developed countries to developing countries.
Openness to trade and foreign direct investment constitute an effective channel for
international transfer of know-how and dissemination of technological progress. If the
cost of imitating technological know-how is lower than the cost of internal innovation of
such technologies, then economic theory suggests that poorer countries will not only
grow, but grow even faster than more developed countries till some point of equilibrium
is reached between developed and developing countries in terms of technological know-
how. This will however hold only if such developing countries remain open to trade and
capital flows. Fourthly, a more open economy is able to avoid sharp contractions in
[3]
consumption and investment during periods of temporal income shortfall by running a
current account deficit. Similarly, when it has ample savings, an open economy is able to
participate in productive investment projects abroad, generating positive net factor
payments from abroad and hence increasing its national income. Outward oriented
policies that encourage capital inflows also create an enabling and supporting
environment for the private sector to thrive and fully contribute to the growth potential of
the domestic economy. In essence, the limitation of domestic investment financed solely
by inadequate domestic savings is eliminated, allowing for the inflow of foreign
investment which bridges the financial gap between domestic capital and the amount of
investment required to fully exploit the potential of the private sector and its significant
role of fueling domestic growth.
These benefits from openness are supposed to be realized when world trade is
relatively more liberalized because countries will be able to trade and interact more with
the rest of the world than they would under a less liberalized trade system. However, the
experiences among developing countries seem counter intuitive. Hence, the puzzle
associated with the high and sustained growth recorded by developing countries (HPAEs)
that opened up their economy earlier in the 1960s (dubbed ‘early openers’) when
international trade was less liberalized, and the relatively low and sluggish growth
recorded by other developing countries (LAC, SSA and SEA) that opened up later in the
1980s (dubbed ‘late openers’) within a more liberalized trade regime.
The adoption of free trade as a means to economic growth dates back to the 18th
century following Adam Smith and David Ricardo’s criticisms of the Mercantilist ideas
in Europe. Their argument for free trade was premised on the notions of absolute and
[4]
comparative advantage. This marked the birth of the free trade revolution. However, the
significant move from reliance on inward-looking industrial policies towards outward-
looking export-oriented strategies occurred after the late 1940s as many countries
reverted to inward-looking strategies prior to and during the World War II. Although
Great Britain had adopted free trade policies in the 19th century, most developed
countries during the latter part of the 19th century and early 20th century were still very
much industrialized and pursuing import protection policies. The United States,
Germany, France and Japan were predominantly inward-looking. The Soviet Union in the
1920s and 1930s as well as China after 1949 were no exceptions to the pursuit of inward-
oriented strategy to growth (Baldwin, 2004).
The 1940s and 1950s thus marked the beginning of significant world integration
through international trade led by developed countries. The period witnessed the
proliferation of Regional Trade Agreements (RTAs) which were initially among
developed countries (north-north in nature). The formation of the General Agreement on
Tariffs and Trade (GATT) in 1947 and the European Economic Community in 1957 are
examples of such RTAs. The latter part of the 1960s however saw RTAs take on north-
south forms, enabling developed countries to grant tariff concessions and other
preferential treatment to developing countries. The Kennedy Rounds of GATT held
between 1962 and 1967 are examples of such agreements which were targeted at the
expansion of trade in developing countries as means to furthering their economic
development. It was not until the late 1970s that most developing countries realized that
they could achieve their developmental goals by harnessing the gains from trade
[5]
partnerships with other developing countries rather than relying extensively on the rich-
north. The proliferation of RTAs thus came to include south-south agreements.
International trade became more liberalized after the late 1970s and 1980s when
most developing countries shifted from inward-oriented to outward-oriented growth
strategy. The African Caribbean Pacific (ACP) group of states created in 1975 entailed
the integration of developing countries towards the goal of achieving sustainable
development and poverty reduction. In attaining this, the member states most critically
sought to pursue greater integration into the world economy through trade. Hence, all
member states were signatories to the Cotonou Agreement with the European Union.2
The Geneva round of the GATT multilateral trade negotiations in 1947 was initially
signed by 23 countries in an effort to give an early boost to trade liberalization. The
number of countries later increased to 102 in the Tokyo round in 1973 and further to 123
by 1986 during the Uruguay round (World Trade Organization, 2012). Subsequent to the
1980s, the world has even become more integrated through trade and foreign capital
inflows. Currently, 82% of internationally recognized sovereign states (160 out of 195)
are member states of the World Trade Organization which was officially created in 1995,
replacing GATT (World Trade Organization, 2012). Other Free Trade Agreements
(FTAs) such as the African Growth and Opportunity Act (AGOA) signed into law in
2000 and renewed in June 2015, the Most Favored Nation (MFN) and the Generalized
System of Preference under the WTO, the North American Free Trade Agreement
(NAFTA) which came into force in 1994 and the Doha Round of trade negotiations
among the WTO membership launched in 2001 are some of the existing evidence of how
2 Except Cuba
[6]
liberalized international trade has become in the past three decades relative to the 1960s.
These trade developments have culminated into higher world trade-to-GDP ratios. In
1960, the world economy recorded a total trade to GDP ratio of 24.77%. By 1980, the
rate had increased to 38.72%. This has increased over the years to 42.76%, 49.81% and
55.88% in 1995, 2000 and 2010 respectively. By 2013, the ratio had reached 59.41%
(World Bank WDI, 2015). It is thus evident that, international trade has become more
liberalized after the late 1970s and early 1980s relative to the 1960s.
Empirical studies have however done little, if any, to explain the apparent
anomaly associated with the difference in growth experienced by the HPAEs and the
other developing countries within different trade regimes that seems even more favorable
to the other developing countries. Tagged as the ‘Asian Tigers’, Hong Kong, Singapore,
South Korea and Taiwan were the first among developing countries to successfully
transition their economies from inward-oriented to an outward-oriented approach to
economic growth and development in the 1960s.3 They were followed by Thailand,
Malaysia and Indonesia who also went ahead of other developing countries. These
countries and the ‘Asian Tigers’ have been referred to as high performing Asian
economies (HPAEs) due to the high level of economic growth they experienced after
opening up. The ‘miraculous’ growth recorded in South and East Asia between 1960 and
1990 was largely attributed to the growth performance of these HPAEs.
The Asian Tigers were noted for maintaining exceptionally high growth rates
such that by the early 2000s all four of them had attained the high income economy
3 With the exception of Hong Kong which was already pursuing open trade and investment
policies (Baldwin, 2004).
[7]
status. They grew in excess of 7% annually over three decades after opening up (between
1960 and 1990). Since most developing countries in Latin America and Sub-Saharan
Africa opened up later in the late 1970s and early 1980s, they have however recorded
comparatively, an annual lower average growth rate of about 3.37% between the 1980s
and 2010.4 After three decades of opening up, SSA and LAC grew less than half of the
growth rate experienced by the ‘Tigers’.
Open markets, free trade and other factors have mostly been credited with the
boom otherwise known as the economic miracle recorded by the HPAEs. It’s thus
puzzling that other developing countries could not and still have not been able to
experience such magnitude of sustained growth after opening up their external sector,
especially when they are doing so in a relatively more liberal international trade regime.
Daumal and Ӧzyurt (2011) explain that opening up the external sector leads to the
integration of an economy into global innovation networks and international market
contacts which increase the prospects of economic growth. However in a period when the
world was relatively less integrated (1960-1980), the HPAEs were able to maintain
growth rates twice the rates recorded by other developing countries within a period
(1980-2012) when the world had become more integrated.
Although empirical studies on the actual openness-growth nexus exist, it is yet to
be made conclusive. None of such studies has investigated the possible reasons for the
difference in the growth effect of openness recorded by HPAEs and other developing
countries. This thesis therefore reassesses the relationship between external sector
openness and economic growth as it pertains to developing countries. It also investigates
4 Author’s calculation using data from the World Development Indicator (WDI), World Bank
[8]
and explains the apparent anomaly that describes the difference between the openness
gains experienced by the HPAEs and developing countries in SSA, LAC and SEA within
two different trade regimes.
1.2. Background and Objective
The post-World War II era was marked by the independence movement, with developing
countries attaining independence from their colonial rulers. Motivated by the desire to
raise living standards, economic development became the prime objective of newly
independent developing countries. The quest for rapid growth formed the core of policy
making. A widespread view among economists and policy makers in developing
countries was that, the best way to achieve accelerated growth was by pursuing import-
substitution industrialization. To a very large extent, this approach was justified by a
number of reasons.
Having observed the developed countries that colonized them, developing
countries perceived import-substitution and industrialization policies to be a catalyst for
economic growth. The developed countries (former colonial rulers) had much higher per
capita income levels and were much more industrialized. To the developing countries,
industrialization was therefore an appropriate means to raising per capita income and
improving living standards. An economically viable approach to achieving significant
industrialization was perceived to be restricting imports, boosting domestic demand, and
using the country's primary-product export earnings to import capital goods for
industrialization. The economic prosperity of highly inward-oriented economies such as
[9]
Germany, France, the Soviet Union and the United States during the nineteenth and mid-
twentieth century were sources of motivation for the adoption of protectionist policies by
the developing countries.
Developing countries also had theoretical economic support for adopting inward-
oriented economies in the ''Infant Industry'' argument set forth by Alexander Hamilton
(1913) which was widely accepted by many classical and neoclassical economists as a
valid exception to the case for worldwide free trade.5 The pursuit of inward-oriented
economies by developing countries was also premised on the Dependency theory which
had become popular during the 1960s.6 The dependency theory advocated an inward
looking approach to development and an increased role for the state in terms of imposing
barriers to trade and promoting nationalization of key industries. Although the
protectionist policy approach worked well initially for the developing countries, its
drawbacks became increasingly apparent, with a net outcome of a slow paced growth rate
relative to the pace at which their economies grew prior to the adoption of import
substitution policies (Baldwin, 2004). It subsequently became apparent among economic
policy makers of developing countries that the import substitution strategy was not
appropriate for most developing countries in raising long-run growth rates.
5 the infant industry argument maintains that, during the temporary period when domestic cost in
an industry are above the product's import price, a tariff is a socially desirable method of
financing the investment in human resources needed to compete successfully with foreign
producers. (Baldwin, 2004)
6 Dependency theory is the notion that inward investment is a means of enriching a ''core'' of
wealthy states at the expense of a ''periphery'' of poor and underdeveloped states. Dependency
theory therefore encourages inward looking approach to development. It proposes increased state
role in imposing inhibitions to globalization in terms of international trade and foreign
investment.
[10]
By the 1960s, some developing countries begun to shift from the inward-oriented
to outward-oriented approach to economic growth and development with Singapore,
Taiwan and South Korea leading the way and experiencing appreciable levels of success
within fairly liberal trade systems. Though other developing countries undertook periodic
attempts to liberalize their trade restrictions, most of them still pursued the import-
substitution approach to growth until the late 1970s. Countries like Ghana, Uganda,
Turkey and Mexico adopted more outward-looking policies in the late 1970s and early
80s. The period also saw a gradual shift in thinking amongst economists and international
organizations such as the World Bank and the International Monetary Fund (IMF) from
inward-oriented to outward-oriented policies (Baldwin, 2004). The 1990s witnessed the
resurgence of the debate over the Dependency theory with majority of the research works
focusing on the repercussions of opening up to foreign investment on economic growth.
Most findings debunked the argument made by dependency theorists and showed that
opening up to foreign capital flows had beneficial rather than detrimental effects on
economic growth.
It became increasingly apparent that the inward-oriented approach (import-
substitution approach) to growth was not an effective means to raising long run growth
rates in developing countries. In identifying what could have gone wrong, Baldwin
(2004) discusses two mistakes; an uncritical acceptance of the ‘Infant Industry’ argument
and a failure to consider the macroeconomic consequences of import substitution
policies. For instance, as noted by Meade (1955), the infant industry argument is
premised on technological externalities associated with the learning process. However in
reality, the externalities create little or no incentive to entrepreneurs in bearing the
[11]
knowledge-acquisition cost. For example, in acquiring the know-how about local
production techniques needed to compete with foreign producers, an entrepreneur who
bears the innovation cost of such technique faces the challenge of his innovation
becoming freely available to other local producers. With free access to the new
technique, the entrepreneur who bore the initial innovation cost faces competition from
his local competitors (who also use the technique). This drives down the product’s price
to levels where the initial entrepreneur is unable to recover his cost of the innovation. The
fact that technological externalities may not be internalized reduces the incentive to learn
and innovate local production techniques needed to compete with foreign producers. The
imposition of protective tariffs is no guarantee that individual entrepreneurs will
undertake additional investment in knowledge acquisition (Baldwin, 2004). In most
developing countries, the infant industries receiving infant-industry protection were
therefore slow to grow.
Following the setbacks of the infant industry argument and the negative effects of
protectionist policies on macroeconomic variables such as aggregate exports and imports,
the inward-oriented approach to development lost its popularity in most developing
countries. Theoretical literature on the openness-growth relationship has come to
reinforce the need for liberalizing the external sector. According to the theory of
‘Comparative Advantage’, free international trade allows for the efficient allocation of a
country’s resources to the production of goods for which it incurs the least resource cost
while enabling the import of goods and services that would otherwise be produced
domestically at a higher resource cost. The Ricardian model of comparative advantage
holds that even if a country has absolute advantage in the production of both goods, trade
[12]
is still a preferred option to autarky. This leads to efficient resource allocation across
countries and hence increases total world output and welfare. The Hecksher-Ohlin-
Samuelson theory also shows that welfare gains are enjoyed from trade through
specialization which is based on factor endowment. These static trade models suggest
that openness temporarily increases growth due to short-run gains from the reallocation
of resources.
Recent growth literature identifies channels through which openness to trade
affects economic growth in the long run. According to Harrison and Hanson (1999), less
developed countries which open up to international trade, create more opportunities to
absorb new ideas, fill in their technological gaps and converge faster to international
norms. Endogenous growth models have also shown that, through participation in world
markets, trade affects economic growth positively through improvement in Total Factor
Productivity (TFP) and growth in knowledge acquisition. Generally, these models
suggest that trade leads to accelerated growth in the long run. Economic theory further
establishes that there are two main gains from international trade; consumption and
production gains which ultimately translate into increase in national output and
improvement in collective living standards. This is because international trade causes
production to be centered on those sectors where an economy’s labour is relatively most
efficient resulting in greater output which allows citizens to expand their basket of
consumption goods and services at relatively lower prices than they could afford in
autarky. Openness to foreign direct investment also serves as a channel for the transfer of
know-how, technological progress and managerial expertise from developed to
[13]
developing economies, improving the skills and dexterity of labour in developing
countries.
The openness and growth relationship in the theoretical framework have however
been indistinct. In Thirlwall’s Balance of Payments constrained growth model, which
explains the trade-growth relationship through the demand-pull characteristics of exports,
trade represents an important constraint to economic growth by means of balance of
payments problems. A dynamic version of the Ricardian model presented by Findlay
(1984) also suggests that trade reduces growth rate. His model indicates that relative to
autarky, trade leads to declining growth for countries which export agricultural goods and
imports industrial ones. Rodrik (1999) describes the theoretical openness-growth nexus
as fundamentally ambiguous.
In line with the theoretical ambiguity surrounding the trade-growth relationship,
empirical studies have also suggested inconclusive results on the openness-growth
relationship. Nonetheless, most findings of these studies suggest that opening up the
external sector boosts economic growth. In an attempt to test the relationship between
trade and economic growth, Balassa and Associates (1978) regress the growth rate of
exports on the growth rates of output. The study used two measures of output; one
without exports and the other with exports. The results of the study show a significant
positive relationship between trade and economic growth. The positive relationship was
however stronger when output was inclusive of exports. This finding is also consistent
with Krueger's (1978) claim that when the growth of exports is faster, the growth of
Gross National Product (GNP) is also faster.
[14]
To a very large extent, recent empirical research agrees with the positive effect of
opening up to foreign investment on economic growth. Firebaugh (1992) argued that
foreign investment would adversely affect economic growth if it were less productive
relative to domestic capital and if domestic capital is displaced by the relatively less
productive foreign investment. De Soysa and Oneal (1999) however show that foreign
investment is more productive relative to domestic capital. Using Granger causality test,
they also show that FDI stimulates rather than displaces domestic investment; hence
developing countries have no reason to eschew foreign investment inflows in pursuit of
rapid economic growth. The works of Edward (1998), Frankel and Romer (1999), Fu
(2004), Liu et al (2005) and Cheng and Mendy (2012) show that openness in terms of
both international trade and FDI is beneficial to economic growth.
Following the discussions on the indistinctive openness-growth nexus and the
seeming anomaly associated with the growth benefits from openness experienced by the
early and late openers within a more restrictive and a relatively less restrictive trade
regime respectively, the objectives of this thesis are set as follows. First, this thesis is
done in the Chen (1999) framework, which analyzes the openness-growth relationship in
a comparative context. We however extend the analysis to cover regions that are more
representative of the developing world. The thesis re-assesses the interaction between
economic openness and economic growth within a trans-regional context using Latin
America and the Caribbean (LAC), South and Eastern Asia (SEA) and Sub-Saharan
Africa (SSA). Secondly, this thesis examines whether intra-regional income inequality
can be attributed to external sector openness. That is, whether openness widens the
income gap between countries in the same region. If the empirical result is supportive of
[15]
the fact that the gains from openness to growth is contingent on the initial income level of
a country, then openness could be an important factor in explaining regional inequalities
in income between relatively rich and poor countries. Thirdly, this thesis identifies, tests,
and explains the sharp contrast between the high rates of growth recorded by the HPAEs
within a period when international trade was relatively less liberalized and the relatively
low growth rates recorded by the other developing countries in recent times when
international trade is relatively more liberalized. To the best of my knowledge, this is the
first study that seeks to conduct a trans-regional comparative analysis of the openness-
growth relationship in the developing world while investigating the reason behind the
difference in the growth-effect of openness as recorded by the HPAEs and other
developing countries.
1.3 Thesis Contribution
This thesis makes three important contributions to the economic openness and growth
literature. First, it adds to the scanty empirical studies on comparative trans-regional
analysis of the openness-growth relationship. The empirical evidence of the openness-
growth nexus has been examined within cross-country empirical studies, within-country
studies as well as in comparative studies that rely on within-regional variations. Chen
(1999) is one of the few, if not the only study that makes a trans-regional comparison. He
studies the openness-growth nexus in the context of economic growth differentials among
countries in East Asia and Latin America. The study shows that the higher the degree of
openness, the greater the growth rate experienced. This thesis therefore addresses the
[16]
need for additional and extended trans-regional studies as acknowledged by Jelles (2012).
According to him, regional-specific research on the impact of trade should be undertaken
in regions other than South and South-East Asia. The thesis therefore extends Chen’s
(1999) study to cover an additional region. It comparatively analyzes the growth-
openness nexus within the context of growth differentials in Latin America, South and
East Asia and Sub-Saharan Africa.
This thesis also examines whether external sector openness contributes to the
income differentials among countries within a given developing region. That is, whether
openness contributes to widening the income gap between countries in the same region.
This is relevant to ascertaining whether or not the effect of openness on economic growth
is contingent on the initial growth performance of an economy. Precisely, it shows
whether openness is more beneficial to relatively richer states than poor states within a
given developing region. An empirical result which shows that, the magnitude of the
openness effect on growth is contingent on initial growth performance implies that,
openness is an important factor in explaining the differences in growth between relatively
rich countries and poor countries. Studies that focus on the effect of economic openness
on economic growth have used economic models that do not capture the effect of
openness on economic growth given the initial level of growth already attained by a
country.7 This study therefore modifies the 'standard' growth model to include an
interaction variable of a country's initial real GDP per capita and its openness to
determine if the effect of openness on economic growth is dependent on the level of
7 See Krueger (1978), Frankel and Romer (1999) and Dollar and Kraay (2004),
[17]
economic growth attained by an economy. In essence, it examines if openness accelerates
or decelerates convergence among developing countries.
This thesis further makes a contribution to the openness-growth literature by
analyzing the contrast between the high rate of growth recorded by the high performing
Asian economies (HPAEs) who opened their economies when the world trade regime
was relatively restrictive and the relatively low growth rates recorded by other developing
countries such as those in Sub-Saharan Africa and Latin America in recent times when
international trade is relatively more liberalized. To the best of our knowledge, this is the
first study that investigates the growth differences recorded by the ‘early openers’ and the
‘late openers’ while conducting a trans-regional comparative analysis on the openness-
growth relationship in the developing world. This analysis will yield policy
recommendations for advancing accelerated growth in developing countries.
1.4 Thesis Organization
The rest of the thesis is organized as follows. The next chapter (chapter two) presents a
review of relevant theoretical and empirical literature on the openness-growth nexus. The
chapter presents in detail, the conflicting findings of empirical studies that have
attempted to explain the openness-growth relationship. Chapter three analyzes and
discusses the performance of HPAEs and other developing regions since opening up their
external sector. The chapter discusses regional performances in terms of growth,
openness to trade and foreign investment inflows, making some comparative analysis of
how the trends have differed over the decades. Chapter four presents the econometric
[18]
model and the relevant variables that are used to empirically examine the relationship
between openness and growth. It also discusses the econometric challenges associated
with estimating the econometric model with alternative techniques as well as the rationale
behind the choice of the appropriate estimation technique used in this study. In chapter
five, we estimate and discuss the empirical findings of the standard growth model.
Chapter six summarizes and concludes the thesis with policy recommendations.
[19]
CHAPTER TWO
2.1 Economic Openness and Growth: A Review of the Literature
The impact of external sector openness on economic growth has been and still remains a
subject of debate among empirical studies. As discussed in the previous chapter, the
growth-effect of outward-oriented economic policies remain uncertain in theory and most
especially in empirical studies. According to the hypothesis of factor input mobility
across sectors, the international trade theory of Heckscher-Ohlin-Samuelson, suggests
that openness to international trade may generate substantial gains by reallocating
resources between tradable and non-tradable sectors. Other theoretical models however
suggest that free trade may hurt growth in income of underdeveloped or agrarian
economies. In Bagwahati’s (1958) immiserizing growth, export led growth may lead to a
decline in national welfare. According to this theory, if growth is heavily export biased,
it might worsen the terms of trade of the exporting country. In some instances this decline
in the terms of trade may be so large as to outweigh the gains from growth.
In empirical studies, the relationship remains indistinctive. According to Daumal
and Özyurt (2011), an open economy can improve the skills and dexterity of its labor
force by learning through exporting. More so, opening up the external sector leads to the
integration of an economy into global innovation networks and international marketing
contacts which provide ideas to local producers to innovate and develop new products.
Romer and Gugerty (1997) also argue that openness to the world economy including
allowing foreign investment inflows is critical to enhancing economic growth. According
to Myint (1958), openness to international trade in developing economies serve as an
[20]
effective means to overcoming the narrowness of the domestic market and providing an
outlet for surplus products relative to domestic demand. De Soysa and Oneal (1999) find
that the inflow of foreign investment has beneficial effects on economic growth. Their
study shows that foreign capital penetration has no negative effect on economic growth.
Hansen and Rand (2004), Kessides (1991) and Balassa and Associates (1978) are a few
of the studies that predict positive growth effect of openness. Nevertheless, Young
(1991) poses an argument against the positive effect of openness, claiming that
liberalizing trade may push some economies to specialize in low value-added activities
such as extraction and exploration of natural resources and production of primary goods.
In effect, these non-dynamic sectors face low propensity for technological progress which
turns out to be detrimental to long-run economic growth. Studies by Rodriguez and
Rodrik (2001) and Harrison (1996) have also cast doubts on the robustness and
significance of the positive growth effect of openness. According to Rodriquez and
Rodrik (2001), the various indicators of openness used by researchers are poor measures
of trade barriers. They also criticize the methods used to ascertain the link between trade
policy and growth as having serious shortcomings. After reviewing studies such as Dollar
(1992), Ben-David (1993), Sachs and Warner (1995), and Edwards (1998) they find little
evidence that openness to international trade are significantly associated with economic
growth. The results of Eris and Ulas (2013) suggest that, policymakers should not follow
trade-openness-enhancing policies based purely on growth objectives. In their study, they
used Bayesian model averaging techniques to investigate the robustness of the
relationship between trade openness and long-run economic growth using a cross section
of countries over the period 1960–2000. Their results show no evidence that trade
[21]
openness is directly and robustly correlated with economic growth in the long run. A
study by Tekin (2012) shows similar results for a panel of Least Developed Countries
(LDCs). Using Granger causality testing approach and taking into account cross-sectional
dependence and heterogeneity issues, his study finds no significant causality relation
between openness to trade and economic growth. The results obtained by Amadou (2013)
in analyzing the causal relationship between openness and economic growth in the West
African Economic and Monetary Union (WAEMU) countries suggest that besides Côte
d’Ivoire, trade openness doesn’t cause economic growth in WAEMU countries.8 A more
recent study by Ulaşan (2015) examines the openness–growth nexus in a dynamic panel
data framework, using various openness indicators. His findings show that lower trade
barriers are not associated with higher growth, implying that trade openness by itself does
not boost economic growth.
In spite of the seemingly mixed findings on the openness-growth relationship, the
tendency is towards a positive impact of openness on growth. Sachs and Warner (1995)
empirically examine the relationship using 122 countries. They show that open countries
exhibit higher growth rates relative to inward oriented countries. Hansen and Rand
(2004) also examine the causal link between foreign direct investment (FDI) and growth
using estimates from heterogeneous panel data. Analyzing the Granger-Causal
relationship between FDI and GDP in 31 developing countries, they show that opening
up to FDI promotes economic growth. Liu et al (2005) adopt a dynamic approach to
investigate the impact of openness on production efficiency improvement and compared
8 WAEMU is a regional organization of eight West African countries (Benin, Burkina Faso, Cote
d’Ivoire, Guinea Bissau, Mali, Niger, Senegal and Togo) with the objective of promoting regional
economic integration and creating a common market.
[22]
the link between openness and economic performance in Malaysia, India and China.
Their results indicate that openness as measured by international trade and foreign direct
investment plays a positive role in improving an economy’s production efficiency,
although the impact of trade is not as robust as that of FDI. They also report that
Malaysia, which had the highest degree of openness, enjoyed the highest economic
performance among the three economies. Further studies by Frankel and Romer (1999),
Dollar and Kraay (2004), Bussman et al (2002) and Calderon et al (2004), show that
opening up the external sector positively impacts per capita income growth.
Recent review of empirical literature on the relationship between openness and
the level of national income by Winters and Masters (2013) reinforces the presumption of
a positive causal link from trade to income growth, especially by solving endogeneity
issues and allowing for heterogeneity between countries. According to them, besides the
positive relationship, heterogeneity also suggests openness to trade is less beneficial to
low-income countries than other countries, though this is not completely settled. Zeren
and Ari (2013) reinvestigate the causality relationship between trade openness and
economic growth for the developed countries between 1970 and 2011. Using the Granger
non-causality test for heterogeneous panel data, they find that openness increases
economic growth in the G7 countries, as is suggested by the endogenous growth theory.
They however show that, there is a feedback relationship between the two variables, such
that while openness to trade increases growth, the increase in growth increases openness
in return. The positive nexus between trade and growth has also been established within
rapidly developing countries. In their study, Mercan, Gocer, Bulut and Dam (2013)
examine the effect of trade openness on economic growth via panel data analysis method
[23]
in a sample of five emerging markets (Brazil, Russia, India, China and Turkey). Their
results show that openness affects economic growth positively with a 1% increase in
openness level increasing growth at the rate of 0.27%.
2.1.1 Comparative Studies
Other studies have conducted comparative analysis on the openness-growth nexus,
relying on within-country variations. According to Daumal and Özyurt (2011), these
studies mostly reported robust findings of growth in income benefits from opening up to
trade. Rivas (2007) empirically examines the openness-growth nexus across Mexican
states. She regresses growth rate of states on trade openness and interacts income levels
of various states with trade openness. Her results show that trade openness is beneficial to
growth of Mexican states. Furthermore, states with higher income levels are shown to
benefit more from openness relative to states with low income levels. Daumal and Özyurt
(2011) also perform a similar comparative study over Brazilian states, taking into account
each state's initial income level. Covering 26 states over the period between 1989 and
2002, they show that openness is more beneficial to states with higher levels of initial per
capita income. In addition, their results show that external sector openness benefits
industrialized states more than states with an agricultural based economy. This implies
that the gains from openness can be increased in developing countries by shifting from an
agrarian based economy that characterizes such countries towards an industrialized
economy. Other within-country studies such as Goldberg et al (2010) and Fu (2004) also
show positive effect of openness on growth in India and China respectively. The findings
[24]
of cross country comparative studies are not any different from those of within-country
comparative studies. Kakar and Khilji (2011) examine the causality between openness
and growth for Pakistan and Malaysia over three decades. They show that in the long run
openness as measured by trade positively affects growth rate in both Pakistan and
Malaysia. FDI is however shown to have an opposite causal relationship with GDP in
Malaysia, such that GDP growth rather causes increase in FDI.
Some researchers argue that the impact of trade on growth should not be expected
to be homogenous across countries. Chang et al (2009) argue that the growth effect due to
openness may be contingent on some structural characteristics. They therefore test this
hypothesis empirically by creating alternative interaction variables of trade openness and
inflation, openness and education, openness and governance, openness and initial GDP
per capita amongst others. Their results show a positive impact of trade openness on
economic growth only under certain conditions, such as when the labor market is flexible
enough. Calderon et al (2004b) find no growth effect of openness for low level per capital
income countries while high-income countries exhibit positive growth-effect of trade
openness.
2.1.2 Regional Studies
The openness-growth relationship has also been empirically examined by some regional
based studies. The results of such studies however appear to be mixed. Joao et al (2012)
assess the relationship between trade agreements, trade integration and economic growth
in Asia using 21 South and South East Asian countries over the period 1980 to 2004.
[25]
Their results show that openness of either a single country or of its neighbors does not
affect a nation's growth. According to them, Panel Granger-Causality tests between
openness and growth yield mixed results. Empirical studies of the openness-growth nexus
in Africa however show a clear cut effect of openness on growth. Following the
econometric methodology of Barro (1991) and Kandiero and Chitiga (2003), Chang and
Mendy (2012) examine the impact of openness on growth in Africa. Their study uses a
panel data of 36 African countries over the period 1980-2009. Using fixed-effect models,
they carry out panel regressions and their results show that openness to both trade and
foreign investment is significantly and positively related to economic growth. Using
South Africa as a benchmark, they further show that North Africa is the best sub-region
in generating positive GDP growth from FDI followed by Central Africa whilst East
Africa and West Africa compete for the third and fourth positions. In his study, Jouini
(2015) explores the empirical link between growth and openness to international trade,
controlling for auxiliary variables in the model for the six Gulf Cooperation Council
(GCC) countries over the period 1980–2010. His results show evidence of cointegration
relationship between trade and growth, revealing that economic growth responds
positively to trade openness over both the short run and long run. His study suggests the
non-fragility of the relationship between economic growth and openness to international
trade for the GCC region as the result is robust to using various trade openness measures
and alternative model specifications
In light of the discussed literature, it is apparent that external sector openness
contributes positively to economic growth. The empirical evidence of the positive impact
is exhibited in cross-country empirical studies, within-country studies as well as
[26]
comparative studies that rely on within-region variations. Chen (1999) is one of the few,
if not the only study that makes a trans-regional comparative study of the openness-
growth relationship. His study analyzes the impact of openness on growth in the context
of economic growth differentials among countries in East Asia and Latin America. The
results show that openness is significant to improving growth and also the degree of
openness due to outward-oriented policies is an important factor yielding the difference
in growth rates between countries in the two regions. The study therefore shows that the
higher the degree of openness, the higher the economic growth experienced.
This thesis therefore seeks to address the need for regional-comparative studies on
the impact of openness on growth as identified by Jelles (2012). It extends the data
sample used by Chen (1999) to include Sub-Sahara Africa. It also uses an updated dataset
of openness and growth measures which have changed over a decade since the study by
Chen (1999).
[27]
CHAPTER THREE
3.1 Regional Trends in Trade, Foreign Direct Investment and Growth
As a mechanism for promoting rapid economic growth in developing countries, outward
oriented economic policies, including trade liberalization and foreign investment policies,
have been the centerpiece of economic policy reforms since the 1970s. Prior to discussing
the empirical openness-growth nexus, this chapter analyzes the growth and openness
trends in developing regions during the post 1980s when most developing countries
switched from inward oriented to outward oriented development strategies. It also
analyzes the differences in the growth trends experienced by the early (HPAEs) and late
openers (other developing countries) over the first three decades following their
respective pursuit of outward-looking economic policies. The analyses cover Sub-
Saharan Africa (SSA), South and East Asia (SEA), Latin America and Caribbean (LAC)
and the high performing Asian economies (HPAEs). The trends are computed using a
sample of 6 HPAEs over the period 1960 to 1990, and 87 other developing countries
consisting of 40 Sub-Saharan African countries, 22 South and East Asian countries and
25 Latin American countries over the period 1980 to 2012. The period is further divided
into three sub-decades to reflect economic growth patterns and the adoption and
implementation of major openness policies.
The first sub-period (1980-1990) marks the inception of the Structural Adjustment
Program (SAP) in developing countries while the second sub-period (1991-2000)
captures the boom in information technology investment. The 1990s is also noted for the
rapid growth in world trade over world income. Trade grew more than twice as fast as
growth in income between 1990 and 1999 according to Martin (2001). The third sub-
[28]
period (2001-2010) captures the trend in growth and openness following the inception of
such growth and trade policies as the African Growth and Opportunity Act (AGOA), the
Doha round of trade negotiations among World Trade Organization members and the
Poverty Reduction Strategy Papers (PRSPs) geared towards promoting broad-based
economic growth.
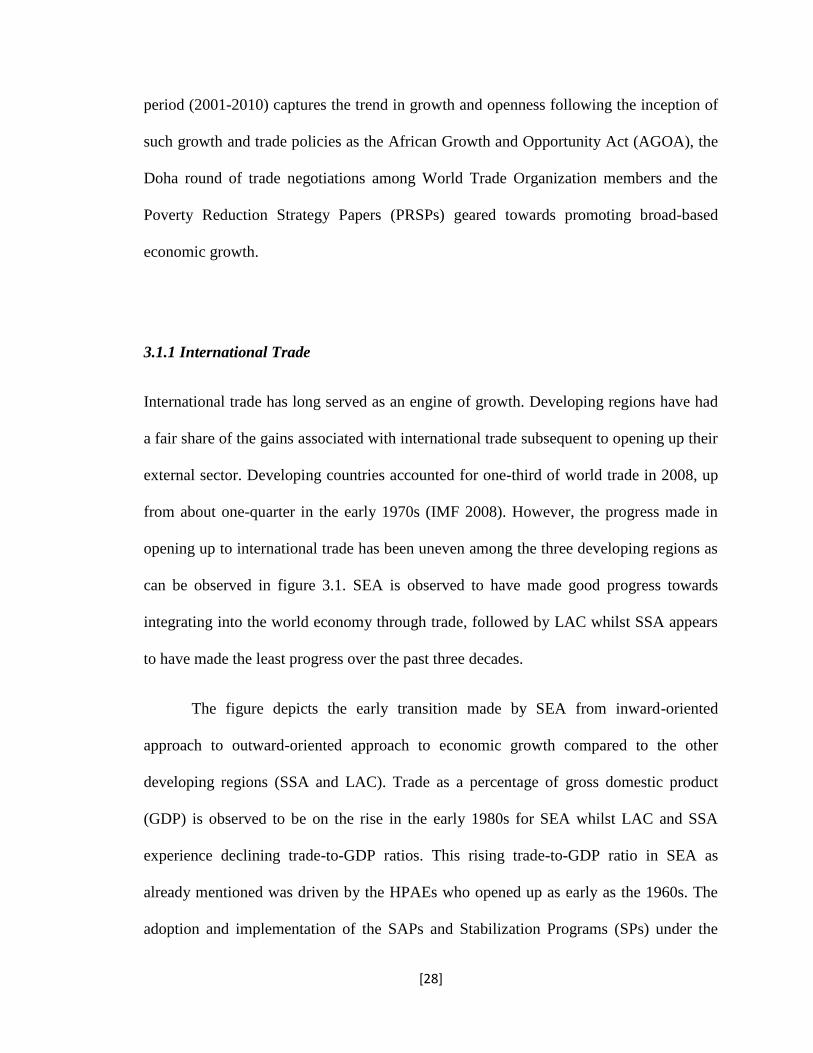
3.1.1 International Trade
International trade has long served as an engine of growth. Developing regions have had
a fair share of the gains associated with international trade subsequent to opening up their
external sector. Developing countries accounted for one-third of world trade in 2008, up
from about one-quarter in the early 1970s (IMF 2008). However, the progress made in
opening up to international trade has been uneven among the three developing regions as
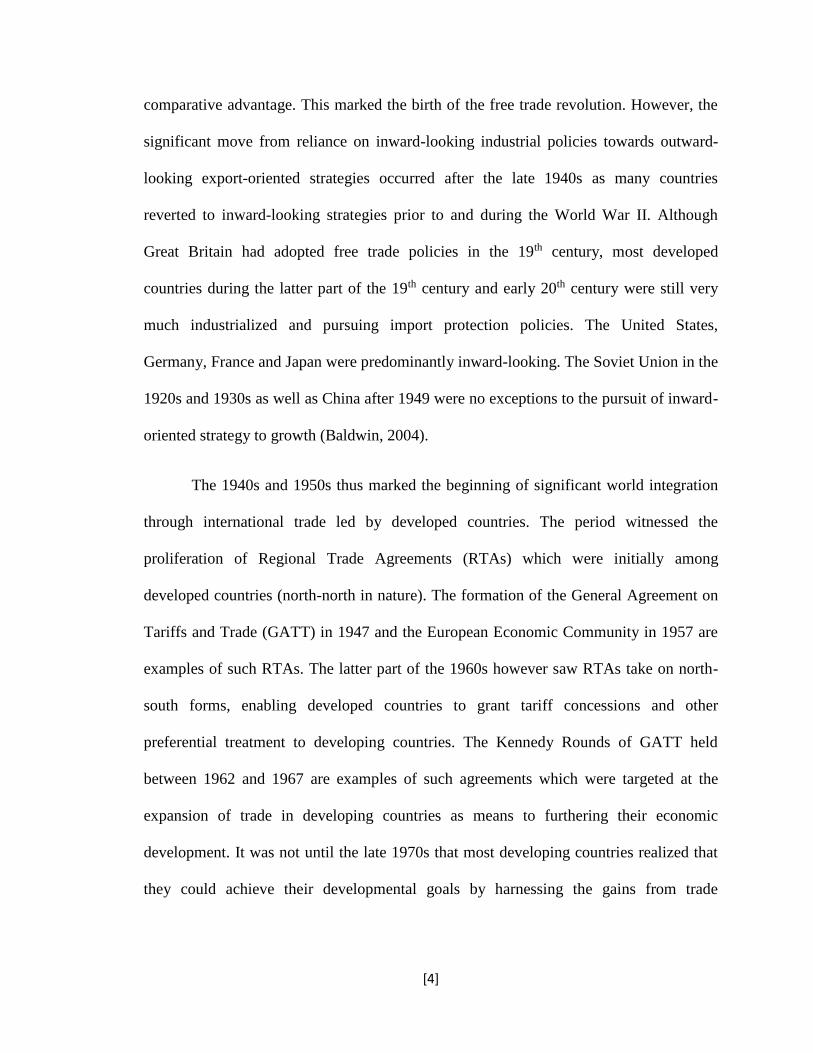
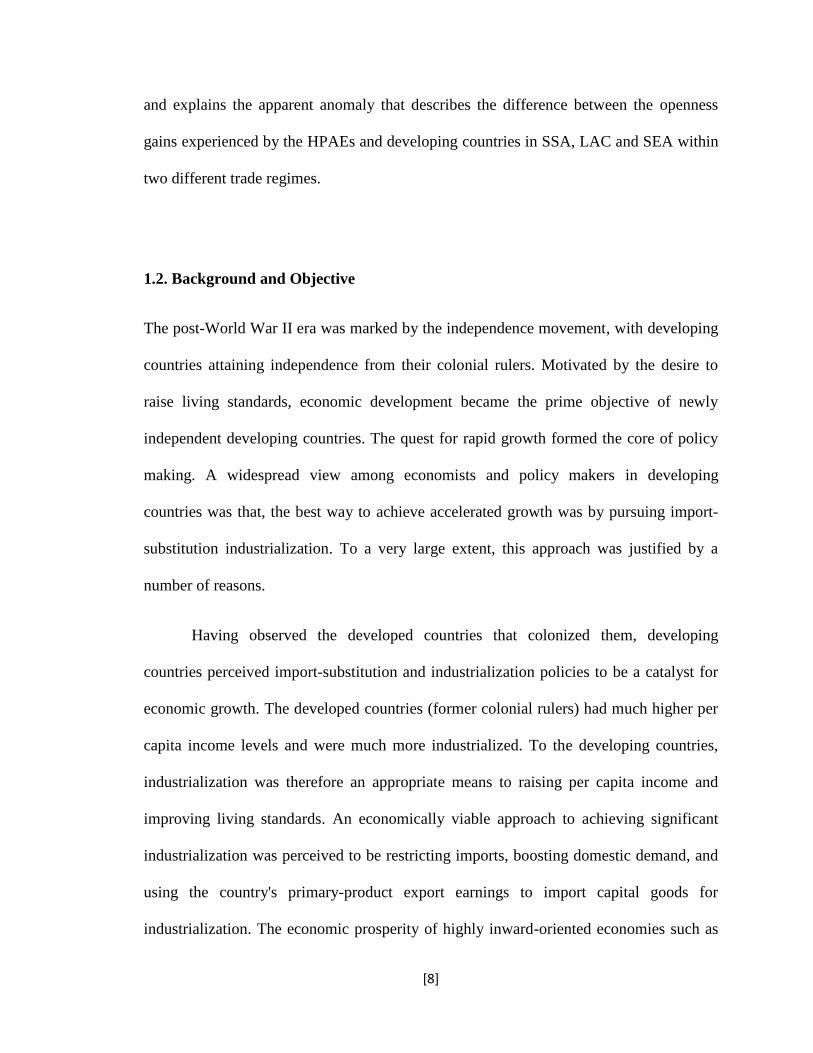
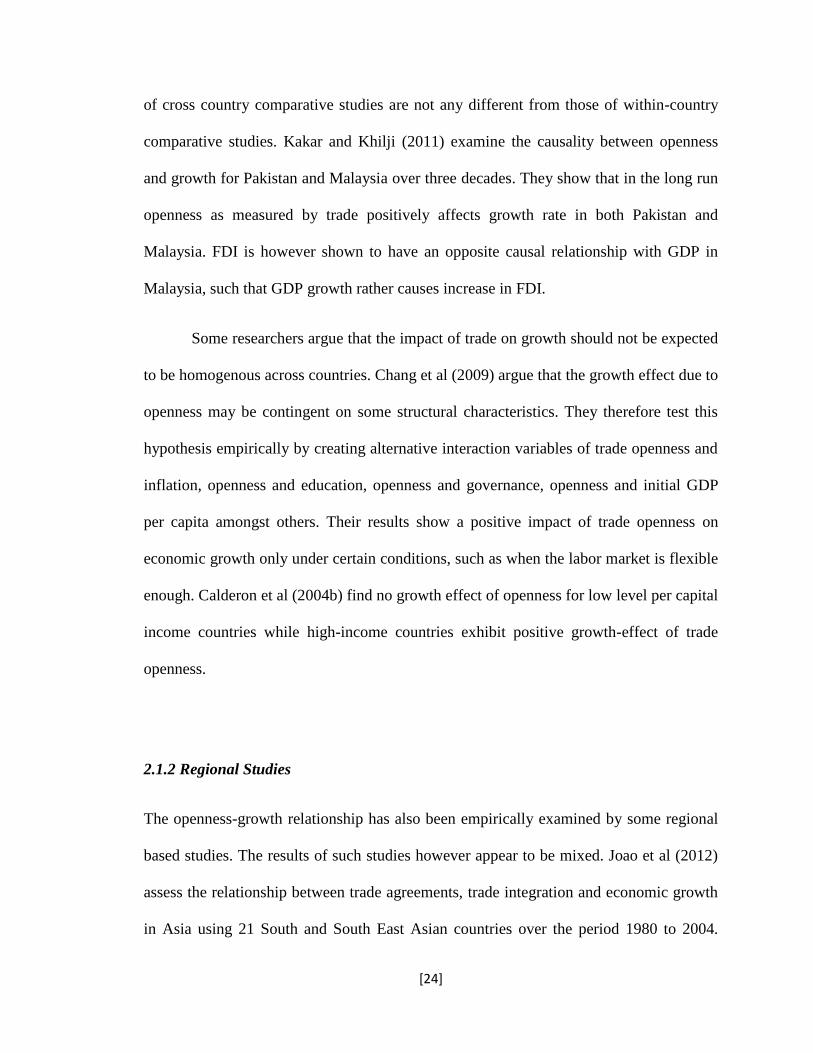
can be observed in figure 3.1. SEA is observed to have made good progress towards
integrating into the world economy through trade, followed by LAC whilst SSA appears
to have made the least progress over the past three decades.
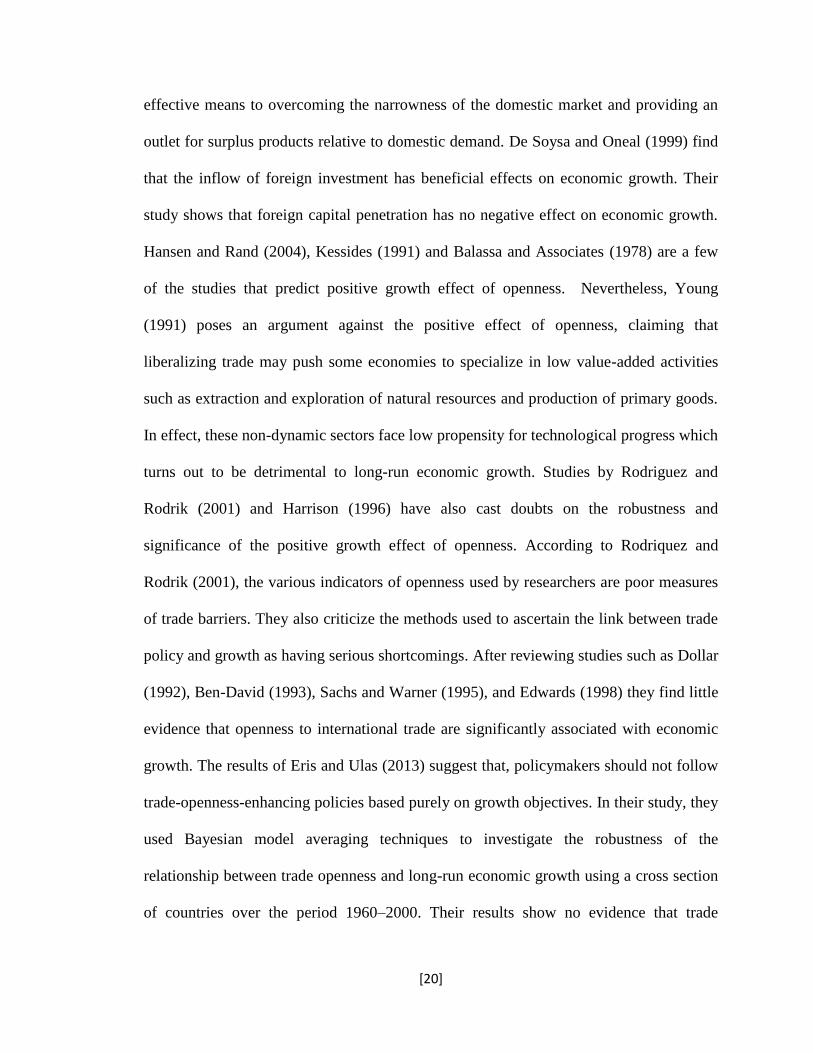
The figure depicts the early transition made by SEA from inward-oriented
approach to outward-oriented approach to economic growth compared to the other
developing regions (SSA and LAC). Trade as a percentage of gross domestic product
(GDP) is observed to be on the rise in the early 1980s for SEA whilst LAC and SSA
experience declining trade-to-GDP ratios. This rising trade-to-GDP ratio in SEA as
already mentioned was driven by the HPAEs who opened up as early as the 1960s. The
adoption and implementation of the SAPs and Stabilization Programs (SPs) under the
[29]
auspices of the Bretton Woods Institution in the 1980s coupled with trade policy reforms
in the late 1980s and early 1990s saw LAC and SSA join SEA in experiencing increasing
rates of trade-to-GDP ratios between the late 1980s and early 1990s.
Figure 3.1 International Trade Trends in Developing Regions
Source: World Development Indicators (WDI), World Bank (2013).
The increasing trend continued for all three developing regions till the late 2000s when
the world economy experienced a down turn due to the 2007-2008 financial crises. All
three regions are however observed to be making good recovery in the early 2010s with
rising trade to GDP ratios.
It is observed that after the early 1990s, all three developing regions have
experienced upward trending trade-to-GDP ratios. This shows that over the past two
60
70
80
90
10
0
Tra
de a
s a
pe
rce
nta
ge
of G
DP
1980 1990 2000 2010Year
South and East Asia Latin America
Sub-Saharan Africa
[30]
decades, developing countries have pursued outward-oriented economic growth policies
than they did prior to the late 1980s and early 1990s. It also shows how liberal the
international trade system has become over the years, leading to a more integrated world
economy.
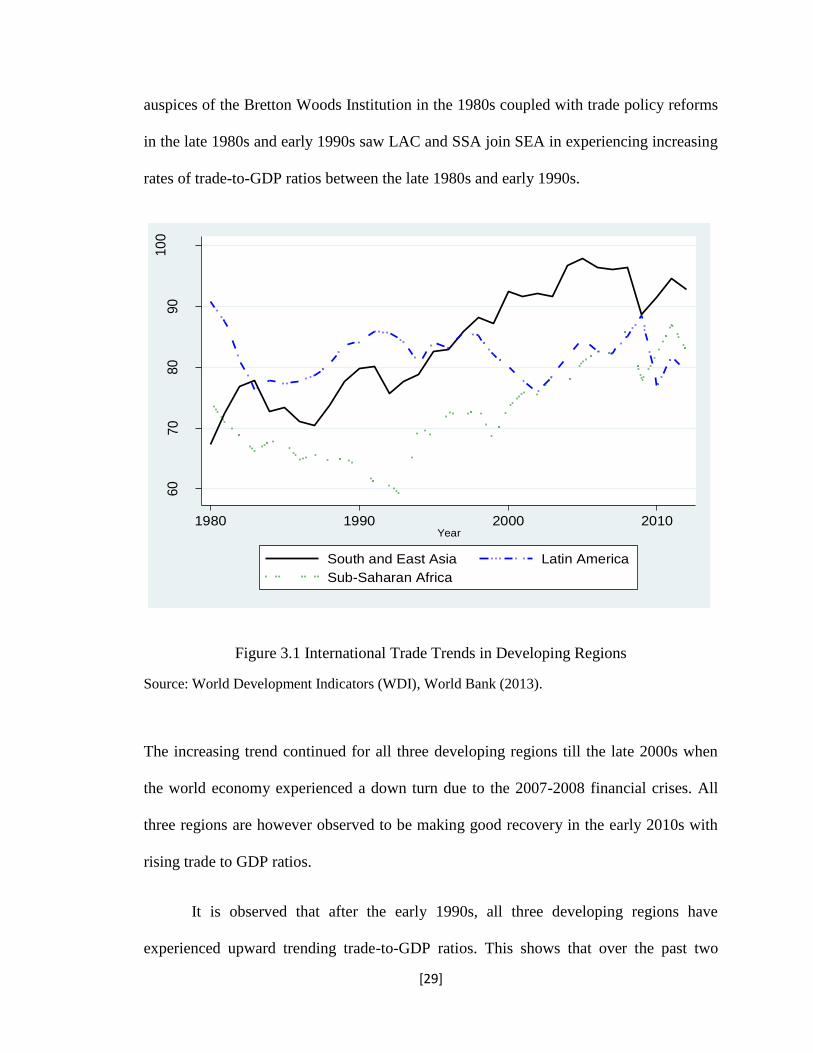
3.1.2 Foreign Direct Investment
Foreign direct investment has remained an important contributing factor to economic
growth in developing countries and to global economic integration over period under
study. Nevertheless there exist variations over time and between regions regarding the
level of foreign investment inflows. In this study, foreign direct investment is also used as
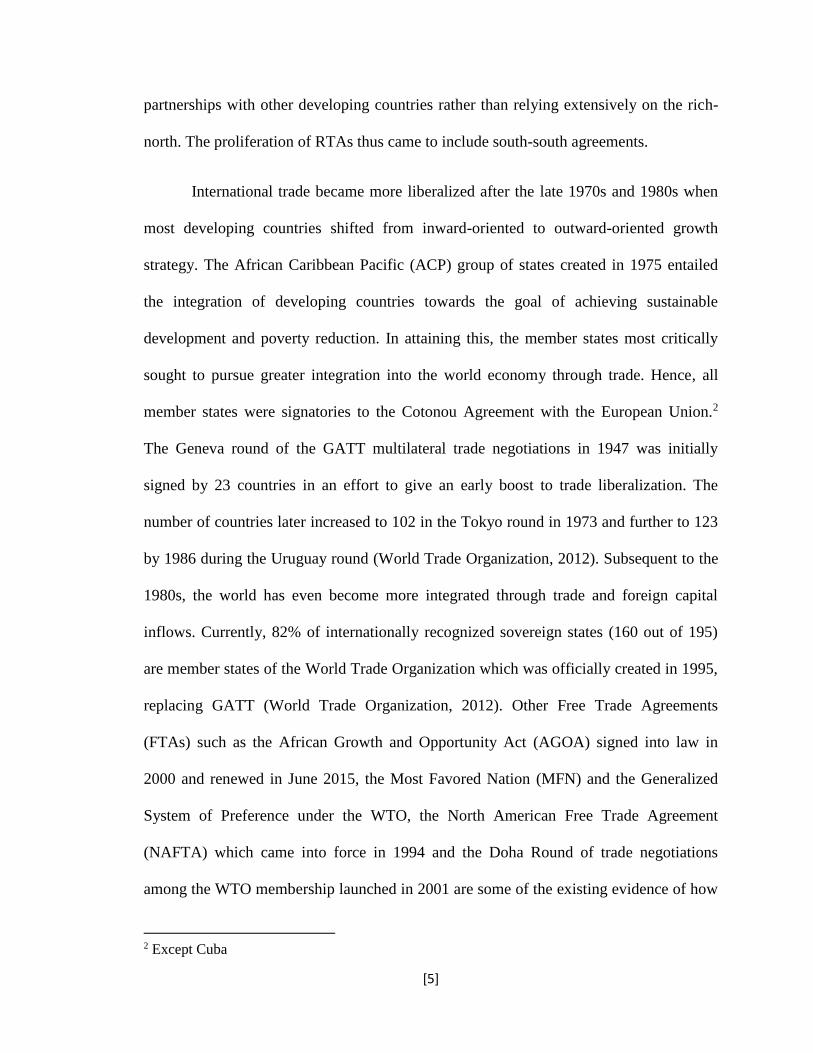
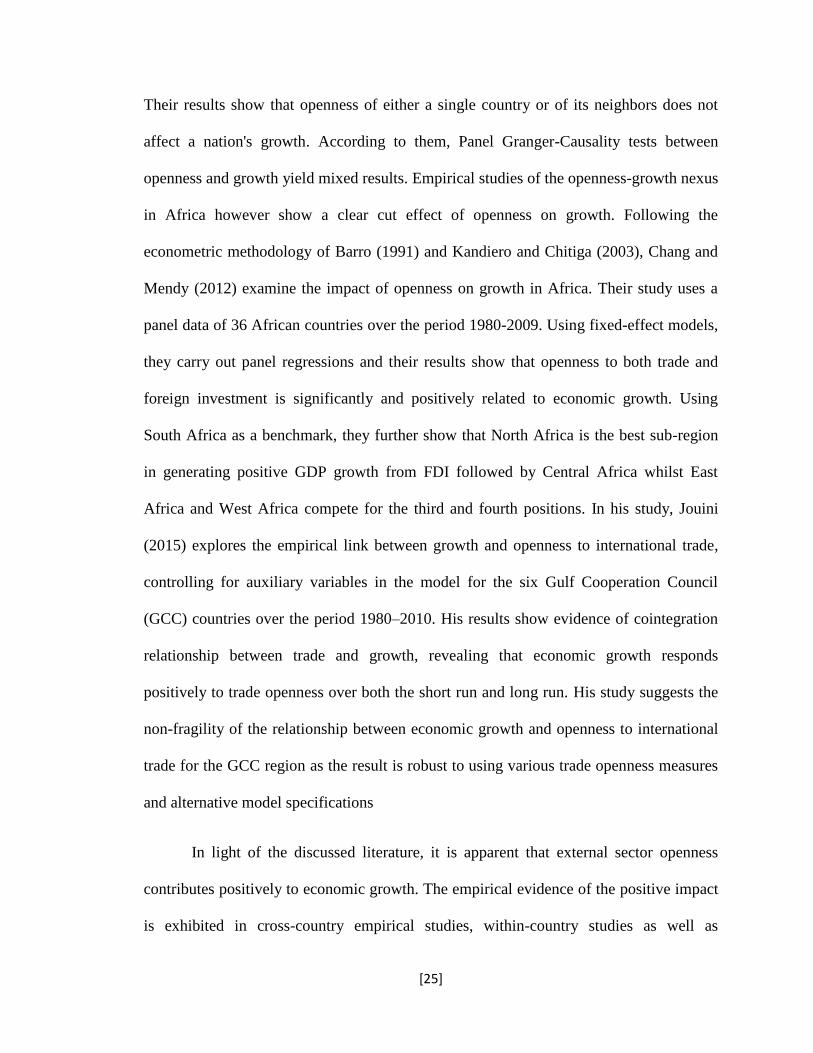
a measure of economic openness. Figure 3.2 below presents the trend in foreign
investment inflows into the three developing regions.
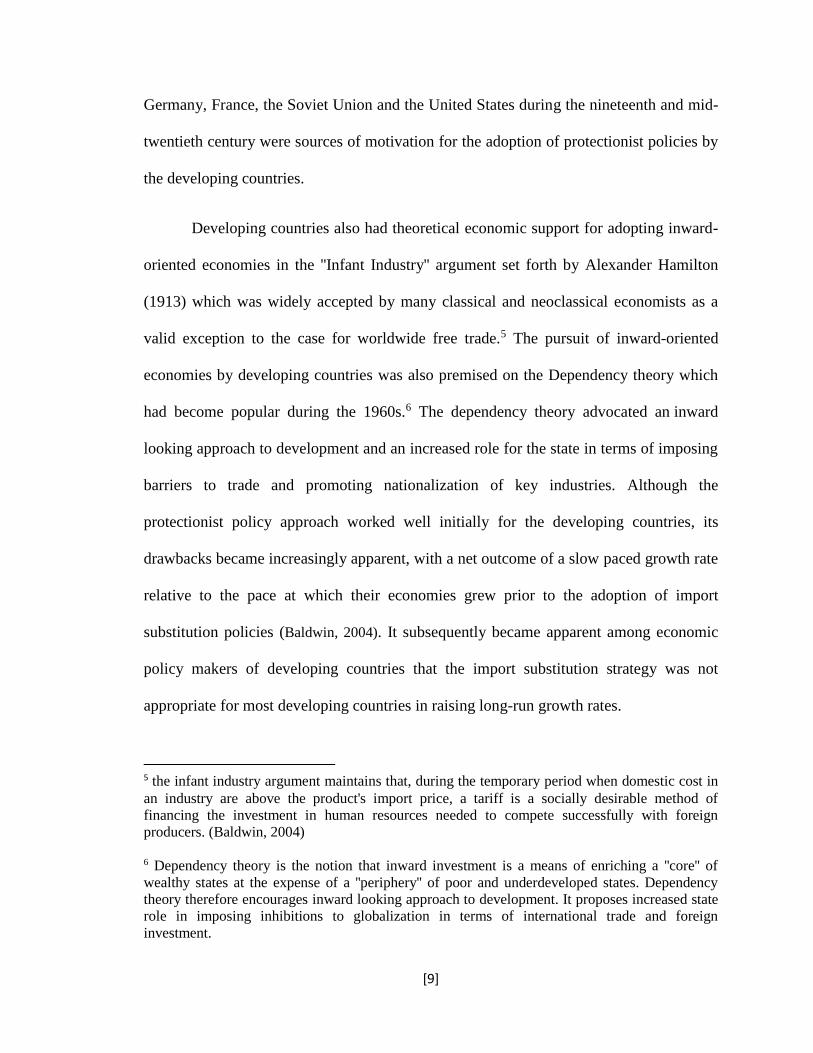
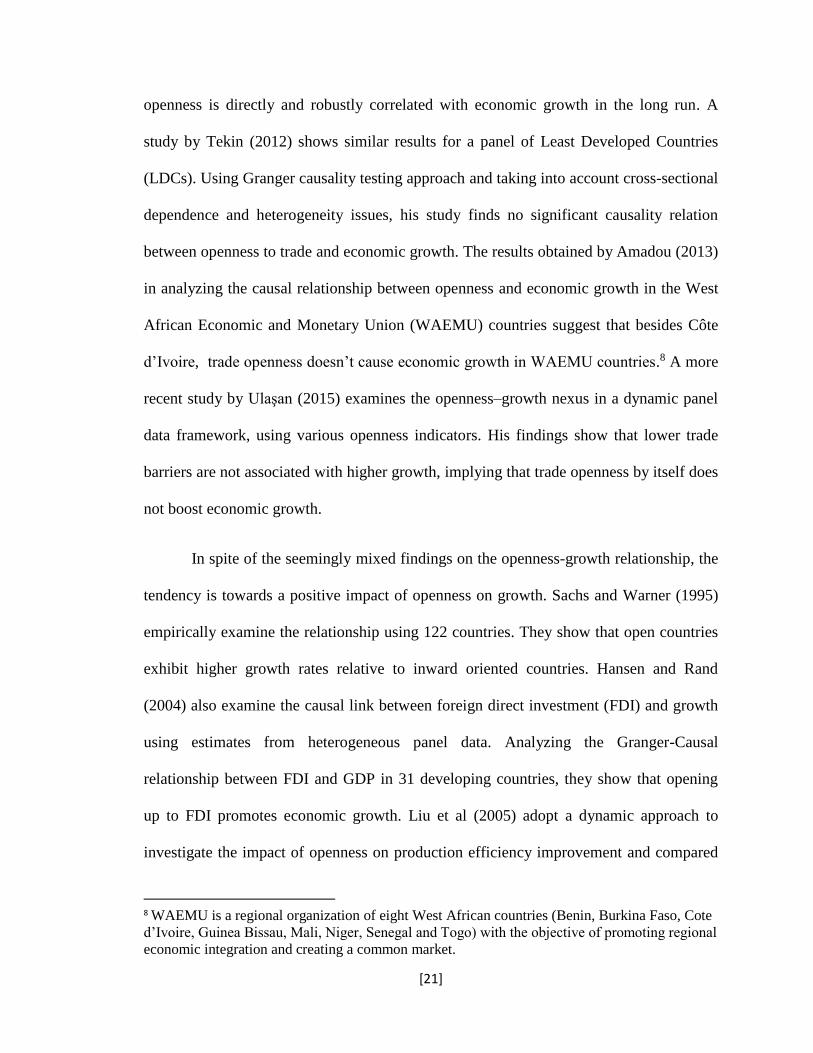
Generally, there has been an increasing growth in the activity of multinational
enterprises within all three developing regions. Latin America and the Caribbean
performed best among all three regions in attracting foreign investment inflows.
Subsequent to the policy reforms in the 1980s (such as the SAPs), Latin America has
experienced a fair increase in FDI. The region's largest share of net investment inflows
comes from the U.S, Europe and Latin America itself. An interesting observation is made
regarding what draws multinational enterprises into investing in these developing
regions. Whiles FDI in Africa is predominantly attracted by the primary sector, foreign
investment inflows to Asia are mostly manufacturing and services sector motivated.
However, in Latin America, FDI appears to be non-sector biased. It is attracted by the
[31]
primary sector (Chile, Bolivia), manufacturing (Argentina and Brazil) and by the service
sector (Peru and Mexico).
Figure 3.2 Trends in Foreign Direct Investment in Developing Regions
Source: World Development Indicators (WDI), World Bank (2013).
Foreign investment inflows to South and East Asia did not take off until the late 1980s.
Though the shift from inward-oriented to outward-oriented approach to development
started with countries in the Far East during the 1960s, most South Asian countries
started opening up their economies in the early eighties after they had experienced
sluggish growth rates throughout the 1970s and early 1980s.
02
46
8
Fore
ign d
ire
ct in
vestm
ent a
s a
perc
en
tag
e o
f G
DP
1980 1990 2000 2010year
South Eastern Asia Latin America
Sub-Saharan Africa
[32]
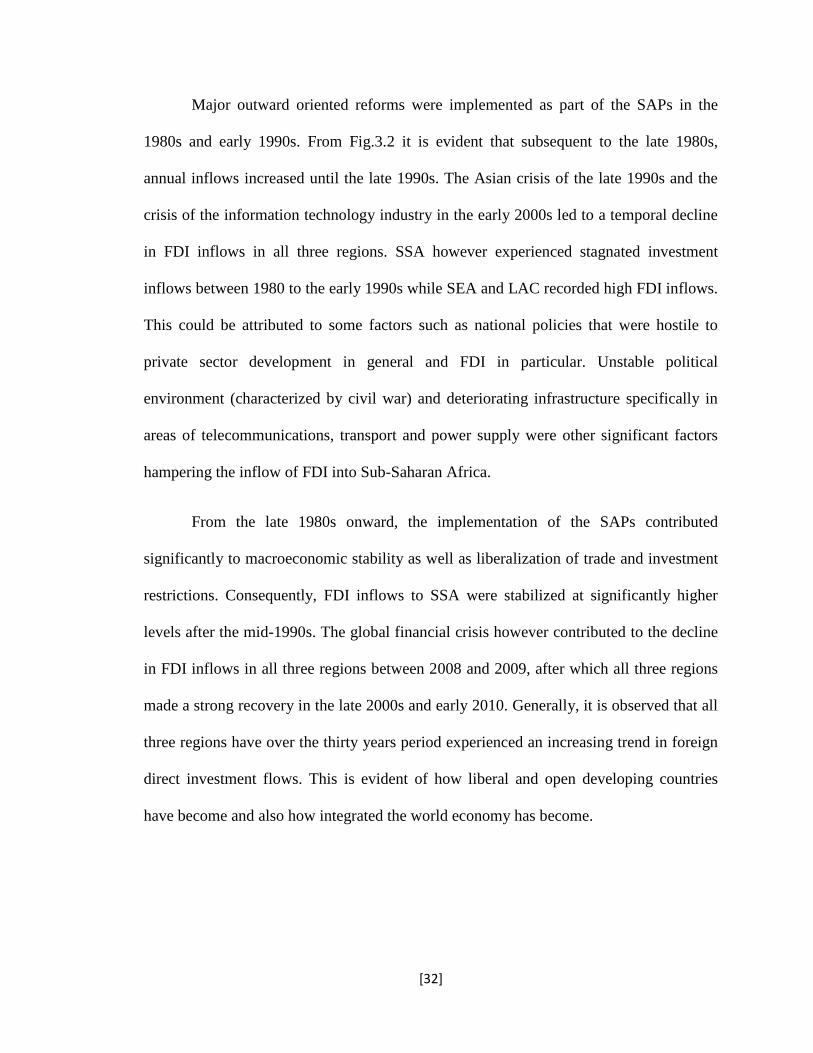
Major outward oriented reforms were implemented as part of the SAPs in the
1980s and early 1990s. From Fig.3.2 it is evident that subsequent to the late 1980s,
annual inflows increased until the late 1990s. The Asian crisis of the late 1990s and the
crisis of the information technology industry in the early 2000s led to a temporal decline
in FDI inflows in all three regions. SSA however experienced stagnated investment
inflows between 1980 to the early 1990s while SEA and LAC recorded high FDI inflows.
This could be attributed to some factors such as national policies that were hostile to
private sector development in general and FDI in particular. Unstable political
environment (characterized by civil war) and deteriorating infrastructure specifically in
areas of telecommunications, transport and power supply were other significant factors
hampering the inflow of FDI into Sub-Saharan Africa.
From the late 1980s onward, the implementation of the SAPs contributed
significantly to macroeconomic stability as well as liberalization of trade and investment
restrictions. Consequently, FDI inflows to SSA were stabilized at significantly higher
levels after the mid-1990s. The global financial crisis however contributed to the decline
in FDI inflows in all three regions between 2008 and 2009, after which all three regions
made a strong recovery in the late 2000s and early 2010. Generally, it is observed that all
three regions have over the thirty years period experienced an increasing trend in foreign
direct investment flows. This is evident of how liberal and open developing countries
have become and also how integrated the world economy has become.
[33]
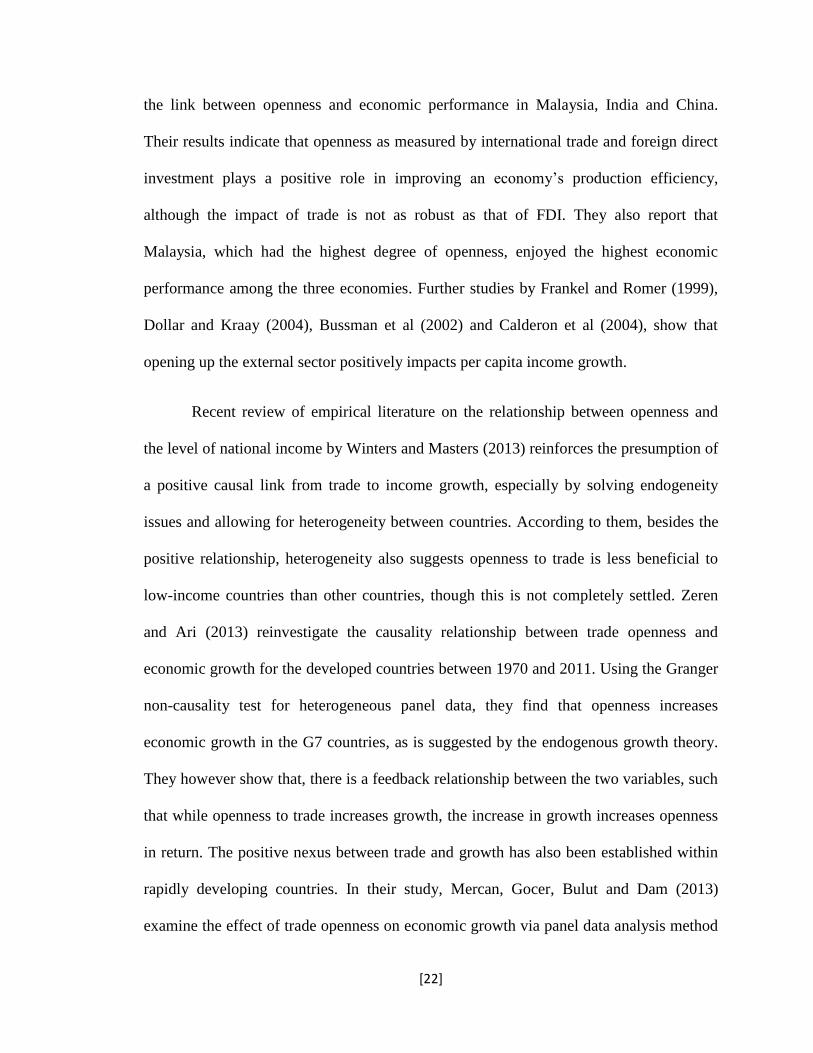
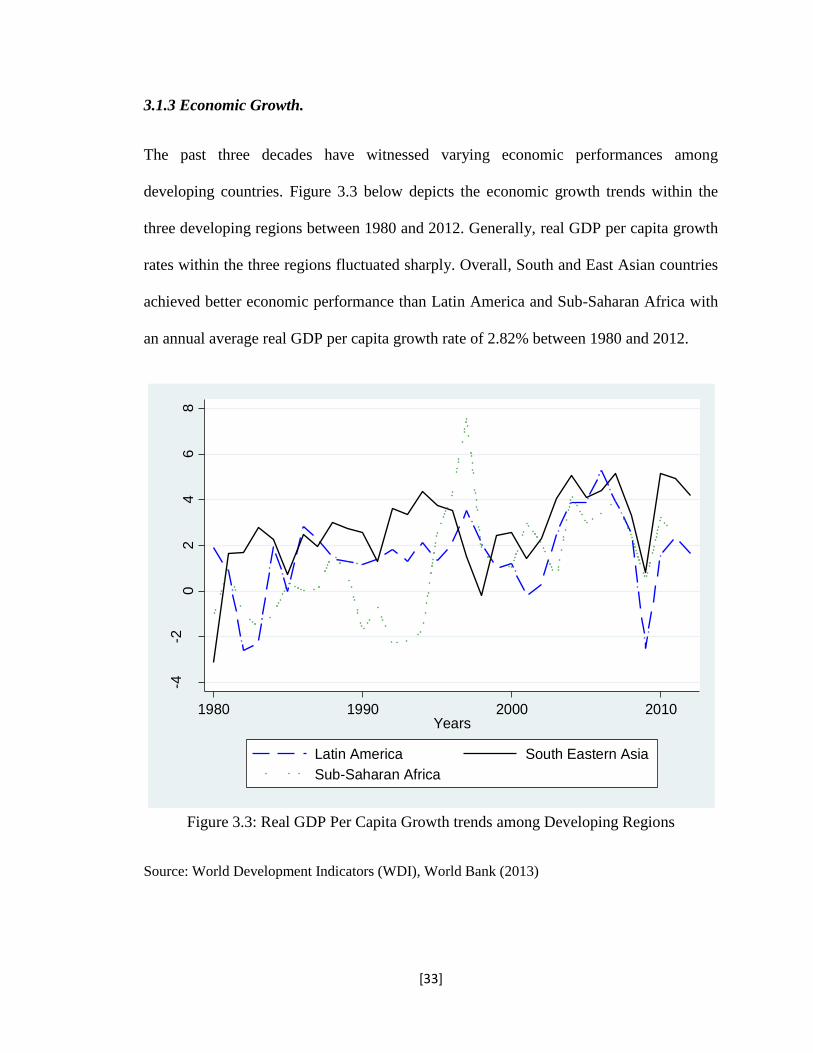
3.1.3 Economic Growth.
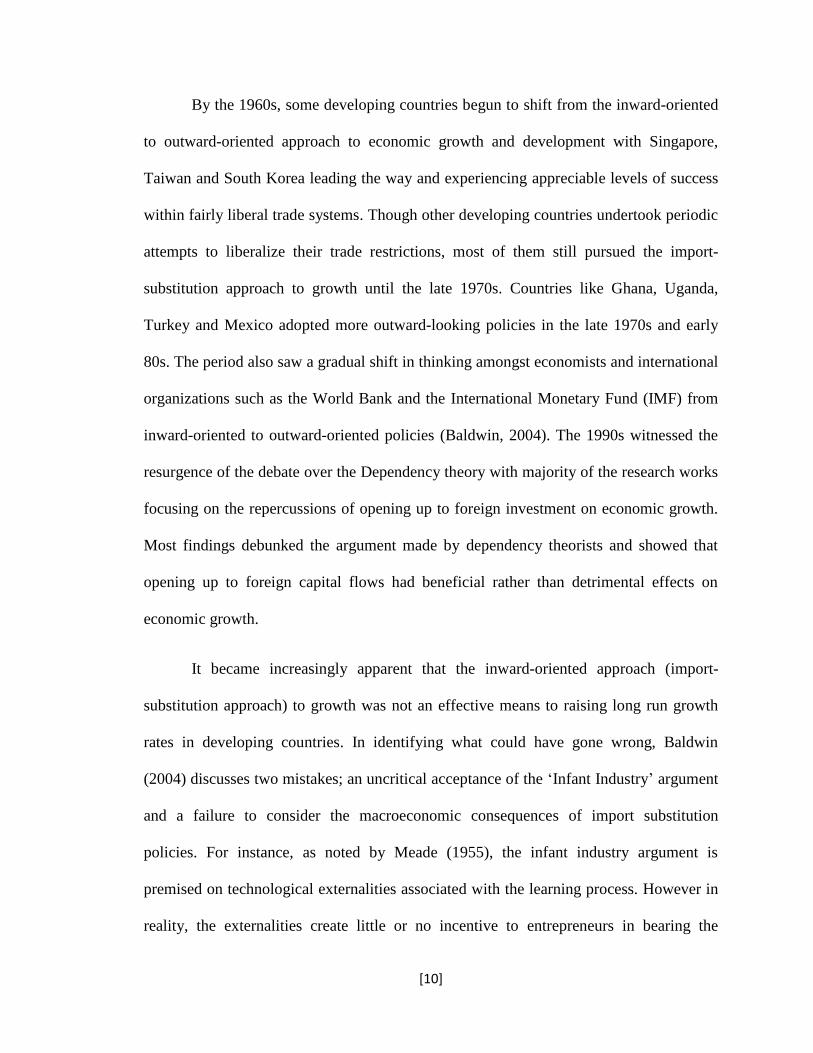
The past three decades have witnessed varying economic performances among
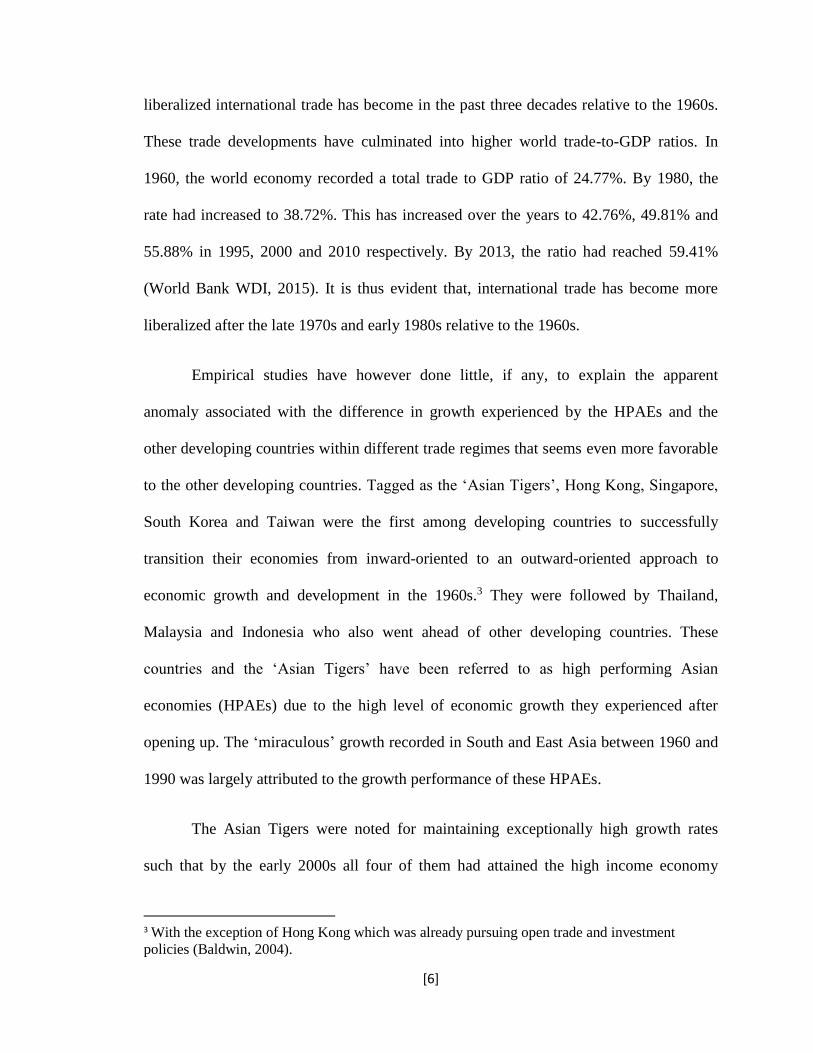
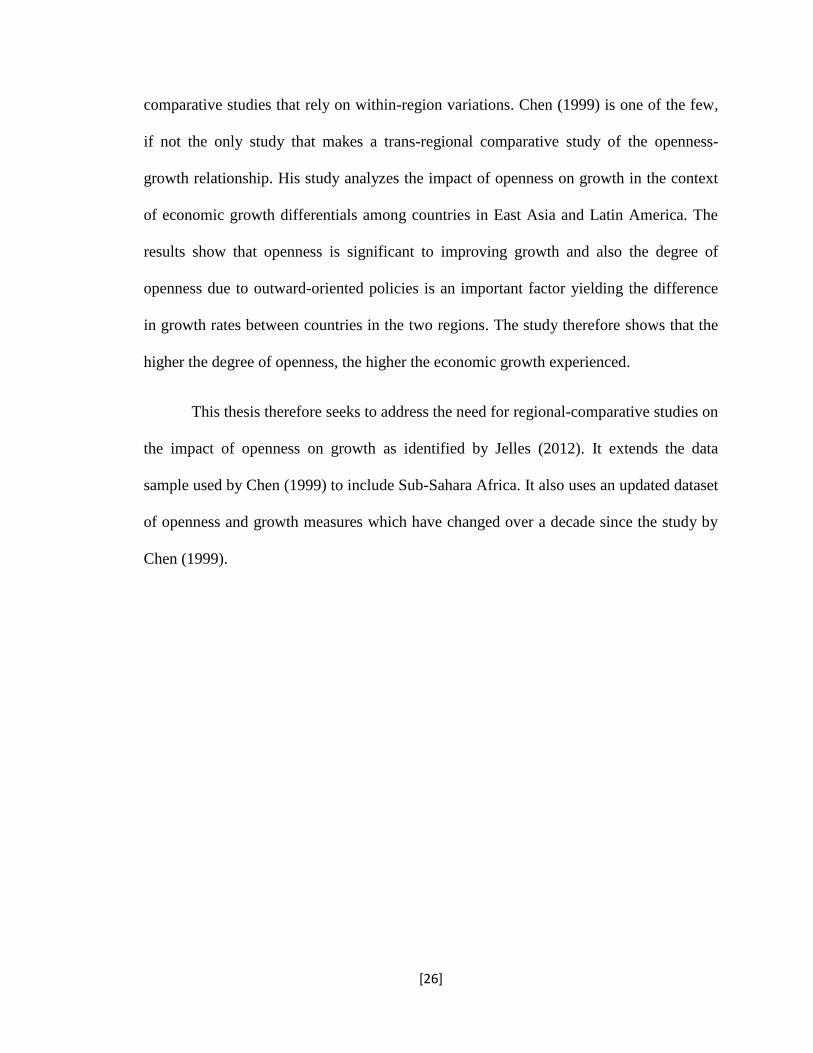
developing countries. Figure 3.3 below depicts the economic growth trends within the
three developing regions between 1980 and 2012. Generally, real GDP per capita growth
rates within the three regions fluctuated sharply. Overall, South and East Asian countries
achieved better economic performance than Latin America and Sub-Saharan Africa with
an annual average real GDP per capita growth rate of 2.82% between 1980 and 2012.
Figure 3.3: Real GDP Per Capita Growth trends among Developing Regions
Source: World Development Indicators (WDI), World Bank (2013)
-4-2
02
46
8
Re
al G
DP
Per
Cap
ita g
row
th r
ate
s
1980 1990 2000 2010Years
Latin America South Eastern Asia
Sub-Saharan Africa
[34]
Latin America comes second with an average annual real GDP per capita growth rate of
1.56% while Sub-Saharan Africa records a 1.29% average annual real GDP per capita
growth rate. The sharp contrast between the increasing GDP per capita growth rates
recorded by South East Asia relative to the declining growth rates recorded by SSA and
LAC in the early 1980s can be attributed to the delay of most countries in Latin America
and Sub-Sahara Africa in shifting from the import substitution approach to the outward
oriented approach to economic growth and development. The increasing GDP per capita
growth rate in SEA in the early 1980s as depicted in Fig. 3.3 can be explained by the
robust growth performance of the high-performing developing East Asian economies
(including Malaysia, Indonesia, Taiwan, Thailand, South Korea, Hong Kong) as well as
China’s remarkable growth performance in the early 1980s. The region’s remarkable
growth performance was predominantly attributed to physical capital formation and total
factor productivity growth which comes across as benefits associated with outward-
oriented economic policies through the inflow of foreign investment and the adoption of
advanced technological know-how from developed trading partners. Most developing
countries in LAC and SSA however continued to follow the import-substitution approach
to growth which was however yielding diminishing growth rates. Coupled with the debt
crisis in the early 1980s, many developing countries in SSA and Latin America
experienced declining growth rates in early 1980s until they shifted from the import
substitution approach to outward oriented approach. This switch in approach saw LAC
and SSA join SEA in experiencing increasing growth rates in the mid-1980s.
The increasing trend continues for all three regions subsequent to the mid-1980s
till the latter part of the 1980s. This is mainly attributed to the adoption of the Structural
[35]
Adjustment Program (SAP) proposed by the Bretton Woods Institutions in the early
1980s aimed at achieving long-term economic growth in developing countries. The SAPs
reflect the neoliberal ideology that drives globalization and hence required developing
countries to be more integrated into the international market. Its policies of currency
devaluation, lower tariffs on imports and increased free trade have resulted in more
developing countries opening up their economies. It is further observed that all the
regions experienced increasing growth rates in the mid-1990s except for South East Asia
which experienced declining growth rates due to the East Asian Crisis of 1997. Though
countries in Latin America and SEA managed to restore growth after the 1982-83
recessions, Sub-Saharan African countries continued to experience stagnation and decline
in growth rates even during the first half of the 1990s. This was due to structural and
institutional bottlenecks as well as adverse external debts and policy errors. With more
countries adopting the SAPs, the region however dispelled pessimisms surrounding its
prospects by a fairly broad-based economic upturn in the second half of the 90s. During
the same period, average income growth rate exceeded population growth rate for four
consecutive years leading to per capita income gains across SSA. The information
technology bubble in the mid-1990s could partly explain the recovery and high growth
rates maintained in SEA in the late 1990s.
The rising trend in growth persisted for SSA until the second half of the 1990s
when the region experienced a generalized slowdown which appears to have continued
through the end of the decade and into the early 2000s. The adoption of the Poverty
Reduction Strategy Papers (PRSPs) in a bid to enable poor countries experience faster
sustainable growth in the early 2000s however saw most countries in all three regions
[36]
experience improved economic performance till the mid-2000s. The second half of the
2000s however saw all three developing regions experience a major economic down-turn
due to the 2007-2008 global financial crises. Ultimately all three developing regions
experienced a recovery in the late 2000s and subsequent improvement in growth
performance in 2010.
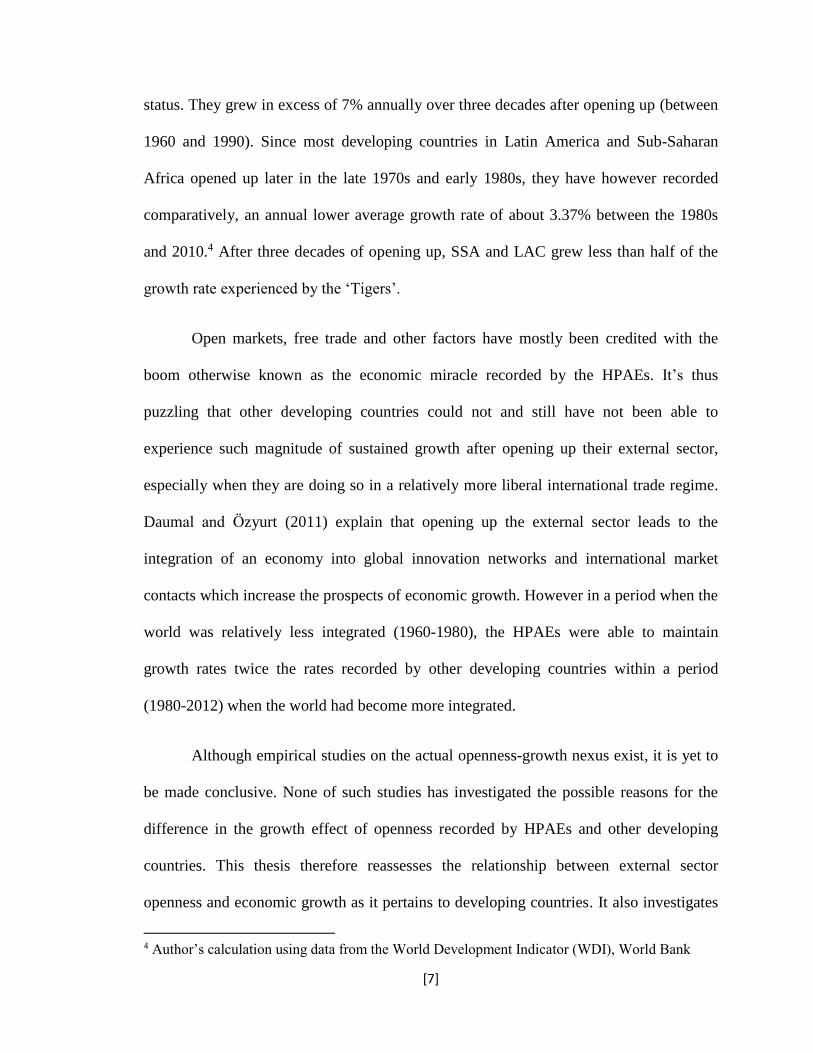
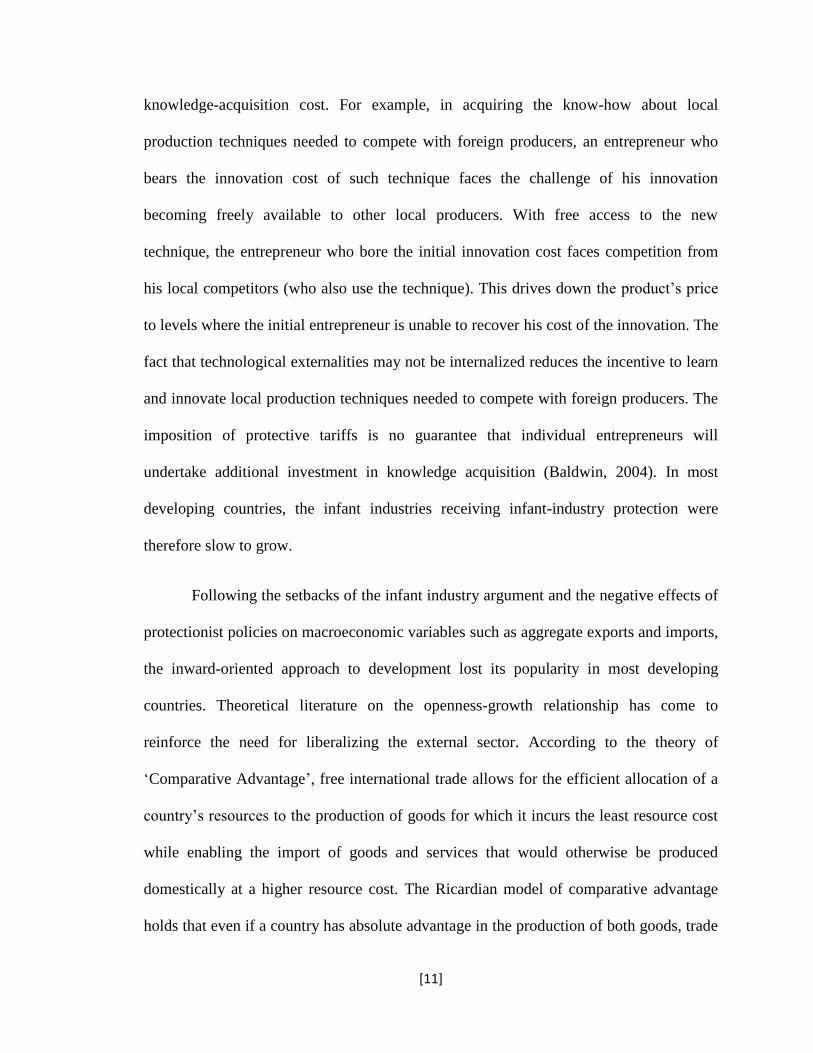
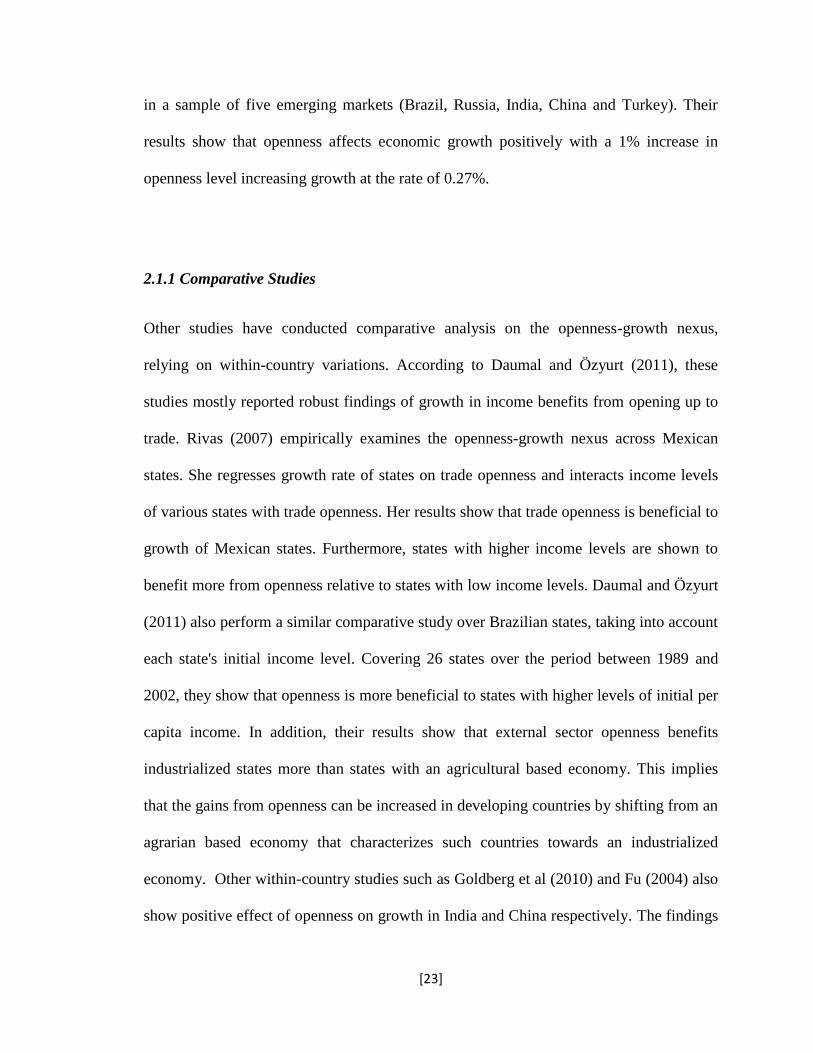
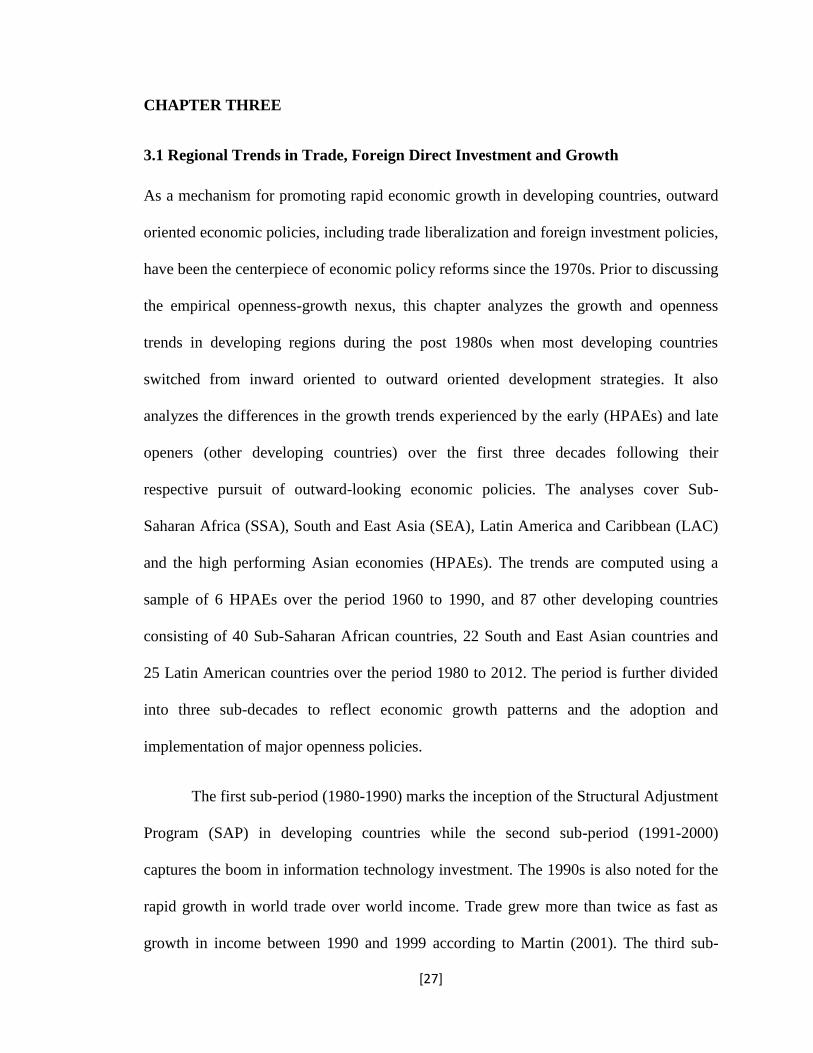
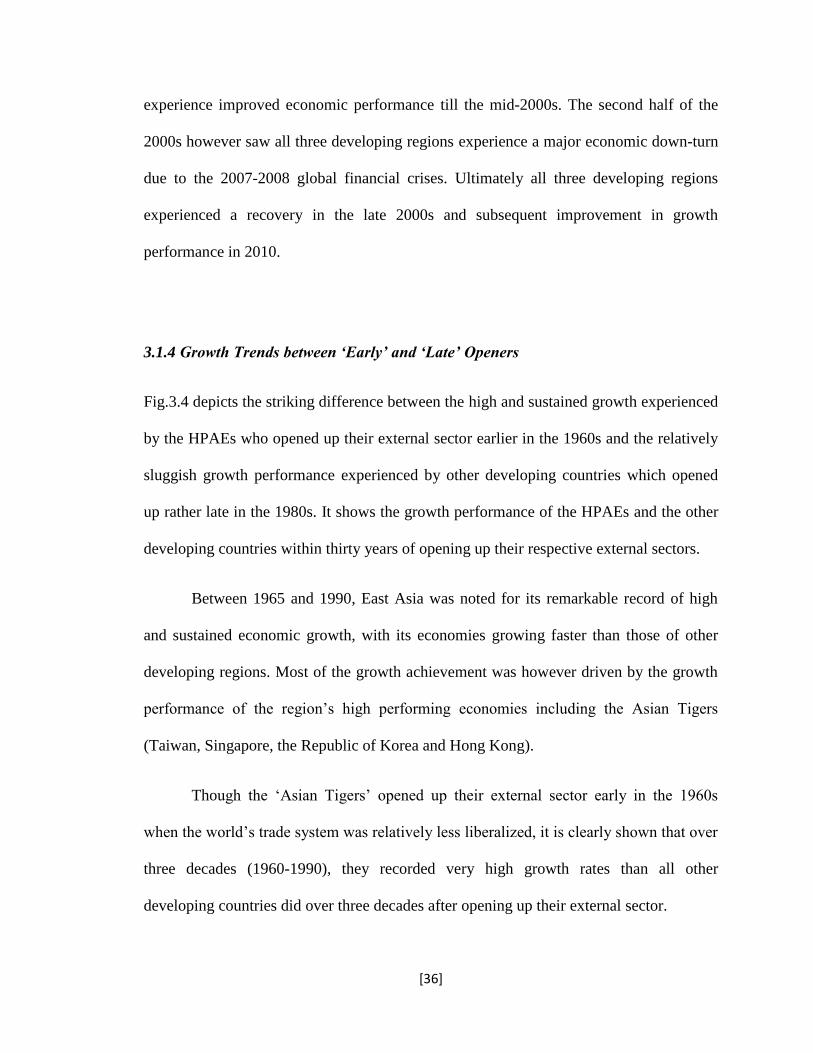
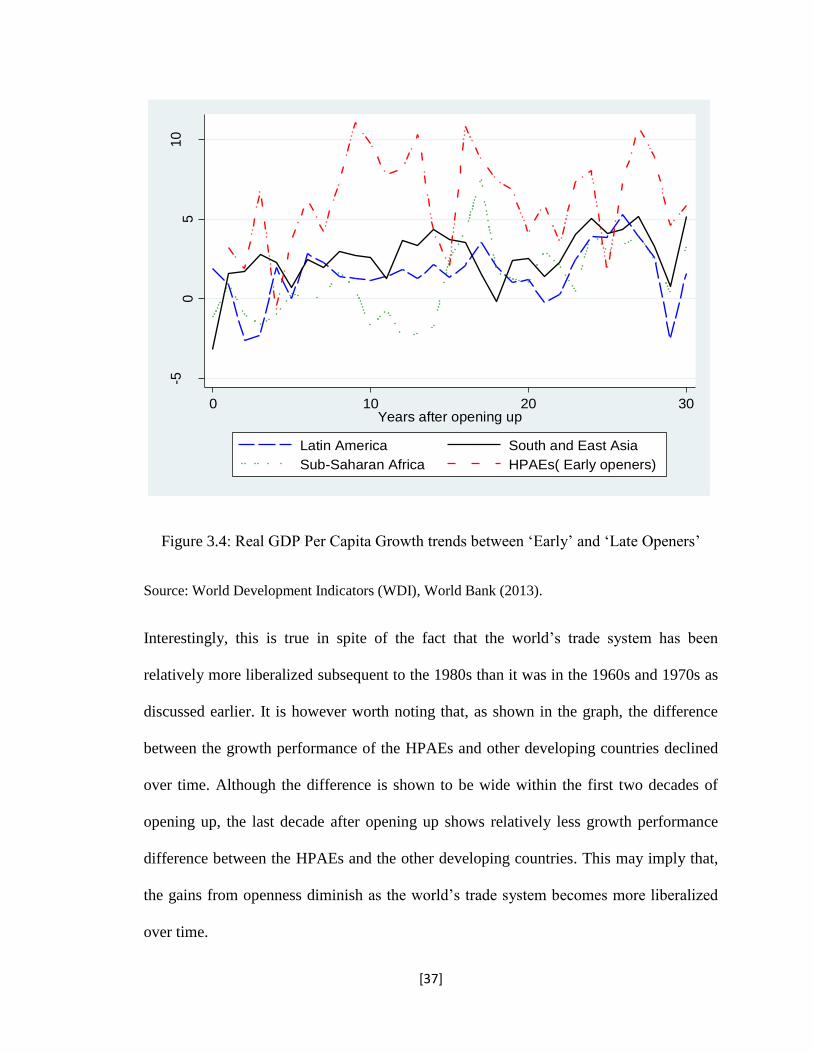
3.1.4 Growth Trends between ‘Early’ and ‘Late’ Openers
Fig.3.4 depicts the striking difference between the high and sustained growth experienced
by the HPAEs who opened up their external sector earlier in the 1960s and the relatively
sluggish growth performance experienced by other developing countries which opened
up rather late in the 1980s. It shows the growth performance of the HPAEs and the other
developing countries within thirty years of opening up their respective external sectors.
Between 1965 and 1990, East Asia was noted for its remarkable record of high
and sustained economic growth, with its economies growing faster than those of other
developing regions. Most of the growth achievement was however driven by the growth
performance of the region’s high performing economies including the Asian Tigers
(Taiwan, Singapore, the Republic of Korea and Hong Kong).
Though the ‘Asian Tigers’ opened up their external sector early in the 1960s
when the world’s trade system was relatively less liberalized, it is clearly shown that over
three decades (1960-1990), they recorded very high growth rates than all other
developing countries did over three decades after opening up their external sector.
[37]
Figure 3.4: Real GDP Per Capita Growth trends between ‘Early’ and ‘Late Openers’
Source: World Development Indicators (WDI), World Bank (2013).
Interestingly, this is true in spite of the fact that the world’s trade system has been
relatively more liberalized subsequent to the 1980s than it was in the 1960s and 1970s as
discussed earlier. It is however worth noting that, as shown in the graph, the difference
between the growth performance of the HPAEs and other developing countries declined
over time. Although the difference is shown to be wide within the first two decades of
opening up, the last decade after opening up shows relatively less growth performance
difference between the HPAEs and the other developing countries. This may imply that,
the gains from openness diminish as the world’s trade system becomes more liberalized
over time.
-50
510
Re
al G
DP
Per
Ca
pita
Gro
wth
Ra
tes
0 10 20 30Years after opening up
Latin America South and East Asia
Sub-Saharan Africa HPAEs( Early openers)
[38]
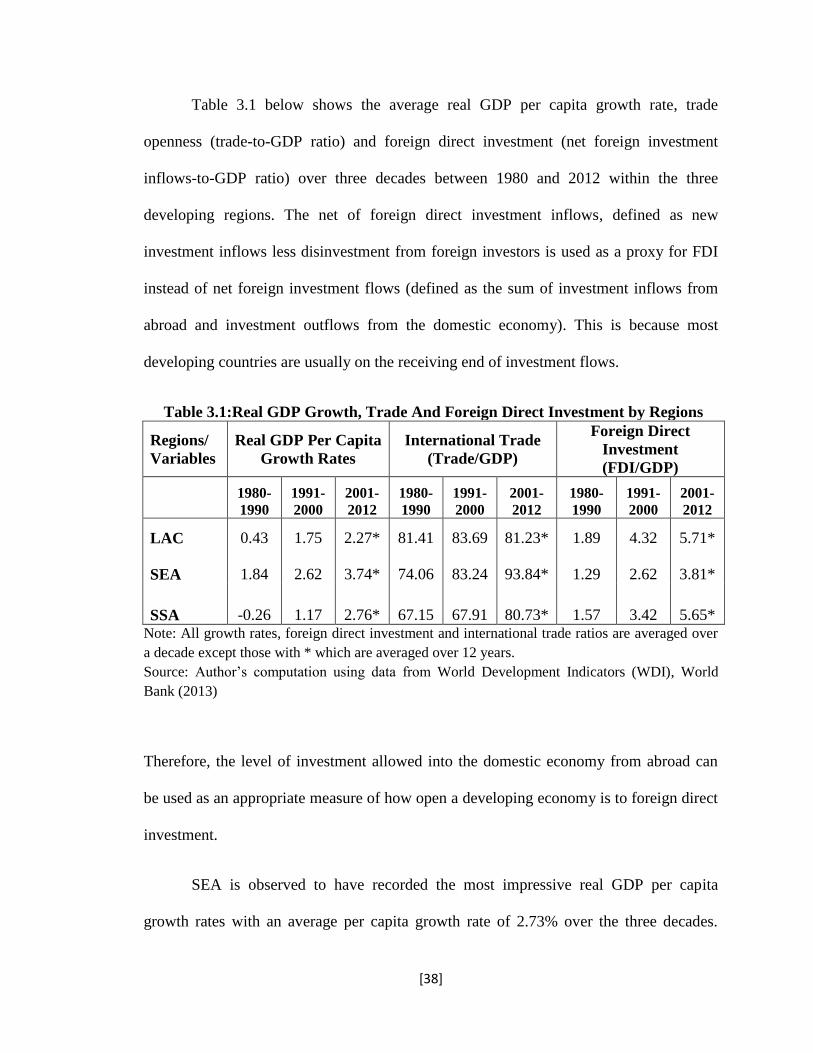
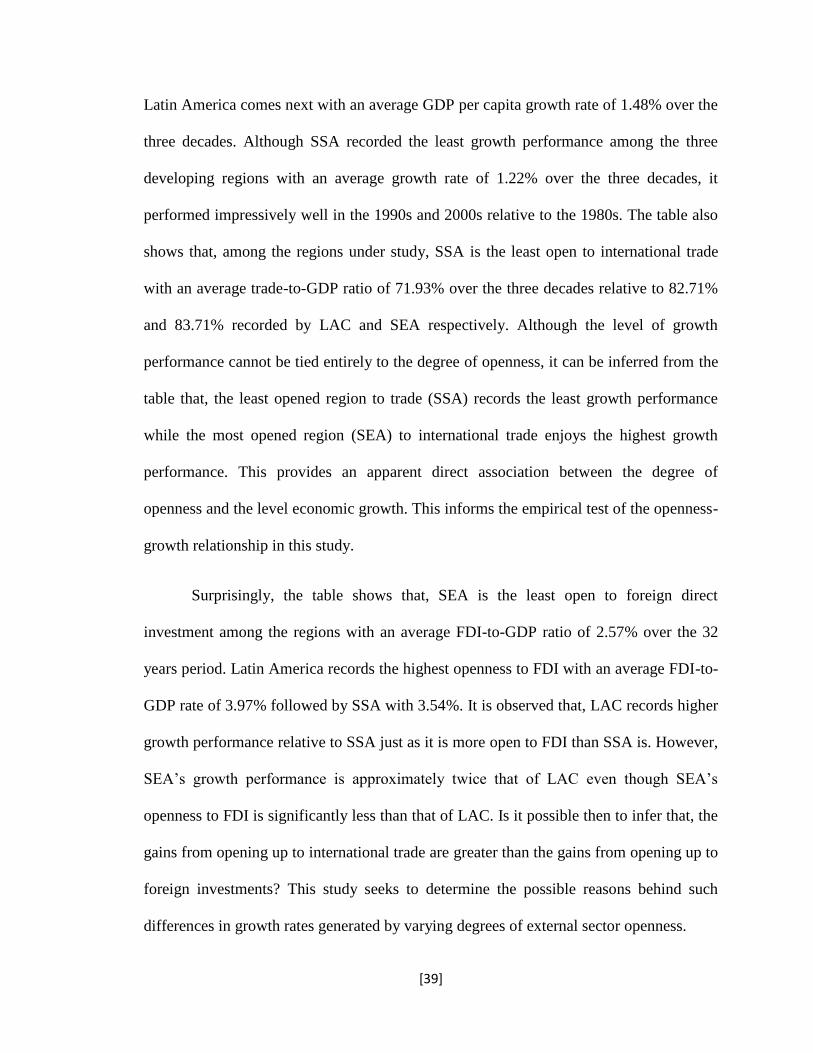
Table 3.1 below shows the average real GDP per capita growth rate, trade
openness (trade-to-GDP ratio) and foreign direct investment (net foreign investment
inflows-to-GDP ratio) over three decades between 1980 and 2012 within the three
developing regions. The net of foreign direct investment inflows, defined as new
investment inflows less disinvestment from foreign investors is used as a proxy for FDI
instead of net foreign investment flows (defined as the sum of investment inflows from
abroad and investment outflows from the domestic economy). This is because most
developing countries are usually on the receiving end of investment flows.
Table 3.1:Real GDP Growth, Trade And Foreign Direct Investment by Regions
Regions/
Variables
Real GDP Per Capita
Growth Rates
International Trade
(Trade/GDP)
Foreign Direct
Investment
(FDI/GDP)
1980-
1990
1991-
2000
2001-
2012
1980-
1990
1991-
2000
2001-
2012
1980-
1990
1991-
2000
2001-
2012
LAC 0.43 1.75 2.27* 81.41 83.69 81.23* 1.89 4.32 5.71*
SEA 1.84 2.62 3.74* 74.06 83.24 93.84* 1.29 2.62 3.81*
SSA -0.26 1.17 2.76* 67.15 67.91 80.73* 1.57 3.42 5.65* Note: All growth rates, foreign direct investment and international trade ratios are averaged over
a decade except those with * which are averaged over 12 years.
Source: Author’s computation using data from World Development Indicators (WDI), World
Bank (2013)
Therefore, the level of investment allowed into the domestic economy from abroad can
be used as an appropriate measure of how open a developing economy is to foreign direct
investment.
SEA is observed to have recorded the most impressive real GDP per capita
growth rates with an average per capita growth rate of 2.73% over the three decades.
[39]
Latin America comes next with an average GDP per capita growth rate of 1.48% over the
three decades. Although SSA recorded the least growth performance among the three
developing regions with an average growth rate of 1.22% over the three decades, it
performed impressively well in the 1990s and 2000s relative to the 1980s. The table also
shows that, among the regions under study, SSA is the least open to international trade
with an average trade-to-GDP ratio of 71.93% over the three decades relative to 82.71%
and 83.71% recorded by LAC and SEA respectively. Although the level of growth
performance cannot be tied entirely to the degree of openness, it can be inferred from the
table that, the least opened region to trade (SSA) records the least growth performance
while the most opened region (SEA) to international trade enjoys the highest growth
performance. This provides an apparent direct association between the degree of
openness and the level economic growth. This informs the empirical test of the openness-
growth relationship in this study.
Surprisingly, the table shows that, SEA is the least open to foreign direct
investment among the regions with an average FDI-to-GDP ratio of 2.57% over the 32
years period. Latin America records the highest openness to FDI with an average FDI-to-
GDP rate of 3.97% followed by SSA with 3.54%. It is observed that, LAC records higher
growth performance relative to SSA just as it is more open to FDI than SSA is. However,
SEA’s growth performance is approximately twice that of LAC even though SEA’s
openness to FDI is significantly less than that of LAC. Is it possible then to infer that, the
gains from opening up to international trade are greater than the gains from opening up to
foreign investments? This study seeks to determine the possible reasons behind such
differences in growth rates generated by varying degrees of external sector openness.
[40]
CHAPTER FOUR
4.1. Methodology and Model Specification
In the preceding section, we discussed and compared the growth performance of
developing countries that opened their economies early and those that opened later. We
also discussed the degree of openness as measured by international trade and FDI among
SSA, LAC and SEA. The analyses of the growth and openness trends revealed some
apparent growth-openness relationships that serve as the basis for further empirical
inquiry into the relationship. This section discusses the econometric model and variables
used to empirically investigate the growth-openness nexus. Due to the nature of the
dataset (panel data), we also discuss the challenges associated with estimating the
relationship with various panel data estimation techniques. The section further explains
the rationale for the choice of estimation method used and ends with a discussion of the
data used in the estimation.
4.1.1 Model Specification and Variables
This thesis empirically examines the impact of economic openness on growth using two
measures of openness (total trade to GDP ratio and net FDI inflows to GDP ratio) while
controlling for other variables that influence economic growth. We estimate the
relationship using three panel datasets of developing regions made up of 87 countries
observed over the period 1960-2012. The panel datasets consist of 40 Sub-Saharan
African countries, 22 South and East Asian countries and 25 Latin America and
Caribbean countries.
[41]
The Solow growth model provides the analytical framework for examining the
openness-growth relationship in the sense that, it seeks to explain the determinants of
economic growth and difference in growth rates across countries. Using standard
notations, we specify a Cobb-Douglas production function with labour augmenting
technological process as:
Y(t) = K(t) α A(t)L(t)1−α (1)
where 0 < α <1, Y is output, K is capital, L is labour and A is the level of technology.
Labour force and technology are assumed to grow exogenously at the rate n and g
respectively, such that:
L(t) = L(0)ent (2)
A(t) = A(0)egt (3)
Defining ŷ= Y / AL, kˆ = K / AL, δ as a constant rate of depreciation, and s as a constant
fraction of output that is saved and invested, the dynamic equation for kˆ is given by:
kˆ(t) = sŷ(t) − (n + g + δ )kˆ(t) (4)
= skˆ(t)α − (n + g + δ )kˆ(t) (4')
From equation (4') kˆ converges to its steady state value:
kˆ* = (𝑠
𝑛 + 𝑔 + δ)
1
1−𝛼 (5)
Substituting (5) into (1) and taking logs, the steady state income per capita is expressed
as:
[42]
ln [𝑌(𝑡)
𝐿(𝑡)] = ln A(0) + gt +
𝛼
1−𝛼ln(s) -
𝛼
1−𝛼ln(n + g + δ ) (6)
Following Darku (2011), we write an autoregressive form of the growth model (equation
6) as:
ln y(t2) = ζ ln y(t1) + (1 – ζ)ln A(0) + g(t2 – t1) + (1 – ζ) 𝛼
1−𝛼 ln(s)
- (1 – ζ) 𝛼
1−𝛼 ln(n + g + δ ) (7)
where y(t) =Y(t) /L(t) is the per capita income and ζ = 𝑒−𝛽1 (𝑡2 − 𝑡1). Equation (7) is a
dynamic panel data model with (1− ζ) ln A(0) being the time invariant individual unit or
regional effect term. In a Cobb-Douglas production function with labour augmenting
technological process, g(t2 – t1) represents growth in knowledge, which is represented by
education in this study. Using standard notation of the panel data literature and adding a
disturbance term we may re-write equation (7) as:
𝑦𝑖𝑡 = 𝛾𝑦𝑖𝑡−1 + ∑ 𝛽𝑗𝑥𝑖𝑡𝑗4
𝑗=2 + µ𝑖 + 𝜀𝑖𝑡 (8)
Where 𝑦𝑖𝑡= ln y(t2), 𝑦𝑖𝑡−1 = ln y(t1), 𝛾 = 𝑒−𝛽1 (𝑡2 − 𝑡1), 𝛽2 = (1 – ζ) 𝛼
1−𝛼, 𝛽3 =
-(1 – ζ) 𝛼
1−𝛼, 𝑥𝑖𝑡
2 = ln(s), 𝑥𝑖𝑡3 = ln(n + g + δ ), 𝑥𝑖𝑡
4 = g(t2 – t1), µ𝑖 = (1− ζ) ln A(0) and
𝜀𝑖𝑡 is the usual error term that varies across regions and time periods and has mean equal
zero. 9
9 µ𝑖 reflects unobserved fixed effects such as geographical, political factors or quality of
institutions and legal systems which vary across countries
[43]
In our empirical analysis, we assume the rate of depreciation (δ) is homogenous
across countries and hence 𝑥𝑖𝑡3 = ln (n + g) and represents rate of population growth
embedded with some level of growth in knowledge (education).10 We also subtract ln of
the lag of GDP per capita from both sides of equation (8) to obtain the conventional
standard growth model (used by studies such as Jalles, 2011 and Dollar and Kraay, 2004)
which relates real GDP per capita growth to its lag, investment, education, and population
growth. It must be recalled that our main goal is to investigate the effect of openness on
income growth. We therefore augment this model with a proxy for trade openness (using
trade-to-GDP ratio). We also replace domestic investment (𝑥𝑖𝑡2 = ln(s)) with net foreign
direct investment (FDI) inflows-to-GDP ratio as a proxy for investment and also as a
measure of the degree of openness to the capital market. Economic growth in most
developing economies are significantly influenced by the level of macroeconomic
stability, we therefore include inflation to capture the effect of macroeconomic stability
on growth. Hence equation (8) is rewritten as:
𝑦𝑖𝑡 = 𝛾𝑦𝑖𝑡−1 + ∑ 𝛽𝑗𝑥𝑖𝑡𝑗6
𝑗=2 + µ𝑖 + 𝜀𝑖𝑡 (9)
Where 𝑦𝑖𝑡 represents GDP per capita growth rate, 𝑦𝑖𝑡−1 represents lag of GDP per
capita growth rate, 𝑥𝑖𝑡5 and 𝑥𝑖𝑡
6 represent trade openness (trade as a percentage of GDP)
and inflation. The lag of real GDP per capita growth (𝑦𝑖𝑡−1) captures the lag effect of the
explanatory variables. It takes some time for policies that affect the explanatory variables
to actually impact on the economic performance of a country, therefore there may be lags
10 Given that population growth already expressed in growth terms, we do not take the log of it in
our empirical estimation.
[44]
between the time policies are implemented and the time they impact on economic growth.
As argued by Beck and Katz (1996), including the lagged real GDP per capita growth as
an explanatory variable serves as a parsimonious way to account for the continuous effect
of explanatory variables in the past. In line with the derivation of the standard growth
model, the model in equation (9) is expressed in a semi-log linear functional form. All
variables are expressed in log terms with the exception of real GDP per capita growth and
population growth rate since they are already expressed as log difference. Education is
also expressed in level terms since taking log of it will significantly reduce its values.
Most empirical studies on the openness-growth relationship have used models that
seldom capture the effect of trade on economic growth given the initial level of growth in
a country.11 In this study, we modify the 'standard' growth model specified in equation (9)
to include an interaction variable of a country's initial growth performance and its
openness measured by trade (trade *𝑦𝑖𝑡−1). This helps us to determine whether or not the
effect of openness on economic growth is contingent on the initial growth performance of
an economy. Specifically, it helps determine if openness is more beneficial to relatively
rich economies than poor economies. Hence it captures the accelerating or de-
accelerating effect of trade openness on convergence. If the coefficient of the interaction
variable is negative in sign and statistically significant, then trade openness has resulted
in accelerating convergence among the countries in a given region. On the other hand, if
the coefficient is positive in sign and statistically significant, then openness as measured
by trade has reduced the rate at which countries were converging. With this interaction
variable, we are able to assess if openness contributes to the income differences between
11 See Krueger (1978), Frankel and Romer (1999) and Dollar and Kraay (2004),
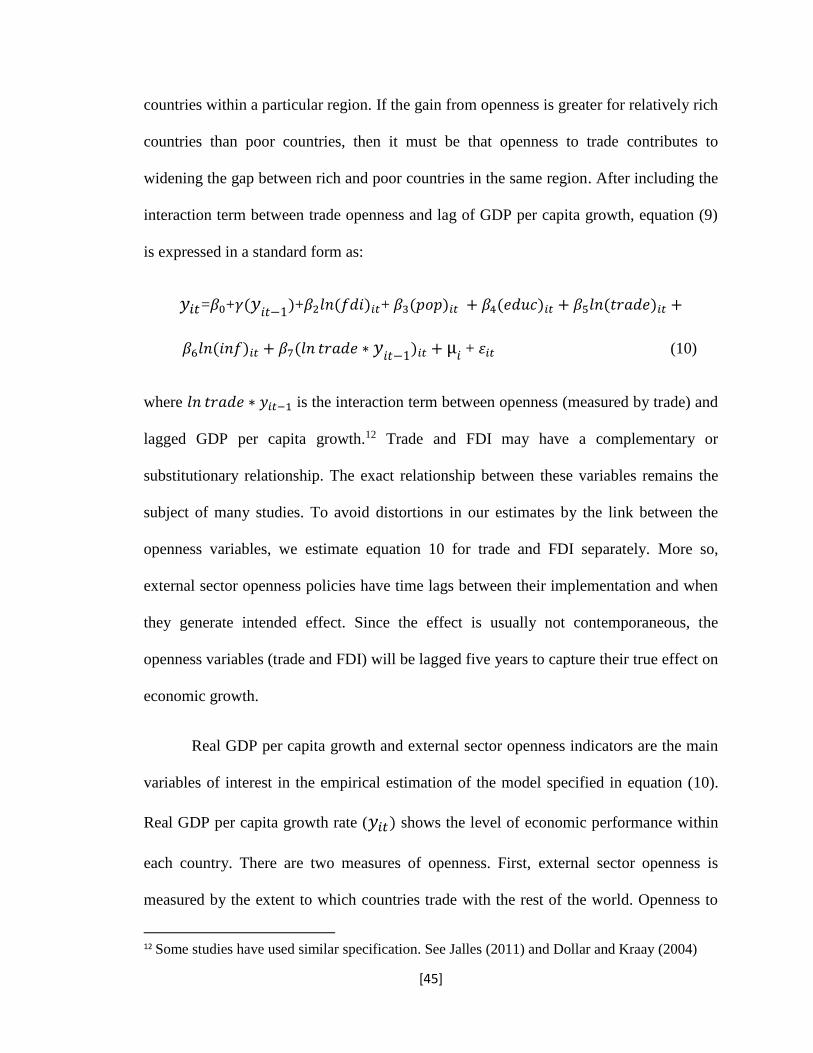
[45]
countries within a particular region. If the gain from openness is greater for relatively rich
countries than poor countries, then it must be that openness to trade contributes to
widening the gap between rich and poor countries in the same region. After including the
interaction term between trade openness and lag of GDP per capita growth, equation (9)
is expressed in a standard form as:
𝑦𝑖𝑡=𝛽0+𝛾(𝑦𝑖𝑡−1)+𝛽2𝑙𝑛(𝑓𝑑𝑖)𝑖𝑡+ 𝛽3(𝑝𝑜𝑝)𝑖𝑡 + 𝛽4(𝑒𝑑𝑢𝑐)𝑖𝑡 + 𝛽5𝑙𝑛(𝑡𝑟𝑎𝑑𝑒)𝑖𝑡 +
𝛽6𝑙𝑛(𝑖𝑛𝑓)𝑖𝑡 + 𝛽7(𝑙𝑛 𝑡𝑟𝑎𝑑𝑒 ∗ 𝑦𝑖𝑡−1)𝑖𝑡 + µ𝑖 + 𝜀𝑖𝑡 (10)
where 𝑙𝑛 𝑡𝑟𝑎𝑑𝑒 ∗ 𝑦𝑖𝑡−1 is the interaction term between openness (measured by trade) and
lagged GDP per capita growth.12 Trade and FDI may have a complementary or
substitutionary relationship. The exact relationship between these variables remains the
subject of many studies. To avoid distortions in our estimates by the link between the
openness variables, we estimate equation 10 for trade and FDI separately. More so,
external sector openness policies have time lags between their implementation and when
they generate intended effect. Since the effect is usually not contemporaneous, the
openness variables (trade and FDI) will be lagged five years to capture their true effect on
economic growth.
Real GDP per capita growth and external sector openness indicators are the main
variables of interest in the empirical estimation of the model specified in equation (10).
Real GDP per capita growth rate (𝑦𝑖𝑡) shows the level of economic performance within
each country. There are two measures of openness. First, external sector openness is
measured by the extent to which countries trade with the rest of the world. Openness to
12 Some studies have used similar specification. See Jalles (2011) and Dollar and Kraay (2004)
[46]
international trade is expressed as the ratio of the sum of import and export to GDP.
Second, openness is measured by net foreign direct investment inflows (FDI). This was
calculated as the ratio of net foreign direct investment inflows (new investment inflows
less disinvestment from foreign investors) to GDP. 13 Education (𝑒𝑑𝑢𝑐) captures the
effect of human capital improvement on real GDP per capita growth. Inflation (inf)
measured by the percentage change in the consumer price index is included to reflect the
annual percentage change in the cost (to the average consumer) of acquiring a basket of
goods and services and hence the stability in general price levels. Population growth
(pop) captures the effect of population on real GDP per capita. This effect may be
negative when the growth in population is higher than the rate of growth in real GDP per
capita.
As discussed earlier, economic theory including the Ricardian model of
comparative advantage, the Hecksher-Ohlin-Samuelson theory and endogenous growth
models as well as a number of studies on the openness-growth nexus, show that opening
up to international trade and foreign investment, affects real GDP per capita growth rate
positively. The trade-to-GDP ratio coefficient (𝛽5) and that of net FDI inflow-to-GDP
ratio (𝛽2) are therefore expected to be positive. If population grows faster than output,
then the coefficient of population growth rate (𝛽3) is expected to be negative. If
otherwise, then the coefficient is expected to be positive. The coefficient of education
(𝛽4) is hypothesized to be positive. This is because higher school enrollment rate
improves human capital and enhances labour productivity; contributing to higher growth
13 Given that most developing countries are usually on the receiving end of foreign investment
flows, we use net foreign investment inflows instead of net foreign investment flows as a proxy
for the degree of openness to foreign investment.
[47]
rate in output (GDP). Theory shows that while inflation could usually be detrimental to
economic growth, some moderate level is sometimes beneficial to economic growth.
However, given that developing countries are characterized by high rates of inflation, it is
expected that the coefficient of inflation (𝛽6) would be negative because high inflation is
detrimental to growth. The coefficient of the interaction variable (𝛽7) cannot be
determined a priori. If openness benefits rich countries more, the coefficient of the
interaction variable is expected to be positive. However, if it benefits poor countries
more, then the coefficient of the interaction variable is expected to be negative. The
coefficient of lagged GDP per capita growth (γ) is expected to be positive and less than
one.
4.1.2 Econometric Estimation
For panel data analysis, the common estimation approach used include Pooled Ordinary
Least Squares (Pooled OLS), Fixed Effect (FE), Random Effect (RE) and the Generalized
Method of Moments (GMM). Estimating the model in equation (10) by OLS faces the
challenge of generating inconsistent and biased estimates given the presence of the
lagged dependent variable included in the model as a regressor. This is because the
lagged dependent variable (𝑦𝑖𝑡−1) is positively related to the fixed effect term (µ𝑖).
Besides creating an endogeneity problem, this also violates an assumption that is required
for consistency of the OLS estimates. Using OLS attributes the predictive power of the
fixed effect to the lagged dependent variable, hence overestimating the coefficient of the
lagged dependent variable. Using the ordinary least squares will therefore generate
[48]
unrealistic statistical inferences. Dollar and Kraay (2004) and Edwards (1992) used OLS
in their estimation of the impact of economic openness on growth. Frankel and Romer
(1999) however criticized that using OLS regression may not produce the true effect of
trade openness on growth due to the problem of endogeneity.
Issues arising from empirical estimation of dynamic growth models have been
discussed in recent literature.14 The general conclusion is that, the system GMM
estimator is the most appropriate approach to estimating dynamic growth models. A
major challenge in estimating dynamic growth models such as the one specified in
equation (10) with Fixed and Random Effect estimation is that some explanatory
variables such as trade or FDI may be endogenous with respect to growth such that a
shock to growth rate might also affect trade or FDI resulting in the problem of reverse
causality. More so, these techniques face difficulties as a result of the lagged dependent
variable included as a regressor in the model. In both methods, the lagged dependent
variable is correlated with the fixed effect term since the determinants of the fixed effect
contribute to the lagged variable. These challenges are addressed by using the difference
generalized method of moments (DIFF-GMM). The problem of endogeneity caused by
the lagged dependent variable can be corrected by first differencing the data under the
assumption of serially uncorrelated level residuals, using the second and third
untransformed lags as instruments (Arellano and Bond, 1991). This implies the following
moment condition 𝐸(𝑌𝑖𝑡 ∆ µ𝑖) = 0 for all t =3….T. Differencing the data also removes the
fixed effect, hence addressing the unobserved fixed effect problem. Applying the
transformation to equation (9) gives:
14 See Caselli et al. (1996), Dollar and Kraay (2004) and Chang et al (2009)
[49]
𝛥𝑦𝑖𝑡 = 𝛾𝛥𝑦𝑖𝑡−1 + ∑ 𝛽𝑗𝛥𝑥𝑖𝑡𝑗6
𝑗=2 + 𝛥𝜀𝑖𝑡 (11)
And equation (10) becomes
𝑦𝑖𝑡=𝛽0+𝛾(𝑦𝑖𝑡−1)+𝛽2𝑙𝑛(𝑓𝑑𝑖)𝑖𝑡+ 𝛽3(𝑝𝑜𝑝)𝑖𝑡 + 𝛽4(𝑒𝑑𝑢𝑐)𝑖𝑡 + 𝛽5𝑙𝑛(𝑡𝑟𝑎𝑑𝑒)𝑖𝑡 +
𝛽6𝑙𝑛(𝑖𝑛𝑓)𝑖𝑡 + 𝛽7(𝑙𝑛 𝑡𝑟𝑎𝑑𝑒 ∗ 𝑦𝑖𝑡−1)𝑖𝑡 + 𝜀𝑖𝑡 (12)
Despite the strength of DIFF-GMM in solving the endogeneity problem and removing the
fixed effect by first differencing the data, Blundell and Bond (1998) demonstrate that if y
is persistent (close to random walk), the DIFF-GMM suffers the ‘weak instrument
problem’. That is, untransformed lags are weak instruments for transformed variables as
past levels convey little information about future changes. DIFF-GMM thus performs
poorly.
The system generalized method of moments (SYS-GMM) developed by Blundell
and Bond (1998) addresses the weak instrument problem of DIFF-GMM. It comprises of
two equations. The first being the usual DIFF-GMM which uses lagged levels as
instruments for equations in first differences. In the second equation, instead of
differencing the data to remove the fixed effect, SYS-GMM takes the first difference of
the variables to make them exogenous to the fixed effect and uses them as instruments in
the level equation. This leads to adding another moment condition, [𝐸(𝛥𝑤𝑖𝑡 µ𝑖) = 0] for
all i and t, where 𝛥𝑤𝑖𝑡 is the instrument and µ𝑖 is the fixed effect. The SYS-GMM
estimator is more efficient asymptotically as it explores more moment conditions than the
DIFF-GMM estimator which uses only a subset of linear moment conditions. We
[50]
therefore follow Daumal and Özyurt (2011) in estimating the dynamic growth model in
equation (12) by using the SYS-GMM estimator.
4.1.3. Data Description and Scope of the Study
The empirical analysis of this thesis is conducted using annual data of 7 high performing
Asian economies (HPAEs) and selected countries from three developing regions over the
period 1960-2012. The regions include Sub-Saharan Africa (SSA), South and Eastern
Asia (SEA) and Latin America and Caribbean (LAC). The panel dataset include 40
countries in SSA, 22 countries in South and East Asia and 25 countries in Latin America.
The data set is balanced.15 The HPAEs are excluded from the pool of SEA countries
because they opened up earlier than most developing countries. They also have
significantly higher average real GDP per capita growth and hence may overshadow the
true effect of openness on growth in SEA if the study is conducted by simply pooling
them together with the other SEA countries. The choice of the developing regions is
basically motivated by the differences between the growth rates recorded by the countries
after opening up their economies at about the same time except for some Asian countries.
The choice of countries within each region is based on availability of data for key
variables. The study period is motivated by the difference in growth recorded by the
‘early’ and ‘late openers’ after opening up to trade in the 1960s and 1980s respectively.
The source of data for this study is the World Development Indicators (WDI) of the
World Bank.
15 As a developed country, Japan is excluded from the HPAEs.
[51]
CHAPTER FIVE
5.1 Estimation and Econometric Results
In the preceding chapter, we specified and discussed the model to be used to empirically
examine the openness-growth relationship. In this section, we estimate and discuss the
results of the standard growth model specified in equation (12), using panel data of
countries within each of the three regions. As mentioned earlier, equation (12) is
estimated for trade and FDI separately. The results are discussed in two sub-sections. The
first, presents a comparative regional analysis of the openness-growth relationship across
the three developing regions. The second, discusses the difference between the growth
effect of trade experienced by the ‘early openers’ (HPAEs) and the ‘late openers’ (other
developing countries). To do this, we estimate the openness-growth relationship over a
period of 30 years after each category of countries opened up their economies. The
relationship is thus estimated for HPAEs over the period 1960-1990 and 1980-2010 for
the other developing countries. We also report the Arellano and Bond test for second
order autocorrelation (AR (2)), and the Sargan tests for over-identifying restriction.
5.2 The Growth-Openness Model
In Tables 5.1A and 5.1B below, we present the results of the openness-growth
relationship estimated using a pooled data of all the three developing countries with
regional dummies. The primary objective of using this approach is to test for the
statistical significance of the difference in coefficient estimates among the regions.
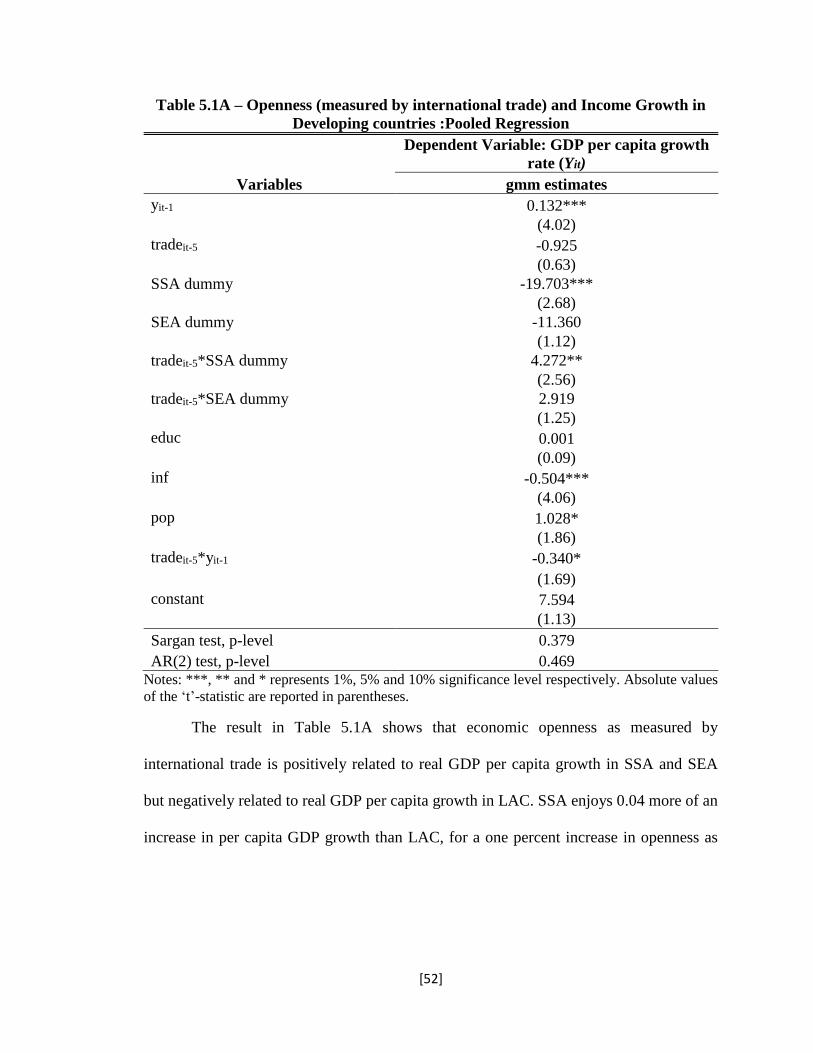
[52]
Table 5.1A – Openness (measured by international trade) and Income Growth in
Developing countries :Pooled Regression
Variables
Dependent Variable: GDP per capita growth
rate (Yit)
gmm estimates
yit-1 0.132***
(4.02)
tradeit-5 -0.925
(0.63)
SSA dummy -19.703***
(2.68)
SEA dummy -11.360
(1.12)
tradeit-5*SSA dummy 4.272**
(2.56)
tradeit-5*SEA dummy 2.919
(1.25)
educ 0.001
(0.09)
inf -0.504***
(4.06)
pop 1.028*
(1.86)
tradeit-5*yit-1 -0.340*
(1.69)
constant 7.594
(1.13)
Sargan test, p-level 0.379
AR(2) test, p-level 0.469 Notes: ***, ** and * represents 1%, 5% and 10% significance level respectively. Absolute values
of the ‘t’-statistic are reported in parentheses.
The result in Table 5.1A shows that economic openness as measured by
international trade is positively related to real GDP per capita growth in SSA and SEA
but negatively related to real GDP per capita growth in LAC. SSA enjoys 0.04 more of an
increase in per capita GDP growth than LAC, for a one percent increase in openness as
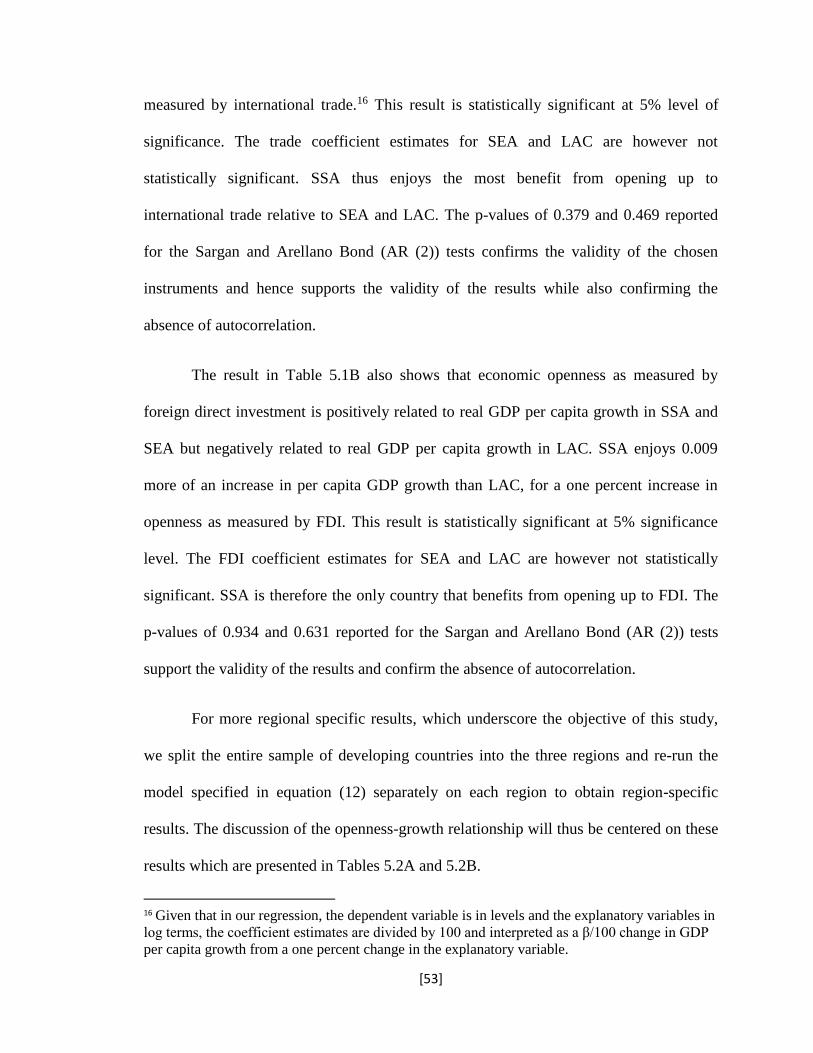
[53]
measured by international trade.16 This result is statistically significant at 5% level of
significance. The trade coefficient estimates for SEA and LAC are however not
statistically significant. SSA thus enjoys the most benefit from opening up to
international trade relative to SEA and LAC. The p-values of 0.379 and 0.469 reported
for the Sargan and Arellano Bond (AR (2)) tests confirms the validity of the chosen
instruments and hence supports the validity of the results while also confirming the
absence of autocorrelation.
The result in Table 5.1B also shows that economic openness as measured by
foreign direct investment is positively related to real GDP per capita growth in SSA and
SEA but negatively related to real GDP per capita growth in LAC. SSA enjoys 0.009
more of an increase in per capita GDP growth than LAC, for a one percent increase in
openness as measured by FDI. This result is statistically significant at 5% significance
level. The FDI coefficient estimates for SEA and LAC are however not statistically
significant. SSA is therefore the only country that benefits from opening up to FDI. The
p-values of 0.934 and 0.631 reported for the Sargan and Arellano Bond (AR (2)) tests
support the validity of the results and confirm the absence of autocorrelation.
For more regional specific results, which underscore the objective of this study,
we split the entire sample of developing countries into the three regions and re-run the
model specified in equation (12) separately on each region to obtain region-specific
results. The discussion of the openness-growth relationship will thus be centered on these
results which are presented in Tables 5.2A and 5.2B.
16 Given that in our regression, the dependent variable is in levels and the explanatory variables in
log terms, the coefficient estimates are divided by 100 and interpreted as a β/100 change in GDP
per capita growth from a one percent change in the explanatory variable.
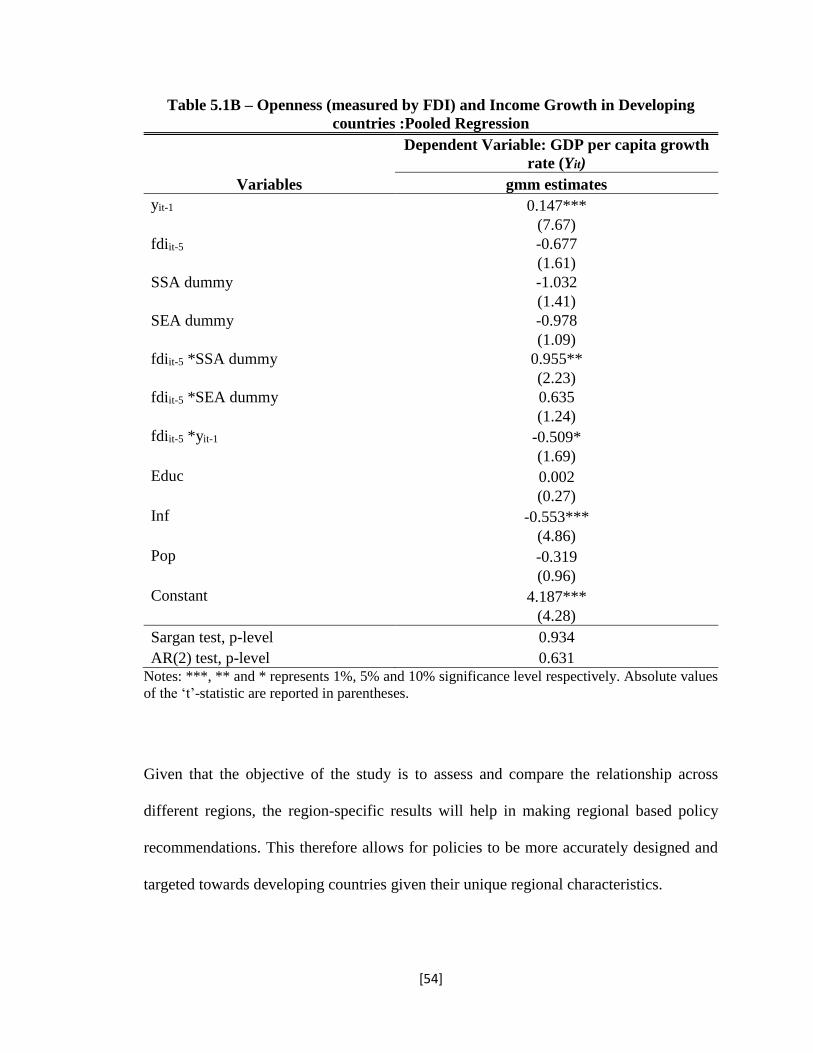
[54]
Table 5.1B – Openness (measured by FDI) and Income Growth in Developing
countries :Pooled Regression
Variables
Dependent Variable: GDP per capita growth
rate (Yit)
gmm estimates
yit-1 0.147***
(7.67)
fdiit-5 -0.677
(1.61)
SSA dummy -1.032
(1.41)
SEA dummy -0.978
(1.09)
fdiit-5 *SSA dummy 0.955**
(2.23)
fdiit-5 *SEA dummy 0.635
(1.24)
fdiit-5 *yit-1 -0.509*
(1.69)
Educ 0.002
(0.27)
Inf -0.553***
(4.86)
Pop -0.319
(0.96)
Constant 4.187***
(4.28)
Sargan test, p-level 0.934
AR(2) test, p-level 0.631 Notes: ***, ** and * represents 1%, 5% and 10% significance level respectively. Absolute values
of the ‘t’-statistic are reported in parentheses.
Given that the objective of the study is to assess and compare the relationship across
different regions, the region-specific results will help in making regional based policy
recommendations. This therefore allows for policies to be more accurately designed and
targeted towards developing countries given their unique regional characteristics.
[55]
Table 5.2A – Openness (measured by international trade) and Income Growth in
Developing countries (1980-2012): Regional Specific Regression
Dependent Variable: GDP per capita
growth rate (Yit)
Variables
gmm estimates
SSA LAC SEA
yit-1 0.280*** 0.168** 0.456***
(6.99) (2.16) (9.17)
tradeit-5 1.364*** 0.813 -0.325
(3.07) (0.92) (0.68)
Educ 0.014 -0.007 0.006
(1.25) (0.54) (0.57)
inf -0.296* -0.565*** -0.371*
(1.87) (2.73) (1.77)
pop -0.124 0.314 -0.585
(0.24) (1.03) (1.31)
tradeit-5 * yit-1 -0.367*** 0.145 -0.295**
(2.75) (0.66) (2.29)
constant -3.589* -0.718 4.282**
(1.76) (0.18) (2.17)
Sargan test, p-level 0.207 0.881 0.727
AR(2) test, p-level 0.194 0.113 0.254
Notes: ***, ** and * represents 1%, 5% and 10% significance level respectively. Absolute
values of the‘t’-statistic are reported in parentheses.
The econometric specification tests; Sargan test and Arellano Bond test for
autocorrelation (AR (2)) are also reported. The Sargan test assesses the validity and
efficiency of the SYS-GMM estimator. It tests the validity of the chosen set of
instrumental variables by assuming that the residuals are not correlated with the
instruments. The p-values of 0.207, 0.881 and 0.727 reported for the Sargan test for SSA,
LAC and SEA respectively in Table 5.2A indicate failure to reject the null hypothesis
that the instruments as a group are exogenous. This confirms the validity of the chosen
instruments and hence supports the validity of the results. It also suggests that the results
[56]
are not weakened by many instruments. The AR (2) test for autocorrelation has a null
hypothesis of no autocorrelation. It is applied to the differenced residuals and just like the
Sargan test, a higher p-value is preferred. This is because; it implies failure to reject the
null hypothesis that there is no autocorrelation. The p-values of 0.194, 0.113 and 0.254
reported for the AR (2) tests for SSA, LAC and SEA respectively in table 5.2A, implies
the absence of autocorrelation in the specification of the estimated model.
Column 2 represents the results for SSA. The coefficient of the lagged real GDP
per capita growth is positive and statistically significant at 1% significance level. For
SSA, openness as measured by trade is positively related to real GDP per capita growth.
This positive coefficient estimate is in line with the findings of some empirical studies
and the relationship predicted by economic theory.17 The estimated coefficient of
openness implies that, a 1% increase in trade results in a 0.01364 increase in the growth
rate of per capita income of Sub-Saharan African countries. This could be explained by
the economic benefits associated with opening up to trade as discussed earlier in the
previous chapters. In the 1980s, the World Bank and the IMF identified trade policies as
part of the primary causes of slow growth and trade marginalization in Africa. The Bank
argued and proposed that orthodox macroeconomic management and in particular trade
liberalization represents the road to economic recovery in SSA and that more adjustment
was required. By mid 1980s, almost all Sub-Saharan African countries had implemented
comprehensive and substantial economic policy reforms. The reforms were further
encouraged by the astounding performance of some East Asian countries that had opened
up to trade earlier. The implementation of comprehensive economic and trade reforms by
17 See Chang and Mendy, (2012) and Chen (1999)
[57]
the early 1990s in most SSA countries have been a major contributing factor to the
positive growth in real GDP per capita. Subsequent to opening up their external sector,
most SSA countries have benefited from access to increased market size, transfer of
technological know-how and managerial expertise as well as increased output due to
specialization amongst others. The interaction variable between trade and lagged real
GDP per capita growth has a negative coefficient estimate with a magnitude of 0.367.
The estimated coefficient is statistically significant at 1% significance level and implies
that higher income countries experience 0.00367 less growth for every 1% increase in
trade. This implies that trade is more beneficial to low income countries than it is to high
income countries in SSA. Therefore, openness to international trade accelerates
convergence in the Sub-Saharan Africa region.
Inflation is estimated to be negatively related to real GDP per capita growth in
SSA, with a magnitude of 0.296. This implies that, inflation in SSA has been detrimental
to the growth of real GDP per capita. A 1% increase in inflation results in a decline of
0.00296 in real GDP per capita growth rate. This result is statistically significant at a 10%
level of significance. Macroeconomic theory and empirical studies show that, although
moderate levels of inflation is favorable for growth, higher levels of it is detrimental to
growth. Unfortunately, most countries in SSA are characterized by higher inflation rates.
Inflation rates have been high for most of the region’s well performing economies such as
Nigeria, Ghana, Angola and Mozambique due to a number of factors. Most critical of
such factors include escalating prices of food and transportation as well as the erosion of
the domestic currency’s value against the U.S dollar and other major currencies. To a
large extent, these could explain the negative effect of inflation on income growth as
[58]
estimated. As expected, given the definition of GDP per capita, the results show that
population growth rate is negatively related to the growth rate of real GDP per capita.
However, this result is not statistically significant. Education is estimated to be positively
related to per capita income growth. However, it is not statistically significant in affecting
income growth. This is indicative of the mismatch between the skills acquired in schools
and the skills required in the job market, which characterizes most SSA countries.
The results for LAC are presented in column 3. The coefficient of the lagged per
capita income growth is positive and statistically significant at 5% significance level. The
results indicate that, opening up the external sector of Latin American countries has not
been significant in impacting real GDP per capita growth rates. Although the trade
coefficient estimate is positive, the result is not statistically significant. Similarly,
opening up to trade is not significant in either accelerating or decelerating the process of
convergence among Latin American countries. This is depicted by the coefficient
estimate of the interaction variable (Trade and lagged GDP per capita growth), which is
not statistically significant.
Inflation is negatively and significantly related to real per capita GDP growth of
Latin American countries with a 1% increase in inflation resulting in a 0.00565 decline in
real GDP per capita growth. The result is statistically significant at a 1% level of
significance. By implication, inflation has been detrimental to per capita income growth
as it pertains to most developing countries. Education in LAC is not statistically
significant in affecting real GDP per capita growth. This could equally be attributed to
the mismatch between skills provided by the educational system and the skills required
[59]
by the job market. Similarly, population growth is not statistically significant in affecting
GDP per capita growth.
Estimation results for the openness-growth nexus in SEA are presented in the 4th
column. As expected, the coefficient of lagged GDP per capita growth is positive and
statistically significant at 1% significance level. External sector openness as measured by
trade in SEA is negatively related to real income per capita growth. This result is
however not statistically significant. Nevertheless, when trade is interacted with growth
performance, the coefficient of the interaction variable is negative and statistically
significant at 5% level of significance. This means that, while trade may not be
statistically significant in affecting growth within the entire region, it may contribute to
accelerating the process of convergence within the region, as trade tends to be detrimental
to high income countries relative to low income countries. The negative and insignificant
trade coefficient estimate may be explained by the nature of most trade agreements in the
region. That is, most of the trade agreements have been regional based. Since the trend of
regionalism reached South-East Asia in the 1980s, it has been accompanied by sharp
increase in RTAs. Four of such RTAs were established between 1980 and 1990 (Jalles,
2011). Intra-regional trade had become relatively important in South-East Asia. Although
broad liberalization seems to be growth enhancing, the effect of most RTAs which had
gained prominence in the region had no impact on growth while others tended to be
detrimental to growth. This result is similar to the findings of Jalles (2011). His study
shows that, in SEA the effect of international trade on real GDP per capita growth is
mixed if not detrimental in some cases, once endogeneity is accounted for. He uses the
Sachs-Warner index to show that broad liberalization is positively and significantly
[60]
related to growth however, this effect is offset by a negative impact of belonging to the
South Asian Preferential Trade Arrangement (SAPTA).
As expected, education is positively related to real GDP per capita growth in SEA
with an estimated coefficient of 0.006. The result is however statistically insignificant as
it is with the other developing regions. In line with economic theory and empirical
studies, inflation and population growth rates are both estimated to be negatively related
to real GDP per capita growth in SEA. The coefficient estimate for inflation is
statistically significant at 10% significance level but the population growth estimate is not
statistically significant. Generally, it is shown that, openness as measured by international
trade has led to increasing real GDP per capita growth rates of countries in SSA and some
low income countries in SEA while countries in LAC have not been significantly
impacted by trade. The implementation of comprehensive and substantial trade policy
reforms has thus paid off especially for developing countries in SSA.
Estimation results for the effect of external sector openness measured by FDI on
income per capita growth in SSA, LAC and SEA are presented in Table 5.2B below.
Here, our discussion of the results will be focused on the variables of main concern (FDI
and GDP per capita growth). The p-values of 0.986, 0.482 and 0.691 reported for the
Sargan test for SSA, LAC and SEA respectively indicate failure to reject the null
hypothesis that the instruments as a group are exogenous. It also suggests that the results
are not weakened by many instruments. The p-values of 0.226, 0.857 and 0.118 reported
for the AR (2) tests for SSA, LAC and SEA respectively, implies the absence of
autocorrelation in the specification of the estimated model. External sector openness
measured by FDI is positively related to real income growth in SSA. A 1% increase in
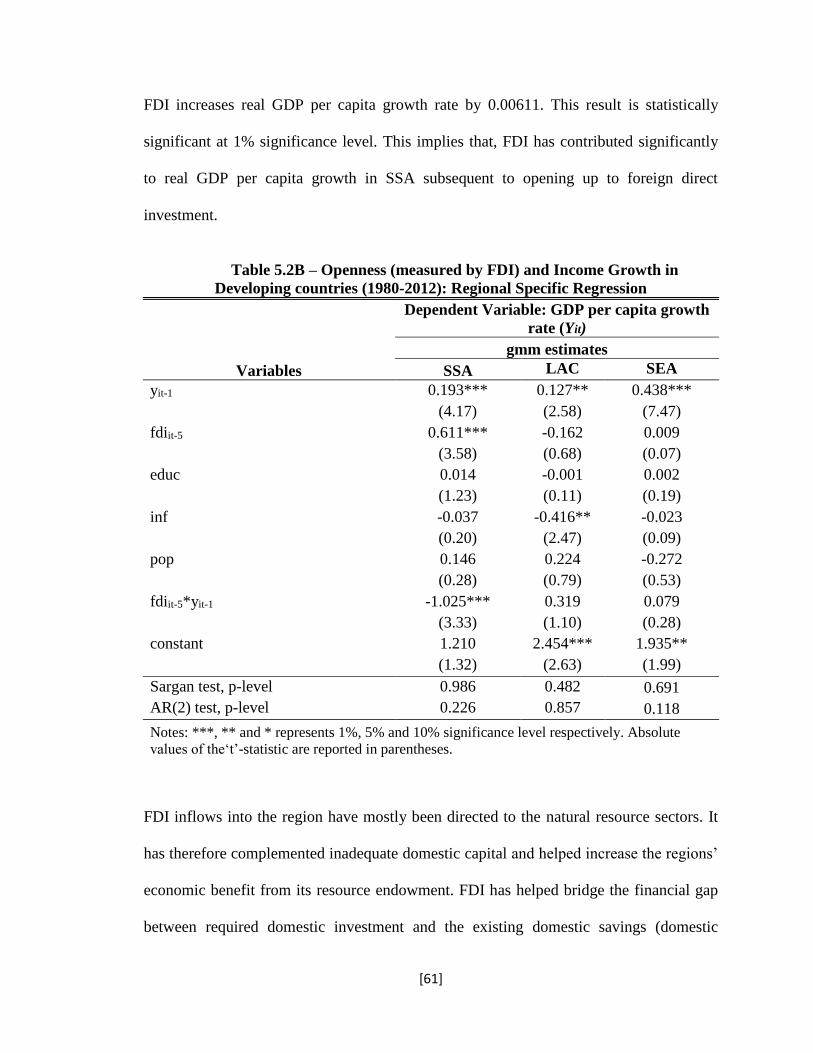
[61]
FDI increases real GDP per capita growth rate by 0.00611. This result is statistically
significant at 1% significance level. This implies that, FDI has contributed significantly
to real GDP per capita growth in SSA subsequent to opening up to foreign direct
investment.
Table 5.2B – Openness (measured by FDI) and Income Growth in
Developing countries (1980-2012): Regional Specific Regression
Dependent Variable: GDP per capita growth
rate (Yit)
Variables
gmm estimates
SSA LAC SEA
yit-1 0.193*** 0.127** 0.438***
(4.17) (2.58) (7.47)
fdiit-5 0.611*** -0.162 0.009
(3.58) (0.68) (0.07)
educ 0.014 -0.001 0.002
(1.23) (0.11) (0.19)
inf -0.037 -0.416** -0.023
(0.20) (2.47) (0.09)
pop 0.146 0.224 -0.272
(0.28) (0.79) (0.53)
fdiit-5*yit-1 -1.025*** 0.319 0.079
(3.33) (1.10) (0.28)
constant 1.210 2.454*** 1.935**
(1.32) (2.63) (1.99)
Sargan test, p-level 0.986 0.482 0.691
AR(2) test, p-level 0.226 0.857 0.118
Notes: ***, ** and * represents 1%, 5% and 10% significance level respectively. Absolute
values of the‘t’-statistic are reported in parentheses.
FDI inflows into the region have mostly been directed to the natural resource sectors. It
has therefore complemented inadequate domestic capital and helped increase the regions’
economic benefit from its resource endowment. FDI has helped bridge the financial gap
between required domestic investment and the existing domestic savings (domestic
[62]
capital) in SSA. The interaction variable between FDI and real GDP per capita growth
has a negative coefficient with a magnitude of 1.025 and statistically significant at 1%
significance level. This implies that, opening up to FDI is more beneficial to low income
countries relative to high income countries in SSA. This is because high income countries
experience 0.01025 less of an increase in growth for every 1% increase in FDI. Openness
to foreign direct investment therefore accelerates convergence in SSA.
External sector openness measured by FDI is negatively related to per capita GDP
growth in LAC. The FDI coefficient estimate is however not statistically significant.
Although the region is shown in earlier discussions to have recorded on average the
highest foreign direct investment inflows relative to SSA and SEA, the estimated
coefficient implies that, FDI has not been significant in affecting real GDP per capita
growth. Similarly, opening up to FDI neither facilitate nor tempers the process of
convergence. This is implied by an insignificant coefficient estimate for the interaction
variable between FDI and GDP per capita growth. Although external sector openness
measured by FDI has a positive relationship with income growth in SEA, the result is not
statistically significant. By implication, FDI has nether affected real income growth nor
the process of convergence as the coefficient of the interaction variable between FDI and
GDP per capita is also not statistically significant.
While broad trade liberalization has promoted economic growth for some
developing countries, the differences in the trade effect could stem from the effect of
intra-regional trade liberalization policies. Sub-Saharan Africa has benefited most from
trade with a coefficient estimate of 1.364. Openness to trade has however been
insignificant in affecting growth in LAC and in some countries in SEA. Given that most
[63]
developing countries could not reap the expected gains from north-south trade
relationships, the south-south RTAs began to occupy an integral part of economic
policies of most developing countries in the late 1970s. The south-south RTAs were
therefore perceived as the key strategy for transforming the economies of first Asia and
subsequently Africa. Regionalism became relatively important in South-East Asia in the
1980s and 1990s and was accompanied by a sharp increase in RTAs (Jalles, 2011).
However intra-SSA trade was very limited and hardly grew over time within the same
period (Foroutan and Pritchett, 1993). It is shown however that, the RTAs rather than the
broad trade liberalization accounts for the negative effect of trade on growth in SEA.18
Venables (2003) also finds that developing countries would benefit more from trade if
they pursued north-south trade liberalization agreements than they would if they pursue
south-south RTAs.
It could also be observed that SSA and SEA have negative and significant
coefficient estimates for the interaction variable between trade and GDP per capita
growth, with the exception of LAC which has an insignificant coefficient estimate for the
interaction variable. This implies that, generally, developing countries in SEA and SSA
with relatively higher real GDP per capita growth tend to benefit less from trade relative
to countries with lower real GDP per capita growth. In terms of significance of the
coefficient estimates, the results imply that with the exception of LAC, the level of a
country’s economic performance in SEA and SSA has an effect on the level of benefit
obtained from opening up to trade. By extension, the reported coefficient of the
18 See Jalles, 2011.
[64]
interaction variable also implies that, opening up to trade accelerates convergence in SSA
and SEA.
5.3 Openness Effects on Income growth for ‘Early’ and ‘Late Openers’
A continued process of openness to the global economy and removal of trade barriers has
occurred over the past three decades in many developing countries. This has increasingly
made the world market more integrated than it was in the late 1950s and 1960s. Although
Great Britain had liberalized its trade policies in the 19th century, most developed
countries including the United States, Germany, France and Japan were still very much
inward-oriented. The 1940s and 1950s marked the beginning of significant efforts
towards substantial reduction of tariffs and other trade barriers with the formation of such
liberalizing trade agreements as the General Agreement on Tariffs and Trade (GATT) in
1947. Although it was initially signed by mostly developed countries, it was later
extended to include developing countries in the Kennedy Rounds held in 1962 and 1967.
The Geneva round of GATT in 1947 was signed by 23 countries. By 1973 the number
had increased by 343% to 102 in the Tokyo round and further to 123 by 1986 in the
Uruguay round. Out of 195 recognized sovereign states, 160 are currently member states
of the World Trade Organization (WTO) which was officially created in 1995 to replace
GATT. This is one of many examples which shows that world trade was relatively less
liberalized prior to the 1980s.
However as earlier discussed, there exist a difference between the high growth
recorded by the Asian Tigers and other high performing Asian economies (HPAEs)
[65]
which opened up their external sector earlier in the 1960s and the relatively sluggish
growth performance recorded by the other developing countries which opened up their
external sector later in the 1980s. Table 5.3A and 5.3B present the results for the effect of
economic openness measured by trade and FDI respectively on real GDP per capita
growth for the late openers (developing regions) and the early openers (HPAEs) using
equation (12). Discussion of results in table 5.3B will be focused on the variables of main
concern (FDI and GDP per capita growth).
The regression results for the HPAEs cover a sample of six countries made up of
the Asian Tigers (Hong Kong, the Republic of Korea, Singapore and Taiwan) and the
other countries (Indonesia, Malaysia and Thailand) that make up the HPAEs over three
decades (1960-1990) subsequent to opening up their economies. 19 That of the other
developing regions also covers three decades (1980-2010) after opening up their
economies. We also report the openness-growth relationship in the other developing
regions over the period 1960 to 1980. This enables us to assess the role of economic
openness to real GDP per capita growth in the other developing regions prior to
significantly opening up their external sector in the 1980s. The econometric specification
tests (Sargan and AR (2)) support the robustness of the results presented.
As can be observed, openness as measured by trade was not significant in
influencing real income growth in SSA and SEA prior to the 1980s when most of these
countries had not significantly opened up their external sector. Although trade was
significant in affecting GDP per capita growth in LAC, the effect was negative. A 1%
increase in trade led to a 0.0245 decrease in GPD per capita growth. This result is
19 Taiwan is excluded in this study due to unavailability of data.
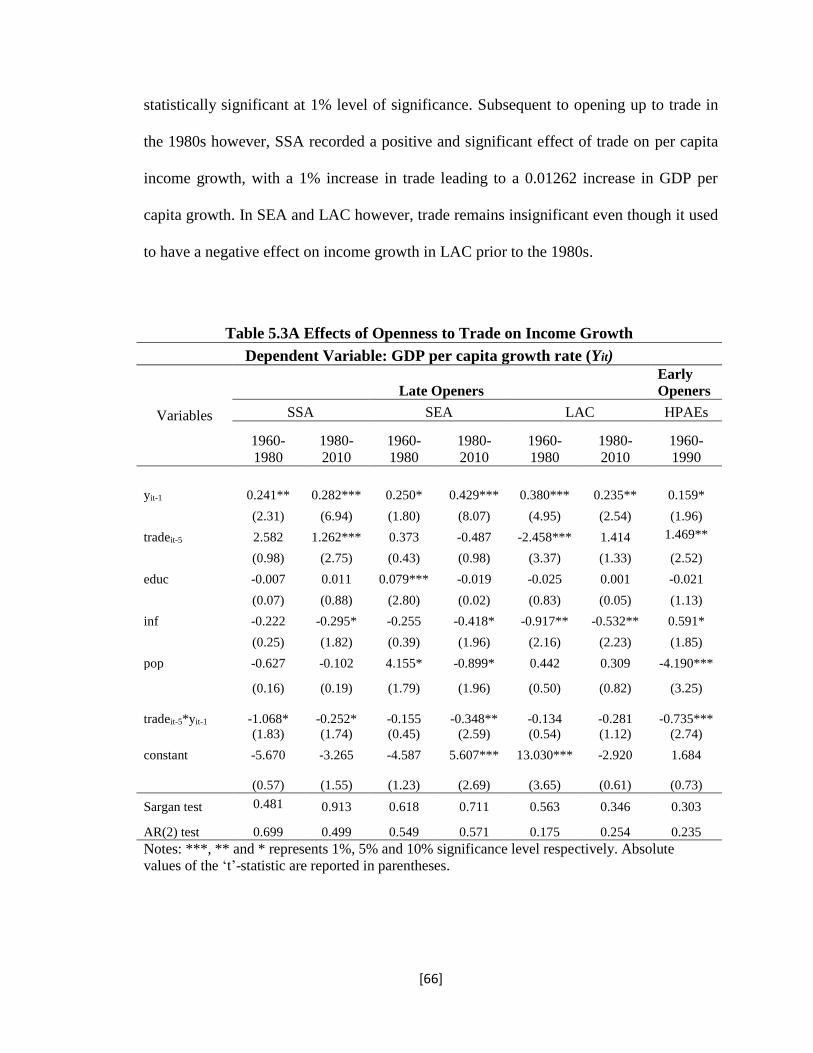
[66]
statistically significant at 1% level of significance. Subsequent to opening up to trade in
the 1980s however, SSA recorded a positive and significant effect of trade on per capita
income growth, with a 1% increase in trade leading to a 0.01262 increase in GDP per
capita growth. In SEA and LAC however, trade remains insignificant even though it used
to have a negative effect on income growth in LAC prior to the 1980s.
Table 5.3A Effects of Openness to Trade on Income Growth
Dependent Variable: GDP per capita growth rate (Yit)
Variables
Late Openers
Early
Openers
SSA SEA LAC HPAEs
1960-
1980
1980-
2010
1960-
1980
1980-
2010
1960-
1980
1980-
2010
1960-
1990
yit-1
0.241** 0.282*** 0.250* 0.429*** 0.380*** 0.235** 0.159*
(2.31) (6.94) (1.80) (8.07) (4.95) (2.54) (1.96)
tradeit-5 2.582 1.262*** 0.373 -0.487 -2.458*** 1.414 1.469**
(0.98) (2.75) (0.43) (0.98) (3.37) (1.33) (2.52)
educ -0.007 0.011 0.079*** -0.019 -0.025 0.001 -0.021
(0.07) (0.88) (2.80) (0.02) (0.83) (0.05) (1.13)
inf -0.222 -0.295* -0.255 -0.418* -0.917** -0.532** 0.591*
(0.25) (1.82) (0.39) (1.96) (2.16) (2.23) (1.85)
pop -0.627 -0.102 4.155* -0.899* 0.442 0.309 -4.190***
(0.16) (0.19) (1.79) (1.96) (0.50) (0.82) (3.25)
tradeit-5*yit-1 -1.068* -0.252* -0.155 -0.348** -0.134 -0.281 -0.735***
(1.83) (1.74) (0.45) (2.59) (0.54) (1.12) (2.74)
constant -5.670 -3.265 -4.587 5.607*** 13.030*** -2.920 1.684
(0.57) (1.55) (1.23) (2.69) (3.65) (0.61) (0.73)
Sargan test 0.481 0.913 0.618 0.711 0.563 0.346 0.303
AR(2) test 0.699 0.499 0.549 0.571 0.175 0.254 0.235
Notes: ***, ** and * represents 1%, 5% and 10% significance level respectively. Absolute
values of the ‘t’-statistic are reported in parentheses.
[67]
This provides an empirical evidence of the role openness has played in improving
income growth in some developing countries subsequent to the implementation of trade
liberalizing policies. However, openness to trade has significantly and positively affected
real GDP per capita growth in the HPAEs over the thirty years period after they opened
up to trade. They recorded a higher positive effect of openness than SSA or any of the
other developing regions did over the thirty-year period of opening up to their external
sector with a coefficient estimate of 1.469. We test the significance of the difference
between the trade coefficient estimates for the HPAEs and SSA using the Wald test
involving linear combinations of parameters. The test is based on the null hypothesis that
the coefficient estimate for the HPAEs is significantly different from that of SSA. The
result shows that the difference between the openness coefficient estimate for HPAEs and
SSA is statistically significant at a P-value 0.7218. Hence we fail to reject the null
hypothesis that, the trade coefficient estimates are significantly different.
As can be seen in Table 5.3B, the HPAEs also benefitted most from opening up to
FDI than any of the other developing countries. A 1% increase in FDI led to a 0.01088
increase in GDP per capita growth whiles in SSA, a 1% increase in FDI led to a 0.00655
increase in GDP per capita growth. This may be because, unlike other developing
regions, the HPAEs opened up their external sector earlier in the 1960s and 1970s and
became the prime choice for Multinational Enterprises (NMEs) which wanted to out-
source labor intensive parts of their production. Subsequently, the region has remained a
prime destination of FDI due to growing regional market and natural resources. More so,
some countries in the region consciously promoted FDI inflows. Indonesia adopted and
implemented liberalized FDI regulatory frameworks. Singapore invested more of its
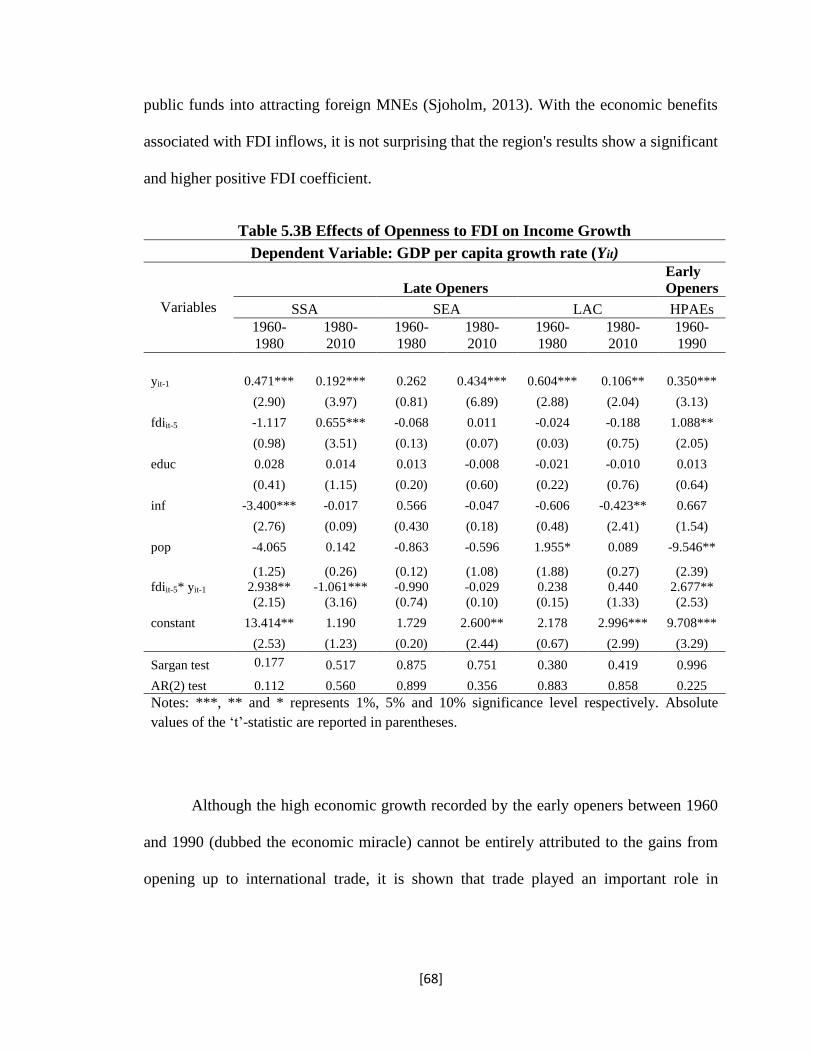
[68]
public funds into attracting foreign MNEs (Sjoholm, 2013). With the economic benefits
associated with FDI inflows, it is not surprising that the region's results show a significant
and higher positive FDI coefficient.
Table 5.3B Effects of Openness to FDI on Income Growth
Dependent Variable: GDP per capita growth rate (Yit)
Variables
Late Openers
Early
Openers
SSA SEA LAC HPAEs
1960-
1980
1980-
2010
1960-
1980
1980-
2010
1960-
1980
1980-
2010
1960-
1990
yit-1
0.471*** 0.192*** 0.262 0.434*** 0.604*** 0.106** 0.350***
(2.90) (3.97) (0.81) (6.89) (2.88) (2.04) (3.13)
fdiit-5 -1.117 0.655*** -0.068 0.011 -0.024 -0.188 1.088**
(0.98) (3.51) (0.13) (0.07) (0.03) (0.75) (2.05)
educ 0.028 0.014 0.013 -0.008 -0.021 -0.010 0.013
(0.41) (1.15) (0.20) (0.60) (0.22) (0.76) (0.64)
inf -3.400*** -0.017 0.566 -0.047 -0.606 -0.423** 0.667
(2.76) (0.09) (0.430 (0.18) (0.48) (2.41) (1.54)
pop -4.065 0.142 -0.863 -0.596 1.955* 0.089 -9.546**
(1.25) (0.26) (0.12) (1.08) (1.88) (0.27) (2.39)
fdiit-5* yit-1 2.938** -1.061*** -0.990 -0.029 0.238 0.440 2.677**
(2.15) (3.16) (0.74) (0.10) (0.15) (1.33) (2.53)
constant 13.414** 1.190 1.729 2.600** 2.178 2.996*** 9.708***
(2.53) (1.23) (0.20) (2.44) (0.67) (2.99) (3.29)
Sargan test 0.177 0.517 0.875 0.751 0.380 0.419 0.996
AR(2) test 0.112 0.560 0.899 0.356 0.883 0.858 0.225
Notes: ***, ** and * represents 1%, 5% and 10% significance level respectively. Absolute
values of the ‘t’-statistic are reported in parentheses.
Although the high economic growth recorded by the early openers between 1960
and 1990 (dubbed the economic miracle) cannot be entirely attributed to the gains from
opening up to international trade, it is shown that trade played an important role in
[69]
increasing growth rates.20 Total factor productivity and factor accumulation have been
cited as sources of the high sustained growth of the HPAEs (Page, 1994). Nonetheless,
trade also had an indirect effect on the growth of these economies through its positive
effect on total factor productivity (TFP) growth rates (through the adoption of
international best practices). It is therefore not unusual that the coefficient estimate for
trade is shown to be equally significant and relatively higher than that of the other
developing regions.
The results present what seems like an anomaly in the sense that, the other
developing countries have enjoyed a system of ‘free trade’ subsequent to opening up their
economy relative to the HPAEs which opened up in a relatively more restricted trade
regime. It is thus expected that the other developing countries should benefit more than
the HPAEs from opening up their external economy since they have enjoyed a wider
international market size. However, the reverse is what is depicted in the results. In other
to affirm the seeming anomaly or claim otherwise, we investigate some factors that could
explain the difference between the gains from openness recorded by the HPAEs and the
other developing countries. By economic theory and intuitive reasoning, we identify two
socio-economic factors that could explain the difference in the gains from openness
experienced by the two groups of countries. First, economic theory shows that human
capital development through education is critical to inducing a positive growth effect
from trade. Technological progress is very important in enhancing the growth of an
economy and in developing countries, external sector openness serves as a means to
advancing technology through the adoption of technological know-how from developed
20 See John Page (1994)
[70]
trading partners. However, a well-trained and highly skilled domestic labour force is
required for the adoption and efficient use of the international best practices and
technological know-how associated with trading with developed countries. Hence the
relevance of education to inducing positive growth effect of trade through technological
progress. Secondly, economic theory shows that achieving macroeconomic stability is
critical to enhancing economic growth and inducing a positive effect of openness on
growth. Theory shows that, some level of inflation (low-to-moderate) is good for an
economy to thrive, however high levels of inflation is detrimental to growth. In relation
to openness, low-to-moderate inflation levels induces positive effect of trade relative to
high inflation levels which make an economy’s export less attractive and less competitive
on the international market. The gains from opening up an economy’s external sector is
thus contingent on how attractive or competitive its exports are on the international
market and hence how high, moderate or low its inflation rate is.
To further investigate the aforementioned seeming anomaly, we extend the
openness-growth model specified in equation (12) to test for the statistical significance of
the factors identified above as contributing to the difference in trade benefits to growth
experienced by the HPAEs and the other developing countries. To do this, we include
two interaction variables (trade and improved education, trade and low inflation) to
determine if there exist any additional effects or indirect effect of trade on growth
through these contributing factors. The extended openness-growth model is thus
expressed as;

[71]
𝑦𝑖𝑡= 𝛽0 + 𝛽1ln (𝑦𝑖𝑡−1) + 𝛽2𝑙𝑛(𝑡𝑟𝑎𝑑𝑒)𝑖𝑡 + 𝛽3 𝑙𝑛(𝑖𝑛𝑓)𝑖𝑡 + 𝛽4(𝑒𝑑𝑢𝑐)𝑖𝑡 +
𝛽5(𝑝𝑜𝑝)𝑖𝑡 + 𝛽6(𝑙𝑛 𝑡𝑟𝑎𝑑𝑒 ∗ 𝑙𝑛𝑦𝑖𝑡−1)𝑖𝑡 + 𝛽7(𝑙𝑛 𝑡𝑟𝑎𝑑𝑒 ∗ 𝑙𝑛𝑖𝑛𝑓)𝑖𝑡 +
𝛽8(𝑙𝑛 𝑡𝑟𝑎𝑑𝑒 ∗ 𝑒𝑑𝑢𝑐)𝑖𝑡 + 𝜀𝑖𝑡 (13)
Where 𝑙𝑛 𝑡𝑟𝑎𝑑𝑒 ∗ 𝑙𝑛𝑖𝑛𝑓 and 𝑙𝑛 𝑡𝑟𝑎𝑑𝑒 ∗ 𝑒𝑑𝑢𝑐 represent the interaction terms between
trade and low inflation and improved education respectively. Both interaction variables
are expected to be positively related to growth as earlier discussed. To analyze the trade
benefit differentials between the HPEAs and the other developing countries, we estimate
equation (13) for both groups over three decades after they each opened up their external
sector. That is between 1960 – 1990 and 1980 – 2010 respectively.
Table 5.4 below presents the results for the empirical estimation of the extended
openness-growth model. The econometric specification tests; Sargan and AR(2) validate
the results presented. As can be observed from column (5), openness as measured by
trade has a positive indirect effect on real GDP per capita growth through improved
education and low-to-moderate levels of inflation. The coefficient estimates for the trade-
education and trade-inflation interaction variables are positive and statistically significant
at 1% and 10% respectively. These results imply that, for every 1% increase in education,
openness (trade) contributes 0.00473 more to real GDP per capita growth through
improved education. Openness also contributes 0.00298 more to real GDP per capita
growth for every 1% decline in inflation. The positive effects of the trade-education and
trade-inflation interaction variables, goes to reinforce the role of education and low-to-
moderate inflation in augmenting the positive effect of openness on real GDP per capita
growth of the HPAEs.
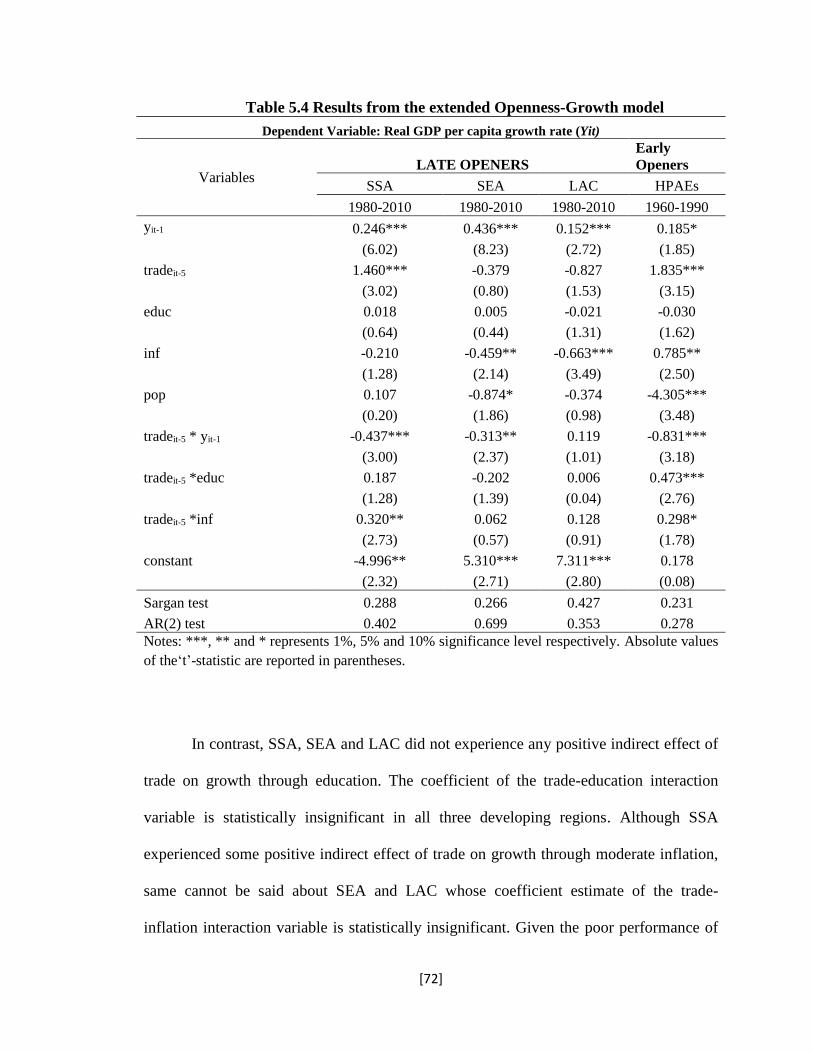
[72]
Table 5.4 Results from the extended Openness-Growth model
Dependent Variable: Real GDP per capita growth rate (Yit)
Variables LATE OPENERS
Early
Openers
SSA SEA LAC HPAEs
1980-2010 1980-2010 1980-2010 1960-1990
yit-1 0.246*** 0.436*** 0.152*** 0.185*
(6.02) (8.23) (2.72) (1.85)
tradeit-5 1.460*** -0.379 -0.827 1.835***
(3.02) (0.80) (1.53) (3.15)
educ 0.018 0.005 -0.021 -0.030
(0.64) (0.44) (1.31) (1.62)
inf -0.210 -0.459** -0.663*** 0.785**
(1.28) (2.14) (3.49) (2.50)
pop 0.107 -0.874* -0.374 -4.305***
(0.20) (1.86) (0.98) (3.48)
tradeit-5 * yit-1 -0.437*** -0.313** 0.119 -0.831***
(3.00) (2.37) (1.01) (3.18)
tradeit-5 *educ 0.187 -0.202 0.006 0.473***
(1.28) (1.39) (0.04) (2.76)
tradeit-5 *inf 0.320** 0.062 0.128 0.298*
(2.73) (0.57) (0.91) (1.78)
constant -4.996** 5.310*** 7.311*** 0.178
(2.32) (2.71) (2.80) (0.08)
Sargan test 0.288 0.266 0.427 0.231
AR(2) test 0.402 0.699 0.353 0.278
Notes: ***, ** and * represents 1%, 5% and 10% significance level respectively. Absolute values
of the‘t’-statistic are reported in parentheses.
In contrast, SSA, SEA and LAC did not experience any positive indirect effect of
trade on growth through education. The coefficient of the trade-education interaction
variable is statistically insignificant in all three developing regions. Although SSA
experienced some positive indirect effect of trade on growth through moderate inflation,
same cannot be said about SEA and LAC whose coefficient estimate of the trade-
inflation interaction variable is statistically insignificant. Given the poor performance of
[73]
the other developing countries in improving education, it is not surprising that none of
them experienced a positive indirect effect of openness on growth through education. In
effect, SSA, LAC and SEA have not been able to improve their educational system well
enough to become information imbibing and technologically oriented. This has led to
their inability to build their human capital well enough to harness the gains of trade
which include the adoption of advanced technologies and best practices from developed
trading partners.
The results presented in Table 5.4 reinforce the factors (improved education and
low-to-moderate inflation) identified as being some of the reasons for the trade benefit
differential recorded by the early and late openers. It therefore clarifies the seeming
puzzle of why the early openers recorded high and sustained growth when they opened
up to trade in a relatively less liberalized trade regime as against the relatively low and
sluggish growth experienced by the late openers who opened up later in a more
liberalized trade regime. First, the inability of SSA, LAC and SEA to exploit the gains
from opening up to their economies as the HPAEs did is a contributing factor to the
difference in openness effect on growth recorded by the two groups. As mentioned
earlier, the economic miracle experienced by the HPAEs has been partly attributed to
total factor productivity (TFP) growth and part of this growth in TFP has been attributed
to the adoption and implementation of international best practices and technological
know-how which comes along as a major gain from trading with developed countries.
However, it is worth noting that, the HPAEs were able to adopt and master these
international best practices and technology because they had well trained and highly
skilled domestic labour force. In essence, their trade strategies were complemented with
[74]
human capital development. While they opened up their economy, they also invested into
human capital development through broad-based educational policies. Hence, they were
able to adopt foreign knowledge and use imported capital to improve their economic
performance. As discussed in the previous section, education in most developing
countries have been insignificant or at best contributed less to economic growth.
Moreover, there exist persistent mismatch between skills acquired through the
educational system and the skills required by the job market. In effect, these economies
haven’t been able to develop their labour force well enough to take advantage of the
gains from trade. They have been inefficient in using imported capital and technology as
well as in implementing international best practices.
Second, in contrast to other developing economies, the HPAEs were successful at
attaining macroeconomic stability. While they opened up their external sector, the
HPAEs were successful at creating and sustaining low-to-moderate inflation rate relative
to the other developing countries. The HPAEs were not immune to high budget deficit
which characterizes most developing countries, but they were more efficient in keeping
their deficits within limits set by their ability to finance them without destabilizing their
macro-economy. Although Thailand and Malaysia’s budget deficits were above that of
the Philippines, Brazil, Argentina and Mexico in the 1980s, they were more successful at
financing their deficits without causing macroeconomic instability (Page, 1994). By
keeping public deficit within prudent financing bounds, the HPAEs were able to avoid
money creation-induced-inflation which has been a major affliction to most developing
countries, in trying to address their high debt ratios. Relative to the other developing
countries, money creation was constant among the HPAEs. Consequently, they
[75]
experienced low-to-moderate rates of inflation when they opened up their external sector.
This made their exports more attractive and generated increased world demand for their
exports which works towards the improvement of their current account and hence
increasing the contribution of trade to economic growth. On the contrary, the other
developing countries noted for high public deficits have not been able to escape the
macroeconomic consequence of high public sector deficit beyond prudent financing
limits. They have thus suffered relatively high inflation rates which makes their export
unattractive and less competitive on the international market. Although they have
benefited from a more liberal trade regime, their exports have been less competitive. In
effect, external sector openness has not been much beneficial to the other developing
countries as it was to the HPAEs due to high inflation rates in the economies of the other
developing countries.
The factors discussed above show that, what seems an anomaly, should not
actually be considered as such. This is because, although the other developing countries
have enjoyed free trade, they have failed to keep pace with global technological
advancement. The labour force in these regions has not been well developed enough to
exploit the transfer of technological know-how and managerial expertise that comes with
trading with developed countries. More so, these economies have been inefficient in
keeping public deficits in limits that ensures macroeconomic stability. Inflation in these
regions has thus been high, making their exports less competitive on the international
market. On the contrary, the HPAEs complemented their liberal trade policies with socio-
economic policies that placed them in the appropriate position to exploit every gain that
comes with opening up to multilateral trade. In effect, though they faced a relatively less
[76]
liberalized trade regime, they experienced higher openness gains in terms of growth in
GDP per capita due to their ability to maintain macroeconomic stability through low-to-
moderate inflation. They were also able to technologically catch-up with the developed
world by improving their educational system to produce well developed and skilled
human capital. With the technological know-how adopted from developed trading
countries, they were able to add value to their export by diversifying the composition of
their exports to include value-added goods. With these reasons, it is only normal that the
HPAEs benefited more than the other developing countries did when they each opened
up to trade in different trade regimes that tended to be even more favorable to the other
developing countries than it was to the HPAEs.
Openness is shown in this study to be beneficial to economic growth in
developing countries. There is therefore no reason for these countries to impose
economic exile on themselves through international trade protections and foreign
exchange controls. More so, the findings on the HPAEs’ openness-growth relationship
show that opening up is not enough to attain the level of accelerated growth desired in
developing countries. Although the conditionality clauses attached to the loans advanced
by the Bretton Woods institutions to developing countries have been criticized over their
effects on the social sector, the findings discussed above shows otherwise. It reinforces
the stabilization policies put forward by the IMF and the World Bank’s Structural
Adjustment Programs (SAPs) as the right principles required to accompany the
elimination of self-imposed economic exile in developing countries. As shown by the
HPAEs’ experience, there is the need for developing countries to adopt and efficiently
implement a coordinated set of mostly restrictive fiscal and monetary policies aimed at
[77]
reducing inflation, budget deficits and improving their balance of payments. Pursuing
greater hospitality to foreign investment and other structural adjustment policies such as
reallocation of public spending towards operations and maintenance, health, education,
and infrastructure are equally crucial in complementing openness to international trade to
yield the level of growth required in developing countries.
[78]
CHAPTER SIX
6.1 Summary and Conclusion
Some mainstream economists share the view that economic openness has significantly
accounted for the persisting growth differentials between developing countries over the
past three decades. It has therefore been the center piece of recent reforms and economic
policies in developing countries. The arguments in favor of openness are premised on a
number of reasons. Openness promotes efficient allocation of resources through
comparative advantage which forms the basis of international trade. It facilitates the
dissemination of knowledge, technological progress and managerial expertise. More so,
openness through trade encourages competition in domestic and international market
while expanding the market size available to domestic producers.
Some empirical studies suggest that outward oriented economies have
experienced better economic performance relative to inward oriented economies.
Development policies in developing countries have therefore entailed strategies geared
towards opening up the external sector of these countries. Nevertheless, mainstream
economists remain divided on the empirical growth effect of external sector openness.
While some point to minimal growth effect (Lee et al, 2004), others identify a
significantly positive effect (Sachs and Warner, 1995, Edwards, 1998). Others such as
Rodriguez and Rodrik (2000) have however cast doubts on the robustness of the
significant positive growth effect of openness. Even more interesting is the seeming
anomaly associated with the growth differential experienced by the early (HPAEs) and
late openers (other developing countries) when they opened up to trade. In a relatively
[79]
less liberalized trade regime, the HPAEs recorded higher gains from openness relative to
what the other developing countries experienced in a more liberalized trade regime. This
thesis contributes to the economic growth and external sector openness discussion by
empirically examining the growth-openness relationship in the context of a regional
analysis. Besides determining the direction of the effect of openness on economic growth,
this thesis also contributes to the openness-growth literature by examining and explaining
some factors that account for the difference between the gains from openness experienced
by the HPAEs and the other developing countries.
The empirical investigation led to some interesting findings. First, external sector
openness is positively related to the growth performance of some developing countries.
In SSA, openness as measured by FDI impacts the rate of real GDP per capita growth
positively and significantly. In LAC and SEA however, openness as measured by FDI
does not affect real GDP per capita. While openness to international trade has no
significant effect on real GDP per capita growth in LAC and SEA, it does have
significant effects in SSA countries. In SSA, openness as measured by trade is positively
related to real GDP per capita growth.
Among the three developing regions, SSA benefits most from openness measured
in terms of both trade and FDI. In SEA however, openness to trade is detrimental to
growth in higher income countries. In lower income countries, trade has no impact on
income growth. The HPAEs recorded more benefits from FDI relative to the other
developing countries. The group also recorded a higher positive effect of trade on growth
than recorded by SSA and more significant effect of trade than the effect recorded by
LAC and SEA. This implies that, the difference between the income growth experienced
[80]
by the HPAEs and the other developing countries can be explained by the difference in
the gains from openness. It is further shown that, the HPAEs did enough in terms of
complementing trade liberalizing policies with other socio-economic policies that
enabled them maximize the gains from opening up their external sector. SSA, LAC and
SEA on the other hand, have enjoyed periods of ‘free trade’ but have done little to benefit
fully from opening up to international trade. It is therefore not unusual that the HPAEs
performed better economically after opening up their external sector in a more restrictive
trade regime relative to how the other developing countries have performed after opening
up in a relatively less restricted trade regime. Though East Asia is known to have
recorded a high and sustained growth between the 1960s and 1990s, it is not surprising
that this performance was driven by the miraculous growth of the HPEAs. The results
generally imply that, opening up the external sector alone is not enough to yield high
positive effect on real income per capita of developing countries. Complementing
openness policies with socio-economic policies that ensure macroeconomic stability and
well developed human capital is equally very necessary.
The results also show that, the growth effect of openness could be dependent on
the level of growth attained by a given country. It is shown that there is an additional
effect of openness on real GDP per capita growth through the level of economic growth
in a region. The effect however differs over the regions. In LAC, the trade effect on real
per capita income growth of countries is independent of their initial income level. In SEA
and SSA, openness to international trade translates into lesser growth in real GDP per
capita of relatively richer countries than poorer ones. This tends to accelerate
convergence within the regions. Coupled with the degree of openness, the level of
[81]
economic performance attained by developing countries plays a role in determining the
level of growth benefit obtained from external sector openness.
6.2. Policy Recommendations
The empirical results suggest that external sector openness contributes positively to the
growth of real per capita income as seen in SSA. Hence openness could be good for
developing countries. This is shown by the positive and significant effect of openness as
measured by FDI on real GDP per capita growth in Sub-Saharan Africa and in the High
Performing Asian Economies. Openness as measured by trade also positively and
significantly affects real income per capita growth in the HPAEs and SSA countries. This
thesis recommends that, developing countries need not impose economic exile on
themselves but instead engage in multilateral trade with the rest of the world. More so,
the HPAEs’ orientation to opening up to the international market provides developing
countries with a range of policy frameworks. Equal attention should be given to
macroeconomic policies directed at stabilizing the economy, which entails addressing the
persistent rise in general price levels, effective management of budget deficits, which is
very typical of developing countries and precisely, pursuing policies that limit deficits
within levels that can be financed without destabilizing the macro-economy.
Inasmuch as developing countries seek to take advantage of the larger world
market, it is important that they implement socio-economic policies geared towards
human capital development. We propose that, governments should adopt and promote
social policies that aim at investing into human capital development in terms of education
[82]
and health especially among the poor. This will help build human capital which in the
long run enhances the ability of the labour force to adopt and implement advanced
technological know-how and international best practices that come along with trading
with more advanced economies. This eventually leads to an improvement in total factor
productivity which is equally a critical source of economic growth. These policy
recommendations tend to reinforce the principles that should accompany openness-based
policies in developing countries as proposed by the World Bank and IMF through the
Structural Adjustment Programs (SAPs) and Stabilization policies.
[83]
REFERENCES
Amadou, A. 2013. Is there a causal relation between trade openness and economic
growth in the WAEMU countries? International Journal of Economics and Finance 5
(6): 151 – 157.
Arellano, M. and O. Bover. 1995. Another look at the Instrumental-Variable Estimation
of Error-Components Models. Journal of Econometrics 68 (1): 29-51.
Arellano, M. and S. Bond. 1991. Some tests of specification for panel data: Monte Carlo
evidence and an application to employment equation. Review of Economic Studies 58:
277-297.
Balassa, B. and Associates. 1978. Exports and economic growth: Further evidence.
Journal of Development Economics 5:181-89
Baldwin, E.R. 2004. Openness and Growth: What's the empirical relationship? Challenge
to Globalization: Analyzing the Economics. Chicago: University of Chicago Press. 499-
521.
Beck, N. and J. N. Katz. 2009. Modeling Dynamics in Time-Series-Cross-Section
Political Economy Data. Social Science Working Paper 1304. Division of the Humanities
and Social Sciences, California Institute of Technology, Pasadena, California.
Blundell, R. and S. Bond. 1998. Initial conditions and moment restrictions in dynamic
panel data models. Journal of Econometrics 87 (1): 115-143.
Bussmann, M., I. de Soysa and J.R. Oneal. 2002. The Effect of Foreign Investment on
Economic Development and Income Inequality. ZEF-Discussion Papers on Development
Poilicy Number 53. Bonn: Center for Development Research, University of Bonn.
Calderon, C., P. Fajnzylber and K. Schmidt-Hebbel. 2004b. External conditions and
growth performance. Working Paper #292, Central Bank of Chile, Central Bank of Chile.
Calderon, C., P. Fajnzylber and N. Loayza. 2004. Economic growth in Latin America and
the Caribbean: stylized facts, explanations, and forecasts. Working Paper #265, Central
Bank of Chile, Central Bank of Chile.
Caselli, F., G. Esquivel and F. Lefort. 1996. Reopening the Convergence Debate: Anew
look at cross-country Growth Empirics. Journal of Economic Growth 1(3):363-89.
Chang, C. and M. Mendy. 2012. Economic growth and openness in Africa: What is the
empirical relationship? Applied Economics Letters 19 (128) : 1903-1907
Chang, R., L. Kaltani and N. Loayza. 2009. Openness can be good for growth: The role
of policy complementarities. Journal of Development Economics 90 (1) : 33-49.
Chen, B. 1999. Trade Openness and Economic Growth: Evidence in East Asia and Latin
America. Journal of Economic Integration 14 (2) : 265-295.
[84]
Darku, A. B. 2011. The impact of trade liberalization and the fiscal equalization transfer
policy on provincial income disparities in Canada: an application of GMM estimation.
Applied Economics 43(13): 1679 – 1689.
Daumal, M. and S. Özyurt. 2011. The impact of International Trade Flows on Economic
Growth in Brazilian States. Review of Economics and Institutions 2 (1):1-25.
De Soysa, I. and J.R. Oneal. 1999. Boon or Bane? Reassessing the productivity of
Foreign Direct Investment. American Sociological Review 64 (1): 766-782.
Dollar, D. and A. Kraay. 2004. Trade, Growth and Poverty. The Economic Journal 114
(493): F22–F49.
Edwards, S. 1993. Openness, trade liberalization, and growth in developing countries.
Journal of Economic Literature 31(3): 1358-93.
Edwards, S. 1998. Openness, productivity, and growth: What do we really know?
Economic Journal 108 (447): 383-98
Eris, M. N. and B. Ulasan. 2013. Trade openness and economic growth: Bayesian model
averaging estimate of cross-country growth regressions. Economic Modelling 33: 867–
883.
Firebaugh, G. 1992. Growth effects of Foreign and Domestic Investment. American
Journal of Sociology 98 (1): 105-30
Foroutan, F. and L. Pritchett. 1993. Intra-Sub Saharan African Trade: Is it too little?
Journal of African Economies 2 (1): 74-105
Frankel, J.A. and D. Romer. 1999. Does trade cause growth? American Economic Review
89 (3):279-99.
Fu, X. 2004. Limited Linkages from Growth Engines and Regional Disparities in China.
Journal of Comparative Economics 32 (1): 148-164.
Goldberg, P., A. Khandelwal, N. Pavcnik and P. Topalova. 2010. Imported
intermediated inputs and domestic product growth: Evidence from India. The Quarterly
Journal of Economics 125 (4) : 1727-1767.
Hamilton, A. 1913. Report on manufactures (1791). Rep., U.S Senate Documents, XXII,
no. 172
Hansen, H. and S. Rand. 2004. On the causal links between FDI and growth in
developing countries. Discussion paper number 04-30. Institute of Economics,
University of Copenhagen. Development Economics Research Group (DERG),
Copenhagen, Denmark.
Harrison, Ann and Gordon Hanson. 1999. Who gains from trade reform? Some
remaining puzzles. NBER Working Papers 6915, January.
[85]
Jalles, T. J. 2012. Openness, Regional Trade Agreements and Growth: Evidence from
Asia. Asian Economic Journal 26 (1) : 63–85.
Jouini, J. 2015. Linkage between international trade and economic growth in GCC
countries: Empirical evidence from PMG estimation approach. The Journal of
International Trade & Economic Development: An International and Comparative
Review. 6 (3): 341-372.
Kakar, K.Z. and B.A. Khilji. 2011. Impact of FDI and Trade Openness on Economic
Growth: A Comparative Study of Pakistan and Malaysia. Theoretical and Applied
Economics 18 (11) : 53-58.
Kessides, I. N. 1991. Lessons of experience in developing world. Oxford: Basil
Blackwell.
Krueger, A.O. 1978. Foreign trade regimes and economic development: Liberalization
attempts and consequences. Cambridge, Mass. Ballinger Publishing Co. for National
Bureau of Economic Research.
Liu, G. S., L. Xiaming and W. Yingqi. 2005. Openness and Efficiency of Malaysia, India
and China Relative to the World Economy: A Comparative Study. Malaysian Journal of
Economic Studies 42 (1-2) : 41-61.
Martin, W. (2001). Trade policies, developing countries, and globalization. World Bank,
Washington, DC.
Mercan, M., I. Gocer , S. Bulut and M. Dam. 2013. The effect of openness on economic
growth for BRIC-T Countries: Panel Data Analysis. Eurasian Journal of Business and
Economics 6 (11): 1-14.
Myinth, H. 1958. The classical theory of International Trade and the underdeveloped
countries. Economic Journal 68 (270):317-337.
Page, J. 1994. The East Asian Miracle: Four lessons for development policy. National
Bureau of Economic Research 9: 219-282.
Roemer, M. and M.K. Gugerty. 1997. Does Economic Growth Reduce Poverty?
Consulting Assistance on Economic Reform (CAER) II Discussion Paper No. 4.
Cambridge: Harvard Institute for International Development.
Rana, P.B. 2006. Economic Integration in East Asia: Trends, prospects and a possible
roadmap. Working paper. Series on Regional Economic Integration. Office of Regional
Economic Integration, Asian Development Bank.
Rodrik, Dani. 1999. The New Global Economy and Developing Countries: Making
Openness Work. Washington, DC. Overseas Development Council.
Sachs, J.D., and A. Warner. 1995. Economic Reform and the Process of Global
Integration. Brookings Paper on Economic Activity. 1995(1): 1-118.
[86]
Tekin, R. B. 2012. Development aid, openness to trade and economic growth in Least
Developed Countries: bootstrap panel Granger causality analysis. Procedia - Social and
Behavioral Sciences 62: 716 – 721.
Thirlwall, A. 1979. Balance of Payments constraint as an Explanation of International
Growth Rate differences. Banca Nazionale del Lavoro Quarterly Review. 128(1): 45-53.
Timeline: World Trade Organization - A chronology of key events. BBC News
http://news.bbc.co.uk/2/hi/europe/country_profiles/2430089.stm Accessed October 10,
2014.
Ulaşan, B. 2015. Trade openness and economic growth: panel evidence. Applied
Economics Letters 22 (2): 163–167.
Venables, A. J. 2003. Winners and losers from regional integration agreements.
Economic Journal 113 (1): 747-61.
Winters, L. A. and A. Masters. 2013. Openness and growth: still an open question?
Journal of International Development 25: 1061–1070.
Young, A. 1991. Learning by doing and the dynamic effects of international trade.
Quarterly Journal of Economics 106 (2): 369-405.
Zeren, F. and A. Ari. 2013. Trade openness and economic growth: A panel causality test.
International Journal of Business and Social Science 4 (9): 317 -324.
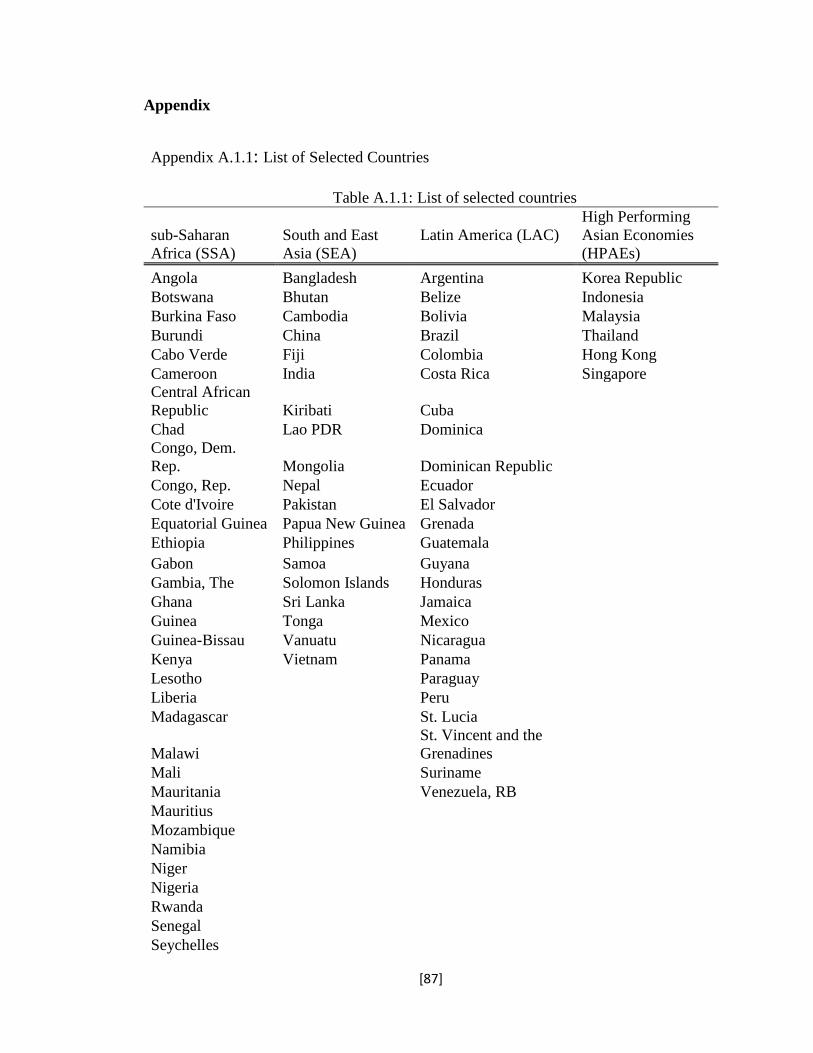
[87]
Appendix
Appendix A.1.1: List of Selected Countries
Table A.1.1: List of selected countries
sub-Saharan
Africa (SSA)
South and East
Asia (SEA)
Latin America (LAC)
High Performing
Asian Economies
(HPAEs)
Angola Bangladesh Argentina Korea Republic
Botswana Bhutan Belize Indonesia
Burkina Faso Cambodia Bolivia Malaysia
Burundi China Brazil Thailand
Cabo Verde Fiji Colombia Hong Kong
Cameroon India Costa Rica Singapore
Central African
Republic Kiribati Cuba Chad Lao PDR Dominica Congo, Dem.
Rep. Mongolia Dominican Republic Congo, Rep. Nepal Ecuador Cote d'Ivoire Pakistan El Salvador Equatorial Guinea Papua New Guinea Grenada Ethiopia Philippines Guatemala Gabon Samoa Guyana Gambia, The Solomon Islands Honduras Ghana Sri Lanka Jamaica Guinea Tonga Mexico Guinea-Bissau Vanuatu Nicaragua Kenya Vietnam Panama Lesotho
Paraguay Liberia
Peru Madagascar
St. Lucia
Malawi
St. Vincent and the
Grenadines Mali
Suriname Mauritania
Venezuela, RB Mauritius
Mozambique Namibia Niger Nigeria Rwanda Senegal Seychelles

[88]
Sierra Leone South Africa Sudan Swaziland Togo Uganda Zambia Zimbabwe