Embed Size (px)
DESCRIPTION
Published by the University of Arkansas - Fort Smith College of Business and sponsored by Arvest Bank
Citation preview
Col
lege
of
Bus
ines
sCENTER
4th Quarter, 2012
UAFS.eduVol. 3, Num. 4
Fort SmithREGIONAL
Economic OutlookReport Sponsored by Arvest Bank
FOR BUSINESS RESEARCH AND ECONOMIC DEVELOPMENT
Sponsored by Arvest Bank Fort Smith Regional Economic Outlook, 4th Quarter, 2012
UNIVERSITY OF ARKANSAS - FORT SMITH COLLEGE OF BUSINESS
The Fort Smith Regional Economic Outlook Report is published quarterly by the College of Business and the Center for Business Research and Economic Development (CBRED). Subscriptions are available for $25 per year.
For more information, please visit us on the web at uafs.edu/cob/cbred, or contact us at:
Center for Business Research and Economic DevelopmentUAFS College of Business5210 Grand Avenue, BI 218P.O. Box 3649Fort Smith, AR 72913-3649
Phone: 479-788-7938Fax: 479-424-6938E-mail: [email protected]
The Center for Business Research and Economic Development seeks to be the primary source of Fort Smith regional economic information; a catalyst for bold, innovative ideas and strategies for economic development in the area; and an active partner in the execution of sound, integrative solutions for regional prosperity and health.
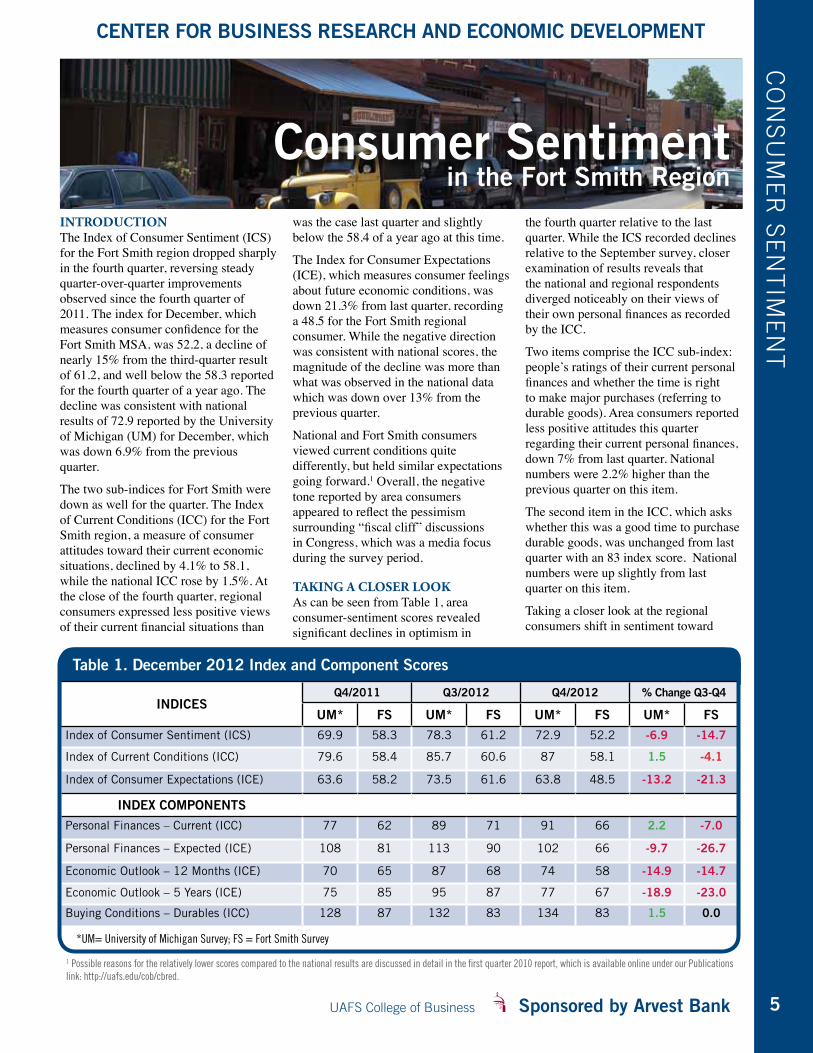
Cover image: The Fort Chaffee Barbershop Museum located in Fort Smith, AR, where Elvis received his GI haircut in 1958 when he entered the Army.
Vol. 3, Num. 4 4th Quarter, 2012
From the Director ........................................ 1
Fourth Quarter Summary of Regional Economy .............................. 2–4
Consumer Sentiment in the Fort Smith Region ..............................5–9
Health Care: Challenges and Prospects...................................... 10–16
Sponsors .................................................. 17
uafs.edu/cob/cbred
Upcoming EventsFort Smith Regional Economic Outlook Forumsponsored by Arvest Bank
Presenters include Dr. Kermit Kuehn, Director, CBRED, and Mr. Kevin L. Kliesen, Business Economist and Research Officer,Federal Reserve Bank of St. Louis
Wednesday, July 10, 201311:30 a.m. — 1:00 p.m.Smith-Pendergraft Campus Center (Reynolds Room)
UAFS College of Business Sponsored by Arvest Bank 1
FOR BUSINESS RESEARCH AND ECONOMIC DEVELOPMENT
As we wrap up this issue of the Fort Smith Regional Economic Outlook Report, there seems to be a strange calm presiding over the economic landscape. Perhaps too calm. Markets continue to move higher even as corporate performance comes in plenty soft for last quarter, jobs growth remains squishy, and Washington continues to avoid the tough issues of budgets and debts. I have a feeling that things will have changed between now and when this publication comes out a month from now.
Yet, regardless of the ebbs and flows of markets, there is a broad human expectation, call it hope, that tomorrow will be a better day, and that we can do something about our tomorrows. That’s really what economic development is all about —creating our tomorrow.
In the previous two issues of this report we took a first look at the regional economy in terms of jobs, compensation, and output, using data from 2007 and 2010—a kind of pre- and post-recession snapshot. Our discussions centered around research conducted by my colleague and research associate in CBRED, Dr. Latisha Settlage. There is much more that is being done in this regard, but for our purposes in this issue we take a closer look at one of the sectors we highlighted from this research—health care.
Specifically, we look at the sector from the perspective of occupational classifications, the jobs and salaries contained in these positions. We compare head count in these occupations relative to their proportion nationally using a term “location quotient.” We then look at estimated growth of jobs in the sector, concluding with some observations regarding the sector as to future challenges and prospects for jobs.
Changing gears a bit, let’s briefly review what’s been happening in the economy since our last report.
Regionally there has been some good news since our last report, but overall the last quarter of 2012 was generally weak. On the one hand we had some positive announcements as to expansions, such as Walther/Umarex and the proposed transition of the 188th to another mission. Moreover, several months of year-over-year positive numbers in manufacturing suggest the sector has some legs.
Yet, the workforce numbers just don’t add up to a winning formula for sustainable economic growth in the region. The civilian labor force continues to decline, which means more and more people are not even looking for a job. Further, the number of people employed has declined as well, which tells me that there’s just not much lift potential in this economy— at least from the consumer side.
While the election is well behind us now, the story line is much the same as before the election. It appears that positive action in terms of national policy remains more a hope than a realistic prospect—I hope I’m wrong on this one. We do have front-row seats, so we’ll know soon enough.
In this report, we make our regular review of the performance of the Fort Smith area economy for the period. It wasn’t one of our stronger quarters, that’s for certain. Housing permits were up, but home sales were lower for the fourth quarter. Retail sales were lower and auto sales were higher. The jobs picture weakened some as well. Our survey of Fort Smith consumer sentiment for December dropped significantly from last quarter. And, as discussed earlier, the final section examines the health care subsector of our economy.
Arvest continues to support our efforts here in CBRED. Their commitment to what we do, along with our advertisers and subscribers, make our work possible. We truly are partners in a common cause of making the Fort Smith region the best it can possibly be.
To our future,
From
the
Dire
ctor
CENTER
Kermit W. Kuehn, Ph.D.Director, Center for Business Research and Economic Development
FR
OM
th
E D
iRE
Ct
OR
Sponsored by Arvest Bank Fort Smith Regional Economic Outlook, 4th Quarter, 2012
UNIVERSITY OF ARKANSAS - FORT SMITH COLLEGE OF BUSINESS
2
The fourth quarter performance of the Fort Smith regional economy showed broad weakness relative to the same period in 2011. Only two of the six main performance indicators were positive for the quarter. Retails sales for September-November were weaker, as were fourth-quarter home sales, overall jobs numbers, and airport passenger traffic. Even the unemployment rate rose.
Auto sales and residential construction permits for the quarter were markedly higher in the MSA compared to a year ago. The most recent economic activity index for the Fort Smith region was for October and was estimated at 91, down from the 92.1 reading for the same period in 2011.
Area auto sales continued to show solid month-over-month growth in 2012, resulting in sales up 6.2% for the quarter. Unit sales were up as well with 7,002 new and used autos sold in the quarter, a three-percent increase from
the number of units sold during the same quarter of 2011. Recall that auto data is only available for Sebastian, Crawford and Franklin counties of Arkansas.
New car units sold in the fourth quarter made up 19% of total units sold in the quarter, up slightly from the 18% five-year average. New car sales totaled 1,335 units for the quarter.
Retail sales posted a year-over-year decline for the quarter, down 2.8% for the three-month period ending November 30, the most recent data available. Consumer spending has continued to trail 2011 in three of the previous monthly readings, suggesting that when December results come in we’ll see a year-over-year decline relative to 2011. U.S. retail sales activity appeared to be weak during the close of December, suggesting a weaker number for the Fort Smith region is possible.
Overall, the regional consumer appears to have slowed down in the last quarter of 2012 in terms of general consumption. Sentiment moved lower in that last quarter as well.
Auto sales continue to hold up well, however, suggesting pent up demand remains solid. Sustainability of demand continues to be a question, particularly in light of the discontinuation of the two percent social-security tax ‘holiday’ of the past two years. The impact of increased taxes combined with continuing weakness in the overall job market in the region suggests weaker consumption going forward. See our full discussion of consumer sentiment in the next section.
The residential real estate sector continued to give mixed signals relative to the fourth quarter of a year ago. Residential construction improved markedly again for the quarter with new permit totals up 72% from last year.
Fourth Quarter Summary of Regional Economy
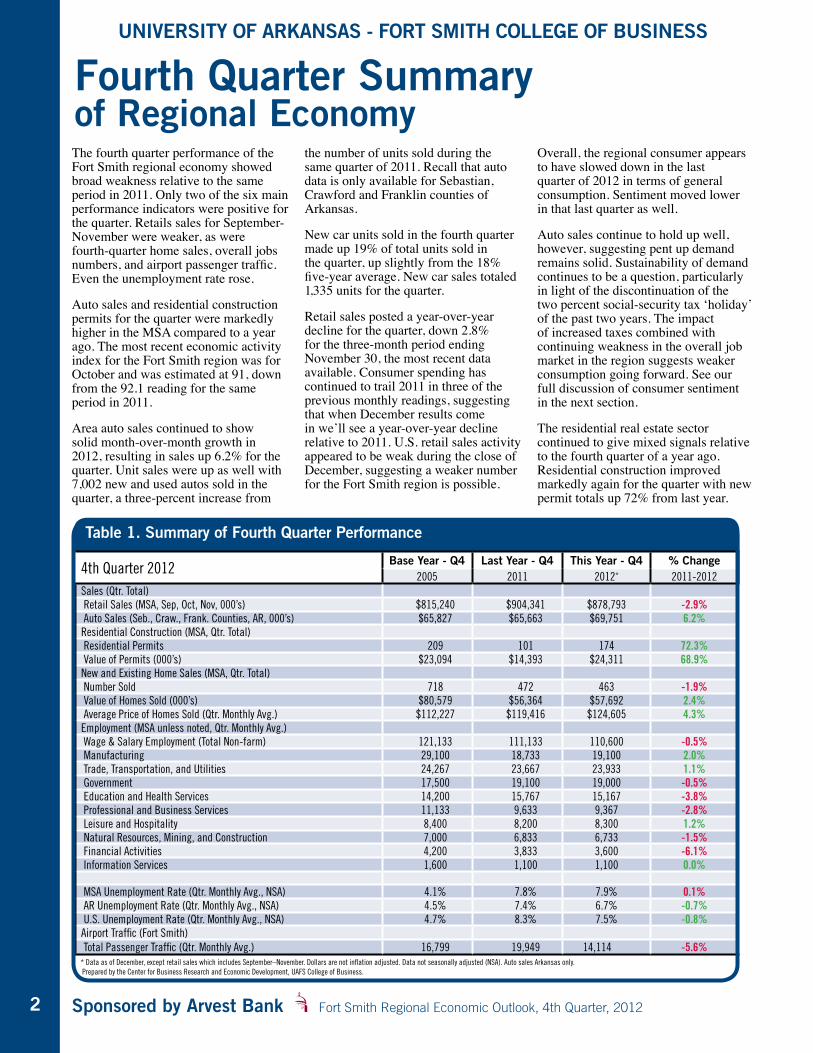
Table 1. Summary of Fourth Quarter Performance
4th Quarter 2012 Base Year - Q4 Last Year - Q4 This Year - Q4 % Change2005 2011 2012* 2011-2012
Sales (Qtr. Total) Retail Sales (MSA, Sep, Oct, Nov, 000’s) $815,240 $904,341 $878,793 -2.9% Auto Sales (Seb., Craw., Frank. Counties, AR, 000’s) $65,827 $65,663 $69,751 6.2%Residential Construction (MSA, Qtr. Total) Residential Permits 209 101 174 72.3% Value of Permits (000’s) $23,094 $14,393 $24,311 68.9%New and Existing Home Sales (MSA, Qtr. Total) Number Sold 718 472 463 -1.9% Value of Homes Sold (000’s) $80,579 $56,364 $57,692 2.4% Average Price of Homes Sold (Qtr. Monthly Avg.) $112,227 $119,416 $124,605 4.3%Employment (MSA unless noted, Qtr. Monthly Avg.) Wage & Salary Employment (Total Non-farm) 121,133 111,133 110,600 -0.5% Manufacturing 29,100 18,733 19,100 2.0% Trade, Transportation, and Utilities 24,267 23,667 23,933 1.1% Government 17,500 19,100 19,000 -0.5% Education and Health Services 14,200 15,767 15,167 -3.8% Professional and Business Services 11,133 9,633 9,367 -2.8% Leisure and Hospitality 8,400 8,200 8,300 1.2% Natural Resources, Mining, and Construction 7,000 6,833 6,733 -1.5% Financial Activities 4,200 3,833 3,600 -6.1% Information Services 1,600 1,100 1,100 0.0%
MSA Unemployment Rate (Qtr. Monthly Avg., NSA) 4.1% 7.8% 7.9% 0.1% AR Unemployment Rate (Qtr. Monthly Avg., NSA) 4.5% 7.4% 6.7% -0.7% U.S. Unemployment Rate (Qtr. Monthly Avg., NSA) 4.7% 8.3% 7.5% -0.8%Airport Traffic (Fort Smith) Total Passenger Traffic (Qtr. Monthly Avg.) 16,799 19,949 14,114 -5.6%* Data as of December, except retail sales which includes September–November. Dollars are not inflation adjusted. Data not seasonally adjusted (NSA). Auto sales Arkansas only. Prepared by the Center for Business Research and Economic Development, UAFS College of Business.
UAFS College of Business Sponsored by Arvest Bank
CENTER FOR BUSINESS RESEARCH AND ECONOMIC DEVELOPMENT
3
SU
MM
AR
y O
F R
Eg
iOn
AL E
CO
nO
My
The 174 permits issued was still well off the 209 units issued in 2005 for the same period, but is a marked improvement over last year at this time.
Home sales, on the other hand, were down for the quarter, off nearly two percent from 2011. Based on MLS data, 463 units were sold. The results suggest that, while activity has slowed, it does appear to have formed a bottom. The sector continues to chug along, but sales are significantly below the 718 units sold during the 2005 base year. The average price of the homes sold was nearly $5,000 higher than 2011, suggesting that relatively higher priced property was moving in 2012 than was the case a year ago.
The underlying dynamics of the sector remain largely the same as they have been for the past couple of years. We’re well past sounding like a broken record here. Interest rates have begun to rise some in recent weeks, but continue near record lows. Inventory levels appear to be sufficient in most price ranges and home prices remain largely in the buyer’s favor. Qualifying for mortgages remains difficult. The amount of paperwork required to complete a mortgage loan application can be intimidating.
The regional jobs picture continues its ragged performance, based on recent Bureau of Labor Statistics (BLS) data. Total non-farm employment declined .5% for the quarter, following declines in both the second and third quarters. Based on the monthly average of total MSA employment for the fourth quarter, there were over 500 fewer jobs in the region than there were a year ago. This is a significant improvement from recent quarters, but still an indication that the region struggles to generate consistent net-positive job growth.
Taking a closer look at specific sectors, we find that manufacturing (+367), trade, transportation and utilities (+266), and leisure and hospitality (+100) added jobs for the quarter, while the top three losers by headcount were in education and health services (-600), business and professional services (-266), and financial services (-233).
The unemployment rate rose relative to a year ago. The 7.9% average unemployment rate for the MSA for the fourth quarter was a tenth higher than a year ago.
According to BLS data, there were 4,089 fewer people in the Fort Smith MSA labor force in December 2012 than there were in 2011. There were also 3,929 fewer people working in the MSA during the period. The net result was that the number of unemployed in the region was estimated to include 10,182 people, a decline of 160 people from a year ago. Recall that the unemployment rate is calculated by dividing the number of unemployed by the total civilian labor force.
As is always the case, data are preliminary estimates and are likely to change month-by-month and then change again annually. The annual revisions by the BLS should be out by the time this report comes out.
Finally, average monthly airport traffic counts for the quarter have been dropping in recent months. Total passenger traffic for the fourth quarter was down 5.6% from last year. Annual traffic, however, closed out 2012 up about one percent from 2011.
Summary and analySiSAt the writing of this report (second week of February), stock markets have moved within sight of record highs, even though corporate reporting for the quarter was anything but exciting—and guidance as to expectations for the first quarter of 2013 was generally weak. After an impressive move near new highs to start 2013, markets appear unsure as to why they are this high.
Overall, the tone is cautious, though it appears few investors wish to sit on the sidelines for fear of missing something. A stock market correction has been expected for weeks, but none has shown up yet. Federal policy continues to keep rates low, causing more and more people to look for returns in worse and worse places. Reminds one of a phrase in a once popular song “looking for love in all the wrong places,” where investors assuming more and more risk to get less and less return—this story will not end well.
Home prices have turned higher in the past few months and homebuilders are reporting favorable activity in new-home demand. Nationally, commercial builders have little good news to report. Added to this, national retailers reported a mixed bag of results for year end and jobs data suggest hiring continues to limp along in the right direction. In sum, broad economic performance of the U.S.
“You’re kidding?I thought we were covered.”
BusinessInsuranceSOLUTIONS
PropertyGeneral Liability
Business AutoWorkers Comp
UmbrellaContractors Insurance
Surety Bonds
www.bhca.com5500 Euper Lane - Fort Smith
(479) 452-40001626 Empire Street - Lowell
(479) 878-1896
Sponsored by Arvest Bank Fort Smith Regional Economic Outlook, 4th Quarter, 2012
UNIVERSITY OF ARKANSAS - FORT SMITH COLLEGE OF BUSINESS
4
economy indicates that we continue on a slow-growth path for the time being.
Europe remains largely off the media radar, though there is nothing there to cheer about. Overall, the continent is in a recession, budget and debt issues remain unsolved, and this all suggests that this part of the world could visit our headlines at any inopportune moment.
On the monetary side in the U.S., the Federal Reserve last week affirmed its commitment to its generous credit policy. However, treasuries have begun to show weakness in recent weeks as have mortgage interest rates, suggesting that rates may continue moving higher in 2013. While there is some talk that the Fed will begin to take its foot off the gas by the latter part of 2013, the current easy-money policy will likely be in place well into 2014 and beyond at the rate we’re going as an economy.
On the fiscal side, Congress and the President pushed through an early 2013 tax bill, but deferred the cost-cutting portion of the fiscal cliff until March. The automatic cost cuts (referred to as “sequester”) are getting little actual discussion to date, but there’s two weeks left before the next crisis is upon us. So, there’s plenty of time for more drama to manifest itself. Should these cuts actually take effect, combined with the reinstatement of the two-percent payroll tax, the drag on the economy will likely be quite noticeable—and appear quickly.
Checking some other indicators, national manufacturing (PMI) and non-manufacturing (NMI) numbers for January, the most recent data reported by the Institute for Supply Management, were both higher than the October readings reported last quarter. The PMI (for manufacturers) recorded a 53.1 for January, up from the 51.7 in October we reported in our last report. This indicates the manufacturing sector continues to expand.
The NMI, which includes such sectors as professional services, information, wholesale and retail trade, came in at 55.2. This compares with an October reading of 54.2, which we reported last time. Index scores that trend above 50 are interpreted as a growth mode for the sector.
The December results from the Manpower Group’s Employment Outlook Survey found that Arkansas employers’ hiring intentions for the first quarter of 2013 were down from last quarter, with 10% of employers indicating they intended to hire more people in the first quarter, down from 15% in the previous survey. Five percent indicated they planned to decrease payrolls for the first quarter, down from eight percent who indicated this in the previous report. This results in a net positive of five percent for the quarter and reflects a moderately positive prospect toward first quarter hiring.
No report specific to the Fort Smith MSA was available.
_____________
So how will the Fort Smith regional economy perform as we move through the first half of 2013? Two events on the national calendar over the coming weeks have the potential to rattle markets and consumer sentiment—sequester discussions between now and March 1st and debt ceiling discussions by May 18th. These issues have the potential to further sour consumer sentiment through the first quarter, as well as corporate investment decisions—whether investing in hard assets or in hiring.
Regional sentiment took a sharp downward turn in the fourth quarter and retail sales have been showing weakness year-over-year in recent months. We can expect that the expiration of the two-percent payroll tax holiday will put downward pressure on consumption in the coming months.
On the positive side, the possibility of the 188th Fighter Wing maintaining head counts, even expanding over time, is a nice piece of news for the region, as is the Walther Arms/Umarex expansion. Further, based on the surge in housing permits being issued in the past two months, we might expect to see some upside in residential construction in 2013. Where’s this all going? I’m not sure.
But, we are moving into the spring season, so a mix of rain and sunshine is to be expected.
UAFS College of Business Sponsored by Arvest Bank
CENTER FOR BUSINESS RESEARCH AND ECONOMIC DEVELOPMENT
5
introductionThe Index of Consumer Sentiment (ICS) for the Fort Smith region dropped sharply in the fourth quarter, reversing steady quarter-over-quarter improvements observed since the fourth quarter of 2011. The index for December, which measures consumer confidence for the Fort Smith MSA, was 52.2, a decline of nearly 15% from the third-quarter result of 61.2, and well below the 58.3 reported for the fourth quarter of a year ago. The decline was consistent with national results of 72.9 reported by the University of Michigan (UM) for December, which was down 6.9% from the previous quarter.
The two sub-indices for Fort Smith were down as well for the quarter. The Index of Current Conditions (ICC) for the Fort Smith region, a measure of consumer attitudes toward their current economic situations, declined by 4.1% to 58.1, while the national ICC rose by 1.5%. At the close of the fourth quarter, regional consumers expressed less positive views of their current financial situations than
was the case last quarter and slightly below the 58.4 of a year ago at this time.
The Index for Consumer Expectations (ICE), which measures consumer feelings about future economic conditions, was down 21.3% from last quarter, recording a 48.5 for the Fort Smith regional consumer. While the negative direction was consistent with national scores, the magnitude of the decline was more than what was observed in the national data which was down over 13% from the previous quarter.
National and Fort Smith consumers viewed current conditions quite differently, but held similar expectations going forward.1 Overall, the negative tone reported by area consumers appeared to reflect the pessimism surrounding “fiscal cliff” discussions in Congress, which was a media focus during the survey period.
taking a cloSer lookAs can be seen from Table 1, area consumer-sentiment scores revealed significant declines in optimism in
the fourth quarter relative to the last quarter. While the ICS recorded declines relative to the September survey, closer examination of results reveals that the national and regional respondents diverged noticeably on their views of their own personal finances as recorded by the ICC.
Two items comprise the ICC sub-index: people’s ratings of their current personal finances and whether the time is right to make major purchases (referring to durable goods). Area consumers reported less positive attitudes this quarter regarding their current personal finances, down 7% from last quarter. National numbers were 2.2% higher than the previous quarter on this item.
The second item in the ICC, which asks whether this was a good time to purchase durable goods, was unchanged from last quarter with an 83 index score. National numbers were up slightly from last quarter on this item.
Taking a closer look at the regional consumers shift in sentiment toward
Consumer Sentiment in the Fort Smith Region
Table 1. December 2012 Index and Component Scores
*UM= University of Michigan Survey; FS = Fort Smith Survey
CO
nS
UM
ER
SE
nt
iME
nt
1 Possible reasons for the relatively lower scores compared to the national results are discussed in detail in the first quarter 2010 report, which is available online under our Publications link: http://uafs.edu/cob/cbred.
INDICESQ4/2011 Q3/2012 Q4/2012 % Change Q3-Q4
UM* FS UM* FS UM* FS UM* FS
Index of Consumer Sentiment (ICS) 69.9 58.3 78.3 61.2 72.9 52.2 -6.9 -14.7
Index of Current Conditions (ICC) 79.6 58.4 85.7 60.6 87 58.1 1.5 -4.1
Index of Consumer Expectations (ICE) 63.6 58.2 73.5 61.6 63.8 48.5 -13.2 -21.3
INDEx COMPONENTS
Personal Finances – Current (ICC) 77 62 89 71 91 66 2.2 -7.0
Personal Finances – Expected (ICE) 108 81 113 90 102 66 -9.7 -26.7
Economic Outlook – 12 Months (ICE) 70 65 87 68 74 58 -14.9 -14.7
Economic Outlook – 5 Years (ICE) 75 85 95 87 77 67 -18.9 -23.0
Buying Conditions – Durables (ICC) 128 87 132 83 134 83 1.5 0.0
Sponsored by Arvest Bank Fort Smith Regional Economic Outlook, 4th Quarter, 2012
UNIVERSITY OF ARKANSAS - FORT SMITH COLLEGE OF BUSINESS
6
their personal finances, we find that 11% indicated they were financially better off than they were a year ago, down from 16% for last quarter. Forty-five percent of current respondents indicated they were worse off than a year ago, the same percentage who indicated this last quarter.
These differences in perceptions by respondents of their current personal finances accounted for a good portion of divergent ICC index scores observed between national and regional data, and significantly impacted the overall index (ICS) for the period.
The ICE consists of three items and seeks to measure consumer expectations going forward in areas of personal finances and national economic prospects. As to personal finances over the next twelve months, there was significantly less optimism reported, with scores 26.7% lower than last quarter (90 to 66). National results were down 9.7% for this item. In percentage terms, 13% of respondents in the Fort Smith area felt their personal finances would be better off a year from now versus 48% who expected them to be worse.
When asked about prospects for the general economy over the next 12 months and over the next five years, Fort Smith area respondents reported less optimism for both short- and medium-term prospects of the U.S. economy. Area consumer scores registered a 14.7% decline relative to last quarter when respondents were asked about prospects for the economy over the next 12 months
(68 to 58). National scores were down nearly 15% from the September survey.
When looking at the five-year range, area respondents again reported significantly less optimism than last quarter with scores down 23% (87 to 67) relative to last quarter. National scores were down nearly 19% from last quarter on this item.
To summarize the results to this point, regional consumer sentiment eroded noticeably in the fourth quarter, particular in their views of future expectations for the national economy. With the exception of the item on personal finances, which was unchanged, all item scores were lower than last quarter.
reSultS Specific to the fort Smith economyFor each quarterly survey, we modify two items in the UM scale to focus participants on the Fort Smith regional economy versus the national economy. These two items ask respondents to rate their expectations about business conditions in the Fort Smith economy over the next year and also five years
from now. The overall FS ICS index and FS ICE sub-index are impacted by the change. As these items focus on future expectations as opposed to current conditions, the FS ICC scale is not affected (thus, is the same as ICC results in Table 1 for Fort Smith).
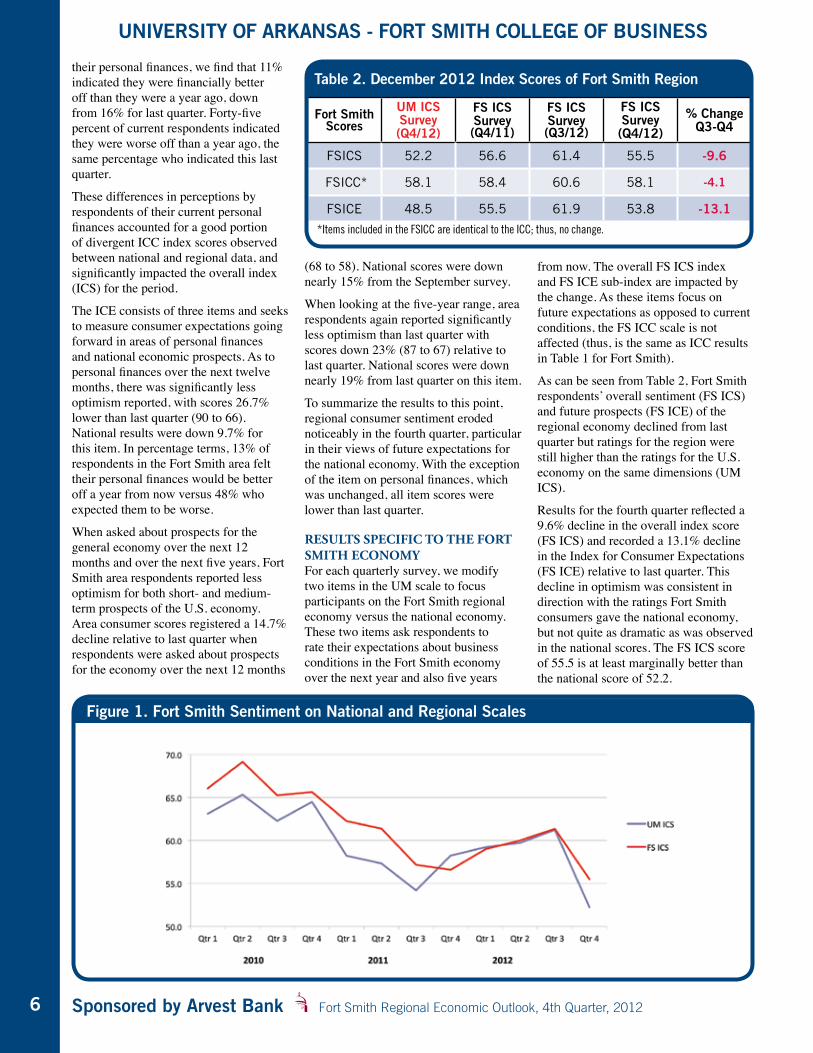
As can be seen from Table 2, Fort Smith respondents’ overall sentiment (FS ICS) and future prospects (FS ICE) of the regional economy declined from last quarter but ratings for the region were still higher than the ratings for the U.S. economy on the same dimensions (UM ICS).
Results for the fourth quarter reflected a 9.6% decline in the overall index score (FS ICS) and recorded a 13.1% decline in the Index for Consumer Expectations (FS ICE) relative to last quarter. This decline in optimism was consistent in direction with the ratings Fort Smith consumers gave the national economy, but not quite as dramatic as was observed in the national scores. The FS ICS score of 55.5 is at least marginally better than the national score of 52.2.
Figure 1. Fort Smith Sentiment on National and Regional Scales
Table 2. December 2012 Index Scores of Fort Smith Region
Fort Smith Scores
UM ICS Survey (Q4/12)
FS ICS Survey (Q4/11)
FS ICS Survey (Q3/12)
FS ICS Survey (Q4/12)
% Change Q3-Q4
FSICS 52.2 56.6 61.4 55.5 -9.6
FSICC* 58.1 58.4 60.6 58.1 -4.1
FSICE 48.5 55.5 61.9 53.8 -13.1
*Items included in the FSICC are identical to the ICC; thus, no change.
UAFS College of Business Sponsored by Arvest Bank
CENTER FOR BUSINESS RESEARCH AND ECONOMIC DEVELOPMENT
7
As can be seen in Figure 1, Fort Smith consumer sentiment had been moving higher in recent quarters, though still well below results reported in surveys in 2010. That came to an end this quarter, where scores reached new lows in consumer optimism.
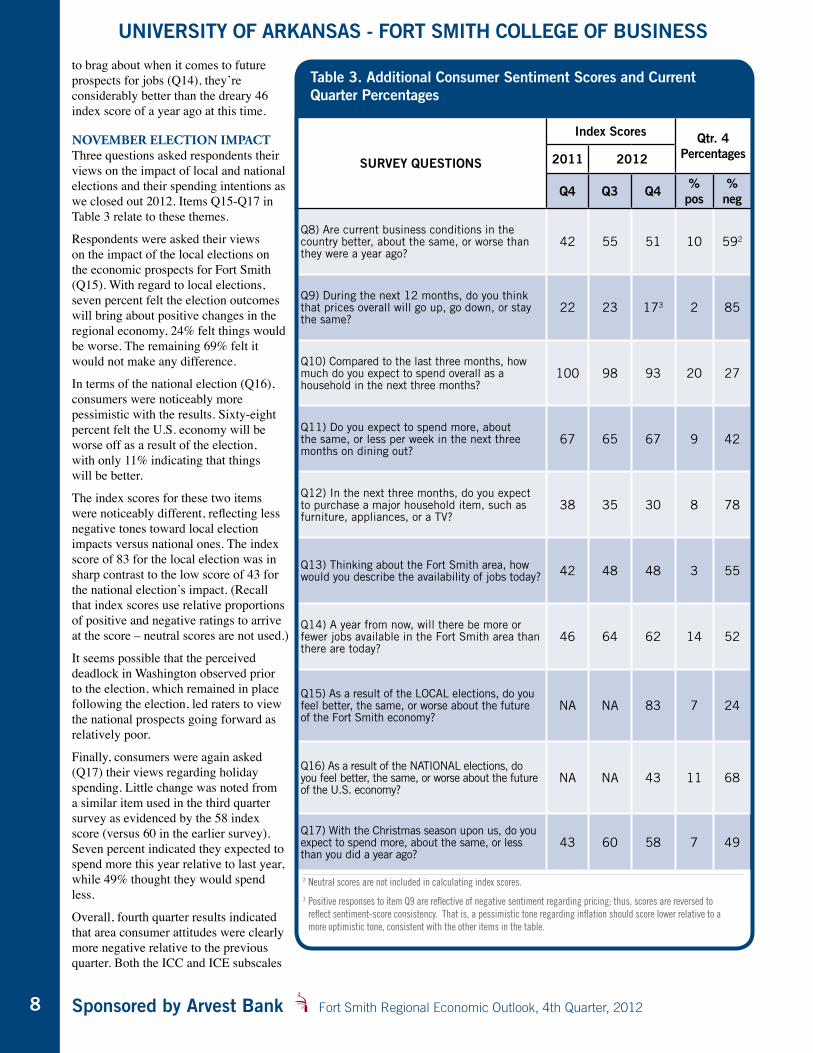
Beyond the core meaSureSConsumers were asked seven additional questions in order to better understand their views and expectations about inflation, personal spending, jobs, and income. Two additional items were included which asked consumers to rate the impact of the November elections on our economy, and one more item re-tested consumer spending intentions as they headed into final weeks of the Christmas shopping season. The specific questions, comparative scores and percentage breakdown of positive-negative responses for each are contained in Table 3.
general economy and conSumption indicatorSPerceptions of the current business conditions in the U.S. economy (Q8) declined from September ratings, with 10% of the respondents indicating they thought the economy was better now than it was a year ago. This was down from 12% who felt this way in the third quarter. Fifty-nine percent (versus 55% in September) indicated it was worse. However, the index score of 51 for December was well above the 42 recorded in 2011 for the quarter.
More consumers continue to think that higher inflation will be the rule over the next twelve months (Q9), with 85% indicating this view. This was up from the 82% who felt that way in the previous quarter, and higher than the 82% that felt that way a year ago. The dominant expectation among area consumers continues to be biased toward inflation.
When asked about overall consumption expectations over the next three months (Q10), the percentage of respondents in this survey who indicated they intended to spend more in the first quarter 2013 declined, while the number indicating they would spend less increased slightly. This resulted in decline in the index score from 98 to 93 for the quarter. Twenty percent of the respondents indicated that they would spend more overall in the first quarter 2013 versus 27% who intended to spend less.
When it came to specific purchasing activity over the next quarter (Q11), nine percent expected to increase spending on such activities as dining out, up from the five percent who responded last quarter to this item. Forty-two percent indicated they would spend less during the 2013 first quarter, an increase from the 40% recorded last quarter. Spending intentions on dining out are still biased toward constraining consumption in this area, but there appeared to be a slight uptick in spending intentions here.
Ratings regarding intentions toward buying large-ticket items (Q12) in the first quarter remained largely unchanged in this survey, with 8% of respondents indicating they definitely expected to make such purchases in the first quarter. Seventy-eight percent (versus 75% last quarter) did not. The remaining 14% indicated they might make such a purchase. Overall, the index score of 30 is lower than last quarter and lower than the 38 reported for the quarter a year ago. This suggests that we might continue to expect some weakening in the sale of large-ticket items as we move through the first quarter of 2013.
Overall, these data suggest that consumers will remain generally cautious as we move through the first quarter, but the positive responses tended to hold ground or improve slightly for the period.
employmentFort Smith respondents continue to report less optimism about the regional job market, but scores were largely unchanged from the previous survey. Ratings of current perceptions of job availability in the Fort Smith area (Q13) indicated that 55% of the respondents felt that jobs were hard to get now (the same as last quarter) and only 3% stating that jobs were plentiful (also the same as last quarter).
When asked about availability of jobs a year from now, regional consumers were pessimistic here as well, with 52% of respondents indicating they expected fewer jobs to be available a year from now. This was largely the same as the 51% who felt that way in September. Fourteen percent felt there would be more jobs in the region, the same as in the last survey.
Survey participants continue to hold rather pessimistic views of the regional employment situation, but ratings held steady this quarter. From Table 3 we see that while ratings are hardly anything
CO
nS
UM
ER
SE
nt
iME
nt
Sponsored by Arvest Bank Fort Smith Regional Economic Outlook, 4th Quarter, 2012
UNIVERSITY OF ARKANSAS - FORT SMITH COLLEGE OF BUSINESS
8
2 Neutral scores are not included in calculating index scores.
3 Positive responses to item Q9 are reflective of negative sentiment regarding pricing; thus, scores are reversed to reflect sentiment-score consistency. That is, a pessimistic tone regarding inflation should score lower relative to a more optimistic tone, consistent with the other items in the table.
SURVEY QUESTIONS
Index Scores Qtr. 4Percentages2011 2012
Q4 Q3 Q4 % pos
% neg
Q8) Are current business conditions in the country better, about the same, or worse than they were a year ago?
42 55 51 10 592
Q9) During the next 12 months, do you think that prices overall will go up, go down, or stay the same?
22 23 173 2 85
Q10) Compared to the last three months, how much do you expect to spend overall as a household in the next three months?
100 98 93 20 27
Q11) Do you expect to spend more, about the same, or less per week in the next three months on dining out?
67 65 67 9 42
Q12) In the next three months, do you expect to purchase a major household item, such as furniture, appliances, or a TV?
38 35 30 8 78
Q13) Thinking about the Fort Smith area, how would you describe the availability of jobs today? 42 48 48 3 55
Q14) A year from now, will there be more or fewer jobs available in the Fort Smith area than there are today?
46 64 62 14 52
Q15) As a result of the LOCAL elections, do you feel better, the same, or worse about the future of the Fort Smith economy?
NA NA 83 7 24
Q16) As a result of the NATIONAL elections, do you feel better, the same, or worse about the future of the U.S. economy?
NA NA 43 11 68
Q17) With the Christmas season upon us, do you expect to spend more, about the same, or less than you did a year ago?
43 60 58 7 49
Table 3. Additional Consumer Sentiment Scores and Current Quarter Percentages
to brag about when it comes to future prospects for jobs (Q14), they’re considerably better than the dreary 46 index score of a year ago at this time.
novemBer election impactThree questions asked respondents their views on the impact of local and national elections and their spending intentions as we closed out 2012. Items Q15-Q17 in Table 3 relate to these themes.
Respondents were asked their views on the impact of the local elections on the economic prospects for Fort Smith (Q15). With regard to local elections, seven percent felt the election outcomes will bring about positive changes in the regional economy, 24% felt things would be worse. The remaining 69% felt it would not make any difference.
In terms of the national election (Q16), consumers were noticeably more pessimistic with the results. Sixty-eight percent felt the U.S. economy will be worse off as a result of the election, with only 11% indicating that things will be better.
The index scores for these two items were noticeably different, reflecting less negative tones toward local election impacts versus national ones. The index score of 83 for the local election was in sharp contrast to the low score of 43 for the national election’s impact. (Recall that index scores use relative proportions of positive and negative ratings to arrive at the score – neutral scores are not used.)
It seems possible that the perceived deadlock in Washington observed prior to the election, which remained in place following the election, led raters to view the national prospects going forward as relatively poor.
Finally, consumers were again asked (Q17) their views regarding holiday spending. Little change was noted from a similar item used in the third quarter survey as evidenced by the 58 index score (versus 60 in the earlier survey). Seven percent indicated they expected to spend more this year relative to last year, while 49% thought they would spend less.
Overall, fourth quarter results indicated that area consumer attitudes were clearly more negative relative to the previous quarter. Both the ICC and ICE subscales
UAFS College of Business Sponsored by Arvest Bank
CENTER FOR BUSINESS RESEARCH AND ECONOMIC DEVELOPMENT
9
CO
nS
UM
ER
SE
nt
iME
nt
were lower, with the ICE measure of future expectations declining the most from the third quarter readings.
It will be important to see if regional sentiment will rebound in the upcoming first quarter survey, now that much of the negativity of the “fiscal cliff” has dissipated – at least the media reporting of these issues has become less spectacular in tone.
The regional jobs picture continues to record low scores, though one could interpret the unchanged nature of consumer perceptions as a positive. This might be a reasonable interpretation, particularly as the overall tone reflected in this survey was quite negative.
On the consumption side, evidence from this survey suggests little change in consumer buying behavior for the first quarter of 2013. In general, the positive responses held steady while negative responses increased somewhat in these results.
While the news headlines out of Washington have been less dramatic, and locally as well for that matter, there remain plenty of issues on the agenda that have the potential to further sour consumer attitudes in the coming months.
aBout the SurveyOf the 3,250 surveys mailed to the five-county MSA, 398 were returned undeliverable, and 323 usable surveys were returned, providing a return rate of 11.3%. As a result, the confidence level exceeds 90% for this survey.
The University of Michigan’s (UM) Index of Consumer Sentiment (ICS) survey is used to measure consumer attitudes on several economic themes. Collectively, these represent consumer optimism or confidence levels for any given period and can be used to compare any one period with other periods.
The overall ICS score includes five core questions and constitutes a general measure of consumer sentiment for the period. These questions cover three general areas of consumer sentiment: personal finances, business conditions, and buying conditions. Two sub-indices within the ICS make up the Index of Consumer Expectations (ICE) and the Index of Current Economic Conditions or more simply, Index of Current Conditions (ICC). The ICE “focuses on three areas: how consumers view prospects for their own financial situation, how they view prospects for the general economy over the near term, and their view of prospects for the economy over the long term” (University of Michigan). The ICC focuses on consumers’ views of their current financial condition and whether they feel secure enough about their financial situations to engage in major consumption activity.
For more information on the Consumer Sentiment Survey, methodology used and discussion regarding results, a more extensive narrative is provided in the first quarter 2010 report that is available online under our Publications link at http://uafs.edu/cob/cbred.
How prepared is your business?Tax audits • Employee fraud • Compliance audits
Retirement decisions • Unexpected growth
Accountable to you since 1963.
We’ve got the knowledge and experience to keep you preparedno matter what the situation. Call today. 479.484.5740.
BeallBarclay.com Beall Barclay and Company, PLC • Beall Barclay Wealth Management, LLCSecurities offered by 1st Global Capital Corp. Member FINRA. SIPC Investment Advisory services offered through 1st Global Advisors, Inc.
Sponsored by Arvest Bank Fort Smith Regional Economic Outlook, 4th Quarter, 2012
UNIVERSITY OF ARKANSAS - FORT SMITH COLLEGE OF BUSINESS
10
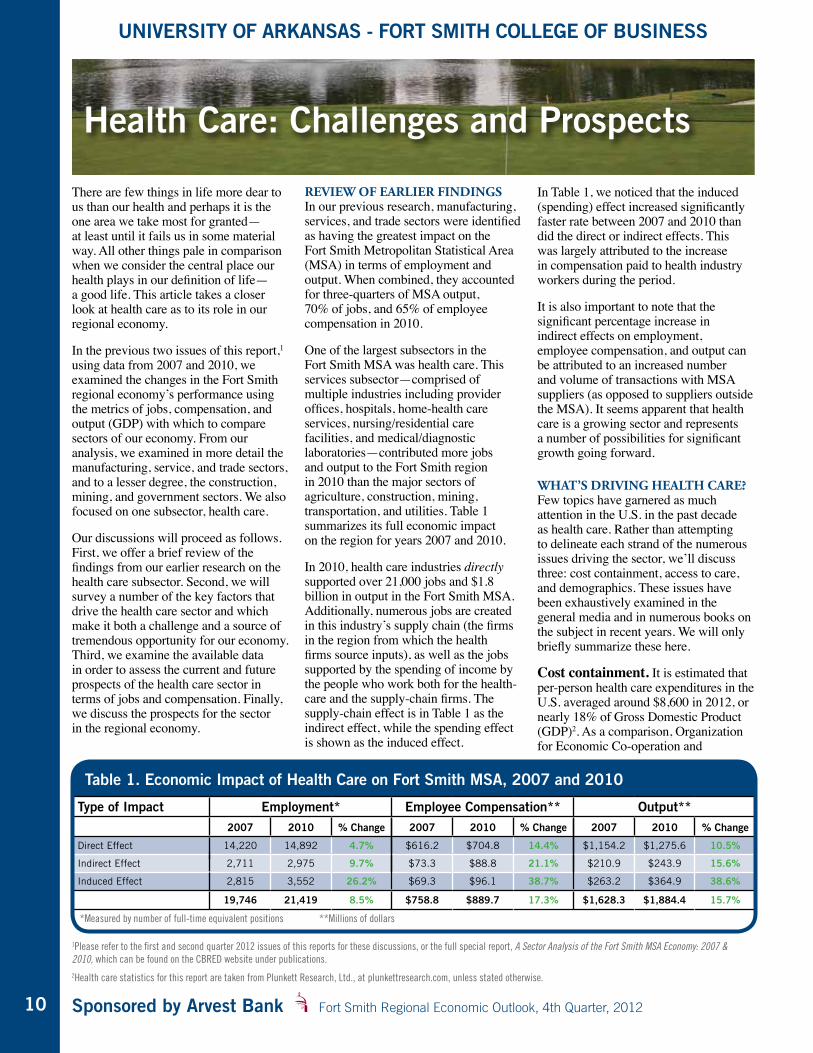
There are few things in life more dear to us than our health and perhaps it is the one area we take most for granted— at least until it fails us in some material way. All other things pale in comparison when we consider the central place our health plays in our definition of life— a good life. This article takes a closer look at health care as to its role in our regional economy.
In the previous two issues of this report,1 using data from 2007 and 2010, we examined the changes in the Fort Smith regional economy’s performance using the metrics of jobs, compensation, and output (GDP) with which to compare sectors of our economy. From our analysis, we examined in more detail the manufacturing, service, and trade sectors, and to a lesser degree, the construction, mining, and government sectors. We also focused on one subsector, health care.
Our discussions will proceed as follows. First, we offer a brief review of the findings from our earlier research on the health care subsector. Second, we will survey a number of the key factors that drive the health care sector and which make it both a challenge and a source of tremendous opportunity for our economy. Third, we examine the available data in order to assess the current and future prospects of the health care sector in terms of jobs and compensation. Finally, we discuss the prospects for the sector in the regional economy.
review of earlier findingSIn our previous research, manufacturing, services, and trade sectors were identified as having the greatest impact on the Fort Smith Metropolitan Statistical Area (MSA) in terms of employment and output. When combined, they accounted for three-quarters of MSA output, 70% of jobs, and 65% of employee compensation in 2010.
One of the largest subsectors in the Fort Smith MSA was health care. This services subsector—comprised of multiple industries including provider offices, hospitals, home-health care services, nursing/residential care facilities, and medical/diagnostic laboratories—contributed more jobs and output to the Fort Smith region in 2010 than the major sectors of agriculture, construction, mining, transportation, and utilities. Table 1 summarizes its full economic impact on the region for years 2007 and 2010.
In 2010, health care industries directly supported over 21,000 jobs and $1.8 billion in output in the Fort Smith MSA. Additionally, numerous jobs are created in this industry’s supply chain (the firms in the region from which the health firms source inputs), as well as the jobs supported by the spending of income by the people who work both for the health-care and the supply-chain firms. The supply-chain effect is in Table 1 as the indirect effect, while the spending effect is shown as the induced effect.
In Table 1, we noticed that the induced (spending) effect increased significantly faster rate between 2007 and 2010 than did the direct or indirect effects. This was largely attributed to the increase in compensation paid to health industry workers during the period.
It is also important to note that the significant percentage increase in indirect effects on employment, employee compensation, and output can be attributed to an increased number and volume of transactions with MSA suppliers (as opposed to suppliers outside the MSA). It seems apparent that health care is a growing sector and represents a number of possibilities for significant growth going forward.
what’S driving health care?Few topics have garnered as much attention in the U.S. in the past decade as health care. Rather than attempting to delineate each strand of the numerous issues driving the sector, we’ll discuss three: cost containment, access to care, and demographics. These issues have been exhaustively examined in the general media and in numerous books on the subject in recent years. We will only briefly summarize these here.
Cost containment. It is estimated that per-person health care expenditures in the U.S. averaged around $8,600 in 2012, or nearly 18% of Gross Domestic Product (GDP)2. As a comparison, Organization for Economic Co-operation and
Health Care: Challenges and Prospects
1Please refer to the first and second quarter 2012 issues of this reports for these discussions, or the full special report, A Sector Analysis of the Fort Smith MSA Economy: 2007 & 2010, which can be found on the CBRED website under publications.2Health care statistics for this report are taken from Plunkett Research, Ltd., at plunkettresearch.com, unless stated otherwise.
Type of Impact Employment* Employee Compensation** Output**2007 2010 % Change 2007 2010 % Change 2007 2010 % Change
Direct Effect 14,220 14,892 4.7% $616.2 $704.8 14.4% $1,154.2 $1,275.6 10.5%
Indirect Effect 2,711 2,975 9.7% $73.3 $88.8 21.1% $210.9 $243.9 15.6%
Induced Effect 2,815 3,552 26.2% $69.3 $96.1 38.7% $263.2 $364.9 38.6%
19,746 21,419 8.5% $758.8 $889.7 17.3% $1,628.3 $1,884.4 15.7%
*Measured by number of full-time equivalent positions **Millions of dollars
Table 1. Economic Impact of Health Care on Fort Smith MSA, 2007 and 2010
UAFS College of Business Sponsored by Arvest Bank
CENTER FOR BUSINESS RESEARCH AND ECONOMIC DEVELOPMENT
11
Development (OECD) member countries spent approximately $3,000 per capita. The OECD is comprised of 34 countries, most of which are from the developed world, such as Japan, Australia, European countries, Canada and the U.S.
Bottom line, the U.S. has one of the most costly health care systems in the world and the cost as a percentage of GDP is expected to continue to grow at an unsustainable rate—unless something is done.
Access to care. At the time the Patient Protection and Affordable Care Act (PPACA, and is often referred to as Obamacare or the Affordable Care Act) was signed into law in 2010, it was estimated that between 30 and 40 million Americans were not covered by any medical insurance plan.
The reasons for this were several but could be summed up into three groups 1) young people not wanting to spend the money on insurance premiums as they were healthy and didn’t see the need; 2) those who for various reasons couldn’t afford (or chose not to afford) the pricey premiums required to secure insurance; and 3) those who couldn’t secure a policy at nearly any price due to pre-existing conditions which prevented them from getting insurance.
PPACA sets out to change, among many other things, the access problem by requiring everyone, one way or another, to be covered by an insurance plan. The net result is that when the legislation is fully implemented, many more people will directly access the health care system—and it will be paid for by an insurance plan of some sort.
Demographics. While the PPACA will open the door to many new clients for the health care system, the even more pressing issue may be argued to exist in the aging of the general population. Specifically, the largest U.S. generation to date, known as Baby Boomers, is moving into Medicare eligibility and will strain the resources of this program for decades to come. Added to these demands is the fact that older populations require increased frequency and amounts of care—costly care.
In 2012, Medicare provided coverage for 50.7 million people. By 2030, the number covered by this program is expected to grow to 78 million.
What might the impact of these on our economy in terms of jobs and GDP? Positive. Let’s next look in more detail at the regional employment picture for the health care sector.
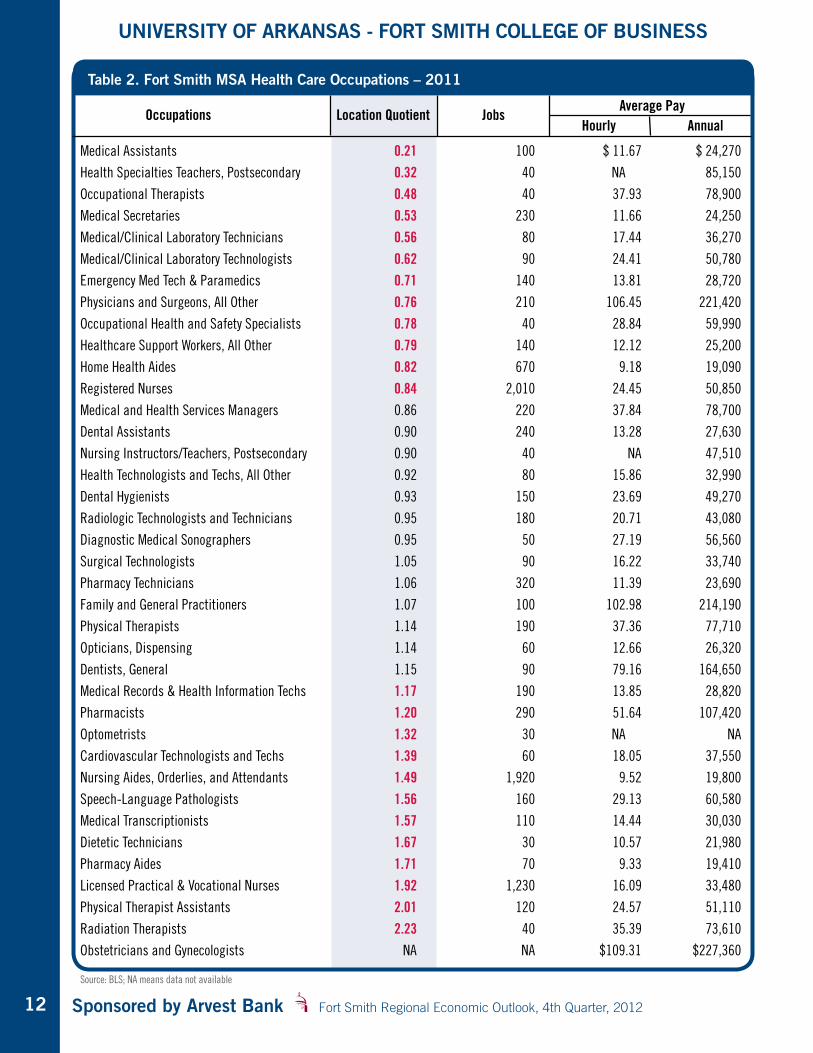
fort Smith mSa health care occupationSTable 2 contains key groupings of health care-related occupations as of 2011 for the Fort Smith MSA. These data are from the Bureau of Labor Statistics (BLS). The table is organized based on the location quotient, starting from the lowest quotient to the highest. The location quotient is a metric that reflects the relative presence of the occupation in the region as compared to national averages for the occupation.
A location quotient of 1.00 on a particular occupation means that the MSA has the occupation in the same relative proportion as the national average. For example, if registered nurses made up 4% of the Fort Smith MSA workforce and this was the same nationally, then four divided by four would equal a quotient of 1.00.
Based on these BLS data, the lowest location quotient reflects those occupations within the Fort Smith region that are lower than the national average. Medical assistants, for example, have a quotient of .21, suggesting a significantly lower proportion of the occupation in the region than what is observed in the nation as a whole.
Quotients highlighted in red assume cutoff limits of +/-15 points and are used to illustrate areas where perhaps there are too few workers in the particular occupation (below .85) or too many (above 1.15).
While we can observe from these data that a particular occupation has relatively fewer people working in it relative to national averages, it does not tell us why and thus, whether it is a problem to be addressed or if it is as would be expected. Take laboratory technicians with a quotient score of .56, nearly half of the national average. Is it a problem, or does it simply reflect the reality that a good portion of lab services were done outside the MSA in 2011?
Relative shortages in a particular occupation may offer some insight into potential growth opportunities, however, depending on the reason for the shortage.
Take the lab tech example. As these services are relatively portable, it may reflect a regional recruitment opportunity if we should find that these services are being outsourced to providers outside the MSA.
Further, these data only reflect comparative estimates of the current state of the sector (as of 2011) relative to U.S. averages. It does not reflect what is needed or what the expected demand will be in the future. For example, Table 2 indicates that the number of family and general practitioners (physicians) in the region are right at the national average, suggesting there isn’t really a problem here. However, it is recognized that the availability of physicians nationally is already short of demand and expected to become an even greater challenge going forward.
What these data do indicate is that the region is doing as well as the nation as a whole when it comes to overall physician recruitment and retention. It says nothing about relative presence of the various specialties within the group.
One other observation we can make from Table 2 is that the sector varies greatly in the skill levels required and the compensation paid. Orderlies and attendants garner the lowest wages (averaging just under $20,000 annually) and make up a significant portion of the head count found in the sector. Registered nurses comprise the largest occupational group in the sector with average pay of just over $50,000 annually. As expected, physician groups comprise the upper end of the pay scale and a lower head count.
While the data in Table 2 is helpful in gauging current relative performance across key occupations in the health care sector, it does not address future demand. We turn to that now.
regional demand for health ServiceSIn order to discuss the expected demand for health care occupations, we’ll use available data produced by the State of Arkansas for our region, defined as the Western Arkansas Workforce Investment Area (WIA)3. This definition will not line up with the five-county MSA designation as the state has defined our WIA in terms of Arkansas counties, and these include Sebastian, Crawford, Franklin, Logan,
3These data can be found on discoverarkansas.net, the State of Arkansas “labor market information source.”
hE
ALt
h C
AR
E: C
hA
LLEn
gE
S A
nD
PR
OS
PE
Ct
S
Sponsored by Arvest Bank Fort Smith Regional Economic Outlook, 4th Quarter, 2012
UNIVERSITY OF ARKANSAS - FORT SMITH COLLEGE OF BUSINESS
12Source: BLS; NA means data not available
Table 2. Fort Smith MSA Health Care Occupations – 2011
Occupations Location Quotient Jobs Average Pay
Hourly Annual
Medical Assistants 0.21 100 $ 11.67 $ 24,270
Health Specialties Teachers, Postsecondary 0.32 40 NA 85,150
Occupational Therapists 0.48 40 37.93 78,900
Medical Secretaries 0.53 230 11.66 24,250
Medical/Clinical Laboratory Technicians 0.56 80 17.44 36,270
Medical/Clinical Laboratory Technologists 0.62 90 24.41 50,780
Emergency Med Tech & Paramedics 0.71 140 13.81 28,720
Physicians and Surgeons, All Other 0.76 210 106.45 221,420
Occupational Health and Safety Specialists 0.78 40 28.84 59,990
Healthcare Support Workers, All Other 0.79 140 12.12 25,200
Home Health Aides 0.82 670 9.18 19,090
Registered Nurses 0.84 2,010 24.45 50,850
Medical and Health Services Managers 0.86 220 37.84 78,700
Dental Assistants 0.90 240 13.28 27,630
Nursing Instructors/Teachers, Postsecondary 0.90 40 NA 47,510
Health Technologists and Techs, All Other 0.92 80 15.86 32,990
Dental Hygienists 0.93 150 23.69 49,270
Radiologic Technologists and Technicians 0.95 180 20.71 43,080
Diagnostic Medical Sonographers 0.95 50 27.19 56,560
Surgical Technologists 1.05 90 16.22 33,740
Pharmacy Technicians 1.06 320 11.39 23,690
Family and General Practitioners 1.07 100 102.98 214,190
Physical Therapists 1.14 190 37.36 77,710
Opticians, Dispensing 1.14 60 12.66 26,320
Dentists, General 1.15 90 79.16 164,650
Medical Records & Health Information Techs 1.17 190 13.85 28,820
Pharmacists 1.20 290 51.64 107,420
Optometrists 1.32 30 NA NA
Cardiovascular Technologists and Techs 1.39 60 18.05 37,550
Nursing Aides, Orderlies, and Attendants 1.49 1,920 9.52 19,800
Speech-Language Pathologists 1.56 160 29.13 60,580
Medical Transcriptionists 1.57 110 14.44 30,030
Dietetic Technicians 1.67 30 10.57 21,980
Pharmacy Aides 1.71 70 9.33 19,410
Licensed Practical & Vocational Nurses 1.92 1,230 16.09 33,480
Physical Therapist Assistants 2.01 120 24.57 51,110
Radiation Therapists 2.23 40 35.39 73,610
Obstetricians and Gynecologists NA NA $109.31 $227,360
UAFS College of Business Sponsored by Arvest Bank
CENTER FOR BUSINESS RESEARCH AND ECONOMIC DEVELOPMENT
13
Polk and Scott counties. The data will provide us the opportunity to discuss prospects for the sector beyond the current timeframe.
The most recent WIA data available covers the 2008-2018 timeframe.
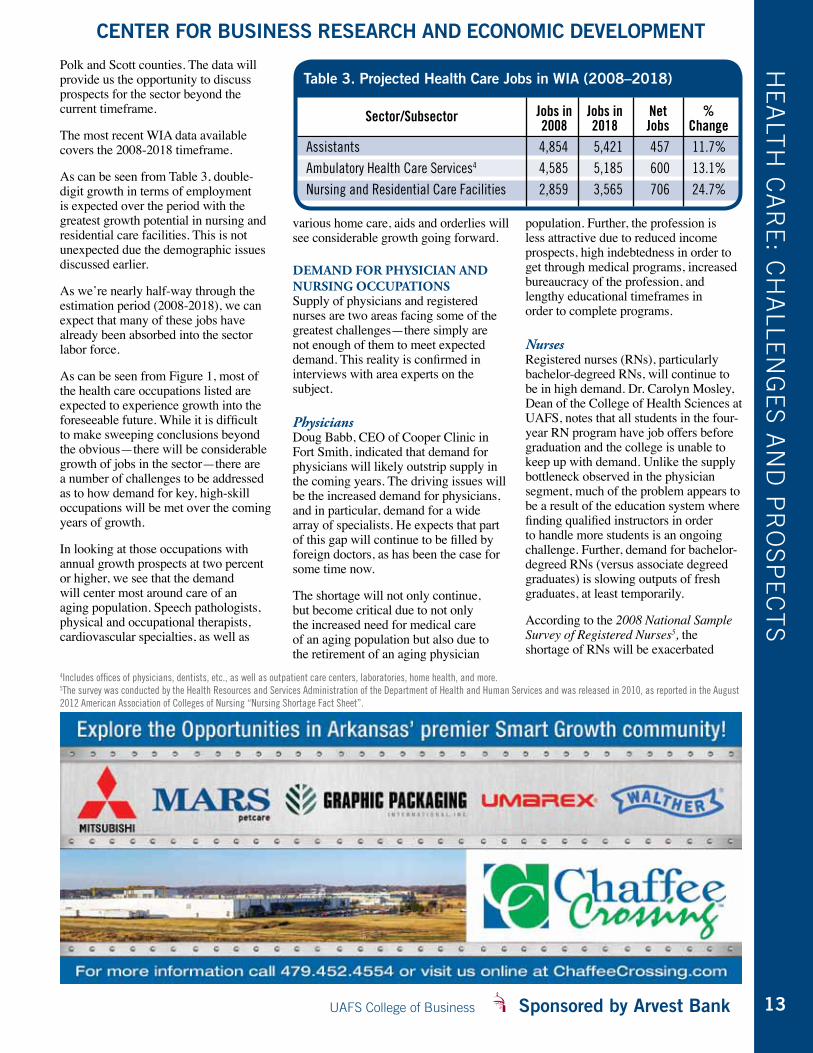
As can be seen from Table 3, double- digit growth in terms of employment is expected over the period with the greatest growth potential in nursing and residential care facilities. This is not unexpected due the demographic issues discussed earlier.
As we’re nearly half-way through the estimation period (2008-2018), we can expect that many of these jobs have already been absorbed into the sector labor force.
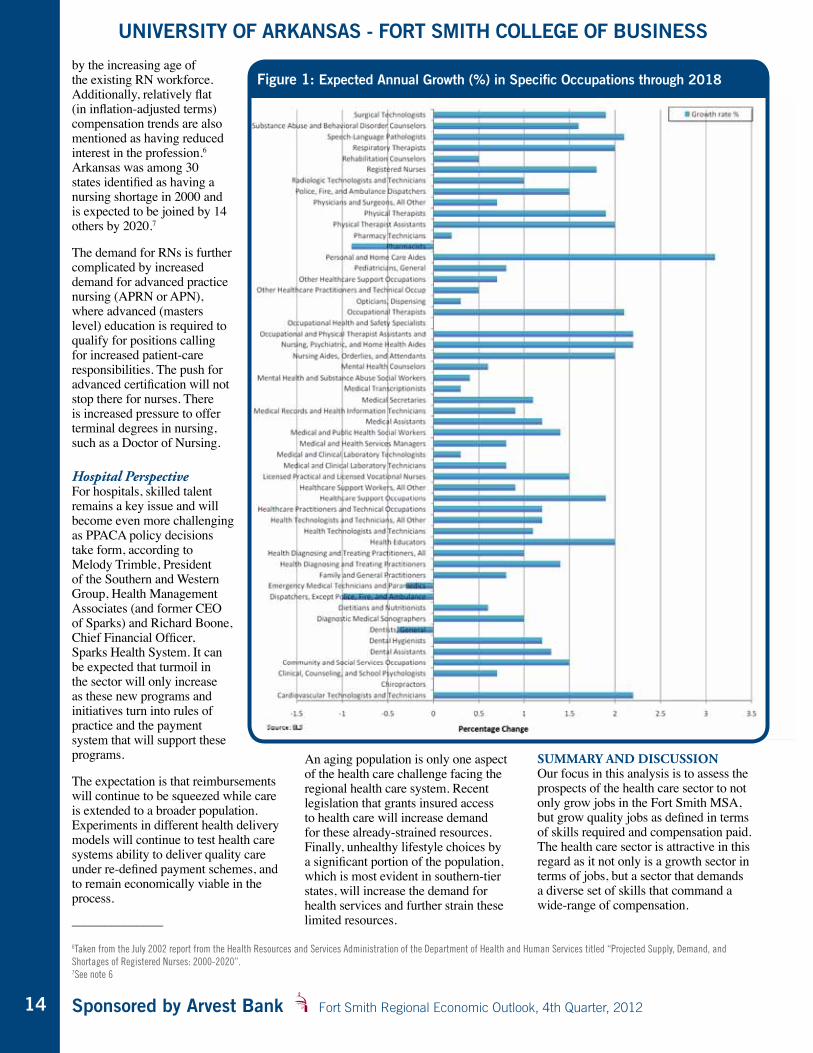
As can be seen from Figure 1, most of the health care occupations listed are expected to experience growth into the foreseeable future. While it is difficult to make sweeping conclusions beyond the obvious—there will be considerable growth of jobs in the sector—there are a number of challenges to be addressed as to how demand for key, high-skill occupations will be met over the coming years of growth.
In looking at those occupations with annual growth prospects at two percent or higher, we see that the demand will center most around care of an aging population. Speech pathologists, physical and occupational therapists, cardiovascular specialties, as well as
various home care, aids and orderlies will see considerable growth going forward.
demand for phySician and nurSing occupationSSupply of physicians and registered nurses are two areas facing some of the greatest challenges—there simply are not enough of them to meet expected demand. This reality is confirmed in interviews with area experts on the subject.
PhysiciansDoug Babb, CEO of Cooper Clinic in Fort Smith, indicated that demand for physicians will likely outstrip supply in the coming years. The driving issues will be the increased demand for physicians, and in particular, demand for a wide array of specialists. He expects that part of this gap will continue to be filled by foreign doctors, as has been the case for some time now.
The shortage will not only continue, but become critical due to not only the increased need for medical care of an aging population but also due to the retirement of an aging physician
population. Further, the profession is less attractive due to reduced income prospects, high indebtedness in order to get through medical programs, increased bureaucracy of the profession, and lengthy educational timeframes in order to complete programs.
NursesRegistered nurses (RNs), particularly bachelor-degreed RNs, will continue to be in high demand. Dr. Carolyn Mosley, Dean of the College of Health Sciences at UAFS, notes that all students in the four-year RN program have job offers before graduation and the college is unable to keep up with demand. Unlike the supply bottleneck observed in the physician segment, much of the problem appears to be a result of the education system where finding qualified instructors in order to handle more students is an ongoing challenge. Further, demand for bachelor-degreed RNs (versus associate degreed graduates) is slowing outputs of fresh graduates, at least temporarily.
According to the 2008 National Sample Survey of Registered Nurses5, the shortage of RNs will be exacerbated
4Includes offices of physicians, dentists, etc., as well as outpatient care centers, laboratories, home health, and more.5The survey was conducted by the Health Resources and Services Administration of the Department of Health and Human Services and was released in 2010, as reported in the August 2012 American Association of Colleges of Nursing “Nursing Shortage Fact Sheet”.
hE
ALt
h C
AR
E: C
hA
LLEn
gE
S A
nD
PR
OS
PE
Ct
S
Sector/Subsector Jobs in Jobs in Net % 2008 2018 Jobs Change
Table 3. Projected Health Care Jobs in WIA (2008–2018)
Assistants 4,854 5,421 457 11.7%Ambulatory Health Care Services4 4,585 5,185 600 13.1%Nursing and Residential Care Facilities 2,859 3,565 706 24.7%
Sponsored by Arvest Bank Fort Smith Regional Economic Outlook, 4th Quarter, 2012
UNIVERSITY OF ARKANSAS - FORT SMITH COLLEGE OF BUSINESS
14
by the increasing age of the existing RN workforce. Additionally, relatively flat (in inflation-adjusted terms) compensation trends are also mentioned as having reduced interest in the profession.6 Arkansas was among 30 states identified as having a nursing shortage in 2000 and is expected to be joined by 14 others by 2020.7
The demand for RNs is further complicated by increased demand for advanced practice nursing (APRN or APN), where advanced (masters level) education is required to qualify for positions calling for increased patient-care responsibilities. The push for advanced certification will not stop there for nurses. There is increased pressure to offer terminal degrees in nursing, such as a Doctor of Nursing.
Hospital PerspectiveFor hospitals, skilled talent remains a key issue and will become even more challenging as PPACA policy decisions take form, according to Melody Trimble, President of the Southern and Western Group, Health Management Associates (and former CEO of Sparks) and Richard Boone, Chief Financial Officer, Sparks Health System. It can be expected that turmoil in the sector will only increase as these new programs and initiatives turn into rules of practice and the payment system that will support these programs.
The expectation is that reimbursements will continue to be squeezed while care is extended to a broader population. Experiments in different health delivery models will continue to test health care systems ability to deliver quality care under re-defined payment schemes, and to remain economically viable in the process.
––––––––––––––
An aging population is only one aspect of the health care challenge facing the regional health care system. Recent legislation that grants insured access to health care will increase demand for these already-strained resources. Finally, unhealthy lifestyle choices by a significant portion of the population, which is most evident in southern-tier states, will increase the demand for health services and further strain these limited resources.
Summary and diScuSSionOur focus in this analysis is to assess the prospects of the health care sector to not only grow jobs in the Fort Smith MSA, but grow quality jobs as defined in terms of skills required and compensation paid. The health care sector is attractive in this regard as it not only is a growth sector in terms of jobs, but a sector that demands a diverse set of skills that command a wide-range of compensation.
6Taken from the July 2002 report from the Health Resources and Services Administration of the Department of Health and Human Services titled “Projected Supply, Demand, and Shortages of Registered Nurses: 2000-2020”.7See note 6
Figure 1: Expected Annual Growth (%) in Specific Occupations through 2018
UAFS College of Business Sponsored by Arvest Bank
CENTER FOR BUSINESS RESEARCH AND ECONOMIC DEVELOPMENT
15
In sum, the sector is, and is expected to be in the future, an attractive source of economic growth for the region. Let’s highlight several things about this sector.
1) In Uncertainty Lives Opportunity. The Affordable Care Act seeks to redefine health care delivery in terms of how care is delivered, by whom, where, for how much, and for which activities. The wide-sweeping nature of the legislation will take years to sort out as to all the details of implementation and practice. It will disrupt the worlds of everyone involved in the system—care providers, payors, and end-users alike.
Yet, it is in such transitions where whole new businesses will emerge employing people with skills that are yet to be defined. Technologies will continue to change not only treatment possibilities but also support or “backroom” activities such as records management.
Potential: As the parameters take shape, health care providers will be looking for solutions to solve the revenue squeeze on the one hand and the influx of demand on the other. This means that the pursuit of cost savings will be ongoing. Organizations that can increase process efficiencies in patient care and support activities will prosper.
Communities that position themselves to attract these service providers will have to demonstrate an infrastructure capable of high-speed, high-volume internet traffic, in addition to the typical labor-force attractiveness. Golden Living’s decision to house their administrative
support activities in Fort Smith is an example of the type of organizations and work that is possible.
2) Devolving Medical Care to the First Best Provider. “First best provider” is defined as the caregiver that can provide the necessary care for the least cost. Physicians are expected to remain a highly-prized asset and a costly one—and in short supply. Thus, pressure to reduce costs while providing care to a larger population will drive this trend. Jobs will go to those areas that can solve this dilemma.
Patient care responsibilities will continue to move away from the physician to other providers, such as nurse practitioners, physician assistants, and other types of advanced practice nurses. Further, lower cost experts will make decisions—think radiologists reading x-rays—from India or China. It’s already being done. Technology will be the usual good-news bad-news player in this evolving story.
Potential: This likely shift to lower-skill workers benefits our region as the workforce development potential is attainable, broadly speaking. That is, we won’t likely produce many physicians in Fort Smith, but producing mid-tier skill sets is more likely attained. This trend also suggests that not only are there multiple entry points to the profession in terms of skill-levels (CNAs, LPNs, RNs, etc.), but there appears to be greater opportunities to progress in the system with additional skill acquisition.
Organizations that can solve these in-demand degree/skill requirements will prosper in terms of claiming more resources and employing more people to deliver needed supply.
3) Technology will Compete for Jobs. Think manufacturing – output increases, costs decline – and so do number of jobs. The health care sector is ripe for innovation.8 The forces driving it is a shortage of key resources (doctors, nurses, etc.) and decreased latitude in terms of price-setting means costs must be contained in order for providers and payors to remain viable. The tension will be between health care that is personal in terms of the doctor-patient relationship (and its cost) and the efficiency of the care-from-anywhere-by-anyone model—or most likely, something in between.
We’ve already indicated that health care will continue to explore lower-cost delivery methods where doctors plug into direct patient care in an as-needed basis—call it rationing a scarce resource. We’ll look at a couple of trends that have been argued to not only reduce costs, but will maintain a high level of care in terms of outcomes. Of course, they are not without their critics. Let’s do a quick survey of three of these.
Diagnostic/treatment protocols. Protocols are developed to standardize a process into a precise set of steps by which a decision is reached. Think of a familiar doctor-patient dialog from the 1960s TV show Hee Haw. “Doc, it hurts when I do this!” Doctor says, “Well, then don’t DO that!” (striking the patient with a rubber
8One extensive discussion of the trends in health care is contained in a book by Clayton M. Crhsitensen, Jerome H. Grossman M.D., & Jason Hwang M.D. (2009). The Innovator’s Prescription: A Disruptive Solution for Health Care, published by McGraw-Hill.
hE
ALt
h C
AR
E: C
hA
LLEn
gE
S A
nD
PR
OS
PE
Ct
S
Sponsored by Arvest Bank Fort Smith Regional Economic Outlook, 4th Quarter, 2012
UNIVERSITY OF ARKANSAS - FORT SMITH COLLEGE OF BUSINESS
16
chicken). Or, how about this one: “Doc, I don’t feel well.” Doctor responds, “Take two aspirin and call me in the morning.” Treatment protocols—standardized treatment regimes for a given set of symptoms.
In health care it amounts to standardizing processes so as to ensure a consistent approach to diagnosing illness and prescribing a treatment regime that will result in a desired outcome—a healthy patient. Protocols are used all the time in health care today.
However, the question then becomes, why use such an expensive ‘cook’ when all you have to do is give the ‘recipe’ to a well trained but lower-cost decision maker and let him or her handle it? In fact, if you input the recipe and data into a computer it will tell you the appropriate treatment! No human error. No warm fuzzies in this.
Outsourcing diagnostics and treatment. This is hardly new, but its use will likely be expanded to include more and more services shipped to low-cost environments. India and China have significant populations of highly trained specialists. Digitized records, such as x-rays, are already moved around the world for diagnosis and with considerable ease. Telemedicine is in its infancy, suggesting that the use of remote diagnosis and treatment will continue to grow.
But, how about a U.S.- based specialist signing onto a ‘cloud’ database filled with patient files and data related to various tests conducted. The pre-certified specialist may actually bid to diagnose
the patient’s issue, or bid to read the x-ray in much the same way a host of jobs are currently outsourced online via sites like guru.com or elance.com. Possible? Very.
There are many other examples, but the net result is that technology has and will continue to change the way health care will be offered. These innovations have the potential to disrupt current practice and offer a host of possibilities as to how care may be offered in the future.
Immediate Digitization of Records. Currently, you walk into a clinic and you are handed a pen and a personal-data form on a clipboard, which you’re asked to complete – so 1970s! Enter 2020 (or sooner)! You’re handed an “iPad” tablet through which you swipe your I.D. card and enter the data, which is instantly available to all who need access –—doctor, nurse, whoever. Your vitals are collected by a machine and the result is instantly available on all “iPads”.
Oh, and you end up with a RFID (radio frequency identification) tag that tracks you during your visit. Each care giver’s “iPad” automatically detects your tag so as to match you with your data. If need be, your record can be read remotely by any qualified person. That is, lab work, x-rays, scans, vitals, comments, etc. allow for diagnosis from anywhere.
When you leave, the payor is automatically billed and you’ve set your next appointment on your way out. Far fetched? Not really.
Potential: As you can see from these short examples, when it comes to jobs,
technology will often result in fewer jobs in the fields to which it is applied. The evidence gleaned from many industries and occupations over recent decades is overwhelming. It will likely impact health care in a similar way, in time.
concluSionFrom our analysis, we conclude that the health care sector will continue to be a significant job generator in the coming years. It is a sector under tremendous pressure to service increased demand and do so with fewer resources. How this will play out is anything but clear at this point.
For our purposes, the sector is attractive as a net-job creator and as a source for quality jobs. The sector also uses a wide array of skill sets, which offers access to meaningful work to a broad segment of our workforce. Few sectors offer such breadth of entry-level work, and a path to improve one’s life through a clearly marked career progression.
This is an important aspect for bettering the economic opportunities in the region, because it provides identifiable steps of progression for regional workers to improve their skills (through experience and educational attainment) and thus, household income and well being.
Because of the resources that will continue to flow to the sector for decades to come, it offers the potential for our community to not only grow jobs through the sector, but also attract new organizations that will emerge to service the sector.
YOUR Regional Car & Truck Center!The 5th Oldest Ford Dealer in the Country
5500 ROGERS AVE • FORT SMITH, AR 479-452-FORD (3673) • 800-217-4248
Open 24/7 Online at randallford.com
Others Talk, We Deliver…The Lowest Price
FAMILY OWNED…PROUDLY SERVING THE RIVER VALLEY SINCE 1908
UAFS College of Business Sponsored by Arvest Bank
CENTER FOR BUSINESS RESEARCH AND ECONOMIC DEVELOPMENT
1717
SP
On
SO
RS
www.bhca.com1626 Empire Street - Lowell
(479) 878-18965500 Euper Lane - Fort Smith
(479) 452-4000
THE PERFECT BANK FOR YOUR CHANGING WORLD
arvest.com
Member FDIC
How prepared is your business?Tax audits • Employee fraud • Compliance audits
Retirement decisions • Unexpected growthWe’ve got the knowledge and experience to keep you prepared
no matter what the situation. Call today. 479.484.5740.
Beall Barclay and Company, PLCBeall Barclay Wealth Management, LLC
Securities offered by 1st Global Capital Corp. Member FINRA. SIPC Investment Advisory services offered through 1st Global Advisors, Inc.
BeallBarclay.com
Every year since 2005,UA Fort Smith business graduates have placed in thetop 25% or better in national testing. How do they do it? Their instructors are career business professionals, experts in their field.
HELLOmy name is
Be an expert. Be a graduate of the College of Business.
We would like to thank our sponsors for their
generous support.
horizontalad.indd 1 8/5/2010 4:28:52 PM
YOUR Regional Car & Truck Center!The 5th Oldest Ford Dealer in the Country
5500 ROGERS AVE • FORT SMITH, AR 479-452-FORD (3673) • 800-217-4248
Open 24/7 Online at randallford.com
Others Talk, We Deliver…The Lowest Price
FAMILY OWNED…PROUDLY SERVING THE RIVER VALLEY SINCE 1908

Member FDIC
Whether your business is construction, retail, manufacturing or pretty much anything else, Arvest is an
important part of your financial stability. Every day, we help businesses manage their money, improve their
cash flow and realize their growth potential. With over 200 locations in Oklahoma, Arkansas, Missouri
and Kansas, and convenient 7 to 7 hours, there are plenty of reasons that Arvest should be the foundation
for your success. See one of our experienced bankers today or visit arvest.com.
Arvest Bank. The perfect bank for your changing world.
THE FOUNDATION FORA SUCCESSFUL BUSINESS