Embed Size (px)
Citation preview
Northern Territory rural industries and fisheriesEconomic Outlook 20176
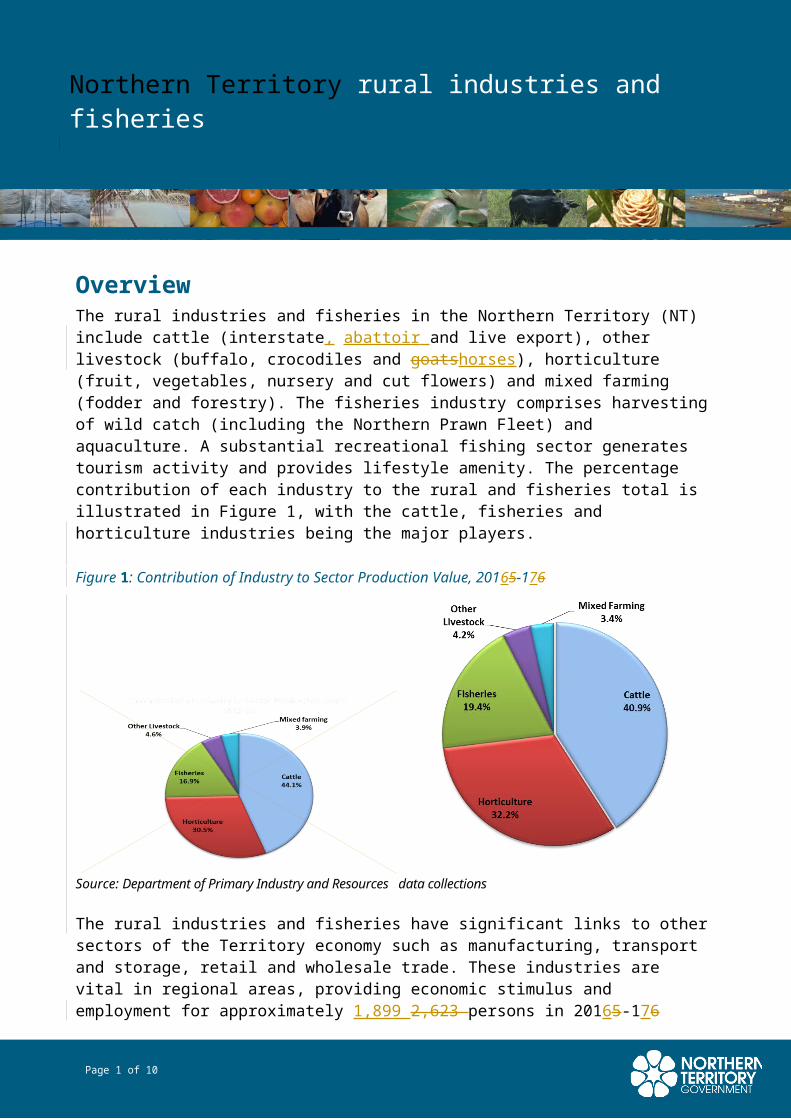
Overview The rural industries and fisheries in the Northern Territory (NT) include cattle (interstate, abattoir and live export), other livestock (buffalo, crocodiles and goatshorses), horticulture (fruit, vegetables, nursery and cut flowers) and mixed farming (fodder and forestry). The fisheries industry comprises harvesting of wild catch (including the Northern Prawn Fleet) and aquaculture. A substantial recreational fishing sector generates tourism activity and provides lifestyle amenity. The percentage contribution of each industry to the rural and fisheries total is illustrated in Figure 1, with the cattle, fisheries and horticulture industries being the major players.
Figure 1: Contribution of Industry to Sector Production Value, 20165-176
Source: Department of Primary Industry and Resources data collections
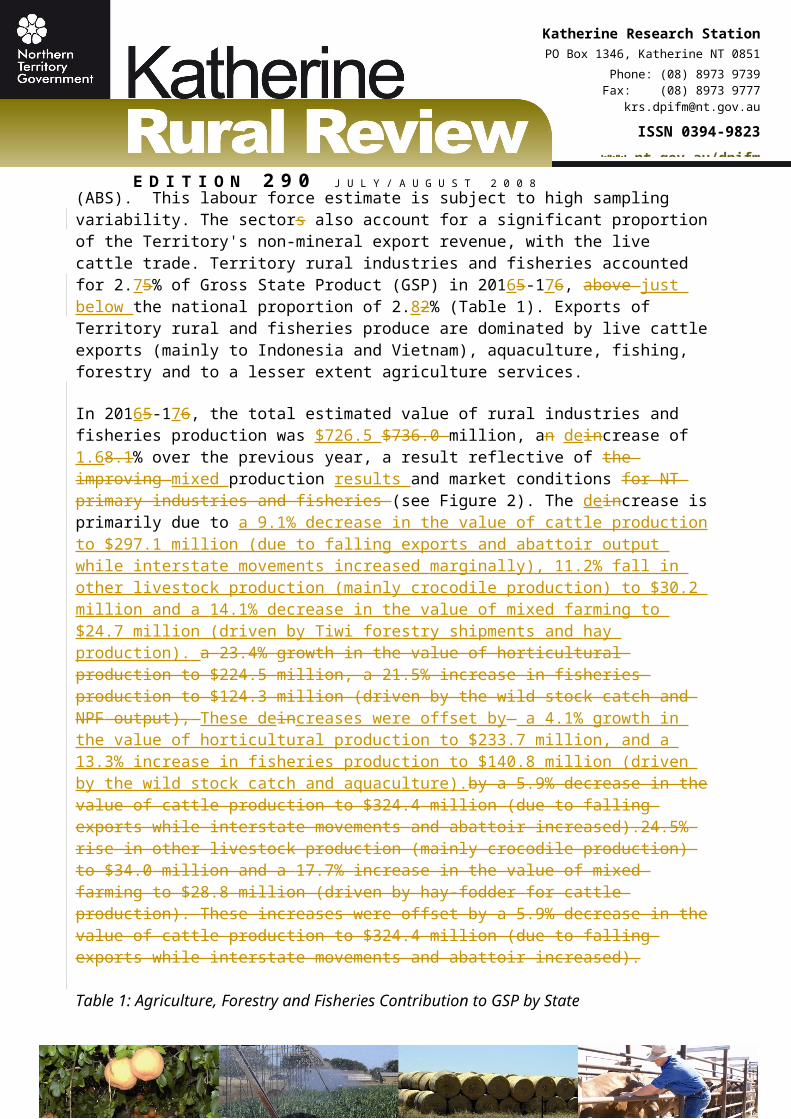
The rural industries and fisheries have significant links to other sectors of the Territory economy such as manufacturing, transport and storage, retail and wholesale trade. These industries are vital in regional areas, providing economic stimulus and employment for approximately 1,899 2,623 persons in 20165-176 (ABS). This labour force estimate is subject to high sampling variability. The sectors also account for a significant proportion of the Territory's non-mineral export revenue, with the live cattle trade. Territory rural industries and fisheries accounted for 2.75% of Gross State Product (GSP) in 20165-176, above just below the national proportion of 2.82% (Table 1). Exports of Territory rural and fisheries produce are dominated by live cattle
Page 1 of 10
E D I T I O N 2 9 0 J U L Y / A U G U S T 2 0 0 8
1
Katherine Research StationPO Box 1346, Katherine NT 0851
Phone: (08) 8973 9739Fax: (08) 8973 9777
ISSN 0394-9823www.nt.gov.au/dpifm
exports (mainly to Indonesia and Vietnam), aquaculture, fishing, forestry and to a lesser extent agriculture services.
In 20165-176, the total estimated value of rural industries and fisheries production was $726.5 $736.0 million, an deincrease of 1.68.1% over the previous year, a result reflective of the improving mixed production results and market conditions for NT primary industries and fisheries (see Figure 2). The deincrease is primarily due to a 9.1% decrease in the value of cattle production to $297.1 million (due to falling exports and abattoir output while interstate movements increased marginally), 11.2% fall in other livestock production (mainly crocodile production) to $30.2 million and a 14.1% decrease in the value of mixed farming to $24.7 million (driven by Tiwi forestry shipments and hay production). a 23.4% growth in the value of horticultural production to $224.5 million, a 21.5% increase in fisheries production to $124.3 million (driven by the wild stock catch and NPF output), These deincreases were offset by a 4.1% growth in the value of horticultural production to $233.7 million, and a 13.3% increase in fisheries production to $140.8 million (driven by the wild stock catch and aquaculture).by a 5.9% decrease in the value of cattle production to $324.4 million (due to falling exports while interstate movements and abattoir increased).24.5% rise in other livestock production (mainly crocodile production) to $34.0 million and a 17.7% increase in the value of mixed farming to $28.8 million (driven by hay-fodder for cattle production). These increases were offset by a 5.9% decrease in the value of cattle production to $324.4 million (due to falling exports while interstate movements and abattoir increased).
Table 1: Agriculture, Forestry and Fisheries Contribution to GSP by State
20165-176 % Contribution to GSP
TasmaniaTasmania 9.6%8.9%South AustraliaSouth Australia
5.9%4.5%
QueenslandQueensland 3.4%2.5%Western AustraliaNorthern Territory
2.9%2.5%
Northern TerritoryVictoria
2.7%2.4%
Victoria Western Australia
2.6%2.1%
NSWNew South Wales 1.8%1.3%Australian Capital Territory Australian Capital Territory
0.1%0.1%
E D I T I O N 2 9 0 J U L Y / A U G U S T 2 0 0 8
1
Katherine Research StationPO Box 1346, Katherine NT 0851
Phone: (08) 8973 9739Fax: (08) 8973 9777
ISSN 0394-9823www.nt.gov.au/dpifm
Australia (% of GDP)Australia (% of GDP)
2.8%2.2%
Source: ABS 5220.0

E D I T I O N 2 9 0 J U L Y / A U G U S T 2 0 0 8
1
Katherine Research StationPO Box 1346, Katherine NT 0851
Phone: (08) 8973 9739Fax: (08) 8973 9777
ISSN 0394-9823www.nt.gov.au/dpifm
Figure 2: NT Rural Industries and Fisheries Production Value
Source: Department of Primary Industry and Resources data collections
E D I T I O N 2 9 0 J U L Y / A U G U S T 2 0 0 8
1
Katherine Research StationPO Box 1346, Katherine NT 0851
Phone: (08) 8973 9739Fax: (08) 8973 9777
ISSN 0394-9823www.nt.gov.au/dpifm
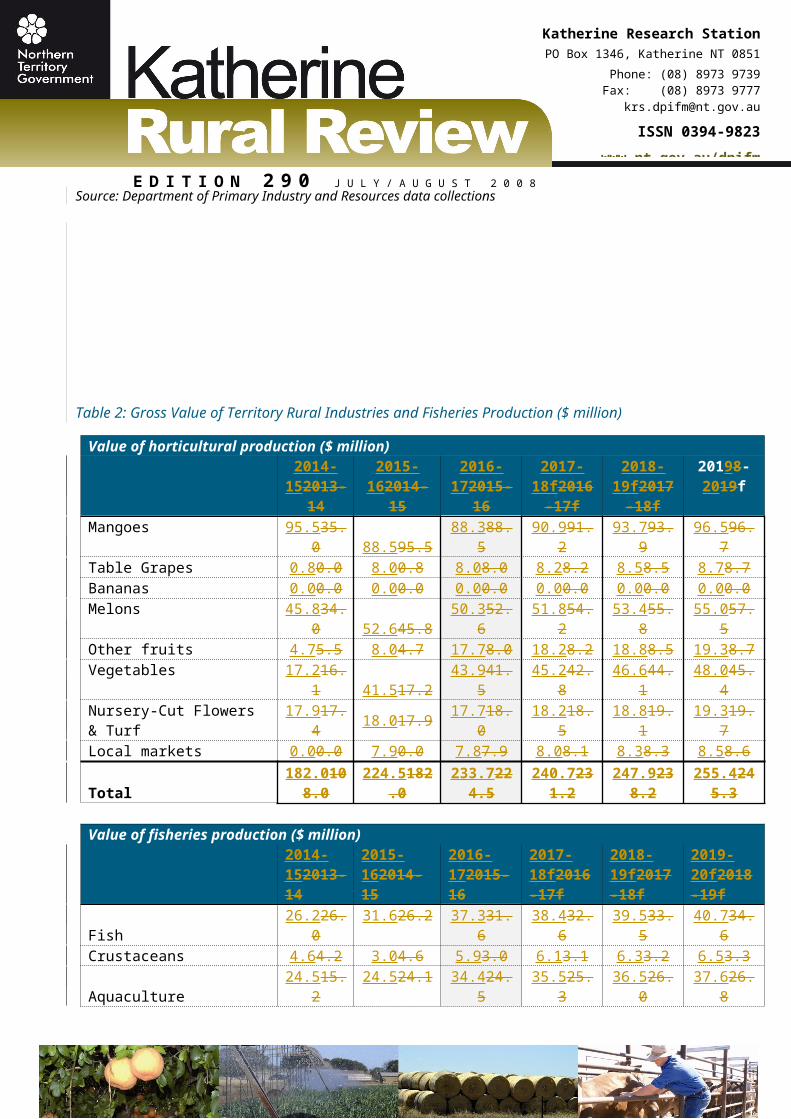
Table 2: Gross Value of Territory Rural Industries and Fisheries Production ($ million)
Value of horticultural production ($ million)2014-
152013-
14
2015-162014-
15
2016-1
72015-16
2017-18
f2016-17f
2018-19
f2017-18f
20198-2019f
Mangoes 95.535.0 88.595.5 88.388.5 90.991.2 93.793.9 96.596.7
Table Grapes 0.80.0 8.00.8 8.08.0 8.28.2 8.58.5 8.78.7Bananas 0.00.0 0.00.0 0.00.0 0.00.0 0.00.0 0.00.0Melons 45.
834.0 52.645.8 50.352.6 51.854.2 53.455.8 55.057.5Other fruits 4.75.5 8.04.7 17.78.0 18.28.2 18.88.5 19.38.7Vegetables 17.
216.1 41.517.2 43.941.5 45.242.8 46.644.1 48.045.4Nursery-Cut Flowers & Turf
17.917.4 18.017.9 17.718.0 18.218.5 18.819.1 19.319.7
Local markets 0.00.0 7.90.0 7.87.9 8.08.1 8.38.3 8.58.6
Total182.
0108.0224.
5182.0233.
7224.5240.
7231.2247.
9238.2255.
4245.3
Value of fisheries production ($ million)2014-152013-14
2015-162014-15
2016-172015-16
2017-18f2016-17f
2018-19f2017-18f
2019-20f2018-19f
Fish26.
226.031.626.2 37.331.6 38.432.6 39.533.5 40.734.6
Crustaceans 4.64.2 3.04.6 5.93.0 6.13.1 6.33.2 6.53.3
Aquaculture24.
515.224.524.1 34.424.5 35.525.3 36.526.0 37.626.8
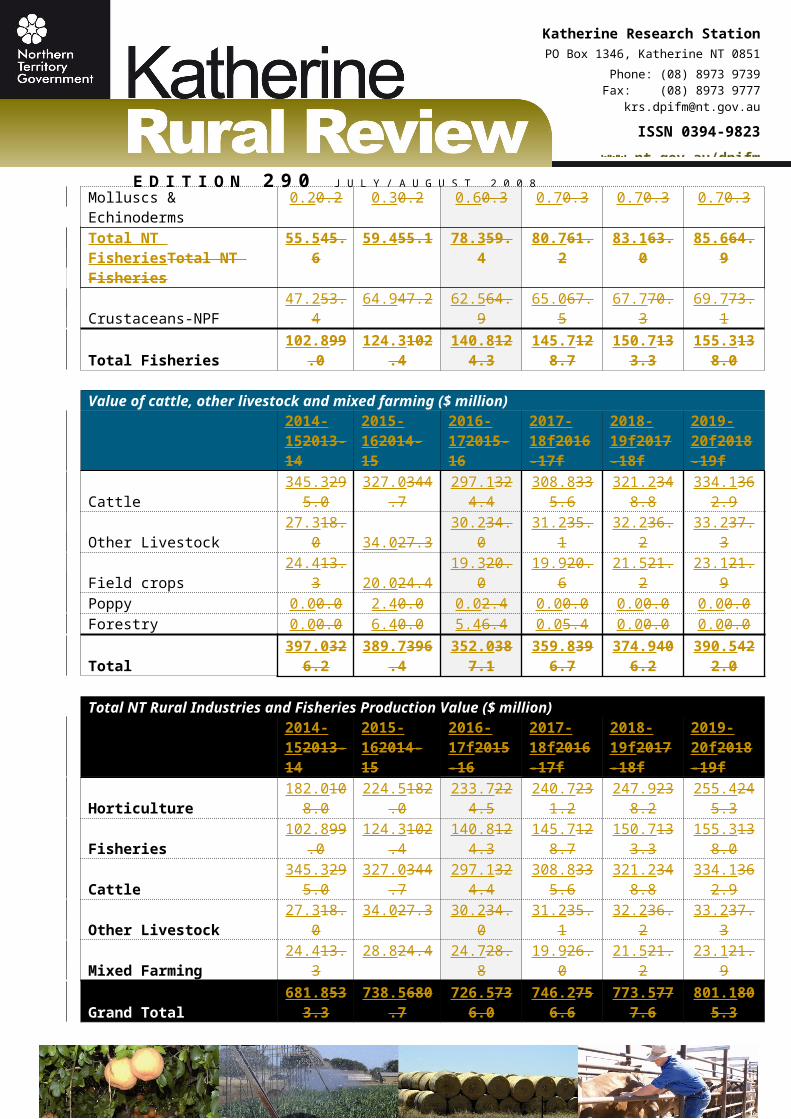
Molluscs & Echinoderms 0.20.2 0.30.2 0.60.3 0.70.3 0.70.3 0.70.3Total NT FisheriesTotal NT Fisheries
55.545.6
59.455.1 78.359.4
80.761.2
83.163.0
85.664.9
Crustaceans-NPF47.
253.464.947.2 62.564.9 65.067.5 67.770.3 69.773.1
Total Fisheries 102. 124. 140. 145. 150. 155.
E D I T I O N 2 9 0 J U L Y / A U G U S T 2 0 0 8
1
Katherine Research StationPO Box 1346, Katherine NT 0851
Phone: (08) 8973 9739Fax: (08) 8973 9777
ISSN 0394-9823www.nt.gov.au/dpifm
899.0 3102.4 8124.3 7128.7 7133.3 3138.0
Value of cattle, other livestock and mixed farming ($ million)2014-152013-14
2015-162014-15
2016-172015-16
2017-18f2016-17f
2018-19f2017-18f
2019-20f2018-19f
Cattle345.
3295.0327.
0344.7297.
1324.4308.
8335.6321.
2348.8334.
1362.9
Other Livestock27.
318.0 34.027.3 30.234.0 31.235.1 32.236.2 33.237.3
Field crops24.
413.3 20.024.4 19.320.0 19.920.6 21.521.2 23.121.9Poppy 0.00.0 2.40.0 0.02.4 0.00.0 0.00.0 0.00.0Forestry 0.00.0 6.40.0 5.46.4 0.05.4 0.00.0 0.00.0
Total397.
0326.2389.
7396.4352.
0387.1359.
8396.7374.
9406.2390.
5422.0
Total NT Rural Industries and Fisheries Production Value ($ million)2014-152013-14
2015-162014-15
2016-17f2015-16
2017-18f2016-17f
2018-19f2017-18f
2019-20f2018-19f
Horticulture182.
0108.0224.
5182.0233.
7224.5240.
7231.2247.
9238.2255.
4245.3
Fisheries102.
899.0124.
3102.4140.
8124.3145.
7128.7150.
7133.3155.
3138.0
Cattle345.
3295.0327.
0344.7297.
1324.4308.
8335.6321.
2348.8334.
1362.9
Other Livestock27.
318.034.027.3 30.234.0 31.235.1 32.236.2 33.237.3
Mixed Farming24.
413.328.824.4 24.728.8 19.926.0 21.521.2 23.121.9
Grand Total681.
8533.3738.
5680.7726.
5736.0746.
2756.6773.
5777.6801.
1805.3Source: Department of Primary Industry and Resources data collections, f = forecast. (1) Please note all figures here have been rounded respectively and may not tally to totals. (2) NPF = Northern Prawn Fleet (Commonwealth-managed fishery). (3) Cattle valuations are calculated using farm gate production values not market or whole of industry contribution values. (4) Locals Markets value is derived from production sold at markets located mainly in Darwin plus production sold to supermarket chains.
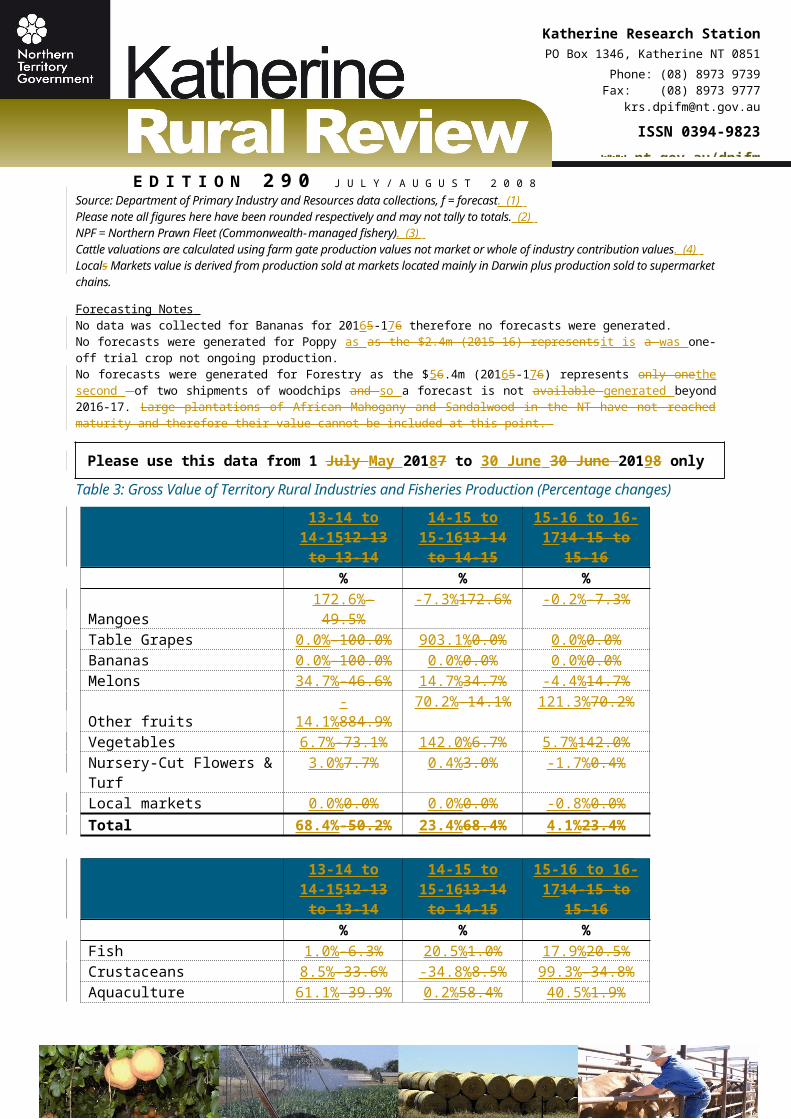
Forecasting Notes No data was collected for Bananas for 20165-176 therefore no forecasts were generated.No forecasts were generated for Poppy as as the $2.4m (2015-16) representsit is a was one-off trial crop not ongoing production.No forecasts were generated for Forestry as the $56.4m (20165-176) represents only onethe second of two shipments of woodchips and so a forecast is not available generated beyond 2016-17. Large plantations of African Mahogany and Sandalwood in the NT have not reached maturity and therefore their value cannot be included at this point.
E D I T I O N 2 9 0 J U L Y / A U G U S T 2 0 0 8
1
Katherine Research StationPO Box 1346, Katherine NT 0851
Phone: (08) 8973 9739Fax: (08) 8973 9777
ISSN 0394-9823www.nt.gov.au/dpifm
Please use this data from 1 July May 20187 to 30 June 30 June 20198 onlyTable 3: Gross Value of Territory Rural Industries and Fisheries Production (Percentage changes)
13-14 to 14-1512-13 to
13-14
14-15 to 15-1613-14 to
14-15
15-16 to 16-1714-15 to
15-16% % %
Mangoes172.6%-49.5%
-7.3%172.6% -0.2%-7.3%
Table Grapes 0.0%-100.0% 903.1%0.0% 0.0%0.0%Bananas 0.0%-100.0% 0.0%0.0% 0.0%0.0%Melons 34.7%-46.6% 14.7%34.7% -4.4%14.7%
Other fruits-
14.1%884.9%70.2%-14.1% 121.3%70.2%
Vegetables 6.7%-73.1% 142.0%6.7% 5.7%142.0%Nursery-Cut Flowers & Turf
3.0%7.7% 0.4%3.0% -1.7%0.4%
Local markets 0.0%0.0% 0.0%0.0% -0.8%0.0%
Total68.4%-50.2%
23.4%68.4% 4.1%23.4%
13-14 to 14-1512-13 to
13-14
14-15 to 15-1613-14 to
14-15
15-16 to 16-1714-15 to
15-16% % %
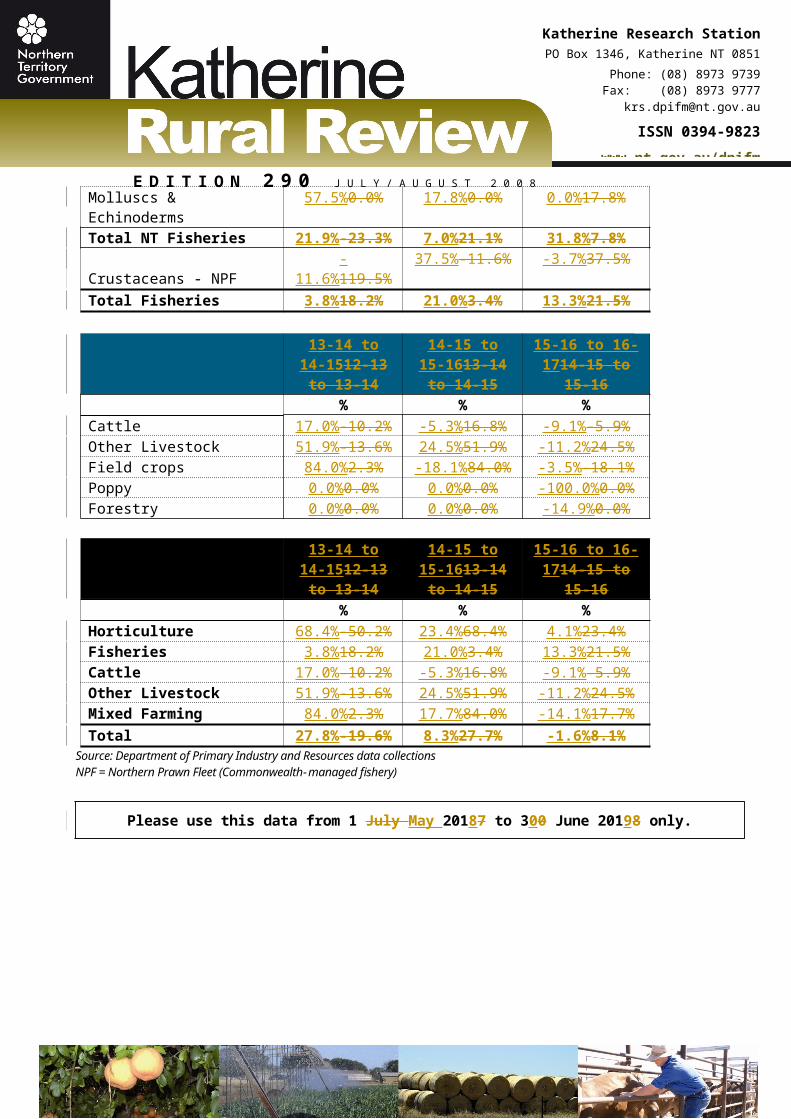
Fish 1.0%-6.3% 20.5%1.0% 17.9%20.5%Crustaceans 8.5%-33.6% -34.8%8.5% 99.3%-34.8%Aquaculture 61.1%-39.9% 0.2%58.4% 40.5%1.9%Molluscs & Echinoderms 57.5%0.0% 17.8%0.0% 0.0%17.8%
Total NT Fisheries21.9%-23.3%
7.0%21.1% 31.8%7.8%
Crustaceans - NPF-
11.6%119.5%37.5%-11.6% -3.7%37.5%
Total Fisheries 3.8%18.2% 21.0%3.4% 13.3%21.5%
13-14 to 14-1512-13 to
13-14
14-15 to 15-1613-14 to
14-15
15-16 to 16-1714-15 to
15-16% % %
Cattle 17.0%-10.2% -5.3%16.8% -9.1%-5.9%Other Livestock 51.9%-13.6% 24.5%51.9% -11.2%24.5%Field crops 84.0%2.3% -18.1%84.0% -3.5%-18.1%Poppy 0.0%0.0% 0.0%0.0% -100.0%0.0%Forestry 0.0%0.0% 0.0%0.0% -14.9%0.0%
E D I T I O N 2 9 0 J U L Y / A U G U S T 2 0 0 8
1
Katherine Research StationPO Box 1346, Katherine NT 0851
Phone: (08) 8973 9739Fax: (08) 8973 9777
ISSN 0394-9823www.nt.gov.au/dpifm
13-14 to 14-1512-13 to
13-14
14-15 to 15-1613-14 to
14-15
15-16 to 16-1714-15 to
15-16% % %
Horticulture 68.4%-50.2% 23.4%68.4% 4.1%23.4%Fisheries 3.8%18.2% 21.0%3.4% 13.3%21.5%Cattle 17.0%-10.2% -5.3%16.8% -9.1%-5.9%Other Livestock 51.9%-13.6% 24.5%51.9% -11.2%24.5%Mixed Farming 84.0%2.3% 17.7%84.0% -14.1%17.7%
Total27.8%-19.6%
8.3%27.7% -1.6%8.1%
Source: Department of Primary Industry and Resources data collectionsNPF = Northern Prawn Fleet (Commonwealth-managed fishery)
Please use this data from 1 July May 20187 to 300 June 20198 only.
Economic Outlook 2017
\
AcknowledgementsThe important contributions made by staff of the Department of Primary Industry and Resources Crocodile Farmers Association of the Northern Territory, and NT Farmers Association are gratefully acknowledged.The author would like to thank the following contributors:Biosecurity and Product Integrity: Adele KluthNT Farmers Association: Ian Baker, Samantha Tocknell DPI&R Fisheries Group: Murray Barton, Thor Saunders, Hock Seng Lee Crocodile Farmers Association of the NT: Gae Mackay
Prepared by: Michael Jean
Contact DetailsMichael JeanSenior EconomistDepartment of Primary Industry and Resources GPO Box 3000, DARWIN NT 0801 Australia
Telephone: +61 8 8999 2242Email: [email protected]
DisclaimerWhile all care has been taken to ensure that information contained in this document is true and correct at the time of publication, changes in circumstances after the time of publication may impact on the accuracy of its information.The Northern Territory of Australia gives no warranty or assurance, and makes no representation as to the accuracy of any information or advice contained in this publication, or that it is suitable for your intended use.You should not rely upon information in this publication for the purpose of making any serious, business or investment decisions without obtaining independent and/or professional advice in relation to your particular situation.
Page 9 of 10

Economic Outlook 2017The NT of Australia disclaims any liability or responsibility or duty of care towards any person for loss or damage caused by any use of or reliance on the information contained in this publication.
Page 10 of 10