Embed Size (px)
Citation preview
Appalachian Regional Commission Economic Overview of Appalachia- 2011 Regional Planning and Research Division Sources: Bureau of Labor Statistics, Bureau of Economic Analysis, U.S. Census 202-884-7700 www.arc.gov/research Current dollars are adjusted for inflation using the PCE chained price index, base year=2005
4.6
4.7
4.9
4.9
6.1
4.6
4.3
9.3
9.7
8.8
8.8
11.1
10.5
10.1
9.6
9.7
9.2
9.8
10.9
9.9
9.9
4.0 5.0 6.0 7.0 8.0 9.0 10.0 11.0 12.0
United States
Appalachian Region
Northern Appalachia
North Central Appalachia
Central Appalachia
South Central Appalachia
Southern Appalachia
2007 peak 2009 2010Unemployment rate unemployed/ labor force, percent
1.2
0.9
0.3
0.7
0.6
1.0
1.5
-1.7
-2.0
-1.6
-2.7
-0.8
-1.8
-2.6
-3.0 -2.0 -1.0 0.0 1.0 2.0
United States
Appalachian Region
Northern Appalachia
North Central Appalachia
Central Appalachia
South Central Appalachia
Southern Appalachia
2001q4-2007q4 expansion 2007q4-2010q4 recessionEmployment average annual percent change
The Appalachian region was home to more than 25 million people in 2010, covering 420 counties in 13 states from New York to Mississippi. Once highly dependent on mining, forestry, agriculture, chemical, and heavy industries, the region's economy has become more diverse in recent times. The region now includes diverse manufacturing and professional and technical service industries, as well as several auto manufacturing plants and a vast network of suppliers. Appalachia has come a long way. In 1965, one in three Appalachians lived in poverty. The average poverty rate from 2005-09 was 15.4%, close to the national average. The number of high poverty Appalachian counties (where the poverty rate is at least 1.5 times the U.S. average) declined from 295 to 120 over that period of time. These gains have transformed the region from one of widespread poverty to one of great contrasts. Some communities have successfully diversified their economies, while others are still isolated and require basic educational and infrastructure improvements such as roads and water and sewer systems. Despite this progress, Appalachia still does not enjoy the same economic vitality and living conditions as the rest of the nation. The region’s traditional industries such as mining, manufacturing, textiles, and paper and wood products have faced intense global competition and are in decline. Population outmigration is among the worst in the nation, and there is continuing concern about the decline in Appalachia’s “prime age” workforce—workers between the ages of 25 and 55. The Central Appalachian region in particular still battles economic distress, with concentrated areas of high poverty, unemployment, poor health, and severe educational disparities. During this recession the Appalachian region fared far worse than the nation and was battered by job losses and structural economic changes. The role of the Commission is to make targeted investments in human and physical capital that will help Appalachia reach parity with the rest of the nation. The region’s isolation and its difficulty with diversifying its economy over past decades are major factors contributing to the gap in living standards and economic achievement. This era of intense global competition requires a special emphasis on identifying assets and opportunities, overcoming barriers to progress, and helping the people of Appalachia become a globally competitive workforce.
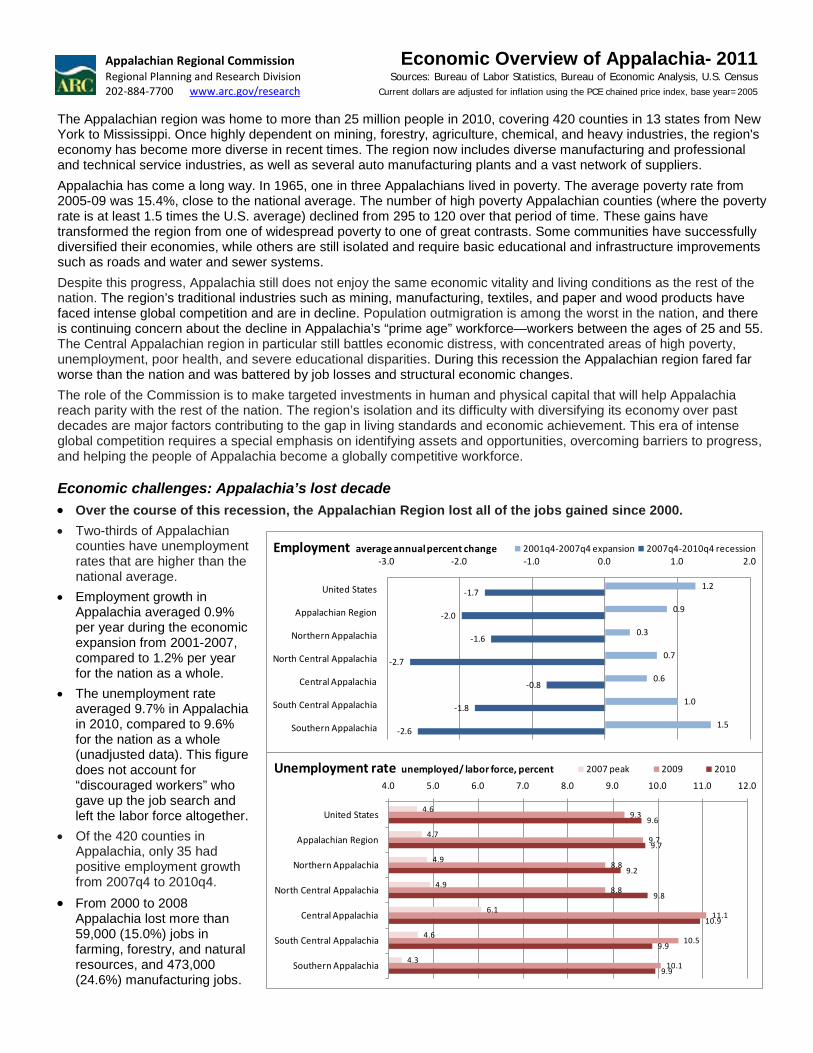
Economic challenges: Appalachia’s lost decade • Over the course of this recession, the Appalachian Region lost all of the jobs gained since 2000. • Two-thirds of Appalachian
counties have unemployment rates that are higher than the national average.
• Employment growth in Appalachia averaged 0.9% per year during the economic expansion from 2001-2007, compared to 1.2% per year for the nation as a whole.
• The unemployment rate averaged 9.7% in Appalachia in 2010, compared to 9.6% for the nation as a whole (unadjusted data). This figure does not account for “discouraged workers” who gave up the job search and left the labor force altogether.
• Of the 420 counties in Appalachia, only 35 had positive employment growth from 2007q4 to 2010q4.
• From 2000 to 2008 Appalachia lost more than 59,000 (15.0%) jobs in farming, forestry, and natural resources, and 473,000 (24.6%) manufacturing jobs.
Appalachian Regional Commission Economic Overview of Appalachia- 2011 Regional Planning and Research Division Sources: Bureau of Labor Statistics, Bureau of Economic Analysis, U.S. Census 202-884-7700 www.arc.gov/research Current dollars are adjusted for inflation using the PCE chained price index, base year=2005
36,306
29,702
31,931
28,703
24,578
28,926
29,358
20,000 24,000 28,000 32,000 36,000 40,000
United States
Appalachian Region
Northern Appalachia
North Central Appalachia
Central Appalachia
South Central Appalachia
Southern Appalachia
2009 2007 2000 Per Capita Personal Income (2005$)
29,945
22,491
23,983
21,045
15,964
21,702
23,428
14,000 18,000 22,000 26,000 30,000 34,000
United States
Appalachian Region
Northern Appalachia
North Central Appalachia
Central Appalachia
South Central Appalachia
Southern Appalachia
2009 2007 2000 Per Capita Market Income (2005$)
25,261
18,489
21,484
18,246
12,974
17,285
17,554
10,000 15,000 20,000 25,000 30,000 35,000
United States
Appalachian Region
Northern Appalachia
North Central Appalachia
Central Appalachia
South Central Appalachia
Southern Appalachia
2009 2007 2000 Average Proprietor's Income (2005$)
6,543
4,549
4,964
3,666
2,835
5,012
4,521
2,000 3,000 4,000 5,000 6,000 7,000
United States
Appalachian Region
Northern Appalachia
North Central Appalachia
Central Appalachia
South Central Appalachia
Southern Appalachia
2009 2007 2000 Per Capita Investment Income (2005$)Includes Income from dividends, interest, and rent
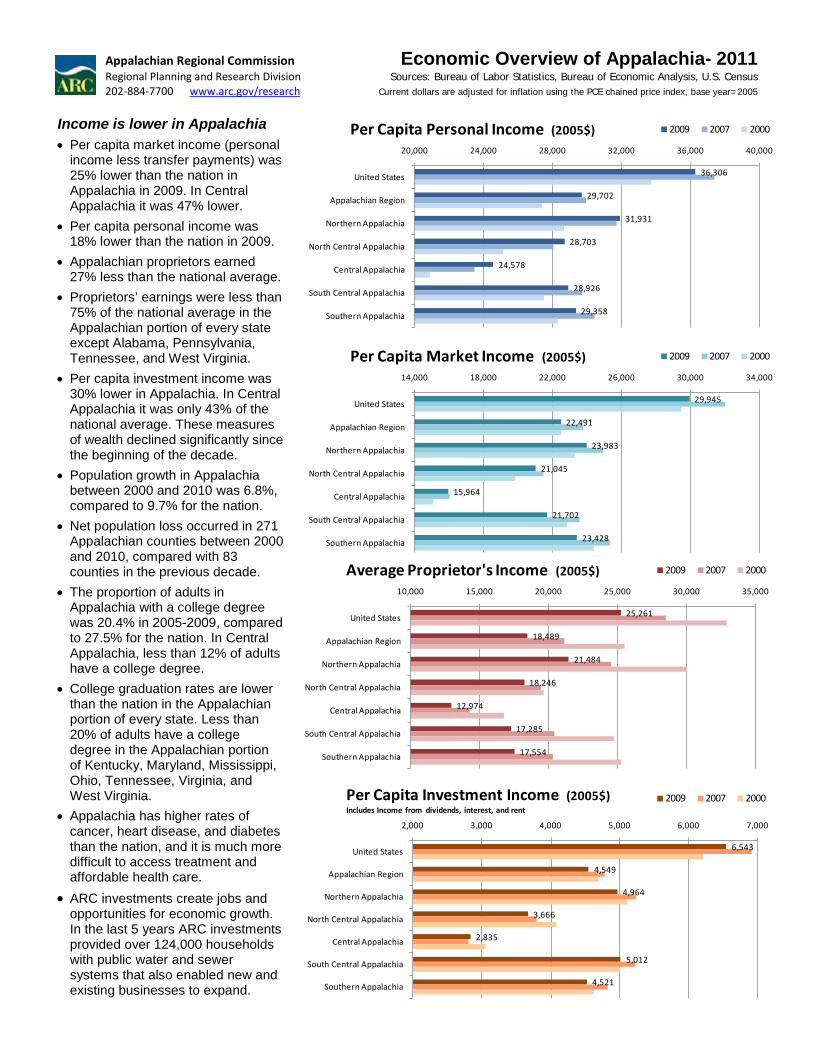
Income is lower in Appalachia • Per capita market income (personal
income less transfer payments) was 25% lower than the nation in Appalachia in 2009. In Central Appalachia it was 47% lower.
• Per capita personal income was 18% lower than the nation in 2009.
• Appalachian proprietors earned 27% less than the national average.
• Proprietors’ earnings were less than 75% of the national average in the Appalachian portion of every state except Alabama, Pennsylvania, Tennessee, and West Virginia.
• Per capita investment income was 30% lower in Appalachia. In Central Appalachia it was only 43% of the national average. These measures of wealth declined significantly since the beginning of the decade.
• Population growth in Appalachia between 2000 and 2010 was 6.8%, compared to 9.7% for the nation.
• Net population loss occurred in 271 Appalachian counties between 2000 and 2010, compared with 83 counties in the previous decade.
• The proportion of adults in Appalachia with a college degree was 20.4% in 2005-2009, compared to 27.5% for the nation. In Central Appalachia, less than 12% of adults have a college degree.
• College graduation rates are lower than the nation in the Appalachian portion of every state. Less than 20% of adults have a college degree in the Appalachian portion of Kentucky, Maryland, Mississippi, Ohio, Tennessee, Virginia, and West Virginia.
• Appalachia has higher rates of cancer, heart disease, and diabetes than the nation, and it is much more difficult to access treatment and affordable health care.
• ARC investments create jobs and opportunities for economic growth. In the last 5 years ARC investments provided over 124,000 households with public water and sewer systems that also enabled new and existing businesses to expand.
Appalachian Regional Commission Economic Overview of Appalachia- 2011 Regional Planning and Research Division Sources: Bureau of Labor Statistics, Bureau of Economic Analysis, U.S. Census 202-884-7700 www.arc.gov/research Current dollars are adjusted for inflation using the PCE chained price index, base year=2005
336134 54
896
1,453 1,548
876 983
1,485
429
1,428
1,930
252
1,532
0
500
1,000
1,500
2,000
2,500
2000 2008 2020Total Employment by Industry, Appalachian Region (thousands)
7.3%
-15.0%
39.7%
-13.4%
13.7%
-24.6%
-0.1%
6.9%
31.1%24.7%
8.0%
23.5%17.5%
-5.0%
10.2%
-40%
-20%
0%
20%
40%
60%
United States AppalachiaEmployment Change by Industry, Appalachia 2000-08
2.5%1.0% 0.4%
6.7%
10.9% 11.6%
6.6% 7.4%
11.1%
3.2%
10.7%
14.5%
1.9%
11.5%
0%
4%
8%
12%
16%
United States AppalachiaIndustry Shares of Total Employment, Appalachia 2008
1.31
1.58
1.251.09
1.41
1.12
0.95
0.77 0.80 0.79
1.05
0.99
0.70
1.06
0.6
1.0
1.4
1.8
United States AppalachiaIndustry Index , Appalachia 2008 ratio to U.S. share: U.S.=1
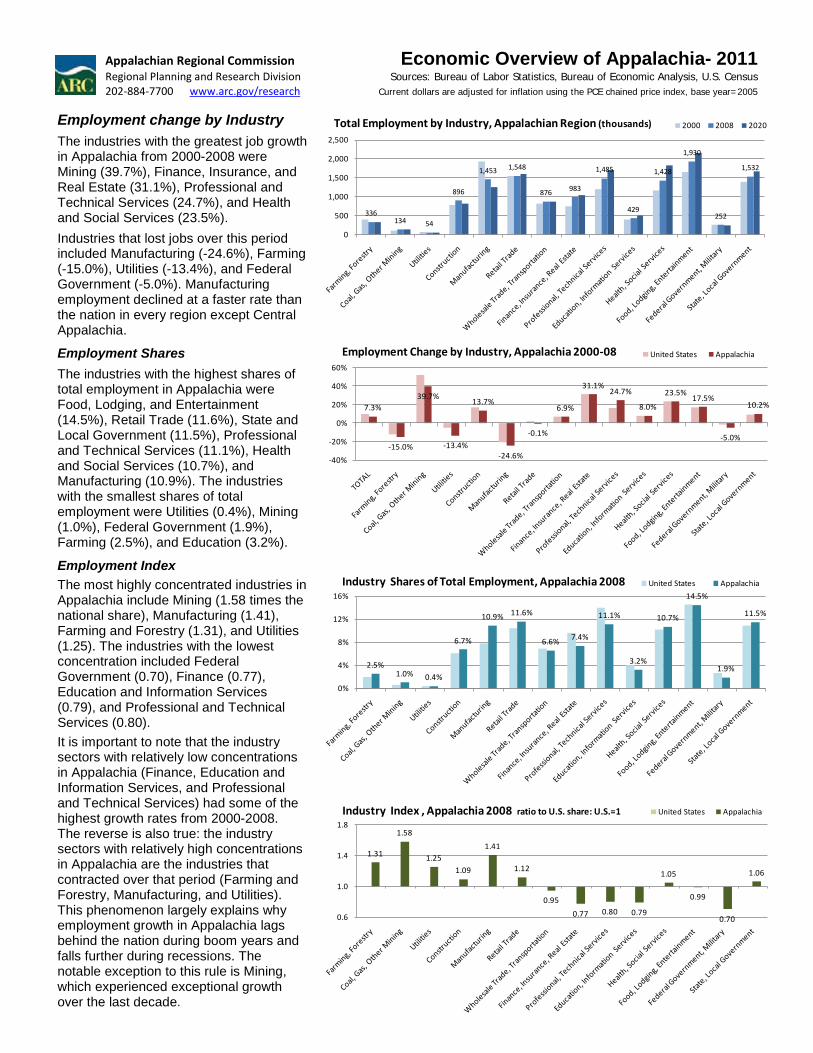
Employment change by Industry The industries with the greatest job growth in Appalachia from 2000-2008 were Mining (39.7%), Finance, Insurance, and Real Estate (31.1%), Professional and Technical Services (24.7%), and Health and Social Services (23.5%). Industries that lost jobs over this period included Manufacturing (-24.6%), Farming (-15.0%), Utilities (-13.4%), and Federal Government (-5.0%). Manufacturing employment declined at a faster rate than the nation in every region except Central Appalachia.
Employment Shares The industries with the highest shares of total employment in Appalachia were Food, Lodging, and Entertainment (14.5%), Retail Trade (11.6%), State and Local Government (11.5%), Professional and Technical Services (11.1%), Health and Social Services (10.7%), and Manufacturing (10.9%). The industries with the smallest shares of total employment were Utilities (0.4%), Mining (1.0%), Federal Government (1.9%), Farming (2.5%), and Education (3.2%).
Employment Index The most highly concentrated industries in Appalachia include Mining (1.58 times the national share), Manufacturing (1.41), Farming and Forestry (1.31), and Utilities (1.25). The industries with the lowest concentration included Federal Government (0.70), Finance (0.77), Education and Information Services (0.79), and Professional and Technical Services (0.80). It is important to note that the industry sectors with relatively low concentrations in Appalachia (Finance, Education and Information Services, and Professional and Technical Services) had some of the highest growth rates from 2000-2008. The reverse is also true: the industry sectors with relatively high concentrations in Appalachia are the industries that contracted over that period (Farming and Forestry, Manufacturing, and Utilities). This phenomenon largely explains why employment growth in Appalachia lags behind the nation during boom years and falls further during recessions. The notable exception to this rule is Mining, which experienced exceptional growth over the last decade.
Appalachian Regional Commission Economic Overview of Appalachia- 2011 Regional Planning and Research Division Sources: Bureau of Labor Statistics, Bureau of Economic Analysis, U.S. Census 202‐884‐7700 www.arc.gov/research Current dollars are adjusted for inflation using the PCE chained price index, base year=2005
$0
$4,000
$8,000
$12,000
$16,000
Per Capita Federal Expenditures Source: Consolidated Federal Funds Report
US 2010 US 2007
Appalachia 2010 Appalachia 2007
72%
97%
25%
87%
70%
53%
69%
89%
34%
76%68%
51%
0.20
0.40
0.60
0.80
1.00
Per Capita Federal Expenditures IndexAppalachian Region as percentage of national average
Source: Consolidated Federal Funds Report
2007 2010
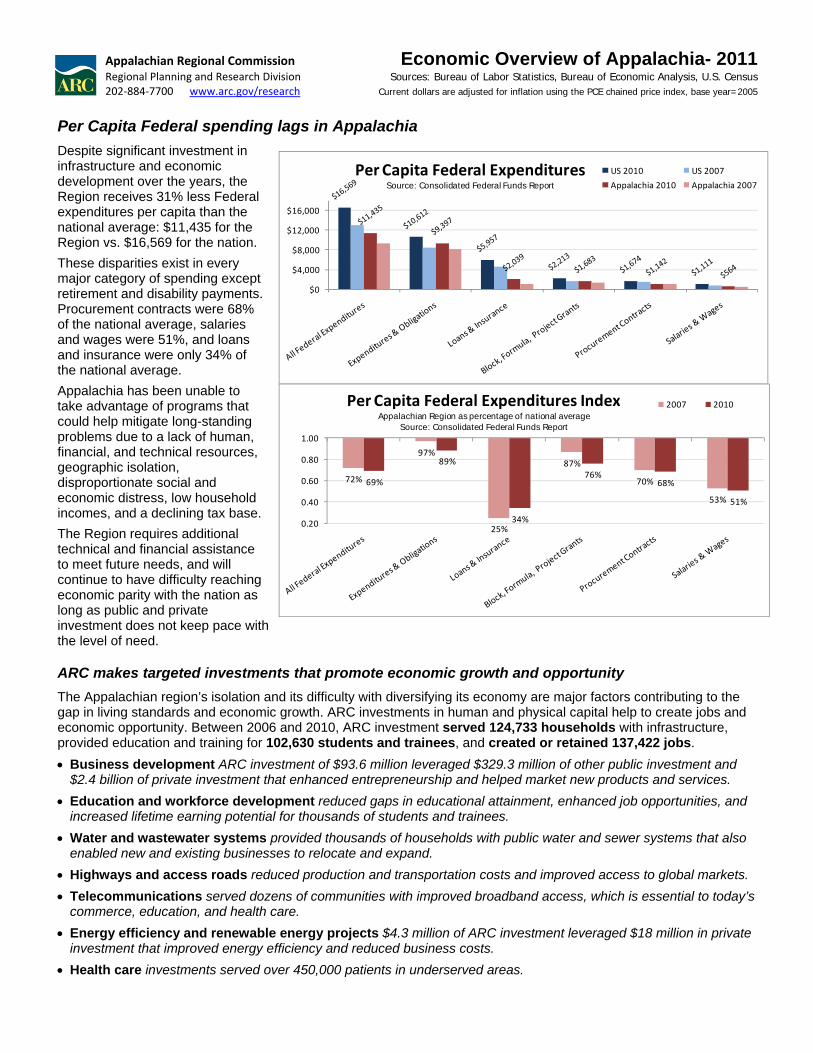
Per Capita Federal spending lags in Appalachia
Despite significant investment in infrastructure and economic development over the years, the Region receives 31% less Federal expenditures per capita than the national average: $11,435 for the Region vs. $16,569 for the nation.
These disparities exist in every major category of spending except retirement and disability payments. Procurement contracts were 68% of the national average, salaries and wages were 51%, and loans and insurance were only 34% of the national average.
Appalachia has been unable to take advantage of programs that could help mitigate long-standing problems due to a lack of human, financial, and technical resources, geographic isolation, disproportionate social and economic distress, low household incomes, and a declining tax base.
The Region requires additional technical and financial assistance to meet future needs, and will continue to have difficulty reaching economic parity with the nation as long as public and private investment does not keep pace with the level of need.
ARC makes targeted investments that promote economic growth and opportunity
The Appalachian region’s isolation and its difficulty with diversifying its economy are major factors contributing to the gap in living standards and economic growth. ARC investments in human and physical capital help to create jobs and economic opportunity. Between 2006 and 2010, ARC investment served 124,733 households with infrastructure, provided education and training for 102,630 students and trainees, and created or retained 137,422 jobs.
Business development ARC investment of $93.6 million leveraged $329.3 million of other public investment and $2.4 billion of private investment that enhanced entrepreneurship and helped market new products and services.
Education and workforce development reduced gaps in educational attainment, enhanced job opportunities, and increased lifetime earning potential for thousands of students and trainees.
Water and wastewater systems provided thousands of households with public water and sewer systems that also enabled new and existing businesses to relocate and expand.
Highways and access roads reduced production and transportation costs and improved access to global markets.
Telecommunications served dozens of communities with improved broadband access, which is essential to today’s commerce, education, and health care.
Energy efficiency and renewable energy projects $4.3 million of ARC investment leveraged $18 million in private investment that improved energy efficiency and reduced business costs.
Health care investments served over 450,000 patients in underserved areas.
Appalachian Regional Commission Economic Overview of Appalachia- 2011 Regional Planning and Research Division Sources: Bureau of Labor Statistics, Bureau of Economic Analysis, U.S. Census 202-884-7700 www.arc.gov/research Current dollars are adjusted for inflation using the PCE chained price index, base year=2005
$0
$4,000
$8,000
$12,000
$16,000
Per Capita Federal Expenditures Source: Consolidated Federal Funds Report FY2007 & FY2009 US 2007
US 2009Appalachia 2007Appalachia 2009
0.20
0.40
0.60
0.80
1.00
1.20
1.40
Per Capita Federal Expenditures IndexSource: Consolidated Federal Funds Report FY2007 & FY2009
Index 2007 (U.S.=1)
Index 2009 (U.S.=1)
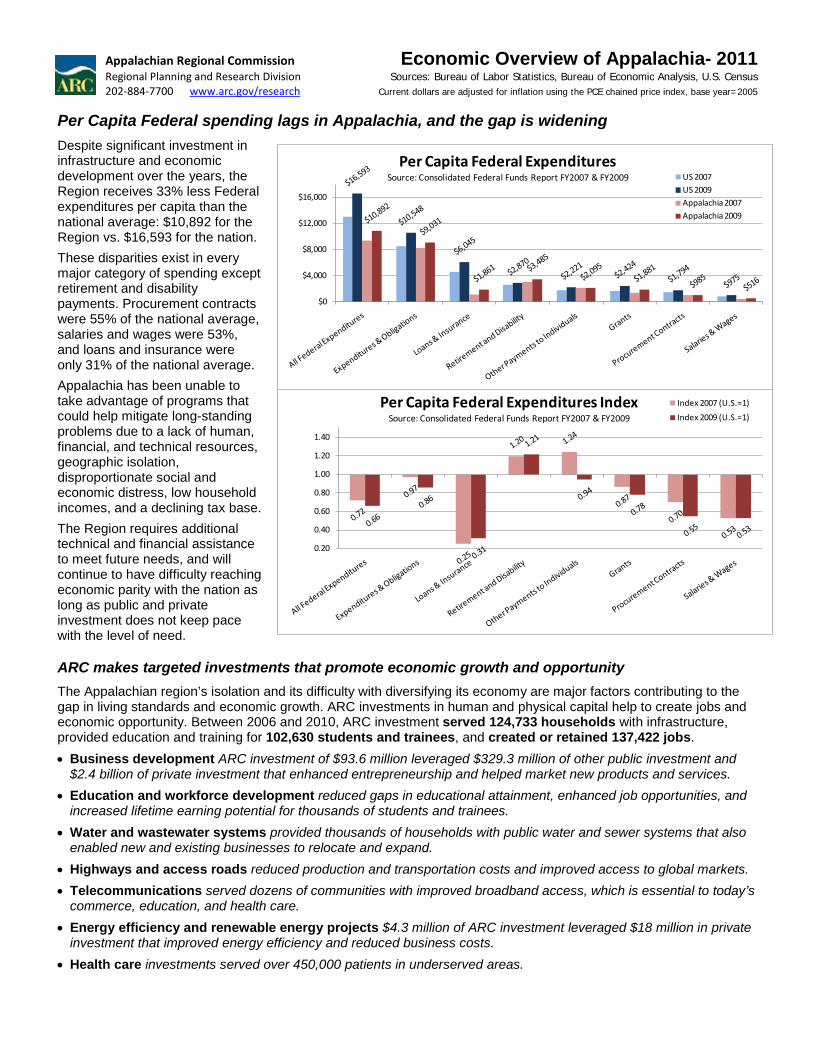
Per Capita Federal spending lags in Appalachia, and the gap is widening Despite significant investment in infrastructure and economic development over the years, the Region receives 33% less Federal expenditures per capita than the national average: $10,892 for the Region vs. $16,593 for the nation. These disparities exist in every major category of spending except retirement and disability payments. Procurement contracts were 55% of the national average, salaries and wages were 53%, and loans and insurance were only 31% of the national average. Appalachia has been unable to take advantage of programs that could help mitigate long-standing problems due to a lack of human, financial, and technical resources, geographic isolation, disproportionate social and economic distress, low household incomes, and a declining tax base. The Region requires additional technical and financial assistance to meet future needs, and will continue to have difficulty reaching economic parity with the nation as long as public and private investment does not keep pace with the level of need.
ARC makes targeted investments that promote economic growth and opportunity The Appalachian region’s isolation and its difficulty with diversifying its economy are major factors contributing to the gap in living standards and economic growth. ARC investments in human and physical capital help to create jobs and economic opportunity. Between 2006 and 2010, ARC investment served 124,733 households with infrastructure, provided education and training for 102,630 students and trainees, and created or retained 137,422 jobs. • Business development ARC investment of $93.6 million leveraged $329.3 million of other public investment and
$2.4 billion of private investment that enhanced entrepreneurship and helped market new products and services. • Education and workforce development reduced gaps in educational attainment, enhanced job opportunities, and
increased lifetime earning potential for thousands of students and trainees. • Water and wastewater systems provided thousands of households with public water and sewer systems that also
enabled new and existing businesses to relocate and expand. • Highways and access roads reduced production and transportation costs and improved access to global markets. • Telecommunications served dozens of communities with improved broadband access, which is essential to today’s
commerce, education, and health care. • Energy efficiency and renewable energy projects $4.3 million of ARC investment leveraged $18 million in private
investment that improved energy efficiency and reduced business costs. • Health care investments served over 450,000 patients in underserved areas.