Embed Size (px)
Citation preview
ECFIN/407/00-EN This paper exists in English only
ECONOMIC PAPERS
Number 145 September 2000
Time –Varying Nairu / NawruEstimates for
the EU's Member States
by
K. Mc Morrow and W. Roeger*
* The authors are economists in the Directorate-General for Economic andFinancial Affairs (ECFIN) of the European Commission.
Acknowledgements: The authors would like to thank A. Dramais for hisvaluable comments and assistance with this paper.


© European Communities, 2000.


3
TIME –VARYING NAIRU / NAWRU ESTIMATES FOR THE EU'SM EMBER STATES
TABLE OF CONTENTS
INTRODUCTORY REMARKS
SECTION 1 : NAIRU / NAWRU M ODELLING STRATEGY : ATHEORETICAL OVERVIEW
1.1 : NAIRU M ODELLING METHODS
1.2 : DESCRIPTION OF PREFERRED NAIRU M ODELLING STRATEGY
1.3 : TAXATION AND WAGE DETERMINATION
1.4 : RATIONALE FOR I NCLUSION OF REAL I NTEREST RATE VARIABLE
SECTION 2 : EMPIRICAL TESTING OF "H YBRID " NAIRU / NAWRUMODEL
2.1 : OUTLINE OF TESTING STRATEGY
2.2 : SUMMARY OF MAIN RESULTS
2.3 : SPECIFIC COMMENTS ON TAXATION /REAL I NTEREST RATE EFFECTS
SECTION 3 : HOW GOOD ARE THE NAIRU / NAWRU E STIMATES IN
EXPLAINING PAST CHANGES IN WAGE/PRICE I NFLATION ?
3.1 : IS THE UNEMPLOYMENT GAP TERM A STATIONARY OR NON
STATIONARY PROCESS ?3.2 : UNEMPLOYMENT GAPS AND CHANGES IN WAGE / PRICE I NFLATION
3.3 : COMPARISON WITH H-P FILTERED UNEMPLOYMENT GAPS
3.4 : REAL DISEQUILIBRIUM MEASURES: UNEMPLOYMENT V OUTPUT GAPS
BOX 1 : I TALY
SUMMARY AND CONCLUDING REMARKS
ANNEX 1: GRAPHIC PRESENTATION OF KEY EXPLANATORY VARIABLES

4
INTRODUCTORY REMARKS
In 1968 Friedman put forward the notion of a “natural” rate of unemployment toencapsulate the idea that a “normal” level of unemployment, roughly equivalent to theamount of frictional and structural unemployment, persists even when the labourmarket is in equilibrium. Since there are no direct measures of the natural rate, as it isessentially a theoretical construct, one must be satisfied with proxy estimates derivedusing various methods including that which draws on Tobin’s concept of the non-accelerating inflation rate of unemployment (i.e. the NAIRU).
The concept of the NAIRU should be seen in the context of the shift in the frameworkfor analysis of the labour market over the last number of decades from one focussedon whether the labour market clears or not, to one which allows for imperfectlycompetitive goods markets and recognises that unions have a role to play in terms ofwage determination. This shift to a bargaining framework of wage setting underimperfect competition is likely to lead to a NAIRU estimate which converges to anunemployment rate which is higher, because of the monopolistic element, comparedwith that under the classical competitive paradigm and its theoretically equivalentconcept of the natural rate.
The essential objective of the present paper is to produce statistically significant andeconomically reasonable, time-varying, NAIRU estimates (TV-NAIRU's) for theCommunity's Member States which also have informational content in terms ofinflation. While it is clearly difficult to estimate NAIRU's using variables to cover allthe main contributory factors which are likely to be at play, it may nevertheless bepossible to isolate the principal "sinners" by selecting a modelling strategy which isboth theoretically robust and empirically respectful of a number of key pre-determined criteria, including in particular the inflation tracking performance of theestimated NAIRU's / unemployment gaps.
The TV-NAIRU approach attempts to provide an indication of the path the NAIRUhas taken over a particular period, by including variables which capture the impact ofsignificant supply side shocks, over the period in question, which would have beenexpected to influence the NAIRU. Examples of the latter over the last number ofdecades include the slowdown in trend productivity growth, the large external oilprice shocks and the presumed deterioration, especially in Europe, in labour marketflexibility. One can introduce this « time varying » element by using either astatistical model to determine the NAIRU, which allows the NAIRU to vary butensures that this variation is smooth over time (eg Cubic Spline / Kalman Filterapproaches) or an economic model approach which uses additional economicvariables which capture the supply side shocks, mentioned above, to identify theNAIRU. The latter economic model approach is used in the present study for theperiod 1980-1999, with the introduction of variables like productivity, the real interestrate, the tax burden and replacement ratios etc having the effect of producing a « time-varying » NAIRU, which shifts over time due to changes in the respectivedetermining variables.

5
It should be stressed at the outset that precise measurements of the TV-NAIRU areextremely difficult to produce because any measurement process is dogged by theexistence of two fundamental sources of uncertainty. The first source of uncertaintyemanates from the fact that the NAIRU must be estimated since it is unobserved, withmany different modelling approaches and empirical specifications from which tochoose, all of which give plausible, although different, point measurements of theNAIRU. The second source of uncertainty is the degree of doubt surrounding theNAIRU point estimates themselves, which are imprecisely calculated from acombination of stochastic variables and parameters, with the computing of confidenceintervals for the latter highlighting the extent of the imprecision of the variousmethods used in the calculation. Given these latter uncertainties, it is hardlysurprising to find that the NAIRU is increasingly been seen not as a robust pointestimate but as a zone.
In overall terms, the methodology developed in this paper is not that different to thatadopted by the OECD to produce its NAWRU series since both this paper and theOECD use a method which in essence assumes that the change in wage/price inflationis proportional to the unemployment gap i.e. the gap between the actualunemployment rate and the calculated NAIRU/NAWRU series. However, while themethodology adopted has similarities with the OECD's approach, there are somenotable differences including in particular the inclusion of a number of structuralvariables such as real interest rates etc which try to give some indication of thesources of the change in the "reduced form" NAIRU over time. Furthermore, unlikethe OECD methodology, the approach adopted in this paper uses standard estimationmethods which allows for the computation of confidence intervals as well aspermitting the statistical and economic significance of the preferred explanatoryvariables to be checked and validated. Only those structural variables which arestatistically significant and have economically the expected coefficient sign are usedin the final model.
The paper is structured as follows. In section one, following a short overview of themain NAIRU modelling methods, the details of the preferred modelling strategywhich the paper intends to use to estimate TV-NAIRU's is presented, including theselection of appropriate variables to cover the main shocks, which occurred over theperiod since 1980, such as the productivity slowdown and real interest rate increases,as well as proxy variables to reflect the impact of institutional rigidities on reservationwage developments (i.e. taxation and replacement ratio variables). Section two goeson to give the results of the estimation process, with an important role found for thetaxation and real interest rate variables in a majority of the Community's countries.Finally, section three tests the NAIRU results in terms of their ability to explain pastmovements in wage inflation and also in terms of their usefulness in output gapmodels of price inflation.

6
SECTION 1 : NAIRU / NAWRU M ODELLING STRATEGY : ATHEORETICAL OVERVIEW
1.1 NAIRU M ODELLING METHODS : There are two broad modellingapproaches normally adopted in defining the NAIRU, firstly the expectations-augmented Phillips curve approach, which distinguishes a series of labour marketvariables as potential empirical determinants of the NAIRU, and secondly a numberof statistical methods in which the time series properties of the macroeconomicvariable(s) in question are used to identify the NAIRU. In general, the structuralapproach to estimating the NAIRU seems preferable since it allows for a bettereconomic interpretation of the results. We find in this study that the structuralapproach works reasonably well for all EU countries, except Italy where it proveddifficult to find an equilibrium unemployment rate with the chosen structuralindicators.
The calculation of the equilibrium or steady-state (i.e. stable inflation) value ofunemployment from an expectations-augmented Phillips curve framework constitutesa genuine estimate of the NAIRU given that the Phillips curve postulates a formalrelationship between the unemployment rate and wage/price inflation. As regards thisapproach, the NAIRU is established at the point where a stable relationship existsbetween the deviation of unemployment from the NAIRU and unexpected inflation.Within this dominant Phillips curve framework two variants have emerged, namelythe single equation inflation approach, an example being Gordon’s “Triangle” model(see Gordon 1997), with the latter postulating that the inflation rate depends on a“triangle” of basic factors, namely expected inflation, demand conditions, as proxiedby the unemployment gap, and supply side shocks, and the multiple equation wage-price model approach (e.g. the bargaining model)1.
1 BROAD THEORETICAL FRAMEWORK UNDERLYING THE BARGAINING “W AGE-PRICE” M ODELAPPROACH: Wage-Price models can be set up in a wide variety of ways to reflect the internationaldifferences between the labour and product market systems of individual countries. One widely usedwage-price model draws on the bargaining framework of wage determination. This latter bargainingview of the world interprets real wage developments as being the result of a bargaining processbetween employers and employees, the outcome of which reflects the relative degree of market powerpossessed by the actors involved. Workers bargaining power, for example, is negatively related to theprevailing rate of unemployment and positively influenced by factors which tend to push up real wagedemands such as generous social welfare benefits, mismatch problems in the labour market andunionisation rates. Under this approach real wages are the outcome of a negotiated compromisebetween the respective parties with employees, basing their nominal wage demands on aspirationsregarding a target real wage, and employers responding with views as to the feasible or warranted realwage. Bargaining models of wage determination suggest a process of wage bargaining closer to abilateral monopoly than to perfect competition. This approach, commonly referred to in the literature as“the battle of the mark-ups”, is associated with the work of Layard, Nickell and Jackman (1991) and isoften purported to be the most appropriate one to be adopted in the European context.
7
1.2 DESCRIPTION OF PREFERRED NAIRU M ODELLING STRATEGY : Themodelling approach used in the present paper represents essentially a “hybrid” formof both Gordon’s triangle model and of the bargaining framework underlying thelabour market specification of the Commission Services Quest II model, where wagerules are postulated, which identify productivity, reservation wage/participation ratechanges and labour market tightness as major determinants of workers wage claims.Wages in Quest II are in fact determined as a weighted average of the reservationwage ( unemployment benefits)2 and labour productivity plus an additional mark-upterm that depends on labour market conditions. In this framework unemployment canbe explained in terms of structural characteristics of the labour market, such asadjustment costs for labour, the replacement rate, the bargaining strength of tradeunions and tax rates.
LABOUR MARKET MACRO MODEL: In more specific terms, the structuralunemployment estimates presented in this note use a simple macro model of thelabour market which consists of a wage equation and a labour demand equation. Thestructural unemployment rate defined in this way would be the equilibrium of thatsystem after wages and prices have adjusted.
Wage Equation: Given the fact that market clearing is an unrealistic description ofEuropean labour markets, which are characterised by substantial involuntaryunemployment, the wage equation does not therefore rely on such a framework. It isassumed instead that wages are set in an imperfectly competitive fashion. It should benoted therefore that since the wage rule reflects wage setting in an imperfect market(e.g. union power, vacancy costs, search costs and efficiency wage considerations) theequilibrium reached in the labour market will generally be an equilibrium withinvoluntary unemployment. Standard macroeconomic models of the labour market(search-, union bargaining- and efficiency wage models) imply the followingspecification for the wage rule:
(1) W/P=w(rew(tl,ben),LUR,MPL)
Workers (trade unions) aim for a real wage(W/P) that depends, as mentioned earlier,on a reservation wage (rew), labour market tightness(LUR) and the marginal productof labour(MPL) 3. In particular workers will require that (net) wages are set equal toor above the reservation wage.4 Therefore unemployment benefits(ben) and labourtaxes(tl) can have an effect on the level of wages demanded by workers.
2 A replacement ratio effect which impacts on the consumption/leisure choice.
3 In some specifications, the wage equation is formulated in terms of the average product of labourinstead of the marginal product. These differences do, however, not affect the basic results.
4 From a theoretical point of view an ideal indicator would be the net replacement ratio. Unfortunately,benefits are not available over a sufficiently long period of time and obtaining a simple empiricalmeasure for the replacement ratio is difficult since one must capture the effects of both benefit durationand coverage. Therefore we make the simplifying assumption that movement of tax rates reflectchanges in the net replacement ratio. This is a reasonable approximation if the reservation wage is nottaxed and follows labour productivity.

8
Labour Demand Equation: Labour demand is derived from the marginal productcondition which determines the level of real wages the firm is willing to pay for agiven capital intensity(K/L) and level of technology, as represented by total factorproductivity (tfp) . Real wages which are offered by the firm depend positively oncapital intensity (which depends negatively on the real interest rate(r) and corporatetaxes(tc)) and on total factor productivity.
(2) W/P=MPL(K/L( r,tc ),tfp)
This condition can also be written as a price equation and can be presented as follows:
(2’) P=P(W,r,tc,tfp)
GENERATING STRUCTURAL UNEMPLOYMENT ESTIMATES : Labour demandand labour supply then determine the equilibrium unemployment rate(LUR*) as afunction of the interest rate, labour and capital taxes (henceforth denoted as tax) andtfp (and correspondingly a level of real wages (WR*) that is compatible with thisunemployment rate).
(3) LUR*=L(r,tl,tc,tfp) = b1*r+b2*tax+b3*tfpb1>0, b2>0, b3=0
Most theories imply restrictions on labour supply such that the long run effect of tfpon LUR* is zero5. Of course there can also be other factors influencingunemployment which are not captured by this formulation, such as specific eventslike German unification, large exogenous shocks to export markets (e.g. the breakdown of the former Soviet Union in the case of Finland), other structural reforms inthe labour market affecting the bargaining position of trade unions and employers etc.We have used time dummies(TD) to represent these factors. Therefore we postulatethe following specification for the equilibrium unemployment rate :
(4) LUR* = b0*TD+b1*r+b2*tax+b3*tfp with b1,b2>0
Because of real and nominal adjustment rigidities, wages and prices will in generaldeviate from their equilibrium levels. However, stability requires that the adjustmentof wages and prices will be such that whenever the actual unemployment rateexceeds/falls short of LUR*, wages will tend to fall/rise, i.e. the coefficient"a" of the
5 This is a fairly standard restriction usually imposed in macro formulations of the labour market andderives from the observation that in the very long run tfp and the unemployment rate have verydifferent trends. However, there exists a wide variety of views on the relationship between technicalchange and employment. For example, some hypotheses point to the productivity slowdown as a majorreason for the rise in the unemployment rate. Other hypotheses, however, suggest that there is apositive correlation between measures of tfp and the unemployment rate. For example, in anenvironment with skill biased technical progress and relative wage rigidity it is very likely that tfp andthe unemployment rate are positively correlated. Some evidence to support this was, for example,found by Roeger and Wijkander (1999) for the three largest continental EU countries over the sampleperiod 1970 to 1995. This correlation was particularly strong in the case of Italy and indispensable forobtaining a cointegrating relationship between unemployment and structural factors. As will be seenlater on in this paper tfp is still needed in the case of Italy for the later sample period.

9
“unemployment gap” (LUR*-LUR) is positive. This equilibrating mechanismprovides additional useful information from wage inflation(Winf) which helps toidentify the NAIRU and therefore we estimate the NAIRU via the followingspecification, using non-linear least squares regression (NLS).
(5) Winf=a(LUR*(TD,r,tax,tfp)-LUR)+ � c(i)Winf(-i),
� c(i)=1 a>06
This implies that LUR* can be identified from estimating equation (5).
For each country the following variables are used:• TD: CONSTANT/ BREAK IN CONSTANT/ TREND: This refers to the classical concept
of a natural rate and also requires little empirical knowledge.• R: Ex post real long term interest rate.• TAX: This is a comprehensive tax measure which includes all direct taxes plus
social security contributions (SSC) as a share of the wage bill.• TFP: Growth rate of real trend GDP.
The estimate for structural unemployment is given by those coefficients of LUR* andthe corresponding unemployment gap (LUR*-LUR) which best explains wageinflation, given past levels of wage inflation.
The estimates from equation (5) allow an assessment to be made of the plausibility ofLUR* both on theoretical as well as empirical grounds. The estimates of thecoefficients of LUR* should be consistent with theoretical restrictions imposed by thewage and the labour demand equations on the structural unemployment rate (i.e. thecoefficientsb), and the coefficients should be significant. Also the unemployment gapshould have explanatory power for explaining wage inflation, given past wageinflation i.e. the coefficienta should be significant.
1.3 TAXATION AND WAGE DETERMINATION - RESERVATION WAGE /UNEMPLOYMENT BENEFIT SYSTEM I NTERACTIONS : In the model describedabove wage setting and labour supply decisions are crucially affected by the ratiobetween the net market wage and the reservation wage. In assessing the impact oftaxation on employment it is important therefore to analyse how a change in taxesaffects the reservation wage.
6 Estimation of this equation requires an assumption with regard to the formation of expectations.Since the inflation process in many countries is dominated by inertia, with year-to-year changes ininflation being small, the most commonly adopted approach to providing an estimate of inflationaryexpectations is to use a distributed lag of past rates of inflation as a proxy for future inflation i.e. abackward looking specification. A stable inflation rate requires that the sum of the coefficients on thelagged inflation rate variables equal one. This latter homogeneity restriction implies the absence of anylong run trade off between inflation and unemployment with the unitary coefficient encapsulating theidea that any given rate of inflation, if left to itself in the sense of no policy interventions to change it,is self-perpetuating.
10
With regard to the reservation wage effect on wages, the first thing to note is that thereservation wage is composed of unemployment benefits and the value of leisure,with the crucial determinant for tax effects being unemployment benefits. To theextent to which benefits are indexed to gross wages, a tax reduction increases thewedge between net wages and the reservation wage and increases the room to sharethe benefits of lower labour taxes between workers and firms. In contrast, if tax rateson benefits and wages were kept equal, the effect of taxation would be small and itwould entirely disappear if the value of leisure goes to zero. This suggests that theinteraction of the tax / benefit systems, and in particular the indexation link betweenbenefits and wages (i.e. gross vs. net) plays a vital role in determining the effects oftaxation on wage setting. However, it should be stressed that other institutional factorsalso play a role. The analysis by Calmfors and Driffill (1988) suggests that thebargaining structure plays an important part in determining the extent to which taxincreases are shifted onto wages. In particular it has been argued that centralised andlarge unions would internalise the macroeconomic consequences of wage increasesmore strongly compared with equivalently strong but decentralised unions.
1.4 RATIONALE FOR I NCLUSION OF THE REAL I NTEREST RATE
VARIABLE : While most of the variables which are used in the above estimationprocess would find widespread support in the literature, more controversial is thechoice of the real interest rate variable. Higher real interest rates have a potentialimpact on unemployment via the knock-on effect on firms of increases in their cost ofcapital which reduces both investment and the capital stock and ultimatelyemployment. To the extent that these additional financing costs are not taken intoaccount in the wage bargaining system, equilibrating employees' real wage demandswith the mark-up ambitions of employers may necessitate higher levels ofunemployment. The big question, however, is whether it is credible to believe thatthese interest rate-induced unemployment increases are likely to be structural orcyclical in nature. Many commentators find the theoretical and empirical case for asecular growth in unemployment consequent to higher real interest rates difficult tojustify and instead argue that the effects are likely to be temporary, with the real wageaspirations of workers likely to adjust over time in much the same way as with shiftsin trend productivity, although the length of the transition phase could be considerableespecially in countries with particularly inflexible institutional setups where theimpact of shocks tend to persist.
The model developed above is sufficiently flexible to allow for the latter view of realinterest rates interacting with a relatively rigid institutional framework here in Europe.The criteria adopted for the final model selection are based not only on theoreticalconsiderations but in fact give precedence to the empirical explanatory power of theNAIRU series which is generated by the model in terms of tracking past trends ininflation. In addition, the real interest rate variable is only selected for those countrieswhere a robust statistical relationship is shown to exist and where the parameter iscorrectly signed from an economic theory point of view. In this regard the modeldeveloped in the paper is essentially one for calculating a short-run NAIRU asopposed to a long run structural rate. Consequently, it is capable of picking up sometransitory or persistence effects, emanating from perhaps a mixture of supply and

11
demand side influences, which will be resolved in the longer run when the price andwage dynamics have settled down and the long run steady state is finally reached.
The difficulty experienced in the present study in distinguishing structural as opposedto purely cyclical links between real interest rates and unemployment seems also to bereflected in the empirical literature on this topic, where diametrically opposing effectshave been found. Some authors such as Darby, Ireland and Wren-Lewis (1992),Barrell, Pain and Young (1993), Manning (1992 and 1993), Phelps (1992 and 1994)and Scarpetta (1996)7 point to significant positive effects on the NAIRU from realinterest rate movements, whereas other papers, notably by Carruth, Hooker andOswald (1993) and Bean (1994) show effects close to zero.
DISTINCTION BETWEEN THE SHORT AND LONG RUN NAIRU C ONCEPTSThe distinction between the short and long run NAIRU concepts is an important one,especially here in Europe, given the difficulties in estimating a long run NAIRU andof adjusting to the latter in an environment of hysteresis / persistence mechanisms.The essential difference between both concepts is that the long run NAIRU ischaracterised by stability in terms of both inflation and unemployment whereas for theshort-run NAIRU, only inflation is stable. This latter stability is perhaps fragile insome countries since, the above-mentioned, hysteresis type mechanisms may imposelimits on the speed with which the economy can return to the long-run NAIRU, with,for example, policies aimed at rapidly reducing unemployment being potentiallycostly in terms of inflation.
The short-run NAIRU concept should, in fact, be seen as a reduced-form as opposedto a structural concept, which encompasses not only the longer run structuraldeterminants of the NAIRU (such as real interest rates, replacement ratios and taxburdens) but also reflects the dynamic adjustment of the economy to past economicshocks, as reflected in the impact of the unemployment gap on wage or price inflation.The preference in the present paper for calculating a short-run NAIRU reflects anumber of arguments including the fact that for most European countries it is virtuallyimpossible to measure a purely structural natural rate given the difficulty in findingcredible indicators to pick up all the supply side factors which are likely to impact onthe natural rate whilst at the same time ensuring that these latter factors are immunefrom the influence of cyclical determinants.
7 Although in commenting on the results of the reduced form regressions on the total unemploymentrate, Scarpetta states that "there is no evidence that over the 1983-1993 period that changes in the longterm interest rates have significantly affected labour market conditions".
12
SECTION 2 : EMPIRICAL TESTING OF "H YBRID " NAIRU / NAWRUMODEL
2.1 OUTLINE OF TESTING STRATEGY : In overall terms, the model developedin Section 1 revolves around a basic equation for explaining inflation in the differentcountries, with inflation being a function of the unemployment gap and a distributedlag of past inflation. Various permutations to this specification were used in theNAIRU estimation process including using different inflation indicators (wageinflation or general, economy-wide, inflation as measured by the GDP deflator),various structural variables (labour taxation, wider measure of tax pressure, gross andnet replacement ratios, real interest rates, trend productivity growth as well as ademographic variable which was included to pick up changes in the ratio of thepopulation of working age to total population) allied to different lag structures for therespective variables. In terms of the inflation variable used, one possible differencebetween countries is that unemployment gap developments may be a more usefulpredictor of wage inflation than of price inflation (this in fact is the case in all thecountries, except Portugal and the Netherlands, and consequently in this paper we arenormally measuring a NAWRU as opposed to a NAIRU).
EXPECTED SIGN OF COEFFICIENTS : Economic theory would suggest positivesigns for the coefficients for lagged inflation, taxation and real interest rate variablesand a negative coefficient for the trend growth variable. In a bargaining framework ofwage determination, real interest rates and the NAIRU would be expected to bepositively related, with the transmission channel between the two, as mentionedearlier, revolving around the idea of a wedge between the target real wage ofemployees and the feasible real wage on the employers side. Furthermore, for themost important term, the unemployment gap, which measures the influence of the gapon inflation, given that this is estimated as the NAIRU less the actual unemploymentrate, one would expect to see a positive coefficient. This in fact is the case with allthe equation results, with a positive coefficient on the unemployment gap termindicating that wage inflation seems to respond to disequilibrium in the respectivelabour markets. Given these feedback effects it is clear that this unemployment gapterm could be used as a rough indicator of the relative real wage flexibility of therespective labour markets.
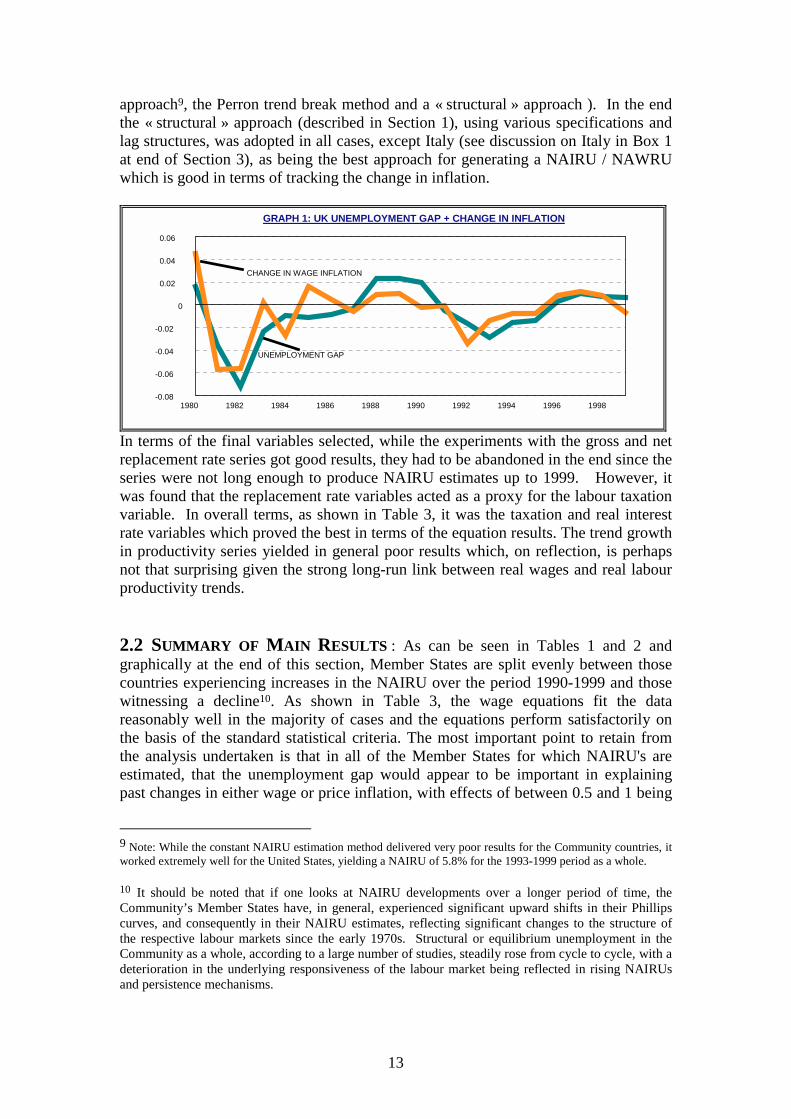
As illustrated in Graph 1, using the example of the UK (see Section 3 for Graphs forall the countries), the objective of the estimation process is to try to extract a NAIRUestimate which is linked not to inflation but to the change in inflation. In other wordswe are trying to choose the NAIRU estimate which gives the best fit over thehistorical sample period i.e. the NAIRU which is best at tracking past changes ininflation. A number of different methods of estimation were experimented with (egtrend estimation using the Hodrick-Prescott (H-P) filter8, the constant NAIRU
8 The Hodrick-Prescott (H-P) filter approach is a trend estimation method which basically uses a long-run movingaverage to detrend a particular series, in this case unemployment. Using the H-P filter is justified for calculatingthe natural component of unemployment since the latter concept assumes that factors affecting the natural rate areinfrequent and are slow to change.
13
approach9, the Perron trend break method and a « structural » approach ). In the endthe « structural » approach (described in Section 1), using various specifications andlag structures, was adopted in all cases, except Italy (see discussion on Italy in Box 1at end of Section 3), as being the best approach for generating a NAIRU / NAWRUwhich is good in terms of tracking the change in inflation.
GRAPH 1: UK UNEMPLOYMENT GAP + CHANGE IN INFLATION
1980 1982 1984 1986 1988 1990 1992 1994 1996 1998
0
0.02
0.04
0.06
-0.02
-0.04
-0.06
-0.08
CHANGE IN WAGE INFLATION
UNEMPLOYMENT GAP
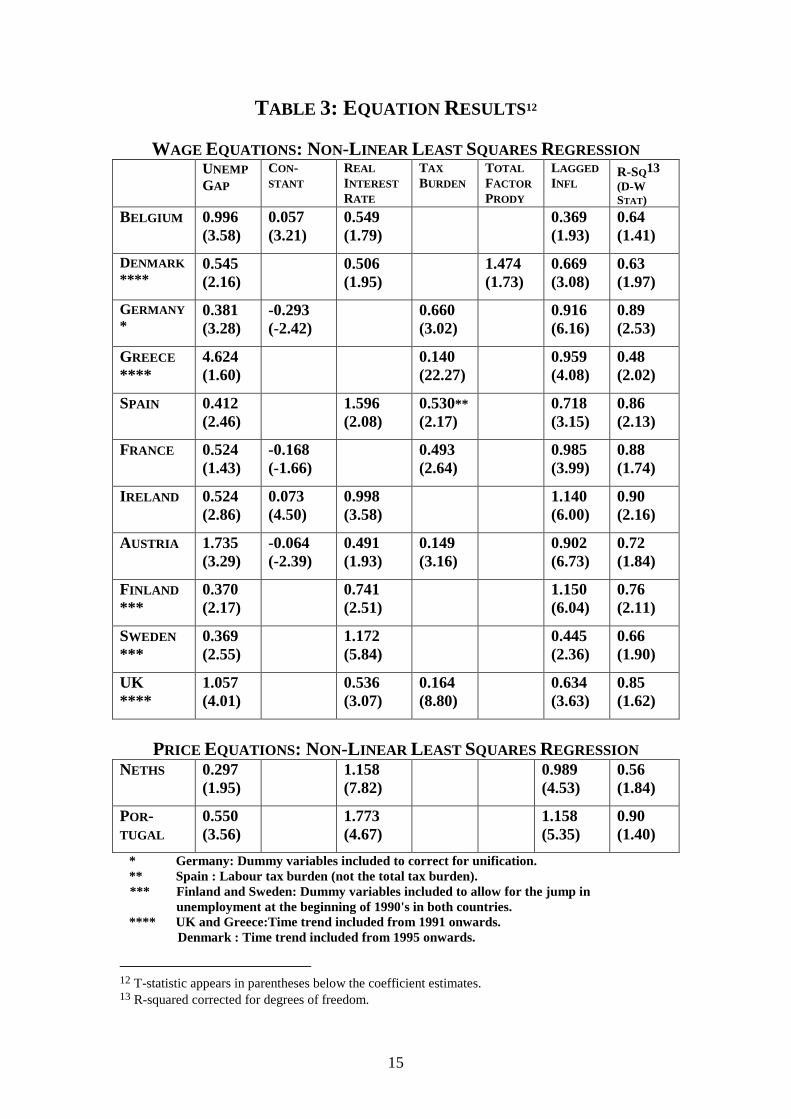
In terms of the final variables selected, while the experiments with the gross and netreplacement rate series got good results, they had to be abandoned in the end since theseries were not long enough to produce NAIRU estimates up to 1999. However, itwas found that the replacement rate variables acted as a proxy for the labour taxationvariable. In overall terms, as shown in Table 3, it was the taxation and real interestrate variables which proved the best in terms of the equation results. The trend growthin productivity series yielded in general poor results which, on reflection, is perhapsnot that surprising given the strong long-run link between real wages and real labourproductivity trends.
2.2 SUMMARY OF MAIN RESULTS : As can be seen in Tables 1 and 2 andgraphically at the end of this section, Member States are split evenly between thosecountries experiencing increases in the NAIRU over the period 1990-1999 and thosewitnessing a decline10. As shown in Table 3, the wage equations fit the datareasonably well in the majority of cases and the equations perform satisfactorily onthe basis of the standard statistical criteria. The most important point to retain fromthe analysis undertaken is that in all of the Member States for which NAIRU's areestimated, that the unemployment gap would appear to be important in explainingpast changes in either wage or price inflation, with effects of between 0.5 and 1 being
9 Note: While the constant NAIRU estimation method delivered very poor results for the Community countries, itworked extremely well for the United States, yielding a NAIRU of 5.8% for the 1993-1999 period as a whole.
10 It should be noted that if one looks at NAIRU developments over a longer period of time, theCommunity’s Member States have, in general, experienced significant upward shifts in their Phillipscurves, and consequently in their NAIRU estimates, reflecting significant changes to the structure ofthe respective labour markets since the early 1970s. Structural or equilibrium unemployment in theCommunity as a whole, according to a large number of studies, steadily rose from cycle to cycle, with adeterioration in the underlying responsiveness of the labour market being reflected in rising NAIRUsand persistence mechanisms.
14
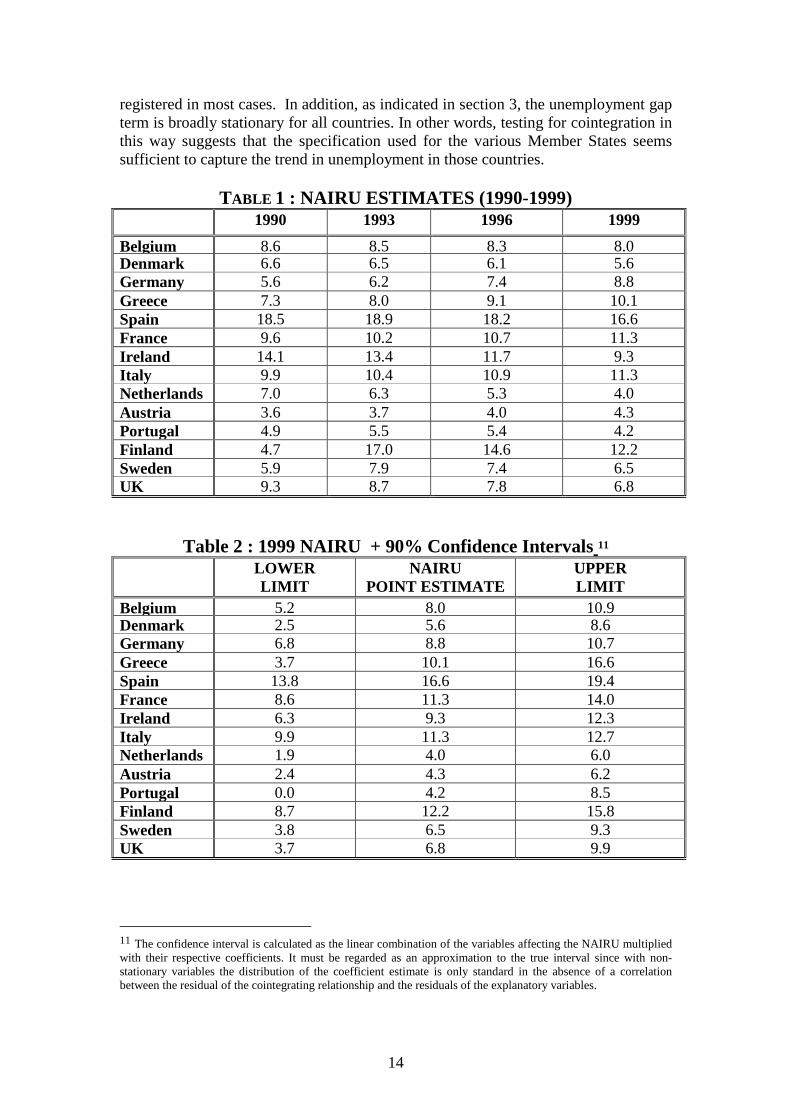
registered in most cases. In addition, as indicated in section 3, the unemployment gapterm is broadly stationary for all countries. In other words, testing for cointegration inthis way suggests that the specification used for the various Member States seemssufficient to capture the trend in unemployment in those countries.
TABLE 1 : NAIRU ESTIMATES (1990-1999)1990 1993 1996 1999
Belgium 8.6 8.5 8.3 8.0Denmark 6.6 6.5 6.1 5.6Germany 5.6 6.2 7.4 8.8Greece 7.3 8.0 9.1 10.1Spain 18.5 18.9 18.2 16.6France 9.6 10.2 10.7 11.3Ireland 14.1 13.4 11.7 9.3Italy 9.9 10.4 10.9 11.3Netherlands 7.0 6.3 5.3 4.0Austria 3.6 3.7 4.0 4.3Portugal 4.9 5.5 5.4 4.2Finland 4.7 17.0 14.6 12.2Sweden 5.9 7.9 7.4 6.5UK 9.3 8.7 7.8 6.8
Table 2 : 1999 NAIRU + 90% Confidence Intervals11
LOWERLIMIT
NAIRUPOINT ESTIMATE
UPPERLIMIT
Belgium 5.2 8.0 10.9Denmark 2.5 5.6 8.6Germany 6.8 8.8 10.7Greece 3.7 10.1 16.6Spain 13.8 16.6 19.4France 8.6 11.3 14.0Ireland 6.3 9.3 12.3Italy 9.9 11.3 12.7Netherlands 1.9 4.0 6.0Austria 2.4 4.3 6.2Portugal 0.0 4.2 8.5Finland 8.7 12.2 15.8Sweden 3.8 6.5 9.3UK 3.7 6.8 9.9
11 The confidence interval is calculated as the linear combination of the variables affecting the NAIRU multipliedwith their respective coefficients. It must be regarded as an approximation to the true interval since with non-stationary variables the distribution of the coefficient estimate is only standard in the absence of a correlationbetween the residual of the cointegrating relationship and the residuals of the explanatory variables.
15
TABLE 3: EQUATION RESULTS12
WAGE EQUATIONS: NON-L INEAR LEAST SQUARES REGRESSIONUNEMPGAP
CON-STANT
REALINTERESTRATE
TAXBURDEN
TOTALFACTORPRODY
LAGGEDINFL
R-SQ13(D-WSTAT )
BELGIUM 0.996(3.58)
0.057(3.21)
0.549(1.79)
0.369(1.93)
0.64(1.41)
DENMARK****
0.545(2.16)
0.506(1.95)
1.474(1.73)
0.669(3.08)
0.63(1.97)
GERMANY*
0.381(3.28)
-0.293(-2.42)
0.660(3.02)
0.916(6.16)
0.89(2.53)
GREECE
****4.624(1.60)
0.140(22.27)
0.959(4.08)
0.48(2.02)
SPAIN 0.412(2.46)
1.596(2.08)
0.530**(2.17)
0.718(3.15)
0.86(2.13)
FRANCE 0.524(1.43)
-0.168(-1.66)
0.493(2.64)
0.985(3.99)
0.88(1.74)
I RELAND 0.524(2.86)
0.073(4.50)
0.998(3.58)
1.140(6.00)
0.90(2.16)
AUSTRIA 1.735(3.29)
-0.064(-2.39)
0.491(1.93)
0.149(3.16)
0.902(6.73)
0.72(1.84)
FINLAND
***0.370(2.17)
0.741(2.51)
1.150(6.04)
0.76(2.11)
SWEDEN
***0.369(2.55)
1.172(5.84)
0.445(2.36)
0.66(1.90)
UK****
1.057(4.01)
0.536(3.07)
0.164(8.80)
0.634(3.63)
0.85(1.62)
PRICE EQUATIONS: NON-L INEAR LEAST SQUARES REGRESSIONNETHS 0.297
(1.95)1.158(7.82)
0.989(4.53)
0.56(1.84)
POR-TUGAL
0.550(3.56)
1.773(4.67)
1.158(5.35)
0.90(1.40)
* Germany: Dummy variables included to correct for unification.** Spain : Labour tax burden (not the total tax burden).*** Finland and Sweden: Dummy variables included to allow for the jump in
unemployment at the beginning of 1990's in both countries.**** UK and Greece:Time trend included from 1991 onwards.
Denmark : Time trend included from 1995 onwards.
12 T-statistic appears in parentheses below the coefficient estimates.13 R-squared corrected for degrees of freedom.

16
However, while the sign and size of the model coefficients are economicallymeaningful, past experience suggests caution in using such models for predictingfuture price pressures, in isolation from the many other inflation indicators which areavailable. This is especially true given the normal parameter and model uncertaintywhich clouds any NAIRU / NAWRU estimates. While statistically significantestimates were obtained in the present exercise, as Table 3 shows the latter pointestimates are not very precise, and as can be seen in Table 2 using the example of1999, the confidence intervals around the point estimates for all countries arerelatively wide, thereby reducing their usefulness as policy guides. These lattermeasurement problems are hardly surprising given the well-documented instabilitiesin the Phillips curve for many of the Community's Member States.
2.3 SPECIFIC COMMENTS ON THE EFFECTS OF THE TAXATION AND REAL
I NTEREST RATE VARIABLES
TAXATION : Concerning the effects of taxation, it is interesting to observe that theresults presented in Table 3 are broadly consistent with previous results obtained byDaveri and Tabellini in their seminal 1997 article on the link between the observedrise in labour tax rates in Europe and the concomitant slowdown in economic growthand rise in unemployment over the period from the mid-1960s to the early 1990s.Since the employment effect of taxes was expected by the authors to depend on thebargaining structure, Daveri and Tabellini partitioned an OECD data set into thefollowing three groups; firstly European countries where trade unions play a big rolebut are decentralised; secondly Anglo saxon countries where labour markets are morecompetitive; and finally Scandinavian countries where unions are large andcentralised.
Though the present paper neither constrained regression coefficients within groupsnor across groups, nevertheless similar coefficient groupings emerge from theregressions. Table 3 shows the largest tax effects (with similar size) for Germany,Spain and France. Similar to results obtained by Daveri and Tabellini, an increase inthe tax rate by 1% point increases the structural unemployment rate by about half apoint. Furthermore, the present research does not find a significant effect fromtaxation in the Scandinavian countries nor in Belgium and the Netherlands. Finally,only a very small tax effect is found for the UK. Results for Greece, Ireland, Austriaand Portugal are not directly comparable because they are not included in the Daveriand Tabellini study.
ARE THE EFFECTS ON NAWRU / NAIRU TRENDS EMANATING FROM
REAL INTEREST RATES CREDIBLE OR ARE THESE EFFECTS MASKING
DEMAND INFLUENCES ? : It is very interesting to observe that the real interest ratevariable plays a key role in NAWRU / NAIRU developments in 10 of the 13countries. What is more surprising is both the size of the expected effects and the factthat for a number of countries which have experienced substantial declines in theirstructural unemployment rates that real interest rate developments would appear to bethe main explanation. While structural reform clearly plays a role in terms of realinterest rate developments, the latter association between real interest rates and
17
NAIRU declines might be a difficult one to explain to policy makers in the context ofits implications for the broad thrust of structural initiatives in their respectivecountries.
Because of these latter concerns, it was decided to try to examine whether, as statedearlier in the paper, these interest rate-induced trend unemployment changes are likelyto be structural or cyclical in nature. In other words could any other variable be foundwhich would work equally as well in the country equations as the real interest ratevariable appeared to do ?. A large number of variables were tested, including theinvestment to output ratio, trend growth, competitiveness indicators such as realexchange rate movements, as well as dummy variables indicating dates of majorlabour market reforms14. However, none of these variables could significantlyimprove the fit of the estimated equation. It was finally decided to include a variablein the equation to mimic the effect of cyclical demand changes. This variablemeasures the deviation from trend growth (calculated as the residual of an OLSequation which regresses the log of the GDP series against time) and when includedin the equations for a number of countries produced good results, especially for someof those Member States which have experienced large declines in their NAIRU's overthe period in question, such as the UK and Ireland.
Regarding these latter results, however, it should be stressed that, despite therelatively good performance achieved by the deviation from trend growth variable incertain countries, this explanatory variable did not perform nearly as well as the realinterest variable in overall terms. Consequently, it would appear that while aproportion of the real interest effects which are shown in our results may emanatefrom a short to medium term real interest effect on demand, it would also appear thatreal interest rate developments have an additional longer run (i.e. structural) influenceon NAIRU / NAWRU trends.
14 Dummy variables are obviously only crude measures for labour market reforms. From a statisticalpoint of view, it would certainly be preferable to have more precise time series indicators, measuringcertain aspects of labour market rigidities, like adjustment costs, bargaining strength of unions, taxdisincentives for certain categories of workers, etc. Unfortunately, such measures are hard to constructon a time series basis.

18
NAIRU E STIMATES , CONFIDENCE INTERVALS AND ACTUALUNEMPLOYMENT 15
(1990-1999)
�
�
� � �� � � � �
�
�
� �� � � � �
�
1990 1993 1996 19994
6
8
10
12Upper Limit
Lower Limit
ActualUnemployment
Belgium
NAIRU
�
�
� ��
�
�
�
�
�
�
�
��
��
�
�
�
�
1990 1993 1996 19993
5
7
9
11
NAIRU
Upper Limit
Lower Limit
ActualUnemployment
Germany*% %
* GERMANY : With regard to the 1990's, the estimates for Germany suggest that structural unemployment has been rising in thatcountry over the period. It is clear from the regression results that the trend of the NAIRU series is strongly influenced by therising direct labour tax burden (including social security contributions) which has been a feature in Germany in the 1990’s.
�
�
� � � � ��
� �
�
�
� � ��
� ��
�
1990 1993 1996 19992
4
6
8
10
12
Upper Limit
Lower Limit
ActualUnemployment
Denmark
NAIRU
�
�
�� �
��
��
�
�
�
� � � ��
��
�
1990 1993 1996 199913
15
17
19
21
23
25
NAIRU
Upper Limit
Lower Limit
ActualUnemployment
Spain*% %
* SPAIN : The overall picture for Spain presented for the period as a whole indicates a relatively rapid decline in recent years instructural unemployment. This development is due to a strong decline in real interest rates in Spain. A lagged employmentresponse to a reduction in effective labour taxes is also present. However, since labour tax rates have stayed roughly constant inrecent years, they do not explain the recent fall in structural unemployment.
15 As is the practice with the OECD's NAWRU series, the NAIRU/NAWRU series produced using the approach presented inthis paper are smoothed using a HP filter to remove any erratic year to year movements. However, it should be noted that thegraphs in section 3.2 of this paper, which compare unemployment gaps and changes in wage/price inflation use the unsmoothedNAIRU series since it is the actual year to year changes which we are interested in.
19
�
�
��
� ��
�
��
�
�
��
�� �
�� �
1990 1993 1996 19996
8
10
12
14
Upper Limit
Lower Limit
ActualUnempl
France*
NAIRU
�
�
��
��
��
��
�
�
��
� ��
��
�
1990 1993 1996 19990
5
10
15
NAIRU
Upper Limit
Lower Limit
ActualUnemployment
Greece% %
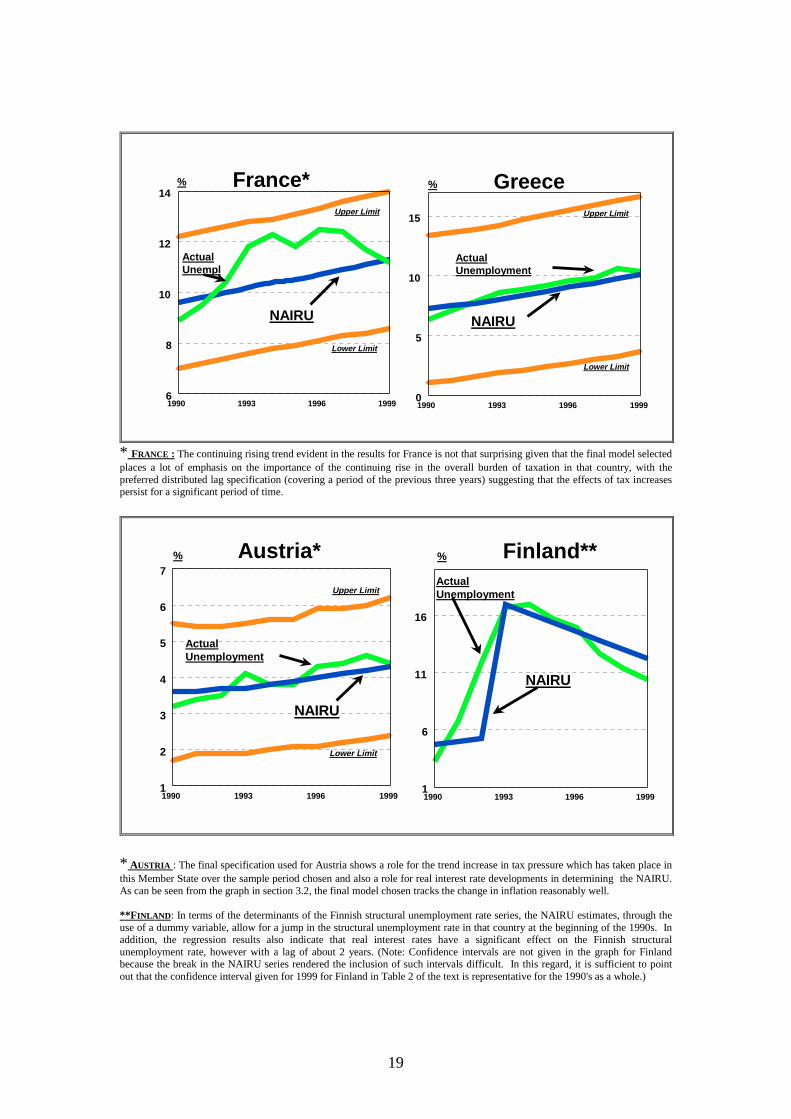
* FRANCE : The continuing rising trend evident in the results for France is not that surprising given that the final model selectedplaces a lot of emphasis on the importance of the continuing rise in the overall burden of taxation in that country, with thepreferred distributed lag specification (covering a period of the previous three years) suggesting that the effects of tax increasespersist for a significant period of time.
�
�
� ��
� �
� ��
�
�
� � ��
� ��
�
1990 1993 1996 19991
2
3
4
5
6
7
Upper Limit
Lower Limit
ActualUnemployment
Austria*
NAIRU
1990 1993 1996 19991
6
11
16
NAIRU
ActualUnemployment
Finland**% %
* AUSTRIA : The final specification used for Austria shows a role for the trend increase in tax pressure which has taken place inthis Member State over the sample period chosen and also a role for real interest rate developments in determining the NAIRU.As can be seen from the graph in section 3.2, the final model chosen tracks the change in inflation reasonably well.
**F INLAND : In terms of the determinants of the Finnish structural unemployment rate series, the NAIRU estimates, through theuse of a dummy variable, allow for a jump in the structural unemployment rate in that country at the beginning of the 1990s. Inaddition, the regression results also indicate that real interest rates have a significant effect on the Finnish structuralunemployment rate, however with a lag of about 2 years. (Note: Confidence intervals are not given in the graph for Finlandbecause the break in the NAIRU series rendered the inclusion of such intervals difficult. In this regard, it is sufficient to pointout that the confidence interval given for 1999 for Finland in Table 2 of the text is representative for the 1990's as a whole.)
20
1990 1993 1996 19991
3
5
7
9
11
ActualUnempl
Sweden*
NAIRU
�
�
� ��
�
��
� �
�
�
�
��
��
�
�
�
1990 1993 1996 19993
5
7
9
11
13
NAIRU
Upper Limit
Lower Limit
ActualUnempl
UK% %
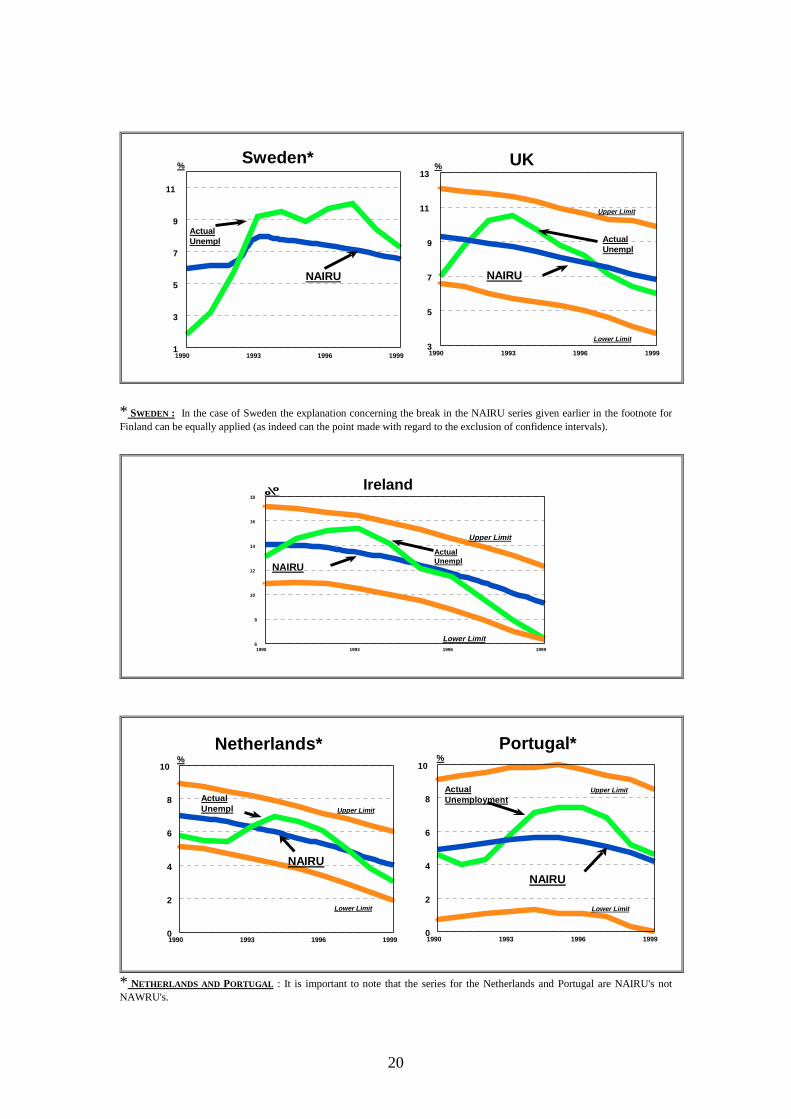
* SWEDEN : In the case of Sweden the explanation concerning the break in the NAIRU series given earlier in the footnote forFinland can be equally applied (as indeed can the point made with regard to the exclusion of confidence intervals).
�
�
��
�
�
�
�
�
�
�
�
� ��
�
�
�
�
�
1990 1993 1996 19996
8
10
12
14
16
18
Upper Limit
Lower Limit
ActualUnempl
Ireland
NAIRU
�
�
��
��
�
��
�
�
�
��
��
�
�
�
�
1990 1993 1996 19990
2
4
6
8
10
Upper Limit
Lower Limit
ActualUnempl
Netherlands*
NAIRU
�
�
��
� ��
�
��
�
�
�� � �
� ��
�
1990 1993 1996 19990
2
4
6
8
10
NAIRU
Upper Limit
Lower Limit
ActualUnemployment
Portugal*% %
* NETHERLANDS AND PORTUGAL : It is important to note that the series for the Netherlands and Portugal are NAIRU's notNAWRU's.
21
SECTION 3 : HOW GOOD ARE THE NAIRU E STIMATES IN EXPLAINING
PAST CHANGES IN WAGE/PRICE I NFLATION ?
While Section 2 clearly demonstrates that the modelling strategy adopted yieldsmeaningful NAIRU estimates in both statistical and economic terms, it is important toassess these results in a number of different ways in order to establish :
• firstly, whether the model variables are capable of capturing the trend inunemployment in the various Member States i.e. can a hypothesis of nocointegration be rejected by the data. This essentially amounts to a test of whetherthe unemployment gap term is stationary or not for the individual countries.(Section 3.1).
• secondly, to assess graphically whether the unemployment gaps generated, usingthe estimated NAIRU / NAWRU estimates, are capable of tracking past changesin wage or price inflation. (Section 3.2).
• thirdly, how do the unemployment gaps, using the estimated NAIRU's, comparein terms of their inflationary explanatory power with unemployment gaps whichare generated by a simple statistical smoothing technique such as the H-P filter. Inother words, does the economic approach adopted in the paper yield any benefitsover and above those of widely used univariate statistical methods? (Section 3.3).
• finally , how useful are the NAIRU estimates generated in this paper in output gapmodels of price inflation. Again, as in section 3.3, the objective in this section isto try to assess whether it is really worthwhile to go to the trouble of estimatingeconomically significant TV-NAIRU's. (Section 3.4).
3.1 IS THE UNEMPLOYMENT GAP TERM A STATIONARY OR NON -STATIONARY PROCESS ? : The distinction between a stationary and a non-stationary series is an important one and depends on whether or not the variablecontains a unit root. If the unemployment gap series, LURGAP, is non-stationary (i.e.it may not be mean reverting) this would suggest that our modelling strategy is notpicking up all the elements which are influencing the movements of LURGAP.Consequently, it is important to establish the order of integration of the LURGAPseries, by determining the properties of the data using formal unit root testing i.e. isthe LURGAP variable stationary in levels or does it have to be differenced a numberof times before becoming stationary. If, for example, first differencing eliminates thetrending behaviour in the variable, then we can say that the variable is I(1), i.e.integrated of order one.
It must be stressed that unit root testing is neither a simple nor definitive process butuse of both the augmented Dickey-Fuller (ADF) test, which allows for a constant andhas an adequate lag structure, combined with the sequential testing strategy whichunderpins the Phillips-Perron (PP) tests is widely accepted as being an appropriatetesting strategy. Testing for the presence of a unit root can be carried out in severaldifferent ways with the approach adopted here being a combination of the ADF andPP tests. Given that the trend should already have been removed from the series, it is
22
only necessary to allow for the intercept term to enter the regression model. The nullhypothesis to be tested is that the time series is non-stationary (i.e. it contains a unitroot) against the alternative hypothesis of stationarity.
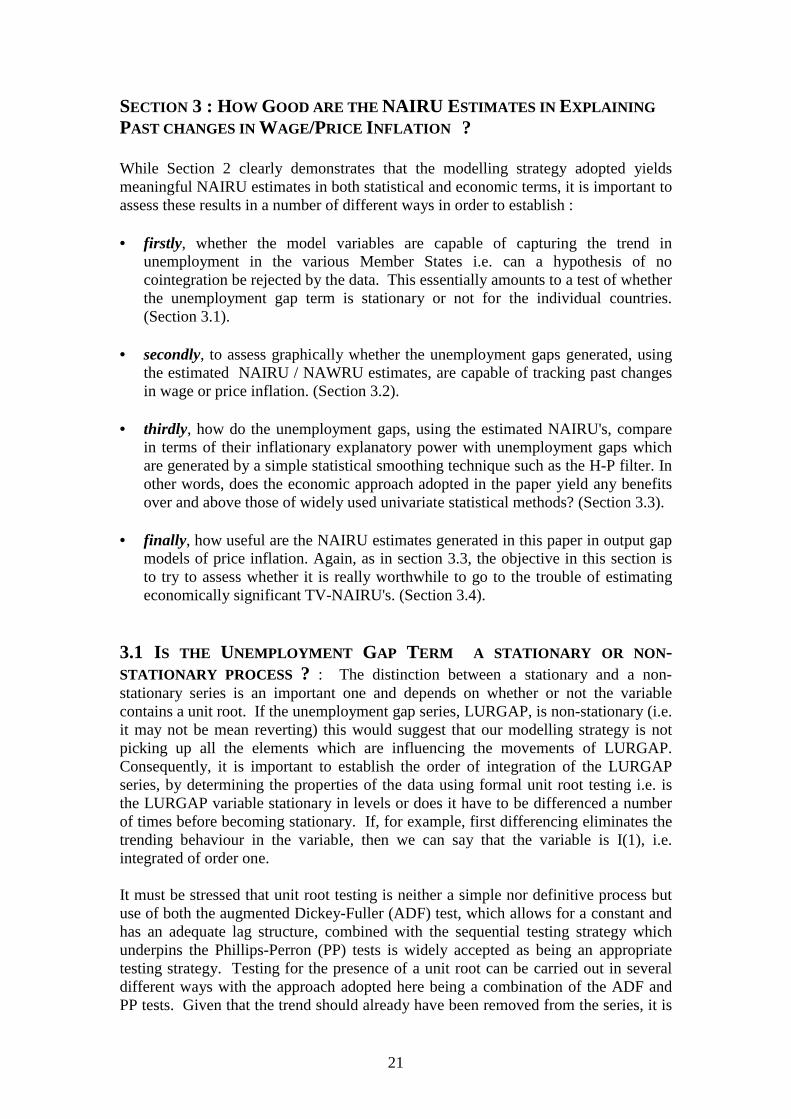
ADF and PP statistics for the level of the LURGAP variable are shown in the Tablebelow and when compared with the MacKinnon critical values suggest stationarity orborderline stationarity, with the vast majority of the countries rejecting the nullhypothesis of non-stationarity for either the ADF or PP tests at the 10% level. Whilethese results do not appear to provide overwhelming support for stationarity, it shouldbe borne in mind that these test statistics lose a lot of their explanatory power whenthe number of observations used are small, as in the present case. Recently, attemptshave been made to increase the power of cointegration tests by taking into account thecross section dimension in cases where the time series are not very long but similardata are available across countries. The most general formulation of a panelcointegration test to date is the one from Pedroni (1997, 1999) which allows bothfixed effects and heterogeneous coefficients across cross sectional units. Pedronidevelops various panel cointegration tests and especially extends the ADF and PPtests. He shows that these panel cointegration statistics approximately follow astandard normal distribution after appropriate standardisation. As can be seen fromthe results of the panel cointegration test shown below, the hypothesis of nocointegration can be rejected at the 5% level for the panel of all EU countries.
Statistical Stationary Tests for the EC's Member States
1. Augmented Dickey-Fuller (ADF) and Phillips-Perron (PP) Unit Root Tests in Levels*
- (Intercept included in test equation with 1 lag) -
ADFTEST STATISTIC
PPTEST STATISTIC
Belgium -2.87 -2.51Denmark -2.08 -3.41Germany -2.89 -2.69Greece -6.52 -4.44Spain -2.40 -1.91France -2.68 -1.67Ireland -1.99 -2.70Ital y -2.99 -1.96Netherlands -3.00 -2.27Austria -2.49 -2.55Portugal -2.48 -4.11Finland -1.97 -2.03Sweden -1.46 -2.65UK -3.09 -2.54
* MacKinnon critical values for rejection of hypothesis of a unit rootIntercept Included
1% critical value = - 3.495% critical value = - 2.8910% critical value = - 2.58
2. Panel Cointegration Test (Pedroni 1999)
Group PP Statistic = -1.89**Group ADF Statistic = -2.59**
**5% critical value = - 1.69
23
3.2 UNEMPLOYMENT GAPS AND CHANGES IN WAGE / PRICE I NFLATION
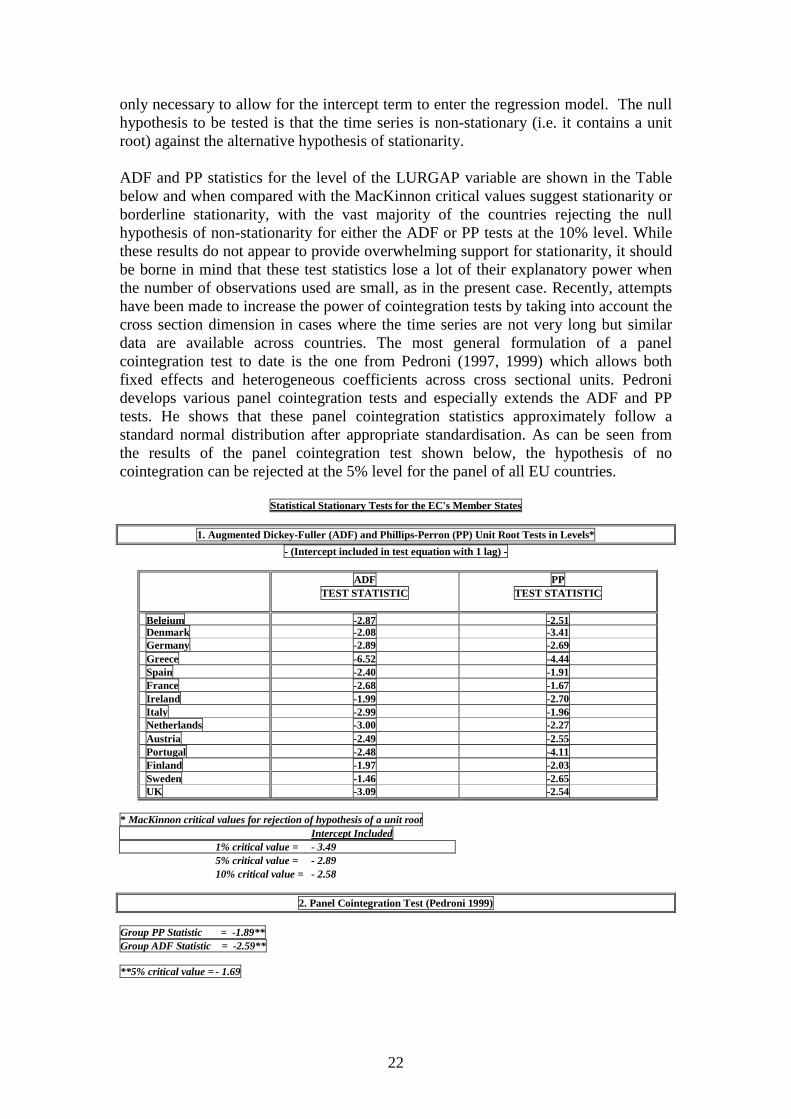
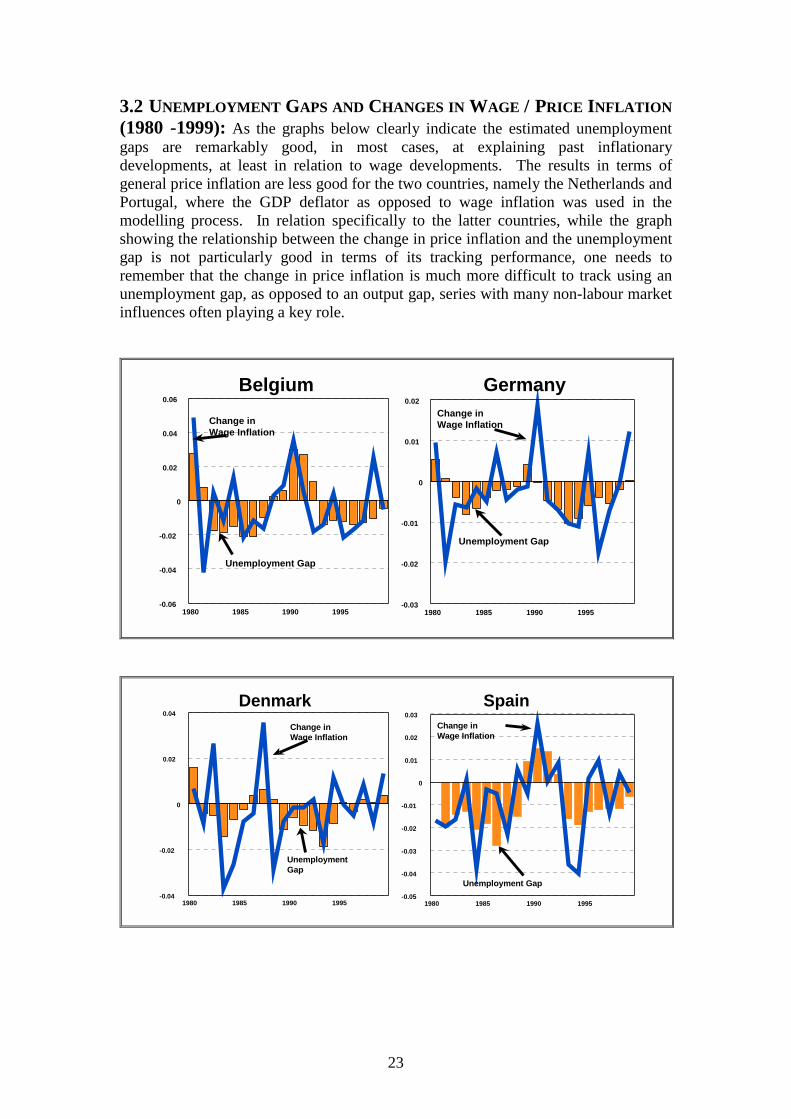
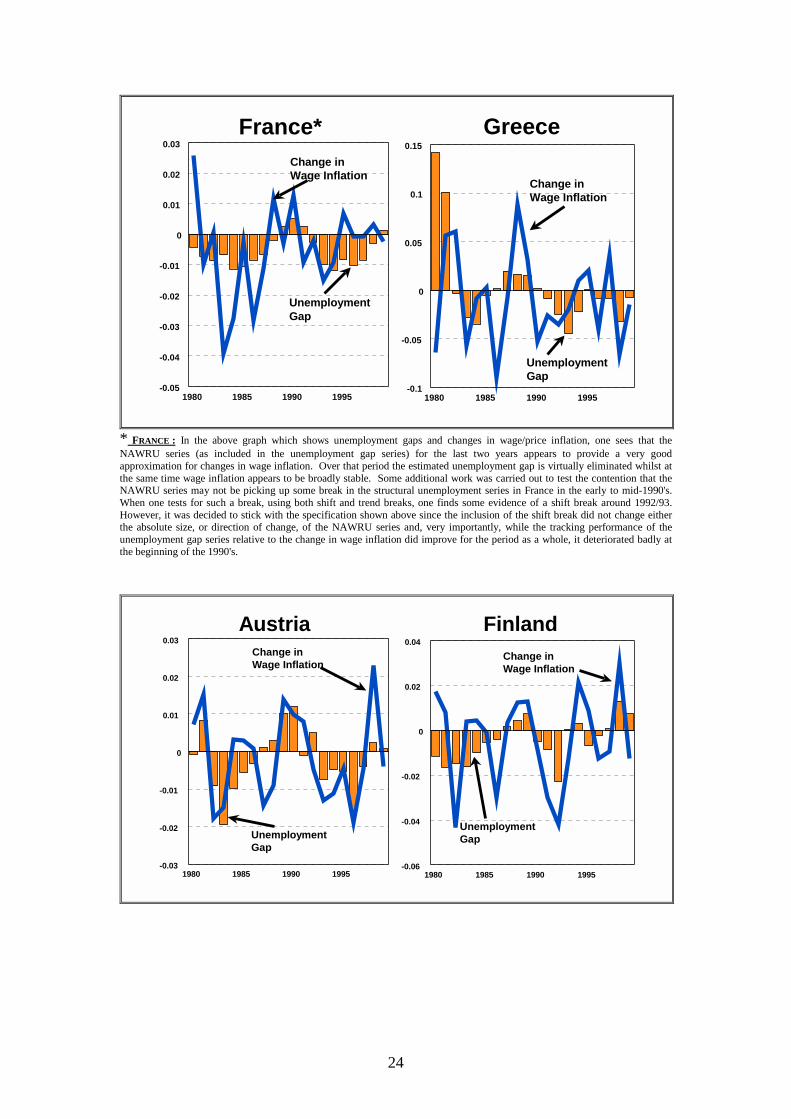
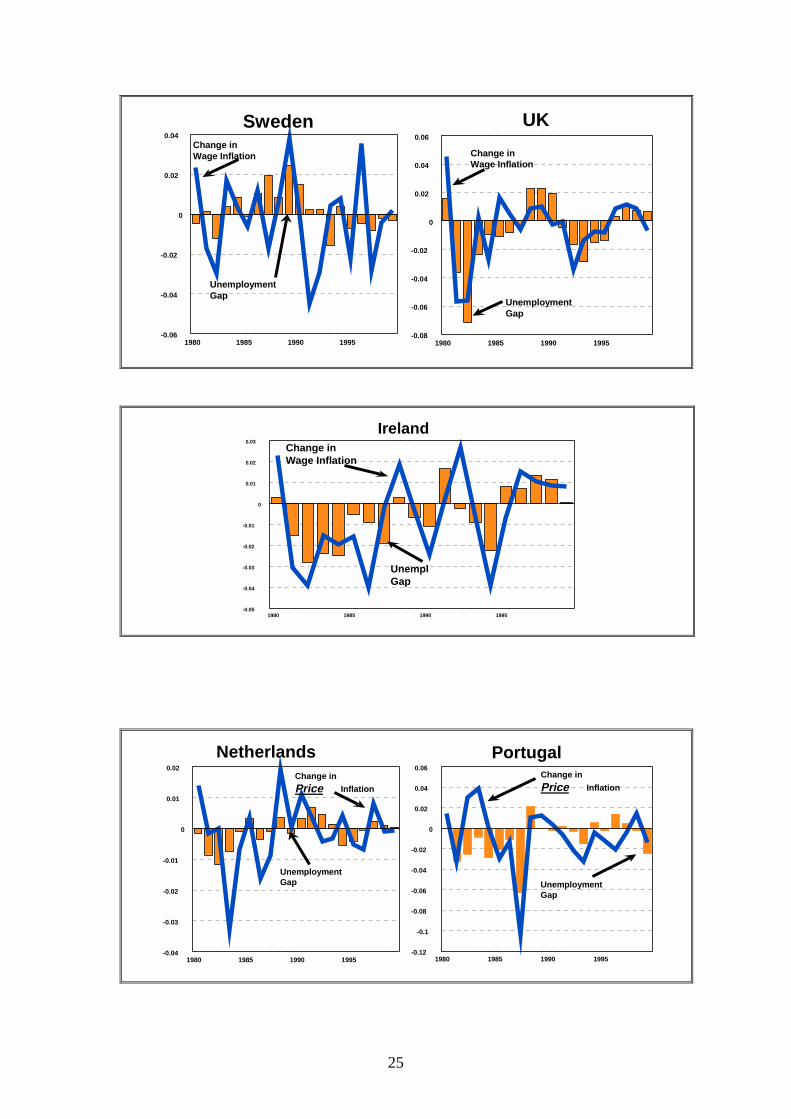
(1980 -1999):As the graphs below clearly indicate the estimated unemploymentgaps are remarkably good, in most cases, at explaining past inflationarydevelopments, at least in relation to wage developments. The results in terms ofgeneral price inflation are less good for the two countries, namely the Netherlands andPortugal, where the GDP deflator as opposed to wage inflation was used in themodelling process. In relation specifically to the latter countries, while the graphshowing the relationship between the change in price inflation and the unemploymentgap is not particularly good in terms of its tracking performance, one needs toremember that the change in price inflation is much more difficult to track using anunemployment gap, as opposed to an output gap, series with many non-labour marketinfluences often playing a key role.
1980 1985 1990 1995
0
0.02
0.04
0.06
-0.02
-0.04
-0.06
Belgium
Change inWage Inflation
Unemployment Gap
1980 1985 1990 1995
0
0.01
0.02
-0.01
-0.02
-0.03
Change inWage Inflation
Unemployment Gap
Germany
1980 1985 1990 1995
0
0.02
0.04
-0.02
-0.04
DenmarkChange inWage Inflation
UnemploymentGap
1980 1985 1990 1995
0
0.01
0.02
0.03
-0.01
-0.02
-0.03
-0.04
-0.05
Change inWage Inflation
Unemployment Gap
Spain
24
1980 1985 1990 1995
0
0.01
0.02
0.03
-0.01
-0.02
-0.03
-0.04
-0.05
France*Change inWage Inflation
UnemploymentGap
1980 1985 1990 1995
0
0.05
0.1
0.15
-0.05
-0.1
Change inWage Inflation
UnemploymentGap
Greece
* FRANCE : In the above graph which shows unemployment gaps and changes in wage/price inflation, one sees that theNAWRU series (as included in the unemployment gap series) for the last two years appears to provide a very goodapproximation for changes in wage inflation. Over that period the estimated unemployment gap is virtually eliminated whilst atthe same time wage inflation appears to be broadly stable. Some additional work was carried out to test the contention that theNAWRU series may not be picking up some break in the structural unemployment series in France in the early to mid-1990's.When one tests for such a break, using both shift and trend breaks, one finds some evidence of a shift break around 1992/93.However, it was decided to stick with the specification shown above since the inclusion of the shift break did not change eitherthe absolute size, or direction of change, of the NAWRU series and, very importantly, while the tracking performance of theunemployment gap series relative to the change in wage inflation did improve for the period as a whole, it deteriorated badly atthe beginning of the 1990's.
1980 1985 1990 1995
0
0.01
0.02
0.03
-0.01
-0.02
-0.03
AustriaChange inWage Inflation
UnemploymentGap
1980 1985 1990 1995
0
0.02
0.04
-0.02
-0.04
-0.06
Change inWage Inflation
UnemploymentGap
Finland
25
1980 1985 1990 1995
0
0.02
0.04
-0.02
-0.04
-0.06
SwedenChange inWage Inflation
UnemploymentGap
1980 1985 1990 1995
0
0.02
0.04
0.06
-0.02
-0.04
-0.06
-0.08
Change inWage Inflation
UnemploymentGap
UK
1980 1985 1990 1995
0
0.01
0.02
0.03
-0.01
-0.02
-0.03
-0.04
-0.05
IrelandChange inWage Inflation
UnemplGap
1980 1985 1990 1995
0
0.01
0.02
-0.01
-0.02
-0.03
-0.04
NetherlandsChange in
Price Inflation
UnemploymentGap
1980 1985 1990 1995
0
0.02
0.04
0.06
-0.02
-0.04
-0.06
-0.08
-0.1
-0.12
Change in
Price Inflation
UnemploymentGap
Portugal

26
3.3 COMPARISON WITH H-P FILTER DERIVED UNEMPLOYMENT GAPS.HOW WELL DO THE ESTIMATED UNEMPLOYMENT GAP V HP FILTER
DERIVED UNEMPLOYMENT GAPS EXPLAIN PAST CHANGES IN WAGE
INFLATION ?
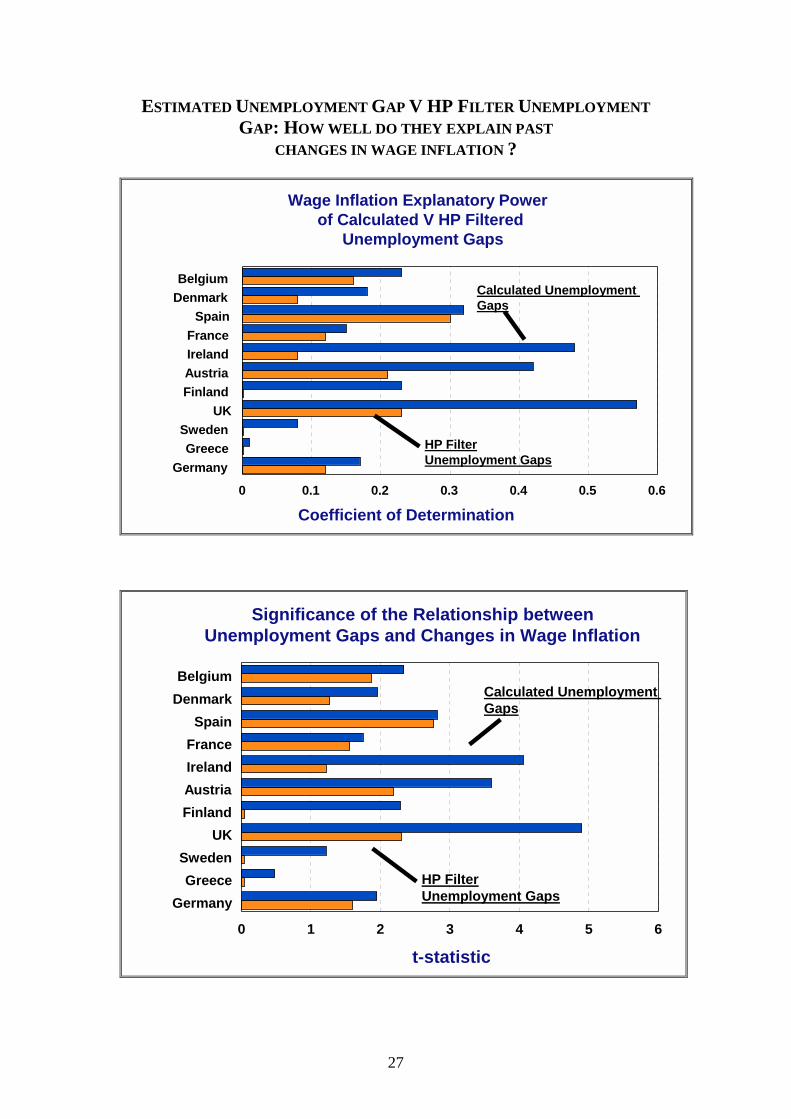
As the table and graphs below indicate, the results of this comparison are veryencouraging for the methodology adopted in this paper, since they indicate that foreach Member State there is a gain to be made by estimating an economicallysignificant NAIRU series, with the gain in certain countries being very significant interms of both the explanatory power of the NAIRU's and in terms of the significanceof the relationship between the unemployment gaps and past changes in wageinflation.
TABLE : ESTIMATED UNEMPLOYMENT GAP V HP FILTER UNEMPLOYMENT GAP
Estimated Gap HP Filter GapR-Squared t-Statistic R-Squared t-Statistic
Belgium 0.23 2.34 0.16 1.87
Denmark 0.18 1.96 0.08 1.27
Germany 0.17 1.95 0.12 1.60
Greece 0.01 0.48 0.001 0.05
Spain 0.32 2.82 0.30 2.77
France 0.15 1.75 0.12 1.56
Ireland 0.48 4.06 0.08 1.22
Austria 0.42 3.60 0.21 2.19
Finland 0.23 2.29 0.001 0.05
Sweden 0.08 1.22 0.001 0.04
UK 0.57 4.90 0.23 2.30
27
ESTIMATED UNEMPLOYMENT GAP V HP FILTER UNEMPLOYMENT
GAP: HOW WELL DO THEY EXPLAIN PAST
CHANGES IN WAGE INFLATION ?
Wage Inflation Explanatory Powerof Calculated V HP Filtered
Unemployment Gaps
BelgiumDenmark
SpainFranceIrelandAustriaFinland
UKSwedenGreece
Germany
0 0.1 0.2 0.3 0.4 0.5 0.6
Coefficient of Determination
Calculated UnemploymentGaps
HP FilterUnemployment Gaps
Significance of the Relationship betweenUnemployment Gaps and Changes in Wage Inflation
Belgium
Denmark
Spain
France
Ireland
Austria
Finland
UK
Sweden
Greece
Germany
0 1 2 3 4 5 6
t-statistic
Calculated UnemploymentGaps
HP FilterUnemployment Gaps
28
3.4 REAL DISEQUILIBRIUM MEASURES: UNEMPLOYMENT V OUTPUT
GAPS
The essential question to be addressed in this section is whether economic, as opposedto statistical, estimates of trend or structural unemployment can help in improving theinflationary explanatory power of output gap calculations (i.e. the gap between actualand potential output)?.
The first thing to stress is that the unemployment gap and the output gap estimates arelinked in a number of different ways:• Firstly, they are both real disequilibria measures - although one wouldn’t
necessarily expect both these measures of real disequilibrium to coincide in termsof their movements over time since non-labour market influences on priceinflation must also be taken into account;
• Secondly,they are linked due to the fact that the unemployment gap is often usedas an important input into the output gap calculations. It is this latter connectionwhich the present section concentrates on.
This section presents two different sets of output gap estimates, both of which arebased on a production function approach using the Commission’s services QUESTmodel, but with one set of calculations using a Hodrick Prescott generated trendunemployment rate and with the other using the NAIRU estimates as calculated in thepresent paper. The objective is to see whether by using the economically derivedNAWRU/NAIRU estimates, in preference to a statistical method such as the H-Pfilter, we can improve on the price inflation tracking performance of the resultantoutput gap calculations. Before going on to discuss the different calculations, a shortdigression is necessary to provide a quick overview of the production functionapproach for calculating output gaps in the Quest II model.
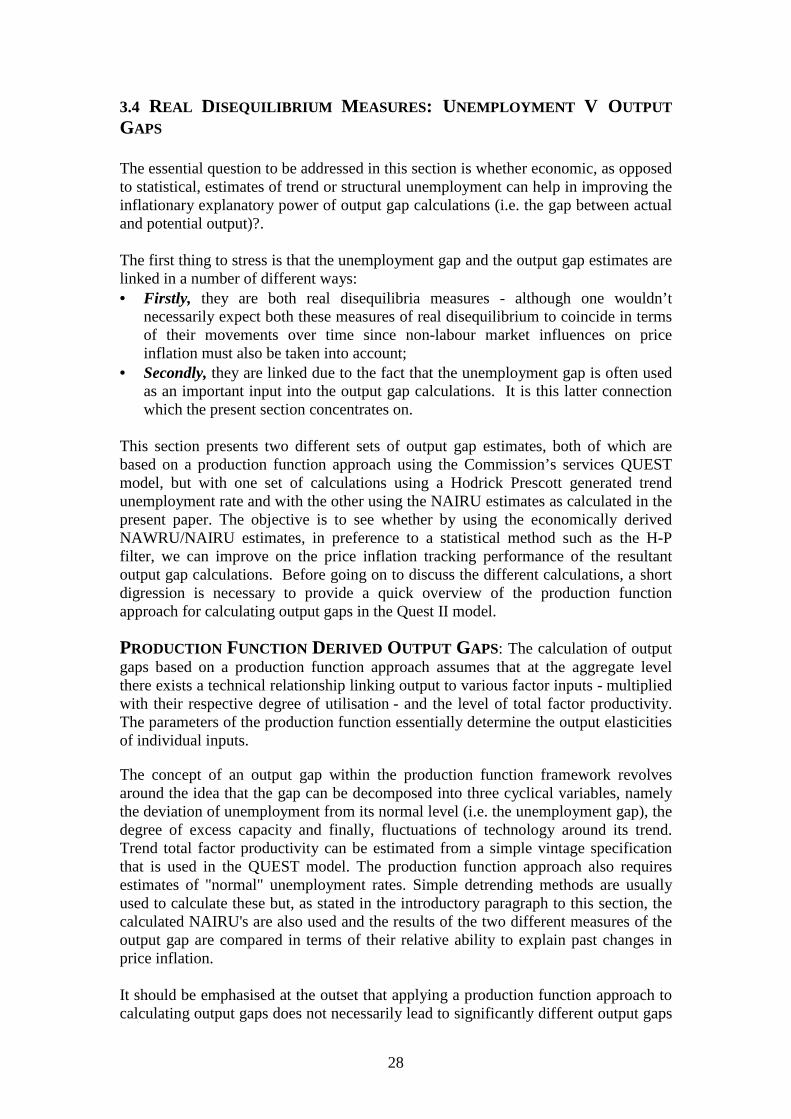
PRODUCTION FUNCTION DERIVED OUTPUT GAPS: The calculation of outputgaps based on a production function approach assumes that at the aggregate levelthere exists a technical relationship linking output to various factor inputs - multipliedwith their respective degree of utilisation - and the level of total factor productivity.The parameters of the production function essentially determine the output elasticitiesof individual inputs.
The concept of an output gap within the production function framework revolvesaround the idea that the gap can be decomposed into three cyclical variables, namelythe deviation of unemployment from its normal level (i.e. the unemployment gap), thedegree of excess capacity and finally, fluctuations of technology around its trend.Trend total factor productivity can be estimated from a simple vintage specificationthat is used in the QUEST model. The production function approach also requiresestimates of "normal" unemployment rates. Simple detrending methods are usuallyused to calculate these but, as stated in the introductory paragraph to this section, thecalculated NAIRU's are also used and the results of the two different measures of theoutput gap are compared in terms of their relative ability to explain past changes inprice inflation.
It should be emphasised at the outset that applying a production function approach tocalculating output gaps does not necessarily lead to significantly different output gaps
29
than those obtained via simple statistical methods. The production function approachessentially amounts to calculating cyclical components of the inputs. It is relativelyeasy to see that applying a linear filter with common weights to individualcomponents is identical to applying the filter to the output series itself. A gain fromusing a production function approach can only be expected if it is easier to extractcyclical components from input factors (unemployment and total factor productivity)than from GDP itself or if it seems necessary to apply very different detrendingmethods to the individual inputs.
In overall terms, with a production function, potential GDP (Y) can be represented bya combination of factor inputs - employment (L) and capital (K) at the aggregatelevel -, corrected for the degree of excess capacity (UC) and multiplied with thetechnological level or total factor productivity (total factor productivity). In manyempirical applications (including the QUEST model), a Cobb Douglas specification ischosen for the functional form as this greatly simplifies estimation and exposition.Thus potential GDP is given by:
TFPKLUCY )( 1 αα −= (1)
where α and )1( α− represent the output elasticities of labour and capital
respectively.
OUTPUT GAPS BASED ONBOTH ECONOMIC & STATISTICALLY DERIVEDTREND UNEMPLOYMENT : As explained above, the production functionapproach to calculating output gaps requires estimates to be provided for equilibriumunemployment. For the purposes of the present exercise two approaches have beenused to estimate the trend or structural unemployment rate, one mechanical (i.e. theH-P Filter) and one economically estimated (i.e. the Phillips curve derived NAIRU'sas given in section 2 of this paper). A comparison of the inflation trackingperformance of output gaps using both these methods is given in Table 2.
The most striking conclusion to be drawn from the Table overleaf, in relation tooutput gaps and price inflation, is how little output gaps explain of the change in priceinflation. Of the 13 countries for which we have calculated NAIRU's, in only 3 ofthem, namely Ireland, the UK and Germany, do output gaps explain in excess of 20%of the change in price inflation over the period 1980 to 1999. With regard to theusefulness of the calculated NAIRU's relative to the HP-filtered NAIRU's, therewould appear to be a sizeable gain in the information content of the calculatedNAIRU's for the three countries in question, with the coefficient of determination andthe overall significance of the relationship increasing for all 3 countries, especiallyIreland (see graph overleaf).

30
TABLE : HOW WELL DO OUTPUT GAPS EXPLAIN PAST CHANGES IN PRICE
INFLATION ? A COMPARISON OF OUTPUT GAPS USING ESTIMATED
NAIRU' S AND HP FILTERED NAIRU' S
OUTPUT GAPSUsing Estimated NAIRU's Using HP Filtered NAIRU's
R-Squared t-Statistic R-Squared t-StatisticBelgium 0.0003 0.076 0.0002 0.063Denmark 0.045 0.926 0.035 0.805Germany 0.308 2.831 0.205 2.155Greece 0.004 0.27 0.003 0.238Spain 0.036 0.817 0.046 0.935France 0.088 1.319 0.121 1.573Ireland 0.206 2.162 0.026 0.692Austria 0.013 0.496 0.012 0.474Finland 0.032 0.773 0.0001 0.038Sweden 0.0001 0.016 0.005 0.305UK 0.318 2.899 0.258 2.500
Italy* 0.443 3.785 .452 3.857Netherlands 0.078 1.231 .019 0.589Portugal 0.001 0.010 0.003 0.237*NAIRU series is virtually identical to a HP filter
Ireland UK Germany0
0.1
0.2
0.3
0.4
0.5
Co
effi
cien
to
fD
eter
min
ati o
n
UsingCalculatedNAIRU's
Using HP-FilteredNAIRU's
Price Inflation and Production Function Derived Output Gaps
Explanatory Power and Significance
Ireland UK Germany0
1
2
3
4
t-S
tati
stic
Using HP-FilteredNAIRU's
UsingCalculatedNAIRU's

31
BOX 1 : I TALY
As mentioned earlier in the text, Italy is the only country in the EU where the« structural » method failed to produce a satisfactory NAIRU series. In other words,the macroeconomic indicators turned out to be insufficient to explain the trendmovement of the Italian unemployment rate. This suggests that an importantinfluencing factor is missing. In trying to resolve this problem 3 differentapproaches were adopted:
• A univariate approach;• The inclusion in the standard specification of a variable which measures the
deviation from trend growth over the estimation period; and finally,• The inclusion of a variable to allow for skill-biased technical progress.
UNIVARIATE APPROACH: A univariate trending method- the HP filter- was usedto produce a proxy for the « structural » unemployment series. Univariate methodsare essentially statistical as opposed to economic models of the NAIRU, with theunderlying assumption being that unemployment always reverts to its mean ornatural rate over time. If the latter assumption is true then the NAIRU can bedefined uniquely in terms of the behaviour of the unemployment series itself.However, while the trend unemployment series for Italy produced using thisapproach appeared to give a reasonable proxy compared with actualunemployment, it was also clear that this series told us very little about the changein wage inflation in Italy over the period.
DEVIATION FROM TREND GROWTH : Given the generally unsatisfactory resultsusing the univariate method, it was decided to try a variable which essentiallymeasures the deviation from trend growth over the period 1980-1999. When thisvariable was introduced in the basic equation, the results were substantially betterin terms of the overall fit of the equation. Unfortunately, the unemployment gapseries produced using this new NAIRU estimate was still poor in terms of trackingpast changes in inflation.
SKILL -BIASED TECHNICAL PROGRESS: Given the poor inflation trackingperformance using the above two methods, a variable for skilled biased technicalprogress was included in the basic specification. When this variable was introducedit performed reasonably well in terms of the basic equation results. This appears toconfirm the results of a previous analysis by Roeger and Wijkander (see references)which showed that the inclusion of a proxy variable for relative wage rigidity in thepresence of skill biased technical progress, namely the ratio between total factorproductivity in manufacturing and services, provides cointegration in the case ofItaly. However, while the structural unemployment series produced using the latterapproach may appear (see graph overleaf) a reasonable proxy compared withactual unemployment, it is unfortunately still very poor in terms of explaining thechange in wage inflation in Italy over the period in question.
32
COULD HYSTERESIS MECHANISMS PROVIDE PART OF THE EXPLANATION FOR THE
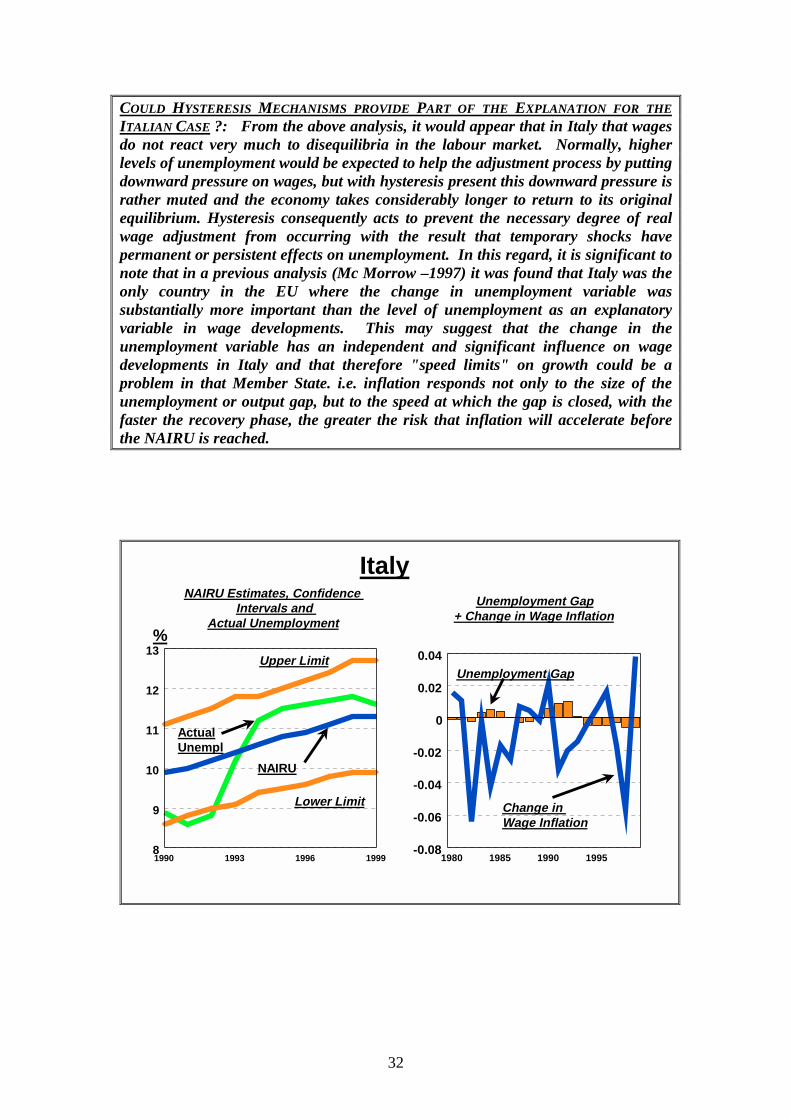
I TALIAN CASE ?: From the above analysis, it would appear that in Italy that wagesdo not react very much to disequilibria in the labour market. Normally, higherlevels of unemployment would be expected to help the adjustment process by puttingdownward pressure on wages, but with hysteresis present this downward pressure israther muted and the economy takes considerably longer to return to its originalequilibrium. Hysteresis consequently acts to prevent the necessary degree of realwage adjustment from occurring with the result that temporary shocks havepermanent or persistent effects on unemployment. In this regard, it is significant tonote that in a previous analysis (Mc Morrow –1997) it was found that Italy was theonly country in the EU where the change in unemployment variable wassubstantially more important than the level of unemployment as an explanatoryvariable in wage developments. This may suggest that the change in theunemployment variable has an independent and significant influence on wagedevelopments in Italy and that therefore "speed limits" on growth could be aproblem in that Member State. i.e. inflation responds not only to the size of theunemployment or output gap, but to the speed at which the gap is closed, with thefaster the recovery phase, the greater the risk that inflation will accelerate beforethe NAIRU is reached.
�
�
��
� ��
��
�
�
�
��
�
��
��
�
1990 1993 1996 19998
9
10
11
12
13
NAIRU
Upper Limit
Lower Limit
ActualUnempl
Italy
%
1980 1985 1990 1995
0
0.02
0.04
-0.02
-0.04
-0.06
-0.08
NAIRU Estimates, ConfidenceIntervals and
Actual Unemployment
Change inWage Inflation
Unemployment Gap
Unemployment Gap+ Change in Wage Inflation

33
SUMMARY AND CONCLUDING REMARKS
As stressed at the outset, estimating NAIRU's, especially those for Europeancountries, is an exercise fraught with well documented difficulties, includinguncertainties concerning both model selection, where a number of plausible butfundamentally different modelling approaches exist for their estimation, and empiricalinadequacies, including often large confidence intervals surrounding the resultantNAIRU point estimates. With regard to the present study, while statisticallysignificant NAIRU's were obtained, the latter point estimates have, in general,comparatively low t-statistics and consequently relatively large confidence intervals,thereby reducing their usefulness as policy guides. In addition, interpreting changesin NAIRU's should always be done with caution not only because of the unreliabilityof the estimates themselves, but also, and very importantly here in Europe, because ofthe possible presence of hysteresis mechanisms which have the effect that the NAIRUoften gravitates towards the prevailing rate of unemployment.
Hysteresis is a feature of labour markets which have been "slack" for some time, inthat they become less flexible and more inefficient through skill loss, reduced searcheffectiveness etc. with the present performance of such labour markets to an extentbeing dictated by the shocks which they have been subjected to in the past. Thishysteresis argument forms part of the consensus view regarding Europeanunemployment which purports that the high level of the latter is due to the interactionof two particular effects i.e. a combination of real shocks allied to relatively rigidinstitutional structures. Particular aspects of these latter structures, such as insider-outsider mechanisms, restrictive hiring and firing rules, generous systems of long-term unemployment benefit provision appear to result in the effects of negativeshocks persisting over an extended period of time.
While conscious of the many problems, highlighted above, associated with NAIRUcalculations, the approach in this paper has been to try to pinpoint a number of key"sinners", amongst the many possible contributory factors to the trend growth inunemployment, by isolating those causal variables which are statistically significantand are economically plausible and by testing the explanatory power of the resultantNAIRU and unemployment gap measures in terms of their ability to track pastchanges in wage inflation (or in the case of Portugal and the Netherlands priceinflation).
The model developed has, at its heart, a basic equation for explaining inflation in thedifferent countries, with inflation being a function of the unemployment gap and adistributed lag of past inflation. With regard to the unemployment gap term, whichcould be seen as a rough indicator of real wage flexibility in the respective countries,the NAIRU part of the gap is determined by a series of structural variables such as taxpressure, borrowing costs and trend productivity growth. By adopting this modellingstrategy the paper can provide meaningful,short-run , NAIRU / NAWRU estimateswhich encompass not only the latter's longer run structural determinants but which

34
also mirror the dynamic adjustment of the economy to past economic shocks, asreflected in the impact of the unemployment gap on wage or price inflation16.
The most important point to retain from the analysis undertaken is that, in all of theMember States for which NAWRU / NAIRU's are estimated, the unemployment gapterm would appear to be important in explaining past changes in either wage or priceinflation, with effects of between 0.5 and 1 being registered in most cases i.e. a 1%point change in the unemployment gap term leads to a 0.5 to 1 % point change ininflation in a majority of the Member States. This can be seen graphically in Section3 of the paper, where the estimated unemployment gaps are shown to be remarkablygood, in most cases, at explaining past inflationary developments, at least in relationto wage trends. In addition, the unemployment gap term is also broadly stationary forall countries which suggests that the specification used in the paper for the variousMember States seems sufficient to capture the trend in unemployment in thosecountries.
The study also assesses the gains to be made from estimating NAIRU / NAWRU'susing an economic approach, such as that used in the present paper, as opposed tosimply using a statistical method such as the H-P filter to extract the trendunemployment rate. The results of the comparison of the economically estimatedunemployment gaps with the H-P filtered generated gaps is in fact very encouragingfor the methodology adopted in the paper, since it indicates that for each MemberState there is a gain to be made by estimating an economically significant NAIRUseries, with the gain in certain countries being very significant in terms of both theexplanatory power of the NAIRU's and in terms of the significance of the relationshipbetween the unemployment gaps and past changes in wage inflation. Furthermore,the paper suggests that the link between unemployment gaps and wage inflation is, ingeneral, substantially stronger than between output gaps and general price inflation.
As regards the specific determinants of the NAIRU estimates, it is interesting to notein relation to the taxation effects that there are similarities between the results of thepresent study with those of an earlier study in this area by Daveri and Tabellini in1997. As shown in Section 2 of the paper, the largest employment effect of taxes, asin the case of the Daveri and Tabellini study, are found in those continental Europeancountries, such as Germany, Spain and France, where unions play a big role in adecentralised wage bargaining system. In the latter countries the present studysuggests that a 1% point increase in the tax rate leads to an increase in the equilibriumunemployment rate of half a point. An important role is also found in the presentstudy for the real interest rate variable in a number of the Community's countries anda tentative explanation is given as to why this might be so. This explanationhighlights the difficulty in isolating the demand from the supply side effects of realinterest rate changes, especially here in Europe since the unemployment cycle appearsto have stretched out over the last number of decades. It is impossible to definitively
16 See section 1.4 for a further discussion on the distinction between the short and long run NAIRUconcepts.
35
say whether this lengthening is due to a deterioration in the supply side fundamentalsor whether it reflects slow adjustment / persistence effects.
In overall terms, while the equation specifications used in the paper for some of theMember States may appear rather sparse it should be borne in mind, as highlighted ina lot of research in this area in the past, that whilst data may exist for a large range ofpossible explanatory factors for changes in structural unemployment, such as thebenefit replacement ratio, the ratio of the minimum wage to the average wage, thedegree of coordination in the wage bargaining process, the amount of expenditure onactive labour market policies, real interest rates, the tax wedge, union density andemployment protection legislation, many of the effects of the latter set of variables arehighly correlated. This multicollinearity problem ensures that even if all thesevariables were included in our equation specification it would still remain verydifficult to definitively establish the relative quantitative contribution of each factor tochanges in structural unemployment over time. The final specification chosen foreach country should therefore be seen as a type of summary reflection of a much morecomplex set of factors, with the small number of final variables chosen clearlyencapsulating the effects of a much wider, related, range of influences.
With regard to the policy implications of the analysis undertaken in this paper, thefirst point to note is that the NAIRU estimates produced tentatively support thehypothesis of a non-verticalshort-run Phillips curve, with quantifiable feedbackeffects being identified from deviations in the actual unemployment rate from thenatural rate to changes in the rate of wage/price inflation. While, of course, empiricalsupport may exist for such a short-run trade-off, it would be fundamentally wrong toinfer from this evidence that such a trade-off could be exploited for policy purposes.This is especially true here in Europe given the previously mentioned instabilities inthe Phillips curve for the majority of the Community countries. In fact, given all theempirical and theoretical difficulties associated with the NAIRU concept, theindividual point estimates produced in this paper for the various countries are likely,not surprisingly, to evoke a strong sense of dubiousness on the part of many nationalpolicy makers.
At a wider level, there would appear to be a growing sense of unease in a number ofEuropean countries, openly articulated in the vast literature on this topic, concerningboth the theoretical and empirical underpinnings of the NAIRU concept, with thisunease suggesting caution in attributing any policy role at all to the concept. In thisregard it should be remembered that in addition to the practical measurementproblems already alluded to, at a fundamental level the theoretical weaknesses, inparticular hysteresis mechanisms, call into question even the existence of a uniquelong run NAIRU, i.e. it may be indeterminate or stochastic by nature. However, whilethe present authors share a lot of the latter concerns and feel that these problemsrender short-run NAIRU estimates, like the ones calculated in this paper, less thanuseful in the macro policy context, it is nevertheless felt that a case can still be madefor sustaining the use of these estimates as a structural indicator for cross country,labour flexibility, comparisons. Regarding the latter, it is postulated that short-runNAIRU's contain useful information for structural policy and that calculating this
36
concept as an ex-post indicator of structural problems still remains its most importantpotential contribution to the policy debate.
Finally, in terms of future research, it is clear that a more disaggregated analysis isneeded if one wishes to use these NAIRU estimates in any meaningful way in thestructural policy making process in the various countries. In this regard, in mostMember States, it is widely accepted that the fundamental problem regardingstructural unemployment lies at the low end of the skill distribution. Action toaddress this problem is manifestly needed to enhance the employability of theunskilled and the inexperienced through active labour market measures whilst at thesame time increasing the employment prospects of this group of workers through suchmeasures as targetted reductions in employers social charges, appropriate action interms of statutory wage floors and overhauling the system of social assistance toensure that it is not acting to undermine incentives to work. Policy actions along thelatter lines have already been introduced in a large number of Member States. In thisregard it is clear that our present specification is not detailed enough to pick up theeffects of such changes, including for example the introduction of importantmodifications to the tax regime for the low skilled, since the necessary, cross-country,data to include a meaningful skilled / unskilled breakdown is difficult to assemble.This is something which must urgently be addressed in any future research work inthis area.

37
ANNEX 1GRAPHIC PRESENTATION
OF
KEY EXPLANATORY VARIABLES *
Belgium
1990 19950
0.01
0.02
0.03
0.04
0.05
0.06
0.07
0.08
Real Interest Rate
Trend Productivity
1990 19950.25
0.35
0.45
0.55
0.65
0.75
Labour Taxation
Tax Burden
Germany
1990 19950
0.01
0.02
0.03
0.04
0.05
0.06
0.07
Real Interest Rate
TrendProd'y
1990 19950.25
0.35
0.45
0.55
0.65
Labour Taxation
Tax Burden
* Tax burden is measured as all current taxes on income and wealth plus total socialsecurity contributions as a proportion of nominal compensation of employees.
Labour taxation = the effective tax rate on labour income. This is measured as non-wage labour costs plus personal income taxes on labour income as a proportion oftotal gross wages.
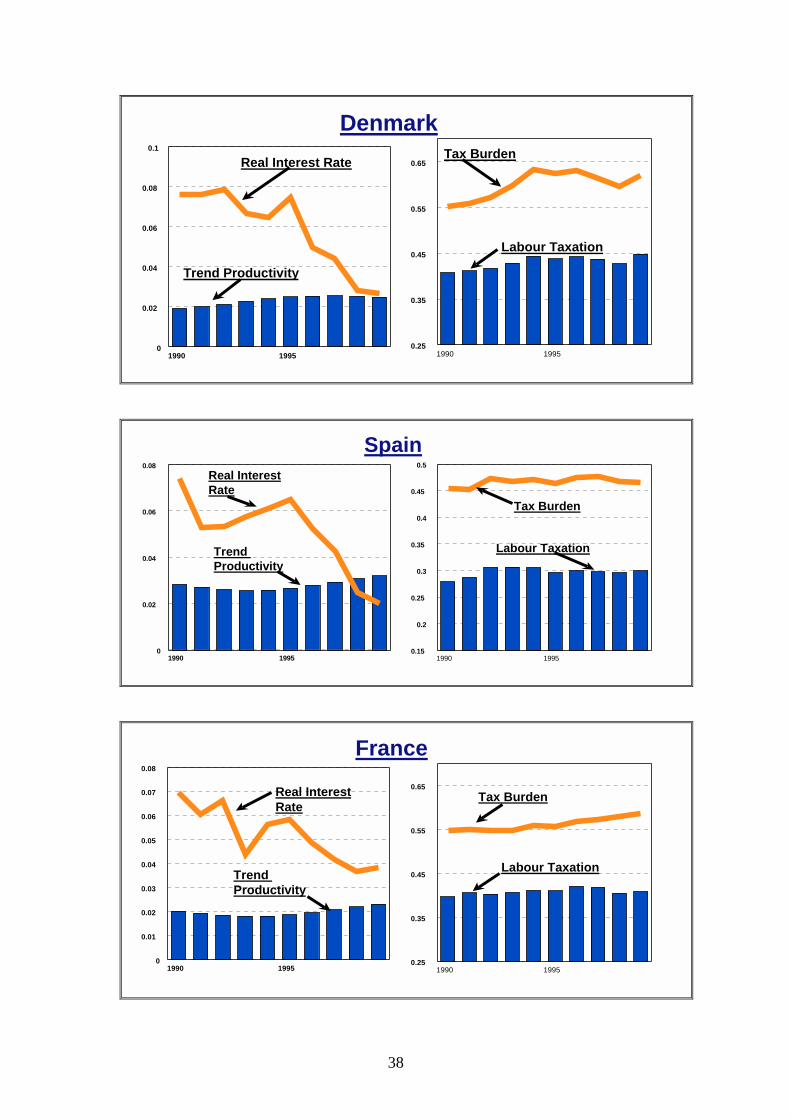
38
Denmark
1990 19950
0.02
0.04
0.06
0.08
0.1
Real Interest Rate
Trend Productivity
1990 19950.25
0.35
0.45
0.55
0.65
Labour Taxation
Tax Burden
Spain
1990 19950
0.02
0.04
0.06
0.08
Real InterestRate
TrendProductivity
1990 19950.15
0.2
0.25
0.3
0.35
0.4
0.45
0.5
Labour Taxation
Tax Burden
France
1990 19950
0.01
0.02
0.03
0.04
0.05
0.06
0.07
0.08
Real InterestRate
TrendProductivity
1990 19950.25
0.35
0.45
0.55
0.65
Labour Taxation
Tax Burden
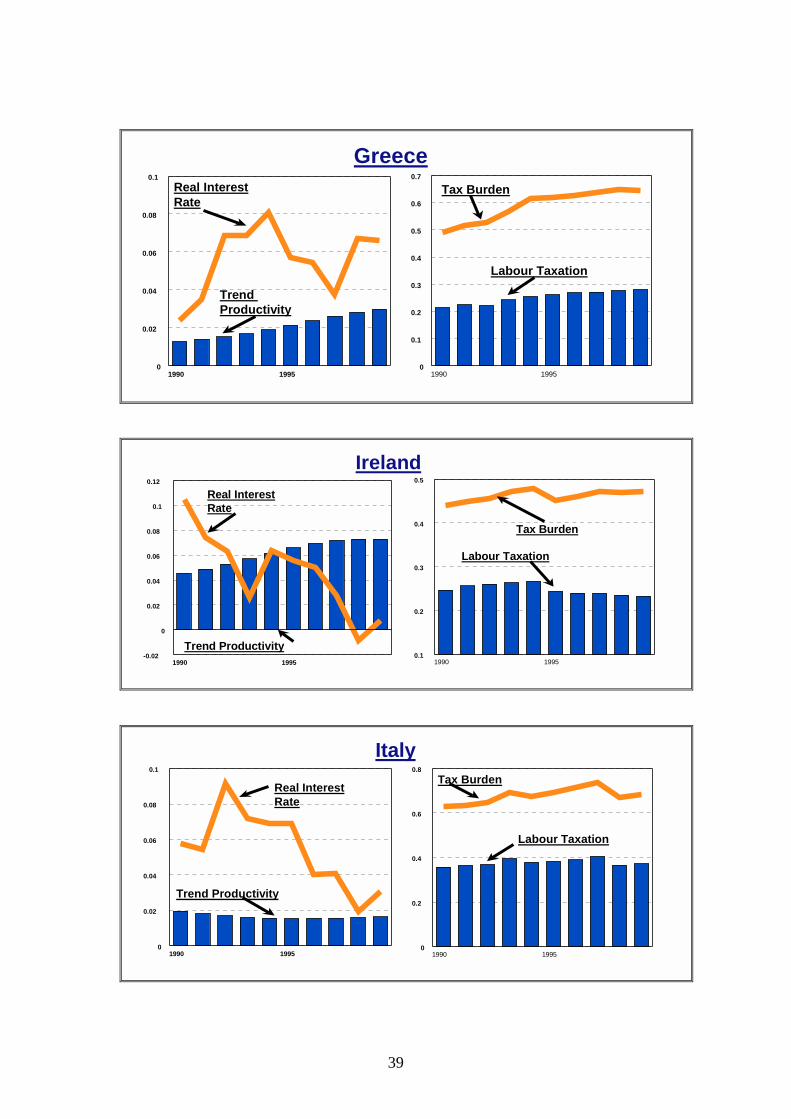
39
Greece
1990 19950
0.02
0.04
0.06
0.08
0.1
Real InterestRate
TrendProductivity
1990 19950
0.1
0.2
0.3
0.4
0.5
0.6
0.7
Labour Taxation
Tax Burden
Ireland
1990 1995
0
0.02
0.04
0.06
0.08
0.1
0.12
-0.02
Real InterestRate
Trend Productivity1990 1995
0.1
0.2
0.3
0.4
0.5
Labour Taxation
Tax Burden
Italy
1990 19950
0.02
0.04
0.06
0.08
0.1
Real InterestRate
Trend Productivity
1990 19950
0.2
0.4
0.6
0.8
Labour Taxation
Tax Burden
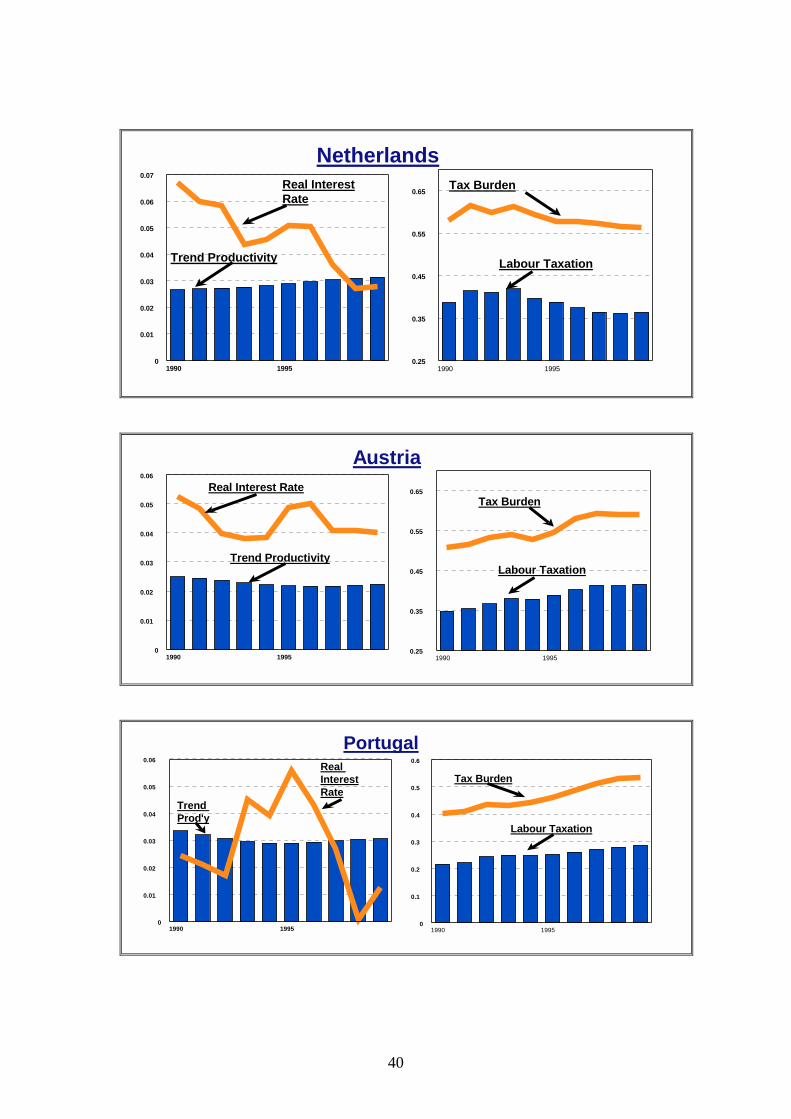
40
Netherlands
1990 19950
0.01
0.02
0.03
0.04
0.05
0.06
0.07
Real InterestRate
Trend Productivity
1990 19950.25
0.35
0.45
0.55
0.65
Labour Taxation
Tax Burden
Austria
1990 19950
0.01
0.02
0.03
0.04
0.05
0.06
Real Interest Rate
Trend Productivity
1990 19950.25
0.35
0.45
0.55
0.65
Labour Taxation
Tax Burden
Portugal
1990 19950
0.01
0.02
0.03
0.04
0.05
0.06RealInterestRate
TrendProd'y
1990 19950
0.1
0.2
0.3
0.4
0.5
0.6
Labour Taxation
Tax Burden
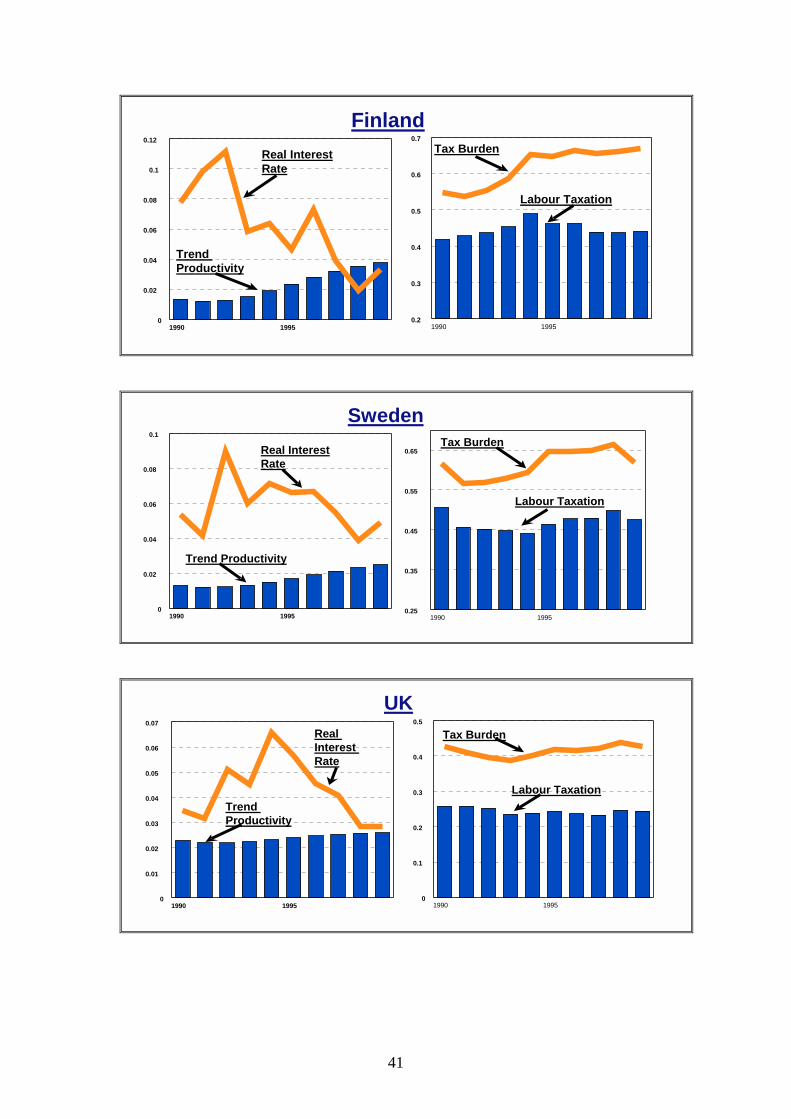
41
Finland
1990 19950
0.02
0.04
0.06
0.08
0.1
0.12
Real InterestRate
TrendProductivity
1990 19950.2
0.3
0.4
0.5
0.6
0.7
Labour Taxation
Tax Burden
Sweden
1990 19950
0.02
0.04
0.06
0.08
0.1
Real InterestRate
Trend Productivity
1990 19950.25
0.35
0.45
0.55
0.65
Labour Taxation
Tax Burden
UK
1990 19950
0.01
0.02
0.03
0.04
0.05
0.06
0.07
RealInterestRate
TrendProductivity
1990 19950
0.1
0.2
0.3
0.4
0.5
Labour Taxation
Tax Burden

42
List of References
Adams, C. and D. Coe (1990),“A Systems Approach to Estimating the Natural Rateof Unemployment and Potential Output for the US", IMF Staff Papers (June).
Andersen, T. and S. Hylleberg (2000),“Sources of Persistence in EmploymentAdjustment - Denmark 1974-93 ", Oxford Economic Papers, Volume 52.
Arulampalam, W., Booth, A. and M. Taylor (2000), “Unemployment Persistence",Oxford Economic Papers, Volume 52.
Balmaseda, M., Dolado, J. and J. Lopez-Salido (2000),“The Dynamic Effects ofShocks to Labour Markets: Evidence from OECD Countries", Oxford EconomicPapers, Volume 52.
Ball, L. (1996), “Disinflation and the NAIRU”, NBER Working Paper No. 5520.
Bank of England (1999): "Economic Models at the Bank of England".
Barrell, R., Pain, N. and G. Young (1993): "Structural Differences in EuropeanLabour Markets", NIESR.
Bean, C. (1994) : "European Unemployment: A Survey", Journal of EconomicLiterature.
Blanchard, O. (1998), “Revisiting European Unemployment : Unemployment,Capital Accumulation and Factor Prices", NBER Working Paper No. 6566.
Blanchard, O. and L. Summers (1988),“Beyond the Natural Rate Hypothesis”,American Economic Review.
Blanchard, O. and L. Katz (1997), “What We Know and Do Not Know about theNatural Rate of Unemployment”, Journal of Economic Perspectives (Winter).
Blanchard, O. and L. Katz (1999), “Wage Dynamics : Reconciling Theory andEvidence”, NBER Working Paper No. 6924.
Blanchard, O. and J. Wolfers (2000),“The Role of Shocks and Institutions in theRise of European Unemployment”, The Economic Journal, Vol 110 (March).
Boeri, T., Nicoletti, G. and S. Scarpetta (1999),“Regulation and Labour MarketPerformance", Working Paper No. 158, Bocconi University.
Broersma, L., Koeman, J. and C. Teulings (2000),“Labour Supply, the NaturalRate and the Welfare State in the Netherlands", Oxford Economic Papers, Volume 52.
Brunello, G., Lupi, C. and P. Ordine (2000),“Regional Disparities and the ItalianNAIRU", Oxford Economic Papers, Volume 52.
Calmfors, L. and J. Driffill (1988), “Bargaining Structure, Corporatism andMacroeconomic Performance“. Economic Policy 6.

43
Carruth, A., Hooker, M. and A. Oswald (1993) : "Unemployment, Oil Prices andthe Real Interest Rate", CEP Discussion Paper No 188, London School of Economics.
Chang, R. (1997),“Is Low Unemployment Inflationary”, Federal Reserve Bank ofAtlanta Economic Review (1st Quarter).
Coe, D.T. (1985),“Nominal Wages, the NAIRU and Wage Flexibility”, OECDEconomic Studies, N° 5.
Coulton, B. and R. Cromb (1994),“The UK NAIRU”, UK Government EconomicService Working Paper N° 124.
Cross, R., Darby, J. and J. Ireland (1997),“Uncertainties Surrounding Natural RateEstimates in the G7”, University of Strathclyde (October).
Daveri, F. and G. Tabellini (1997) “Unemployment Growth and Taxation inIndustrial Countries”. Mimeo. The World Bank.
Darby, J., J. Ireland and S. Wren-Lewis (1992): "Interest Rates, Vintages and theNatural Rate", International Centre for Macroeconomic Modelling, University ofStrathclyde.
Debelle, G. and D. Laxton (1997),“Is the Phillips Curve Really a Curve? SomeEvidence for Canada, the United Kingdom and the United States”, IMF Staff Papers(June).
Egebo, T. and A. Englander (1992),“Institutional Commitments and PolicyCredibility : A Critical Survey and Empirical Evidence from the ERM”, OECDEconomic Studies No.18, Spring.
Elmeskov, J. (1993), “High and Persistent Unemployment: Assessment of theProblem and Its Causes”, OECD Working Paper N° 132.
Espinosa-Vega, M.A. and S. Russell (1997),“History and Theory of the NAIRU: ACritical Review”, Federal Reserve Bank of Atlanta Economic Review (2nd Quarter).
Estrella, A. and F. Mishkin (1998), “Rethinking the Role of the NAIRU inMonetary Policy : Implications of Model Formulation and Uncertainty”, NBERWorking Paper No. 6518.
European Economy (1995),“The Composition of Unemployment from an EconomicPerspective”, Analytical Study N° 3.
Fabiani, S., Locarno, A., Oneto, G. and P. Sestito (1997),“NAIRU : IncomesPolicy and Inflation”, OECD Working Paper N°. 187.
Fuhrer, J.C. (1995), “The Phillips Curve is Alive and Well”, New EnglandEconomic Review (March/April).
Galbraith, J.K. (1997), “Time to Ditch the NAIRU”, Journal of EconomicPerspectives (Winter).
44
Gersing, A. (1997),“Structural Unemployment in Denmark”, OECD Working PaperN° 183.
Giorno, C., Richardson, P., Roseveare, D. and P. van den Noord (1995),“Estimating Potential Output, Output Gaps and Structural Budget Balances”, OECDWorking Paper N°. 152.
Gordon, R. (1997),“The Time-Varying NAIRU and its Implications for EconomicPolicy”, Journal of Economic Perspectives (Winter).
Gordon, R. (1998),“Foundations of the Goldilocks Economy : Supply Shocks andthe Time-Varying NAIRU”, Paper presented at Brookings Panel on EconomicActivity, Washington, D.C., Sept 1998.
Henry, B., Karanassou, M. and D. Snower (2000),“Adjustment Dynamics and theNatural Rate : An Account of UK Unemployment", Oxford Economic Papers,Volume 52.
Henry, B. and J. Nixon (2000), “Unemployment Dynamics in the UK", OxfordEconomic Papers, Volume 52.
Holm, P. and H. Somervouri (1997),“Structural Unemployment in Finland”, OECDWorking Paper N° 177.
Karanassou, M. and Snower, D. (1996),“Is the Natural Rate a Reference Point”,CEPR Discussion Paper N° 1507.
Karanassou, M. and Snower, D. (1998),“How Labour Market Flexibility AffectsUnemployment : Long-term Implications of the Chain Reaction Theory”, TheEconomic Journal, Vol 108 (May).
Kawaski, K., Hoeller, P. and P. Poret (1990),“Modelling Wages and Prices for theSmaller OECD Countries”, OECD Working Paper N° 86.
King, R. and M. Watson (1994),“The Post-War US Phillips Curve: A RevisionistEconometric History”, Carnegie-Rochester Conference Series on Public Policy, N°41.
King, M. (1999), “Monetary Policy and the Labour Market”, Bank of EnglandQuarterly Bulletin.
Laxton, D., Rose, D. and D. Tambakis (1997),“The US Phillips Curve: The Casefor Asymmetry”, IMF.
Layard, R., Nickell, S. and Jackman, R. (1991),“Unemployment-MacroeconomicPerformance and the Labour Market”, Oxford University Press.
Madsen, J. (1998),“General Equilibrium Macroeconomic Models of Unemployment: Can they Explain the Unemployment Path in the OECD”, The Economic Journal,Vol 108 (May).

45
Manning, A. (1992) : "Productivity Growth, Wage Setting and the Equilibrium Rateof Unemployment", CEPR.
Manning, A. (1993) : "Wage Bargaining and the Phillips Curve : The Identificationand Specification of Aggregate Wage Equations", Economic Journal.
Martin, J. (1996) : "Measures of Replacement Rates for the Purpose of InternationalComparisons", OECD Economic Studies, No 26.
Martinez Mongay, C. (1999), “Effective Tax Rates Based on Ameco Data"European Commission, Internal ECFIN Note.
McAdam, P. and K. Mc Morrow (1999), “The NAIRU Concept - MeasurementUncertainties, Hysteresis and Economic Policy Role”, European Commission, ECFINEconomic Paper No.136.
Mc Morrow, K. (1996), “The Wage Formation Process and Labour MarketFlexibility in the Community, the US and Japan”, European Commission, ECFINEconomic Paper No.118.
Mellis, C. and A. Webb (1997), “The United Kingdom NAIRU : Concepts,Measurement and Policy Implications”, OECD Working Paper N° 182.
Nickell, S. (1998),“Unemployment: Questions and some Answers”, The EconomicJournal (May).
Nishizaki, F. (1997), “The NAIRU in Japan : Measurement and its Implications”,OECD Working Paper N° 173.
OECD (1999),“Implementing the OECD Jobs Strategy : Assessing Performance andPolicy”, (June).
OECD (1999a),“EMU – Facts, Challenges and Policies”.
Orlandi, F and K. Pichelmann (2000).“Disentangling Trend and Cycle in the EUR-11 Unemployment Series", European Commission, ECFIN Economic Paper No.140.
Pedroni, P (1997).“Panel Cointegration, Asymptotic Finite Sample Properties ofPooled Time Series Tests, with an Application to the PPP Hypothesis: New Results”.Working Paper, Indiana University.
Pedroni, P. (1999)“Critical Values for Cointegration Tests in Heterogeneous Panelswith Multiple Regressors”. Oxford Bulletin of Economics and Statistics 61, pp.653-670.
Phelps, E. (1992) : "Consumer Demand and Equilibrium Unemployment in aWorking Model of the Customer-Market Incentive-Wage Economy", The QuarterlyJournal of Economics.
Phelps, E. (1994) : "Structural Slumps: A Modern Equilibrium Theory ofUnemployment, Interest and Assets", Harvard University Press.

46
Phelps, E. and G. Zoega (1997),“The Rise and Downward Trend of the NaturalRate", AEA Papers and Proceedings (May).
Phelps, E. and G. Zoega (1998),“Natural Rate Theory and OECD Unemployment",The Economic Journal, Volume 108 (May).
Phelps, E. (2000),“Lessons in Natural Rate Dynamics", Oxford Economic Papers,Volume 52.
Pichelmann, K. and A. Ulrich Schuh (1997), “The NAIRU-Concept: a FewRemarks”, OECD Working Paper N° 178.
Pissarides, C. (1998),“The Impact of Employment Tax Cuts on Unemployment andWages : The Role of Unemployment Benefits and Tax Structure”, EuropeanEconomic Review.
Roeger, W. and J. in ‘t Veld (1997),“Quest II: A Multi-country Business Cycle andGrowth Model”, EC Commission, ECFIN Economic Papers Series No.123.
Roeger, W. and H. Wijkander (1999) : "Unemployment in Europe : SwimmingAgainst the Tide of Skill-Biased Technical Progress without Relative WageAdjustment", European Commission, Forthcoming in the ECFIN Economic PaperSeries.
Scarpetta, S. (1996) : "Assessing the Role of Labour Market Policies andInstitutional Settings in Unemployment : A cross-country study", OECD EconomicStudies No 26.
Setterfield, M., Gordon, D. and L. Osberg (1992), “Searching for a will-o-the-wisp:an Empirical Study of the NAIRU in Canada”, European Economic Review, 36.
Smith, J. (2000),“Nominal Wage Rigidity in the United Kingdom”, The EconomicJournal, Vol 110 (March).
Siebert, H. (1997),“Labour Market Rigidities : At the Root of Unemployment inEurope”, Journal of Economic Perspectives, (Summer).
Staiger, D., Stock, J. and M. Watson (1996),“How Precise are Estimates of theNatural Rate of Unemployment”, NBER Working Paper Series N° 5477.
Staiger, D., Stock, J. and M. Watson (1997), “The NAIRU, Unemployment andMonetary Policy”, Journal of Economic Perspectives (Winter).
Stiglitz, J. (1997), “Reflections on the Natural Rate Hypothesis”, Journal ofEconomic Perspectives (Winter).
Tootell, G. (1994)“Restructuring, the NAIRU and the Phillips Curve”, New EnglandEconomic Review (September/October).
Turner, D. and E. Seghezza (1999)“Testing for a Common OECD Phillips Curve”,OECD Working Paper N° 219.

47
Turner, D. (1995) “Speed Limits and Asymmetric Inflation Effects from the OutputGap in the Major Seven Economies” OECD Economic Studies N° 24.
Verlinden, J. (1997),“Concept, Measurement and Policy Implications of the NAIRU– Perspective from Belgium”, OECD Working Paper N° 184.
Walsh, B. (2000), “Cyclical and Structural Influences on Irish Unemployment",Oxford Economic Papers, Volume 52.
48
Economic Papers*
The following papers have been issued. Copies may be obtained by applying to the address:European Commission, Directorate-General for Economic and Financial Affairs200, rue de la Loi (BU-1, -1/10)1049 Brussels, Belgium
No. 1 EEC-DG II inflationary expectations. Survey based inflationary expectations for the EECcountries, by F. Papadia and V. Basano (May 1981).
No. 3 A review of the informal Economy in the European Community, By Adrian Smith (July 1981).
No. 4 Problems of interdependence in a multipolar world, by Tommaso Padoa-Schioppa (August1981).
No. 5 European Dimensions in the Adjustment Problems, by Michael Emerson (August 1981).
No. 6 The bilateral trade linkages of the Eurolink Model : An analysis of foreign trade andcompetitiveness, by P. Ranuzzi (January 1982).
No. 7 United Kingdom, Medium term economic trends and problems, by D. Adams, S. Gillespie, M.Green and H. Wortmann (February 1982).
No. 8 Où en est la théorie macroéconomique, par E. Malinvaud (juin 1982).
No. 9 Marginal Employment Subsidies : An Effective Policy to Generate Employment, by CarlChiarella and Alfred Steinherr (November 1982).
No. 10 The Great Depression: A Repeat in the l980s ?, by Alfred Steinherr (November 1982).
No. 11 Evolution et problèmes structurels de l’économie néerlandaise, par D.C. Breedveld, C.Depoortere, A. Finetti, Dr. J.M.G. Pieters et C. Vanbelle (mars 1983).
No. 12 Macroeconomic prospects and policies for the European Community, by Giorgio Basevi,Olivier Blanchard, Willem Buiter, Rudiger Dornbusch, and Richard Layard (April 1983).
No. 13 The supply of output equations in the EC-countries and the use of the survey–basedinflationary expectations, by Paul De Grauwe and Mustapha Nabli (May 1983).
No. 14 Structural trends of financial systems and capital accumulation : France, Germany, Italy, by G.Nardozzi (May 1983).
No. 15 Monetary assets and inflation induced distorsions of the national accounts - conceptual issuesand correction of sectoral income flows in 5 EEC countries, by Alex Cukierman and JorgenMortensen (May 1983).
No. 16 Federal Republic of Germany. Medium-term economic trends and problems, by F. Allgayer, S.Gillespie, M. Green and H. Wortmann (June 1983).
No. 17 The employment miracle in the US and stagnation employment in the EC, by M. Wegner (July1983).
No. 18 Productive Performance in West German Manufacturing Industry 1970-l980; A FarrellFrontier Characterisation, by D. Todd (August 1983).
No. 19 Central-Bank Policy and the Financing of Government Budget Deficits : A Cross-CountryComparison, by G. Demopoulos, G. Katsimbris and S. Miller (September 1983).
* Issues 1 to 115 are out of print

49
No. 20 Monetary assets and inflation induced distortions of the national accounts. The case ofBelgium, by Ken Lennan (October 1983).
No. 21 Actifs financiers et distorsions des flux sectoriels dues à l’inflation: le cas de la France, par J.–P Baché (octobre 1983).
No. 22 Approche pragmatique pour une politique de plein emploi : les subventions à la créationd’emplois, par A. Steinherr et B. Van Haeperen (octobre 1983).
No. 23 Income Distribution and Employment in the European Communities 1960-1982, by A.Steinherr (December 1983).
No. 24 U.S. Deficits, the dollar and Europe, by O. Blanchard and R. Dornbusch (December 1983).
No. 25 Monetary Assets and inflation induced distortions of the national accounts. The case of theFederal Republic of Germany, by H. Wittelsberger (January 1984).
No. 26 Actifs financiers et distorsions des flux sectoriels dues à l’inflation : le cas de l’Italie, par A.Reati (janvier 1984).
No. 27 Evolution et problèmes structurels de l’économie italienne, par Q. Ciardelli, F. Colasanti et X.Lannes (janvier 1984).
No. 28 International Co-operation in Macro-economic Policies, by J.E. Meade (February 1984).
No. 29 The Growth of Public Expenditure in the EEC Countries 1960-1981 : Some Reflections, byDouglas Todd (December 1983).
No. 30 The integration of EEC qualitative consumer survey results in econometric modelling : anapplication to the consumption function, by Peter Praet (February 1984).
No. 31 Report of the CEPS Macroeconomic Policy Group. EUROPE : The case for unsustainablegrowth, by R. Layard, G. Basevi, O. Blanchard, W. Buiter and R. Dornbusch (April 1984).
No. 32 Total Factor Productivity Growth and the Productivity Slowdown in the West GermanIndustrial Sector, 1970-1981, by Douglas Todd (April 1984).
No. 33 An analytical Formulation and Evaluation of the Existing Structure of Legal ReserveRequirements of the Greek Economy : An Uncommon Case, by G. Demopoulos (June 1984).
No. 34 Factor Productivity Growth in Four EEC Countries, 1960-1981, by Douglas Todd (October1984).
No. 35 Rate of profit, business cycles and capital accumulalion in U.K. industry, 1959-1981, byAngelo Reati (November 1984).
No. 36 Report of the CEPS Macroeconomic Policy Group. Employment and Growth in Europe : ATwo-Handed Approach by P. Blanchard, R. Dornbush, J. Drèze, H. Giersch, R. Layard and M.Monti (June 1985).
No. 37 Schemas for the construction of an ”auxiliary econometric model” for the social securitysystem, by A. Coppini and G. Laina (June l985).
No. 38 Seasonal and Cyclical Variations in Relationship among Expectations, Plans and Realizationsin Business Test Surveys, by H. König and M. Nerlove (July 1985).
No. 39 Analysis of the stabilisation mechanisms of macroeconomic models : a comparison of theEurolink models by A. Bucher and V. Rossi (July 1985).
No. 40 Rate of profit, business cycles and capital accumulation in West German industry, 1960-1981,by A. Reati (July 1985).
No. 41 Inflation induced redistributions via monetary assets in five European countries : 1974-1982,by A. Cukierman, K. Lennan and F. Papadia (September 1985).
50
No. 42 Work Sharing: Why ? How ? How not ..., by Jacques H. Drèze (December 1985).
No. 43 Toward Understanding Major Fluctuations of the Dollar by P. Armington (January 1986).
No. 44 Predictive value of firms’ manpower expectations and policy implications, by G. Nerb (March1986).
No. 45 Le taux de profit et ses composantes dans l’industrie française de 1959 à 1981, par AngeloReati (mars 1986).
No. 46 Forecasting aggregate demand components with opinions surveys in the four main EC-Countries - Experience with the BUSY model, by M. Biart and P. Praet (May 1986).
No. 47 Report of CEPS Macroeconomic Policy Group : Reducing Unemployment in Europe : TheRole of Capital Formation, by F. Modigliani, M. Monti, J. Drèze, H. Giersch and R. Layard(July 1986).
No. 48 Evolution et problèmes structurels de l’économie française, par X. Lannes, B. Philippe et P.Lenain (août 1986).
No. 49 Long run implications of the increase in taxation and public debt for employment andeconomic growth in Europe, by G. Tullio (August 1986).
No. 50 Consumers Expectations and Aggregate Personal Savings, by Daniel Weiserbs and PeterSimmons (November 1986).
No. 51 Do after tax interest affect private consumption and savings ? Empirical evidence for 8industrial countries : 1970-1983, by G. Tullio and Fr. Contesso (December 1986).
No. 52 Validity and limits of applied exchange rate models : a brief survey of some recentcontributions, by G. Tullio (December 1986).
No. 53 Monetary and Exchange Rate Policies for International Financial Stability : a Proposal, byRonald I. McKinnon (November 1986).
No. 54 Internal and External Liberalisation for Faster Growth, by Herbert Giersch (February 1987).
No. 55 Regulation or Deregulation of the Labour Market : Policy Regimes for the Recruitment andDismissal of Employees in the Industrialised Countries, by Michael Emerson (June 1987).
No. 56 Causes of the development of the private ECU and the behaviour of its interest rates : October1982 - September 1985, by G. Tullio and Fr. Contesso (July 1987).
No. 57 Capital/Labour substitution and its impact on employment, by Fabienne Ilzkovitz (September1987).
No. 58 The Determinants of the German Official Discount Rate and of Liquidity Ratios during theclassical goldstandard: 1876-1913, by Andrea Sommariva and Giuseppe Tullio (September1987).
No. 59 Profitability, real interest rates and fiscal crowding out in the OECD area 1960-1985 (Anexamination of the crowding out hypothesis within a portfolio model), by Jorgen Mortensen(October 1987).
No. 60 The two-handed growth strategy for Europe : Autonomy through flexible cooperation, by J.Drèze, Ch. Wyplosz, Ch. Bean, Fr. Giavazzi and H. Giersch (October 1987).
No. 61 Collusive Behaviour, R & D, and European Policy, by Alexis Jacquemin (Novemher 1987).
No. 62 Inflation adjusted government budget deficits and their impact on the business cycle : empiricalevidence for 8 industrial countries, by G. Tullio (November 1987).
No. 63 Monetary Policy Coordination Within the EMS: Is there a Rule ?, by M. Russo and G. Tullio(April 1988).
51
No. 64 Le Découplage de la Finance et de l’Economie - Contribution à l’Evaluation des EnjeuxEuropéens dans la Révolution du Système Financier International par J.-Y. Haberer (mai1988).
No. 65 The completion of the internal market : results of macroeconomic model simulations, by M.Catinat, E. Donni and A. Italianer (September 1988).
No. 66 Europe after the crash : economic policy in an era of adjustment, by Charles Bean (September1988).
No. 67 A Survey of the Economies of Scale, by Cliff Pratten (October 1988).
No. 68 Economies of Scale and Intra-Community trade, by Joachim Schwalbach (October 1988).
No. 69 Economies of Scale and the Integration of the European Economy : the Case of Italy, byRodolfo Helg and Pippo Ranci (October 1988).
No 70 The Costs of Non-Europe - An assessment based on a formal Model of Imperfect Competitionand Economies of Scale, by A. Smith and A. Venables (October 1988).
No. 71 Competition and Innovation, by P.A. Geroski (October I 988).
No. 72 Commerce Intra-Branche - Performances des firmes et analyse des échanges commerciauxdans 1a Communauté européenne par le Centre d’Etudes Prospectives et d’InformationsInternationales de Paris (octobre 1988).
No. 73 Partial Equilibrium Calculations of the Impact of Internal Market Barriers in the EuropeanCommunity, by Richard Cawley and Michael Davenport (October 1988).
No. 74 The exchange-rate question in Europe, by Francesco Giavazzi (January 1989).
No. 75 The QUEST model (Version 1988), by Peter Bekx, Anne Bucher, Alexander Italianer,Matthias Mors (March 1989).
No. 76 Europe’s Prospects for the 1990s, by Herbert Giersch (May 1989).
No. 77 1992, Hype or Hope : A review, by Alexander Italianer (February 1990).
No. 78 European labour markets : a long run view (CEPS Macroeconomic Policy Group 1989 AnnualReport), by J.-P. Danthine, Ch. Bean, P. Bernholz and E. Malinvaud (February 1990).
No. 79 Country Studies - The United Kingdom, by Tassos Belessiotis and Ralph Wilkinson (July1990).
No. 80 See” Länderstudien” No. 1
No. 81 Country Studies - The Netherlands, by Filip Keereman, Françoise Moreau and Cyriel Vanbelle(July 1990).
No. 82 Country Studies - Belgium, by Johan Baras, Filip Keereman and Françoise Moreau (July1990).
No. 83 Completion of the internal market : An application of Public Choice Theory, by ManfredTeutemann (August 1990).
No. 84 Monetary and Fiscal Rules for Public Debt Sustainability, by Marco Buti (September 1990).
No. 85 Are we at the beginning of a new long term expansion induced, by technological change ?, byAngelo Reati (August 1991).
No. 86 Labour Mobility, Fiscal Solidarity and the Exchange Rate Regime : a Parable of EuropeanUnion and Cohesion, by Jorge Braga de Macedo (October 1991).
No. 87 The Economics of Policies to Stabilize or Reduce Greenhouse Gas Emissions : the Case ofCO2, by Mathias Mors (October 1991).
52
No. 88 The Adequacy and Allocation of World Savings, by Javier Santillán (December 1991).
No. 89 Microeconomics of Saving, by Barbara Kauffmann (December 1991).
No. 90 Exchange Rate Policy for Eastern Europe and a Peg to the ECU, by Michael Davenport (March1992).
No. 91 The German Economy after Unification : Domestic and European Aspects, by Jürgen Krögerand Manfred Teutemann (April 1992).
No. 92 Lessons from Stabilisation Programmes of Central and Eastern European Countries, 1989-91,by Domenico Mario Nuti (May 1992).
No. 93 Post-Soviet Issues : Stabilisation, Trade and Money, by D. Mario Nuti and Jean Pisani–Ferry(May 1992).
No. 94 Regional Integration in Europe by André Sapir (September 1992).
No. 95 Hungary : Towards a Market Economy (October 1992).
No. 96 Budgeting Procedures and Fiscal Performance in the European Communities, by Jürgen vonHagen (October 1992).
No. 97 L’ECU en poche ? Quelques réflexions sur la méthode et le coût du remplacement desmonnaies manuelles nationales par des pièces et des billets en ECU, par Ephraïm Marquer(octobre 1992).
No. 98 The Role of the Banking Sector in the Process of Privatisation, by Domenico Mario Nuti(November 1992).
No. 99 Towards budget discipline : an economic assessment of the possibilities for reducing nationaldeficits in the run-up to EMU, by Dr. J. de Haan, Dr. C.G.M. Sterks and Prof. Dr. C.A. de Kam(December 1992).
No. 100 EC Enlargement and the EFTA Countries, by Christopher Sardelis (March 1993).
No. 101 Agriculture in the Uruguay Round : ambitions and realities, by H. Guyomard, L.-P. Mahé, K.Munk and T. Roe (March 1993).
No. 102 Targeting a European Monetary Aggregate, Review and Current Issues, by ChristopherSardelis (July 1993).
No. 103 What Have We Learned About the Economic Effects of EC Integration ? - A Survey of theLiterature, by Claudia Ohly (September 1993).
No. 104 Measuring the Term Structure of ECU Interest Rates, by Johan Verhaeven and Werner Röger(October 1993).
No. 105 Budget Deficit and Interest Rates : Is there a Link ? International evidence, by José Nunes–Correia and Loukas Stemitsiotis (November 1993).
No. 106 The Implications for Firms and Industry of the Adoption of the ECU as the Single Currency inthe EC, by M. Burridge and D.G. Mayes (January 1994).
No. 107 What does an economist need to know about the environment ? Approaches to accounting forthe environment in statistical informations systems, by Jan Scherp (May 1994).
No. 108 The European Monetary System during the phase of transition to European Monetary Union,by Dipl.–Vw. Robert Vehrkamp (July 1994).
No. 109 Radical innovations and long waves into Pasinetti’s model of structural change : output andemployment, by Angelo Reati (March 1995).
No. 110 Pension Liabilities - Their Use and Misuse in the Assessment of Fiscal Policies, by DanieleFranco (May 1995).
53
No. 111 The Introduction of Decimal Currency in the UK in 1971. Comparisons with the Introductionof a Single European Currency, by N.E.A. Moore (June 1995).
No. 112 Cheque payments in Ecu - A Study of Cross-Border Payments by Cheques in Ecu Across theEuropean Union, by BDO Stoy Hayward Management Consultants (July 1995).
No. 113 Banking in Ecu - A Survey of Banking Facilities across the European Union in the ECU,Deutschmark and Dollar and of Small Firms’ Experiences and Opinions of the Ecu, by BDOStoy Hayward Management Consultants (July 1995).
No. 114 Fiscal Revenues and Expenditure in the Community. Granger-Causality Among FiscalVariables in Thirteen Member States and Implications for Fiscal Adjustment, by TassosBelessiotis (July 1995).
No. 115 Potentialities and Opportunities of the Euro as an International Currency, by Agnès Bénassy-Quéré (July 1996).
No. 116 Consumer confidence and consumer spending in France, by Tassos Belessiotis (September1996).
No. 117 The taxation of Funded Pension Schemes and Budgetary Policy, by Daniele Franco (September1996).
No. 118 The Wage Formation Process and Labour Market Flexibility in the Community, the US andJapan, by Kieran Mc Morrow (October 1996).
No. 119 The Policy Implications of the Economic Analysis of Vertical Restraints, by Patrick Rey andFrancisco Caballero-Sanz (November 1996).
No. 120 National and Regional Development in Central and Eastern Europe: Implications for EUStructural Assistance, by Martin Hallet (March 1997).
No. 121 Budgetary Policies during Recessions, - Retrospective Application of the “Stability andGrowth Pact” to the Post-War Period -, by M. Buti, D. Franco and H. Ongena (May 1997).
No. 122 A dynamic analysis of France’s external trade - Determinants of merchandise imports andexports and their role in the trade surplus of the 1990s, by Tassos Belessiotis and GiuseppeCarone (October 1997).
No. 123 QUEST II - A Multi Country Business Cycle and Growth Model, by Werner Roeger and Janin’t Veld (October 1997).
No. 124 Economic Policy in EMU - Part A : Rules and Adjustment, by Directorate General II,Economic and Financial Affairs (November 1997).
No. 125 Economic Policy in EMU - Part B : Specific Topics, by Directorate General II, Economic andFinancial Affairs (November 1997).
No. 126 The Legal Implications of the European Monetary Union under the U.S. and New York Law,by Niall Lenihan (January 1998).
No. 127 Exchange Rate Variability and EU Trade, by Khalid Sekkat (February 1998).
No. 128 Regionalism and the WTO: New Rules for the Game?, by Nigel Nagarajan (June 1998).
No. 129 MERCOSUR and Trade Diversion: What Do The Import Figures Tell Us?, by Nigel Nagarajan(July 1998).
No. 130 EUCARS: A partial equilibrium model of EUropean CAR emissions (Version 3.0), by CécileDenis and Gert Jan Koopman (November 1998).
No. 131 Is There a Stable Money Demand Equation at The Community Level? - Evidence, using acointegration analysis approach, for the Euro-zone countries and for the Community as a whole-, by Kieran Mc Morrow (November 1998).
54
No. 132 Differences in Monetary Policy Transmission? A Case not Closed, by Mads Kieler andTuomas Saarenheimo (November 1998).
No. 133 Net Replacement Rates of the Unemployed. Comparisons of Various Approaches, by AinoSalomäki and Teresa Munzi (February 1999).
No. 134 Some unpleasant arithmetics of regional unemployment in the EU. Are there any lessons forthe EMU?, by Lucio R. Pench, Paolo Sestito and Elisabetta Frontini (April 1999).
No. 135 Determinants of private consumption, by A. Bayar and K. Mc Morrow (May 1999).
No. 136 The NAIRU Concept - Measurement uncertainties, hysteresis and economic policy role, by P.McAdam and K. Mc Morrow (September 1999).
No. 137 The track record of the Commission Forecasts, by F. Keereman (October 1999).
No. 138 The economic consequences of ageing populations (A comparison of the EU, US and Japan),by K. Mc Morrow and W. Roeger (November 1999).
No. 139 The millennium round: An economic appraisal, by Nigel Nagarajan (November 1999).
No. 140 Disentangling Trend and Cycle in the EUR-11 Unemployment Series – An UnobservedComponent Modelling Approach, by Fabrice Orlandi and Karl Pichelmann (February 2000)
No. 141 Regional Specialisation and Concentration in the EU, by Martin Hallet (February 2000)
No. 142 The Location of European Industry, by K.H. Midelfart-Knarvik, H.G. Overman, S.J. Reddingand A.J. Venables (April 2000)
No. 143 Report on Financial Stability, by the Economic and Financial Committee (EFC) (May 2000)
No. 144 Estimation of Real Equilibrium Exchange Rates, by Jan Hansen and Werner Roeger(September 2000)
No. 145 Time-Varying Nairu/Nawru Estimates for the EU’s Member States, by K. McMorrow and W.Roeger (September 2000)
55
Euro Papers
The following papers have been issued. Copies may be obtained by applying to the address:European Commission, Directorate-General for Economic and Financial Affairs200, rue de la Loi (BU-1, -1/10)1049 Brussels, Belgium
No. 1 External aspects of economic and monetary union, by Directorate General II,Economic and Financial Affairs (July 1997).
No. 2 Accounting for the introduction of the euro, by Directorate General XV, InternalMarket and Financial Services (July 1997).
No. 3 The impact of the introduction of the euro on capital markets, by Directorate GenerallI, Economic and Financial Affairs (July 1997).
No. 4 Legal framework for the use of the euro, by Directorate General II, Economic andFinancial Affairs(September 1997).
No. 5 Round Table on practical aspects of the changeover to the euro -May 15, 1997 -Summary and conclusions, by Directorate General II, Economic and FinancialAffairs (September 1997).
No. 6 Checklist on the introduction of the euro for enterprises and auditors, by Fédérationdes Experts Comptables Européens (September 1997).
No. 7 The introduction of the euro—Compilation of community legislation and relateddocuments, by Directorate General II, Economic and Financial Affairs (October1997).
No. 8 Practical aspects of the introduction of the euro, by Directorate General II, Economicand Financial Affairs (November 1997).
No. 9 The impact of the changeover to the euro on community policies, institutions andlegislation, by Directorate General II, Economic and Financial Affairs (November1997).
No. 10 Legal framework for the use of the euro - Questions and answers on the euroregulations, by Directorate General II, Economic and Financial Affairs (December1997).
No. 11 Preparing Financial Information Systems for the euro, by Directorate General XV,Internal Market and Financial Services (December 1997).
No. 12 Preparations for the changeover of public administrations to the euro, by DirectorateGeneral II, Economic and Financial Affairs (December 1997).
No. 13 Report of the Expert Group on Technical and Cost Aspects of Dual Display, byDirectorate General II, Economic and Financial Affairs (December 1997).
No. 14 Report of the Expert Group on banking charges for conversion to the euro, byDirectorate General XV, Internal Market and Financial Services (January 1998).
No. 15 The Legal Implications of the European Monetary Union under the U.S. and NewYork Law, by Niall Lenihan, (Study commissioned by Directorate General II,Economic and Financial Affairs) (January 1998).
56
No. 16 Commission Communication on the information strategy for the euro, by DirectorateGeneral X, Information, communication, culture, audiovisual communication andDirectorate General II, Economic and Financial Affairs (February 1998).
No. 17 The euro: explanatory notes, by Directorate General II, Economic and FinancialAffairs (February 1998).
No. 18 Report by the Working Group on “Acceptance of the new prices and scales of valuesin euros”, by Directorate General XXIII, Enterprise Policy, Distributive Trades,Tourism and Social Economy and Directorate General XXIV, Consumer PolicyService (February 1998).
No. 19 Report of the Expert Working Group “Euro-Education”, by Directorate GeneralXXII, Education, Training and Youth (February 1998).
No. 20 Report by the Working Party “Small businesses and the euro”, by DirectorateGeneral XXIII, Enterprise Policy, Distributive Trades, Tourism and Social Economy(February 1998).
No. 21 Update on the practical aspects of the introduction of the euro, by Directorate GeneralII, Economic and Financial Affairs (February 1998).
No. 22 The introduction of the euro and the rounding of currency amounts, by DirectorateGeneral II, Economic and Financial Affairs (March 1998).
No. 23 From Round Table to Recommendations on practical aspects of the introduction ofthe euro, by Directorate General II, Economic and Financial Affairs (May 1998).
No. 24 The impact of the euro on Mediterranean partner countries, by Jean-Pierre Chauffourand Loukas Stemitsiotis, Directorate General II, Economic and Financial Affairs(June 1998).
No. 25 The introduction of the euro - Addendum to the compilation of community legislationand related documents, by Directorate General II, Economic and Financial Affairs(July 1998).
No. 26 The implications of the introduction of the euro for non-EU countries, by Peter Bekx,Directorate General II, Economic and Financial Affairs (July 1998).
No. 27 Fact sheets on the preparation of national public administrations to the euro (Status :15 May 1998), by Directorate General II, Economic and Financial Affairs (July1998).
No. 28 Debt redenomination and market convention in stage III of EMU, by MonetaryCommittee (July 1998).
No. 29 Summary of experts’ reports compiled for the euro working group/EuropeanCommission - DG XXIV on psycho-sociological aspects of the changeover to theeuro, by Directorate General XXIV, Consumer Policy and Consumer HealthProtection (November 1998).
No. 30 Implementation of the Commission Recommendation on banking charges for theconversion to the euro, by Directorate General XV, Internal Market and FinancialServices, Directorate General II, Economic and Financial Affairs and DirectorateGeneral XXIV, Consumer Policy and Consumer Health Protection (December 1998).
No. 31 How large companies could help their small suppliers and distributors change over tothe euro. Proceedings and conclusions of the Workshop held on 5 November 1998 in
57
Brussels. Organised by the Directorate General II and The Association for theMonetary Union of Europe (January 1999).
No. 32 Risk capital markets, a key to job creation in Europe. From fragmentation tointegration - Report prepared by Delphine Sallard, Directorate General II, Economicand Financial Affairs, on a conference organised by the European Commission on 24November 1998, in Brussels (January 1999).
No. 33 The impact of the changeover to the euro on community policies, institutions andlegislation (Progress towards implementing the Commission’s Communication ofNovember 1997), by Directorate General II, Economic and Financial Affairs (April1999).
No. 34 Duration of the transitional period related to the introduction of the euro (Report fromthe Commission to the Council), by Directorate General II, Economic and FinancialAffairs (April 1999).
No. 35 EU Repo markets: opportunities for change, (Report of the Giovannini Group)(October 1999).
No. 36 Migrating to euro - System strategies & best practices recommendations for theadaptation of information systems to the euro, (Report by the Euro Working Group)(October 1999).
No. 37 Euro coins – From design to circulation, by Directorate-General ECFIN, Economicand Financial Affairs (May 2000)
No. 38 Communication from the Commission on communications strategy in the last phasesof the completion of EMU, by Directorate General II, Economic and FinancialAffairs (August 2000).
No. 39 Changing to the euro – What would happen to a company on 1 January 2002 that hadnot converted to the euro? Advice to managers and their advisers, by Fédération desExperts Comptables Européens (August 2000)
No. 40 Conference “Enterprises 2002” – 6 June 2000. A round table on the practical impacton enterprises at the end of the “transition period”by Directorate General forEconomic and Financial Affairs, August 2000
No. 41 Communication from the Commission on the practical aspects of the euro: state ofplay and tasks ahead, by Directorate General II, Economic and Financial Affairs(August 2000).