Embed Size (px)
Citation preview

Economic Quarterly Report 1st Quarter 2021

2 | Economic Quarterly Report
PEDESTRIANSPEDESTRIANSPEDESTRIAN COUNTSWELCOMING BACK THE GARMENT DISTRICT
We are resuming our quarterly Economic Reports this year after a pause in 2020. Leasing of both office and retail spaces slowed dramatically as the COVID-19 crisis unfolded, and accurate tracking of leasing activity was impacted as in-person communication and office working were disrupted. Even today, as the city and the Garment District are slowly emerging from the devastating effects of the last year, the impact of the pandemic on economic activity in the neighborhood is not entirely clear. Availability and vacancy rates are at highs not seen in at least a decade, and the average months on market for available spaces has nearly doubled.
In just over one week in March 2020, when local restrictions were first implemented, neighborhood pedestrian counts dropped 70 percent, eventually falling by 90 percent. Storefronts and offices shuttered, and travel into the District’s public transit hubs fell by well over 90 percent. Activity began gradually rebounding in early May, but pedestrian counts and other measures, while improving steadily, remain far below normal.
Tourism and business travel were also decimated by COVID-19 as New York City missed out on most of its typical 50 million domestic and 13.5 million foreign tourists. This was particularly impactful in the Garment District, where 48 hotels and 11,000 rooms account for more than eight percent of the entire hotel capacity in New York City. The neighborhood was one of the best performing hotel markets in the city in recent years, and the rise of the restaurant and bar scene in the District has largely coincided with the hotel construction boom that has seen 33 hotels constructed in the past ten years.
As vaccinations continue to roll out at a rapid rate and local restrictions are eased, there is reason to hope for a boom time ahead for the city and the Garment District. Each week has brought more pedestrians to the neighborhood and higher transit ridership. There is optimism for a wave of pent-up demand for social experiences to re-enliven our streets. The Garment District Alliance is prepared for it, continuing to advocate for policies from the city and state to ensure a robut recovery, while invigorating our streets with vibrant public spaces and public art to welcome workers and visitors back to the neighborhood.

1st Quarter 2021 | 3
EMPLOYMENT
» Employment in zip code 10018 continued its multi-decade growth trend in 2019. The impact of COVID-19 on neighborhood employment is not yet known. 2020 employment figures are anticipated to be released by NewYork State in late 2021.
» The largest growth sectors from 2018 to 2019 in the neighborhood’s core industries were Education and Health Services (+17.6%) and Natural Resources, Mining and Construction (+8.1%).
» Hotels, restaurants, and bars continued to drive significant growth in the leisure and hospitality sector,
but 2020 job losses are expected to be severe given the impact of the pandemic.
» The largest employment sector in the neighborhood remains Professional and Business Services, which grew 5.3% in 2019 and contains nearly 38% of all jobs in the neighborhood.
» Overall manufacturing continued a long decline, falling to just over 5,000 jobs. Of those, 3,800 are in apparel manufacturing, which fell 12% from 2008 and 74% from 2000. Apparel manufacturing comprised just 2.6% of employment in the District in 2019.
KEY INSIGHTS
EMPLOYEES IN CORE GDA INDUSTRIES — ZIP CODE 10018, 2000 - 2019
2,157
17,079
26,691
-
6,362
18,224
5,439
2,209
1,587
89,267
Natural Resources, Mining and Construction
Manufacturing
Trade, Transportation, and Utilities
Information
Financial Services
Professional and Business Services
Education and Health Services
Leisure and Hospitality
Other Services
Total Employment
2000
6,143
5,078
25,200
9,796
11,893
52,915
10,749
11,629
7,411
141,091
2019
5,683
5,700
26,869
10,535
12,203
50,238
9,137
11,136
7,374
138,875
2018
8.1%
-10.9%
-6.2%
-7.0%
-2.5%
5.3%
17.6%
4.4%
0.5%
1.6%
1-yr. Change
184.8%
-70.3%
-5.6%
-
86.9%
190.3%
97.6%
426.4%
367.0%
58.1%
Since 2000
Source: NY State Dept. of Labor

4 | Economic Quarterly Report
OFFICE
KEY INSIGHTS
» While leasing data tracked by CoStar and CompStak has yet to reflect a drop in Garment District average starting rents due to the pandemic, this may be a lagging indicator given that vacancy and availability rates have spiked dramatically and asking rents have declined.
» With leasing activity down significantly, the data is more easily impacted by outliers. For instance, the rise in average starting rents in the Grand Central Partnership was driven in large part by the opening of One Vanderbilt.
» Recent notable office leases in the Garment District include:
» Transit Wireless 32,499 SF - 1400 Broadway
» Ideanomics 10,790 SF - 1441 Broadway
» Beth Melsky Casting 10,000 SF - 49 W 37th St
» The Forum Group 8,216 SF - 550 Seventh Ave
» Arete Management 6,966 SF - 42 W 39th St
GARMENT DISTRICT AVERAGE STARTING OFFICE RENTS PER SF
Source: CompStak, Inc., 1-year moving averages
OFFICE
$51.92 $52.16 $52.35 $52.48 $52.57 $52.66 $52.74 $52.83 $52.91 $52.98 $53.07
$53.38 $53.86
$40
$42
$44
$46
$48
$50
$52
$54
Mar-18 Jun-18 Sep-18 Dec-18 Mar-19 Jun-19 Sep-19 Dec-19 Mar-20 Jun-20 Sep-20 Dec-20 Mar-21

1st Quarter 2021 | 5
2 A
VE
.
3 A
VE
.
F D
R D
RIV
E
VE
.
VE
.
MA
DIS
ON
AV
E.
W. 44 ST.
W. 52 ST.
W. 48 ST.
BR
OA
DW
AY
W. 30 ST.
LE
XIN
GT
ON
AV
E.
5 A
VE
.
E. 52 ST.
E. 46 ST.
E. 30 ST.
E. 34 ST.
W. 40 ST.
W. 50 ST.
E. 32 ST.
E. 48 ST.
W. 54 ST. E. 54 ST.
E. 40 ST.
VE
.
E. 42 ST.
VE
.
E. 50 ST.
W. 34 ST.
W. 42 ST.
W. 46 ST.
E. 44 ST.
PA
RK
AV
E.
12 A
VE
.
LINCOLN TUNNEL
0 0.2 Miles
`
$76GRAND
CENTRAL$75BRYANT PARK
$5634TH ST/PENN STATION
$54GARMENT DISTRICT
$67TIMES
SQUARE
$77HUDSONYARDS
AVERAGE STARTING OFFICE RENTS PER SF
GARMENT DISTRICT
+4% n = 2,500
HUDSON YARDS*
-1% n = 185
34TH ST/PENN
STATION
-5% n = 1,800
GRAND CENTRAL
+10% n = 5,900
BRYANT PARK
-2% n = 668
TIMES SQUARE
0% n = 1,300
% = change from Mar-18 to Mar-21
n = sample size
*Hudson Yards formally opened in
March 2019, but the first building
opened in May 2016
$40
$50
$60
$70
$80
$90
$100
Mar-18 Sep-18 Mar-19 Sep-19 Mar-20 Sep-20 Mar-21
Actual BID boundaries vary slightly from neighborhood boundaries shown. Source: CompStak, Inc.
Source: CompStak, Inc., 1-year moving averages
AVERAGE STARTING OFFICE RENTS PER SF, MARCH 2021

6 | Economic Quarterly Report
9 A
VENUE
WEST 39 STREET
WEST 36 STREET
WEST 40 STREET
WEST 41 STREET
WEST 37 STREET
5 A
VENUE
8 A
VENUE
WEST 34 STREET
WEST 38 STREET
WEST 42 STREET
7 AVENUE
BROADWAY 6
AVENUE
0 0.1 Miles `
5th-6th Ave Side Streets
7th-8th Ave Side Streets
8th-9th Ave Side Streets
SixthAvenue
Broadway
Seventh Avenue
Eighth Avenue
318
369
168
119
768
561
266
Sample Size
$47.36
$44.68
$44.52
$66.43
$58.79
$53.55
$43.00
March 2019($/SF)
$47.89
$41.51
$46.74
$62.36
$59.52
$52.23
$43.16
March 2020($/SF)
$47.92
$36.48
$48.24
$56.65
$59.12
$51.50
$43.05
March 2021($/SF)
1%
-18%
8%
-15%
1%
-4%
0%
2-yr. Change
District Average
2,569 $52.57 $52.91 $53.86 2%
GARMENT DISTRICT AVERAGE STARTING OFFICE RENTS BY LOCATION
Source: CompStak, Inc., 12-month moving averages
OFFICE

1st Quarter 2021 | 7
Bao Bao Cafe at 214 W 39th St
8 | Economic Quarterly Report
RETAIL
KEY INSIGHTS
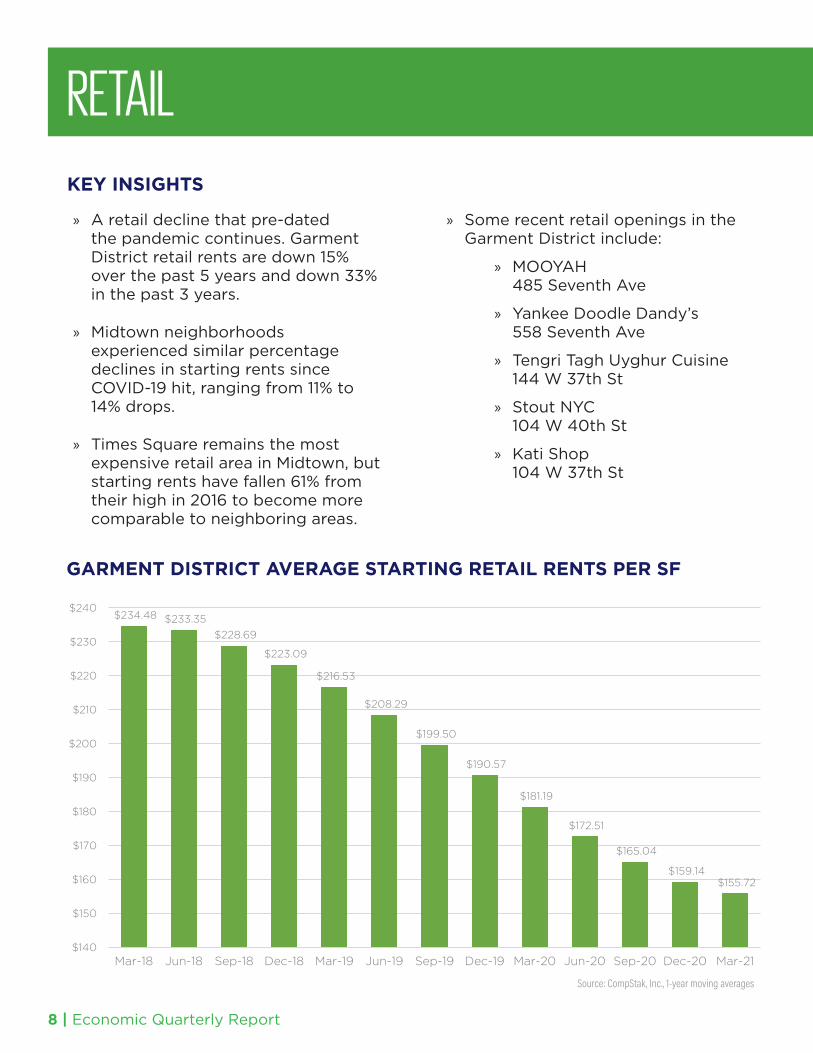
» A retail decline that pre-dated the pandemic continues. Garment District retail rents are down 15% over the past 5 years and down 33% in the past 3 years.
» Midtown neighborhoods experienced similar percentage declines in starting rents since COVID-19 hit, ranging from 11% to 14% drops.
» Times Square remains the most expensive retail area in Midtown, but starting rents have fallen 61% from their high in 2016 to become more comparable to neighboring areas.
» Some recent retail openings in the Garment District include:
» MOOYAH 485 Seventh Ave
» Yankee Doodle Dandy’s 558 Seventh Ave
» Tengri Tagh Uyghur Cuisine 144 W 37th St
» Stout NYC 104 W 40th St
» Kati Shop 104 W 37th St
GARMENT DISTRICT AVERAGE STARTING RETAIL RENTS PER SF
Source: CompStak, Inc., 1-year moving averages
RETAILRETAIL
$234.48 $233.35
$228.69
$223.09
$216.53
$208.29
$199.50
$190.57
$181.19
$172.51
$165.04
$159.14 $155.72
$140
$150
$160
$170
$180
$190
$200
$210
$220
$230
$240
Mar-18 Jun-18 Sep-18 Dec-18 Mar-19 Jun-19 Sep-19 Dec-19 Mar-20 Jun-20 Sep-20 Dec-20 Mar-21

1st Quarter 2021 | 9
2 A
VE
.
3 A
VE
.
F D
R D
RIV
E
1 A
VE
.
AV
E.
MA
DIS
ON
AV
E.
W. 44 ST.
W. 52 ST.
W. 48 ST.
BR
OA
DW
AY
W. 30 ST.
LE
XIN
GT
ON
AV
E.
5 A
VE
.
E. 52 ST.
E. 46 ST.
E. 30 ST.
E. 34 ST.
W. 40 ST.
W. 50 ST.
E. 32 ST.
E. 48 ST.
W. 54 ST. E. 54 ST.
E. 40 ST.
AV
E.
E. 42 ST.
AV
E.
E. 50 ST.
W. 34 ST.
W. 42 ST.
W. 46 ST.
E. 44 ST.
PA
RK
AV
E.
12 A
VE
.
LINCOLN TUNNEL
0 0.2 Miles
`
$169GRAND
CENTRALN/A*BRYANT PARK
$18034TH ST/PENN STATION
$156GARMENT DISTRICT
$195TIMES
SQUARE
N/A*HUDSONYARDS
AVERAGE STARTING RETAIL RENTS PER SF, MARCH 2021
AVERAGE STARTING RETAIL RENTS PER SF
GARMENT DISTRICT
-34% n = 264
TIMES SQUARE
-51% n = 327
GRAND CENTRAL
-28% n = 519
% = change from Mar-18 to Mar-21
n = sample size
34TH ST/ PENN
STATION
-31% n = 247
$100
$150
$200
$250
$300
$350
$400
$450
Mar-18 Sep-18 Mar-19 Sep-19 Mar-20 Sep-20 Mar-21
Source: CompStak, Inc., 1-year moving averages
Actual BID boundaries vary slightly from neighborhood boundaries shown. Source: CompStak, Inc.
*Sample sizes in Hudson Yards and Bryant Park were too small to be analyzed
10 | Economic Quarterly Report
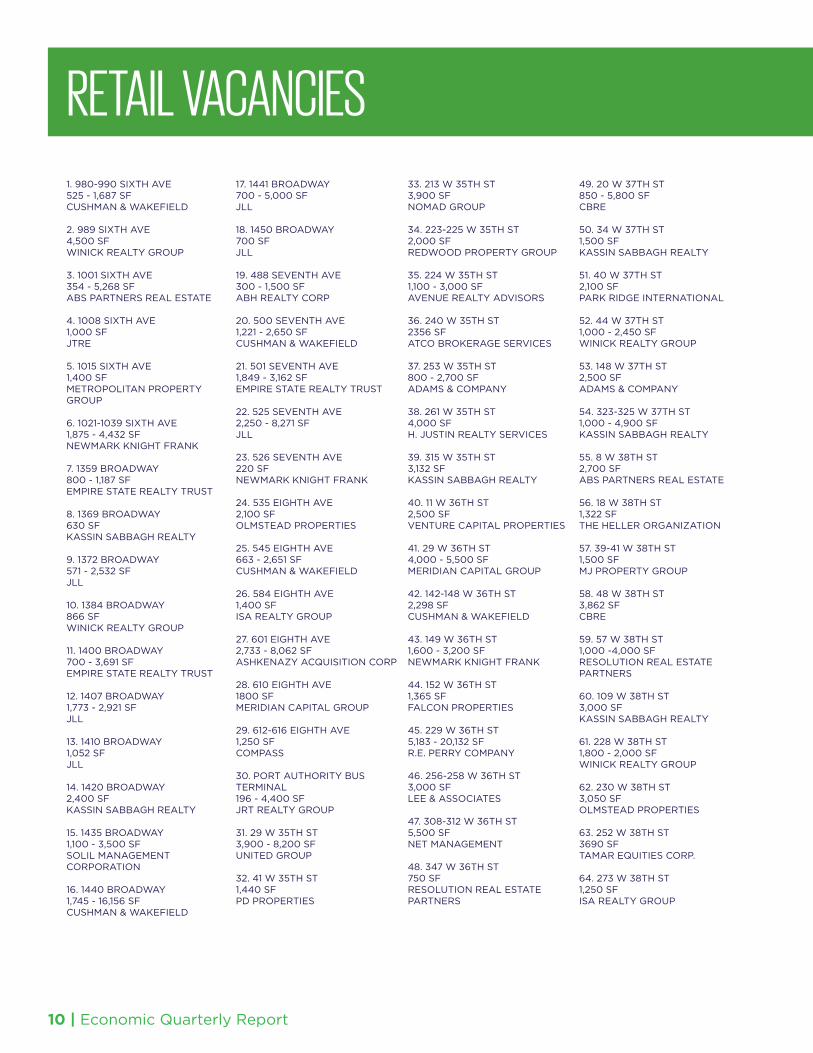
RETAIL VACANCIESRETAIL VACANCIES
17. 1441 BROADWAY700 - 5,000 SFJLL
18. 1450 BROADWAY700 SFJLL
19. 488 SEVENTH AVE300 - 1,500 SFABH REALTY CORP
20. 500 SEVENTH AVE1,221 - 2,650 SFCUSHMAN & WAKEFIELD
21. 501 SEVENTH AVE1,849 - 3,162 SFEMPIRE STATE REALTY TRUST
22. 525 SEVENTH AVE2,250 - 8,271 SFJLL
23. 526 SEVENTH AVE220 SFNEWMARK KNIGHT FRANK
24. 535 EIGHTH AVE2,100 SFOLMSTEAD PROPERTIES
25. 545 EIGHTH AVE663 - 2,651 SFCUSHMAN & WAKEFIELD
26. 584 EIGHTH AVE1,400 SFISA REALTY GROUP
27. 601 EIGHTH AVE2,733 - 8,062 SFASHKENAZY ACQUISITION CORP
28. 610 EIGHTH AVE1800 SFMERIDIAN CAPITAL GROUP
29. 612-616 EIGHTH AVE1,250 SFCOMPASS
30. PORT AUTHORITY BUS TERMINAL196 - 4,400 SFJRT REALTY GROUP
31. 29 W 35TH ST3,900 - 8,200 SFUNITED GROUP
32. 41 W 35TH ST1,440 SFPD PROPERTIES
33. 213 W 35TH ST3,900 SFNOMAD GROUP
34. 223-225 W 35TH ST2,000 SFREDWOOD PROPERTY GROUP
35. 224 W 35TH ST1,100 - 3,000 SFAVENUE REALTY ADVISORS
36. 240 W 35TH ST2356 SFATCO BROKERAGE SERVICES
37. 253 W 35TH ST800 - 2,700 SFADAMS & COMPANY
38. 261 W 35TH ST4,000 SFH. JUSTIN REALTY SERVICES
39. 315 W 35TH ST3,132 SFKASSIN SABBAGH REALTY
40. 11 W 36TH ST2,500 SFVENTURE CAPITAL PROPERTIES
41. 29 W 36TH ST4,000 - 5,500 SFMERIDIAN CAPITAL GROUP
42. 142-148 W 36TH ST2,298 SFCUSHMAN & WAKEFIELD
43. 149 W 36TH ST1,600 - 3,200 SFNEWMARK KNIGHT FRANK
44. 152 W 36TH ST1,365 SFFALCON PROPERTIES
45. 229 W 36TH ST5,183 - 20,132 SFR.E. PERRY COMPANY
46. 256-258 W 36TH ST3,000 SFLEE & ASSOCIATES
47. 308-312 W 36TH ST5,500 SFNET MANAGEMENT
48. 347 W 36TH ST750 SFRESOLUTION REAL ESTATE PARTNERS
49. 20 W 37TH ST850 - 5,800 SFCBRE
50. 34 W 37TH ST1,500 SFKASSIN SABBAGH REALTY
51. 40 W 37TH ST2,100 SFPARK RIDGE INTERNATIONAL
52. 44 W 37TH ST1,000 - 2,450 SFWINICK REALTY GROUP
53. 148 W 37TH ST2,500 SFADAMS & COMPANY
54. 323-325 W 37TH ST1,000 - 4,900 SFKASSIN SABBAGH REALTY
55. 8 W 38TH ST2,700 SFABS PARTNERS REAL ESTATE
56. 18 W 38TH ST1,322 SFTHE HELLER ORGANIZATION
57. 39-41 W 38TH ST1,500 SFMJ PROPERTY GROUP
58. 48 W 38TH ST3,862 SFCBRE
59. 57 W 38TH ST1,000 -4,000 SFRESOLUTION REAL ESTATE PARTNERS
60. 109 W 38TH ST3,000 SFKASSIN SABBAGH REALTY
61. 228 W 38TH ST1,800 - 2,000 SFWINICK REALTY GROUP
62. 230 W 38TH ST3,050 SFOLMSTEAD PROPERTIES
63. 252 W 38TH ST3690 SFTAMAR EQUITIES CORP.
64. 273 W 38TH ST1,250 SFISA REALTY GROUP
1. 980-990 SIXTH AVE525 - 1,687 SFCUSHMAN & WAKEFIELD
2. 989 SIXTH AVE4,500 SFWINICK REALTY GROUP
3. 1001 SIXTH AVE354 - 5,268 SFABS PARTNERS REAL ESTATE
4. 1008 SIXTH AVE1,000 SFJTRE
5. 1015 SIXTH AVE1,400 SFMETROPOLITAN PROPERTY GROUP
6. 1021-1039 SIXTH AVE1,875 - 4,432 SFNEWMARK KNIGHT FRANK
7. 1359 BROADWAY800 - 1,187 SFEMPIRE STATE REALTY TRUST
8. 1369 BROADWAY630 SFKASSIN SABBAGH REALTY
9. 1372 BROADWAY571 - 2,532 SFJLL
10. 1384 BROADWAY866 SFWINICK REALTY GROUP
11. 1400 BROADWAY700 - 3,691 SFEMPIRE STATE REALTY TRUST
12. 1407 BROADWAY1,773 - 2,921 SFJLL
13. 1410 BROADWAY1,052 SFJLL
14. 1420 BROADWAY2,400 SFKASSIN SABBAGH REALTY
15. 1435 BROADWAY1,100 - 3,500 SFSOLIL MANAGEMENT CORPORATION
16. 1440 BROADWAY1,745 - 16,156 SFCUSHMAN & WAKEFIELD
RETAIL VACANCIES

1st Quarter 2021 | 11
`
65. 325 W 38TH ST810 SFFALCON PROPERTIES
66. 21-23 W 39TH ST2,600 SFFOREST PARK PROPERTIES
67. 37 W 39TH ST1,750 - 3,000 SFRESOLUTION REAL ESTATE PARTNERS
68. 55 W 39TH ST4,500 SFSINOVSKY REALTY SERVICES
69. 214 W 39TH ST2,350 - 4,700 SFGRANITE MANAGEMENT
70. 231-250 W 39TH ST1,100 -1,444 SFADAMS & COMPANY
71. 234 W 39TH ST3,479 SFCUSHMAN & WAKEFIELD
72. 260 W 39TH ST2,800 SFLEE & ASSOCIATES
73. 270-276 W 39TH ST500 SFLEE & ASSOCIATES
74. 147 W 40TH ST1,975 - 2,100 SFCOMPASS
75. 218-232 W 40TH ST5,192 - 10,316 SFSAVITT PARTNERS
76. 240 W 40TH ST1,500 - 2,600 SFWINICK REALTY GROUP
77. 264 W 40TH ST1,000 - 3,400 SFNEWMARK KNIGHT FRANK
78. 334-340 W 40TH ST2,000 - 4,000 SFKASSIN SABBAGH REALTY
79. 114 W 41ST ST744 - 2,546 SFCUSHMAN & WAKEFIELD
12
3 4
5
6
7
8
9
10
1112
13
14
15 16
17 18
19
20 21
2223
24
25
26
2728
29
30
31323334
3536
373839
4041
42
43
44
45
4647
48
4950515253
54
5556
57
58
5960
616263
6465
666768
69
70
717273
74
75767778
79
Source: CoStar

12 | Economic Quarterly Report
RESIDENTIAL
KEY INSIGHTS
HOTELS
» There are currently 48 hotels in the Garment District with 11,000 rooms.
» At least 15 hotels in the neighborhood closed temporarily and at least one (Courtyard by Marriott at 71 W 35th St) has closed permanently.
» At least three hotels (Margaritaville Resort, The Draper, and Arlo Hotel Midtown) are anticipated to open in 2021.
» Eight additional hotels were planned or under construction before the pandemic, but their status is unclear.
» Average revenue per available room (RevPAR) for Garment District area hotels is down 74% from March 2019.
» 1.2 million guests stayed in Garment District hotels in the past year, down from 2.7 million over the same time period in 2018-19, a decline of 56%.
» Hotel revenue in the Garment District was down $542 million over the past year, declining 82% from 2018-19.
» Performance is rebounding faster at hotels outside of business districts (Uptown and Village/SoHo/Tribeca).
HOTEL DEVELOPMENTHOTEL DEVELOPMENTHOTELS
Margaritaville Resort under construction at 560 Seventh Avenue

1st Quarter 2021 | 13
REVPAR, OCCUPANCY, & ADR COMPARISON, MARCH 2020 & 2021
Uptown
Village/SoHo/Tribeca
Financial District
Midtown East
Midtown South*
Midtown West/Times Square*
Garment District
Mar 2021 Mar 2020 Mar 2021 Mar 2020
Revenue Per Available Room (RevPAR)
Occupancy
$47 $53
$50 $61
$50 $53
$55 $57
$56 $59
$67 $63
$103 $86
48.1% 35.2%
35.8% 31.1%
45.3% 33.6%
37.7% 26.6%
43.2% 28.8%
48.0% 29.0%
45.6% 31.4%
*Garment District data is included in this area
Mar 2021 Mar 2020
Average Daily Rate (ADR)
$97 $151
$139 $197
$110 $159
$147 $214
$129 $205
$139 $218
$225 $273
Pct. Change
-11.3%
-18.0%
-5.7%
-3.5%
-5.1%
+6.3%
+19.8%
OCCUPANCY & AVERAGE DAILY RATE IN GARMENT DISTRICT, 2020-2021
Source: STR
35.2
38.3
43.8
33.8 34.435.4
34.0
37.9
33.4
38.636.7
40.6
48.1
151
102 103107
102 105 107 105 103 103
9599 97
0
20
40
60
80
100
120
140
160
25
30
35
40
45
50
2021
Occupancy (%) ADR ($)
Mar Apr May Jun Jul Aug Sep Oct Nov Dec Jan Feb Mar
Source: STR

14 | Economic Quarterly Report
PEDESTRIANS
TOTAL WEEKLY PEDESTRIAN VOLUMES, 2019 - 2021
Source: Springboard
PEDESTRIANSPEDESTRIAN COUNTS
January 2021
March 2021
July 2020
November 2020
September 2020
5.3 million
7.7 million
5.2 million
5.9 million
7.7 million
Change from 2019Change from 2020
-11%
-63%
N/A
N/A
N/A
-61%
-61%
-62%
-66%
-72%
Total Count
May 2020 2.3 million N/A -87%
March 2020 8.7 million N/A -56%
Source: Springboard
MONTHLY PEDESTRIAN VOLUMES SINCE MARCH 2020
KEY INSIGHTS
» Warmer weather and the vaccine rollout spurred higher pedestrian counts each week in March, with the last week of the month setting a new post-pandemic high.
» MTA weekday subway ridership is currently at roughly 35% of pre-pandemic totals. The Long Island Rail Road is at 30% and Metro-North Railroad at 25%.

1st Quarter 2021 | 15
WEIGHTED WEEKDAY AVERAGE PEDESTRIAN COUNTS, JAN - MAR 2021
40th St
39th St
38th St
37th St
36th St
35th St6th
Ave
7th
Ave
Broadway
8th
Ave
PortAuthority
BusTerminal
BryantPark
Pla
zas
SIXTH AVE at 39th St
18,688
SEVENTH AVE at 40th St
20,071
BROADWAY at 40th St
21,794
EIGHTH AVE at 36th St
32,602
SEVENTH AVE at 37th St
23,296
`
BROADWAY at 37th St
17,553
Source: Springboard

We are the Garment District Alliance
We serve New York’s storied Garment District, in the heart of Midtown Manhattan. Working
in partnership with local building owners and businesses, we improve the quality of life
and economic vitality in this authentic New York neighborhood. The Garment District Alliance
is a not-for-profit corporation, established in 1993.
For more information on all that’s happening in the Garment District, visit garmentdistrict.nyc
Cover: Kim Carlino installing “Spectrum” on Seventh AvenueBack: “Pin Cushion” by Floratorium on Seventh AvenuePhotos by Alexandre Ayer/Diversity Pictures
Published May 2021
The Garment District Alliance
209 West 38th Street, 2nd Floor
New York, NY 10018
Tel. 212.764.9600 | Fax 212.764.9697
www.garmentdistrict.nyc
#GarmentDistrict