Embed Size (px)
Citation preview
FTI INSIGHTS Report
4th Quarter 2017
EXPERTS WITH IMPACTTM
Economic & Real Estate Report
Contents
Introduction ....................................................................................... 1
Summary of Key Economic Indicators ...................................... 2
5‐Year Graphical Snapshots of Selected Economic Indicators ...... 3
Labor Market ................................................................................ 4
Gross Domestic Product (GDP) ..................................................... 5
Institute for Supply Management (ISM) Manufacturing Index .......... 5
Construction Spending ....................................................................... 6
The Architecture Billings Index (ABI) ........................................ 7
State of the Housing Market .............................................................. 7
PwC Real Estate Investor Survey................................................... 9
4Q17 Survey Highlights ............................................................ 9
PwC Real Estate Barometer 4Q17 ................................................. 9
RCA Commercial Property Price Index (CPPI) ............................. 10
Green Street Commercial Property Price Index ............................... 11
Commercial Property Sales Analysis ........................................... 11
NCREIF Property Index ..................................................................... 13
Equity REIT Analysis ......................................................................... 15
FTSE National Association of REITs U.S. Real Estate Index .......... 15
Stock Market Recap .................................................................... 16
Capital Raising ............................................................................. 16
Commercial Lending ......................................................................... 16
Commercial Mortgage Backed Securities (CMBS) Market ............... 17
Property Sector Overviews ............................................................... 18
Office ........................................................................................... 18
Industrial ..................................................................................... 19
Retail ........................................................................................... 20
Apartment ................................................................................... 21
Hotel ........................................................................................... 21
Forecast ............................................................................................ 22
Introduction Although the 4Q17 GDP advance estimate indicated that growth
softened, many key economic indicators signaled strength within
the U.S. economy to end 2017, including a) unemployment rates
remaining at a 17‐year low, b) the escalation of job creation to
its strongest quarterly pace during the year, c) steady business
investment, d) consumer confidence levels lingering near 17‐
year highs, e) increasing home values, f) rising retail sales and g)
robust construction outlays. Stock indices continued to reach
new highs during 4Q17, fueled by the anticipation of corporate
tax cuts resulting from the passage of the Tax Cuts and Jobs Act
(TCJA), strong corporate earnings and future economic growth.
Strengthening domestic demand also reflected in a widening
trade deficit to end the year. Stronger global growth and a
weakening U.S. dollar have benefitted U.S. exporters, which has
bolstered the U.S. manufacturing sector and driven orders
higher for factory, industrial and durable goods; however,
imports have increased at a faster rate due to brisk consumer
outlays, which have, in part, sent the savings rate to a 12‐year
low. Economists believe the weaker dollar has resulted from a
resurgent European economy that is driving more investors to
the Euro and increased U.S. political dysfunction.
In November, Jerome Powell was chosen to replace current Fed
Chair Janet Yellen in February 2018. At its December Federal
Open Market Committee meeting, the Fed raised its benchmark
interest rate (between 1.25% and 1.50%) for the third time in
2017 after expressing optimism regarding the labor market.
During 4Q17, the Fed also began the reduction of the $4.5
trillion balance sheet it acquired in the wake of the financial
crisis.
Leading commercial information providers and real estate
brokerages generally reported positive market fundamentals
within the major sectors despite challenges distinct to each asset
class. Commercial property indices from CoStar, Green Street
and NCREIF revealed surging pricing growth for industrial assets
and generally moderating growth for most of the other major
commercial property types. The growing gap between buyer and
seller pricing expectations continued to contribute to softer sales
volume during 4Q17.
FTI INSIGHTS Economic & Real Estate Report – 4th Quarter 2017
2 · FTI Consulting, Inc. EXPERTS WITH IMPACT
Real estate debt market conditions remained favorable during
4Q17. CMBS issuances increased to their highest level since
4Q17 while CMBS delinquencies further declined. According to
the Mortgage Bankers Association, commercial and multi‐family
loan lending escalated from the prior quarter and year, but the
Fed reported demand for CRE loans was largely unchanged.
Sustained investor demand allowed capital raising by REITs to
increase more than 30.0% year‐over‐year (YoY).
Summary of Key Economic Indicators
GDP Growth Slows The advance estimate showed that
4Q17 U.S. GDP increased at a 2.6% seasonally adjusted
annualized rate, down from 3.2% in 3Q17.
No Change in Unemployment Rate. Despite job gains, the
December unemployment rate remained at 4.1% for the
third consecutive month.
Job Openings Decline. Despite more workers increasingly
leaving jobs, indicative of greater confidence in finding new
positions, job openings fell to a seven‐month low in
December. Still, there were about 5.8 million job openings
at the end of December, a 4.9% YoY increase.
Employment Cost Index (ECI) Surges. Total employment
costs, including wages and benefits, increased 2.6% in 2017,
matching the 2015 increase. Of significance, this
represented the strongest growth since 2008. Strength was
evident in private sector where wages and salaries posted a
2.8% YoY increase, matching the best gain of this current
economic expansion.
Small Business Optimism Falls. According to the NFIB Small
Business Optimism Index, small business confidence
declined in December from the record high level of the
prior month. Recent weakness was largely driven by
declines in expected business conditions, but more business
owners reported escalating sales during the month. It was
reported that staffing challenges remain a concern.
Consumer Confidence Slips. Although December’s
consumer confidence, as measured by the Conference
Board and University of Michigan Index, pulled back,
readings remain at historically high levels.
Dodge Momentum Index (DMI) Increases. After recording
its third consecutive month of gains, the DMI is at its
highest level of the current expansion. The latest reading
indicated escalating demand for non‐residential projects.
Month‐over‐month (MoM) the institutional building
component increased 10.4 points and the commercial
building component rose 1.2 points.
The Leading Economic Index (LEI) Rises. In December, the
LEI increased 0.6%, marking the 16th consecutive monthly
rise. The gains among the leading indicators were
widespread, but were mostly driven by strength in new
manufacturing orders, improving stock markets and
financial conditions.
Retail Sales Increase. Retail sales rose 0.4% in December,
the fourth consecutive monthly gain. During 4Q17, retail
sales increased 5.5% YoY, driven by the strongest holiday
season since 2010 (National Retail Federation). Total 2017
retail sales increased 4.2% YoY and reflected the strongest
year for sales growth since 2014. In 2017, sales at non‐
store retailers, mostly online‐shopping outlets, also
increased 12.7% from the prior year.
Consumer Inflation Slows. The headline Consumer Price
Index (CPI) increased 0.1% in December, following a 0.4%
rise in November, which was primarily due to a 2.7% decline
in gasoline prices. Core inflation, which strips out food and
energy prices, rose 0.3% in December, its largest gain since
January 2017, and has increased 1.8% during the past 12‐
month period.
Industrial Production Rises. U.S. industrial output increased
0.9% in December, primarily due to a surge in demand for
heating. Manufacturing output, accounting for more than
70% of industrial production, rose at a 7.0% rate in 4Q17,
the largest gain since 2Q10. For all of 2017, industrial
output increased 1.8%, its first gain since 2014.
Durable Goods Orders Increase. Driven by a 55.3% increase
in orders for military aircraft and a 15.9% jump in civilian‐
airplane orders, U.S. durable goods orders increased 2.9%
in December, the largest gain in six months. During 2017,
durable‐goods orders increased 5.8% YoY.
Factory Orders Rise. For the fifth consecutive month,
factory orders increased. December’s 1.7% advance was
fueled by sharply higher sales of defense and non‐defense
aircrafts and parts. YoY, factory orders were up 8.4%. Of
concern, core capital goods (non‐defense capital goods
excluding aircrafts) fell 0.6% in December.
ISM Nonmanufacturing Index Declines. Although the
service sector index fell in December, primarily due to the
slowdown in new orders, the index still signaled moderate
growth to end the year.
Consumer Borrowing Stays strong. In December, consumer
credit increased $18.4 billion, driven by a 6.0% increase in
revolving credit (credit cards) to its highest level on record.
During 4Q17, consumer credit increased at a 7.7% annual
rate, the strongest pace of the year.
FTI INSIGHTS Economic & Real Estate Report – 4th Quarter 2017
3 · FTI Consulting, Inc. EXPERTS WITH IMPACT
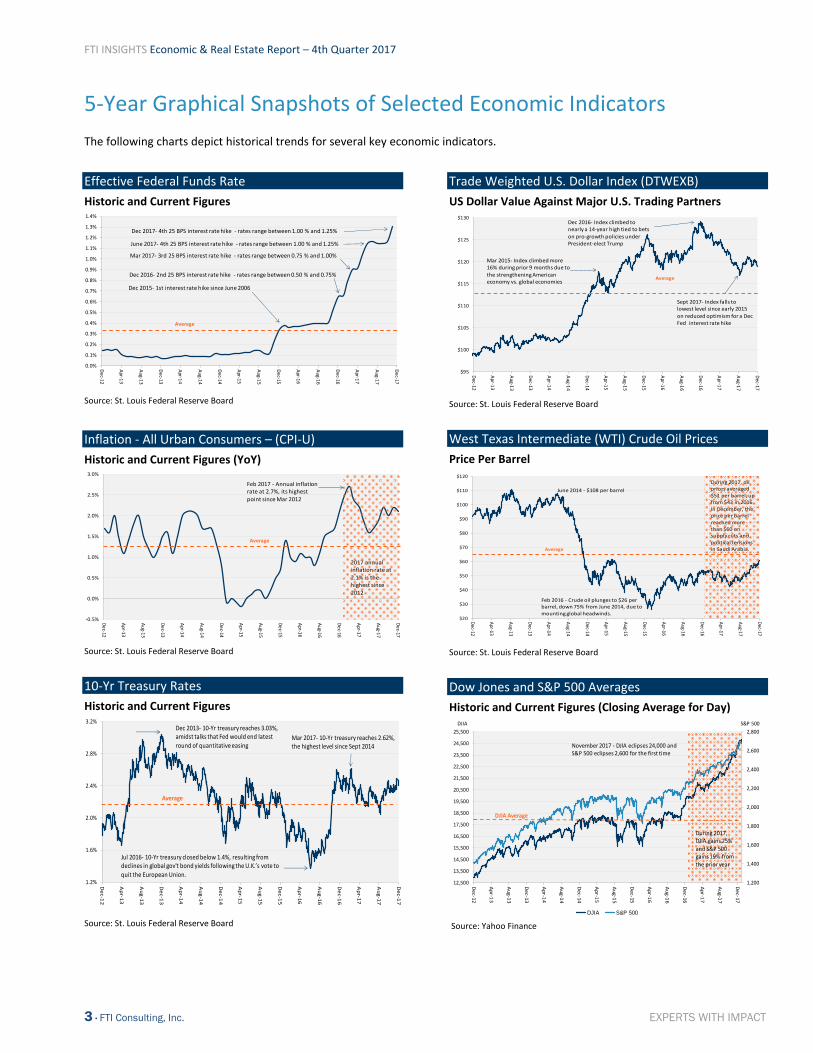
5‐Year Graphical Snapshots of Selected Economic Indicators
The following charts depict historical trends for several key economic indicators.
Effective Federal Funds Rate
Historic and Current Figures
Source: St. Louis Federal Reserve Board
Inflation ‐ All Urban Consumers – (CPI‐U)
Historic and Current Figures (YoY)
Source: St. Louis Federal Reserve Board
10‐Yr Treasury Rates
Historic and Current Figures
Source: St. Louis Federal Reserve Board
Trade Weighted U.S. Dollar Index (DTWEXB)
US Dollar Value Against Major U.S. Trading Partners
Source: St. Louis Federal Reserve Board
West Texas Intermediate (WTI) Crude Oil Prices
Price Per Barrel
Source: St. Louis Federal Reserve Board
Dow Jones and S&P 500 Averages
Historic and Current Figures (Closing Average for Day)
Source: Yahoo Finance
0.0%
0.1%
0.2%
0.3%
0.4%
0.5%
0.6%
0.7%
0.8%
0.9%
1.0%
1.1%
1.2%
1.3%
1.4%
Dec‐12
Apr‐1
3
Aug‐1
3
Dec‐13
Apr‐1
4
Aug‐1
4
Dec‐14
Apr‐1
5
Aug‐1
5
Dec‐15
Apr‐1
6
Aug‐1
6
Dec‐16
Apr‐1
7
Aug‐1
7
Dec‐17
Average
Dec 2015‐ 1st interest rate hike since June 2006
Dec 2016‐ 2nd 25 BPS interest rate hike ‐ rates range between 0.50 % and 0.75%
Mar 2017‐ 3rd 25 BPS interest rate hike ‐ rates range between 0.75 % and 1.00%
June 2017‐ 4th 25 BPS interest rate hike ‐ rates range between 1.00 % and 1.25%
Dec 2017‐ 4th 25 BPS interest rate hike ‐ rates range between 1.00 % and 1.25%
‐0.5%
0.0%
0.5%
1.0%
1.5%
2.0%
2.5%
3.0%
Dec‐12
Apr‐1
3
Aug‐1
3
Dec‐13
Apr‐1
4
Aug‐1
4
Dec‐14
Apr‐1
5
Aug‐1
5
Dec‐15
Apr‐1
6
Aug‐1
6
Dec‐16
Apr‐1
7
Aug‐1
7
Dec‐17
Average
Feb 2017 ‐ Annual inflation rate at 2.7%, its highest
point since Mar 2012
2017 annual inflation rate at
2.1% is the highest since
2012
1.2%
1.6%
2.0%
2.4%
2.8%
3.2%
Dec‐12
Apr‐1
3
Aug‐13
Dec‐13
Apr‐1
4
Aug‐14
Dec‐14
Apr‐1
5
Aug‐15
Dec‐15
Apr‐1
6
Aug‐16
Dec‐16
Apr‐1
7
Aug‐17
Dec‐17
Average
Jul 2016‐ 10‐Yr treasury closed below 1.4%, resulting from declines in global gov't bond yields following the U.K.’s vote to
quit the European Union.
Mar 2017‐ 10‐Yr treasury reaches 2.62%, the highest level since Sept 2014
Dec 2013‐ 10‐Yr treasury reaches 3.03%, amidst talks that Fed would end latest
round of quantitative easing
$95
$100
$105
$110
$115
$120
$125
$130
Dec‐12
Apr‐1
3
Aug‐1
3
Dec‐13
Apr‐1
4
Aug‐1
4
Dec‐14
Apr‐1
5
Aug‐1
5
Dec‐15
Apr‐1
6
Aug‐1
6
Dec‐16
Apr‐1
7
Aug‐1
7
Dec‐17
Average
Dec 2016‐ Index climbed to nearly a 14‐year high tied to bets on pro‐growth policies under President‐elect Trump
Sept 2017‐ Index falls to lowest level since early 2015 on reduced optimism for a Dec Fed interest rate hike
Mar 2015‐ Index climbedmore 16% during prior 9 months due to the strengthening American economy vs. global economies
$20
$30
$40
$50
$60
$70
$80
$90
$100
$110
$120
Dec‐12
Apr‐1
3
Aug‐1
3
Dec‐13
Apr‐1
4
Aug‐1
4
Dec‐14
Apr‐1
5
Aug‐1
5
Dec‐15
Apr‐1
6
Aug‐1
6
Dec‐16
Apr‐1
7
Aug‐1
7
Dec‐17
Average
Feb 2016 ‐ Crude oil plunges to $26 per barrel, down 75% from June 2014, due to
mounting global headwinds.
June 2014 ‐ $108 per barrel
During 2017, oil prices averaged
$51 per barrel, up from $43 in 2016.
In December, the price per barrel
reached more than $60 on supply cuts and
political tensions in Saudi Arabia.
1,200
1,400
1,600
1,800
2,000
2,200
2,400
2,600
2,800
12,500
13,500
14,500
15,500
16,500
17,500
18,500
19,500
20,500
21,500
22,500
23,500
24,500
25,500
Dec‐1
2
Apr‐1
3
Aug‐13
Dec‐1
3
Apr‐1
4
Aug‐14
Dec‐1
4
Apr‐1
5
Aug‐15
Dec‐1
5
Apr‐1
6
Aug‐16
Dec‐1
6
Apr‐1
7
Aug‐17
Dec‐1
7
S&P 500DJIA
DJIA S&P 500
DJIA Average
November 2017 ‐ DJIA eclipses 24,000 and S&P 500 eclipses 2,600 for the first time
During 2017, DJIA gains 25%
and S&P 500 gains 19% from the prior year
FTI INSIGHTS Economic & Real Estate Report – 4th Quarter 2017
4 · FTI Consulting, Inc. EXPERTS WITH IMPACT
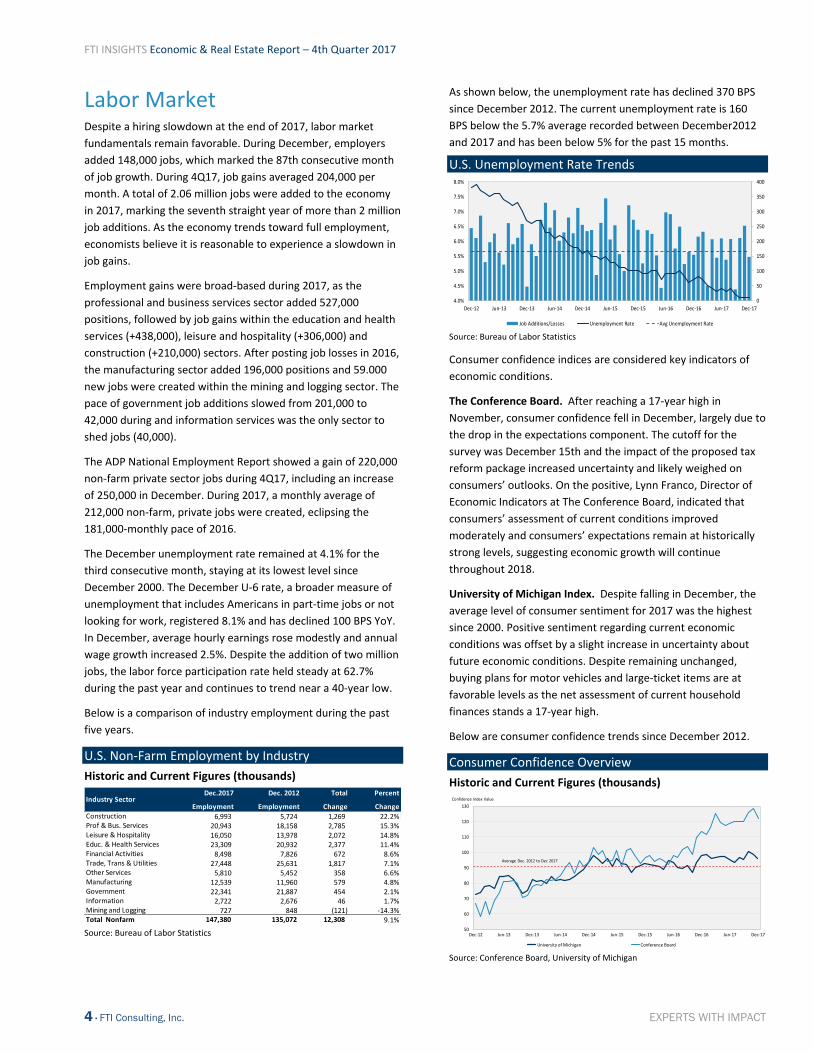
Labor Market Despite a hiring slowdown at the end of 2017, labor market
fundamentals remain favorable. During December, employers
added 148,000 jobs, which marked the 87th consecutive month
of job growth. During 4Q17, job gains averaged 204,000 per
month. A total of 2.06 million jobs were added to the economy
in 2017, marking the seventh straight year of more than 2 million
job additions. As the economy trends toward full employment,
economists believe it is reasonable to experience a slowdown in
job gains.
Employment gains were broad‐based during 2017, as the
professional and business services sector added 527,000
positions, followed by job gains within the education and health
services (+438,000), leisure and hospitality (+306,000) and
construction (+210,000) sectors. After posting job losses in 2016,
the manufacturing sector added 196,000 positions and 59.000
new jobs were created within the mining and logging sector. The
pace of government job additions slowed from 201,000 to
42,000 during and information services was the only sector to
shed jobs (40,000).
The ADP National Employment Report showed a gain of 220,000
non‐farm private sector jobs during 4Q17, including an increase
of 250,000 in December. During 2017, a monthly average of
212,000 non‐farm, private jobs were created, eclipsing the
181,000‐monthly pace of 2016.
The December unemployment rate remained at 4.1% for the
third consecutive month, staying at its lowest level since
December 2000. The December U‐6 rate, a broader measure of
unemployment that includes Americans in part‐time jobs or not
looking for work, registered 8.1% and has declined 100 BPS YoY.
In December, average hourly earnings rose modestly and annual
wage growth increased 2.5%. Despite the addition of two million
jobs, the labor force participation rate held steady at 62.7%
during the past year and continues to trend near a 40‐year low.
Below is a comparison of industry employment during the past
five years.
U.S. Non‐Farm Employment by Industry
Historic and Current Figures (thousands)
Source: Bureau of Labor Statistics
As shown below, the unemployment rate has declined 370 BPS
since December 2012. The current unemployment rate is 160
BPS below the 5.7% average recorded between December2012
and 2017 and has been below 5% for the past 15 months.
U.S. Unemployment Rate Trends
Source: Bureau of Labor Statistics
Consumer confidence indices are considered key indicators of
economic conditions.
The Conference Board. After reaching a 17‐year high in
November, consumer confidence fell in December, largely due to
the drop in the expectations component. The cutoff for the
survey was December 15th and the impact of the proposed tax
reform package increased uncertainty and likely weighed on
consumers’ outlooks. On the positive, Lynn Franco, Director of
Economic Indicators at The Conference Board, indicated that
consumers’ assessment of current conditions improved
moderately and consumers’ expectations remain at historically
strong levels, suggesting economic growth will continue
throughout 2018.
University of Michigan Index. Despite falling in December, the
average level of consumer sentiment for 2017 was the highest
since 2000. Positive sentiment regarding current economic
conditions was offset by a slight increase in uncertainty about
future economic conditions. Despite remaining unchanged,
buying plans for motor vehicles and large‐ticket items are at
favorable levels as the net assessment of current household
finances stands a 17‐year high.
Below are consumer confidence trends since December 2012.
Consumer Confidence Overview
Historic and Current Figures (thousands)
Source: Conference Board, University of Michigan
Dec.2017 Dec. 2012 Total Percent
Employment Employment Change ChangeConstruction 6,993 5,724 1,269 22.2%Prof & Bus. Services 20,943 18,158 2,785 15.3%Leisure & Hospitality 16,050 13,978 2,072 14.8%Educ. & Health Services 23,309 20,932 2,377 11.4%Financial Activities 8,498 7,826 672 8.6%Trade, Trans & Utilities 27,448 25,631 1,817 7.1%Other Services 5,810 5,452 358 6.6%Manufacturing 12,539 11,960 579 4.8%Government 22,341 21,887 454 2.1%Information 2,722 2,676 46 1.7%Mining and Logging 727 848 (121) ‐14.3%Total Nonfarm 147,380 135,072 12,308 9.1%
Industry Sector
0
50
100
150
200
250
300
350
400
4.0%
4.5%
5.0%
5.5%
6.0%
6.5%
7.0%
7.5%
8.0%
Dec‐12 Jun‐13 Dec‐13 Jun‐14 Dec‐14 Jun‐15 Dec‐15 Jun‐16 Dec‐16 Jun‐17 Dec‐17
Job Additions/Losses Unemployment Rate Avg Unemployment Rate
50
60
70
80
90
100
110
120
130
Dec‐12 Jun‐13 Dec‐13 Jun‐14 Dec‐14 Jun‐15 Dec‐15 Jun‐16 Dec‐16 Jun‐17 Dec‐17
Confidence Index Value
University of Michigan Conference Board
Average Dec. 2012 to Dec 2017
FTI INSIGHTS Economic & Real Estate Report – 4th Quarter 2017
5 · FTI Consulting, Inc. EXPERTS WITH IMPACT
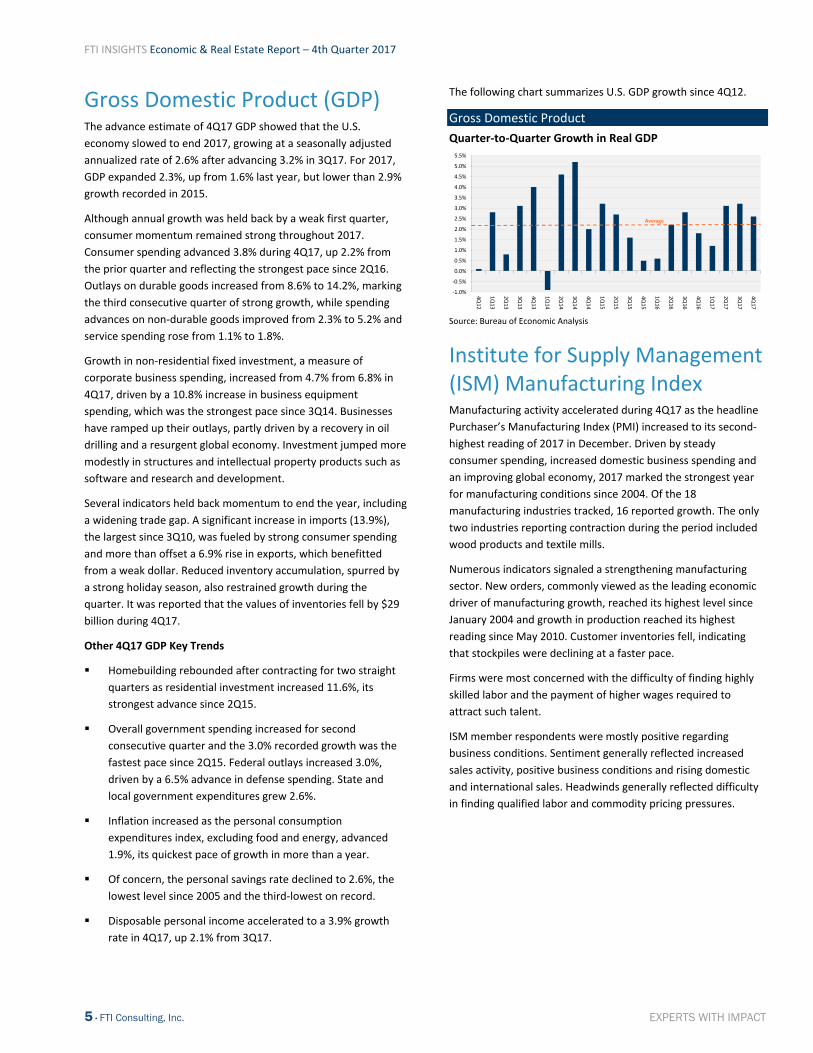
Gross Domestic Product (GDP) The advance estimate of 4Q17 GDP showed that the U.S.
economy slowed to end 2017, growing at a seasonally adjusted
annualized rate of 2.6% after advancing 3.2% in 3Q17. For 2017,
GDP expanded 2.3%, up from 1.6% last year, but lower than 2.9%
growth recorded in 2015.
Although annual growth was held back by a weak first quarter,
consumer momentum remained strong throughout 2017.
Consumer spending advanced 3.8% during 4Q17, up 2.2% from
the prior quarter and reflecting the strongest pace since 2Q16.
Outlays on durable goods increased from 8.6% to 14.2%, marking
the third consecutive quarter of strong growth, while spending
advances on non‐durable goods improved from 2.3% to 5.2% and
service spending rose from 1.1% to 1.8%.
Growth in non‐residential fixed investment, a measure of
corporate business spending, increased from 4.7% from 6.8% in
4Q17, driven by a 10.8% increase in business equipment
spending, which was the strongest pace since 3Q14. Businesses
have ramped up their outlays, partly driven by a recovery in oil
drilling and a resurgent global economy. Investment jumped more
modestly in structures and intellectual property products such as
software and research and development.
Several indicators held back momentum to end the year, including
a widening trade gap. A significant increase in imports (13.9%),
the largest since 3Q10, was fueled by strong consumer spending
and more than offset a 6.9% rise in exports, which benefitted
from a weak dollar. Reduced inventory accumulation, spurred by
a strong holiday season, also restrained growth during the
quarter. It was reported that the values of inventories fell by $29
billion during 4Q17.
Other 4Q17 GDP Key Trends
Homebuilding rebounded after contracting for two straight
quarters as residential investment increased 11.6%, its
strongest advance since 2Q15.
Overall government spending increased for second
consecutive quarter and the 3.0% recorded growth was the
fastest pace since 2Q15. Federal outlays increased 3.0%,
driven by a 6.5% advance in defense spending. State and
local government expenditures grew 2.6%.
Inflation increased as the personal consumption
expenditures index, excluding food and energy, advanced
1.9%, its quickest pace of growth in more than a year.
Of concern, the personal savings rate declined to 2.6%, the
lowest level since 2005 and the third‐lowest on record.
Disposable personal income accelerated to a 3.9% growth
rate in 4Q17, up 2.1% from 3Q17.
The following chart summarizes U.S. GDP growth since 4Q12.
Gross Domestic Product
Quarter‐to‐Quarter Growth in Real GDP
Source: Bureau of Economic Analysis
Institute for Supply Management (ISM) Manufacturing Index Manufacturing activity accelerated during 4Q17 as the headline
Purchaser’s Manufacturing Index (PMI) increased to its second‐
highest reading of 2017 in December. Driven by steady
consumer spending, increased domestic business spending and
an improving global economy, 2017 marked the strongest year
for manufacturing conditions since 2004. Of the 18
manufacturing industries tracked, 16 reported growth. The only
two industries reporting contraction during the period included
wood products and textile mills.
Numerous indicators signaled a strengthening manufacturing
sector. New orders, commonly viewed as the leading economic
driver of manufacturing growth, reached its highest level since
January 2004 and growth in production reached its highest
reading since May 2010. Customer inventories fell, indicating
that stockpiles were declining at a faster pace.
Firms were most concerned with the difficulty of finding highly
skilled labor and the payment of higher wages required to
attract such talent.
ISM member respondents were mostly positive regarding
business conditions. Sentiment generally reflected increased
sales activity, positive business conditions and rising domestic
and international sales. Headwinds generally reflected difficulty
in finding qualified labor and commodity pricing pressures.
‐1.0%
‐0.5%
0.0%
0.5%
1.0%
1.5%
2.0%
2.5%
3.0%
3.5%
4.0%
4.5%
5.0%
5.5%
4Q12
1Q13
2Q13
3Q13
4Q13
1Q14
2Q14
3Q14
4Q14
1Q15
2Q15
3Q15
4Q15
1Q16
2Q16
3Q16
4Q16
1Q17
2Q17
3Q17
4Q17
Average
FTI INSIGHTS Economic & Real Estate Report – 4th Quarter 2017
6 · FTI Consulting, Inc. EXPERTS WITH IMPACT
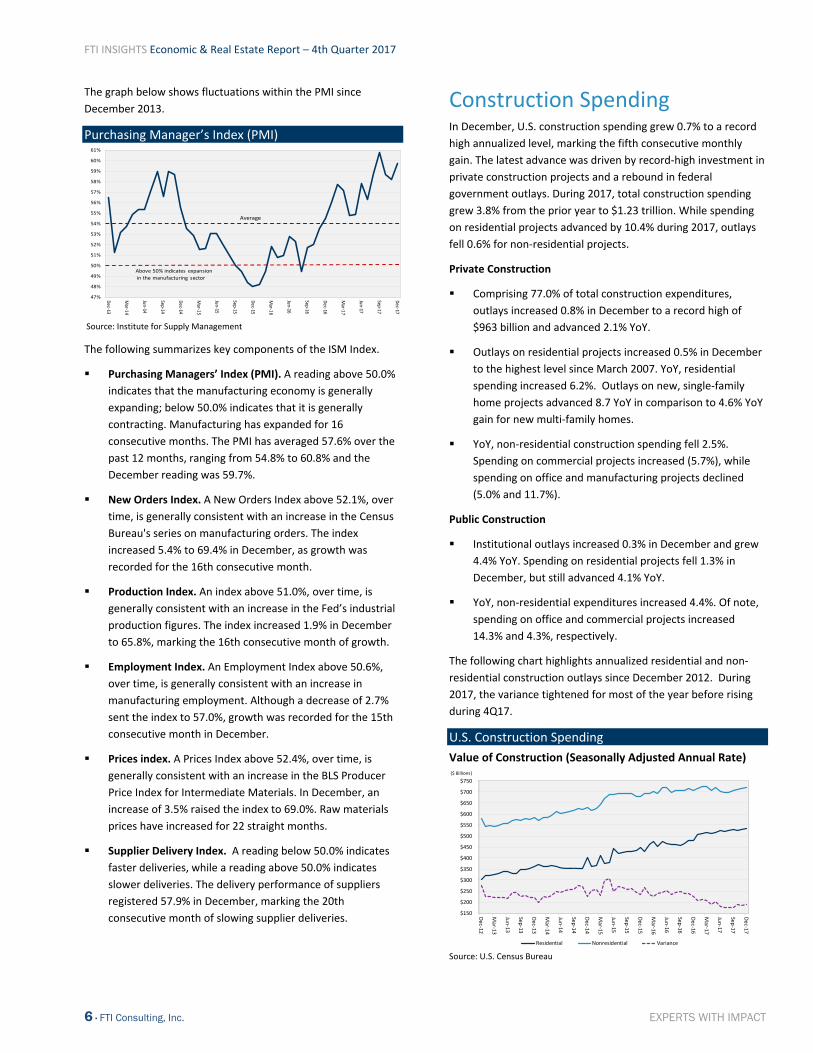
The graph below shows fluctuations within the PMI since
December 2013.
Purchasing Manager’s Index (PMI)
Source: Institute for Supply Management
The following summarizes key components of the ISM Index.
Purchasing Managers’ Index (PMI). A reading above 50.0%
indicates that the manufacturing economy is generally
expanding; below 50.0% indicates that it is generally
contracting. Manufacturing has expanded for 16
consecutive months. The PMI has averaged 57.6% over the
past 12 months, ranging from 54.8% to 60.8% and the
December reading was 59.7%.
New Orders Index. A New Orders Index above 52.1%, over
time, is generally consistent with an increase in the Census
Bureau's series on manufacturing orders. The index
increased 5.4% to 69.4% in December, as growth was
recorded for the 16th consecutive month.
Production Index. An index above 51.0%, over time, is
generally consistent with an increase in the Fed’s industrial
production figures. The index increased 1.9% in December
to 65.8%, marking the 16th consecutive month of growth.
Employment Index. An Employment Index above 50.6%,
over time, is generally consistent with an increase in
manufacturing employment. Although a decrease of 2.7%
sent the index to 57.0%, growth was recorded for the 15th
consecutive month in December.
Prices index. A Prices Index above 52.4%, over time, is
generally consistent with an increase in the BLS Producer
Price Index for Intermediate Materials. In December, an
increase of 3.5% raised the index to 69.0%. Raw materials
prices have increased for 22 straight months.
Supplier Delivery Index. A reading below 50.0% indicates
faster deliveries, while a reading above 50.0% indicates
slower deliveries. The delivery performance of suppliers
registered 57.9% in December, marking the 20th
consecutive month of slowing supplier deliveries.
Construction Spending In December, U.S. construction spending grew 0.7% to a record
high annualized level, marking the fifth consecutive monthly
gain. The latest advance was driven by record‐high investment in
private construction projects and a rebound in federal
government outlays. During 2017, total construction spending
grew 3.8% from the prior year to $1.23 trillion. While spending
on residential projects advanced by 10.4% during 2017, outlays
fell 0.6% for non‐residential projects.
Private Construction
Comprising 77.0% of total construction expenditures,
outlays increased 0.8% in December to a record high of
$963 billion and advanced 2.1% YoY.
Outlays on residential projects increased 0.5% in December
to the highest level since March 2007. YoY, residential
spending increased 6.2%. Outlays on new, single‐family
home projects advanced 8.7 YoY in comparison to 4.6% YoY
gain for new multi‐family homes.
YoY, non‐residential construction spending fell 2.5%.
Spending on commercial projects increased (5.7%), while
spending on office and manufacturing projects declined
(5.0% and 11.7%).
Public Construction
Institutional outlays increased 0.3% in December and grew
4.4% YoY. Spending on residential projects fell 1.3% in
December, but still advanced 4.1% YoY.
YoY, non‐residential expenditures increased 4.4%. Of note,
spending on office and commercial projects increased
14.3% and 4.3%, respectively.
The following chart highlights annualized residential and non‐
residential construction outlays since December 2012. During
2017, the variance tightened for most of the year before rising
during 4Q17.
U.S. Construction Spending
Value of Construction (Seasonally Adjusted Annual Rate)
Source: U.S. Census Bureau
47%
48%
49%
50%
51%
52%
53%
54%
55%
56%
57%
58%
59%
60%
61%
Dec‐13
Mar‐14
Jun‐14
Sep‐14
Dec‐14
Mar‐15
Jun‐15
Sep‐15
Dec‐15
Mar‐16
Jun‐16
Sep‐16
Dec‐16
Mar‐17
Jun‐17
Sep‐17
Dec‐17
Above 50% indicates expansion
in the manufacturing sector
Average
$150
$200
$250
$300
$350
$400
$450
$500
$550
$600
$650
$700
$750
Dec‐12
Mar‐13
Jun‐13
Sep‐13
Dec‐13
Mar‐14
Jun‐14
Sep‐14
Dec‐14
Mar‐15
Jun‐15
Sep‐15
Dec‐15
Mar‐16
Jun‐16
Sep‐16
Dec‐16
Mar‐17
Jun‐17
Sep‐17
Dec‐17
($ Billions)
Residential Nonresidential Variance
FTI INSIGHTS Economic & Real Estate Report – 4th Quarter 2017
7 · FTI Consulting, Inc. EXPERTS WITH IMPACT
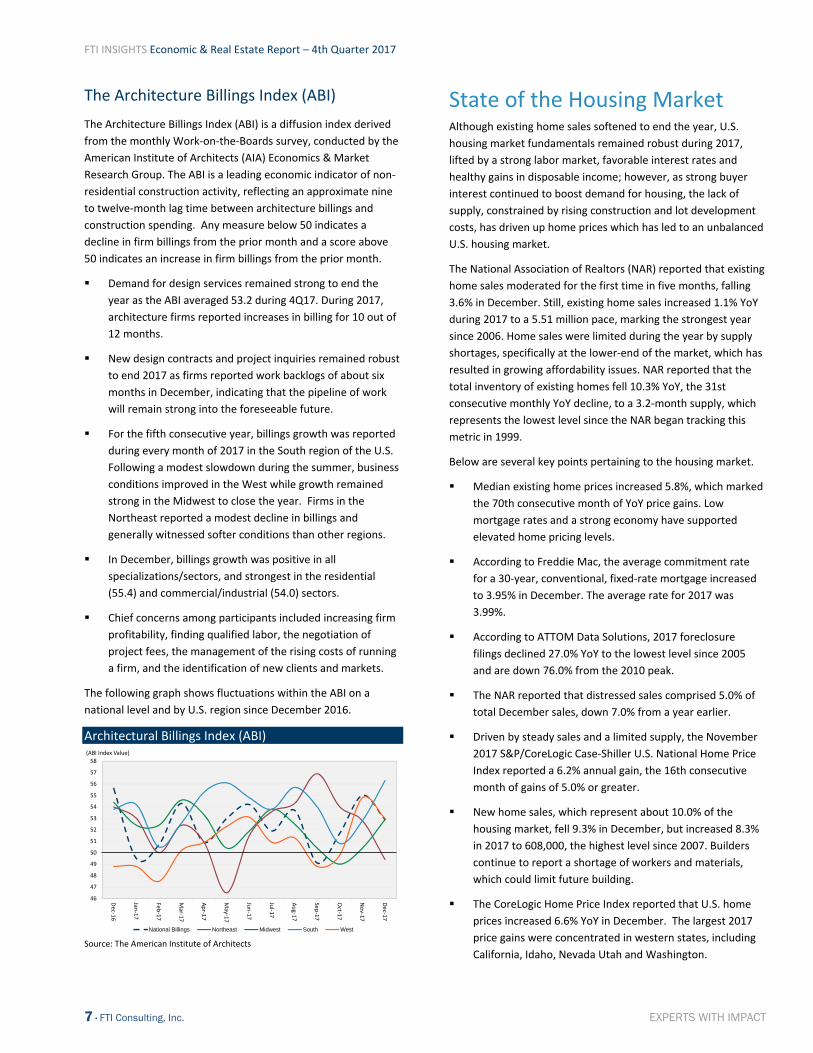
The Architecture Billings Index (ABI)
The Architecture Billings Index (ABI) is a diffusion index derived
from the monthly Work‐on‐the‐Boards survey, conducted by the
American Institute of Architects (AIA) Economics & Market
Research Group. The ABI is a leading economic indicator of non‐
residential construction activity, reflecting an approximate nine
to twelve‐month lag time between architecture billings and
construction spending. Any measure below 50 indicates a
decline in firm billings from the prior month and a score above
50 indicates an increase in firm billings from the prior month.
Demand for design services remained strong to end the
year as the ABI averaged 53.2 during 4Q17. During 2017,
architecture firms reported increases in billing for 10 out of
12 months.
New design contracts and project inquiries remained robust
to end 2017 as firms reported work backlogs of about six
months in December, indicating that the pipeline of work
will remain strong into the foreseeable future.
For the fifth consecutive year, billings growth was reported
during every month of 2017 in the South region of the U.S.
Following a modest slowdown during the summer, business
conditions improved in the West while growth remained
strong in the Midwest to close the year. Firms in the
Northeast reported a modest decline in billings and
generally witnessed softer conditions than other regions.
In December, billings growth was positive in all
specializations/sectors, and strongest in the residential
(55.4) and commercial/industrial (54.0) sectors.
Chief concerns among participants included increasing firm
profitability, finding qualified labor, the negotiation of
project fees, the management of the rising costs of running
a firm, and the identification of new clients and markets.
The following graph shows fluctuations within the ABI on a
national level and by U.S. region since December 2016.
Architectural Billings Index (ABI)
Source: The American Institute of Architects
State of the Housing Market Although existing home sales softened to end the year, U.S.
housing market fundamentals remained robust during 2017,
lifted by a strong labor market, favorable interest rates and
healthy gains in disposable income; however, as strong buyer
interest continued to boost demand for housing, the lack of
supply, constrained by rising construction and lot development
costs, has driven up home prices which has led to an unbalanced
U.S. housing market.
The National Association of Realtors (NAR) reported that existing
home sales moderated for the first time in five months, falling
3.6% in December. Still, existing home sales increased 1.1% YoY
during 2017 to a 5.51 million pace, marking the strongest year
since 2006. Home sales were limited during the year by supply
shortages, specifically at the lower‐end of the market, which has
resulted in growing affordability issues. NAR reported that the
total inventory of existing homes fell 10.3% YoY, the 31st
consecutive monthly YoY decline, to a 3.2‐month supply, which
represents the lowest level since the NAR began tracking this
metric in 1999.
Below are several key points pertaining to the housing market.
Median existing home prices increased 5.8%, which marked
the 70th consecutive month of YoY price gains. Low
mortgage rates and a strong economy have supported
elevated home pricing levels.
According to Freddie Mac, the average commitment rate
for a 30‐year, conventional, fixed‐rate mortgage increased
to 3.95% in December. The average rate for 2017 was
3.99%.
According to ATTOM Data Solutions, 2017 foreclosure
filings declined 27.0% YoY to the lowest level since 2005
and are down 76.0% from the 2010 peak.
The NAR reported that distressed sales comprised 5.0% of
total December sales, down 7.0% from a year earlier.
Driven by steady sales and a limited supply, the November
2017 S&P/CoreLogic Case‐Shiller U.S. National Home Price
Index reported a 6.2% annual gain, the 16th consecutive
month of gains of 5.0% or greater.
New home sales, which represent about 10.0% of the
housing market, fell 9.3% in December, but increased 8.3%
in 2017 to 608,000, the highest level since 2007. Builders
continue to report a shortage of workers and materials,
which could limit future building.
The CoreLogic Home Price Index reported that U.S. home
prices increased 6.6% YoY in December. The largest 2017
price gains were concentrated in western states, including
California, Idaho, Nevada Utah and Washington.
46
47
48
49
50
51
52
53
54
55
56
57
58
Dec‐1
6
Jan‐17
Feb‐17
Mar‐1
7
Apr‐1
7
May‐1
7
Jun‐17
Jul‐1
7
Aug‐1
7
Sep‐17
Oct‐1
7
Nov‐1
7
Dec‐1
7
(ABI Index Value)
National Billings Northeast Midwest South West
FTI INSIGHTS Economic & Real Estate Report – 4th Quarter 2017
8 · FTI Consulting, Inc. EXPERTS WITH IMPACT
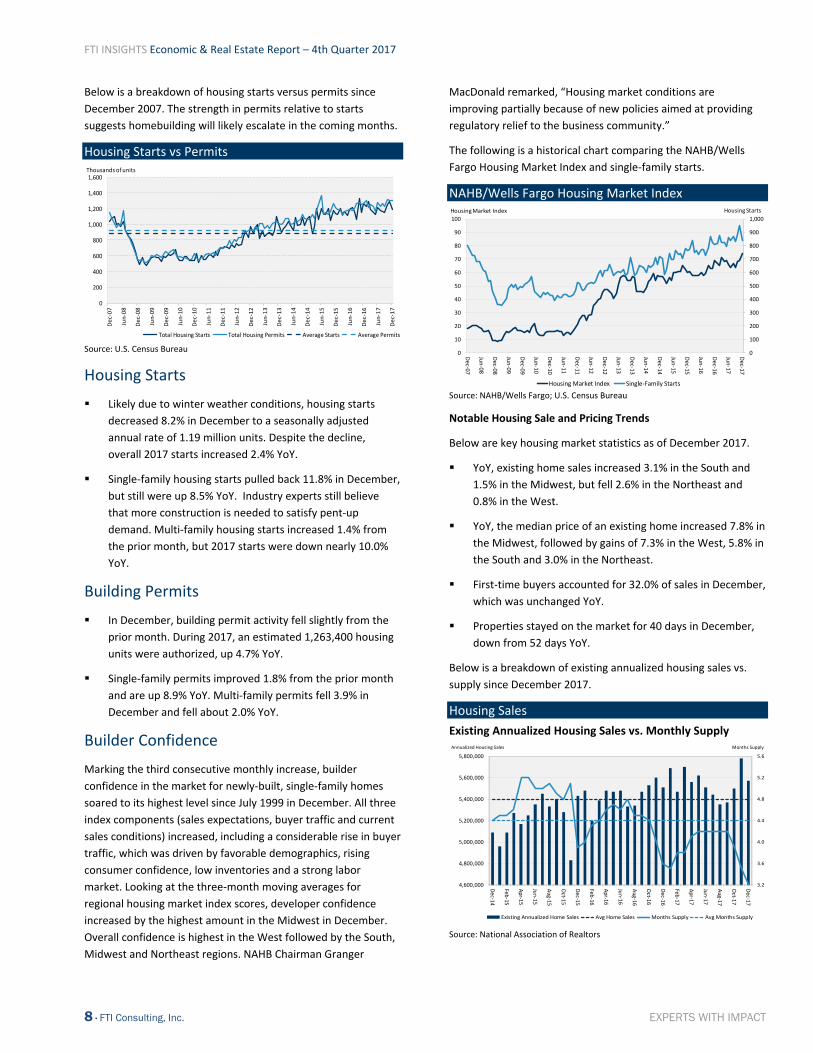
Below is a breakdown of housing starts versus permits since
December 2007. The strength in permits relative to starts
suggests homebuilding will likely escalate in the coming months.
Housing Starts vs Permits
Source: U.S. Census Bureau
Housing Starts
Likely due to winter weather conditions, housing starts
decreased 8.2% in December to a seasonally adjusted
annual rate of 1.19 million units. Despite the decline,
overall 2017 starts increased 2.4% YoY.
Single‐family housing starts pulled back 11.8% in December,
but still were up 8.5% YoY. Industry experts still believe
that more construction is needed to satisfy pent‐up
demand. Multi‐family housing starts increased 1.4% from
the prior month, but 2017 starts were down nearly 10.0%
YoY.
Building Permits
In December, building permit activity fell slightly from the
prior month. During 2017, an estimated 1,263,400 housing
units were authorized, up 4.7% YoY.
Single‐family permits improved 1.8% from the prior month
and are up 8.9% YoY. Multi‐family permits fell 3.9% in
December and fell about 2.0% YoY.
Builder Confidence
Marking the third consecutive monthly increase, builder
confidence in the market for newly‐built, single‐family homes
soared to its highest level since July 1999 in December. All three
index components (sales expectations, buyer traffic and current
sales conditions) increased, including a considerable rise in buyer
traffic, which was driven by favorable demographics, rising
consumer confidence, low inventories and a strong labor
market. Looking at the three‐month moving averages for
regional housing market index scores, developer confidence
increased by the highest amount in the Midwest in December.
Overall confidence is highest in the West followed by the South,
Midwest and Northeast regions. NAHB Chairman Granger
MacDonald remarked, “Housing market conditions are
improving partially because of new policies aimed at providing
regulatory relief to the business community.”
The following is a historical chart comparing the NAHB/Wells
Fargo Housing Market Index and single‐family starts.
NAHB/Wells Fargo Housing Market Index
Source: NAHB/Wells Fargo; U.S. Census Bureau
Notable Housing Sale and Pricing Trends
Below are key housing market statistics as of December 2017.
YoY, existing home sales increased 3.1% in the South and
1.5% in the Midwest, but fell 2.6% in the Northeast and
0.8% in the West.
YoY, the median price of an existing home increased 7.8% in
the Midwest, followed by gains of 7.3% in the West, 5.8% in
the South and 3.0% in the Northeast.
First‐time buyers accounted for 32.0% of sales in December,
which was unchanged YoY.
Properties stayed on the market for 40 days in December,
down from 52 days YoY.
Below is a breakdown of existing annualized housing sales vs.
supply since December 2017.
Housing Sales
Existing Annualized Housing Sales vs. Monthly Supply
Source: National Association of Realtors
0
200
400
600
800
1,000
1,200
1,400
1,600
Dec‐07
Jun‐08
Dec‐08
Jun‐09
Dec‐09
Jun‐10
Dec‐10
Jun‐11
Dec‐11
Jun‐12
Dec‐12
Jun‐13
Dec‐13
Jun‐14
Dec‐14
Jun‐15
Dec‐15
Jun‐16
Dec‐16
Jun‐17
Dec‐17
Thousands of units
Total Housing Starts Total Housing Permits Average Starts Average Permits
0
100
200
300
400
500
600
700
800
900
1,000
0
10
20
30
40
50
60
70
80
90
100
Dec‐07
Jun‐08
Dec‐08
Jun‐09
Dec‐09
Jun‐10
Dec‐10
Jun‐11
Dec‐11
Jun‐12
Dec‐12
Jun‐13
Dec‐13
Jun‐14
Dec‐14
Jun‐15
Dec‐15
Jun‐16
Dec‐16
Jun‐17
Dec‐17
Housing StartsHousing Market Index
Housing Market Index Single‐Family Starts
3.2
3.6
4.0
4.4
4.8
5.2
5.6
4,600,000
4,800,000
5,000,000
5,200,000
5,400,000
5,600,000
5,800,000
Dec‐14
Feb‐15
Apr‐15
Jun‐15
Aug‐15
Oct‐15
Dec‐15
Feb‐16
Apr‐16
Jun‐16
Aug‐16
Oct‐16
Dec‐16
Feb‐17
Apr‐17
Jun‐17
Aug‐17
Oct‐17
Dec‐17
Months SupplyAnnualized Housing Sales
Existing Annualized Home Sales Avg Home Sales Months Supply Avg Months Supply
FTI INSIGHTS Economic & Real Estate Report – 4th Quarter 2017
9 · FTI Consulting, Inc. EXPERTS WITH IMPACT
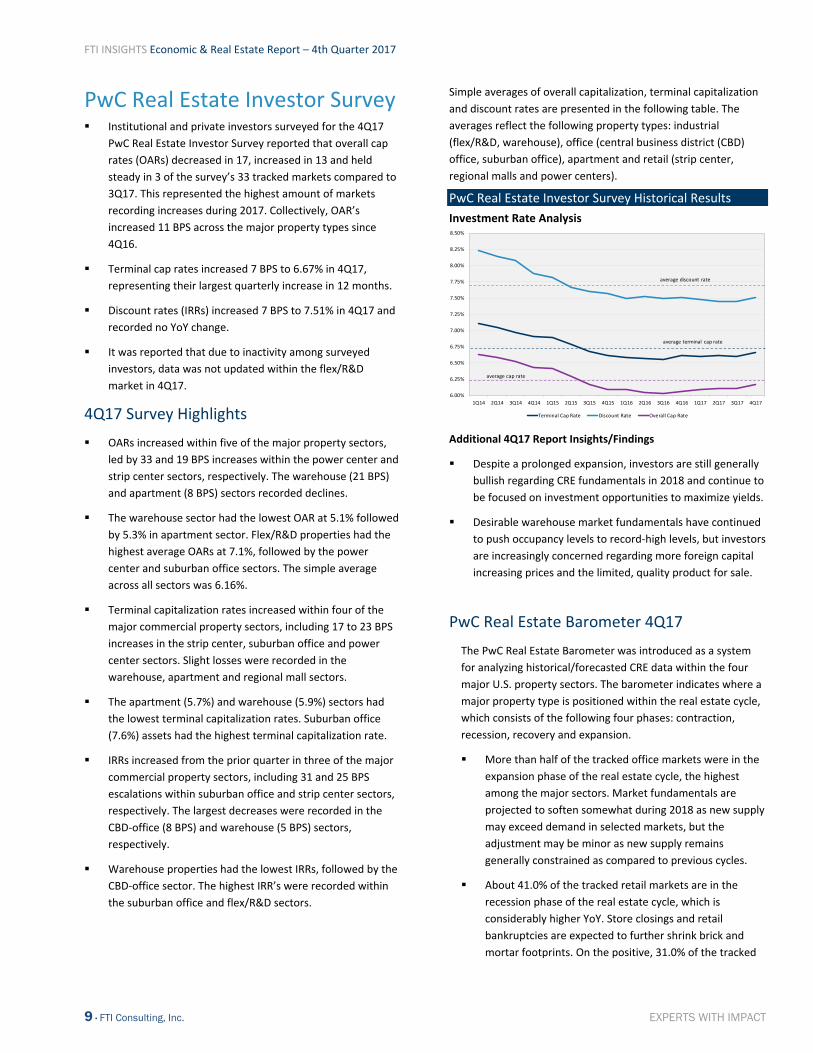
PwC Real Estate Investor Survey Institutional and private investors surveyed for the 4Q17
PwC Real Estate Investor Survey reported that overall cap
rates (OARs) decreased in 17, increased in 13 and held
steady in 3 of the survey’s 33 tracked markets compared to
3Q17. This represented the highest amount of markets
recording increases during 2017. Collectively, OAR’s
increased 11 BPS across the major property types since
4Q16.
Terminal cap rates increased 7 BPS to 6.67% in 4Q17,
representing their largest quarterly increase in 12 months.
Discount rates (IRRs) increased 7 BPS to 7.51% in 4Q17 and
recorded no YoY change.
It was reported that due to inactivity among surveyed
investors, data was not updated within the flex/R&D
market in 4Q17.
4Q17 Survey Highlights
OARs increased within five of the major property sectors,
led by 33 and 19 BPS increases within the power center and
strip center sectors, respectively. The warehouse (21 BPS)
and apartment (8 BPS) sectors recorded declines.
The warehouse sector had the lowest OAR at 5.1% followed
by 5.3% in apartment sector. Flex/R&D properties had the
highest average OARs at 7.1%, followed by the power
center and suburban office sectors. The simple average
across all sectors was 6.16%.
Terminal capitalization rates increased within four of the
major commercial property sectors, including 17 to 23 BPS
increases in the strip center, suburban office and power
center sectors. Slight losses were recorded in the
warehouse, apartment and regional mall sectors.
The apartment (5.7%) and warehouse (5.9%) sectors had
the lowest terminal capitalization rates. Suburban office
(7.6%) assets had the highest terminal capitalization rate.
IRRs increased from the prior quarter in three of the major
commercial property sectors, including 31 and 25 BPS
escalations within suburban office and strip center sectors,
respectively. The largest decreases were recorded in the
CBD‐office (8 BPS) and warehouse (5 BPS) sectors,
respectively.
Warehouse properties had the lowest IRRs, followed by the
CBD‐office sector. The highest IRR’s were recorded within
the suburban office and flex/R&D sectors.
Simple averages of overall capitalization, terminal capitalization
and discount rates are presented in the following table. The
averages reflect the following property types: industrial
(flex/R&D, warehouse), office (central business district (CBD)
office, suburban office), apartment and retail (strip center,
regional malls and power centers).
PwC Real Estate Investor Survey Historical Results
Investment Rate Analysis
Additional 4Q17 Report Insights/Findings
Despite a prolonged expansion, investors are still generally
bullish regarding CRE fundamentals in 2018 and continue to
be focused on investment opportunities to maximize yields.
Desirable warehouse market fundamentals have continued
to push occupancy levels to record‐high levels, but investors
are increasingly concerned regarding more foreign capital
increasing prices and the limited, quality product for sale.
PwC Real Estate Barometer 4Q17
The PwC Real Estate Barometer was introduced as a system
for analyzing historical/forecasted CRE data within the four
major U.S. property sectors. The barometer indicates where a
major property type is positioned within the real estate cycle,
which consists of the following four phases: contraction,
recession, recovery and expansion.
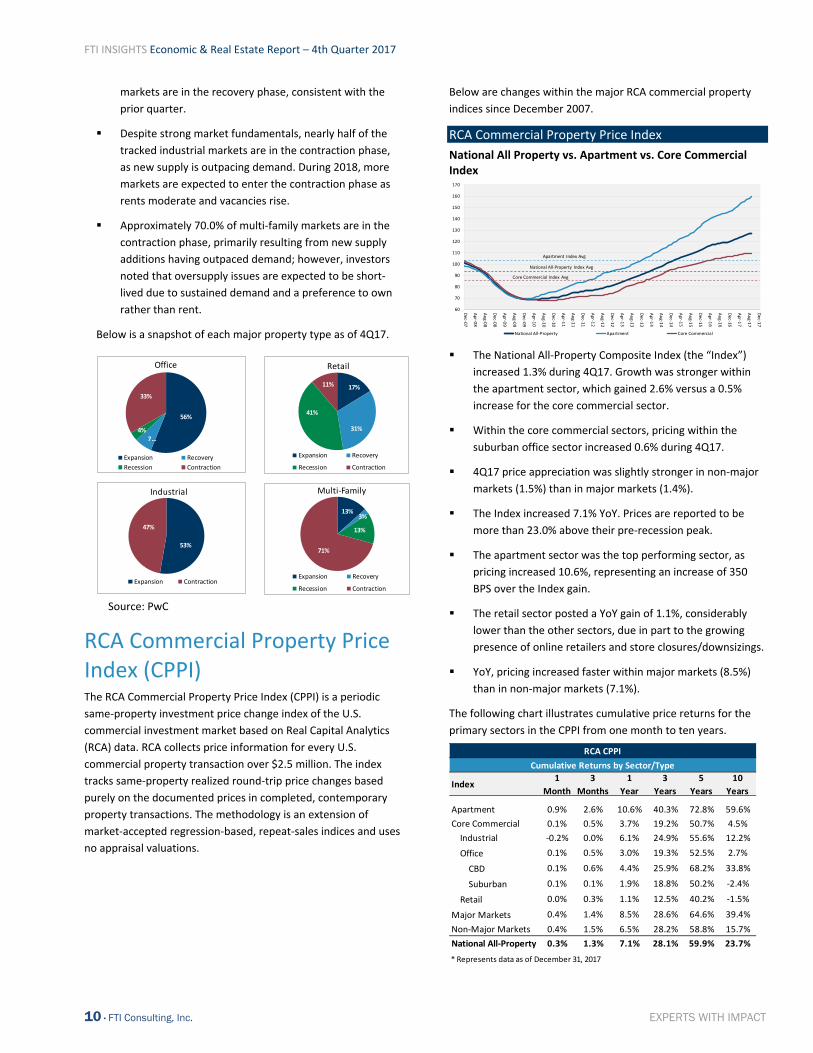
More than half of the tracked office markets were in the
expansion phase of the real estate cycle, the highest
among the major sectors. Market fundamentals are
projected to soften somewhat during 2018 as new supply
may exceed demand in selected markets, but the
adjustment may be minor as new supply remains
generally constrained as compared to previous cycles.
About 41.0% of the tracked retail markets are in the
recession phase of the real estate cycle, which is
considerably higher YoY. Store closings and retail
bankruptcies are expected to further shrink brick and
mortar footprints. On the positive, 31.0% of the tracked
6.00%
6.25%
6.50%
6.75%
7.00%
7.25%
7.50%
7.75%
8.00%
8.25%
8.50%
1Q14 2Q14 3Q14 4Q14 1Q15 2Q15 3Q15 4Q15 1Q16 2Q16 3Q16 4Q16 1Q17 2Q17 3Q17 4Q17
Terminal Cap Rate Discount Rate Overall Cap Rate
average discount rate
average cap rate
average terminal cap rate
FTI INSIGHTS Economic & Real Estate Report – 4th Quarter 2017
10 · FTI Consulting, Inc. EXPERTS WITH IMPACT
markets are in the recovery phase, consistent with the
prior quarter.
Despite strong market fundamentals, nearly half of the
tracked industrial markets are in the contraction phase,
as new supply is outpacing demand. During 2018, more
markets are expected to enter the contraction phase as
rents moderate and vacancies rise.
Approximately 70.0% of multi‐family markets are in the
contraction phase, primarily resulting from new supply
additions having outpaced demand; however, investors
noted that oversupply issues are expected to be short‐
lived due to sustained demand and a preference to own
rather than rent.
Below is a snapshot of each major property type as of 4Q17.
Source: PwC
RCA Commercial Property Price Index (CPPI) The RCA Commercial Property Price Index (CPPI) is a periodic
same‐property investment price change index of the U.S.
commercial investment market based on Real Capital Analytics
(RCA) data. RCA collects price information for every U.S.
commercial property transaction over $2.5 million. The index
tracks same‐property realized round‐trip price changes based
purely on the documented prices in completed, contemporary
property transactions. The methodology is an extension of
market‐accepted regression‐based, repeat‐sales indices and uses
no appraisal valuations.
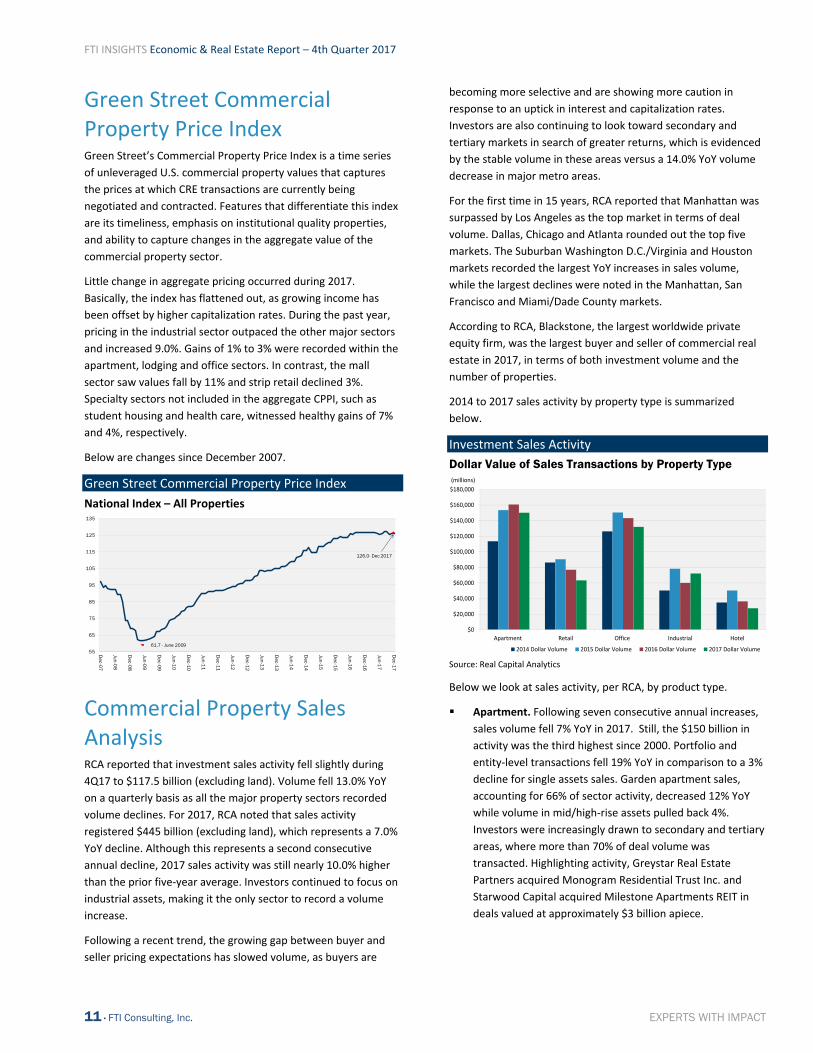
Below are changes within the major RCA commercial property
indices since December 2007.
RCA Commercial Property Price Index
National All Property vs. Apartment vs. Core Commercial Index
The National All‐Property Composite Index (the “Index”)
increased 1.3% during 4Q17. Growth was stronger within
the apartment sector, which gained 2.6% versus a 0.5%
increase for the core commercial sector.
Within the core commercial sectors, pricing within the
suburban office sector increased 0.6% during 4Q17.
4Q17 price appreciation was slightly stronger in non‐major
markets (1.5%) than in major markets (1.4%).
The Index increased 7.1% YoY. Prices are reported to be
more than 23.0% above their pre‐recession peak.
The apartment sector was the top performing sector, as
pricing increased 10.6%, representing an increase of 350
BPS over the Index gain.
The retail sector posted a YoY gain of 1.1%, considerably
lower than the other sectors, due in part to the growing
presence of online retailers and store closures/downsizings.
YoY, pricing increased faster within major markets (8.5%)
than in non‐major markets (7.1%).
The following chart illustrates cumulative price returns for the
primary sectors in the CPPI from one month to ten years.
56%
7…4%
33%
Office
Expansion Recovery
Recession Contraction
53%
2%
47%
Industrial
Expansion Contraction
13%3%
13%
71%
Multi‐Family
Expansion Recovery
Recession Contraction
17%
31%
41%
11%
Expansion Recovery
Recession Contraction
Retail
60
70
80
90
100
110
120
130
140
150
160
170
Dec‐0
7
Apr‐0
8
Aug‐08
Dec‐0
8
Apr‐0
9
Aug‐09
Dec‐0
9
Apr‐1
0
Aug‐10
Dec‐1
0
Apr‐1
1
Aug‐11
Dec‐1
1
Apr‐1
2
Aug‐12
Dec‐1
2
Apr‐1
3
Aug‐13
Dec‐1
3
Apr‐1
4
Aug‐14
Dec‐1
4
Apr‐1
5
Aug‐15
Dec‐1
5
Apr‐1
6
Aug‐16
Dec‐1
6
Apr‐1
7
Aug‐17
Dec‐1
7
National All‐Property Apartment Core Commercial
Apartment Index Avg
National All‐Property Index Avg
Core Commercial Index Avg
Index1
Month
3
Months
1
Year
3
Years
5
Years
10
Years
Apartment 0.9% 2.6% 10.6% 40.3% 72.8% 59.6%
Core Commercial 0.1% 0.5% 3.7% 19.2% 50.7% 4.5%
Industrial ‐0.2% 0.0% 6.1% 24.9% 55.6% 12.2%
Office 0.1% 0.5% 3.0% 19.3% 52.5% 2.7%
CBD 0.1% 0.6% 4.4% 25.9% 68.2% 33.8%
Suburban 0.1% 0.1% 1.9% 18.8% 50.2% ‐2.4%
Retail 0.0% 0.3% 1.1% 12.5% 40.2% ‐1.5%
Major Markets 0.4% 1.4% 8.5% 28.6% 64.6% 39.4%
Non‐Major Markets 0.4% 1.5% 6.5% 28.2% 58.8% 15.7%
National All‐Property 0.3% 1.3% 7.1% 28.1% 59.9% 23.7%
* Represents data as of December 31, 2017
RCA CPPI
Cumulative Returns by Sector/Type
FTI INSIGHTS Economic & Real Estate Report – 4th Quarter 2017
11 · FTI Consulting, Inc. EXPERTS WITH IMPACT
Green Street Commercial Property Price Index Green Street’s Commercial Property Price Index is a time series
of unleveraged U.S. commercial property values that captures
the prices at which CRE transactions are currently being
negotiated and contracted. Features that differentiate this index
are its timeliness, emphasis on institutional quality properties,
and ability to capture changes in the aggregate value of the
commercial property sector.
Little change in aggregate pricing occurred during 2017.
Basically, the index has flattened out, as growing income has
been offset by higher capitalization rates. During the past year,
pricing in the industrial sector outpaced the other major sectors
and increased 9.0%. Gains of 1% to 3% were recorded within the
apartment, lodging and office sectors. In contrast, the mall
sector saw values fall by 11% and strip retail declined 3%.
Specialty sectors not included in the aggregate CPPI, such as
student housing and health care, witnessed healthy gains of 7%
and 4%, respectively.
Below are changes since December 2007.
Green Street Commercial Property Price Index
National Index – All Properties
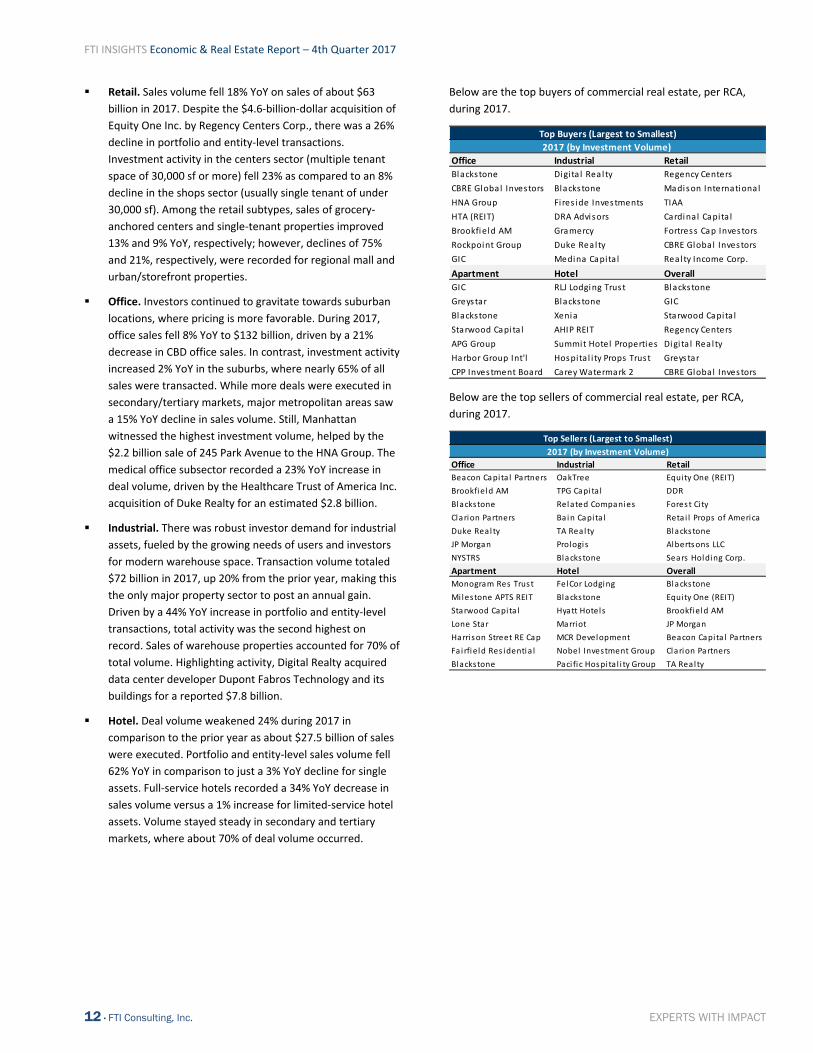
Commercial Property Sales Analysis RCA reported that investment sales activity fell slightly during
4Q17 to $117.5 billion (excluding land). Volume fell 13.0% YoY
on a quarterly basis as all the major property sectors recorded
volume declines. For 2017, RCA noted that sales activity
registered $445 billion (excluding land), which represents a 7.0%
YoY decline. Although this represents a second consecutive
annual decline, 2017 sales activity was still nearly 10.0% higher
than the prior five‐year average. Investors continued to focus on
industrial assets, making it the only sector to record a volume
increase.
Following a recent trend, the growing gap between buyer and
seller pricing expectations has slowed volume, as buyers are
becoming more selective and are showing more caution in
response to an uptick in interest and capitalization rates.
Investors are also continuing to look toward secondary and
tertiary markets in search of greater returns, which is evidenced
by the stable volume in these areas versus a 14.0% YoY volume
decrease in major metro areas.
For the first time in 15 years, RCA reported that Manhattan was
surpassed by Los Angeles as the top market in terms of deal
volume. Dallas, Chicago and Atlanta rounded out the top five
markets. The Suburban Washington D.C./Virginia and Houston
markets recorded the largest YoY increases in sales volume,
while the largest declines were noted in the Manhattan, San
Francisco and Miami/Dade County markets.
According to RCA, Blackstone, the largest worldwide private
equity firm, was the largest buyer and seller of commercial real
estate in 2017, in terms of both investment volume and the
number of properties.
2014 to 2017 sales activity by property type is summarized
below.
Investment Sales Activity
Dollar Value of Sales Transactions by Property Type
Source: Real Capital Analytics
Below we look at sales activity, per RCA, by product type.
Apartment. Following seven consecutive annual increases,
sales volume fell 7% YoY in 2017. Still, the $150 billion in
activity was the third highest since 2000. Portfolio and
entity‐level transactions fell 19% YoY in comparison to a 3%
decline for single assets sales. Garden apartment sales,
accounting for 66% of sector activity, decreased 12% YoY
while volume in mid/high‐rise assets pulled back 4%.
Investors were increasingly drawn to secondary and tertiary
areas, where more than 70% of deal volume was
transacted. Highlighting activity, Greystar Real Estate
Partners acquired Monogram Residential Trust Inc. and
Starwood Capital acquired Milestone Apartments REIT in
deals valued at approximately $3 billion apiece.
61.7 - June 2009 55
65
75
85
95
105
115
125
135
Dec-07
Jun-08
Dec-08
Jun-09
Dec-09
Jun-10
Dec-10
Jun-11
Dec-11
Jun-12
Dec-12
Jun-13
Dec-13
Jun-14
Dec-14
Jun-15
Dec-15
Jun-16
Dec-16
Jun-17
Dec-17
126.0- Dec 2017
$0
$20,000
$40,000
$60,000
$80,000
$100,000
$120,000
$140,000
$160,000
$180,000
Apartment Retail Office Industrial Hotel
(millions)
2014 Dollar Volume 2015 Dollar Volume 2016 Dollar Volume 2017 Dollar Volume
FTI INSIGHTS Economic & Real Estate Report – 4th Quarter 2017
12 · FTI Consulting, Inc. EXPERTS WITH IMPACT
Retail. Sales volume fell 18% YoY on sales of about $63
billion in 2017. Despite the $4.6‐billion‐dollar acquisition of
Equity One Inc. by Regency Centers Corp., there was a 26%
decline in portfolio and entity‐level transactions.
Investment activity in the centers sector (multiple tenant
space of 30,000 sf or more) fell 23% as compared to an 8%
decline in the shops sector (usually single tenant of under
30,000 sf). Among the retail subtypes, sales of grocery‐
anchored centers and single‐tenant properties improved
13% and 9% YoY, respectively; however, declines of 75%
and 21%, respectively, were recorded for regional mall and
urban/storefront properties.
Office. Investors continued to gravitate towards suburban
locations, where pricing is more favorable. During 2017,
office sales fell 8% YoY to $132 billion, driven by a 21%
decrease in CBD office sales. In contrast, investment activity
increased 2% YoY in the suburbs, where nearly 65% of all
sales were transacted. While more deals were executed in
secondary/tertiary markets, major metropolitan areas saw
a 15% YoY decline in sales volume. Still, Manhattan
witnessed the highest investment volume, helped by the
$2.2 billion sale of 245 Park Avenue to the HNA Group. The
medical office subsector recorded a 23% YoY increase in
deal volume, driven by the Healthcare Trust of America Inc.
acquisition of Duke Realty for an estimated $2.8 billion.
Industrial. There was robust investor demand for industrial
assets, fueled by the growing needs of users and investors
for modern warehouse space. Transaction volume totaled
$72 billion in 2017, up 20% from the prior year, making this
the only major property sector to post an annual gain.
Driven by a 44% YoY increase in portfolio and entity‐level
transactions, total activity was the second highest on
record. Sales of warehouse properties accounted for 70% of
total volume. Highlighting activity, Digital Realty acquired
data center developer Dupont Fabros Technology and its
buildings for a reported $7.8 billion.
Hotel. Deal volume weakened 24% during 2017 in
comparison to the prior year as about $27.5 billion of sales
were executed. Portfolio and entity‐level sales volume fell
62% YoY in comparison to just a 3% YoY decline for single
assets. Full‐service hotels recorded a 34% YoY decrease in
sales volume versus a 1% increase for limited‐service hotel
assets. Volume stayed steady in secondary and tertiary
markets, where about 70% of deal volume occurred.
Below are the top buyers of commercial real estate, per RCA,
during 2017.
Below are the top sellers of commercial real estate, per RCA,
during 2017.
Office Industrial Retail
Blackstone Digi ta l Real ty Regency Centers
CBRE Global Investors Blackstone Madison Internationa l
HNA Group Fires ide Investments TIAA
HTA (REIT) DRA Advisors Cardinal Capita l
Brookfield AM Gramercy Fortress Cap Investors
Rockpoint Group Duke Realty CBRE Global Investors
GIC Medina Capita l Rea lty Income Corp.
Apartment Hotel Overall
GIC RLJ Lodging Trust Blackstone
Greystar Blackstone GIC
Blackstone Xenia Starwood Capita l
Starwood Capita l AHIP REIT Regency Centers
APG Group Summit Hotel Properties Digi ta l Realty
Harbor Group Int'l Hospita l i ty Props Trust Greystar
CPP Investment Board Carey Watermark 2 CBRE Global Investors
Top Buyers (Largest to Smallest)
2017 (by Investment Volume)
Office Industrial Retail
Beacon Capita l Partners OakTree Equity One (REIT)
Brookfield AM TPG Capita l DDR
Blackstone Related Companies Forest City
Clarion Partners Bain Capi ta l Reta i l Props of America
Duke Real ty TA Realty Blackstone
JP Morgan Prologis Albertsons LLC
NYSTRS Blackstone Sears Holding Corp.
Apartment Hotel Overall
Monogram Res Trust FelCor Lodging Blackstone
Milestone APTS REIT Blackstone Equity One (REIT)
Starwood Capita l Hyatt Hotels Brookfield AM
Lone Star Marriot JP Morgan
Harrison Street RE Cap MCR Development Beacon Capita l Partners
Fa irfield Res identia l Nobel Investment Group Clarion Partners
Blackstone Paci fic Hospita l i ty Group TA Realty
Top Sellers (Largest to Smallest)
2017 (by Investment Volume)
FTI INSIGHTS Economic & Real Estate Report – 4th Quarter 2017
13 · FTI Consulting, Inc. EXPERTS WITH IMPACT
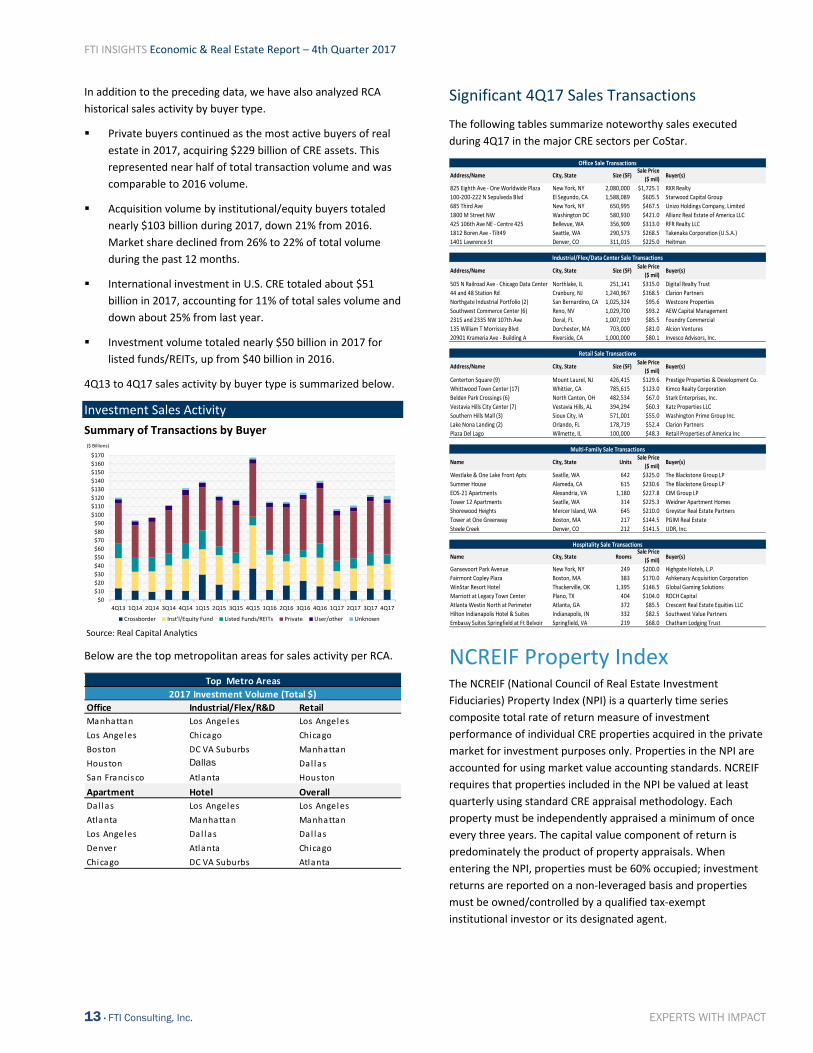
In addition to the preceding data, we have also analyzed RCA
historical sales activity by buyer type.
Private buyers continued as the most active buyers of real
estate in 2017, acquiring $229 billion of CRE assets. This
represented near half of total transaction volume and was
comparable to 2016 volume.
Acquisition volume by institutional/equity buyers totaled
nearly $103 billion during 2017, down 21% from 2016.
Market share declined from 26% to 22% of total volume
during the past 12 months.
International investment in U.S. CRE totaled about $51
billion in 2017, accounting for 11% of total sales volume and
down about 25% from last year.
Investment volume totaled nearly $50 billion in 2017 for
listed funds/REITs, up from $40 billion in 2016.
4Q13 to 4Q17 sales activity by buyer type is summarized below.
Investment Sales Activity
Summary of Transactions by Buyer
Source: Real Capital Analytics
Below are the top metropolitan areas for sales activity per RCA.
Significant 4Q17 Sales Transactions
The following tables summarize noteworthy sales executed
during 4Q17 in the major CRE sectors per CoStar.
NCREIF Property Index The NCREIF (National Council of Real Estate Investment
Fiduciaries) Property Index (NPI) is a quarterly time series
composite total rate of return measure of investment
performance of individual CRE properties acquired in the private
market for investment purposes only. Properties in the NPI are
accounted for using market value accounting standards. NCREIF
requires that properties included in the NPI be valued at least
quarterly using standard CRE appraisal methodology. Each
property must be independently appraised a minimum of once
every three years. The capital value component of return is
predominately the product of property appraisals. When
entering the NPI, properties must be 60% occupied; investment
returns are reported on a non‐leveraged basis and properties
must be owned/controlled by a qualified tax‐exempt
institutional investor or its designated agent.
$0
$10
$20
$30
$40
$50
$60
$70
$80
$90
$100
$110
$120
$130
$140
$150
$160
$170
4Q13 1Q14 2Q14 3Q14 4Q14 1Q15 2Q15 3Q15 4Q15 1Q16 2Q16 3Q16 4Q16 1Q17 2Q17 3Q17 4Q17
($ Billions)
Crossborder Inst'l/Equity Fund Listed Funds/REITs Private User/other Unknown
Office Industrial/Flex/R&D Retail
Manhattan Los Angeles Los Angeles
Los Angeles Chicago Chicago
Boston DC VA Suburbs Manhattan
Houston Dallas Dal las
San Francisco Atlanta Houston
Apartment Hotel Overall
Dal las Los Angeles Los Angeles
Atlanta Manhattan Manhattan
Los Angeles Dal las Dal las
Denver Atlanta Chicago
Chicago DC VA Suburbs Atlanta
Top Metro Areas
2017 Investment Volume (Total $)
Address/Name City, State Size (SF)Sale Price
($ mil)Buyer(s)
825 Eighth Ave ‐ One Worldwide Plaza New York, NY 2,080,000 $1,725.1 RXR Realty
100‐200‐222 N Sepulveda Blvd El Segundo, CA 1,588,089 $605.5 Starwood Capital Group
685 Third Ave New York, NY 650,995 $467.5 Unizo Holdings Company, Limited
1800 M Street NW Washington DC 580,930 $421.0 Allianz Real Estate of America LLC
425 106th Ave NE ‐ Centre 425 Bellevue, WA 356,909 $313.0 RFR Realty LLC
1812 Boren Ave ‐ Tilt49 Seattle, WA 290,573 $268.5 Takenaka Corporation (U.S.A.)
1401 Lawrence St Denver, CO 311,015 $225.0 Heitman
Address/Name City, State Size (SF)Sale Price
($ mil)Buyer(s)
505 N Railroad Ave ‐ Chicago Data Center Northlake, IL 251,141 $315.0 Digital Realty Trust
44 and 48 Station Rd Cranbury, NJ 1,240,967 $168.5 Clarion Partners
Northgate Industrial Portfolio (2) San Bernardino, CA 1,025,324 $95.6 Westcore Properties
Southwest Commerce Center (6) Reno, NV 1,029,700 $93.2 AEW Capital Management
2315 and 2335 NW 107th Ave Doral, FL 1,007,019 $85.5 Foundry Commercial
135 William T Morrissey Blvd Dorchester, MA 703,000 $81.0 Alcion Ventures
20901 Krameria Ave ‐ Building A Riverside, CA 1,000,000 $80.1 Invesco Advisors, Inc.
Address/Name City, State Size (SF)Sale Price
($ mil)Buyer(s)
Centerton Square (9) Mount Laurel, NJ 426,415 $129.6 Prestige Properties & Development Co.
Whittwood Town Center (17) Whittier, CA 785,615 $123.0 Kimco Realty Corporation
Belden Park Crossings (6) North Canton, OH 482,534 $67.0 Stark Enterprises, Inc.
Vestavia Hills City Center (7) Vestavia Hills, AL 394,294 $60.3 Katz Properties LLC
Southern Hills Mall (3) Sioux City, IA 571,001 $55.0 Washington Prime Group Inc.
Lake Nona Landing (2) Orlando, FL 178,719 $52.4 Clarion Partners
Plaza Del Lago Wilmette, IL 100,000 $48.3 Retail Properties of America Inc
Name City, State UnitsSale Price
($ mil)Buyer(s)
Westlake & One Lake Front Apts Seatlle, WA 642 $325.0 The Blackstone Group LP
Summer House Alameda, CA 615 $230.6 The Blackstone Group LP
EOS‐21 Apartments Alexandria, VA 1,180 $227.8 CIM Group LP
Tower 12 Apartments Seatlle, WA 314 $225.3 Weidner Apartment Homes
Shorewood Heights Mercer Island, WA 645 $210.0 Greystar Real Estate Partners
Tower at One Greenway Boston, MA 217 $144.5 PGIM Real Estate
Steele Creek Denver, CO 212 $141.5 UDR, Inc.
Name City, State RoomsSale Price
($ mil)Buyer(s)
Gansevoort Park Avenue New York, NY 249 $200.0 Highgate Hotels, L.P.
Fairmont Copley Plaza Boston, MA 383 $170.0 Ashkenazy Acquisition Corporation
WinStar Resort Hotel Thackerville, OK 1,395 $146.5 Global Gaming Solutions
Marriott at Legacy Town Center Plano, TX 404 $104.0 ROCH Capital
Atlanta Westin North at Perimeter Atlanta, GA 372 $85.5 Crescent Real Estate Equities LLC
Hilton Indianapolis Hotel & Suites Indianapolis, IN 332 $82.5 Southwest Value Partners
Embassy Suites Springfield at Ft Belvoir Springfield, VA 219 $68.0 Chatham Lodging Trust
Hospitality Sale Transactions
Office Sale Transactions
Industrial/Flex/Data Center Sale Transactions
Retail Sale Transactions
Multi‐Family Sale Transactions
FTI INSIGHTS Economic & Real Estate Report – 4th Quarter 2017
14 · FTI Consulting, Inc. EXPERTS WITH IMPACT
NPI General Recap
Although gains remained modest, NPI total returns
increased 10 BPS from last quarter to 1.80%, comprised of a
1.16% income return and a 0.64% capital appreciation
return. Total returns registered 1.73% (1.14% income return
and a 0.59% capital appreciation return) during 4Q16.
Total one‐year returns registered 7.0%, 100 BPS lower YoY.
The average quarterly return during the past 5 years was
nearly 2.5%.
Despite modest growth, it was reported that overall market
fundamentals remained favorable during 4Q17.
Occupancy rates (93.6%) increased to a 16‐year
high for NCREIF‐tracked properties. Industrial
assets had the highest occupancy (96.4%),
followed by retail assets (93.1%).
4Q17 trailing year NOI growth was 5.2%, led by
gains in the office and industrial sectors. Retail
and apartment growth lagged the overall average.
4Q17 trailing year rental growth was 3.5%, led by
gains of around 6.0% within the industrial sector.
Office gains were nearly 5.0% while the retail and
apartment sectors trended near 2.0%.
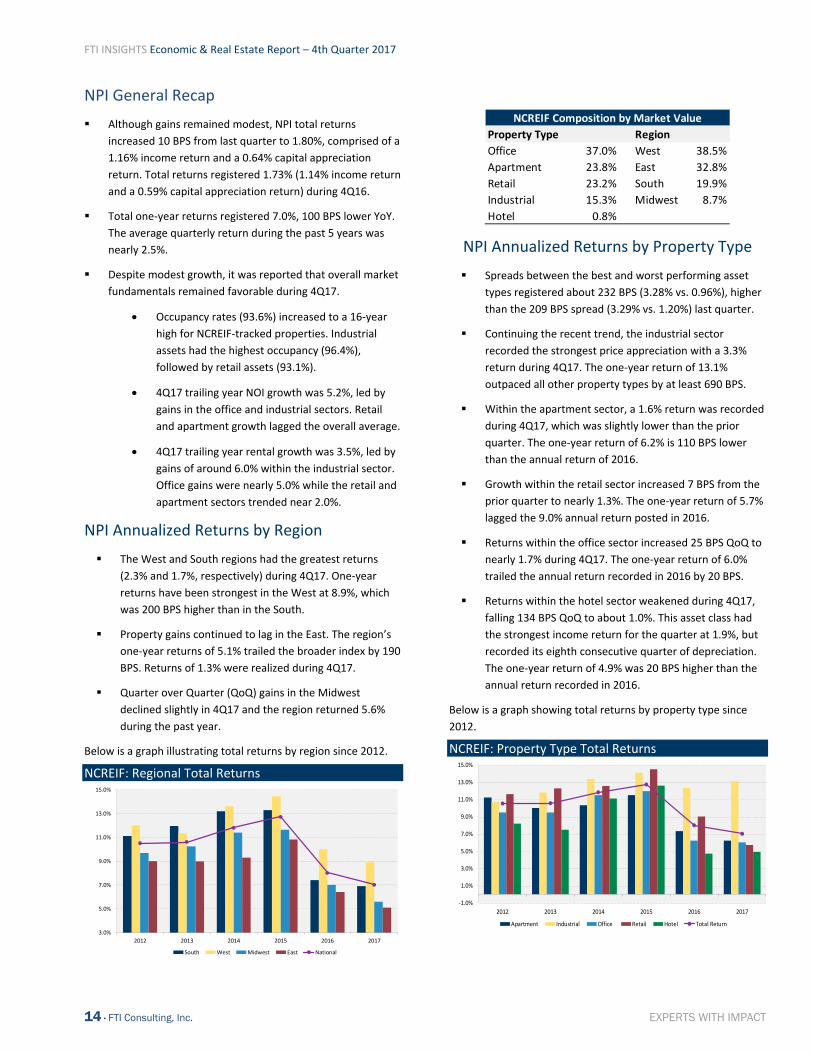
NPI Annualized Returns by Region
The West and South regions had the greatest returns
(2.3% and 1.7%, respectively) during 4Q17. One‐year
returns have been strongest in the West at 8.9%, which
was 200 BPS higher than in the South.
Property gains continued to lag in the East. The region’s
one‐year returns of 5.1% trailed the broader index by 190
BPS. Returns of 1.3% were realized during 4Q17.
Quarter over Quarter (QoQ) gains in the Midwest
declined slightly in 4Q17 and the region returned 5.6%
during the past year.
Below is a graph illustrating total returns by region since 2012.
NCREIF: Regional Total Returns
NPI Annualized Returns by Property Type
Spreads between the best and worst performing asset
types registered about 232 BPS (3.28% vs. 0.96%), higher
than the 209 BPS spread (3.29% vs. 1.20%) last quarter.
Continuing the recent trend, the industrial sector
recorded the strongest price appreciation with a 3.3%
return during 4Q17. The one‐year return of 13.1%
outpaced all other property types by at least 690 BPS.
Within the apartment sector, a 1.6% return was recorded
during 4Q17, which was slightly lower than the prior
quarter. The one‐year return of 6.2% is 110 BPS lower
than the annual return of 2016.
Growth within the retail sector increased 7 BPS from the
prior quarter to nearly 1.3%. The one‐year return of 5.7%
lagged the 9.0% annual return posted in 2016.
Returns within the office sector increased 25 BPS QoQ to
nearly 1.7% during 4Q17. The one‐year return of 6.0%
trailed the annual return recorded in 2016 by 20 BPS.
Returns within the hotel sector weakened during 4Q17,
falling 134 BPS QoQ to about 1.0%. This asset class had
the strongest income return for the quarter at 1.9%, but
recorded its eighth consecutive quarter of depreciation.
The one‐year return of 4.9% was 20 BPS higher than the
annual return recorded in 2016.
Below is a graph showing total returns by property type since
2012.
NCREIF: Property Type Total Returns
3.0%
5.0%
7.0%
9.0%
11.0%
13.0%
15.0%
2012 2013 2014 2015 2016 2017
South West Midwest East National
Property Type Region
Office 37.0% West 38.5%
Apartment 23.8% East 32.8%
Retail 23.2% South 19.9%
Industrial 15.3% Midwest 8.7%
Hotel 0.8%
NCREIF Composition by Market Value
‐1.0%
1.0%
3.0%
5.0%
7.0%
9.0%
11.0%
13.0%
15.0%
2012 2013 2014 2015 2016 2017
Apartment Industrial Office Retail Hotel Total Return
FTI INSIGHTS Economic & Real Estate Report – 4th Quarter 2017
15 · FTI Consulting, Inc. EXPERTS WITH IMPACT
Equity REIT Analysis
FTSE National Association of REITs U.S. Real
Estate Index
Comprised of 167 REITs, the Financial Times of London and
London Stock Exchange (FTSE) NAREIT All Equity REITs Index
(“The Index”) gained 2.5% during 4Q17, despite a slight
December decline. Analysts believed the recent REIT weakness
resulted from expectations that the industry will not benefit
from the TCJA as much as other corporate sectors, which has
shifted some investment into more growth‐oriented sectors. For
the year, the Index has increased 8.7%, similar to 2016.
Still, REITs underperformed the broader stock market during
2017, largely due to concerns regarding performance in a rising
interest rate environment. According to a January 3, 2018 article
from REIT.com, Alexander Goldfarb, managing director at
Sandler O’Neill & Partners, feels that REITs could come back in
favor in 2018, assuming no signs of a market downturn, as the
valuation gap with the broader market widens.
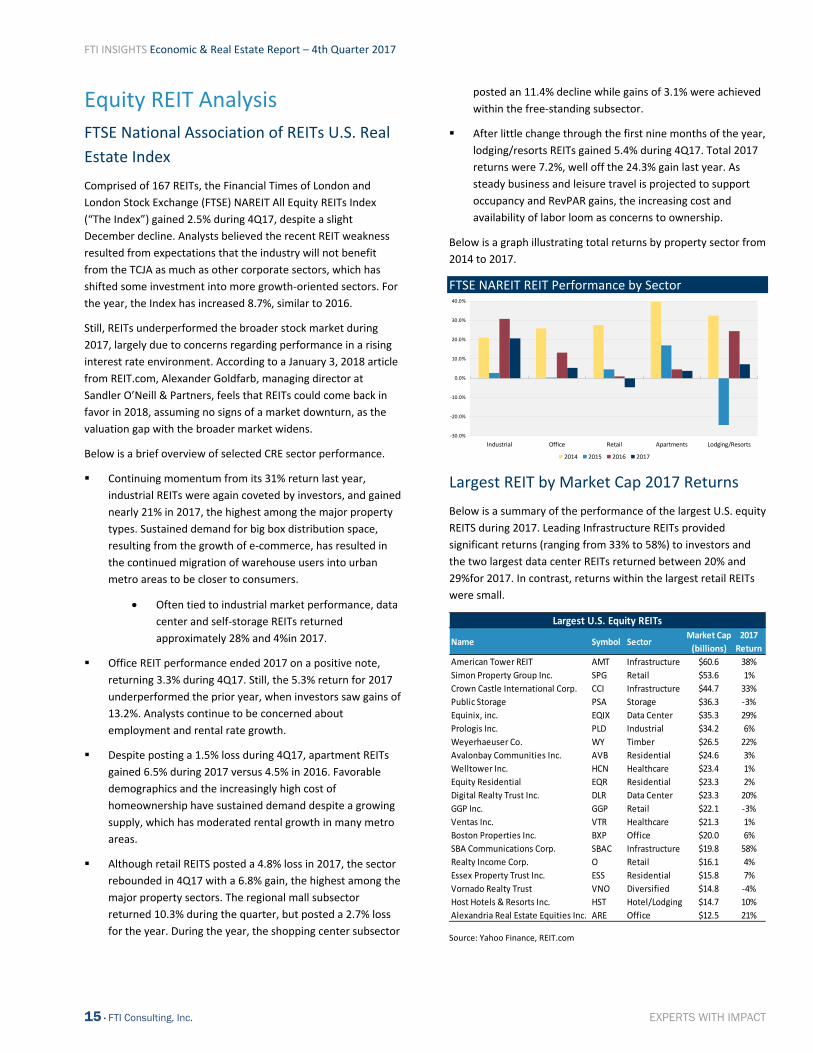
Below is a brief overview of selected CRE sector performance.
Continuing momentum from its 31% return last year,
industrial REITs were again coveted by investors, and gained
nearly 21% in 2017, the highest among the major property
types. Sustained demand for big box distribution space,
resulting from the growth of e‐commerce, has resulted in
the continued migration of warehouse users into urban
metro areas to be closer to consumers.
Often tied to industrial market performance, data
center and self‐storage REITs returned
approximately 28% and 4%in 2017.
Office REIT performance ended 2017 on a positive note,
returning 3.3% during 4Q17. Still, the 5.3% return for 2017
underperformed the prior year, when investors saw gains of
13.2%. Analysts continue to be concerned about
employment and rental rate growth.
Despite posting a 1.5% loss during 4Q17, apartment REITs
gained 6.5% during 2017 versus 4.5% in 2016. Favorable
demographics and the increasingly high cost of
homeownership have sustained demand despite a growing
supply, which has moderated rental growth in many metro
areas.
Although retail REITS posted a 4.8% loss in 2017, the sector
rebounded in 4Q17 with a 6.8% gain, the highest among the
major property sectors. The regional mall subsector
returned 10.3% during the quarter, but posted a 2.7% loss
for the year. During the year, the shopping center subsector
posted an 11.4% decline while gains of 3.1% were achieved
within the free‐standing subsector.
After little change through the first nine months of the year,
lodging/resorts REITs gained 5.4% during 4Q17. Total 2017
returns were 7.2%, well off the 24.3% gain last year. As
steady business and leisure travel is projected to support
occupancy and RevPAR gains, the increasing cost and
availability of labor loom as concerns to ownership.
Below is a graph illustrating total returns by property sector from
2014 to 2017.
FTSE NAREIT REIT Performance by Sector
Largest REIT by Market Cap 2017 Returns
Below is a summary of the performance of the largest U.S. equity
REITS during 2017. Leading Infrastructure REITs provided
significant returns (ranging from 33% to 58%) to investors and
the two largest data center REITs returned between 20% and
29%for 2017. In contrast, returns within the largest retail REITs
were small.
Source: Yahoo Finance, REIT.com
‐30.0%
‐20.0%
‐10.0%
0.0%
10.0%
20.0%
30.0%
40.0%
Industrial Office Retail Apartments Lodging/Resorts
2014 2015 2016 2017
Name Symbol SectorMarket Cap
(billions)
2017
Return
American Tower REIT AMT Infrastructure $60.6 38%
Simon Property Group Inc. SPG Retail $53.6 1%
Crown Castle International Corp. CCI Infrastructure $44.7 33%
Public Storage PSA Storage $36.3 ‐3%
Equinix, inc. EQIX Data Center $35.3 29%
Prologis Inc. PLD Industrial $34.2 6%
Weyerhaeuser Co. WY Timber $26.5 22%
Avalonbay Communities Inc. AVB Residential $24.6 3%
Welltower Inc. HCN Healthcare $23.4 1%
Equity Residential EQR Residential $23.3 2%
Digital Realty Trust Inc. DLR Data Center $23.3 20%
GGP Inc. GGP Retail $22.1 ‐3%
Ventas Inc. VTR Healthcare $21.3 1%
Boston Properties Inc. BXP Office $20.0 6%
SBA Communications Corp. SBAC Infrastructure $19.8 58%
Realty Income Corp. O Retail $16.1 4%
Essex Property Trust Inc. ESS Residential $15.8 7%
Vornado Realty Trust VNO Diversified $14.8 ‐4%
Host Hotels & Resorts Inc. HST Hotel/Lodging $14.7 10%
Alexandria Real Estate Equities Inc. ARE Office $12.5 21%
Largest U.S. Equity REITs
FTI INSIGHTS Economic & Real Estate Report – 4th Quarter 2017
16 · FTI Consulting, Inc. EXPERTS WITH IMPACT
Stock Market Recap
Stocks continued to provide robust returns for investors and
advanced to record high levels during 4Q17. Both the Dow Jones
Industrial Average (+10.3%) and the S&P 500 (+6.2%) recorded
their ninth consecutive quarterly advance and The NASDAQ
(+6.2%) recorded its sixth straight quarterly gain. Volatility
remained light and the CBOE Volatility index fell to its lowest
level since 1993. Mid‐and large cap stocks outperformed small
cap stocks and technology, financial and consumer discretionary
were the best performing sectors within the S&P 500.
Bullish sentiment, driven by investor confidence regarding
positive corporate earnings, steady economic growth and the
anticipation of the passage of the TCJA, which would reduce the
corporate tax rate from 35% to 21%, continued to drive stock
market strength and resulted in what many observers referred
to as a market “melt up” during the second half of the quarter.
The following chart highlights the annual returns of Equity REITs
in comparison to several of the leading stock market indices.
During 2017, the technology‐heavy NASDAQ returned 28.2%,
outperforming other leading indices and equity REITs.
Source: Yahoo Finance:
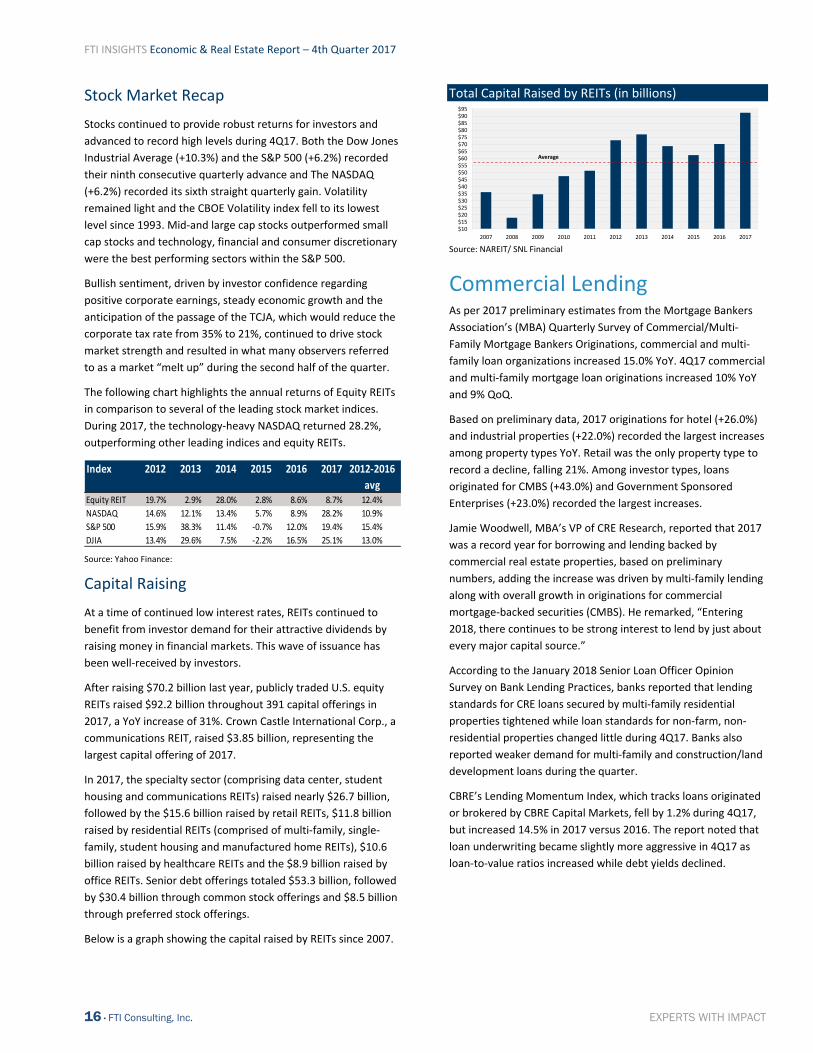
Capital Raising
At a time of continued low interest rates, REITs continued to
benefit from investor demand for their attractive dividends by
raising money in financial markets. This wave of issuance has
been well‐received by investors.
After raising $70.2 billion last year, publicly traded U.S. equity
REITs raised $92.2 billion throughout 391 capital offerings in
2017, a YoY increase of 31%. Crown Castle International Corp., a
communications REIT, raised $3.85 billion, representing the
largest capital offering of 2017.
In 2017, the specialty sector (comprising data center, student
housing and communications REITs) raised nearly $26.7 billion,
followed by the $15.6 billion raised by retail REITs, $11.8 billion
raised by residential REITs (comprised of multi‐family, single‐
family, student housing and manufactured home REITs), $10.6
billion raised by healthcare REITs and the $8.9 billion raised by
office REITs. Senior debt offerings totaled $53.3 billion, followed
by $30.4 billion through common stock offerings and $8.5 billion
through preferred stock offerings.
Below is a graph showing the capital raised by REITs since 2007.
Total Capital Raised by REITs (in billions)
Source: NAREIT/ SNL Financial
Commercial Lending As per 2017 preliminary estimates from the Mortgage Bankers
Association’s (MBA) Quarterly Survey of Commercial/Multi‐
Family Mortgage Bankers Originations, commercial and multi‐
family loan organizations increased 15.0% YoY. 4Q17 commercial
and multi‐family mortgage loan originations increased 10% YoY
and 9% QoQ.
Based on preliminary data, 2017 originations for hotel (+26.0%)
and industrial properties (+22.0%) recorded the largest increases
among property types YoY. Retail was the only property type to
record a decline, falling 21%. Among investor types, loans
originated for CMBS (+43.0%) and Government Sponsored
Enterprises (+23.0%) recorded the largest increases.
Jamie Woodwell, MBA’s VP of CRE Research, reported that 2017
was a record year for borrowing and lending backed by
commercial real estate properties, based on preliminary
numbers, adding the increase was driven by multi‐family lending
along with overall growth in originations for commercial
mortgage‐backed securities (CMBS). He remarked, “Entering
2018, there continues to be strong interest to lend by just about
every major capital source.”
According to the January 2018 Senior Loan Officer Opinion
Survey on Bank Lending Practices, banks reported that lending
standards for CRE loans secured by multi‐family residential
properties tightened while loan standards for non‐farm, non‐
residential properties changed little during 4Q17. Banks also
reported weaker demand for multi‐family and construction/land
development loans during the quarter.
CBRE’s Lending Momentum Index, which tracks loans originated
or brokered by CBRE Capital Markets, fell by 1.2% during 4Q17,
but increased 14.5% in 2017 versus 2016. The report noted that
loan underwriting became slightly more aggressive in 4Q17 as
loan‐to‐value ratios increased while debt yields declined.
Index 2012 2013 2014 2015 2016 2017 2012‐2016
avgEquity REIT 19.7% 2.9% 28.0% 2.8% 8.6% 8.7% 12.4%
NASDAQ 14.6% 12.1% 13.4% 5.7% 8.9% 28.2% 10.9%
S&P 500 15.9% 38.3% 11.4% ‐0.7% 12.0% 19.4% 15.4%
DJIA 13.4% 29.6% 7.5% ‐2.2% 16.5% 25.1% 13.0%
$10$15$20$25$30$35$40$45$50$55$60$65$70$75$80$85$90$95
2007 2008 2009 2010 2011 2012 2013 2014 2015 2016 2017
Average
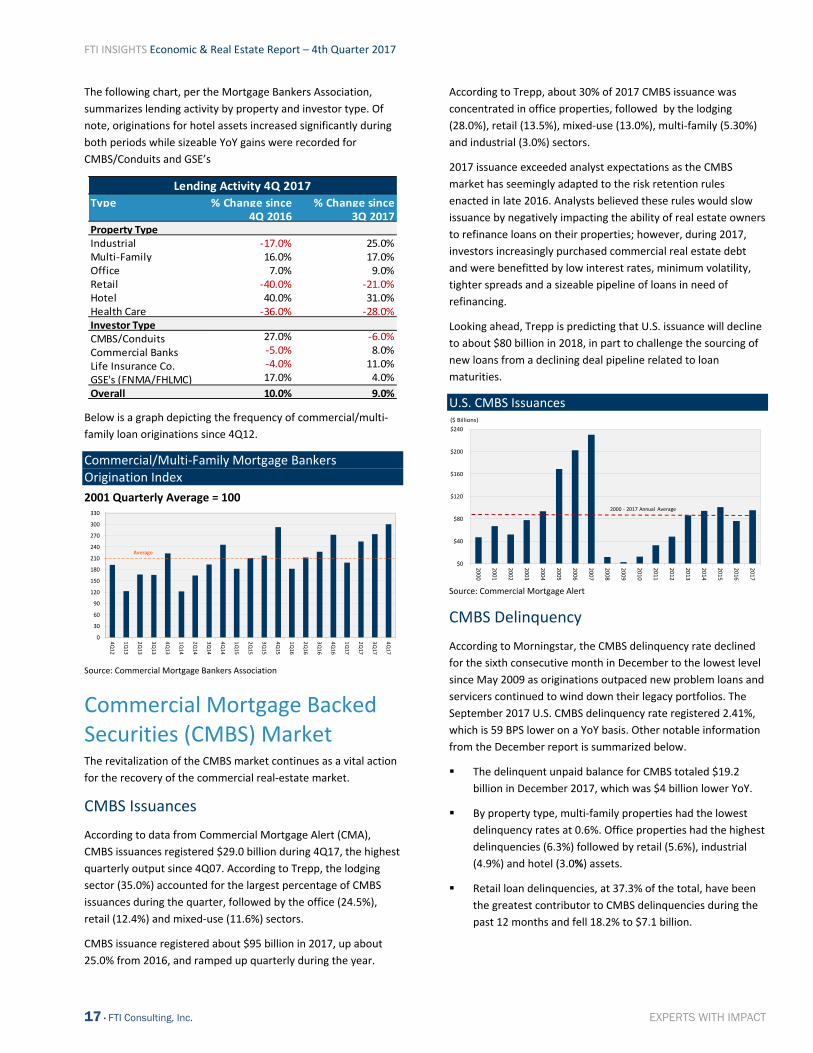
FTI INSIGHTS Economic & Real Estate Report – 4th Quarter 2017
17 · FTI Consulting, Inc. EXPERTS WITH IMPACT
The following chart, per the Mortgage Bankers Association,
summarizes lending activity by property and investor type. Of
note, originations for hotel assets increased significantly during
both periods while sizeable YoY gains were recorded for
CMBS/Conduits and GSE’s
Below is a graph depicting the frequency of commercial/multi‐
family loan originations since 4Q12.
Commercial/Multi‐Family Mortgage Bankers Origination Index
2001 Quarterly Average = 100
Source: Commercial Mortgage Bankers Association
Commercial Mortgage Backed Securities (CMBS) Market The revitalization of the CMBS market continues as a vital action
for the recovery of the commercial real‐estate market.
CMBS Issuances
According to data from Commercial Mortgage Alert (CMA),
CMBS issuances registered $29.0 billion during 4Q17, the highest
quarterly output since 4Q07. According to Trepp, the lodging
sector (35.0%) accounted for the largest percentage of CMBS
issuances during the quarter, followed by the office (24.5%),
retail (12.4%) and mixed‐use (11.6%) sectors.
CMBS issuance registered about $95 billion in 2017, up about
25.0% from 2016, and ramped up quarterly during the year.
According to Trepp, about 30% of 2017 CMBS issuance was
concentrated in office properties, followed by the lodging
(28.0%), retail (13.5%), mixed‐use (13.0%), multi‐family (5.30%)
and industrial (3.0%) sectors.
2017 issuance exceeded analyst expectations as the CMBS
market has seemingly adapted to the risk retention rules
enacted in late 2016. Analysts believed these rules would slow
issuance by negatively impacting the ability of real estate owners
to refinance loans on their properties; however, during 2017,
investors increasingly purchased commercial real estate debt
and were benefitted by low interest rates, minimum volatility,
tighter spreads and a sizeable pipeline of loans in need of
refinancing.
Looking ahead, Trepp is predicting that U.S. issuance will decline
to about $80 billion in 2018, in part to challenge the sourcing of
new loans from a declining deal pipeline related to loan
maturities.
U.S. CMBS Issuances
Source: Commercial Mortgage Alert
CMBS Delinquency
According to Morningstar, the CMBS delinquency rate declined
for the sixth consecutive month in December to the lowest level
since May 2009 as originations outpaced new problem loans and
servicers continued to wind down their legacy portfolios. The
September 2017 U.S. CMBS delinquency rate registered 2.41%,
which is 59 BPS lower on a YoY basis. Other notable information
from the December report is summarized below.
The delinquent unpaid balance for CMBS totaled $19.2
billion in December 2017, which was $4 billion lower YoY.
By property type, multi‐family properties had the lowest
delinquency rates at 0.6%. Office properties had the highest
delinquencies (6.3%) followed by retail (5.6%), industrial
(4.9%) and hotel (3.0%) assets.
Retail loan delinquencies, at 37.3% of the total, have been
the greatest contributor to CMBS delinquencies during the
past 12 months and fell 18.2% to $7.1 billion.
Type % Change since % Change since4Q 2016 3Q 2017
Property Type Industrial ‐17.0% 25.0%Multi‐Family 16.0% 17.0%Office 7.0% 9.0%Retail ‐40.0% ‐21.0%Hotel 40.0% 31.0%Health Care ‐36.0% ‐28.0%Investor TypeCMBS/Conduits 27.0% ‐6.0%
Commercial Banks ‐5.0% 8.0%
Life Insurance Co. ‐4.0% 11.0%
GSE's (FNMA/FHLMC) 17.0% 4.0%
Overall 10.0% 9.0%
Lending Activity 4Q 2017
0
30
60
90
120
150
180
210
240
270
300
330
4Q12
1Q13
2Q13
3Q13
4Q13
1Q14
2Q14
3Q14
4Q14
1Q15
2Q15
3Q15
4Q15
1Q16
2Q16
3Q16
4Q16
1Q17
2Q17
3Q17
4Q17
Average
$0
$40
$80
$120
$160
$200
$240
2000
2001
2002
2003
2004
2005
2006
2007
2008
2009
2010
2011
2012
2013
2014
2015
2016
2017
($ Billions)
2000 ‐ 2017 Annual Average
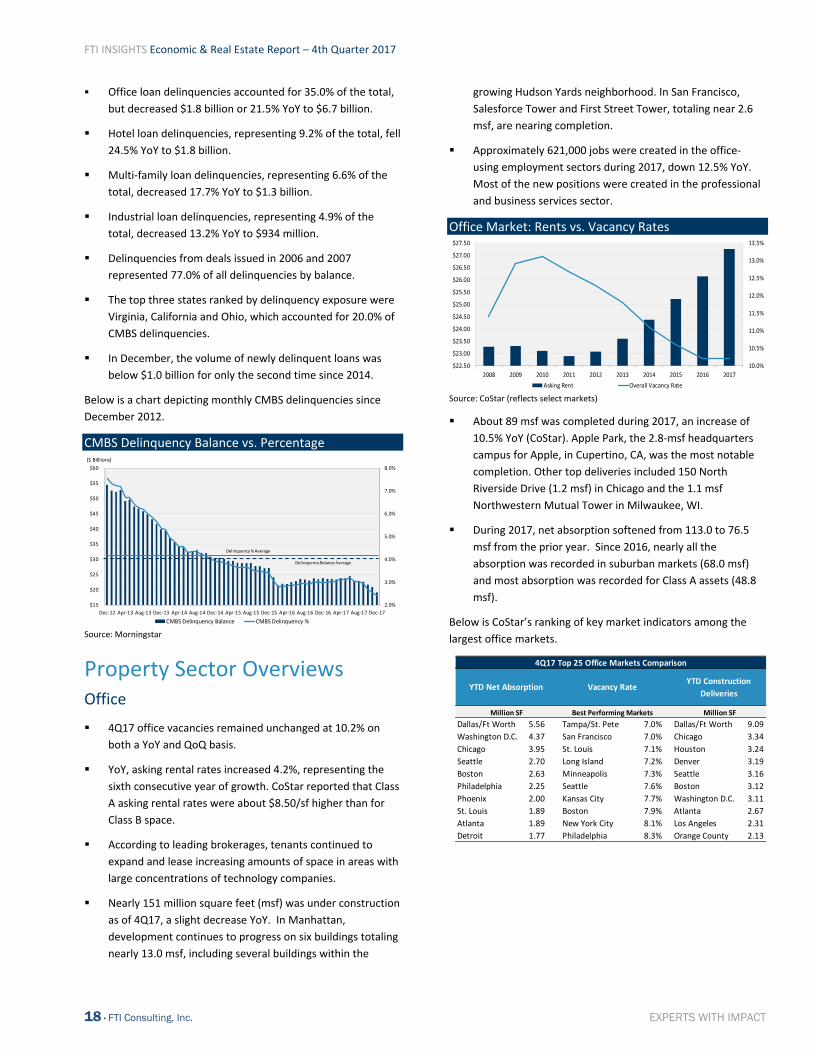
FTI INSIGHTS Economic & Real Estate Report – 4th Quarter 2017
18 · FTI Consulting, Inc. EXPERTS WITH IMPACT
Office loan delinquencies accounted for 35.0% of the total,
but decreased $1.8 billion or 21.5% YoY to $6.7 billion.
Hotel loan delinquencies, representing 9.2% of the total, fell
24.5% YoY to $1.8 billion.
Multi‐family loan delinquencies, representing 6.6% of the
total, decreased 17.7% YoY to $1.3 billion.
Industrial loan delinquencies, representing 4.9% of the
total, decreased 13.2% YoY to $934 million.
Delinquencies from deals issued in 2006 and 2007
represented 77.0% of all delinquencies by balance.
The top three states ranked by delinquency exposure were
Virginia, California and Ohio, which accounted for 20.0% of
CMBS delinquencies.
In December, the volume of newly delinquent loans was
below $1.0 billion for only the second time since 2014.
Below is a chart depicting monthly CMBS delinquencies since
December 2012.
CMBS Delinquency Balance vs. Percentage
Source: Morningstar
Property Sector Overviews Office
4Q17 office vacancies remained unchanged at 10.2% on
both a YoY and QoQ basis.
YoY, asking rental rates increased 4.2%, representing the
sixth consecutive year of growth. CoStar reported that Class
A asking rental rates were about $8.50/sf higher than for
Class B space.
According to leading brokerages, tenants continued to
expand and lease increasing amounts of space in areas with
large concentrations of technology companies.
Nearly 151 million square feet (msf) was under construction
as of 4Q17, a slight decrease YoY. In Manhattan,
development continues to progress on six buildings totaling
nearly 13.0 msf, including several buildings within the
growing Hudson Yards neighborhood. In San Francisco,
Salesforce Tower and First Street Tower, totaling near 2.6
msf, are nearing completion.
Approximately 621,000 jobs were created in the office‐
using employment sectors during 2017, down 12.5% YoY.
Most of the new positions were created in the professional
and business services sector.
Office Market: Rents vs. Vacancy Rates
Source: CoStar (reflects select markets)
About 89 msf was completed during 2017, an increase of
10.5% YoY (CoStar). Apple Park, the 2.8‐msf headquarters
campus for Apple, in Cupertino, CA, was the most notable
completion. Other top deliveries included 150 North
Riverside Drive (1.2 msf) in Chicago and the 1.1 msf
Northwestern Mutual Tower in Milwaukee, WI.
During 2017, net absorption softened from 113.0 to 76.5
msf from the prior year. Since 2016, nearly all the
absorption was recorded in suburban markets (68.0 msf)
and most absorption was recorded for Class A assets (48.8
msf).
Below is CoStar’s ranking of key market indicators among the
largest office markets.
2.0%
3.0%
4.0%
5.0%
6.0%
7.0%
8.0%
$15
$20
$25
$30
$35
$40
$45
$50
$55
$60
Dec‐12 Apr‐13 Aug‐13 Dec‐13 Apr‐14 Aug‐14 Dec‐14 Apr‐15 Aug‐15 Dec‐15 Apr‐16 Aug‐16 Dec‐16 Apr‐17 Aug‐17 Dec‐17
($ Billiions)
CMBS Delinquency Balance CMBS Delinquency %
Delinquency Balance Average
Delinquency % Average
10.0%
10.5%
11.0%
11.5%
12.0%
12.5%
13.0%
13.5%
$22.50
$23.00
$23.50
$24.00
$24.50
$25.00
$25.50
$26.00
$26.50
$27.00
$27.50
2008 2009 2010 2011 2012 2013 2014 2015 2016 2017
Asking Rent Overall Vacancy Rate
Dallas/Ft Worth 5.56 Tampa/St. Pete 7.0% Dallas/Ft Worth 9.09
Washington D.C. 4.37 San Francisco 7.0% Chicago 3.34
Chicago 3.95 St. Louis 7.1% Houston 3.24
Seattle 2.70 Long Island 7.2% Denver 3.19
Boston 2.63 Minneapolis 7.3% Seattle 3.16
Philadelphia 2.25 Seattle 7.6% Boston 3.12
Phoenix 2.00 Kansas City 7.7% Washington D.C. 3.11
St. Louis 1.89 Boston 7.9% Atlanta 2.67
Atlanta 1.89 New York City 8.1% Los Angeles 2.31
Detroit 1.77 Philadelphia 8.3% Orange County 2.13
4Q17 Top 25 Office Markets Comparison
Best Performing Markets
Vacancy Rate
Million SF
YTD Net AbsorptionYTD Construction
Deliveries
Million SF
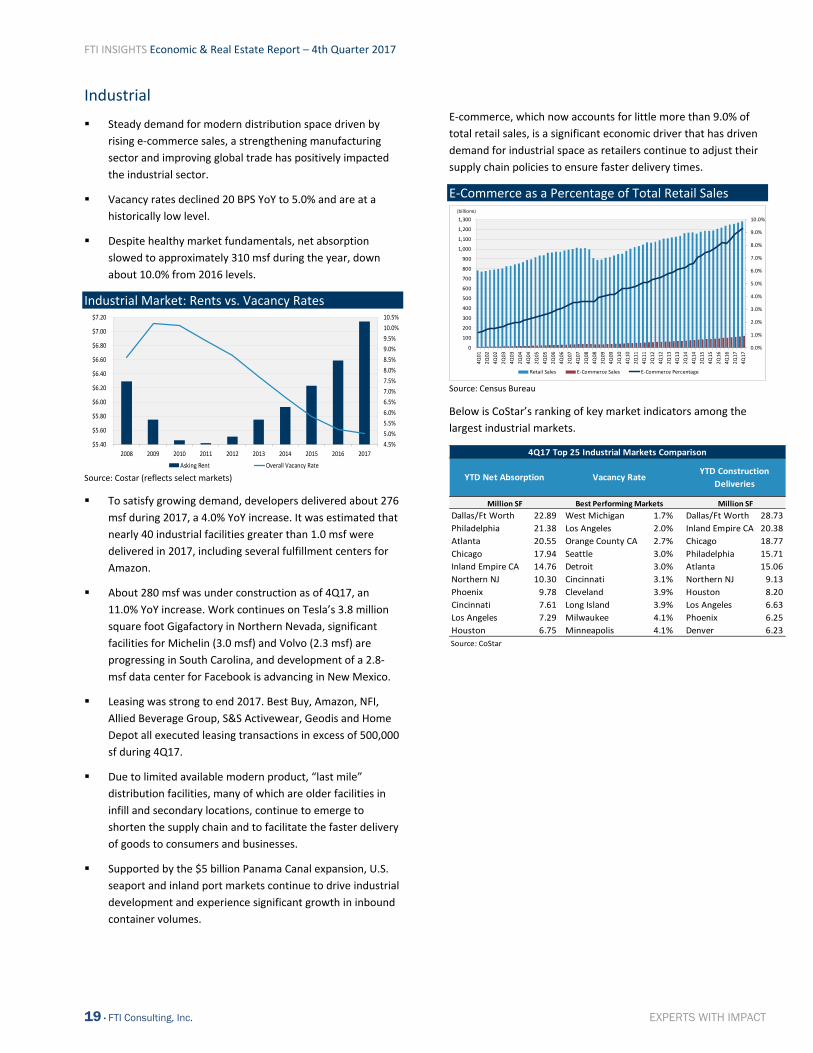
FTI INSIGHTS Economic & Real Estate Report – 4th Quarter 2017
19 · FTI Consulting, Inc. EXPERTS WITH IMPACT
Industrial
Steady demand for modern distribution space driven by
rising e‐commerce sales, a strengthening manufacturing
sector and improving global trade has positively impacted
the industrial sector.
Vacancy rates declined 20 BPS YoY to 5.0% and are at a
historically low level.
Despite healthy market fundamentals, net absorption
slowed to approximately 310 msf during the year, down
about 10.0% from 2016 levels.
Industrial Market: Rents vs. Vacancy Rates
Source: Costar (reflects select markets)
To satisfy growing demand, developers delivered about 276
msf during 2017, a 4.0% YoY increase. It was estimated that
nearly 40 industrial facilities greater than 1.0 msf were
delivered in 2017, including several fulfillment centers for
Amazon.
About 280 msf was under construction as of 4Q17, an
11.0% YoY increase. Work continues on Tesla’s 3.8 million
square foot Gigafactory in Northern Nevada, significant
facilities for Michelin (3.0 msf) and Volvo (2.3 msf) are
progressing in South Carolina, and development of a 2.8‐
msf data center for Facebook is advancing in New Mexico.
Leasing was strong to end 2017. Best Buy, Amazon, NFI,
Allied Beverage Group, S&S Activewear, Geodis and Home
Depot all executed leasing transactions in excess of 500,000
sf during 4Q17.
Due to limited available modern product, “last mile”
distribution facilities, many of which are older facilities in
infill and secondary locations, continue to emerge to
shorten the supply chain and to facilitate the faster delivery
of goods to consumers and businesses.
Supported by the $5 billion Panama Canal expansion, U.S.
seaport and inland port markets continue to drive industrial
development and experience significant growth in inbound
container volumes.
E‐commerce, which now accounts for little more than 9.0% of
total retail sales, is a significant economic driver that has driven
demand for industrial space as retailers continue to adjust their
supply chain policies to ensure faster delivery times.
E‐Commerce as a Percentage of Total Retail Sales
Source: Census Bureau
Below is CoStar’s ranking of key market indicators among the
largest industrial markets.
4.5%
5.0%
5.5%
6.0%
6.5%
7.0%
7.5%
8.0%
8.5%
9.0%
9.5%
10.0%
10.5%
$5.40
$5.60
$5.80
$6.00
$6.20
$6.40
$6.60
$6.80
$7.00
$7.20
2008 2009 2010 2011 2012 2013 2014 2015 2016 2017
Asking Rent Overall Vacancy Rate
0.0%
1.0%
2.0%
3.0%
4.0%
5.0%
6.0%
7.0%
8.0%
9.0%
10.0%
0
100
200
300
400
500
600
700
800
900
1,000
1,100
1,200
1,300
4Q01
2Q02
4Q02
2Q03
4Q03
2Q04
4Q04
2Q05
4Q05
2Q06
4Q06
2Q07
4Q07
2Q08
4Q08
2Q09
4Q09
2Q10
4Q10
2Q11
4Q11
2Q12
4Q12
2Q13
4Q13
2Q14
4Q14
2Q15
4Q15
2Q16
4Q16
2Q17
4Q17
(billions)
Retail Sales E‐Commerce Sales E‐Commerce Percentage
Dallas/Ft Worth 22.89 West Michigan 1.7% Dallas/Ft Worth 28.73
Philadelphia 21.38 Los Angeles 2.0% Inland Empire CA 20.38
Atlanta 20.55 Orange County CA 2.7% Chicago 18.77
Chicago 17.94 Seattle 3.0% Philadelphia 15.71
Inland Empire CA 14.76 Detroit 3.0% Atlanta 15.06
Northern NJ 10.30 Cincinnati 3.1% Northern NJ 9.13
Phoenix 9.78 Cleveland 3.9% Houston 8.20
Cincinnati 7.61 Long Island 3.9% Los Angeles 6.63
Los Angeles 7.29 Milwaukee 4.1% Phoenix 6.25
Houston 6.75 Minneapolis 4.1% Denver 6.23
Source: CoStar
Million SF Best Performing Markets Million SF
YTD Net Absorption Vacancy RateYTD Construction
Deliveries
4Q17 Top 25 Industrial Markets Comparison
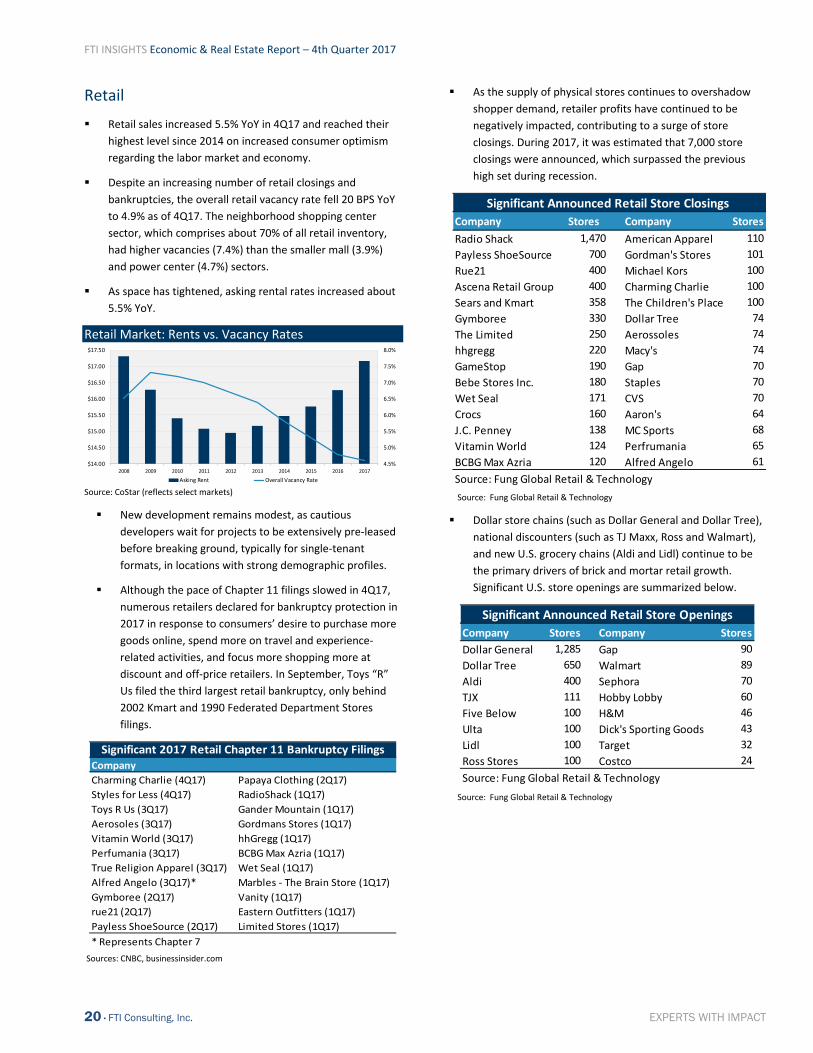
FTI INSIGHTS Economic & Real Estate Report – 4th Quarter 2017
20 · FTI Consulting, Inc. EXPERTS WITH IMPACT
Retail
Retail sales increased 5.5% YoY in 4Q17 and reached their
highest level since 2014 on increased consumer optimism
regarding the labor market and economy.
Despite an increasing number of retail closings and
bankruptcies, the overall retail vacancy rate fell 20 BPS YoY
to 4.9% as of 4Q17. The neighborhood shopping center
sector, which comprises about 70% of all retail inventory,
had higher vacancies (7.4%) than the smaller mall (3.9%)
and power center (4.7%) sectors.
As space has tightened, asking rental rates increased about
5.5% YoY.
Retail Market: Rents vs. Vacancy Rates
Source: CoStar (reflects select markets)
New development remains modest, as cautious
developers wait for projects to be extensively pre‐leased
before breaking ground, typically for single‐tenant
formats, in locations with strong demographic profiles.
Although the pace of Chapter 11 filings slowed in 4Q17,
numerous retailers declared for bankruptcy protection in
2017 in response to consumers’ desire to purchase more
goods online, spend more on travel and experience‐
related activities, and focus more shopping more at
discount and off‐price retailers. In September, Toys “R”
Us filed the third largest retail bankruptcy, only behind
2002 Kmart and 1990 Federated Department Stores
filings.
Sources: CNBC, businessinsider.com
As the supply of physical stores continues to overshadow
shopper demand, retailer profits have continued to be
negatively impacted, contributing to a surge of store
closings. During 2017, it was estimated that 7,000 store
closings were announced, which surpassed the previous
high set during recession.
Source: Fung Global Retail & Technology
Dollar store chains (such as Dollar General and Dollar Tree),
national discounters (such as TJ Maxx, Ross and Walmart),
and new U.S. grocery chains (Aldi and Lidl) continue to be
the primary drivers of brick and mortar retail growth.
Significant U.S. store openings are summarized below.
Source: Fung Global Retail & Technology
4.5%
5.0%
5.5%
6.0%
6.5%
7.0%
7.5%
8.0%
$14.00
$14.50
$15.00
$15.50
$16.00
$16.50
$17.00
$17.50
2008 2009 2010 2011 2012 2013 2014 2015 2016 2017
Asking Rent Overall Vacancy Rate
Company
Charming Charlie (4Q17) Papaya Clothing (2Q17)
Styles for Less (4Q17) RadioShack (1Q17)
Toys R Us (3Q17) Gander Mountain (1Q17)
Aerosoles (3Q17) Gordmans Stores (1Q17)
Vitamin World (3Q17) hhGregg (1Q17)
Perfumania (3Q17) BCBG Max Azria (1Q17)
True Religion Apparel (3Q17) Wet Seal (1Q17)
Alfred Angelo (3Q17)* Marbles ‐ The Brain Store (1Q17)
Gymboree (2Q17) Vanity (1Q17)
rue21 (2Q17) Eastern Outfitters (1Q17)
Payless ShoeSource (2Q17) Limited Stores (1Q17)
* Represents Chapter 7
Significant 2017 Retail Chapter 11 Bankruptcy Filings
Company Stores Company Stores
Radio Shack 1,470 American Apparel 110
Payless ShoeSource 700 Gordman's Stores 101
Rue21 400 Michael Kors 100
Ascena Retail Group 400 Charming Charlie 100
Sears and Kmart 358 The Children's Place 100
Gymboree 330 Dollar Tree 74
The Limited 250 Aerossoles 74
hhgregg 220 Macy's 74
GameStop 190 Gap 70
Bebe Stores Inc. 180 Staples 70
Wet Seal 171 CVS 70
Crocs 160 Aaron's 64
J.C. Penney 138 MC Sports 68
Vitamin World 124 Perfrumania 65
BCBG Max Azria 120 Alfred Angelo 61
Source: Fung Global Retail & Technology
Significant Announced Retail Store Closings
Company Stores Company Stores
Dollar General 1,285 Gap 90
Dollar Tree 650 Walmart 89
Aldi 400 Sephora 70
TJX 111 Hobby Lobby 60
Five Below 100 H&M 46
Ulta 100 Dick's Sporting Goods 43
Lidl 100 Target 32
Ross Stores 100 Costco 24
Source: Fung Global Retail & Technology
Significant Announced Retail Store Openings
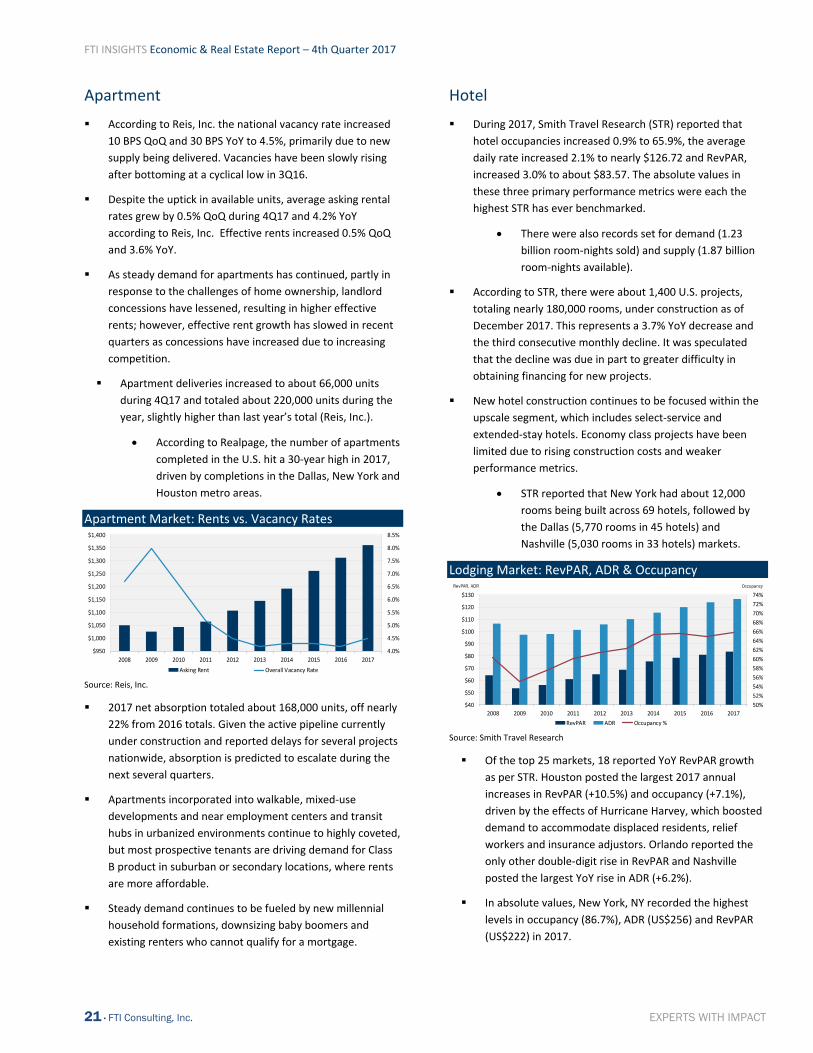
FTI INSIGHTS Economic & Real Estate Report – 4th Quarter 2017
21 · FTI Consulting, Inc. EXPERTS WITH IMPACT
Apartment
According to Reis, Inc. the national vacancy rate increased
10 BPS QoQ and 30 BPS YoY to 4.5%, primarily due to new
supply being delivered. Vacancies have been slowly rising
after bottoming at a cyclical low in 3Q16.
Despite the uptick in available units, average asking rental
rates grew by 0.5% QoQ during 4Q17 and 4.2% YoY
according to Reis, Inc. Effective rents increased 0.5% QoQ
and 3.6% YoY.
As steady demand for apartments has continued, partly in
response to the challenges of home ownership, landlord
concessions have lessened, resulting in higher effective
rents; however, effective rent growth has slowed in recent
quarters as concessions have increased due to increasing
competition.
Apartment deliveries increased to about 66,000 units
during 4Q17 and totaled about 220,000 units during the
year, slightly higher than last year’s total (Reis, Inc.).
According to Realpage, the number of apartments
completed in the U.S. hit a 30‐year high in 2017,
driven by completions in the Dallas, New York and
Houston metro areas.
Apartment Market: Rents vs. Vacancy Rates
Source: Reis, Inc.
2017 net absorption totaled about 168,000 units, off nearly
22% from 2016 totals. Given the active pipeline currently
under construction and reported delays for several projects
nationwide, absorption is predicted to escalate during the
next several quarters.
Apartments incorporated into walkable, mixed‐use
developments and near employment centers and transit
hubs in urbanized environments continue to highly coveted,
but most prospective tenants are driving demand for Class
B product in suburban or secondary locations, where rents
are more affordable.
Steady demand continues to be fueled by new millennial
household formations, downsizing baby boomers and
existing renters who cannot qualify for a mortgage.
Hotel
During 2017, Smith Travel Research (STR) reported that
hotel occupancies increased 0.9% to 65.9%, the average
daily rate increased 2.1% to nearly $126.72 and RevPAR,
increased 3.0% to about $83.57. The absolute values in
these three primary performance metrics were each the
highest STR has ever benchmarked.
There were also records set for demand (1.23
billion room‐nights sold) and supply (1.87 billion
room‐nights available).
According to STR, there were about 1,400 U.S. projects,
totaling nearly 180,000 rooms, under construction as of
December 2017. This represents a 3.7% YoY decrease and
the third consecutive monthly decline. It was speculated
that the decline was due in part to greater difficulty in
obtaining financing for new projects.
New hotel construction continues to be focused within the
upscale segment, which includes select‐service and
extended‐stay hotels. Economy class projects have been
limited due to rising construction costs and weaker
performance metrics.
STR reported that New York had about 12,000
rooms being built across 69 hotels, followed by
the Dallas (5,770 rooms in 45 hotels) and
Nashville (5,030 rooms in 33 hotels) markets.
Lodging Market: RevPAR, ADR & Occupancy
Source: Smith Travel Research
Of the top 25 markets, 18 reported YoY RevPAR growth
as per STR. Houston posted the largest 2017 annual
increases in RevPAR (+10.5%) and occupancy (+7.1%),
driven by the effects of Hurricane Harvey, which boosted
demand to accommodate displaced residents, relief
workers and insurance adjustors. Orlando reported the
only other double‐digit rise in RevPAR and Nashville
posted the largest YoY rise in ADR (+6.2%).
In absolute values, New York, NY recorded the highest
levels in occupancy (86.7%), ADR (US$256) and RevPAR
(US$222) in 2017.
4.0%
4.5%
5.0%
5.5%
6.0%
6.5%
7.0%
7.5%
8.0%
8.5%
$950
$1,000
$1,050
$1,100
$1,150
$1,200
$1,250
$1,300
$1,350
$1,400
2008 2009 2010 2011 2012 2013 2014 2015 2016 2017
Asking Rent Overall Vacancy Rate
50%
52%
54%
56%
58%
60%
62%
64%
66%
68%
70%
72%
74%
$40
$50
$60
$70
$80
$90
$100
$110
$120
$130
2008 2009 2010 2011 2012 2013 2014 2015 2016 2017
OccupancyRevPAR, ADR
RevPAR ADR Occupancy %
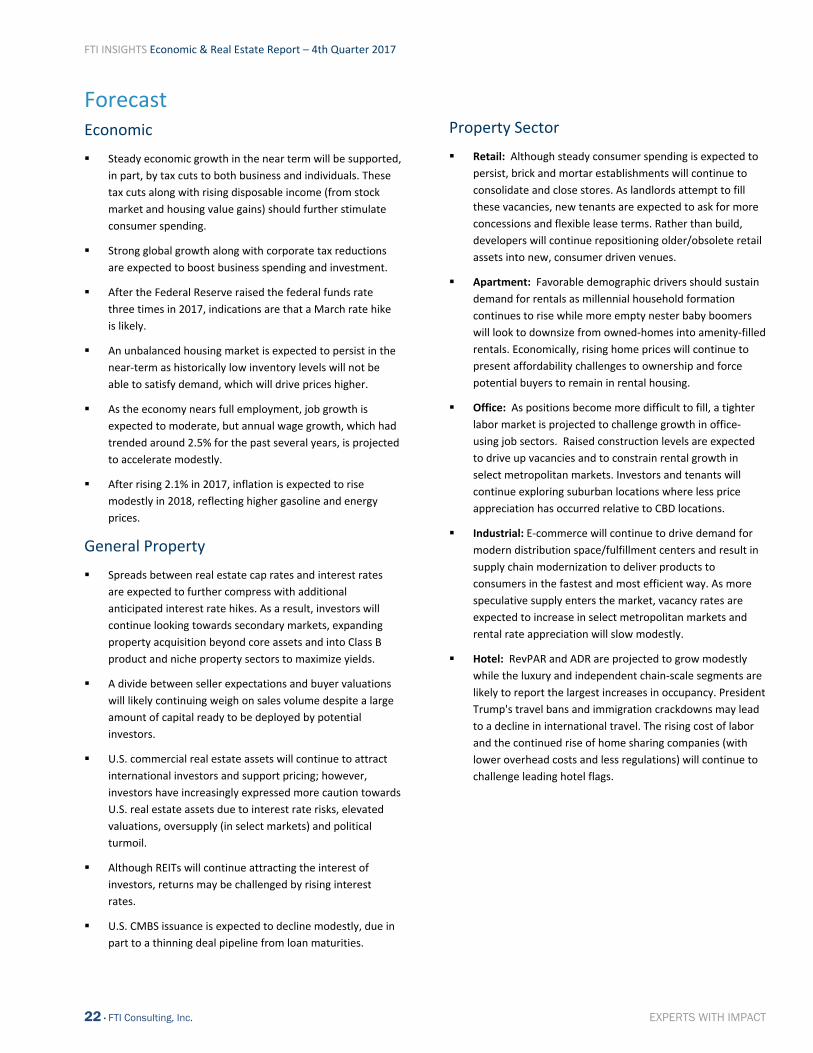
FTI INSIGHTS Economic & Real Estate Report – 4th Quarter 2017
22 · FTI Consulting, Inc. EXPERTS WITH IMPACT
Forecast Economic
Steady economic growth in the near term will be supported,
in part, by tax cuts to both business and individuals. These
tax cuts along with rising disposable income (from stock
market and housing value gains) should further stimulate
consumer spending.
Strong global growth along with corporate tax reductions
are expected to boost business spending and investment.
After the Federal Reserve raised the federal funds rate
three times in 2017, indications are that a March rate hike
is likely.
An unbalanced housing market is expected to persist in the
near‐term as historically low inventory levels will not be
able to satisfy demand, which will drive prices higher.
As the economy nears full employment, job growth is
expected to moderate, but annual wage growth, which had
trended around 2.5% for the past several years, is projected
to accelerate modestly.
After rising 2.1% in 2017, inflation is expected to rise
modestly in 2018, reflecting higher gasoline and energy
prices.
General Property
Spreads between real estate cap rates and interest rates
are expected to further compress with additional
anticipated interest rate hikes. As a result, investors will
continue looking towards secondary markets, expanding
property acquisition beyond core assets and into Class B
product and niche property sectors to maximize yields.
A divide between seller expectations and buyer valuations
will likely continuing weigh on sales volume despite a large
amount of capital ready to be deployed by potential
investors.
U.S. commercial real estate assets will continue to attract
international investors and support pricing; however,
investors have increasingly expressed more caution towards
U.S. real estate assets due to interest rate risks, elevated
valuations, oversupply (in select markets) and political
turmoil.
Although REITs will continue attracting the interest of
investors, returns may be challenged by rising interest
rates.
U.S. CMBS issuance is expected to decline modestly, due in
part to a thinning deal pipeline from loan maturities.
Property Sector
Retail: Although steady consumer spending is expected to
persist, brick and mortar establishments will continue to
consolidate and close stores. As landlords attempt to fill
these vacancies, new tenants are expected to ask for more
concessions and flexible lease terms. Rather than build,
developers will continue repositioning older/obsolete retail
assets into new, consumer driven venues.
Apartment: Favorable demographic drivers should sustain
demand for rentals as millennial household formation
continues to rise while more empty nester baby boomers
will look to downsize from owned‐homes into amenity‐filled
rentals. Economically, rising home prices will continue to
present affordability challenges to ownership and force
potential buyers to remain in rental housing.
Office: As positions become more difficult to fill, a tighter
labor market is projected to challenge growth in office‐
using job sectors. Raised construction levels are expected
to drive up vacancies and to constrain rental growth in
select metropolitan markets. Investors and tenants will
continue exploring suburban locations where less price
appreciation has occurred relative to CBD locations.
Industrial: E‐commerce will continue to drive demand for
modern distribution space/fulfillment centers and result in
supply chain modernization to deliver products to
consumers in the fastest and most efficient way. As more
speculative supply enters the market, vacancy rates are
expected to increase in select metropolitan markets and
rental rate appreciation will slow modestly.
Hotel: RevPAR and ADR are projected to grow modestly
while the luxury and independent chain‐scale segments are
likely to report the largest increases in occupancy. President
Trump's travel bans and immigration crackdowns may lead
to a decline in international travel. The rising cost of labor
and the continued rise of home sharing companies (with
lower overhead costs and less regulations) will continue to
challenge leading hotel flags.
FTI INSIGHTS Economic & Real Estate Report –4th Quarter 2017
EXPERTS WITH IMPACTTM About FTI Consulting
FTI Consulting is an independent global business advisory firm dedicated to helping organizations manage change, mitigate risk and
resolve disputes: financial, legal, operational, political & regulatory, reputational and transactional. FTI Consulting professionals,
located in all major business centers throughout the world, work closely with clients to anticipate, illuminate and overcome complex
business challenges and opportunities. For more information, visit www.fticonsulting.com and connect with us on Twitter (@FTI
Consulting), Facebook and LinkedIn.
www.fticonsulting.com
©2018 FTI Consulting, Inc. All rights reserved.
Marc R. Shapiro
+1 973 852 8154
Mark E. Field
+1 973 852 8157
Real Estate and Infrastructure Every real estate client or stakeholder has unique objectives,
constraints, operational circumstances and economic realities.
The FTI Consulting Real Estate and Infrastructure group has the
deep bench of expertise and experience to help real estate
owners, users, investors and lenders better navigate the
market’s complexities and manage the inherent risks in this
climate. For more than three decades clients have relied on our
creative and sound business solutions to turn these complexities
into opportunities.
As unbiased and independent advisors, we represent leading
public and private real estate entities and stakeholders including
REITs, financial institutions, investment banks, opportunity
funds, insurance companies, hedge funds, pension advisors and
owners/developers to align strategy with business goals.
Our innovative and results‐driven strategy and superior
execution are supported by authoritative, state‐of‐the‐art
financial and tax analyses developed by some of the industry’s
foremost experts.
We offer a comprehensive integrated suite of services:
STRATEGIC ADVISORY, TRANSACTION DUE DILIGENCE & MANAGEMENT
Valuations
Transaction Strategy, Due Diligence and Management
Debt/REO Acquisitions and Dispositions
Operations Optimization
Portfolio Optimization
Development Advisory
Lease Consulting
Site Selection and Incentive Negotiation
Construction Project Management
LITIGATION SUPPORT
Expert Testimony
Investigations and Forensic Accounting
Dispute Advisory Services
REAL ESTATE CAPITAL MARKETS
Capital Markets Advisory
Investment Sales
Debt/ Equity Placement, Joint Ventures, and Investment
Programs
Merger & Acquisition Advisory
RESTRUCTURING SERVICES
Company‐Owner Advisory
Interim Management Services
Secured Lender and Special Servicer Advisory
Unsecured Creditors/Committees Advisory
Trustee‐Receiver Services
Opportunistic Investor Services
§363 Asset Sales
Bankruptcy Administration & Reporting
TAX ADVISORY
Tax Structuring, Consulting and Compliance
State and Local Tax Consulting
Cost Segregation
Tax Strategy and Planning Related to Bankruptcy and
Financial Restructuring
Private Client Advisory
SPECIAL FOCUS AREAS
Residential and Commercial Mortgage Backed Securities
Hospitality, Gaming and Leisure
Outsourced Accounting and Financial Reporting
Executive Compensation and Corporate Governance
The views expressed herein are those of the authors and are not necessarily the views of FTI Consulting, Inc., its management, its subsidiaries, affiliates or other professionals
FTI Consulting, Inc., including its subsidiaries and affiliates, is a consulting firm and is not a certified public accounting firm or a law firm.