Embed Size (px)
Citation preview
Working Paper No. 238Economic Reforms, Financial Development and Growth:
Lessons from the Chilean Experience* **
by
Leonardo Hernández †
Fernando Parro ‡
January 2005
* Paper prepared for presentation at the 2004 SCID Conference, Latin American Financial Systems and TheChallenge of Economic Growth, Stanford, November 11-13, 2004. We are grateful to conferenceparticipants, especially Fernando Navajas, for helpful comments on a preliminary version of the paper.
** The views expressed in this paper are those of the authors and cannot be attributed to the Central Bank ofChile or its Board of Directors. This paper is an extension of previous work with Vittorio Corbo (seeCorbo, Hernández and Parro, 2004).
† Principal Economic Advisor to the Governor. Email [email protected].‡ Economist, Research Department. Email [email protected].
Stanford University John A. and Cynthia Fry Gunn Building
366 Galvez Street | Stanford, CA | 94305-6015

-i-
Table of Contents
I. Introduction ......................................................................................................................... 1
II. Economic Reform in Latin America: Where Do We Stand?............................................. 4
III. Latin America’s Economic and Social Performance........................................................ 6
IV. The Reform Process and Its Results: An Assessment...................................................... 7
V. Why is Chile Different?..................................................................................................... 9
V.1 First Stage: The First Generation Reforms................................................................. 11
V.2 Second Stage: The Deepening and Institutionalization of Reforms........................... 14
VI. Deepening the Reforms: What is at Stake? .................................................................... 16
VI.1 Explaining Economic Growth and Volatility ........................................................... 17
VI.2 Explaining Financial Development........................................................................... 21
VII. The Challenge Ahead for Latin American Economies: Lessons from Chile................ 24
VIII. Summary and Conclusions .......................................................................................... 27
References ............................................................................................................................ 29
Tables and Figures................................................................................................................ 32
Appendix .............................................................................................................................. 51
-1-
Economic Reforms, Financial Development and Growth:Lessons from the Chilean Experience* **
Leonardo Hernández † and Fernando Parro ‡
I. Introduction
Latin American countries grew steadily at about 5% per year in the three decadesafter World War II. But this process did not last long as it was interrupted by the debt crisisof the early 1980s, during which most countries in the region went into recession (table 1).The crisis brought to the surface the structural problems, both macro and micro, existing inmost Latin American economies. Consequently, almost every country in the region spentthe rest of the decade revising and amending their policies and implementing reformsaimed at changing the development model followed until then.
Following the debt crisis, the old import-substitution cum government interventionmodel began to be replaced by market-oriented economies where resource allocation was tobe driven mainly by private initiative and market forces. Thus, during the second part of the1980s –the so-called lost decade–, Latin American countries, one after another, begandismantling tariffs and other trade barriers, reducing fiscal deficits, fighting inflation,liberalizing prices and interest rates, lifting credit restrictions, privatizing state ownedenterprises, and reducing government intervention in the economy. The aim was to achievegreater integration with the rest of the world, both in goods & services and in financialflows. In the new development model the government was supposed to play acomplementary role and focus its attention only on the provision of public goods and theinstitutional build up –e.g. public safety, legal system, regulatory and supervisoryframework– and provide basic services to the poor –health care and education.Expectations were that by adopting the new model and implementing the policiesrecommended by the International Financial Institutions —the so wrongly calledWashington Consensus (Williamson, 2003)— countries would start growing again on asustained basis. Social indicators would improve across the board and income inequalitywould be reduced.
After a decade of reforms, economic growth resumed, but the overall outcome fellshort of expectations: average growth during the 1990s, for the region as a whole, attained3.3% and has since remained below the average of the three decades after WW II. Further,the region was not immune to crises (Mexico 1994-95, Ecuador 1999, Argentina 2001) andwas also adversely affected by the 1997-98 financial turmoil. In addition, although there * Paper prepared for presentation at the 2004 SCID Conference, Latin American Financial Systems and The
Challenge of Economic Growth, Stanford, November 11-13, 2004. We are grateful to conferenceparticipants, especially Fernando Navajas, for helpful comments on a preliminary version of the paper.
** The views expressed in this paper are those of the authors and cannot be attributed to the Central Bank ofChile or its Board of Directors. This paper is an extension of previous work with Vittorio Corbo (seeCorbo, Hernández and Parro, 2004).
† Principal Economic Advisor to the Governor, Central Bank of Chile; email [email protected].‡ Economist, Research Department, Central Bank of Chile; email [email protected].
-2-
was an improvement in social indicators like literacy or infant mortality, the drop inpoverty was very marginal, and the per capita income gap with industrial countriesbroadened in most countries. These results have been the cause of disillusionment with, andthe so-called fatigue of the reform process.
The exception to all of the above was Chile. The country not only grew steadilyduring thirteen years after the debt crisis at a much higher rate than in previous decades —annual growth during 1985-97 averaged 7.3%—, but it was less affected by the turmoil ofthe late 1990s. And although growth averaged only 2.6% during 1998-2003, it is expectedto return to the 5%-6% range in 2004-2005. In addition, during the 1990s the inflation ratefell to single digits, social indicators –except for income distribution– improvedsignificantly (poverty fell by as much as 16 percentage points) and the per capita incomegap with industrial countries was reduced by about 30%.
The contrasting experience of Chile vis-a-vis the rest of the region has not goneunnoticed. In fact, many researchers and policymakers have searched for explanations and,in the process, pointed out to specific factors that distinguish Chile from the rest of theregion. Potential candidates among these factors include the depth and extent of the reformprocess –Chile started its reform in the mid-1970s, about a decade earlier than Mexico, thesecond country to begin reforms. The pension system reform of the early 1980s has alsobeen singled out as an explanation as it provides a large savings base and reduces thecountry’s dependency on foreign savings to finance investment. And some have argued thatcapital controls played a role –especially the so-called encaje (unremunerated reserverequirement)– during the 1990s, when private flows returned to the region, because theyreduced the country’s dependency on short-term and volatile flows, thus making it lessprone to capital flight and contagion effects.
Although all the factors above have most likely played a role, there is at least onecomplementary explanation for the difference between the economic performance of Chileand other Latin American countries. This is based on the most recent literature on economicgrowth that suggests that the ultimate cause of a country’s growth lies on the quality of itsinstitutions. Better institutions –property rights protection, governance, lack of corruptionand bureaucracy, rule of law, and the like– lead to the design of better policies and,therefore, allow countries to attain faster economic growth. Thus, the argument follows,Chile has been able to grow faster than other Latin American countries since the mid-1980s, although facing the same external environment and shocks, mainly thanks to itsbetter institutions.
This paper attempts to evaluate the statement above. That is, we try to find anexplanation for Chile’s different performance since the mid-1980s, with a focus onquantifying –to the extent possible by data availability– the contribution of differentfactors. We find that, as expected, both policies and the quality of the country’s institutionsinfluenced the outcome in terms of growth. However, the two sets of factors differ in theirrelative contribution. For instance, our results show that the higher economic growth ofEast Asia during the 1990s is explained mainly by the better economic policies pursued bythat region. More precisely, using our econometric model to predict the in-sample annualper-capita GDP growth, we find that about 75% of the faster economic growth in East Asiavis-a-vis Latin America is due to better policies and only 25% to better institutions. Incontrast, better policies and better institutions explain Chile’s better performance during the
-3-
1990s, vis-à-vis Latin America, in almost equal shares. The model predicts that during the1990s per-capita GDP in Chile grew annually by about 2.4% more than in the rest of LatinAmerica, and about half of it is explained by better policies and half by better institutions.With regards to economic policies, we find that keeping an overvalued real exchange rate isconsistently detrimental to growth. In addition, the reforms to the pension system in 1981and to the banking sector in 1986 were critical to foster the development of the financialsector and thus contributed to accelerate growth in Chile.
This paper is an attempt to put together the conclusions of two branches of theliterature, one that studies and draw policy lessons from the reform process in LatinAmerica (IDB 1997, Lora 2001; Fernandez-Arias and Montiel 1997), and another that triesto explain economic growth using large data sets, in either a cross sectional or panelframework, which lately has emphasized the role of institutions (Acemoglu et al., 2001;Rodrik et al., 2002; Easterly and Levine, 2003). Using Chile as a counterfactual, we areable to quantify the benefits –in terms of increased economic growth– to be reaped-off byother Latin American countries of adopting better policies and improving the quality oftheir institutions.
At least two policy conclusions emerge from our analysis. First, countries that arebehind in the reform process compared to, say, Chile or Mexico that started earlier, canbenefit and attain higher economic growth if they continue making progress in the so-calledfirst generation reforms. Second, beyond economic reforms, countries would benefit byimproving their institutions, which by nature are much more persistent but, nevertheless,can be changed, as countries are not condemned to live with the institutions inherited fromprevious generations. This means that countries should not cease in their efforts to reformtheir institutional setup, even though the benefits materialize much later than in the case ofeconomic policies, because the payoff is quite large. Institutional buildup should be acontinuos effort, like it has been in Chile that for over three decades has been reforming itsinstitutions and continues doing so. In fact, several reforms affecting the judiciary system,the electoral system and other institutions —some of which even require amendments to thecountry’s Constitution— are underway at the time of writing.
The rest of the paper is organized as follows. Section II briefly describes the reformprocess in Latin America in the past 25 years, highlighting the areas where most and leastprogress has been made. Section III summarizes the economic and social performance ofLatin American economies since World War II. By going over a set of economic and socialindicators, this section establishes that Chile performed relatively well compared to othercountries in almost every dimension, except for income distribution. Based on previouswork by others, section IV evaluates the reforms implemented in the region, that is, itprovides an overall assessment of what did and did not work. Section V looks into Chile’sreforms in greater detail. It advances an explanation of Chile’s better performance byanalyzing in detail the existing differences in both policies and quality of institutionsbetween Chile and the rest of the region. Next, section VI quantifies the relativecontribution to economic growth of each set of factors –policies and quality of institutions.In this section we examine the role played by specific reforms and policies in fosteringfinancial development and growth, in particular the pension reform, the banking sectorreform and the reduction of inflation. By explaining economic growth on a quantitativebasis, this section provides an assessment of the potential benefits that a typical Latin
-4-
American country would obtain after improving the institutional set-up and advancing inthe economic reform process. Finally, section VII discusses the challenges ahead for mostcountries in the region and advances some policy conclusions. Section VIII summarizes.
II. Economic Reform in Latin America: Where Do We Stand?
The Latin American region, which grew steadily at about 5% per year during the1950s, 1960s and 1970s, was severely hit by the debt crisis of the early 1980s. Almostevery country, and especially the largest —Argentina, Brazil and Mexico—, borrowedheavily during the period of high liquidity in the international capital market that followedthe oil price shock of the early 1970s. Thus, after running large current account deficits fora few years, these countries were severely affected when monetary policy shifted in the USand international interest rates were raised causing a global slowdown (table 1).
The crisis uncovered the major imbalances and structural problems that existed inmost countries in the region at the time, and set the stage for the reform process thatoccurred the following years. The reforms were aimed first at attaining macroeconomicstability and reducing government deficits. Beyond that, the main goal was to replace theold import substitution cum government intervention development model that had been inplace for several decades. Instead, countries opted for developing outward orientedeconomies where market forces, as opposed to government actions, would play a major rolein allocating resources among competing sectors.
Starting with Mexico in the mid 1980s, one after another Latin American countriesbegan implementing the same reforms that Chile had introduced in 1974-75 and thereafter.These included a program to reestablish macro stability, comprising a devaluation of thecurrency, a tightening of monetary policy and a fiscal adjustment with cuts in subsidies andnon-essential programs. The aim was threefold: to reduce the fiscal deficit, to balance theexternal accounts and to fight inflation.
In addition, countries began reducing both the level and the dispersion of trade tariffswhile lifting other non-tariff barriers to trade and unifying multiple exchange rate systems.Trade integration took two forms; some countries opted for unilateral tariff reductions –likeChile had done in the 1970s– while others preferred trade agreements and the establishmentof trade areas within the region like Mercosur, which in its first stage included only fourcountries, namely, Argentina, Brazil, Uruguay and Paraguay. Also, countries implementedtax reforms whereby the VAT was introduced —Chile introduced the VAT in 1975— andsome taxes were raised to compensate for the reductions in trade tariffs.
The reform process comprised three other areas, namely, financial liberalization,privatization of state owned enterprises (SOEs), and the labor market. Financial sectorreforms included lifting restrictions on credit allocation, abolishing ceilings on interestrates, and reducing reserve requirements on banks. The aim was to end the era of financialrepression so that credit could be allocated to its most productive and profitable uses amongcompeting economic sectors. In addition, state owned banks were privatized to improvetheir efficiency. Similarly, the privatization of SOEs sought to attract more investment andattain higher levels of efficiency in the use of resources. Along the way, the privatization ofbanks and enterprises would provide extraordinary funds for the government that would
-5-
help to resolve debt problems. Finally, labor market reforms were aimed at increasing labormobility and wage flexibility. Main objectives were to reduce the cost of firing by cuttingseverance payments and to abolish automatic salary adjustments to past inflation.
As mentioned, the goals of the reforms were to reestablish macro stability and toreplace the old development model that was based on import substitution and widespreadgovernment intervention in the economy. The latter occurred through price controls,mandatory credit allocation, financial repression and subsidies to specific industries, amongother measures, and was the cause of governments running large fiscal deficits, highinflation rates and endemic balance of payments deficits. In addition, labor legislation wasoverprotective and tended to reduce mobility and flexibility.
In the new market oriented development model the government relinquishes from theproduction and distribution of private goods that can be produced more efficiently by theprivate sector. Instead, it focuses on the provision of public goods –e.g. safety, judiciarysystem– and, most importantly, implementing social programs to alleviate poverty andimprove the access of the poor to basic services such as health care and education. But inthe new model, education and health care services do not have to be provided necessarilyby the government; the poor, with financial support from the government, can buy theservices from a private provider. In addition, in the new model the government does play acrucial role in market regulation and supervision. This comprises not only the financialsector and public utilities –which in many cases were privatized–, but markets in general.The aim is to develop and maintain a competitive environment in all industries and sectors,and entails setting rates for natural monopolies such as utilities, strengthening the role ofconsumer protection agencies, promoting market discipline and assuring free entry to alleconomic sectors.
Although the breadth and timing of the reform processes differ across countries, it isworth trying to assess the degree of progress achieved throughout the region. As said, Chilemade significant progress in several areas in the 1970s (few other countries did so in someareas), but the bulk of the reforms in the region were implemented after the debt crisis.Figure 1 shows indicators of progress made in several areas as well as an indicator ofprogress made in general. All indicators are constructed to measure progress made since1985. Although these indicators are subject to many caveats1, they are indicative of thereform effort in the region as a whole. The figure shows that much progress occurred intrade liberalization, especially up to the tequila crisis, and significant progress occurred inthe financial sector, although it was more evenly spanned through time2. Conversely, littleprogress has been made in tax reform and in the privatization of state owned enterprises,and no progress at all in the labor market. Thus, a lot remains to be done in Latin Americain the last three areas.
1 The indices measure, for each area, how liberalized is each country compared to the least liberalized
country in the whole sample. The sample period is 1985-99 in Lora (2001) and 1970-95 in Morley et al.(1999). For more details see Lora, 2001; Lora and Barrera 1997; and Morley et al., 1999.
2 According to Morley et al., significant progress also occurred up to 1995 in the opening of the capitalaccount.
-6-
III. Latin America’s Economic and Social Performance
In the past 43 years, Latin America’s economic performance has varied significantlyfrom one period to another, in contrast to the experience of East Asia. Further, on averageLatin America grew at about half the rate of East Asia for the whole 1960-2002 period, andhas not yet recovered the rates of growth attained in the 1960s and 1970s, despite therecovery witnessed shortly into the reform process (figure 2).
Among all Latin American countries, Chile is the only one that in the past eighteenyears has grown at average rates comparable to those attained by the East Asian economies.Chile’s growth rate in 1990-2000 was very similar to that of South Korea, and betweenSouth Korea’s and Indonesia’s in 1985-97. Costa Rica, the Latin American country thatcomes second after Chile in terms of growth, grew at a much lower rate –about 2% less peryear (table 2). Consequently, among all Latin American countries, Chile is the only onethat, along with the emerging market economies from East Asia, in the past quarter centuryhas closed its per-capita GDP gap with the industrial countries —Chile closed this gap inabout 30% (figure 3).
Chile’s good performance also shows up in its social indicators. Life expectancyincreased sharply in the past 42 years and as of 2001 was the region’s second highest afterCosta Rica. Similarly, after falling by more than 91% since 1960, in 2001 infant mortalitywas the region’s second lowest after Costa Rica and has continued falling since; at 7.8 per1000 live births, one year later it was lower than Costa Rica’s. And at 96%, the literacy rateis the third highest in the region after Argentina and Uruguay, although both these countrieshad a relatively high rate (93%) thirty years ago (table 3). But all Latin American countries,albeit to a lesser degree, showed improvements in these indicators.
The most outstanding achievement in the case of Chile has been poverty reduction; inthe past 10 years the country has halved its poverty rate —it went from 33% in the early1990s, down to 17% in 2000 (table 4). In contrast, poverty reduction in the region at largehas been modest —from 41% to 36%— while in some countries it has increased. It is worthnoting that according to Attanassio and Székely (2001), about 85 percent of the povertyreduction in Chile can be attributed to high economic growth, while only 7 percent resultedfrom redistribution policies.3
The one area in which Chile has not been successful is in altering its incomedistribution. Thus, not only income distribution deteriorated in Latin America in the past 30years, becoming one of the worst in the world, but with a Gini coefficient above 0.55Chile’s income distribution is one of the worst in the region (figures 4 and 5).
In sum, in the 1990s, economic growth resumed in the region but remained below thepre-debt-crisis rates, widening the per-capita income gap with industrial countries. At thesame time, poverty reduction was modest, other social indicators improved and incomedistribution worsened. In sharp contrast, Chile’s growth rate during the decade was one ofthe highest around the world, becoming the only Latin America country that converged in
3 The results from Attanassio and Székely (2001) refer to the drop in poverty between 1987 and 1996.
According to these authors, about 8% of the drop in poverty is a residual and cannot be explained by theirmodel.
-7-
per-capita-income terms to the industrial countries. Hence, except for income distribution,Chile’s social indicators improved significantly, placing it among the best in the region.
This brief revision of the economic and social performance of Latin Americaneconomies raises several questions, in particular: Did the structural reforms implementedduring the 1980s and 1990s have any effect on countries’ performance? What did Chile dodifferently that explains its better results? The next two sections try to answer thesequestions by first summarizing previous findings and then exploring in greater detail thereform process in Chile. Section IV provides an overall assessment of why Latin Americancountries did not attain higher growth on a sustained basis, while Section V advances anexplanation of Chile’s better performance by analyzing in detail the differences with therest of the region in both policies and quality of institutions.
IV. The Reform Process and Its Results: An Assessment
Early attempts at evaluating the reform processes in Latin America concluded thatreforming countries reaped large benefits from them. The initial estimates concluded thatthe reforms implemented in the region up to the mid-nineties accelerated growth by about2% per year (Easterly et al., 1997; Fernández-Arias and Montiel, 1997). But these resultswere subsequently contested by new analyses that looked into longer time series.Nevertheless, more recent literature that revisits the issue concludes that the reforms indeedcontributed to accelerate growth, although the effects were rather transitory, implying thatto achieve a higher growth rate on a sustained basis countries should continue the reformprocess. Thus, for instance, according to Lora (2002) Latin America grew about 1.3% fasterduring 1991-93 because of the reform effort, but only about 0.6% faster in 1997-99 bothbecause the effects of previous reforms faded away and because the reform effort declined.
At least four other important conclusions emerge from the literature. First, resultswere unsatisfactory in some countries because of an insufficient reform effort; in otherwords, growth did not accelerate in those countries not because reforms failed, but becausethey were incomplete, either in scope or in depth (Fernández-Arias and Montiel, 1997).Second, the pay-off from the reforms depends on institutions. Thus, for instance, accordingto Lora (2002), reforms were more effective in countries with good rule of law. Third,reforms are complementary; i.e., the pay-off from, say, the trade reform —in terms of fastereconomic growth— was higher in countries with a more developed financial sector(Gallego and Loayza, 2002). And finally, reforms tended to affect growth mainly throughincreases in total factor productivity, TFP, rather than through factor accumulation (Lora,2002).
The four results above are consistent with each other if one notes that the main sourceof growth in recent decades has shifted from factor accumulation to TPF, that is, doingthings better (not just doing more of the same by hiring more labor and capital). This isillustrated in table 5 that shows the decomposition of growth for the five-best and five-worst performers in Latin America in the past four decades. It is clear from the table thatdifferences in growth during the 1960s and 1970s were due mainly to faster capitalaccumulation. In contrast, the best performers in the 1980s and 1990s achieved fastergrowth because of larger increases in TPF. Beyer and Vergara (2000), who decompose thegrowth of a much larger (107) sample of countries during 1980-2000, reach a similar
-8-
conclusion. They conclude that about 82 percent of the growth difference between the 10%-best and the 10%-worst performers can be explained by changes in TFP, while only 18% isexplained by faster factor accumulation4.
In an era of rapid technological change, rapidly growing firms are constantly trying toimprove procedures and attain greater efficiency by incorporating and adapting newtechnologies. For this to occur, a necessary condition is that prices reflect the actual cost ofproviding different goods and services, which can be achieved by liberalizing prices andimplementing several other market-oriented policies. In other words, what is needed is toreduce state intervention in the economy (except for externalities and other market failuresthat require the state to intervene). But this is not enough. Also, the business environmentmust be such that the private sector has the incentives to invest in the development andimplementation of new and better technologies; that is, the business environment must beconducive to agents to get involved in constantly improving their efficiency levels. For this,stable rules of the game and good institutions are needed. Among the latter are the rule oflaw, property rights protection, no corruption, and low bureaucracy.5
In sum, countries that do not put in place an adequate institutional setup, one thatsupports investment in innovation and the adaptation of new technologies, will not reap thebenefits of attaining rapid economic growth even if other economic reforms take place,such as trade liberalization or macro stability. Indeed, Fernández-Arias and Montiel (1997)suggest that this is one front where most Latin American countries failed during the reformprocess; not enough emphasis was put on building up and strengthening institutions. Theseauthors acknowledge that some countries did not even complete the so called firstgeneration reforms; i.e., fiscal and macro stability was not attained, as high inflationresumed after a short period, and trade liberalization was never completed. In their view,completing the macroeconomic reforms that were partially implemented would havebridged a significant part of the growth gap observed during 1991-95 between East Asiaand Latin America. And closing the educational gap that exists between both regions wouldwork in the same direction. But, in their words, “… we suspect that it [the growth gap] isalso associated with other deep-seated institutional and structural differences in theseeconomies as well. In any event, the gap suggests the need for a broadening of the scope ofreform in Latin America beyond the macroeconomic sphere if the region’s economies areto achieve the standard of performance they seek”.
The next two sections of the paper address the issue raised by Fernandez-Arias andMontiel (1997). In particular, we try to explain Chile’s better performance (described insection III) on the country’s institutions and continuos reform process. Section V belowdiscusses in greater detail Chile’s reform process, while section VI provides some empiricalevidence supporting the view that institutions made a difference. We also quantify the
4 It is possible to provide a different interpretation of the results in table 5. In particular, given the way we
computed the contribution to growth of ∆L, ∆K and ∆TFP, the latter element captures not only efficiencygains but also other unidentified shocks (“bad or good luck”). Therefore, it could be argued that the bestperformers, those countries showing a higher contribution of ∆TFP, are those more resilient to shocks(where negative shocks were less harmful). This resilience may, in turn, be a direct result of betterinstitutions and policies.
5 Note that this explanation does not preclude the possibility that a better business environment may,besides being more conducive to research and investment in innovation, lead to faster factor accumulation.
-9-
contribution of policies and institutions in Chile’s growth, paying special attention to thefactors underpinning the development of the financial sector.
But before closing this section, a word should be said about the one area in whichChile, like all other countries in the region, made no progress in the last decades: incomedistribution. In this regard Birdsall and Székely (2003) conclude that, in general, policies toredistribute income failed throughout the region, or were insufficient to compensate for theregressive effects of other reforms like financial liberalization.6 In fact, based on researchconducted by Attanasio and Székely (2001) they show that the bulk of the change inpoverty in the region was due to economic growth. In their sample there is only one LatinAmerican country where redistribution policies were highly effective: Brazil. In fact, up to70 percent of the decrease in moderate poverty there between 1985 and 1995 can beexplained by income redistribution. The only problem is that this result was mainly at theexpense of those in extreme poverty; for this group, redistribution effects deteriorated theirrelative position, more than offsetting the positive effect from economic growth (table 6).
The bottom line is that redistribution is no easy task and the best we can do toalleviate poverty is to enhance growth and avoid crises. This way we can at least assure thatthe poor (as well as the well off) will be better off. Crises are very harsh on the poor; theysuffer the most during recessions because they don’t have assets to compensate for lostjobs, and employment recovers with a significant lag after the crisis is over. Effectiveredistribution is hard to achieve because it entails giving the poor access to assets that allowthem to work their way out of poverty and protect themselves against the loss of unskilledjobs during recessions. Two ways of doing this are to give them access to more and bettereducation, that is, investing more in human capital, and to grant them access to credit tobuy productive assets. But designing and implementing effective policies towards thesegoals is no easy task.
V. Why is Chile Different?
A common feature in the region is that countries are prone to suffer macroeconomiccrises, which usually have fiscal roots and in some cases are even exacerbated by financialproblems. These macro crises have delayed the reform process and in many instancesresulted in major setbacks. In contrast, Chile muddled through the Tequila, Asian andRussian crises relatively unscathed, partly because its fiscal problems were faced early on,culminating with a stringent fiscal responsibility rule, and counts with a very robustbanking sector.
With regards to structural reforms, toward the end of the 1990s most Latin Americancountries had advanced in trade openness, financial liberalization and, to a lesser extent, intax reforms and privatization of SOEs (the so-called “first generation reforms”). The maindifference in the implementation of these reforms was that Chile, jointly with Colombia, 6 Financial liberalization allows people with good investment projects to make large profits, increasing their
wealth. But the poor usually don’t have access to formal financial markets and therefore cannot benefitfrom this reform. In sum, financial liberalization offers new opportunities for those relatively well off asopposed to the poor; it redistributes (opportunities) in favor of the wealthier. The policy conclusion is tocreate special mechanisms to improve access to credit to small enterprises, for example by guarantying thecredits of those that lack enough collateral.
-10-
Argentina and Mexico, began the reform process almost a decade earlier (Morley et. al1999). But even more important, Chile, unlike the rest of the region, continued anddeepened the reform process putting more emphasis in the institutional buildup. A reformprocess without an adequate institutional setup that supports it, most likely won’t havesignificant and sustained effects on economic growth, and can even result in adverseoutcomes. For instance, if financial liberalization is not accompanied by an appropriateregulatory and supervisory framework –one that protects creditors–, most likely theoutcome will be a lending boom followed by a financial crisis, like it occurred in Chile andother Latin American countries in the early 1980s7. Similarly, a privatization program in acorrupt environment will most likely have negative effects on growth.
The most recent literature on economic growth has emphasized the role of policiesand, most importantly, institutions, as the ultimate causes of factor accumulation andproductivity gains. There is growing consensus in the literature that countries attain highereconomic growth when there is rule of law, property rights protection, low bureaucracy,low corruption, adequate supervisory and regulatory frameworks that guarantee a fairmarket competition, stable rules of the game, and adequate checks and balances (Rodrik etal, 2002; Easterly and Levine, 2003). All of these lead to better economic policies andprovide a business environment that is more conducive to investment, innovation and thehiring of labor.
As discussed above (table 5), the bulk of the growth difference among LatinAmerican countries in the 1980s and 1990s can be attributed to changes in TFP. Further,Lora (2002) documents —after controlling for other factors— that there is a term (i.e., hisreform index multiplied by a quality index for each country’s institutions) that affects TFPgrowth. In other words, a country’s institutions reinforce the effect of economic reforms ongrowth, which is channeled through increases in TFP.
The role of institutions is clearly illustrated in figure 6, which shows a scatter for 151countries between per capita GDP (as of 2002) and the quality of the countries’ institutions.Two conclusions are worth highlighting: (i) Latin American countries tend to be in thebottom part of the figure (they tend to have poor institutions and low GDP per capita); and(ii) Chile is the only Latin American country that appears significantly above the fitted line.In fact, according to Kaufmann et al. (2003), as of 2002 Chile appears as the best-rankedemerging market economy in terms of the quality of its institutions (average of sixcategories), followed by Costa Rica and then Uruguay among Latin American countries.Chile is even ranked higher than some developed countries, namely Spain, Japan, HongKong and Italy (table 7). And the situation is very similar when looking at each of the indexcomponents: government effectiveness; regulatory quality; rule of law; control ofcorruption; voice and accountability; and political stability (only in the latter two Chileappears in second place after Costa Rica among emerging market economies).
This striking difference between Chile and the other Latin American countriesprovides a plausible explanation for Chile’s better economic performance in the pastdecades. But this is not all. Chile also advanced further than other economies in theimplementation of macroeconomic reforms, in some cases even concluding withinstitutional arrangements that provide additional guarantees that there will be no
7 On this topic see De Gregorio and Guidotti (1995).
-11-
backtracking in the future. Two examples of the latter are the independence of the CentralBank and the free trade agreements signed recently with important trade blocks and largetrade partners. Another example, although not yet fully institutionalized, is the structuralfiscal surplus rule.
Next we discuss the reform process in Chile since the early 1970s. The aim is to showthat the reforms were much deeper and wider in scope than in the average Latin Americancountry. Also, that the reform process has not stopped; Chile continues implementingpolicies in many areas. And third, that the institutional setup is not given; it can bemodified (albeit slowly), so that countries with poor institutions are not condemned by theirlegacy.
V.1 First Stage: The First Generation Reforms
When the economic reform process began, the Chilean economy was in completedisarray as the state intervened in virtually every area of production and interfered in manyeconomic decisions. Furthermore, fiscal deficits were rampant and the economy wasisolated from the rest of the world through a complex battery of trade restrictions. In anutshell, by 1973 inflation was running at above 500% per year, the fiscal deficit was about30% of GDP, and the peso was artificially overvalued as there were many capital andcurrent-account restrictions aimed at containing the external imbalance, including amultiple exchange rate system. In addition, the average tariff was about 105%, thougheffective protection varied across economic sectors due to a wide range of restrictionsincluding non-tariff barriers, and many prices were set (artificially low) by the government,creating a shortage of goods and services in many markets. Further, the state owned about600 enterprises, accounting for about 40% of GDP, and financial repression in the form ofcontrolled (negative) real interest rates and restrictions on credit allocation was widespread.
The military government that took power in late 1973 inherited an economy incomplete chaos. In the early years of the military government exchange rates were unified,prices were liberalized for most goods and services, and several enterprises, farms andbanks that had been intervened and controlled by the state were returned to their previousowners. In addition, a major fiscal package comprising drastic cuts in public investmentand subsidies, and a freeze in public wages, brought the fiscal deficit down to only 5% ofGDP in 1974. The fiscal adjustment continued, bringing a 4% surplus only two years later(in attaining this surplus it helped the economic recovery that followed the initial reforms).
But reforms went far beyond achieving stabilization and correcting macroeconomicimbalances. In 1975, for example, the sales tax was replaced by the value-added tax (VAT)at a flat rate of 20%, thus improving the efficiency of resource allocation.8 Also, non-tarifftrade barriers were lifted, while both the dispersion and the level of tariffs were unilaterallyreduced for most goods. This process continued into 1979, when a flat tariff of 10% was setfor most goods.9
8 Over time, the VAT became the most important source of government revenue, amounting to about 50%
of total taxes.9 Only a few exceptions remained, like cars and luxury items such as fur and jewelry.
-12-
Major reforms were also introduced in the financial sector, where interest rates wereliberalized, banks privatized, mandatory credit allocation abolished, entry restrictions lifted,and the scope of permitted activities broadened. But the end of financial repression was notpreceded or accompanied by an upgrade —or even better, an overhaul— of the supervisoryand regulatory framework, thus exacerbating moral hazard and adverse-selection problems.Furthermore, early on in the process one commercial bank went bankrupt and thegovernment provided full protection to depositors, thus intensifying moral hazardproblems. Unsurprisingly, after the financial liberalization process began, connectedlending grew unchecked; this was partly motivated by the simultaneous privatization ofbanks and enterprises that had led to a high concentration of wealth. Along with over-borrowing, banks incurred in highly concentrated portfolios and under-provisioning of non-performing loans, the latter due to both low provisioning requirements and lax rules thatallowed non-performing loans to be rolled over (evergreening). Also, bank borrowersincurred in huge currency mismatches in their balance sheets, a risk that was overlooked byboth banks and the supervisory agencies (i.e., bank borrowers’ exchange-rate risk exposurebecame banks’ credit risk). In addition, a de facto deposit insurance system precludeddepositors to exert some kind of market discipline, further aggravating moral hazardproblems. This financial fragility made the overall system prone to crisis and proved to becostly when the economy suffered severe shocks in the early 1980s.
The outcome of all the reforms above combined was a quick economic recovery anda sharp reduction in both the fiscal deficit and the inflation rate. Indeed, after a sharprecession in 197510, GDP grew on average by about 6.8% per year during 1976-81 (7.5% in1977-81). Similarly, inflation fell sharply and reached the two-digit level just a few yearsinto the stabilization program, although it remained around 30% until 1980 (it was slightlybelow 10% only in 1981). The fiscal balance was in surplus through the entire 1976-81period and the economy received large amounts of private capital inflows, mainly in theform of syndicated bank debt.
But major imbalances arose during this period. In particular, the real exchange rateappreciated significantly, the current account deficit climbed to 14.5% of GDP in 1981, andthe financial sector weakened as major risks and vulnerabilities grew unchecked.11 Thelatter led to weak portfolios and undercapitalized banks, many of which accumulatedpotential losses several times their capital base.
In this scenario of increasing macro-financial fragility, it is easy to understand whythe economy nose-dived when the external environment deteriorated in the early 1980s.The balance of payments crisis and the abandonment of the nominal peg that followed wereunavoidable after private capital inflows came to a halt in 1982. The ensuing realdepreciation further aggravated the financial crisis because of the large currencymismatches incurred by the private sector. As a result, real GDP fell by about 16.4%(cumulative) during 1982-83.
10 The recession resulted from the fiscal stabilization program, the first oil shock, and the fall in the price of
copper in the world market.11 The risks included unmatched currency liabilities incurred by banks’ debtors, weak asset rating systems,
under-provisioning, connected lending, and rolling over of bad loans (evergreening of banks’ balancesheets).
-13-
The economic and financial crises caused a setback on some of the policies andachievements of previous years. Indeed, the government had to take over 19 financialinstitutions and ended up controlling about half of the total bank credit (the intervenedinstitutions were later privatized, merged or shut down). Along with this, the governmenttook over several enterprises and non-bank financial intermediaries that belonged to theconglomerates whose flagship banks were near collapse and had been intervened12. Inaddition, import tariffs were raised —albeit temporarily— to help the fiscal adjustment. Allof this represented a major setback to the market-oriented economic model implementedsince 1974, and forced the government to incur in a fiscal deficit and allow higher inflationrates (in addition to the higher tariffs) to finance it.
It is important to single out two other reforms that were implemented just before thedebt crisis hit, and which played a major role in the subsequent period: the newConstitution of 1980, and the pension system reform of 1981.
The new Constitution of 1980 is important not only because it set the timetable forthe return to a democratic regime in Chile, but also because it granted the power to allocategovernment spending exclusively to the executive branch, thus closely linking expenditureswith revenues13. Thus, today the Chilean Congress can either pass or reject the budget lawsubmitted to it by the government, but cannot amend such law. This has proven to be animportant factor for maintaining fiscal discipline. In addition, the new Constitutionprohibited the Central Bank from buying securities issued by the government, thusprecluding the monetization of the deficit. It was also given the explicit mandate to pursuethe stability of prices (or of the currency), the stability of external payments, and thestability of the domestic payment system. Finally, it was granted full independence fromthe executive branch by the way its authorities would be designated14. (It should bementioned that although legislated earlier, these changes came into effect de facto in 1989,with the country’s return to democracy).
The pension system reform of 1981 consisted of the phasing out of the bankrupt pay-as-you-go system and the creation of a fully funded capitalization system run by private,competing entities. In the new system workers make mandatory monthly contributions intopersonal savings accounts, which are managed by specialized private entities, and whosebalances cannot be withdrawn before retirement. This reform led to an increase in totalsavings and, at the same time, contributed to the development and deepening of thedomestic capital markets, thus indirectly helping to raise total factor productivity –weexplore this effect in greater detail below15. In fact, as the private entities managing these
12 The fiscal cost of the financial crisis is estimated to be close to 40% of GDP. For more details on the
Chilean banking crisis of the 1980s, see Barandiarán and Hernández (1999).13 Prior to this legal change, the legislative branch shared the power to allocate public money, but was not
required to provide the necessary funding, thus exacerbating the bias toward having a large fiscal deficitpurely for political reasons.
14 Pursuant to the law, the Central Bank is run by a Board composed of five members, each one appointedfor a term of ten years: every two years a new member is appointed. Board members are nominated by thegovernment, but need approval of the Senate. The Governor is then chosen among the five board membersby the country’s President for a period of five years or the time remaining in the member’s term, whateveris shorter. The Deputy Governor is chosen by vote among the other members of the Central Bank Board.
15 See Corbo and Schmidt-Hebbel (2003).
-14-
funds have become large lenders to both banks and corporations, over the years they haveinduced an improvement in corporate governance (figure 7).
V.2 Second Stage: The Deepening and Institutionalization of Reforms
In the aftermath of the debt crisis, the government focused its policies on two areas:redoing some of the work of previous years —privatizing banks and enterprises taken overduring the crisis, continue reducing the budget deficit and inflation— and overhauling theinstitutional framework to correct the problems and regulatory shortcomings that had beendiagnosed during (and were partly responsible for) the crisis16. Thus, a new tax law wasenacted in 1984, which provided special incentives for saving and investment. For instance,profits became non-taxable if reinvested (taxes accrued only when profits were distributedin the form of dividends) and the corporate tax rate was reduced.17 Also, new banking andbankruptcy laws were enacted in 1986. The new banking law granted more powers to thesupervisory and regulatory agencies, while updating specific regulations to keep up withinternational standards and best practices. For instance, more stringent restrictions wereimposed on loans granted to related parties, on asset classification by banks, onprovisioning and on the reporting of non-performing loans, thus significantly reducing thescope for incurring in connected lending and the rolling over of bad loans. With respect tobankruptcy procedures, the new law set forth very clear steps for the liquidation and closureof banks. Also, clear seniorities were established for the payment of debts to creditors,while bankruptcy procedures were expedited.
Other important institutional changes included the setting of a framework forcontrolling and monitoring monopolistic practices, and the privatization of SOEs,comprising not only banks and other firms taken over during the debt crisis, but alsoutilities formerly owned and operated by the state, such as electricity generation anddistribution, long-distance and local telephone companies. The privatizations undertakenduring this period, as opposed to those implemented during 1974-81, were designed tospread ownership among a larger group of investors, so that the high concentration ofwealth that had resulted before could be avoided. For this purpose, tax and other incentives,such as low-cost loans, were provided to individuals for them to buy shares of theprivatized companies. The new wave of privatization brought the share of SOEs in GDPdown from 24% in 1983, to 13% in 1989. In addition of passing an antitrust law, specific
16 It should be stressed that the decision to maintain the outward oriented market-economy model in the
aftermath of the debt crisis was crucial to determine the country’s economic performance in subsequentyears. Indeed, after that almost a decade of economic reforms had ended in a recession and deep financialcrisis, the development model was discredited. In this setting it could have been easily replaced by theinward looking model with greater government intervention, thus reversing the progress achieved duringthe past decade. Fortunately, the authorities at the time decided to maintain the same overall developmentstrategy, focussing instead on correcting its institutional and regulatory shortcomings.
17 At the same time, double taxation on dividends was abolished by giving shareholders a tax credit, to beused in their personal income tax, equal to the proportional corporate tax paid by the company. This waythe tax-induced bias in favor of corporate borrowing to finance investment was eliminated (Modigliani-Miller’s modified proposition, 1963). In addition, special tax incentives were provided for the issuance ofequity. Buyers of new shares, IPOs, received a tax credit, equal to a fraction of their investment, whichwould last for as long as they held on to the new shares. For details see Hernández and Walker (1993).
-15-
rules were approved for the setting of prices of natural monopolies, such as electric andtelephone companies, and in other industries such as public transportation.
In 1989, a new Central Bank law was enacted, whereby the Central Bank’s soleobjectives are the stability of prices, the stability of the domestic payment system, and thestability of Chile’s external payments. This new charter led the Central Bank, nowautonomous, to adopt in 1991 a monetary policy scheme based on inflation targeting and awidening exchange rate band. The exchange rate band was abolished later on (in 1999),leading to a free-floating regime in which the Central Bank rarely intervenes, that is, onlywhen the exchange rate market becomes dysfunctional and the exchange rate is clearlymisaligned from its fundamentals. As a result of all these changes, the inflation rate inChile today has converged to the Central Bank’s steady-state target, a range of 2 to 4percent per year, a level that nobody thought feasible just a decade ago18.
Also, new legislation allowing the participation of the private sector in infrastructuredevelopment was passed in 1991-92. According to it, roads, highways, airports, seaportsand other infrastructure projects may be developed by the private sector under build,operate and transfer (BOT) arrangements. As of 1998, 21 projects for a combined total ofabout US$3.6 billion had been developed under this arrangement (several others have beenapproved and completed, or are near completion, since then). And in 1994, a new law waspassed permitting free entry to the —until then monopolistic— long-distancetelecommunications market, the so-called “multi-carrier” system. This change has shaped ahighly competitive market and caused a drastic fall in long-distance telephone rates.
It is important to mention that during this period the country successfully transitedfrom an authoritarian to a democratic regime. Despite all the uncertainties surrounding thistransition, the change was smooth, in part because the new Administration confirmed mostof the market economy elements already in place, while concentrating on a social agenda.This way the economic institutions created in previous years were validated and in manycases strengthened, so that uncertainty vanished. For instance, early on in 1990 the newdemocratic government deepened the opening up process by reducing the maximum importtariff from 15% to 11%. In fact, all three governments that have been in power since 1990have strengthened the market economy model, accelerated the opening up process,consolidated the fiscal position and improved regulations, while, at the same time, theyhave emphasized social policies and implemented new programs to alleviate poverty.However, in labor market flexibility there has been some backtracking.
But the reform process has continued up to now with the introduction of policies andinstitutional changes aimed at further consolidating the market-oriented economic modeland improving the Chilean economy’s resilience to shocks. Thus, amendments to thebanking law in 1997 allowed banks to undertake new businesses, including lendinginternationally, while upgrading some regulations, i.e., the Basel capital accord wasadopted. In 1998 a law was passed unilaterally reducing the import tariff by one percentagepoint every year, stopping at 6% in January 2003. Furthermore, in 2002 Chile signed freetrade agreements with the European Union, in 2003 with the United States and in 2004 withSouth Korea, thus consolidating the process of integration with the world economy. Also,in 2001 the government committed to achieving and maintaining a 1% structural fiscal
18 Thus, an inflation that started to develop in 1860 was finally controlled by the late 1990s.
-16-
surplus. Under this commitment, government expenditures are set to be 1% of GDP lessthan the Government’s structural revenues, which are defined as the revenues that wouldoccur in steady state. In other words, expenditures are 1% less than the revenues that wouldoccur if the economy were on its long-term path (after eliminating cyclical variations intaxes and other key variables such as the price of copper and the level of internationalinterest rates). This rule is intended to guarantee that the government will remain solvent inthe long run. Also in 2001, all remaining capital controls were abolished, ending more thanhalf a century of a partly closed capital account. And during this period regulatory and taxchanges were introduced, aimed at increasing the efficiency of capital markets andproviding incentives to save. Among these: taxes on capital gains in the stock market wereabolished; voluntary (tax-free) contributions into personal retirement savings accounts wereallowed; the tax on interests paid to foreign investors in peso-denominated bonds wasreduced from 35% to 4%; and some regulations restraining mutual funds and insurancecompanies were lifted.19 Also, during this period the exchange rate band was abandoned,consolidating both the inflation targeting and the free float regimes, while a voluntaryunemployment insurance scheme was introduced. Finally, in 2003 three new laws werepassed that (i) established a clearer career path for public servants, based on merits, therebysignificantly reducing the scope for the government to appoint political allies in seniorpositions; (ii) provided public funding for political parties; and (iii) regulated privatedonations to political parties and candidates. These three laws should increase transparency,reduce the scope for corruption, and allow the public sector to attract more qualified people.And currently other initiatives are underway to further improve the efficiency and foster thedevelopment of the Chilean capital market.20
In sum, Chile not only began its economic reform process a decade earlier than therest of Latin America; it also completed and deepened many of the reforms in subsequentyears. Further, it changed the institutional setup to enhance the credibility —andeffectiveness— of its policies and the country’s resilience to shocks. Without the continuosprogress in all these areas, most likely the pay-off in terms of growth would have been lessthan it was and the economy would have remained highly vulnerable to crises.
VI. Deepening the Reforms: What is at Stake?
The previous section has shown how Chile introduced and deepened the reforms,putting special emphasis on the institutional buildup. In the process, the country hasestablished high credibility and its institutions have won reputation, being today of betterquality than all other countries in the region. The latter is reflected in the country’s riskpremium, which in 2003-04 attained one of the lowest levels among all emerging marketeconomies (figure 8).
Based on Chile’s experience an interesting question arises: What benefits wouldaccrue to countries that intensify their reform process to attain Chile’s —or higher—standards in terms of macroeconomic indicators, policies and, most important, institutions?
19 Capital Markets Reform I.20 Capital Markets Reform II.
-17-
VI.1 Explaining Economic Growth and Volatility
To answer the question above we follow the standard procedure found in theliterature and run two sets of regressions using a cross section of about 80 countries. In thefirst set of regressions the dependent variable is the average growth of per-capita GDPduring 1960-2000. In the second set the dependent variable is the volatility (measured bythe standard deviation) of the per-capita GDP growth rate over the same time period. Thesecond set of regressions is motivated by recent research by Acemoglu et al. (2003) thatsuggests that volatility is not caused only by bad policies —exchange rate overvaluation,inflation, government consumption, or other— but also by poor quality institutions. Poorquality institutions may cause volatility directly and indirectly by leading to bad economicpolicies. The two regressions are of the following form:
(1) iiii XY εααα +++=•
210 QI
(2) iiii XY µβββσ +++=•
210 QI
where Y is per-capita GDP, QI is an index measuring the quality of institutions in eachcountry, X is a set of other explanatory variables, and ε and µ are random terms (a dotabove a variable means percentage change).
Following the standard literature, the set of explanatory variables X includes initialconditions, policy variables, and one endowment/geography variable. Among the initialconditions we include the log of per-capita GDP in 1960, and the average years ofschooling in 1960 (the latter variable only for equation 1). Policy variables includeopenness (measured as exports plus imports over GDP21), government consumption (inpercentage of GDP), the real exchange rate overvaluation, the exchange rate black-marketpremium, and financial development measured as the ratio of private credit to GDP. Otherexplanatory variables included in the regressions are the growth and the volatility of theterms of trade. In equation (2) we also include inflation and its volatility, and the volatilityof government consumption and exchange rate overvaluation. All the policy variables aremeasured as the average for the 1960-2000 period. The endowment/geography variable iseither a dummy indicating whether the country has access to the seacoast, or the proportionof land area within 100 km of the seacoast.22
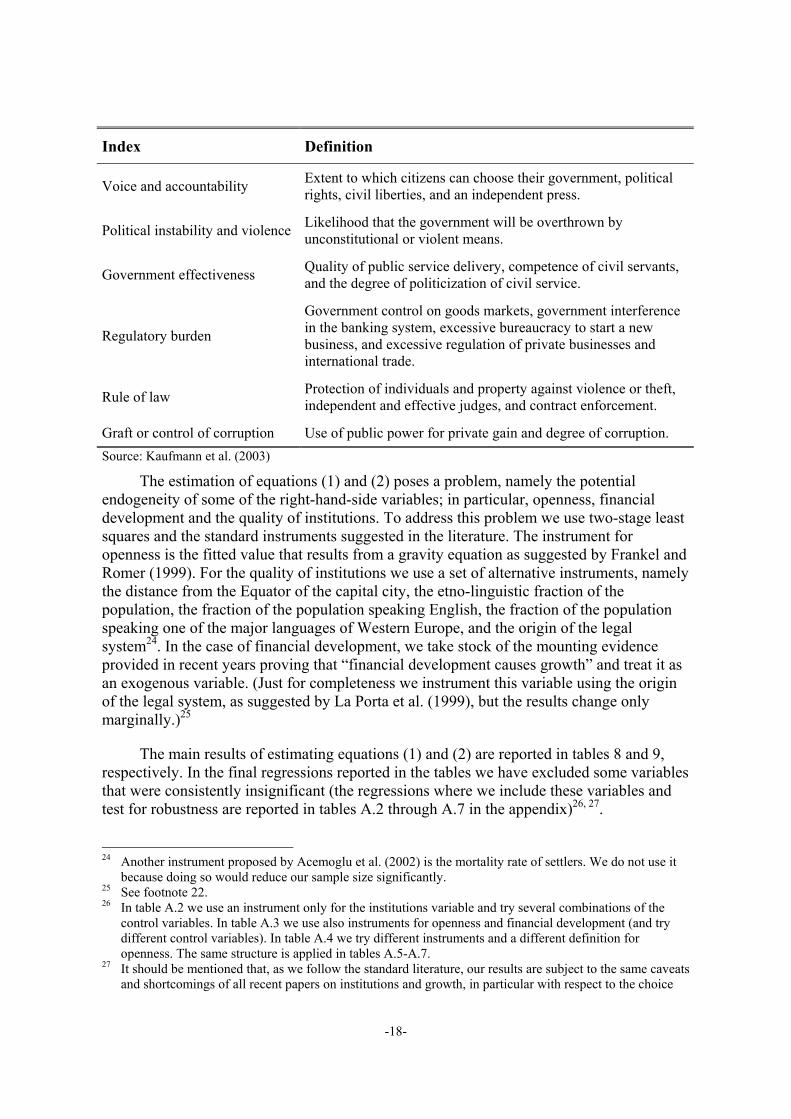
The quality of institutions, QI, is measured by the average for 1996-2000 of thefollowing six indices23:
21 For robustness checking, in a few regressions we use the alternative suggested by Calderón, Loayza and
Servén (2003), but the results do not change. This alternative variable is labeled openness 2 in tables A.2through A.7.
22 The precise definition and source for each variable is provided in table A.1 in the appendix.23 Other papers use Rule of Law as an indicator of the quality of institutions. Although we use a broader
index, the results reported below are robust to the use of Rule of Law. Besides, the correlation betweenour broader index and the latter is 0.97.
-18-
Index Definition
Voice and accountability Extent to which citizens can choose their government, politicalrights, civil liberties, and an independent press.
Political instability and violence Likelihood that the government will be overthrown byunconstitutional or violent means.
Government effectiveness Quality of public service delivery, competence of civil servants,and the degree of politicization of civil service.
Regulatory burden
Government control on goods markets, government interferencein the banking system, excessive bureaucracy to start a newbusiness, and excessive regulation of private businesses andinternational trade.
Rule of law Protection of individuals and property against violence or theft,independent and effective judges, and contract enforcement.
Graft or control of corruption Use of public power for private gain and degree of corruption.Source: Kaufmann et al. (2003)
The estimation of equations (1) and (2) poses a problem, namely the potentialendogeneity of some of the right-hand-side variables; in particular, openness, financialdevelopment and the quality of institutions. To address this problem we use two-stage leastsquares and the standard instruments suggested in the literature. The instrument foropenness is the fitted value that results from a gravity equation as suggested by Frankel andRomer (1999). For the quality of institutions we use a set of alternative instruments, namelythe distance from the Equator of the capital city, the etno-linguistic fraction of thepopulation, the fraction of the population speaking English, the fraction of the populationspeaking one of the major languages of Western Europe, and the origin of the legalsystem24. In the case of financial development, we take stock of the mounting evidenceprovided in recent years proving that “financial development causes growth” and treat it asan exogenous variable. (Just for completeness we instrument this variable using the originof the legal system, as suggested by La Porta et al. (1999), but the results change onlymarginally.)25
The main results of estimating equations (1) and (2) are reported in tables 8 and 9,respectively. In the final regressions reported in the tables we have excluded some variablesthat were consistently insignificant (the regressions where we include these variables andtest for robustness are reported in tables A.2 through A.7 in the appendix)26, 27.
24 Another instrument proposed by Acemoglu et al. (2002) is the mortality rate of settlers. We do not use it
because doing so would reduce our sample size significantly.25 See footnote 22.26 In table A.2 we use an instrument only for the institutions variable and try several combinations of the
control variables. In table A.3 we use also instruments for openness and financial development (and trydifferent control variables). In table A.4 we try different instruments and a different definition foropenness. The same structure is applied in tables A.5-A.7.
27 It should be mentioned that, as we follow the standard literature, our results are subject to the same caveatsand shortcomings of all recent papers on institutions and growth, in particular with respect to the choice
-19-
The first two regressions (columns) in table 8 are simple OLS, before and aftercontrolling for the quality of institutions. The main conclusion that emerges fromcomparing the first two columns is that institutions matter, that is, not only the α1coefficient turns out to be significant, but excluding the institutions variable biases upwards(in absolute value) all the other coefficients, except for initial GDP. Note also that theresults from columns 1 and 2 are consistent with previous findings: there is convergence inper-capita GDP (poorer countries tend to grow faster), education and financial developmentaffect growth positively, while keeping an overvalued exchange rate is detrimental togrowth. Openness and government consumption, although having the right sign, do notattain statistical significance at the standard levels28.
As argued, some of the right-hand side variables may be endogenous and that may becausing a bias in the results. Columns 3 through 7 address this problem by usinginstruments. In the regression in column 3 we use instruments only for the institutionsvariable, in the one in column 4 we use instruments for institutions and openness but not forfinancial development, and in column 5 we use instruments for financial development andinstitutions, but not for openness. The regression in column 6 excludes the institutionsvariable and uses instruments for financial development and openness, and the regression incolumn 7 includes institutions and uses instruments for all the potentially endogenousvariables.
The conclusions that emerge from columns 3 through 7 are very similar to those fromcolumns 1 and 2, that is, institutions matter (excluding this variable biases all othercoefficients), there is per-capita GDP convergence, the level of education matters, andamong the policy variables the most important are exchange rate overvaluation andfinancial development. In addition, when using an instrument for financial development,the corresponding coefficient turns out larger but is estimated less precisely (its marginalsignificance level is about 13% in columns 5 and 7).
Three other conclusions are worth noting from table 8 (and confirmed by therobustness tests in tables A.2 through A.4). First, the coefficient that accompanies theinstitution variable, α1, is robust to many alternative specifications and very stable ataround 0.010. Second, the coefficients for the education and exchange rate overvaluationvariables are not biased (or are only marginally so) when the institutions variable isexcluded. And third, financial development matters for growth on its own, even aftercontrolling for the quality of institutions.
Using the results from tables 8 and A.2 through A.4 (using the average coefficient ±one std. deviation), it is possible to estimate the potential effect for the average LatinAmerican country of adopting Chile’s institutions, or even better, the institutions of
and validity of the instruments and the estimation procedure (Acemoglu et al., 2001, 2003; Beck et al.,2003a, 2003b; La Porta et al., 1997, 1998, 1999). For a test on the validity of the instruments see Easterlyand Levine (2003) and Rodrik et al. (2002).
28 Empirical results indicate that the effect of openness on GDP growth is ambiguous. In particular, cross-section studies tend to find no such effect or the effect, when shown, is not robust, while a positive androbust effect emerges in panel data studies that capture the temporal effect of openness. See Calderón etal. (2004) for a complete review of empirical literature about the effect of openness on economic growth.
-20-
developed countries or Finland’s, the top one among all the countries in the sample. Theresults, reported in table 10, indicate that by having institutions of quality similar to Chile’s,the average Latin American country could raise its per-capita GDP growth rate between0.9% and 2.3% per year (or by about 1.6% per year, on average). Or better still, by havingFinland’s institutions the increase would be between 1.3% and 3.3% per year (or by about2.3% per year, on average). Note that in this case Chile’s per-capita GDP growth wouldraise only by about 0.7% per year on average, because the difference between Chile’s andadvanced economies’ institutions is marginal. Compared with historical growth rates of percapita GDP in Latin America (1.2% p.a. during 1960-2000, using a simple average, and1.8% p.a. taking a GDP-weighted average), the potential raise is quite significant. It meansthat, on average, per capita GDP would double in about 20-2529 years instead of 60 (thesenumbers change to 22-1830 instead of 38 if using the GDP-weighted average).
The results above also provide an explanation for Latin America’s poorerperformance during the 1990s vis-a-vis Chile or East Asia (this is reported in table 11). Inthe former case, about half of the predicted growth difference can be explained by betterinstitutions and about half by better policies (differences in initial condition matter, but lessthan differences in policies and institutions). In the latter case, policies played a muchgreater role, mainly because there is not much difference in the quality of institutionsbetween the average Latin American country and the average East Asian country. Moreprecisely, about 75% of the faster economic growth (predicted) in East Asia is due to betterpolicies and only 25% to better institutions. Finally, among policies, the sustainedovervaluation of the real exchange rate, although adding to the poor performance of theaverage Latin American country, plays a lesser role than financial development.
With regards to GDP growth volatility, the results reported in table 9 suggest that thequality of institutions matter —better institutions reduce volatility— and, therefore,excluding this variable biases all the coefficients, especially the one on financialdevelopment (note that table 9 and table 8 are similar in structure)31. In addition, usinginstruments (2SLS) changes the parameters of some variables (β1 appears to be less stablethan α1 as reported in table 8). Most important, the only variable besides institutions thatmatter is the overvaluation of the exchange rate (keeping an overvalued exchange rateraises GDP growth volatility).
Finally, table 12 reports the (again, simulated) effect on the volatility of per-capitaGPD growth for the average Latin American country, of it adopting institutions of similarquality to Chile’s, or even better, Finland’s. The reduction is significant: volatility wouldfall on average by about 40% per year (from 4.2% to 2.5%) in the former case, and byabout 57% (from 4.2% to 1.8) in the latter (numbers are very similar if using simple orweighted average historical data).
29 20 if compared to Finland’s institutions and 25 if compared to Chile’s.30 18 if compared to Finland’s institutions and 22 if compared to Chile’s.31 That is, regressions in columns 1 and 2 are OLS estimations with and without the institutions variable;
regressions in columns 3 through 5 use instruments for some of the potentially endogenous variables (inthe same order explained in the text); and columns 6 and 7 use instruments for all the endogenousvariables, openness, financial development and quality of institutions (column 7).
-21-
Before closing this section a methodological note is in order. The dependent variablesin equations 1 and 2 are the average and the volatility of the per-capita GDP growth rate for1960-2000, respectively, while, in both regressions the variable indicating the quality ofeach country’s institutions, QI, is measured over 1996-2000. This measurement problemcould invalidate our results. To check for the robustness of our findings we re-estimate bothcross-sectional regressions for the shorter sample period, although doing this may lead topoorer results due to the greater importance of cyclical factors32. The results of these newestimations are presented in table A.9 in the appendix33. As expected, some of theexplanatory variables lose statistical significance, in particular financial development, theovervaluation of the real exchange rate and average schooling years. However, the qualityof institution variable turns out to be statistically significant, with the correct sign and witheven larger coefficients than before, which shows that our results are robust to changing(reducing) the sample period.
VI.2 Explaining Financial Development
The cross-sectional evidence from the previous subsection supports the view that boththe quality of institutions and the degree of financial development matter for growth.Further, when compared with the other explanatory variables –initial conditions and thereal exchange rate overvaluation– it turns out that these two variables explain most of thedifference in economic growth performance between Chile and the rest of Latin Americaand between East Asia and Latin America during the 1990s.
At this point it is important to understand why the Chilean financial system is the largestin Latin America and one of the larger ones among emerging market economies (figure 9).This subsection sheds some light on this issue and tries to identify the ultimate sources ofthe financial development in Chile during the past forty years.
The literature that looks into the factors that explain financial development, which ismainly based on cross-sectional studies, has identified two sets of explanatory variables,namely ‘policy-related’ determinants (i.e., legal, regulatory and macroeconomic policies)and ‘deeper’ determinants (i.e., political, cultural, and even geographical factors).Regarding the first set of variables, La Porta et al. (1997, 1998) show the importance ofproperty rights protection in fostering financial development. Similarly, Beck et al. (2003a)conclude that the adaptability of the legal system is crucial, while Barth et al. (2003) showthat adequate bank regulation and supervision —i.e., providing incentives for greaterinformation disclosure without granting regulators excessive powers— is important for thedevelopment of the banking sector. With respect to macro policies, Boyd et al. (2000) andKhan et al. (2002) find significant non-linear negative effects of inflation on thedevelopment of banks and the stock market. Similarly, Bencivenga and Smith (1992),Huybens and Smith (1999), and Roubini and Sala i Martin (1995) show how monetary and 32 It should be noted that the growth literature tries to identify the determinants of long-term growth. For this
purpose, the standard approach is to take averages over long periods of time, which smoothes out cyclicalfluctuations. Using a five-year period does not guarantee that cyclical factors are cancelled out, whichcould reduce the precision in the estimation.
33 For the economic growth equation (Eq. 1) we report the same regression as equation 7 in table 8, while forthe volatility equation (Eq. 2) we report the same regression as equation 2 in table 9. Other regressions areavailable upon request.
-22-
fiscal policies affect the taxation of financial intermediaries and, therefore, the provision offinancial services.
With regards to deeper determinants, La Porta et al. (1998) emphasize the importance ofthe origin of the legal system, while Stulz and Williamson (2003) highlight the role ofreligion. Finally, Beck et al. (2003b), Easterly and Levine (2003), and Acemoglu et al.(2001) show the importance of geography in the shaping of institutions that, in turn, affectthe development of the financial system.
In this subsection of the paper we follow the first approach and use time-series analysisto explain financial development in Chile. This approach has the advantage of allowing usto capture the contribution of key economic reforms undertaken in recent decades. For thispurpose we use a slightly modified version of the empirical model developed by Corbo andSchmidt-Hebbel (2003), where the dependent variable measures the size of the Chileanfinancial market as a share of GDP. This measure, which adds up the most importantfinancial instruments of the Chilean capital markets, is consistent with financialdevelopment measures frequently used in the literature. The constructed variable consists ofliquid liabilities of the financial system (banks and other non-bank financialintermediaries), stock market capitalization, domestic private and public bonds, andmortgage related bonds.34 The evolution of this variable is showed in figure 10.
The estimation seeks a co-integration relationship between the financial developmentvariable and a set of explanatory variables comprising the size of the (mandatory) pensionindustry, an index measuring the progress in structural reform processes, and a fewvariables to capture other important macro-financial policies and reforms. Among the latterare two dummy variables to capture the reduction in inflation and a variable that measuresreal exchange rate misalignment (the rationale for including this variable is to control forcyclical fluctuations and for potential financial sector distress due to balance sheet effects).In addition, we incorporate a variable that was not included in Corbo and Schmidt-Hebbel’smodel and that captures the 1986 reform to the banking sector.
The pension industry variable is equal to the annual mandatory savings flow of the newprivate system created by the pension reform of 1981. The structural reform index is anaverage of the progress achieved in trade openness, financial liberalization, tax reforms andprivatization of state-owned enterprises. The inflation-related dummies identify thresholds;one equals 1.0 whenever inflation is below 10%, while the second equals 1.0 wheneverinflation in the current and adjacent years is below 20%35, 36. Finally, the banking sectorreform variable is a trend starting in 1986 with diminishing returns over time (it takes theform tα, where α takes the values of 1, 0.75 or 0.5). The estimation is done for the period1961-2003. Thus, in addition to extending the sample period, our estimation differs fromCorbo and Schmidt-Hebbel’s favorite specification in that we also evaluate the effects ofthe 1986 banking sector reform. Our final specification adopts the following form:
34 Following Beck et al. (2000), beginning- and end-of the year financial variables were CPI-deflated and
then averaged. This average was then divided by GDP (deflated by the year-average CPI).35 Corbo and Schmidt-Hebbel try different functional forms and thresholds for inflation. The dummies
defined as explained in the text are their preferred specification.36 This functional form explicitly acknowledges the presence of non-linear effects of inflation on financial
development and hence growth.
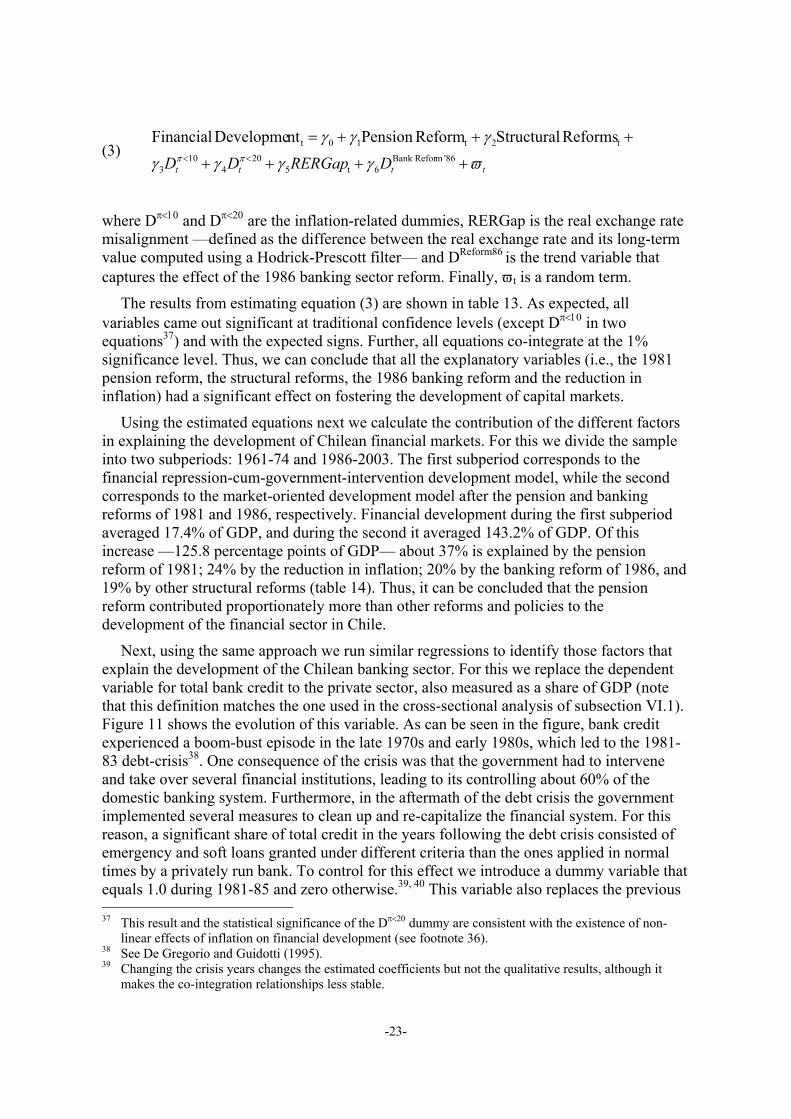
-23-
(3)tttt DRERGapDD ϖγγγγ
γγγππ ++++
+++=<< '86 mBank Refor
6t520
410
3
t2t10t ReformsStructural ReformPensionnt DevelopmeFinancial
where Dπ<10 and Dπ<20 are the inflation-related dummies, RERGap is the real exchange ratemisalignment —defined as the difference between the real exchange rate and its long-termvalue computed using a Hodrick-Prescott filter— and DReform86 is the trend variable thatcaptures the effect of the 1986 banking sector reform. Finally, ϖt is a random term.
The results from estimating equation (3) are shown in table 13. As expected, allvariables came out significant at traditional confidence levels (except Dπ<10 in twoequations37) and with the expected signs. Further, all equations co-integrate at the 1%significance level. Thus, we can conclude that all the explanatory variables (i.e., the 1981pension reform, the structural reforms, the 1986 banking reform and the reduction ininflation) had a significant effect on fostering the development of capital markets.
Using the estimated equations next we calculate the contribution of the different factorsin explaining the development of Chilean financial markets. For this we divide the sampleinto two subperiods: 1961-74 and 1986-2003. The first subperiod corresponds to thefinancial repression-cum-government-intervention development model, while the secondcorresponds to the market-oriented development model after the pension and bankingreforms of 1981 and 1986, respectively. Financial development during the first subperiodaveraged 17.4% of GDP, and during the second it averaged 143.2% of GDP. Of thisincrease —125.8 percentage points of GDP— about 37% is explained by the pensionreform of 1981; 24% by the reduction in inflation; 20% by the banking reform of 1986, and19% by other structural reforms (table 14). Thus, it can be concluded that the pensionreform contributed proportionately more than other reforms and policies to thedevelopment of the financial sector in Chile.
Next, using the same approach we run similar regressions to identify those factors thatexplain the development of the Chilean banking sector. For this we replace the dependentvariable for total bank credit to the private sector, also measured as a share of GDP (notethat this definition matches the one used in the cross-sectional analysis of subsection VI.1).Figure 11 shows the evolution of this variable. As can be seen in the figure, bank creditexperienced a boom-bust episode in the late 1970s and early 1980s, which led to the 1981-83 debt-crisis38. One consequence of the crisis was that the government had to interveneand take over several financial institutions, leading to its controlling about 60% of thedomestic banking system. Furthermore, in the aftermath of the debt crisis the governmentimplemented several measures to clean up and re-capitalize the financial system. For thisreason, a significant share of total credit in the years following the debt crisis consisted ofemergency and soft loans granted under different criteria than the ones applied in normaltimes by a privately run bank. To control for this effect we introduce a dummy variable thatequals 1.0 during 1981-85 and zero otherwise.39, 40 This variable also replaces the previous 37 This result and the statistical significance of the Dπ<20 dummy are consistent with the existence of non-
linear effects of inflation on financial development (see footnote 36).38 See De Gregorio and Guidotti (1995).39 Changing the crisis years changes the estimated coefficients but not the qualitative results, although it
makes the co-integration relationships less stable.
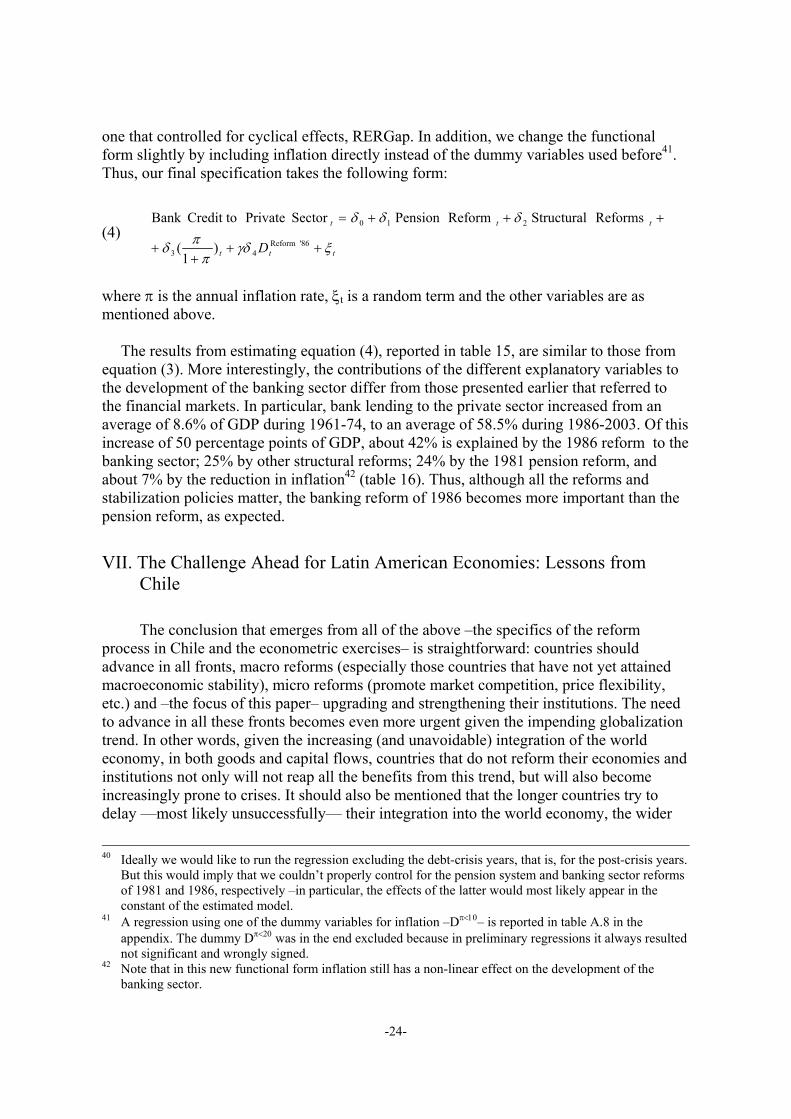
-24-
one that controlled for cyclical effects, RERGap. In addition, we change the functionalform slightly by including inflation directly instead of the dummy variables used before41.Thus, our final specification takes the following form:
(4)ttt
ttt
D ξγδπ
πδ
δδδ
+++
+
+++=
'86 Reform43
210
)1
(
Reforms Structural ReformPension Sector Private Credit toBank
where π is the annual inflation rate, ξt is a random term and the other variables are asmentioned above.
The results from estimating equation (4), reported in table 15, are similar to those fromequation (3). More interestingly, the contributions of the different explanatory variables tothe development of the banking sector differ from those presented earlier that referred tothe financial markets. In particular, bank lending to the private sector increased from anaverage of 8.6% of GDP during 1961-74, to an average of 58.5% during 1986-2003. Of thisincrease of 50 percentage points of GDP, about 42% is explained by the 1986 reform to thebanking sector; 25% by other structural reforms; 24% by the 1981 pension reform, andabout 7% by the reduction in inflation42 (table 16). Thus, although all the reforms andstabilization policies matter, the banking reform of 1986 becomes more important than thepension reform, as expected.
VII. The Challenge Ahead for Latin American Economies: Lessons fromChile
The conclusion that emerges from all of the above –the specifics of the reformprocess in Chile and the econometric exercises– is straightforward: countries shouldadvance in all fronts, macro reforms (especially those countries that have not yet attainedmacroeconomic stability), micro reforms (promote market competition, price flexibility,etc.) and –the focus of this paper– upgrading and strengthening their institutions. The needto advance in all these fronts becomes even more urgent given the impending globalizationtrend. In other words, given the increasing (and unavoidable) integration of the worldeconomy, in both goods and capital flows, countries that do not reform their economies andinstitutions not only will not reap all the benefits from this trend, but will also becomeincreasingly prone to crises. It should also be mentioned that the longer countries try todelay —most likely unsuccessfully— their integration into the world economy, the wider
40 Ideally we would like to run the regression excluding the debt-crisis years, that is, for the post-crisis years.
But this would imply that we couldn’t properly control for the pension system and banking sector reformsof 1981 and 1986, respectively –in particular, the effects of the latter would most likely appear in theconstant of the estimated model.
41 A regression using one of the dummy variables for inflation –Dπ<10– is reported in table A.8 in theappendix. The dummy Dπ<20 was in the end excluded because in preliminary regressions it always resultednot significant and wrongly signed.
42 Note that in this new functional form inflation still has a non-linear effect on the development of thebanking sector.
-25-
the income gap with the industrial world will be. The latter because in a world of very rapidand frequent technological changes, opportunities arise and are exploited quickly by themost dynamic and open economy. In sum, the globalization trend presents opportunities,but the potential benefits will not materialize if countries do not upgrade their institutionsand policies.
The above is more easily said than done. This, because there are no short cuts and theexperience of one country cannot be easily replicated by another; what works in one casedoes not necessarily work in another. So, to make progress countries should be innovativein the design of their policies and institutions. One example is Chile’s 1981 pension reformwhich, as said, was key to foster the development of the country’s financial sector. The newsystem and the transition from the old one was not copied from elsewhere; it was brandnew and started from scratch. Countries that have tried to copy the Chilean system,however, have not always succeeded because of their own idiosyncrasies. Another exampleis the unremunerated reserve requirement or encaje that Chile used in the 1990s that, albeitsome controversy about its effectiveness in achieving all the objectives for which it wasdesigned, at least changed the composition of capital inflows toward the more stable andwith longer maturities. This policy tool worked in Chile because of the rule of law and thetight monitoring exerted by the Central Bank on commercial banks, but by its nature is apotential source for corruption.
Despite these caveats, there are a few general lessons to be learned from Chile’sexperience, and from other successful experiences, that can be extended to other LatinAmerican countries:
• Fiscal responsibility is a must. This because other macro objectives —low inflation,financial sector stability, balance of payments stability— may not be attainable withoutit. Further, fiscal sustainability leads to lower country risk and reduces the volatility ofcapital flows, all of which ease the adjustment to shocks. Whether fiscal policy isdesigned to be countercyclical, while desirable, is not as important as to put in placemechanisms to assure fiscal sustainability. Chile’s structural fiscal surplus rule may notwork for every country, but is one alternative way to proceed.
• Financial sector supervision and regulation must be upgraded and the banking sectorstrengthened. Whether regulation is organized by type of institution (i.e., banks versusfinancial companies) or by type of activity (i.e., mortgages versus credit cards) is opento discussion. Similarly, there is no clear cut on whether the industry should beorganized under the universal banking model or the narrow banking model. But it isclear that a weak financial sector can become a major obstacle to implement macropolicies and, most importantly, to attain macroeconomic stability. Further, a strongerfinancial sector will foster the growth process.
• As for exchange rate policy, experience has taught that intermediate regimes are subjectto attacks (especially with the de facto increasing financial integration). Further, capitalcontrols are not very effective, except for very short periods of time, and used alongwith sterilization policies can be quite costly (in addition to being a potential source ofcorruption). Therefore, countries have to choose between a float and a hard peg. A floateases the adjustment to external shocks that require the real exchange rate to depreciate,and permits using monetary policy in a countercyclical fashion; however, it requires to
-26-
have in place a credible nominal anchor. On the other hand, a hard peg calls for a highlyflexible economy, especially with regards to the labor market, and a very solid bankingsystem. The latter conditions may be hard to meet in Latin American countries.
• The mix of inflation targeting, financial integration, and a float has functioned well inChile’s case in the past decade. Similarly, a hard peg and capital mobility havefunctioned well in Hong Kong for more than two decades. Which way to go is hard tosay; it depends on each country’s characteristics: whether there is an alternative credibleanchor, which, in turn, depends on the track record and reputation of the Central Bank,the strength of banks, and the flexibility of prices (wages).
• One important lesson to be drawn is that, irrespective of the specific exchange rate andmonetary policy arrangements, the macro policy mix must be internally consistent androbust to different scenarios. Policies must prove to work in periods of bonanza as wellas during global slowdowns; this is the only way that credibility will be enhanced,diminishing the likelihood of speculative (unfounded) attacks.
• Countries should advance further in completing the so-called first generation reforms,in particular, in attaining macro stability. It should be stressed that second generationreforms are conditional on macro recovery and sustainability. In addition, countriesshould move forward in completing their trade liberalization processes. Given thesluggishness of multilateral agreements, like those under the auspices of the WTO,unilateral tariff reductions and bilateral free trade agreements —such as those of Chilewith the US or the European Union— may be valid alternatives.
• In order to enhance the chances of attaining higher economic growth on a sustainedbasis, countries should implement reforms and policies aimed at fostering thedevelopment of the financial sector. A sound and modern banking regulation is a must,and a pension reform that guarantees the system’s solvency in the medium and longterm highly recommended (although this does not necessarily imply replicating theChilean system).
• Significant progress is needed throughout the region in the areas of privatization of stateowned enterprises and tax reforms. However, before proceeding with the privatizationof SOEs two conditions must be met: (i) a transparent mechanism for privatization mustbe designed, to minimize the chances of corruption; and (ii) a clear regulatoryframework, including rate setting mechanisms, must be designed for utilities and othernatural monopolies. If these conditions are not met, the privatization process will nothave public support, leading to government intervention and setbacks.
• As it can be concluded from the empirical analysis, significant progress is needed inimproving the compliance with the rule of law, raising government effectiveness,reducing corruption, protecting property rights, increasing the efficiency of thejudiciary, enhancing market competition, and limiting political interference withmonetary, fiscal and exchange rate policies.
• And finally, there are two areas where every Latin American country, including Chile,has to make significant progress, namely income distribution and labor marketflexibility. Although seemingly unrelated, we discuss them together because reforms inthese areas will affect (favorably) mostly the poor.
-27-
- Labor market reform should be aimed at reducing hiring in the informal economy,where employers fail to provide social security, medical insurance and othermandatory benefits. In addition, increasing labor market flexibility would benefitmainly unskilled workers who are hurt the most with cyclical fluctuations becauseof minimum wages or because they are more easily replaced. It should also be notedthat the main way through which the unskilled can raise their human capital —andincome— is by staying employed (through on-the-job training).
- And with regards to income distribution, the challenge is to design policies thatallow the poor to work their way out of poverty; that is, to break the vicious circleby which children of poor people remain poor because they do not have access to aproper education. Among other, key components in the design of these policies are(i) to provide more and better education for the poor (according to internationalstandardized tests, education in Latin America is inadequate), and (ii) to grant moreaccess to credit to micro and small enterprises. Evidence suggests that small andmicro enterprises, which employ a large fraction of the poor and unskilled, have noaccess to formal credit, whereby they end up paying a high cost of funding (whenavailable through informal channels) or cannot invest and grow. Besides, manymicro enterprises remain in the informal sector for years. State policies aimed atfostering their development may have a significant impact on income distribution inthe medium term. With regards to education, it should be emphasized that designingadequate policies becomes more urgent because of the globalization trendmentioned above, that is, because technological changes tend to benefit more theskilled and educated groups that can adjust to and adopt the new technologies moreeasily.
- The need to improve income distribution becomes even more urgent if one takesinto account that in order to be sustainable the reform process needs public support.If a large part of the population feels that they are left behind, there is an increasingrisk of social unrest and track backing in the reform process.
VIII. Summary and Conclusions
This paper addresses the issue of how can countries in Latin America, and otherdeveloping regions, accelerate their growth rates and close their per capita income gap withthe industrial countries. The main motivation of the paper is to contrast the experience ofChile, that during the 1990s grew at high rates and reduced its poverty rate sharply, with therest of the region that, although recovering from the very poor performance of the 1980s(the so-called lost decade), failed to resume the growth rates of the 1960s and 1970s.
Based on recent theoretical and empirical findings, we argue that Chile's successstory is due to the breadth of its reform process, that continues to this date and has beenmuch deeper and broader in scope than that carried out in other countries. The reform hasnot only boosted the country's macro fundamentals but also upgraded and strengthened itsinstitutions. The high payoff from Chile’s reform is due to its breadth and continuancethrough time.
-28-
One conclusion of the paper is that Latin American countries should put additionaleffort in their reform processes, in many cases completing the so-called first generationreforms: e.g., fiscal stability, trade liberalization, inflation reduction. But there is also theneed to advance in second generation reforms: upgrading of the supervisory and regulatoryframework of banks, enhancing market competition and market discipline, upgrading of theregulatory framework for utilities (including a clear rate-setting mechanism), putting inplace a framework for private sector participation in infrastructure development, andreforming pension systems. The latter in the case of Chile has proven to be key to theattainment of deeper financial markets, better governance and higher economic growth.
All the reforms above are part of the macroeconomic-institutional realm and can beimplemented, albeit at different pace each. But continuos progress in all areas is needed asreforms are complementary and stagnation in one area may compromise the success of thereforms in others. Further, there are no easy policy recommendations as reforms cannot beeasily copied from one country to another. Each country has to design its own policies andimplement them taking into account its own characteristics: the way China has proceededin the past two decades is not a replica of the reforms implemented elsewhere, whileChile’s experience with reforms has been a stop-go story.
A second conclusion of the paper refers to the importance of other institutions —ruleof law, control of corruption, government effectiveness, political stability— that are beyondthe realm of political economy but, nevertheless, affect growth significantly. Althoughthere is no straightforward conclusion in this respect, we share the view that theseinstitutions are not given and countries are not condemned to their legacy. Although at amuch slower pace than other reforms, over time countries can modify these institutions.Two examples in this respect are Chile and Singapore (although the latter is far moreadvanced than the former in this respect). In the case of Chile, for instance, after 30 years ofreforms the general public have begun to acknowledge the importance of building a stronginstitutional setup to provide and support a market friendly environment with stable rules ofthe game that attracts investors, foreign or domestic. The latter allowed the governmentrecently to pass legislation to establish a merit-based career for public servants, whichreduces the chances of appointing political allies. Similarly, after about 20 years since thepension reform, workers (in the formal market) have become increasingly aware that theirpension depends on their own contributions to their retirement funds and not ongovernmental policies. Therefore, they are much more demanding than in the past withregards to transparency, disclosure, regulatory issues and other aspects pertaining to thepension fund industry.
One final conclusion of the paper is the urgent need to make real progress in socialpolicies throughout the region; especially those aimed at protecting the poorest groups.This, because of the ongoing globalization trend that exacerbates the technological gap thatexists among countries, and the different capability of the different groups of society withina country to adjust to new technologies. As a result of the rapidly changing environment,the unskilled and uneducated are expected to be hurt proportionately more than othergroups. Thus, making progress in the macro, micro and institutional fronts to accelerategrowth and reap the benefits from the ongoing globalization trend is not enough; it must beaccompanied by adequate social policies —better opportunities to acquiring humancapital— to assure that the poor are not left behind. Not making progress in improving
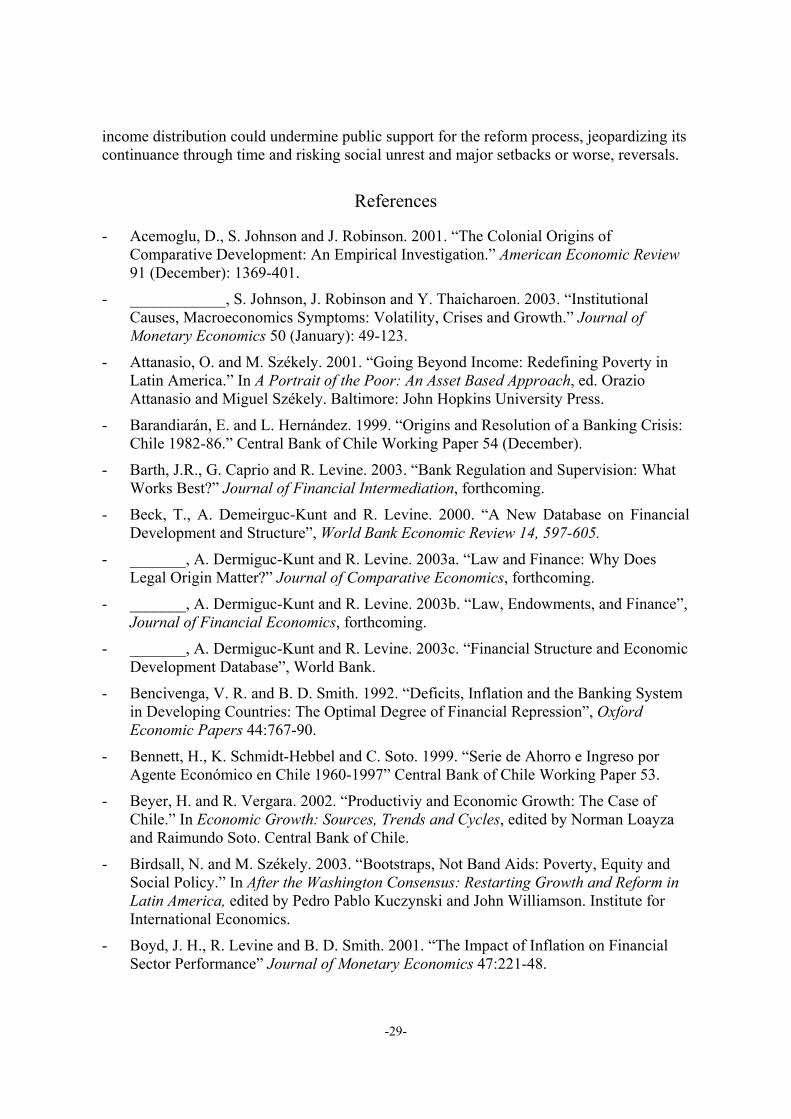
-29-
income distribution could undermine public support for the reform process, jeopardizing itscontinuance through time and risking social unrest and major setbacks or worse, reversals.
References
- Acemoglu, D., S. Johnson and J. Robinson. 2001. “The Colonial Origins ofComparative Development: An Empirical Investigation.” American Economic Review91 (December): 1369-401.
- ____________, S. Johnson, J. Robinson and Y. Thaicharoen. 2003. “InstitutionalCauses, Macroeconomics Symptoms: Volatility, Crises and Growth.” Journal ofMonetary Economics 50 (January): 49-123.
- Attanasio, O. and M. Székely. 2001. “Going Beyond Income: Redefining Poverty inLatin America.” In A Portrait of the Poor: An Asset Based Approach, ed. OrazioAttanasio and Miguel Székely. Baltimore: John Hopkins University Press.
- Barandiarán, E. and L. Hernández. 1999. “Origins and Resolution of a Banking Crisis:Chile 1982-86.” Central Bank of Chile Working Paper 54 (December).
- Barth, J.R., G. Caprio and R. Levine. 2003. “Bank Regulation and Supervision: WhatWorks Best?” Journal of Financial Intermediation, forthcoming.
- Beck, T., A. Demeirguc-Kunt and R. Levine. 2000. “A New Database on FinancialDevelopment and Structure”, World Bank Economic Review 14, 597-605.
- _______, A. Dermiguc-Kunt and R. Levine. 2003a. “Law and Finance: Why DoesLegal Origin Matter?” Journal of Comparative Economics, forthcoming.
- _______, A. Dermiguc-Kunt and R. Levine. 2003b. “Law, Endowments, and Finance”,Journal of Financial Economics, forthcoming.
- _______, A. Dermiguc-Kunt and R. Levine. 2003c. “Financial Structure and EconomicDevelopment Database”, World Bank.
- Bencivenga, V. R. and B. D. Smith. 1992. “Deficits, Inflation and the Banking Systemin Developing Countries: The Optimal Degree of Financial Repression”, OxfordEconomic Papers 44:767-90.
- Bennett, H., K. Schmidt-Hebbel and C. Soto. 1999. “Serie de Ahorro e Ingreso porAgente Económico en Chile 1960-1997” Central Bank of Chile Working Paper 53.
- Beyer, H. and R. Vergara. 2002. “Productiviy and Economic Growth: The Case ofChile.” In Economic Growth: Sources, Trends and Cycles, edited by Norman Loayzaand Raimundo Soto. Central Bank of Chile.
- Birdsall, N. and M. Székely. 2003. “Bootstraps, Not Band Aids: Poverty, Equity andSocial Policy.” In After the Washington Consensus: Restarting Growth and Reform inLatin America, edited by Pedro Pablo Kuczynski and John Williamson. Institute forInternational Economics.
- Boyd, J. H., R. Levine and B. D. Smith. 2001. “The Impact of Inflation on FinancialSector Performance” Journal of Monetary Economics 47:221-48.
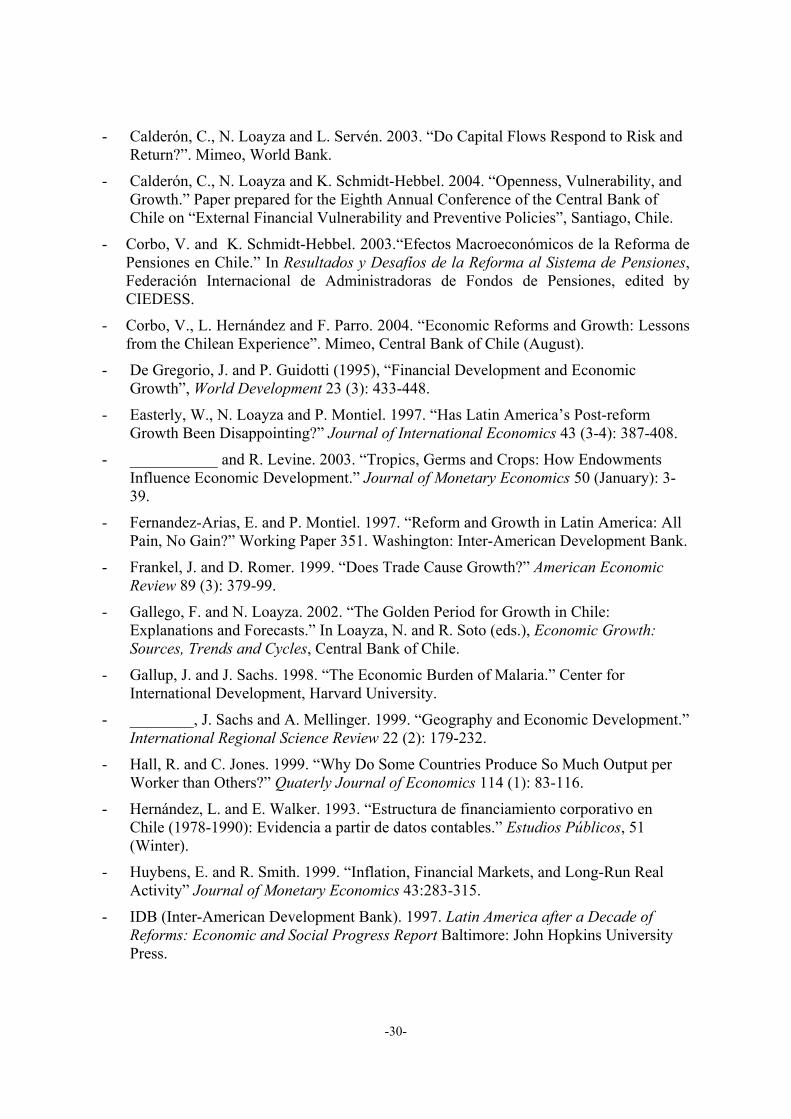
-30-
- Calderón, C., N. Loayza and L. Servén. 2003. “Do Capital Flows Respond to Risk andReturn?”. Mimeo, World Bank.
- Calderón, C., N. Loayza and K. Schmidt-Hebbel. 2004. “Openness, Vulnerability, andGrowth.” Paper prepared for the Eighth Annual Conference of the Central Bank ofChile on “External Financial Vulnerability and Preventive Policies”, Santiago, Chile.
- Corbo, V. and K. Schmidt-Hebbel. 2003.“Efectos Macroeconómicos de la Reforma dePensiones en Chile.” In Resultados y Desafíos de la Reforma al Sistema de Pensiones,Federación Internacional de Administradoras de Fondos de Pensiones, edited byCIEDESS.
- Corbo, V., L. Hernández and F. Parro. 2004. “Economic Reforms and Growth: Lessonsfrom the Chilean Experience”. Mimeo, Central Bank of Chile (August).
- De Gregorio, J. and P. Guidotti (1995), “Financial Development and EconomicGrowth”, World Development 23 (3): 433-448.
- Easterly, W., N. Loayza and P. Montiel. 1997. “Has Latin America’s Post-reformGrowth Been Disappointing?” Journal of International Economics 43 (3-4): 387-408.
- ___________ and R. Levine. 2003. “Tropics, Germs and Crops: How EndowmentsInfluence Economic Development.” Journal of Monetary Economics 50 (January): 3-39.
- Fernandez-Arias, E. and P. Montiel. 1997. “Reform and Growth in Latin America: AllPain, No Gain?” Working Paper 351. Washington: Inter-American Development Bank.
- Frankel, J. and D. Romer. 1999. “Does Trade Cause Growth?” American EconomicReview 89 (3): 379-99.
- Gallego, F. and N. Loayza. 2002. “The Golden Period for Growth in Chile:Explanations and Forecasts.” In Loayza, N. and R. Soto (eds.), Economic Growth:Sources, Trends and Cycles, Central Bank of Chile.
- Gallup, J. and J. Sachs. 1998. “The Economic Burden of Malaria.” Center forInternational Development, Harvard University.
- ________, J. Sachs and A. Mellinger. 1999. “Geography and Economic Development.”International Regional Science Review 22 (2): 179-232.
- Hall, R. and C. Jones. 1999. “Why Do Some Countries Produce So Much Output perWorker than Others?” Quaterly Journal of Economics 114 (1): 83-116.
- Hernández, L. and E. Walker. 1993. “Estructura de financiamiento corporativo enChile (1978-1990): Evidencia a partir de datos contables.” Estudios Públicos, 51(Winter).
- Huybens, E. and R. Smith. 1999. “Inflation, Financial Markets, and Long-Run RealActivity” Journal of Monetary Economics 43:283-315.
- IDB (Inter-American Development Bank). 1997. Latin America after a Decade ofReforms: Economic and Social Progress Report Baltimore: John Hopkins UniversityPress.
-31-
- Khan, M., A. Senhadji and B. Smith. 2001. “Inflation and Financial Depth”, IMFWorking Paper, N°01/44..
- Kaufmann, D., A. Kraay and M. Mastruzzi. 2003. “Governance Matters III:Governance Indicators for 1996-2002.” World Bank.
- La Porta R., F. López de Silanes, A. Schleifer y R. Vishny. 1997. “Legal Determinantsof External Finance”, Journal of Finance 52( july):1131-1150.
- _________, F. López de Silanes, A. Schleifer y R. Vishny. 1998. “Law and Finance”,Journal of Political Economy 106: 1113-55.
- _________, F. Lopez-de-Silanes, A. Schleifer and R. Vishny. 1999. “The Quality ofGovernment.” Journal of Law, Economics and Organization 15 (1): 1113-55.
- Lora, E. 2001. “Structural Reform in Latin America: What Has Been Reformed andHow to Measure It?” Research Department Working Paper 466. Washington DC, Inter-American Development Bank.
- _______ and F. Barrera. 1997. “Una década de reformas estructurales en AméricaLatina: el crecimiento, la productividad y la inversión ya no son como antes.” ResearchDepartment Working Paper 350,Washington DC, Inter-American Development Bank.
- _______ and U. Panizza. 2002. “Structural Reforms in Latin America under Scrutiny”Washington DC, Inter-American Development Bank.
- Morley, S., R. Machado and S. Petinatto. 1999. “Indexes of Structural Reform in LatinAmerica.” Serie de Reformas Económicas 12 (January), Eclac.
- Rodrik, D., A. Subramanian and F. Trebbi. 2002. “Institutions Rule: The Primacy ofInstitutions over Geography and Integration in Economic Development.” NBERWorking Paper 9305.
- Roubini, N. and X. Sala-i-Martin. 1995. “A Growth Model of Inflation, Tax Evasion,and Financial Repression”, Journal of Monetary Economics 35: 275-301.
- Stulz, R. M. and R. Williamson. 2003. “Culture, Openness, and Finance” Journal ofFinancial Economics, forthcoming.
- Williamson, J. 2003. “From Reform Agenda to Damaged Brand Name.” Finance andDevelopment (September): 10-13.
-32-
Tables and Figures
Figure 1Progress in the LACs Reform Process
-20%
0%
20%
40%
60%
80%
Total Trade Financial Taxation Privatization Labor
Up to 1989 Up to 1994 Up to 1999
Note: Progress in reform is measured as the usage (in percent) in each date, of thetotal potential room for reform available in 1985. The potential available in 1985 ismeasured by the difference with the most liberalized country in the whole sample ineach of the sub components. Source: Lora (2001).
Figure 2Economic Growth (%)
(1960-2002)
5.6
4.13.4 3.1 3.4
3.9
6.7
7.8
6.56.0
4.8
6.6
3.4
1.5
3.3
1.3
5.05.0
0123456789
60s 70s 80s 90s 2000-2002 1960-2002
World East Asia Latin America
Note: East Asia includes China, Hong-Kong, Indonesia, Korea, Malaysia, the Philippines and Thailand.Source: World Bank, WDI (2002).
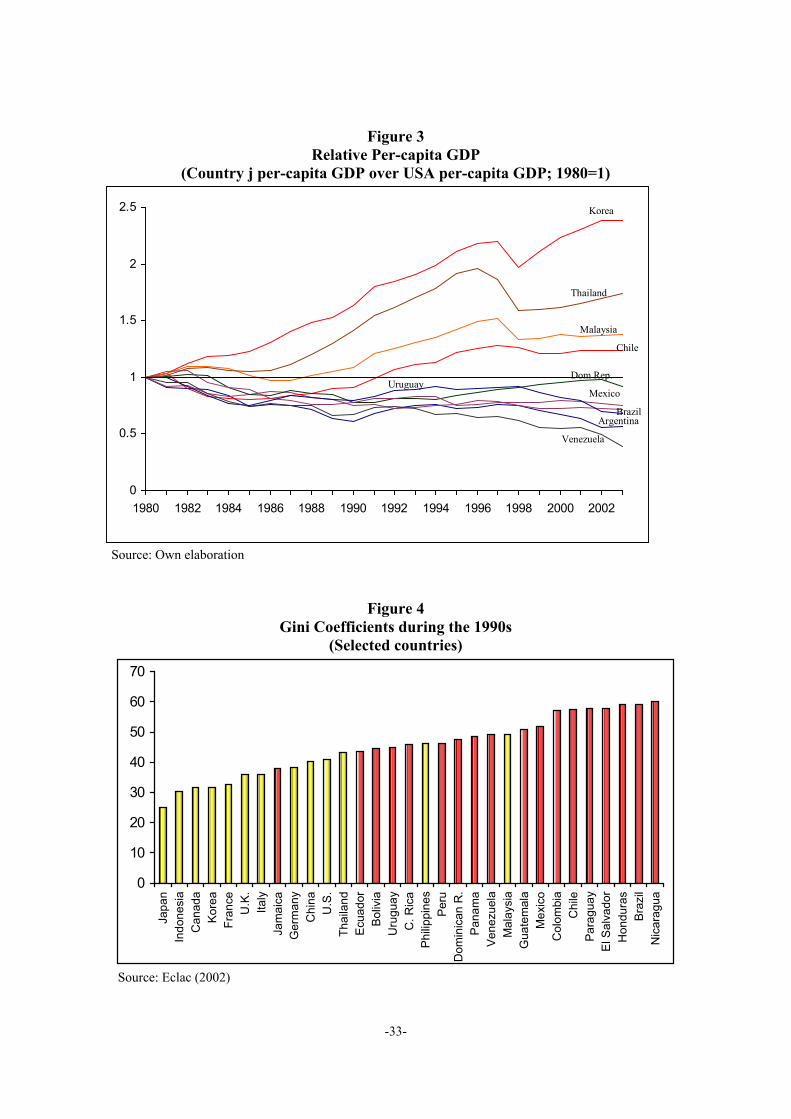
-33-
Figure 3Relative Per-capita GDP
(Country j per-capita GDP over USA per-capita GDP; 1980=1)
0
0.5
1
1.5
2
2.5
1980 1982 1984 1986 1988 1990 1992 1994 1996 1998 2000 2002
Korea
Thailand
Mexico
Malaysia
Uruguay
Venezuela
Argentina
Dom Rep.
Brazil
Chile
Source: Own elaboration
Figure 4Gini Coefficients during the 1990s
(Selected countries)
0
10
20
30
40
50
60
70
Japa
nIn
done
sia
Can
ada
Kore
aFr
ance
U.K
.Ita
lyJa
mai
caG
erm
any
Chi
naU
.S.
Thai
land
Ecua
dor
Boliv
iaU
rugu
ayC
. Ric
aPh
ilippi
nes
Peru
Dom
inic
an R
.Pa
nam
aVe
nezu
ela
Mal
aysi
aG
uate
mal
aM
exic
oC
olom
bia
Chi
lePa
ragu
ayEl
Sal
vado
rH
ondu
ras
Braz
ilN
icar
agua
Source: Eclac (2002)
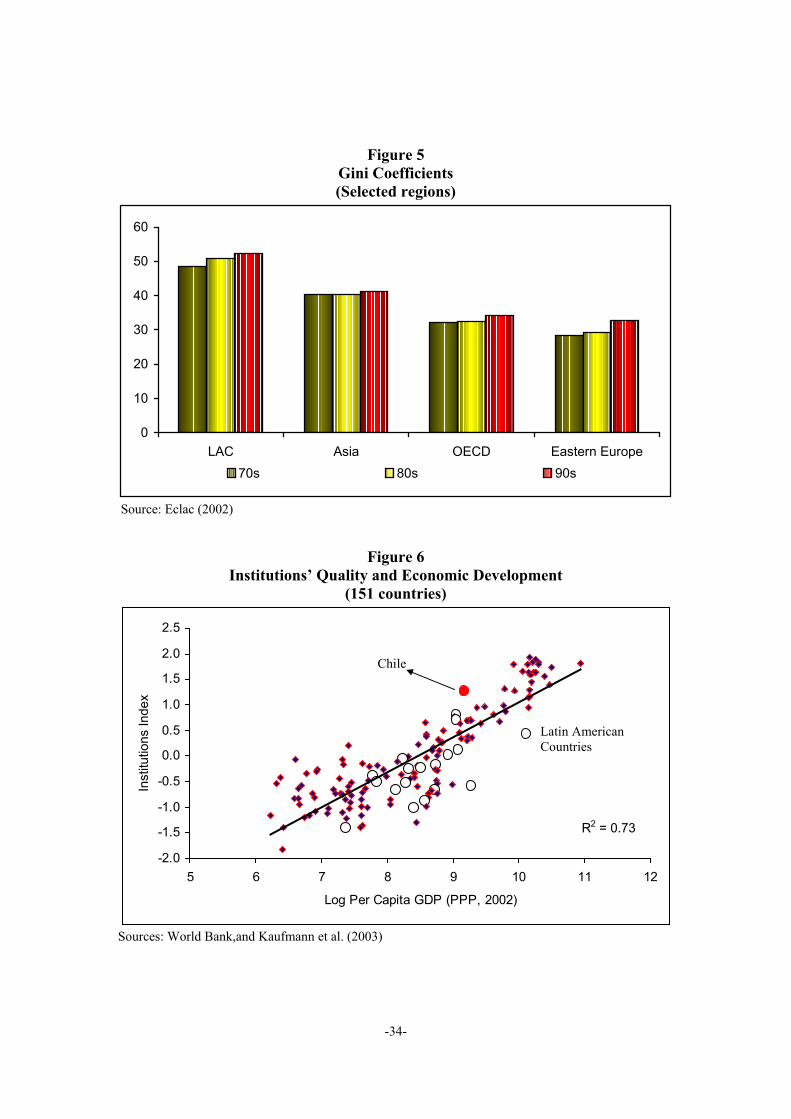
-34-
Figure 5Gini Coefficients(Selected regions)
0
10
20
30
40
50
60
LAC Asia OECD Eastern Europe70s 80s 90s
Source: Eclac (2002)
Figure 6Institutions’ Quality and Economic Development
(151 countries)
R2 = 0.73
-2.0
-1.5
-1.0
-0.5
0.0
0.5
1.0
1.5
2.0
2.5
5 6 7 8 9 10 11 12
Log Per Capita GDP (PPP, 2002)
Inst
itutio
ns In
dex
Chile
Latin AmericanCountries
Sources: World Bank,and Kaufmann et al. (2003)
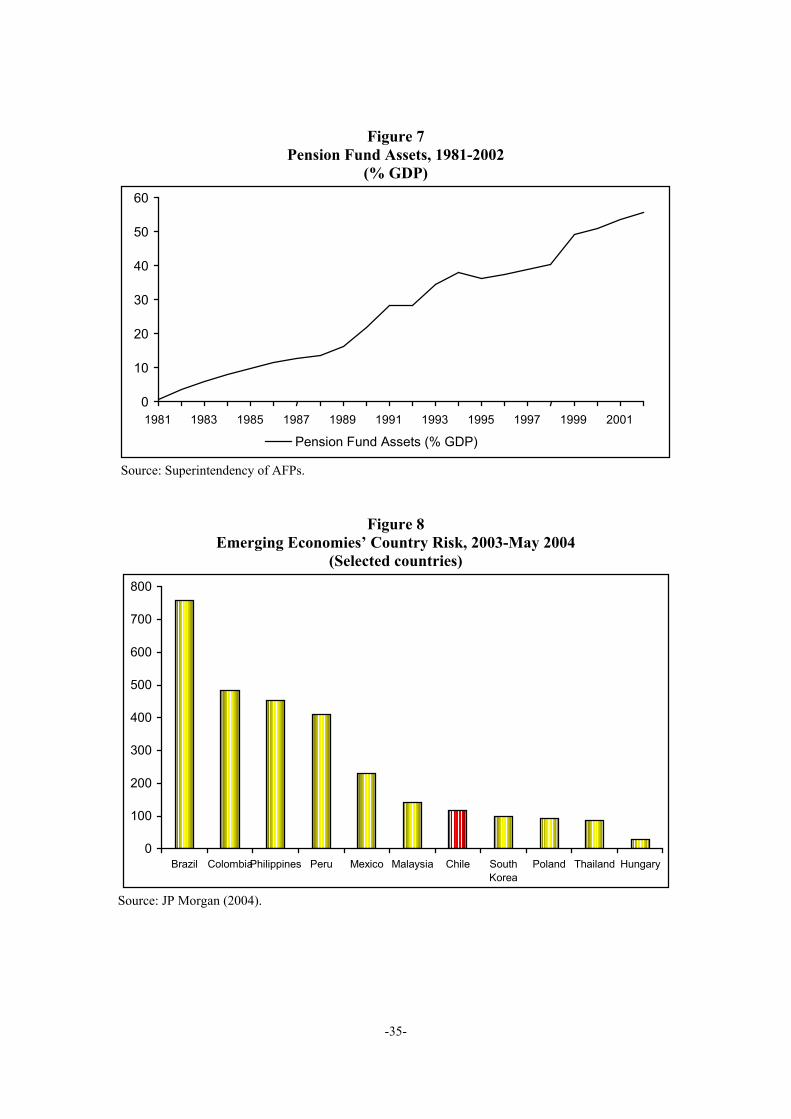
-35-
Figure 7Pension Fund Assets, 1981-2002
(% GDP)
0
10
20
30
40
50
60
1981 1983 1985 1987 1989 1991 1993 1995 1997 1999 2001
Pension Fund Assets (% GDP)
Source: Superintendency of AFPs.
Figure 8Emerging Economies’ Country Risk, 2003-May 2004
(Selected countries)
0
100
200
300
400
500
600
700
800
Brazil ColombiaPhilippines Peru Mexico Malaysia Chile SouthKorea
Poland Thailand Hungary
Source: JP Morgan (2004).
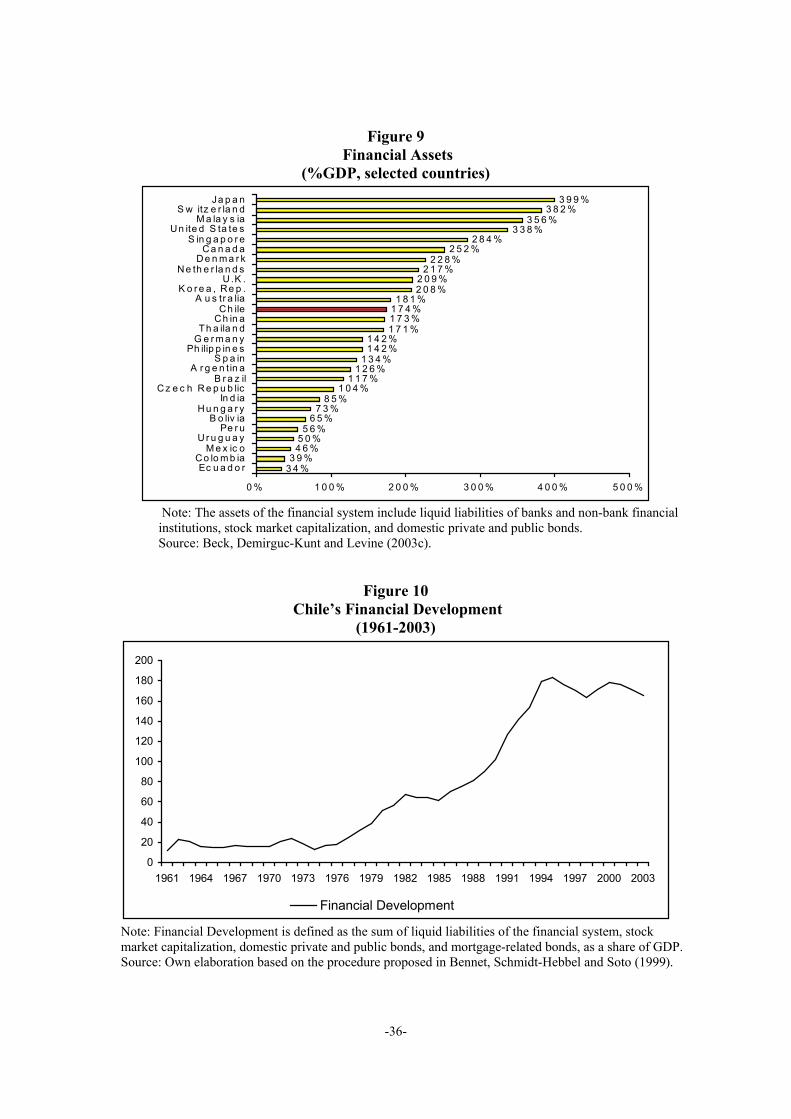
-36-
Figure 9 Financial Assets
(%GDP, selected countries)
3 4 %3 9 %
4 6 %5 0 %5 6 %
6 5 %7 3 %
8 5 %1 0 4 %
1 1 7 %1 2 6 %
1 3 4 %1 4 2 %1 4 2 %
1 7 1 %1 7 3 %1 7 4 %1 8 1 %
2 0 8 %2 0 9 %
2 1 7 %2 2 8 %
2 5 2 %2 8 4 %
3 3 8 %3 5 6 %
3 8 2 %3 9 9 %
0 % 1 0 0 % 2 0 0 % 3 0 0 % 4 0 0 % 5 0 0 %
Ec u a d o rCo lo m b ia
M e x ic oU r u g u a y
Pe r uB o liv ia
H u n g a r yIn d ia
C z e c h R e p u b licB r a z il
A r g e n tin aS p a in
Ph ilip p in e sG e r m a n yTh a ila n d
Ch in aCh ile
A u s tr a liaK o r e a , Re p .
U .K .N e th e r la n d s
D e n m a r kC a n a d a
S in g a p o r eUn ite d S ta te s
M a la y s iaS w itz e r la n d
Ja p a n
Note: The assets of the financial system include liquid liabilities of banks and non-bank financialinstitutions, stock market capitalization, and domestic private and public bonds.Source: Beck, Demirguc-Kunt and Levine (2003c).
Figure 10 Chile’s Financial Development
(1961-2003)
0
20
40
60
80
100
120
140
160
180
200
1961 1964 1967 1970 1973 1976 1979 1982 1985 1988 1991 1994 1997 2000 2003
Financial Development
Note: Financial Development is defined as the sum of liquid liabilities of the financial system, stockmarket capitalization, domestic private and public bonds, and mortgage-related bonds, as a share of GDP.Source: Own elaboration based on the procedure proposed in Bennet, Schmidt-Hebbel and Soto (1999).
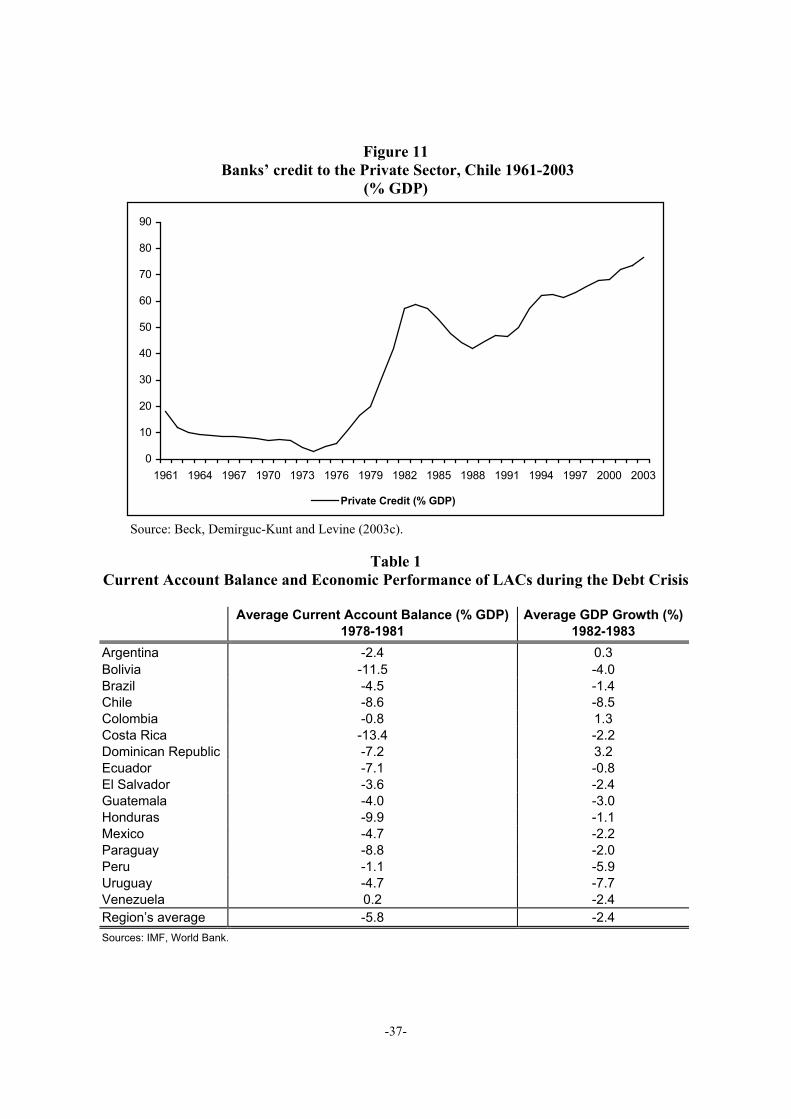
-37-
Figure 11 Banks’ credit to the Private Sector, Chile 1961-2003
(% GDP)
0
10
20
30
40
50
60
70
80
90
1961 1964 1967 1970 1973 1976 1979 1982 1985 1988 1991 1994 1997 2000 2003
Private Credit (% GDP)
Source: Beck, Demirguc-Kunt and Levine (2003c).
Table 1Current Account Balance and Economic Performance of LACs during the Debt Crisis
Average Current Account Balance (% GDP) Average GDP Growth (%)1978-1981 1982-1983
Argentina -2.4 0.3Bolivia -11.5 -4.0Brazil -4.5 -1.4Chile -8.6 -8.5Colombia -0.8 1.3Costa Rica -13.4 -2.2Dominican Republic -7.2 3.2Ecuador -7.1 -0.8El Salvador -3.6 -2.4Guatemala -4.0 -3.0Honduras -9.9 -1.1Mexico -4.7 -2.2Paraguay -8.8 -2.0Peru -1.1 -5.9Uruguay -4.7 -7.7Venezuela 0.2 -2.4Region’s average -5.8 -2.4Sources: IMF, World Bank.
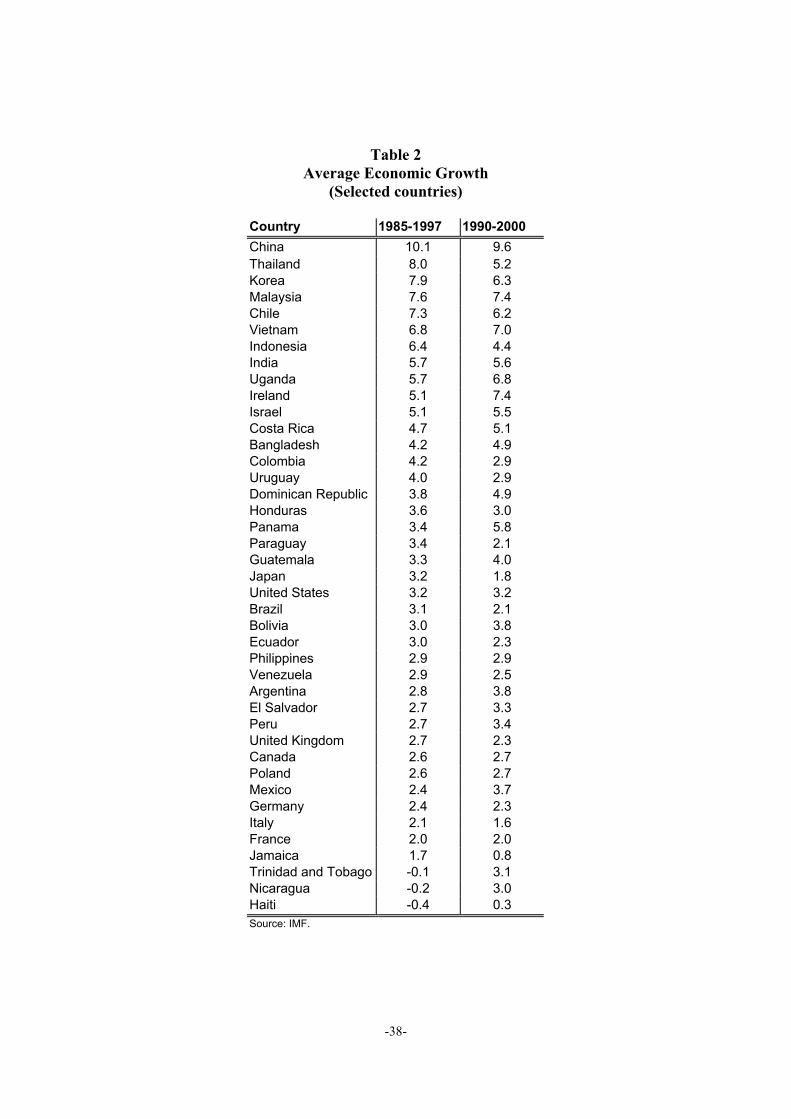
-38-
Table 2Average Economic Growth
(Selected countries)
Country 1985-1997 1990-2000China 10.1 9.6Thailand 8.0 5.2Korea 7.9 6.3Malaysia 7.6 7.4Chile 7.3 6.2Vietnam 6.8 7.0Indonesia 6.4 4.4India 5.7 5.6Uganda 5.7 6.8Ireland 5.1 7.4Israel 5.1 5.5Costa Rica 4.7 5.1Bangladesh 4.2 4.9Colombia 4.2 2.9Uruguay 4.0 2.9Dominican Republic 3.8 4.9Honduras 3.6 3.0Panama 3.4 5.8Paraguay 3.4 2.1Guatemala 3.3 4.0Japan 3.2 1.8United States 3.2 3.2Brazil 3.1 2.1Bolivia 3.0 3.8Ecuador 3.0 2.3Philippines 2.9 2.9Venezuela 2.9 2.5Argentina 2.8 3.8El Salvador 2.7 3.3Peru 2.7 3.4United Kingdom 2.7 2.3Canada 2.6 2.7Poland 2.6 2.7Mexico 2.4 3.7Germany 2.4 2.3Italy 2.1 1.6France 2.0 2.0Jamaica 1.7 0.8Trinidad and Tobago -0.1 3.1Nicaragua -0.2 3.0Haiti -0.4 0.3Source: IMF.
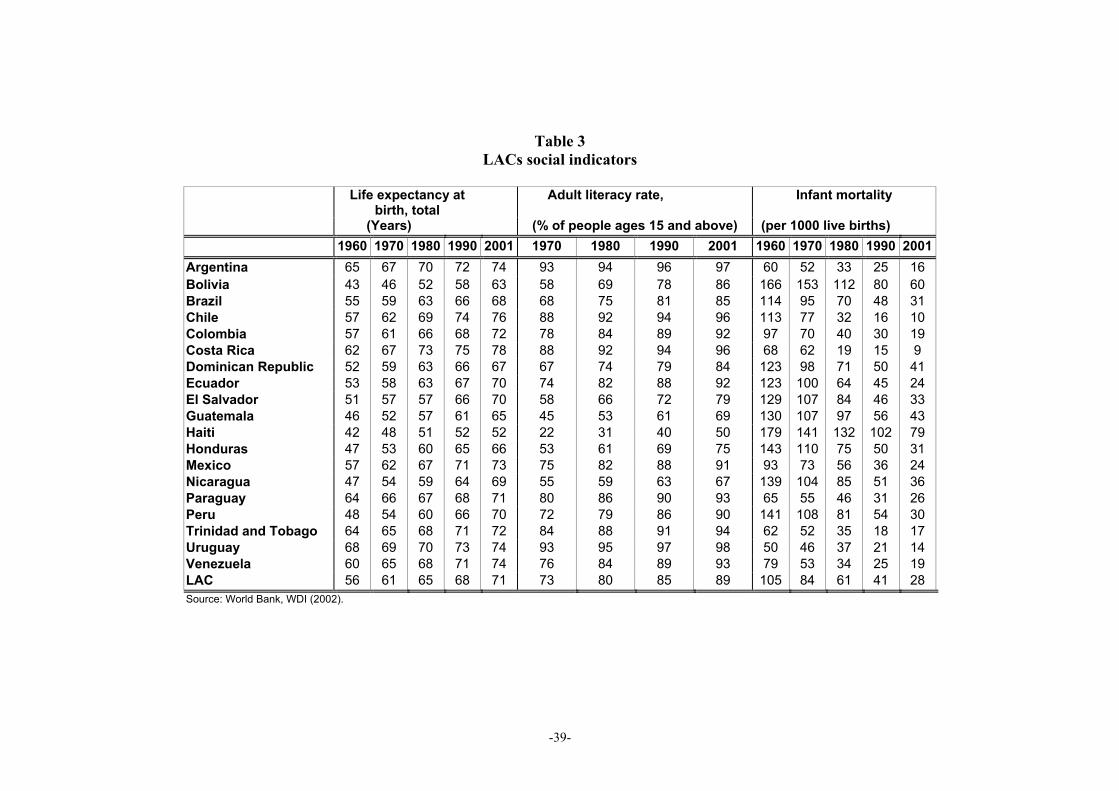
-39-
Table 3LACs social indicators
Life expectancy atbirth, total
Adult literacy rate, Infant mortality
(Years) (% of people ages 15 and above) (per 1000 live births)1960 1970 1980 1990 2001 1970 1980 1990 2001 1960 1970 1980 1990 2001
Argentina 65 67 70 72 74 93 94 96 97 60 52 33 25 16Bolivia 43 46 52 58 63 58 69 78 86 166 153 112 80 60Brazil 55 59 63 66 68 68 75 81 85 114 95 70 48 31Chile 57 62 69 74 76 88 92 94 96 113 77 32 16 10Colombia 57 61 66 68 72 78 84 89 92 97 70 40 30 19Costa Rica 62 67 73 75 78 88 92 94 96 68 62 19 15 9Dominican Republic 52 59 63 66 67 67 74 79 84 123 98 71 50 41Ecuador 53 58 63 67 70 74 82 88 92 123 100 64 45 24El Salvador 51 57 57 66 70 58 66 72 79 129 107 84 46 33Guatemala 46 52 57 61 65 45 53 61 69 130 107 97 56 43Haiti 42 48 51 52 52 22 31 40 50 179 141 132 102 79Honduras 47 53 60 65 66 53 61 69 75 143 110 75 50 31Mexico 57 62 67 71 73 75 82 88 91 93 73 56 36 24Nicaragua 47 54 59 64 69 55 59 63 67 139 104 85 51 36Paraguay 64 66 67 68 71 80 86 90 93 65 55 46 31 26Peru 48 54 60 66 70 72 79 86 90 141 108 81 54 30Trinidad and Tobago 64 65 68 71 72 84 88 91 94 62 52 35 18 17Uruguay 68 69 70 73 74 93 95 97 98 50 46 37 21 14Venezuela 60 65 68 71 74 76 84 89 93 79 53 34 25 19LAC 56 61 65 68 71 73 80 85 89 105 84 61 41 28Source: World Bank, WDI (2002).
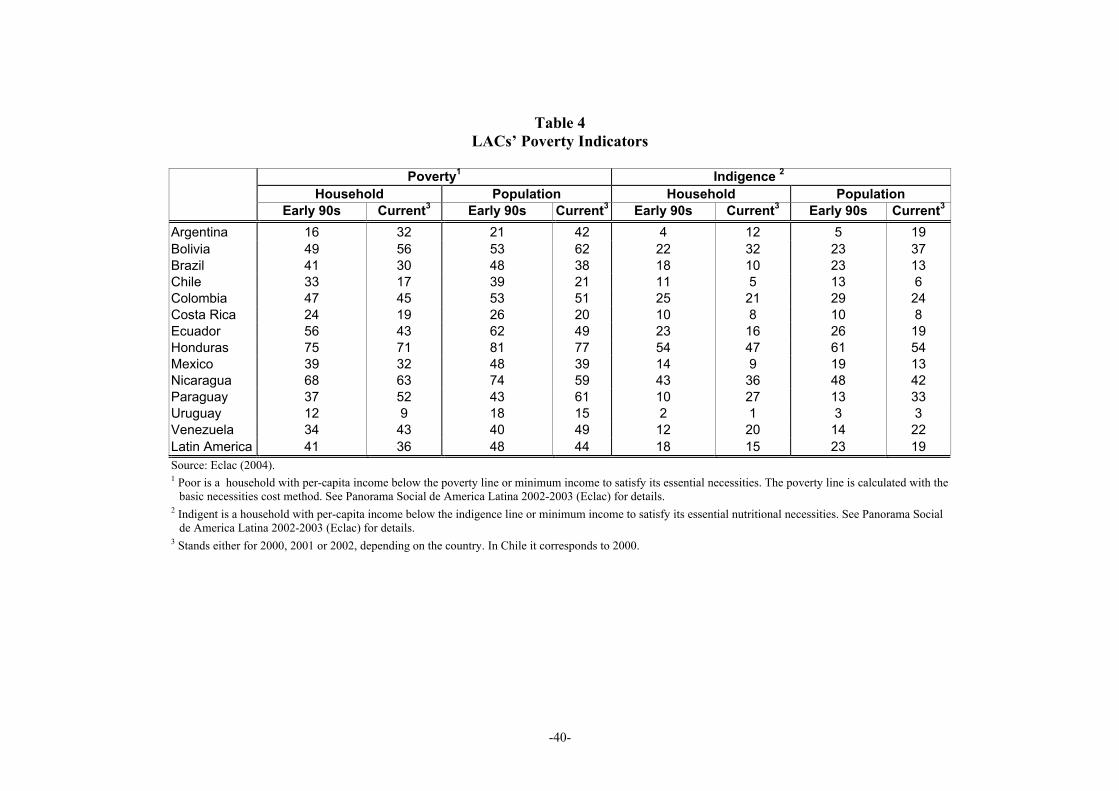
-40-
Table 4LACs’ Poverty Indicators
Poverty1 Indigence 2
Household Population Household PopulationEarly 90s Current3 Early 90s Current3 Early 90s Current3 Early 90s Current3
Argentina 16 32 21 42 4 12 5 19Bolivia 49 56 53 62 22 32 23 37Brazil 41 30 48 38 18 10 23 13Chile 33 17 39 21 11 5 13 6Colombia 47 45 53 51 25 21 29 24Costa Rica 24 19 26 20 10 8 10 8Ecuador 56 43 62 49 23 16 26 19Honduras 75 71 81 77 54 47 61 54Mexico 39 32 48 39 14 9 19 13Nicaragua 68 63 74 59 43 36 48 42Paraguay 37 52 43 61 10 27 13 33Uruguay 12 9 18 15 2 1 3 3Venezuela 34 43 40 49 12 20 14 22Latin America 41 36 48 44 18 15 23 19Source: Eclac (2004).1 Poor is a household with per-capita income below the poverty line or minimum income to satisfy its essential necessities. The poverty line is calculated with the
basic necessities cost method. See Panorama Social de America Latina 2002-2003 (Eclac) for details.2 Indigent is a household with per-capita income below the indigence line or minimum income to satisfy its essential nutritional necessities. See Panorama Social
de America Latina 2002-2003 (Eclac) for details.3 Stands either for 2000, 2001 or 2002, depending on the country. In Chile it corresponds to 2000.
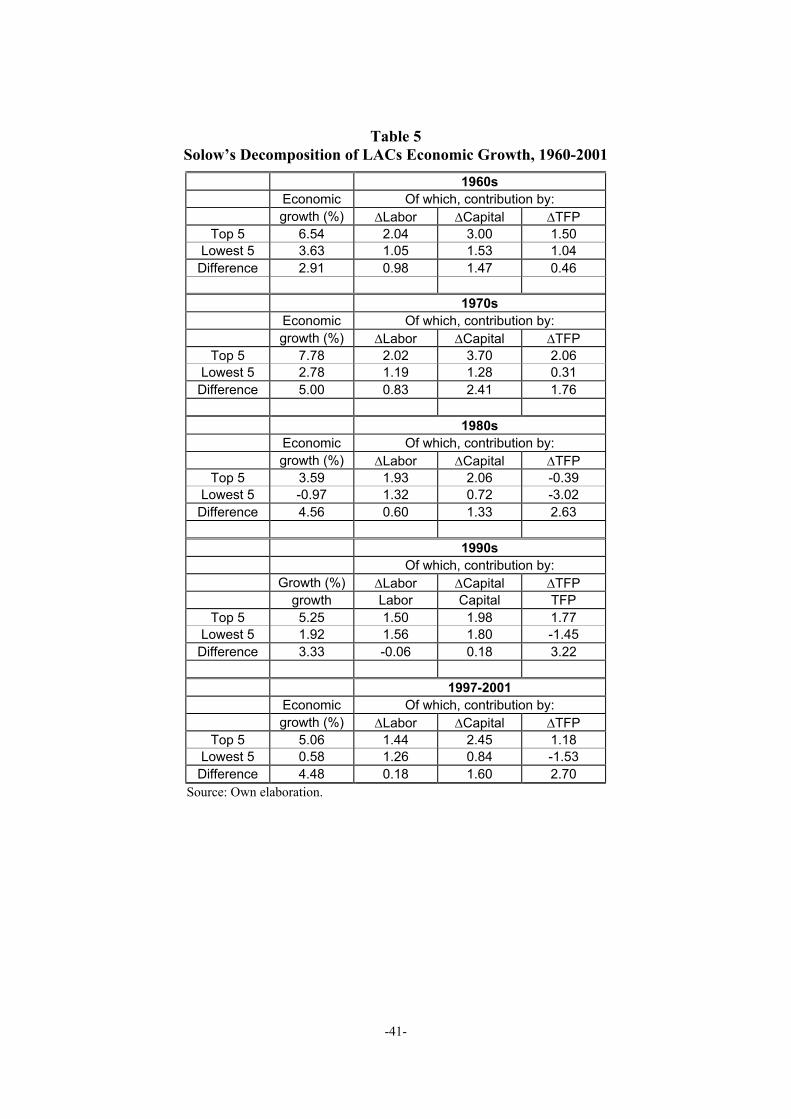
-41-
Table 5Solow’s Decomposition of LACs Economic Growth, 1960-2001
1960sEconomic Of which, contribution by:growth (%) ∆Labor ∆Capital ∆TFP
Top 5 6.54 2.04 3.00 1.50Lowest 5 3.63 1.05 1.53 1.04
Difference 2.91 0.98 1.47 0.46
1970sEconomic Of which, contribution by:growth (%) ∆Labor ∆Capital ∆TFP
Top 5 7.78 2.02 3.70 2.06Lowest 5 2.78 1.19 1.28 0.31
Difference 5.00 0.83 2.41 1.76
1980sEconomic Of which, contribution by:growth (%) ∆Labor ∆Capital ∆TFP
Top 5 3.59 1.93 2.06 -0.39Lowest 5 -0.97 1.32 0.72 -3.02
Difference 4.56 0.60 1.33 2.63
1990sOf which, contribution by:
Growth (%) ∆Labor ∆Capital ∆TFPgrowth Labor Capital TFP
Top 5 5.25 1.50 1.98 1.77Lowest 5 1.92 1.56 1.80 -1.45
Difference 3.33 -0.06 0.18 3.22
1997-2001Economic Of which, contribution by:growth (%) ∆Labor ∆Capital ∆TFP
Top 5 5.06 1.44 2.45 1.18Lowest 5 0.58 1.26 0.84 -1.53
Difference 4.48 0.18 1.60 2.70Source: Own elaboration.
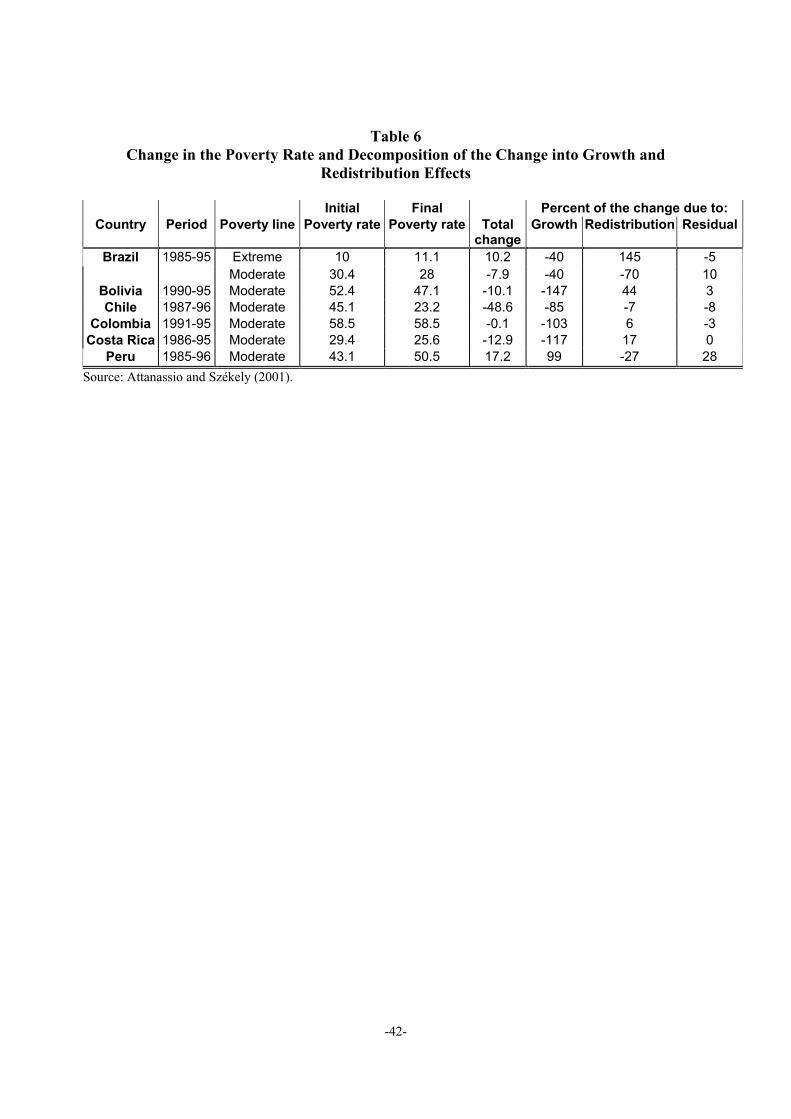
-42-
Table 6Change in the Poverty Rate and Decomposition of the Change into Growth and
Redistribution Effects
Initial Final Percent of the change due to:Country Period Poverty line Poverty rate Poverty rate Total
changeGrowth Redistribution Residual
Brazil 1985-95 Extreme 10 11.1 10.2 -40 145 -5Moderate 30.4 28 -7.9 -40 -70 10
Bolivia 1990-95 Moderate 52.4 47.1 -10.1 -147 44 3Chile 1987-96 Moderate 45.1 23.2 -48.6 -85 -7 -8
Colombia 1991-95 Moderate 58.5 58.5 -0.1 -103 6 -3Costa Rica 1986-95 Moderate 29.4 25.6 -12.9 -117 17 0
Peru 1985-96 Moderate 43.1 50.5 17.2 99 -27 28Source: Attanassio and Székely (2001).
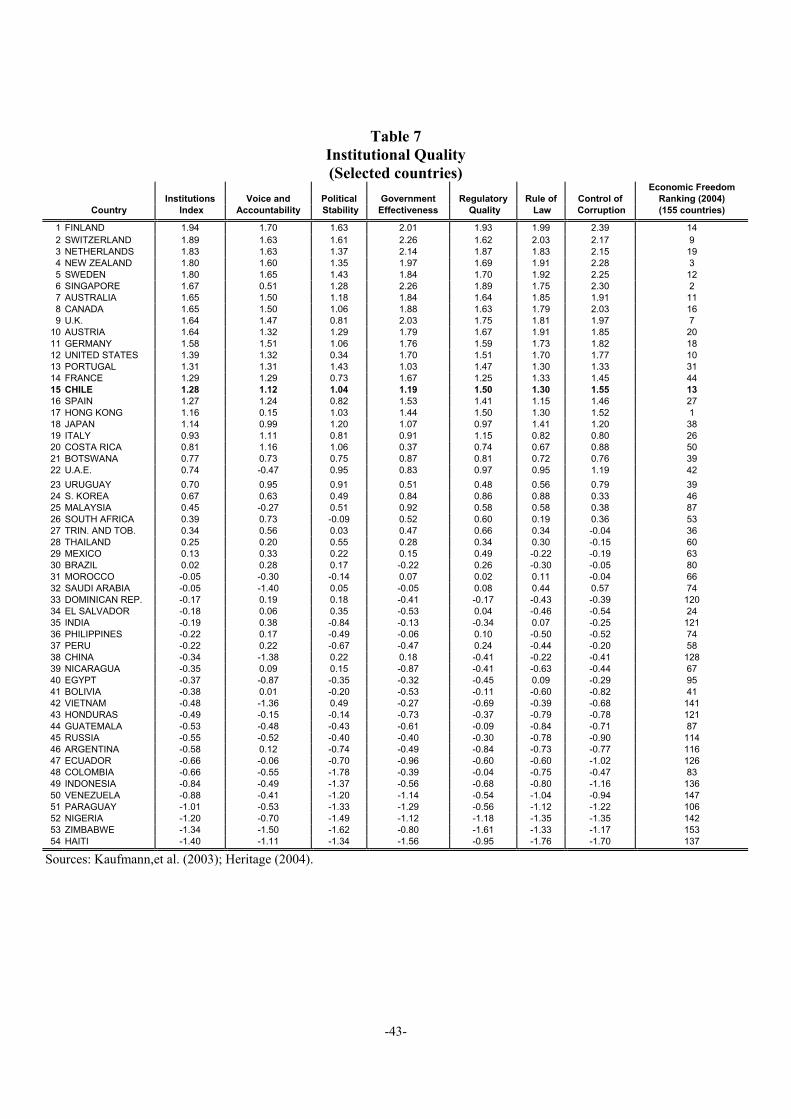
-43-
Table 7Institutional Quality(Selected countries)
Economic FreedomInstitutions Voice and Political Government Regulatory Rule of Control of Ranking (2004)
Country Index Accountability Stability Effectiveness Quality Law Corruption (155 countries)
1 FINLAND 1.94 1.70 1.63 2.01 1.93 1.99 2.39 142 SWITZERLAND 1.89 1.63 1.61 2.26 1.62 2.03 2.17 93 NETHERLANDS 1.83 1.63 1.37 2.14 1.87 1.83 2.15 194 NEW ZEALAND 1.80 1.60 1.35 1.97 1.69 1.91 2.28 35 SWEDEN 1.80 1.65 1.43 1.84 1.70 1.92 2.25 126 SINGAPORE 1.67 0.51 1.28 2.26 1.89 1.75 2.30 27 AUSTRALIA 1.65 1.50 1.18 1.84 1.64 1.85 1.91 118 CANADA 1.65 1.50 1.06 1.88 1.63 1.79 2.03 169 U.K. 1.64 1.47 0.81 2.03 1.75 1.81 1.97 7
10 AUSTRIA 1.64 1.32 1.29 1.79 1.67 1.91 1.85 2011 GERMANY 1.58 1.51 1.06 1.76 1.59 1.73 1.82 1812 UNITED STATES 1.39 1.32 0.34 1.70 1.51 1.70 1.77 1013 PORTUGAL 1.31 1.31 1.43 1.03 1.47 1.30 1.33 3114 FRANCE 1.29 1.29 0.73 1.67 1.25 1.33 1.45 4415 CHILE 1.28 1.12 1.04 1.19 1.50 1.30 1.55 1316 SPAIN 1.27 1.24 0.82 1.53 1.41 1.15 1.46 2717 HONG KONG 1.16 0.15 1.03 1.44 1.50 1.30 1.52 118 JAPAN 1.14 0.99 1.20 1.07 0.97 1.41 1.20 3819 ITALY 0.93 1.11 0.81 0.91 1.15 0.82 0.80 2620 COSTA RICA 0.81 1.16 1.06 0.37 0.74 0.67 0.88 5021 BOTSWANA 0.77 0.73 0.75 0.87 0.81 0.72 0.76 3922 U.A.E. 0.74 -0.47 0.95 0.83 0.97 0.95 1.19 4223 URUGUAY 0.70 0.95 0.91 0.51 0.48 0.56 0.79 3924 S. KOREA 0.67 0.63 0.49 0.84 0.86 0.88 0.33 4625 MALAYSIA 0.45 -0.27 0.51 0.92 0.58 0.58 0.38 8726 SOUTH AFRICA 0.39 0.73 -0.09 0.52 0.60 0.19 0.36 5327 TRIN. AND TOB. 0.34 0.56 0.03 0.47 0.66 0.34 -0.04 3628 THAILAND 0.25 0.20 0.55 0.28 0.34 0.30 -0.15 6029 MEXICO 0.13 0.33 0.22 0.15 0.49 -0.22 -0.19 6330 BRAZIL 0.02 0.28 0.17 -0.22 0.26 -0.30 -0.05 8031 MOROCCO -0.05 -0.30 -0.14 0.07 0.02 0.11 -0.04 6632 SAUDI ARABIA -0.05 -1.40 0.05 -0.05 0.08 0.44 0.57 7433 DOMINICAN REP. -0.17 0.19 0.18 -0.41 -0.17 -0.43 -0.39 12034 EL SALVADOR -0.18 0.06 0.35 -0.53 0.04 -0.46 -0.54 2435 INDIA -0.19 0.38 -0.84 -0.13 -0.34 0.07 -0.25 12136 PHILIPPINES -0.22 0.17 -0.49 -0.06 0.10 -0.50 -0.52 7437 PERU -0.22 0.22 -0.67 -0.47 0.24 -0.44 -0.20 5838 CHINA -0.34 -1.38 0.22 0.18 -0.41 -0.22 -0.41 12839 NICARAGUA -0.35 0.09 0.15 -0.87 -0.41 -0.63 -0.44 6740 EGYPT -0.37 -0.87 -0.35 -0.32 -0.45 0.09 -0.29 9541 BOLIVIA -0.38 0.01 -0.20 -0.53 -0.11 -0.60 -0.82 4142 VIETNAM -0.48 -1.36 0.49 -0.27 -0.69 -0.39 -0.68 14143 HONDURAS -0.49 -0.15 -0.14 -0.73 -0.37 -0.79 -0.78 12144 GUATEMALA -0.53 -0.48 -0.43 -0.61 -0.09 -0.84 -0.71 8745 RUSSIA -0.55 -0.52 -0.40 -0.40 -0.30 -0.78 -0.90 11446 ARGENTINA -0.58 0.12 -0.74 -0.49 -0.84 -0.73 -0.77 11647 ECUADOR -0.66 -0.06 -0.70 -0.96 -0.60 -0.60 -1.02 12648 COLOMBIA -0.66 -0.55 -1.78 -0.39 -0.04 -0.75 -0.47 8349 INDONESIA -0.84 -0.49 -1.37 -0.56 -0.68 -0.80 -1.16 13650 VENEZUELA -0.88 -0.41 -1.20 -1.14 -0.54 -1.04 -0.94 14751 PARAGUAY -1.01 -0.53 -1.33 -1.29 -0.56 -1.12 -1.22 10652 NIGERIA -1.20 -0.70 -1.49 -1.12 -1.18 -1.35 -1.35 14253 ZIMBABWE -1.34 -1.50 -1.62 -0.80 -1.61 -1.33 -1.17 15354 HAITI -1.40 -1.11 -1.34 -1.56 -0.95 -1.76 -1.70 137
Sources: Kaufmann,et al. (2003); Heritage (2004).
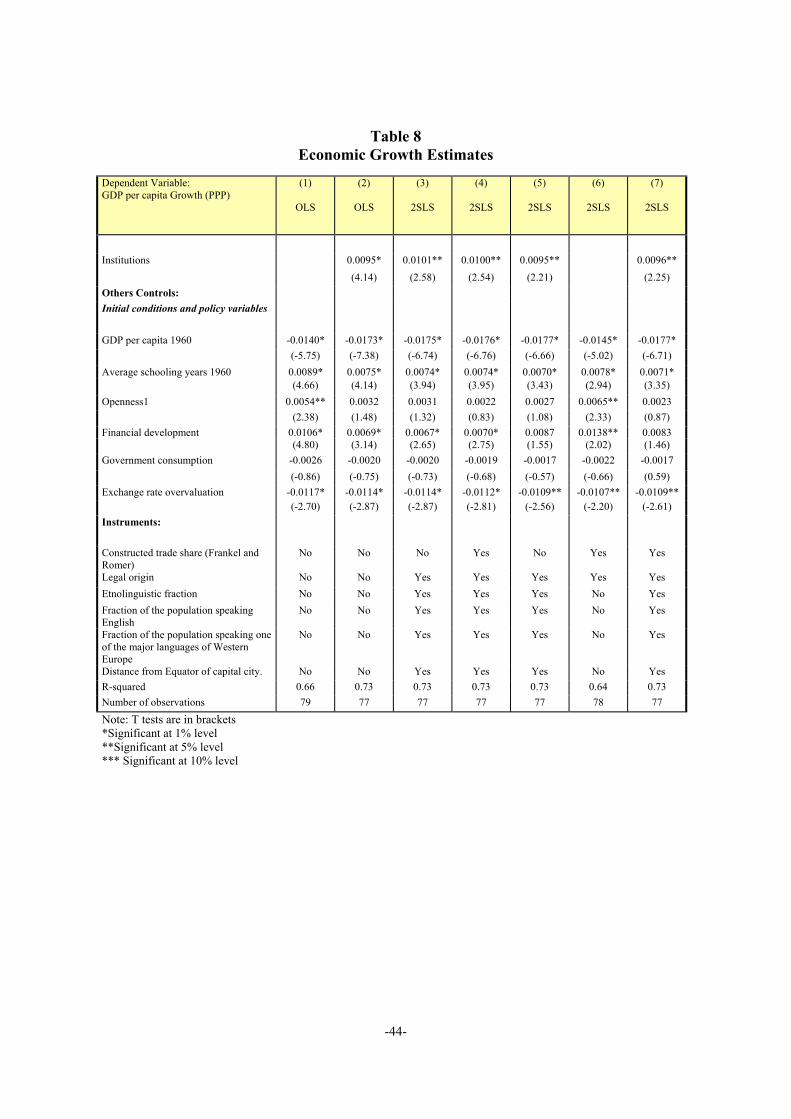
-44-
Table 8Economic Growth Estimates
Dependent Variable:GDP per capita Growth (PPP)
(1)
OLS
(2)
OLS
(3)
2SLS
(4)
2SLS
(5)
2SLS
(6)
2SLS
(7)
2SLS
Institutions 0.0095* 0.0101** 0.0100** 0.0095** 0.0096**(4.14) (2.58) (2.54) (2.21) (2.25)
Others Controls:Initial conditions and policy variables
GDP per capita 1960 -0.0140* -0.0173* -0.0175* -0.0176* -0.0177* -0.0145* -0.0177*(-5.75) (-7.38) (-6.74) (-6.76) (-6.66) (-5.02) (-6.71)
Average schooling years 1960 0.0089* 0.0075* 0.0074* 0.0074* 0.0070* 0.0078* 0.0071*(4.66) (4.14) (3.94) (3.95) (3.43) (2.94) (3.35)
Openness1 0.0054** 0.0032 0.0031 0.0022 0.0027 0.0065** 0.0023(2.38) (1.48) (1.32) (0.83) (1.08) (2.33) (0.87)
Financial development 0.0106* 0.0069* 0.0067* 0.0070* 0.0087 0.0138** 0.0083(4.80) (3.14) (2.65) (2.75) (1.55) (2.02) (1.46)
Government consumption -0.0026 -0.0020 -0.0020 -0.0019 -0.0017 -0.0022 -0.0017(-0.86) (-0.75) (-0.73) (-0.68) (-0.57) (-0.66) (0.59)
Exchange rate overvaluation -0.0117* -0.0114* -0.0114* -0.0112* -0.0109** -0.0107** -0.0109**(-2.70) (-2.87) (-2.87) (-2.81) (-2.56) (-2.20) (-2.61)
Instruments:
Constructed trade share (Frankel andRomer)
No No No Yes No Yes Yes
Legal origin No No Yes Yes Yes Yes YesEtnolinguistic fraction No No Yes Yes Yes No YesFraction of the population speakingEnglish
No No Yes Yes Yes No Yes
Fraction of the population speaking oneof the major languages of WesternEurope
No No Yes Yes Yes No Yes
Distance from Equator of capital city. No No Yes Yes Yes No YesR-squared 0.66 0.73 0.73 0.73 0.73 0.64 0.73Number of observations 79 77 77 77 77 78 77
Note: T tests are in brackets*Significant at 1% level**Significant at 5% level*** Significant at 10% level
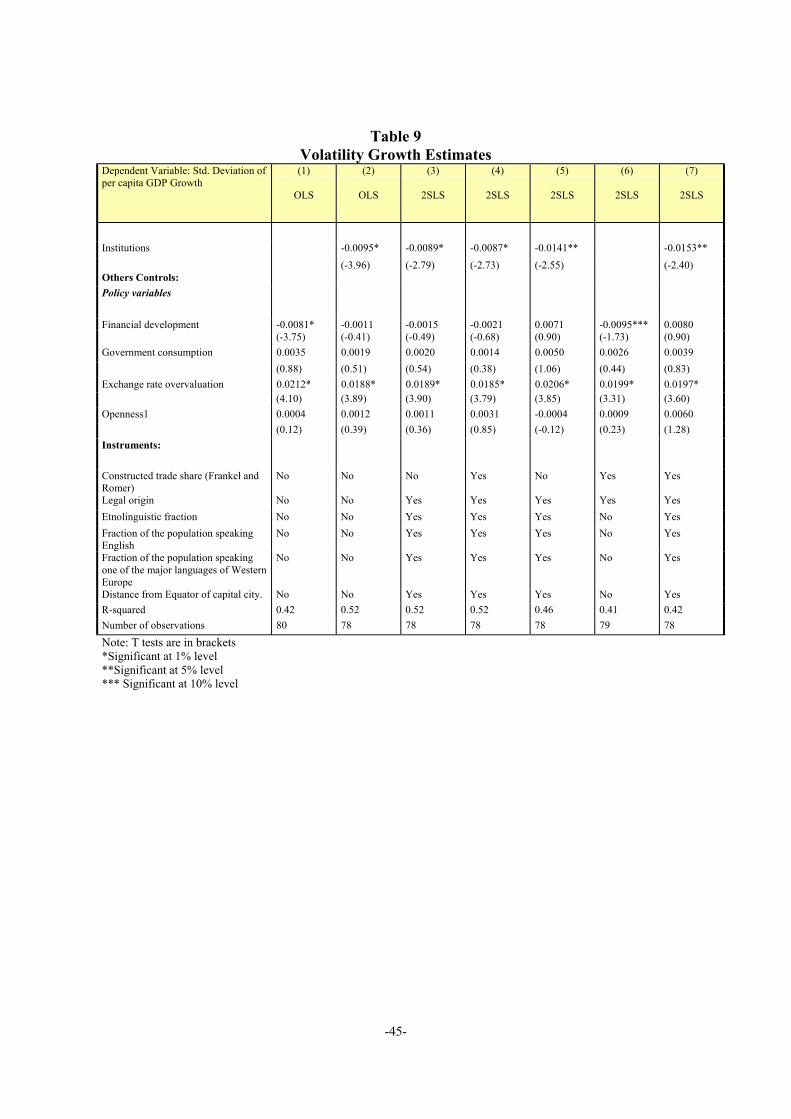
-45-
Table 9Volatility Growth Estimates
Dependent Variable: Std. Deviation ofper capita GDP Growth
(1)
OLS
(2)
OLS
(3)
2SLS
(4)
2SLS
(5)
2SLS
(6)
2SLS
(7)
2SLS
Institutions -0.0095* -0.0089* -0.0087* -0.0141** -0.0153**(-3.96) (-2.79) (-2.73) (-2.55) (-2.40)
Others Controls:Policy variables
Financial development -0.0081* -0.0011 -0.0015 -0.0021 0.0071 -0.0095*** 0.0080(-3.75) (-0.41) (-0.49) (-0.68) (0.90) (-1.73) (0.90)
Government consumption 0.0035 0.0019 0.0020 0.0014 0.0050 0.0026 0.0039(0.88) (0.51) (0.54) (0.38) (1.06) (0.44) (0.83)
Exchange rate overvaluation 0.0212* 0.0188* 0.0189* 0.0185* 0.0206* 0.0199* 0.0197*(4.10) (3.89) (3.90) (3.79) (3.85) (3.31) (3.60)
Openness1 0.0004 0.0012 0.0011 0.0031 -0.0004 0.0009 0.0060(0.12) (0.39) (0.36) (0.85) (-0.12) (0.23) (1.28)
Instruments:
Constructed trade share (Frankel andRomer)
No No No Yes No Yes Yes
Legal origin No No Yes Yes Yes Yes YesEtnolinguistic fraction No No Yes Yes Yes No YesFraction of the population speakingEnglish
No No Yes Yes Yes No Yes
Fraction of the population speakingone of the major languages of WesternEurope
No No Yes Yes Yes No Yes
Distance from Equator of capital city. No No Yes Yes Yes No YesR-squared 0.42 0.52 0.52 0.52 0.46 0.41 0.42Number of observations 80 78 78 78 78 79 78
Note: T tests are in brackets*Significant at 1% level**Significant at 5% level*** Significant at 10% level

-46-
Table 10Effect on Per-capita GDP Growth of Having Institutions like Chile’s, the Major
Advanced Economies’, or Finland’s
Institutions like Institutions like Institutions likeChile major advanced economies Finland (Top one)
Min. Mean Max. Min. Mean Max. Min. Mean Max.
Chile 0.0% 0.0% 0.0% 0.1% 0.1% 0.1% 0.4% 0.7% 1.0%Argentina 1.0% 1.9% 2.7% 1.1% 2.0% 2.8% 1.4% 2.5% 3.7%Bolivia 0.9% 1.7% 2.4% 1.0% 1.8% 2.6% 1.3% 2.3% 3.4%Brazil 0.7% 1.3% 1.8% 0.8% 1.4% 2.0% 1.1% 1.9% 2.8%Colombia 1.1% 2.0% 2.8% 1.1% 2.1% 3.0% 1.5% 2.6% 3.8%Costa Rica 0.3% 0.5% 0.7% 0.3% 0.6% 0.8% 0.6% 1.1% 1.6%Dominican Republic 0.8% 1.5% 2.1% 0.9% 1.6% 2.3% 1.2% 2.1% 3.1%Ecuador 1.1% 2.0% 2.8% 1.1% 2.1% 3.0% 1.5% 2.6% 3.8%El Salvador 0.8% 1.5% 2.1% 0.9% 1.6% 2.3% 1.2% 2.1% 3.1%Guatemala 1.0% 1.8% 2.6% 1.1% 1.9% 2.8% 1.4% 2.5% 3.6%Haiti 1.5% 2.7% 3.9% 1.6% 2.8% 4.1% 1.9% 3.4% 4.9%Honduras 1.0% 1.8% 2.6% 1.1% 1.9% 2.7% 1.4% 2.5% 3.6%Jamaica 0.7% 1.3% 1.9% 0.8% 1.4% 2.0% 1.1% 2.0% 2.9%Mexico 0.6% 1.2% 1.7% 0.7% 1.3% 1.8% 1.0% 1.8% 2.6%Nicaragua 0.9% 1.7% 2.4% 1.0% 1.7% 2.5% 1.3% 2.3% 3.3%Paraguay 1.3% 2.3% 3.3% 1.3% 2.4% 3.5% 1.7% 3.0% 4.3%Peru 0.8% 1.5% 2.2% 0.9% 1.6% 2.3% 1.2% 2.2% 3.2%Trinidad y Tobago 0.5% 1.0% 1.4% 0.6% 1.0% 1.5% 0.9% 1.6% 2.3%Uruguay 0.3% 0.6% 0.9% 0.4% 0.7% 1.0% 0.7% 1.3% 1.8%Venezuela 1.2% 2.2% 3.2% 1.3% 2.3% 3.3% 1.6% 2.9% 4.1%
Simple average excluding Chile 0.9% 1.6% 2.3% 0.9% 1.7% 2.4% 1.3% 2.3% 3.3%Simple average including Chile 0.8% 1.5% 2.2% 0.9% 1.6% 2.3% 1.2% 2.2% 3.1%Weighted average excluding Chile 0.8% 1.4% 2.0% 0.8% 1.5% 2.1% 1.1% 2.1% 3.0%Weighted average including Chile 0.7% 1.3% 1.9% 0.8% 1.4% 2.1% 1.1% 2.0% 2.9%
Notes: (1) Weighted averages are constructed using each country’s GDP as weights. (2) Min and Max are calculated usingthe average coefficient plus/minus one time the average standard deviation.Source: Own elaboration.
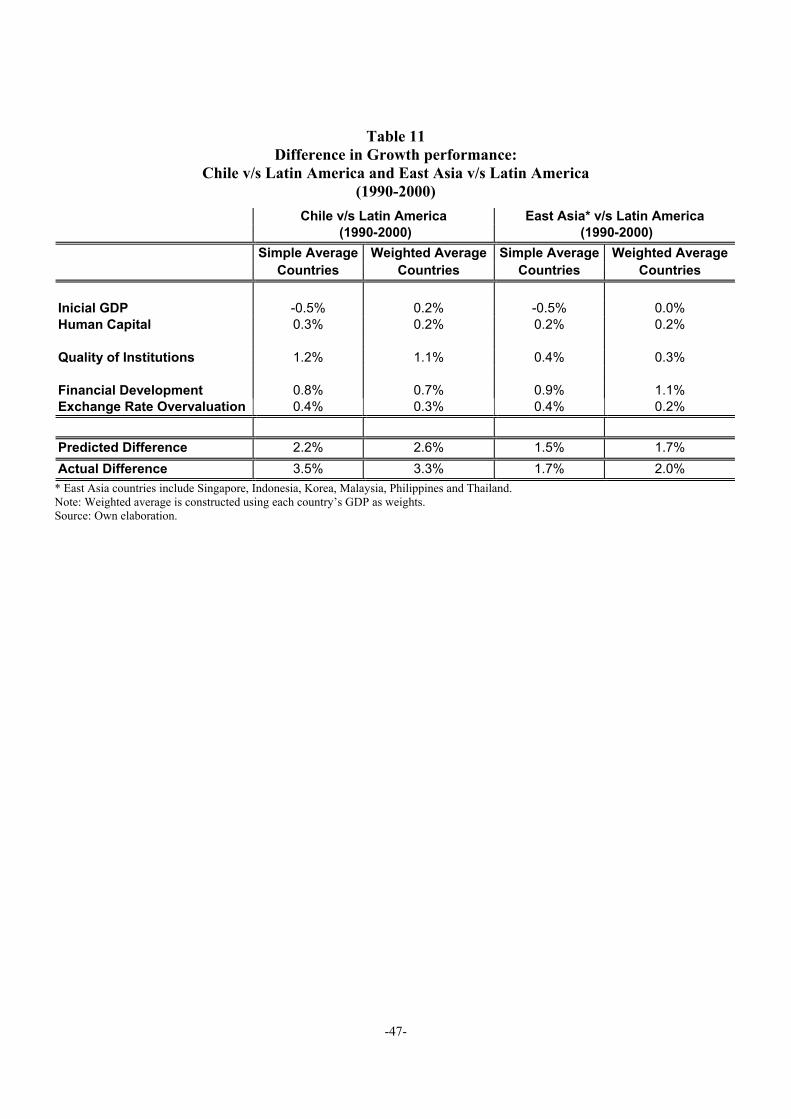
-47-
Table 11Difference in Growth performance:
Chile v/s Latin America and East Asia v/s Latin America(1990-2000)
Chile v/s Latin America East Asia* v/s Latin America (1990-2000) (1990-2000)
Simple Average Weighted Average Simple Average Weighted AverageCountries Countries Countries Countries
Inicial GDP -0.5% 0.2% -0.5% 0.0%Human Capital 0.3% 0.2% 0.2% 0.2%
Quality of Institutions 1.2% 1.1% 0.4% 0.3%
Financial Development 0.8% 0.7% 0.9% 1.1%Exchange Rate Overvaluation 0.4% 0.3% 0.4% 0.2%
Predicted Difference 2.2% 2.6% 1.5% 1.7%Actual Difference 3.5% 3.3% 1.7% 2.0%
* East Asia countries include Singapore, Indonesia, Korea, Malaysia, Philippines and Thailand.Note: Weighted average is constructed using each country’s GDP as weights.Source: Own elaboration.
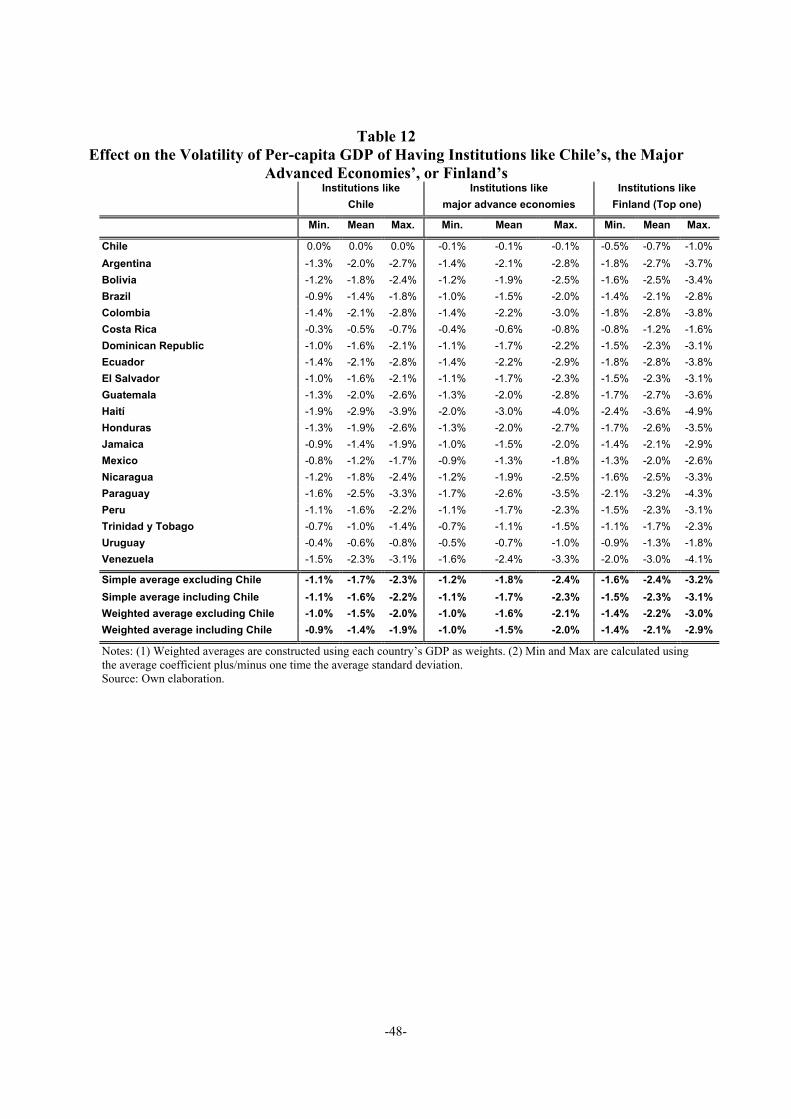
-48-
Table 12Effect on the Volatility of Per-capita GDP of Having Institutions like Chile’s, the Major
Advanced Economies’, or Finland’sInstitutions like Institutions like Institutions like
Chile major advance economies Finland (Top one)
Min. Mean Max. Min. Mean Max. Min. Mean Max.
Chile 0.0% 0.0% 0.0% -0.1% -0.1% -0.1% -0.5% -0.7% -1.0%Argentina -1.3% -2.0% -2.7% -1.4% -2.1% -2.8% -1.8% -2.7% -3.7%Bolivia -1.2% -1.8% -2.4% -1.2% -1.9% -2.5% -1.6% -2.5% -3.4%Brazil -0.9% -1.4% -1.8% -1.0% -1.5% -2.0% -1.4% -2.1% -2.8%Colombia -1.4% -2.1% -2.8% -1.4% -2.2% -3.0% -1.8% -2.8% -3.8%Costa Rica -0.3% -0.5% -0.7% -0.4% -0.6% -0.8% -0.8% -1.2% -1.6%Dominican Republic -1.0% -1.6% -2.1% -1.1% -1.7% -2.2% -1.5% -2.3% -3.1%Ecuador -1.4% -2.1% -2.8% -1.4% -2.2% -2.9% -1.8% -2.8% -3.8%El Salvador -1.0% -1.6% -2.1% -1.1% -1.7% -2.3% -1.5% -2.3% -3.1%Guatemala -1.3% -2.0% -2.6% -1.3% -2.0% -2.8% -1.7% -2.7% -3.6%Haití -1.9% -2.9% -3.9% -2.0% -3.0% -4.0% -2.4% -3.6% -4.9%Honduras -1.3% -1.9% -2.6% -1.3% -2.0% -2.7% -1.7% -2.6% -3.5%Jamaica -0.9% -1.4% -1.9% -1.0% -1.5% -2.0% -1.4% -2.1% -2.9%Mexico -0.8% -1.2% -1.7% -0.9% -1.3% -1.8% -1.3% -2.0% -2.6%Nicaragua -1.2% -1.8% -2.4% -1.2% -1.9% -2.5% -1.6% -2.5% -3.3%Paraguay -1.6% -2.5% -3.3% -1.7% -2.6% -3.5% -2.1% -3.2% -4.3%Peru -1.1% -1.6% -2.2% -1.1% -1.7% -2.3% -1.5% -2.3% -3.1%Trinidad y Tobago -0.7% -1.0% -1.4% -0.7% -1.1% -1.5% -1.1% -1.7% -2.3%Uruguay -0.4% -0.6% -0.8% -0.5% -0.7% -1.0% -0.9% -1.3% -1.8%Venezuela -1.5% -2.3% -3.1% -1.6% -2.4% -3.3% -2.0% -3.0% -4.1%
Simple average excluding Chile -1.1% -1.7% -2.3% -1.2% -1.8% -2.4% -1.6% -2.4% -3.2%Simple average including Chile -1.1% -1.6% -2.2% -1.1% -1.7% -2.3% -1.5% -2.3% -3.1%Weighted average excluding Chile -1.0% -1.5% -2.0% -1.0% -1.6% -2.1% -1.4% -2.2% -3.0%Weighted average including Chile -0.9% -1.4% -1.9% -1.0% -1.5% -2.0% -1.4% -2.1% -2.9%
Notes: (1) Weighted averages are constructed using each country’s GDP as weights. (2) Min and Max are calculated usingthe average coefficient plus/minus one time the average standard deviation.Source: Own elaboration.
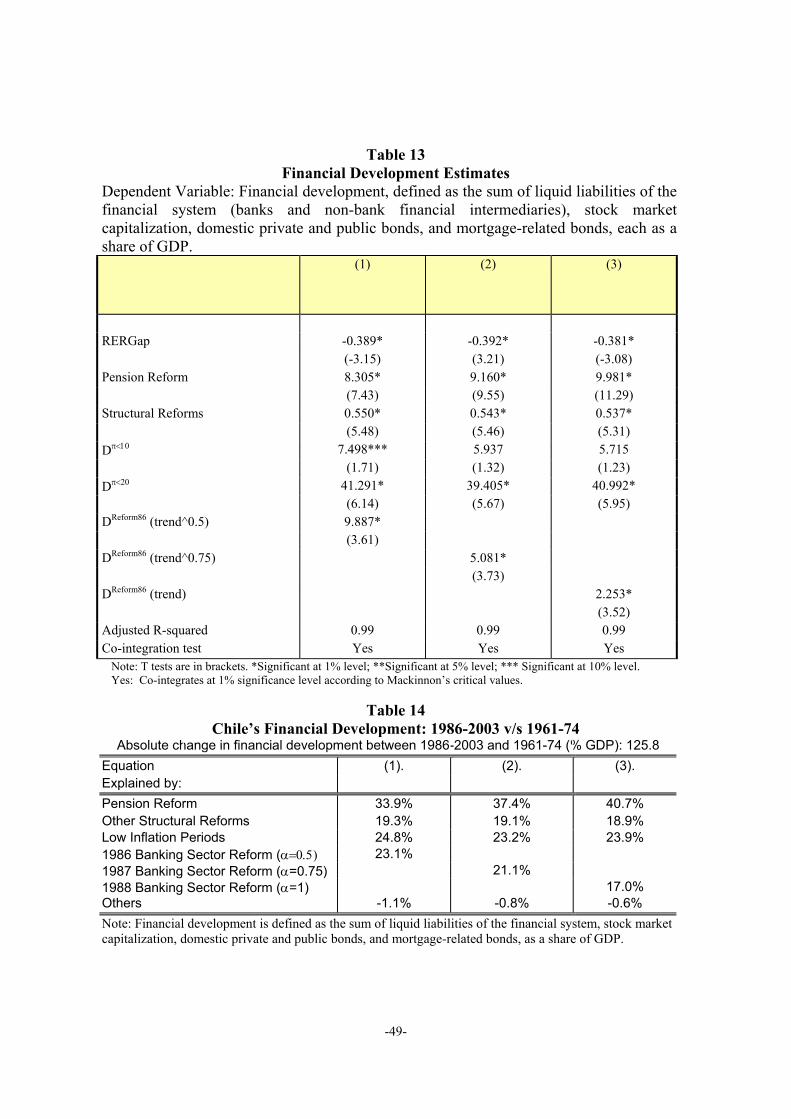
-49-
Table 13Financial Development Estimates
Dependent Variable: Financial development, defined as the sum of liquid liabilities of thefinancial system (banks and non-bank financial intermediaries), stock marketcapitalization, domestic private and public bonds, and mortgage-related bonds, each as ashare of GDP.
(1) (2) (3)
RERGap -0.389* -0.392* -0.381*(-3.15) (3.21) (-3.08)
Pension Reform 8.305* 9.160* 9.981*(7.43) (9.55) (11.29)
Structural Reforms 0.550* 0.543* 0.537*(5.48) (5.46) (5.31)
Dπ<10 7.498*** 5.937 5.715(1.71) (1.32) (1.23)
Dπ<20 41.291* 39.405* 40.992*(6.14) (5.67) (5.95)
DReform86 (trend^0.5) 9.887*(3.61)
DReform86 (trend^0.75) 5.081*(3.73)
DReform86 (trend) 2.253*(3.52)
Adjusted R-squared 0.99 0.99 0.99Co-integration test Yes Yes Yes
Note: T tests are in brackets. *Significant at 1% level; **Significant at 5% level; *** Significant at 10% level.Yes: Co-integrates at 1% significance level according to Mackinnon’s critical values.
Table 14Chile’s Financial Development: 1986-2003 v/s 1961-74
Absolute change in financial development between 1986-2003 and 1961-74 (% GDP): 125.8Equation (1). (2). (3).Explained by:Pension Reform 33.9% 37.4% 40.7%Other Structural Reforms 19.3% 19.1% 18.9%Low Inflation Periods 24.8% 23.2% 23.9%1986 Banking Sector Reform (α=0.5) 23.1%1987 Banking Sector Reform (α=0.75) 21.1%1988 Banking Sector Reform (α=1) 17.0%Others -1.1% -0.8% -0.6%Note: Financial development is defined as the sum of liquid liabilities of the financial system, stock marketcapitalization, domestic private and public bonds, and mortgage-related bonds, as a share of GDP.
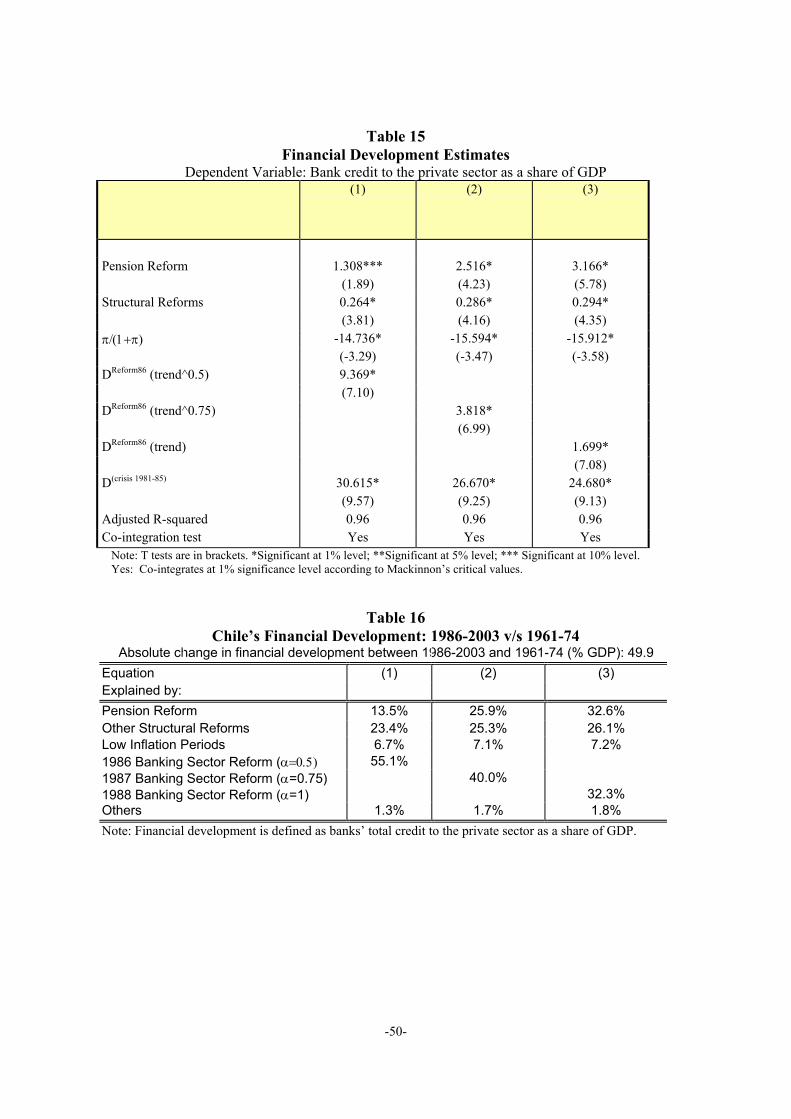
-50-
Table 15Financial Development Estimates
Dependent Variable: Bank credit to the private sector as a share of GDP(1) (2) (3)
Pension Reform 1.308*** 2.516* 3.166*(1.89) (4.23) (5.78)
Structural Reforms 0.264* 0.286* 0.294*(3.81) (4.16) (4.35)
π/(1+π) -14.736* -15.594* -15.912*(-3.29) (-3.47) (-3.58)
DReform86 (trend^0.5) 9.369*(7.10)
DReform86 (trend^0.75) 3.818*(6.99)
DReform86 (trend) 1.699*(7.08)
D(crisis 1981-85) 30.615* 26.670* 24.680*(9.57) (9.25) (9.13)
Adjusted R-squared 0.96 0.96 0.96Co-integration test Yes Yes Yes
Note: T tests are in brackets. *Significant at 1% level; **Significant at 5% level; *** Significant at 10% level.Yes: Co-integrates at 1% significance level according to Mackinnon’s critical values.
Table 16Chile’s Financial Development: 1986-2003 v/s 1961-74
Absolute change in financial development between 1986-2003 and 1961-74 (% GDP): 49.9Equation (1) (2) (3)Explained by:Pension Reform 13.5% 25.9% 32.6%Other Structural Reforms 23.4% 25.3% 26.1%Low Inflation Periods 6.7% 7.1% 7.2%1986 Banking Sector Reform (α=0.5) 55.1%1987 Banking Sector Reform (α=0.75) 40.0%1988 Banking Sector Reform (α=1) 32.3%Others 1.3% 1.7% 1.8%Note: Financial development is defined as banks’ total credit to the private sector as a share of GDP.
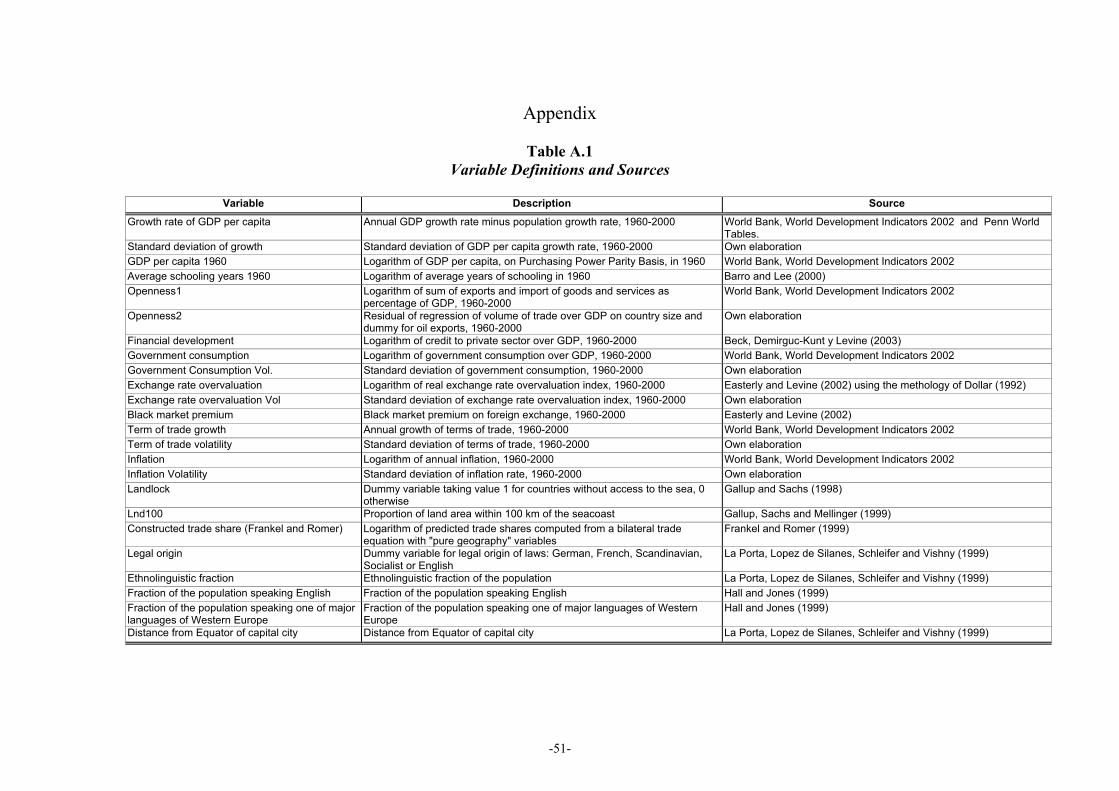
-51-
Appendix
Table A.1Variable Definitions and Sources
Variable Description SourceGrowth rate of GDP per capita Annual GDP growth rate minus population growth rate, 1960-2000 World Bank, World Development Indicators 2002 and Penn World
Tables.Standard deviation of growth Standard deviation of GDP per capita growth rate, 1960-2000 Own elaborationGDP per capita 1960 Logarithm of GDP per capita, on Purchasing Power Parity Basis, in 1960 World Bank, World Development Indicators 2002Average schooling years 1960 Logarithm of average years of schooling in 1960 Barro and Lee (2000)Openness1 Logarithm of sum of exports and import of goods and services as
percentage of GDP, 1960-2000World Bank, World Development Indicators 2002
Openness2 Residual of regression of volume of trade over GDP on country size anddummy for oil exports, 1960-2000
Own elaboration
Financial development Logarithm of credit to private sector over GDP, 1960-2000 Beck, Demirguc-Kunt y Levine (2003)Government consumption Logarithm of government consumption over GDP, 1960-2000 World Bank, World Development Indicators 2002Government Consumption Vol. Standard deviation of government consumption, 1960-2000 Own elaborationExchange rate overvaluation Logarithm of real exchange rate overvaluation index, 1960-2000 Easterly and Levine (2002) using the methology of Dollar (1992)Exchange rate overvaluation Vol Standard deviation of exchange rate overvaluation index, 1960-2000 Own elaborationBlack market premium Black market premium on foreign exchange, 1960-2000 Easterly and Levine (2002)Term of trade growth Annual growth of terms of trade, 1960-2000 World Bank, World Development Indicators 2002Term of trade volatility Standard deviation of terms of trade, 1960-2000 Own elaborationInflation Logarithm of annual inflation, 1960-2000 World Bank, World Development Indicators 2002Inflation Volatility Standard deviation of inflation rate, 1960-2000 Own elaborationLandlock Dummy variable taking value 1 for countries without access to the sea, 0
otherwiseGallup and Sachs (1998)
Lnd100 Proportion of land area within 100 km of the seacoast Gallup, Sachs and Mellinger (1999)Constructed trade share (Frankel and Romer) Logarithm of predicted trade shares computed from a bilateral trade
equation with "pure geography" variablesFrankel and Romer (1999)
Legal origin Dummy variable for legal origin of laws: German, French, Scandinavian,Socialist or English
La Porta, Lopez de Silanes, Schleifer and Vishny (1999)
Ethnolinguistic fraction Ethnolinguistic fraction of the population La Porta, Lopez de Silanes, Schleifer and Vishny (1999)Fraction of the population speaking English Fraction of the population speaking English Hall and Jones (1999)Fraction of the population speaking one of majorlanguages of Western Europe
Fraction of the population speaking one of major languages of WesternEurope
Hall and Jones (1999)
Distance from Equator of capital city Distance from Equator of capital city La Porta, Lopez de Silanes, Schleifer and Vishny (1999)
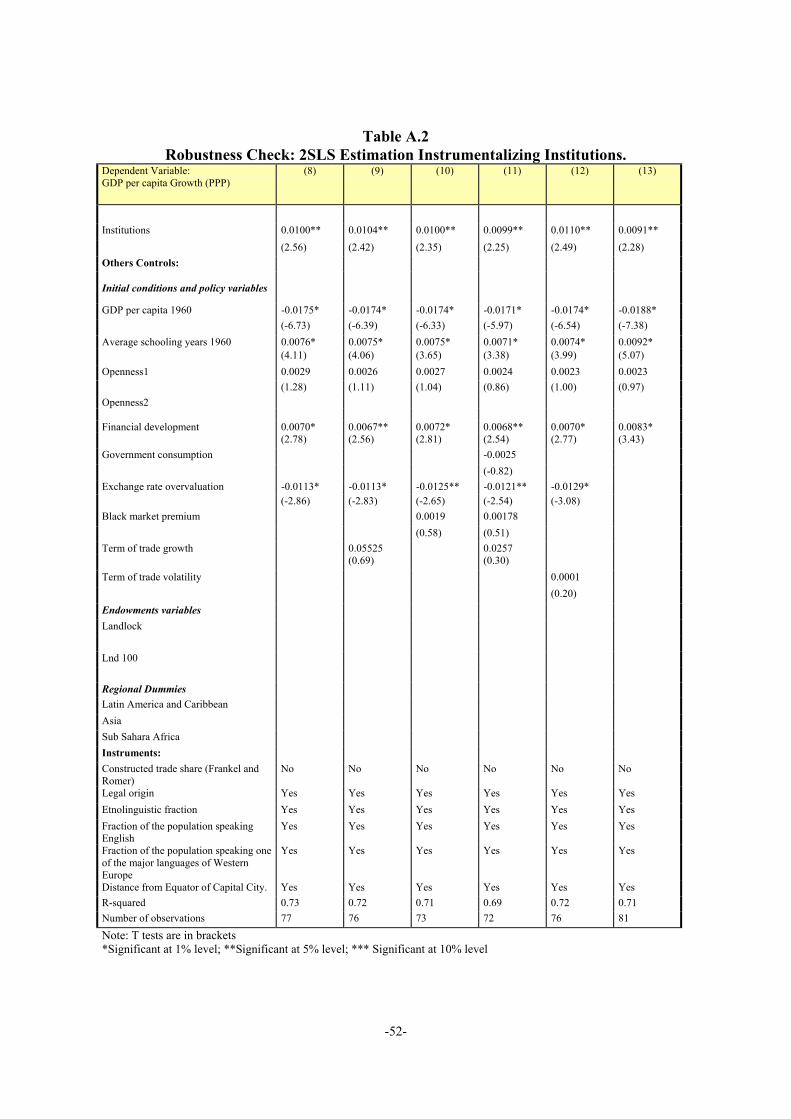
-52-
Table A.2Robustness Check: 2SLS Estimation Instrumentalizing Institutions.
Dependent Variable:GDP per capita Growth (PPP)
(8) (9) (10) (11) (12) (13)
Institutions 0.0100** 0.0104** 0.0100** 0.0099** 0.0110** 0.0091**(2.56) (2.42) (2.35) (2.25) (2.49) (2.28)
Others Controls:
Initial conditions and policy variables
GDP per capita 1960 -0.0175* -0.0174* -0.0174* -0.0171* -0.0174* -0.0188*(-6.73) (-6.39) (-6.33) (-5.97) (-6.54) (-7.38)
Average schooling years 1960 0.0076* 0.0075* 0.0075* 0.0071* 0.0074* 0.0092*(4.11) (4.06) (3.65) (3.38) (3.99) (5.07)
Openness1 0.0029 0.0026 0.0027 0.0024 0.0023 0.0023(1.28) (1.11) (1.04) (0.86) (1.00) (0.97)
Openness2
Financial development 0.0070* 0.0067** 0.0072* 0.0068** 0.0070* 0.0083*(2.78) (2.56) (2.81) (2.54) (2.77) (3.43)
Government consumption -0.0025(-0.82)
Exchange rate overvaluation -0.0113* -0.0113* -0.0125** -0.0121** -0.0129*(-2.86) (-2.83) (-2.65) (-2.54) (-3.08)
Black market premium 0.0019 0.00178(0.58) (0.51)
Term of trade growth 0.05525 0.0257(0.69) (0.30)
Term of trade volatility 0.0001(0.20)
Endowments variablesLandlock
Lnd 100
Regional DummiesLatin America and CaribbeanAsiaSub Sahara AfricaInstruments:Constructed trade share (Frankel andRomer)
No No No No No No
Legal origin Yes Yes Yes Yes Yes YesEtnolinguistic fraction Yes Yes Yes Yes Yes YesFraction of the population speakingEnglish
Yes Yes Yes Yes Yes Yes
Fraction of the population speaking oneof the major languages of WesternEurope
Yes Yes Yes Yes Yes Yes
Distance from Equator of Capital City. Yes Yes Yes Yes Yes YesR-squared 0.73 0.72 0.71 0.69 0.72 0.71Number of observations 77 76 73 72 76 81
Note: T tests are in brackets*Significant at 1% level; **Significant at 5% level; *** Significant at 10% level
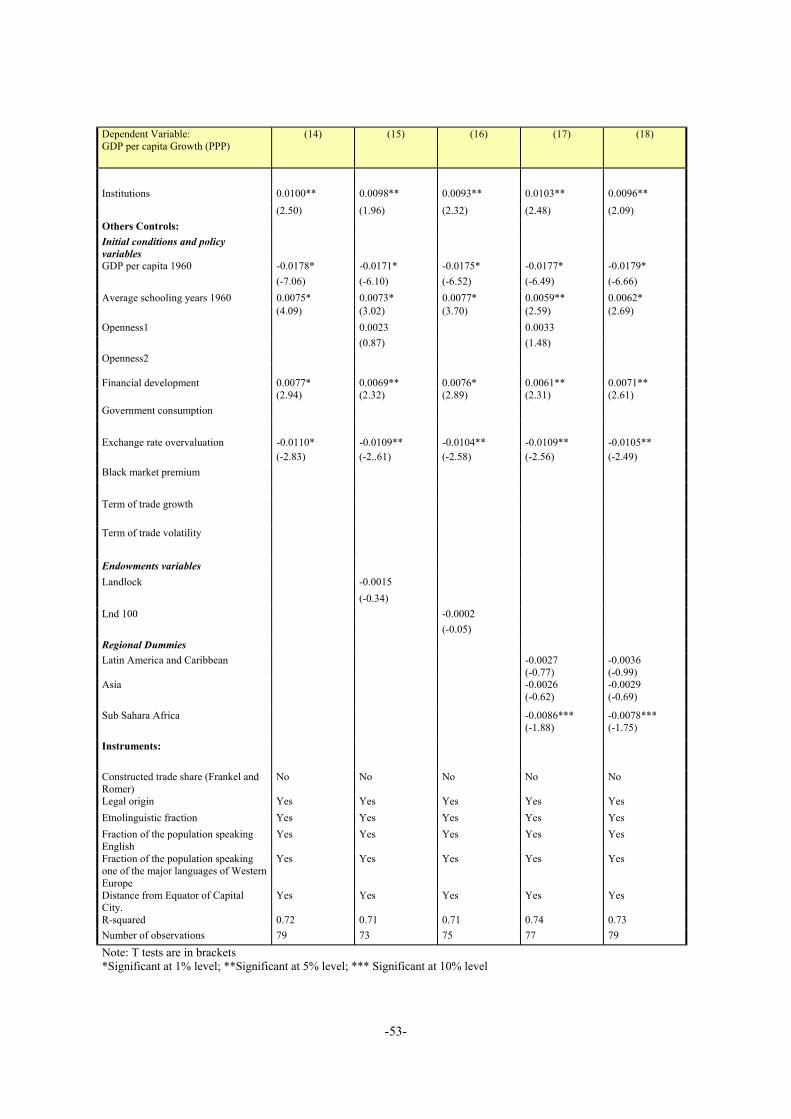
-53-
Dependent Variable:GDP per capita Growth (PPP)
(14) (15) (16) (17) (18)
Institutions 0.0100** 0.0098** 0.0093** 0.0103** 0.0096**(2.50) (1.96) (2.32) (2.48) (2.09)
Others Controls:Initial conditions and policyvariablesGDP per capita 1960 -0.0178* -0.0171* -0.0175* -0.0177* -0.0179*
(-7.06) (-6.10) (-6.52) (-6.49) (-6.66)Average schooling years 1960 0.0075* 0.0073* 0.0077* 0.0059** 0.0062*
(4.09) (3.02) (3.70) (2.59) (2.69)Openness1 0.0023 0.0033
(0.87) (1.48)Openness2
Financial development 0.0077* 0.0069** 0.0076* 0.0061** 0.0071**(2.94) (2.32) (2.89) (2.31) (2.61)
Government consumption
Exchange rate overvaluation -0.0110* -0.0109** -0.0104** -0.0109** -0.0105**(-2.83) (-2..61) (-2.58) (-2.56) (-2.49)
Black market premium
Term of trade growth
Term of trade volatility
Endowments variablesLandlock -0.0015
(-0.34)Lnd 100 -0.0002
(-0.05)Regional DummiesLatin America and Caribbean -0.0027
(-0.77)-0.0036(-0.99)
Asia -0.0026(-0.62)
-0.0029(-0.69)
Sub Sahara Africa -0.0086***(-1.88)
-0.0078***(-1.75)
Instruments:
Constructed trade share (Frankel andRomer)
No No No No No
Legal origin Yes Yes Yes Yes YesEtnolinguistic fraction Yes Yes Yes Yes YesFraction of the population speakingEnglish
Yes Yes Yes Yes Yes
Fraction of the population speakingone of the major languages of WesternEurope
Yes Yes Yes Yes Yes
Distance from Equator of CapitalCity.
Yes Yes Yes Yes Yes
R-squared 0.72 0.71 0.71 0.74 0.73Number of observations 79 73 75 77 79
Note: T tests are in brackets*Significant at 1% level; **Significant at 5% level; *** Significant at 10% level
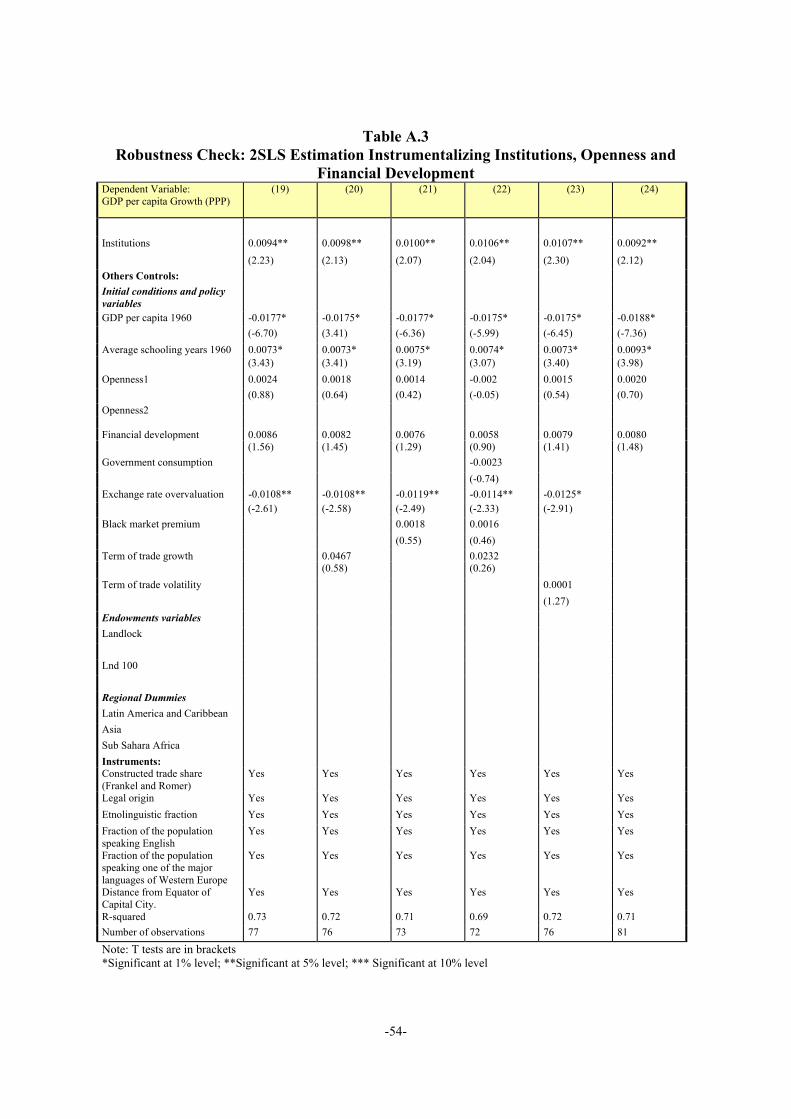
-54-
Table A.3Robustness Check: 2SLS Estimation Instrumentalizing Institutions, Openness and
Financial DevelopmentDependent Variable:GDP per capita Growth (PPP)
(19) (20) (21) (22) (23) (24)
Institutions 0.0094** 0.0098** 0.0100** 0.0106** 0.0107** 0.0092**(2.23) (2.13) (2.07) (2.04) (2.30) (2.12)
Others Controls:Initial conditions and policyvariablesGDP per capita 1960 -0.0177* -0.0175* -0.0177* -0.0175* -0.0175* -0.0188*
(-6.70) (3.41) (-6.36) (-5.99) (-6.45) (-7.36)Average schooling years 1960 0.0073* 0.0073* 0.0075* 0.0074* 0.0073* 0.0093*
(3.43) (3.41) (3.19) (3.07) (3.40) (3.98)Openness1 0.0024 0.0018 0.0014 -0.002 0.0015 0.0020
(0.88) (0.64) (0.42) (-0.05) (0.54) (0.70)Openness2
Financial development 0.0086 0.0082 0.0076 0.0058 0.0079 0.0080(1.56) (1.45) (1.29) (0.90) (1.41) (1.48)
Government consumption -0.0023(-0.74)
Exchange rate overvaluation -0.0108** -0.0108** -0.0119** -0.0114** -0.0125*(-2.61) (-2.58) (-2.49) (-2.33) (-2.91)
Black market premium 0.0018 0.0016(0.55) (0.46)
Term of trade growth 0.0467 0.0232(0.58) (0.26)
Term of trade volatility 0.0001(1.27)
Endowments variablesLandlock
Lnd 100
Regional DummiesLatin America and CaribbeanAsiaSub Sahara AfricaInstruments:Constructed trade share(Frankel and Romer)
Yes Yes Yes Yes Yes Yes
Legal origin Yes Yes Yes Yes Yes YesEtnolinguistic fraction Yes Yes Yes Yes Yes YesFraction of the populationspeaking English
Yes Yes Yes Yes Yes Yes
Fraction of the populationspeaking one of the majorlanguages of Western Europe
Yes Yes Yes Yes Yes Yes
Distance from Equator ofCapital City.
Yes Yes Yes Yes Yes Yes
R-squared 0.73 0.72 0.71 0.69 0.72 0.71Number of observations 77 76 73 72 76 81
Note: T tests are in brackets*Significant at 1% level; **Significant at 5% level; *** Significant at 10% level
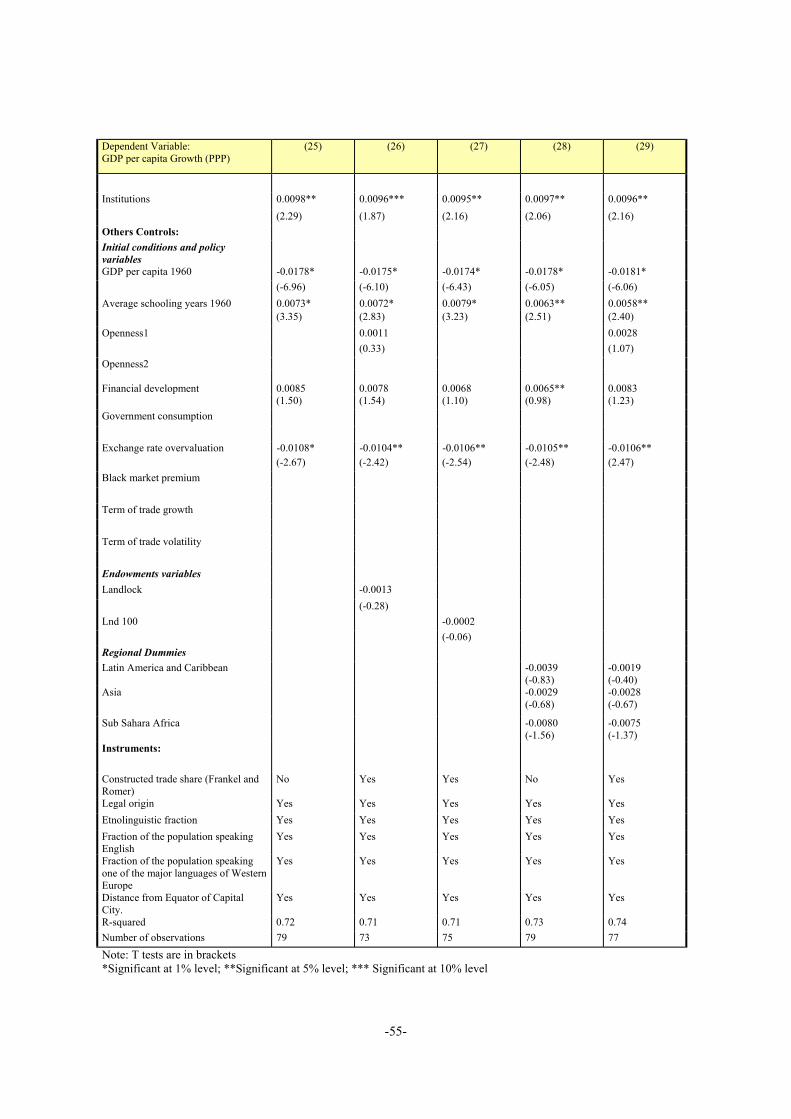
-55-
Dependent Variable:GDP per capita Growth (PPP)
(25) (26) (27) (28) (29)
Institutions 0.0098** 0.0096*** 0.0095** 0.0097** 0.0096**(2.29) (1.87) (2.16) (2.06) (2.16)
Others Controls:Initial conditions and policyvariablesGDP per capita 1960 -0.0178* -0.0175* -0.0174* -0.0178* -0.0181*
(-6.96) (-6.10) (-6.43) (-6.05) (-6.06)Average schooling years 1960 0.0073* 0.0072* 0.0079* 0.0063** 0.0058**
(3.35) (2.83) (3.23) (2.51) (2.40)Openness1 0.0011 0.0028
(0.33) (1.07)Openness2
Financial development 0.0085 0.0078 0.0068 0.0065** 0.0083(1.50) (1.54) (1.10) (0.98) (1.23)
Government consumption
Exchange rate overvaluation -0.0108* -0.0104** -0.0106** -0.0105** -0.0106**(-2.67) (-2.42) (-2.54) (-2.48) (2.47)
Black market premium
Term of trade growth
Term of trade volatility
Endowments variablesLandlock -0.0013
(-0.28)Lnd 100 -0.0002
(-0.06)Regional DummiesLatin America and Caribbean -0.0039
(-0.83)-0.0019(-0.40)
Asia -0.0029(-0.68)
-0.0028(-0.67)
Sub Sahara Africa -0.0080(-1.56)
-0.0075(-1.37)
Instruments:
Constructed trade share (Frankel andRomer)
No Yes Yes No Yes
Legal origin Yes Yes Yes Yes YesEtnolinguistic fraction Yes Yes Yes Yes YesFraction of the population speakingEnglish
Yes Yes Yes Yes Yes
Fraction of the population speakingone of the major languages of WesternEurope
Yes Yes Yes Yes Yes
Distance from Equator of CapitalCity.
Yes Yes Yes Yes Yes
R-squared 0.72 0.71 0.71 0.73 0.74Number of observations 79 73 75 79 77
Note: T tests are in brackets*Significant at 1% level; **Significant at 5% level; *** Significant at 10% level
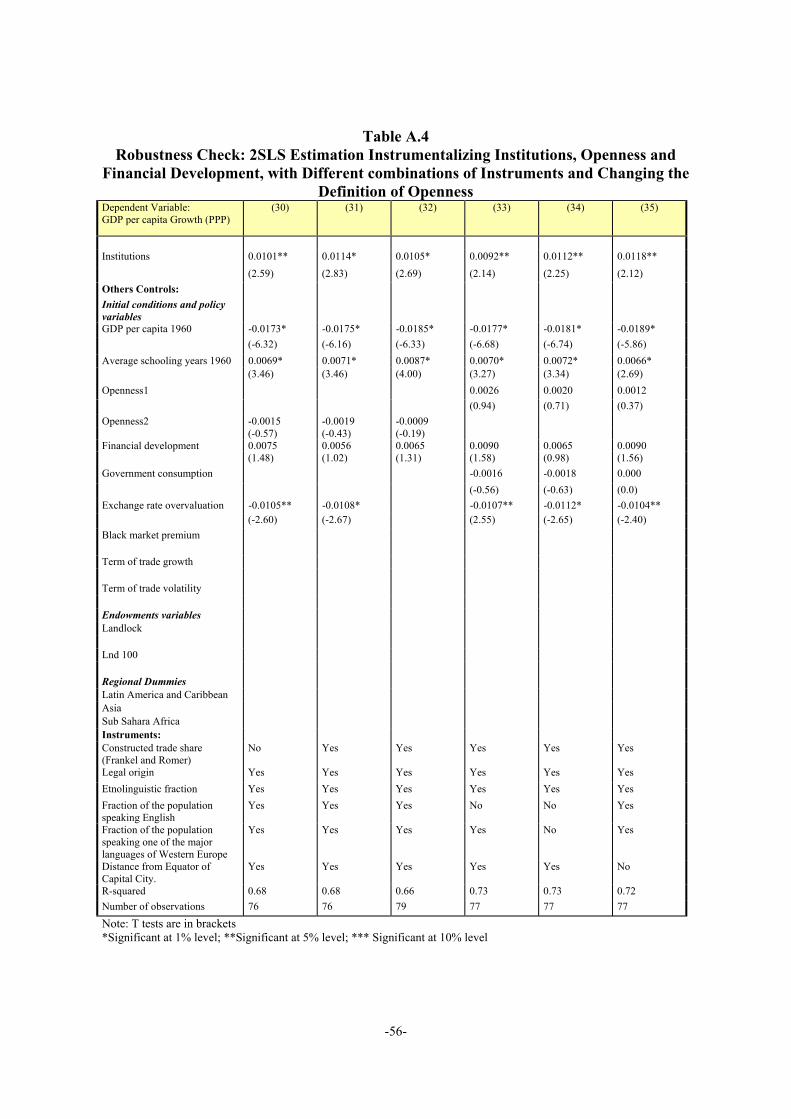
-56-
Table A.4Robustness Check: 2SLS Estimation Instrumentalizing Institutions, Openness and
Financial Development, with Different combinations of Instruments and Changing theDefinition of Openness
Dependent Variable:GDP per capita Growth (PPP)
(30) (31) (32) (33) (34) (35)
Institutions 0.0101** 0.0114* 0.0105* 0.0092** 0.0112** 0.0118**(2.59) (2.83) (2.69) (2.14) (2.25) (2.12)
Others Controls:Initial conditions and policyvariablesGDP per capita 1960 -0.0173* -0.0175* -0.0185* -0.0177* -0.0181* -0.0189*
(-6.32) (-6.16) (-6.33) (-6.68) (-6.74) (-5.86)Average schooling years 1960 0.0069* 0.0071* 0.0087* 0.0070* 0.0072* 0.0066*
(3.46) (3.46) (4.00) (3.27) (3.34) (2.69)Openness1 0.0026 0.0020 0.0012
(0.94) (0.71) (0.37)Openness2 -0.0015 -0.0019 -0.0009
(-0.57) (-0.43) (-0.19)Financial development 0.0075 0.0056 0.0065 0.0090 0.0065 0.0090
(1.48) (1.02) (1.31) (1.58) (0.98) (1.56)Government consumption -0.0016 -0.0018 0.000
(-0.56) (-0.63) (0.0)Exchange rate overvaluation -0.0105** -0.0108* -0.0107** -0.0112* -0.0104**
(-2.60) (-2.67) (2.55) (-2.65) (-2.40)Black market premium
Term of trade growth
Term of trade volatility
Endowments variablesLandlock
Lnd 100
Regional DummiesLatin America and CaribbeanAsiaSub Sahara AfricaInstruments:Constructed trade share(Frankel and Romer)
No Yes Yes Yes Yes Yes
Legal origin Yes Yes Yes Yes Yes YesEtnolinguistic fraction Yes Yes Yes Yes Yes YesFraction of the populationspeaking English
Yes Yes Yes No No Yes
Fraction of the populationspeaking one of the majorlanguages of Western Europe
Yes Yes Yes Yes No Yes
Distance from Equator ofCapital City.
Yes Yes Yes Yes Yes No
R-squared 0.68 0.68 0.66 0.73 0.73 0.72Number of observations 76 76 79 77 77 77
Note: T tests are in brackets*Significant at 1% level; **Significant at 5% level; *** Significant at 10% level
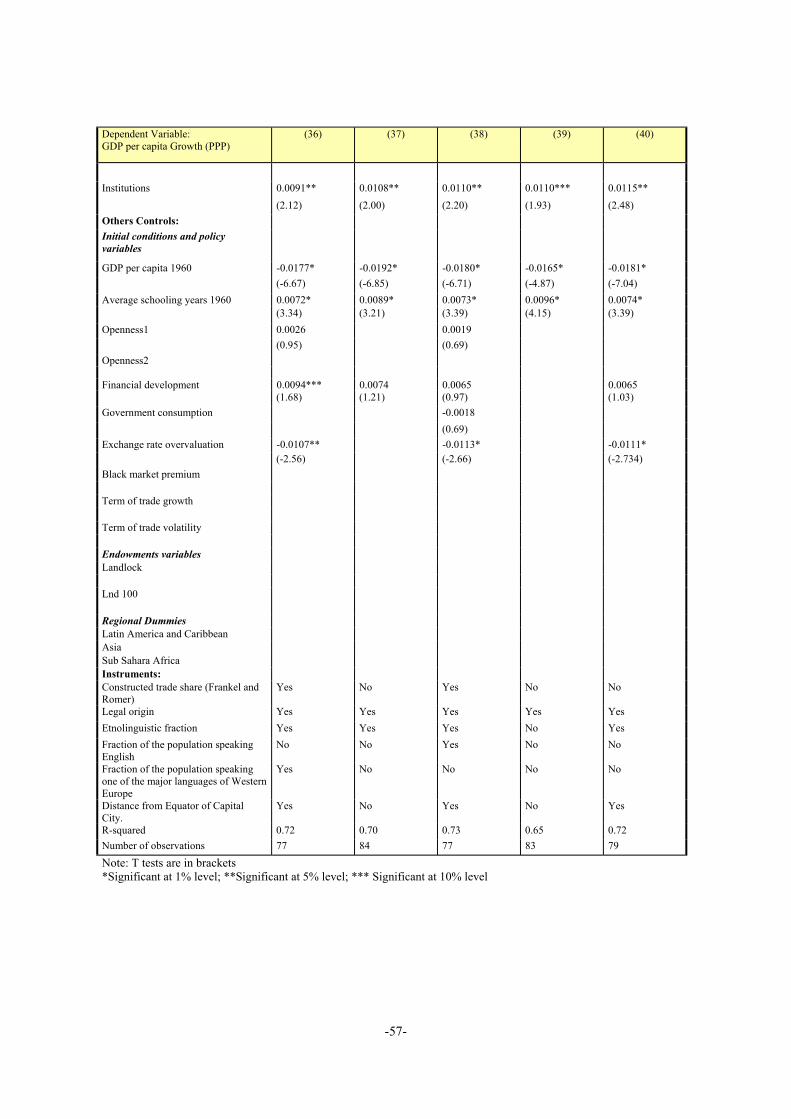
-57-
Dependent Variable:GDP per capita Growth (PPP)
(36) (37) (38) (39) (40)
Institutions 0.0091** 0.0108** 0.0110** 0.0110*** 0.0115**(2.12) (2.00) (2.20) (1.93) (2.48)
Others Controls:Initial conditions and policyvariables
GDP per capita 1960 -0.0177* -0.0192* -0.0180* -0.0165* -0.0181*(-6.67) (-6.85) (-6.71) (-4.87) (-7.04)
Average schooling years 1960 0.0072* 0.0089* 0.0073* 0.0096* 0.0074*(3.34) (3.21) (3.39) (4.15) (3.39)
Openness1 0.0026 0.0019(0.95) (0.69)
Openness2
Financial development 0.0094*** 0.0074 0.0065 0.0065(1.68) (1.21) (0.97) (1.03)
Government consumption -0.0018(0.69)
Exchange rate overvaluation -0.0107** -0.0113* -0.0111*(-2.56) (-2.66) (-2.734)
Black market premium
Term of trade growth
Term of trade volatility
Endowments variablesLandlock
Lnd 100
Regional DummiesLatin America and CaribbeanAsiaSub Sahara AfricaInstruments:Constructed trade share (Frankel andRomer)
Yes No Yes No No
Legal origin Yes Yes Yes Yes YesEtnolinguistic fraction Yes Yes Yes No YesFraction of the population speakingEnglish
No No Yes No No
Fraction of the population speakingone of the major languages of WesternEurope
Yes No No No No
Distance from Equator of CapitalCity.
Yes No Yes No Yes
R-squared 0.72 0.70 0.73 0.65 0.72Number of observations 77 84 77 83 79
Note: T tests are in brackets*Significant at 1% level; **Significant at 5% level; *** Significant at 10% level
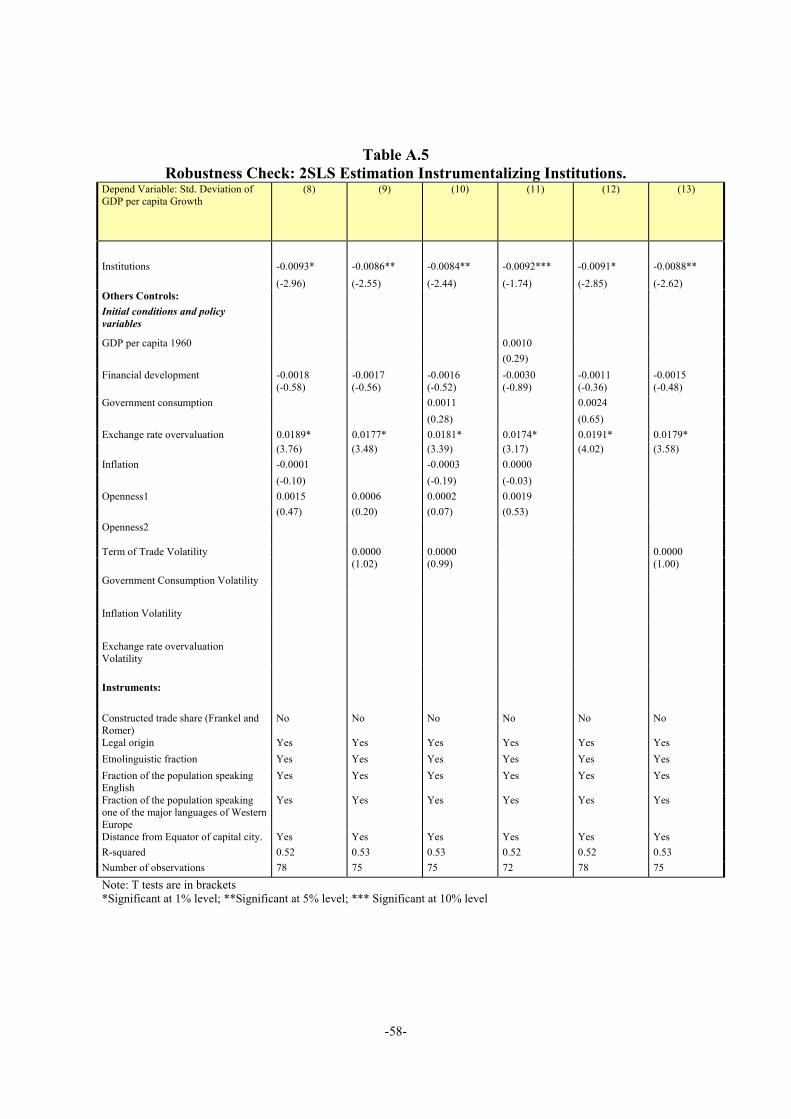
-58-
Table A.5Robustness Check: 2SLS Estimation Instrumentalizing Institutions.
Depend Variable: Std. Deviation ofGDP per capita Growth
(8) (9) (10) (11) (12) (13)
Institutions -0.0093* -0.0086** -0.0084** -0.0092*** -0.0091* -0.0088**(-2.96) (-2.55) (-2.44) (-1.74) (-2.85) (-2.62)
Others Controls:Initial conditions and policyvariables
GDP per capita 1960 0.0010(0.29)
Financial development -0.0018 -0.0017 -0.0016 -0.0030 -0.0011 -0.0015(-0.58) (-0.56) (-0.52) (-0.89) (-0.36) (-0.48)
Government consumption 0.0011 0.0024(0.28) (0.65)
Exchange rate overvaluation 0.0189* 0.0177* 0.0181* 0.0174* 0.0191* 0.0179*(3.76) (3.48) (3.39) (3.17) (4.02) (3.58)
Inflation -0.0001 -0.0003 0.0000(-0.10) (-0.19) (-0.03)
Openness1 0.0015 0.0006 0.0002 0.0019(0.47) (0.20) (0.07) (0.53)
Openness2
Term of Trade Volatility 0.0000 0.0000 0.0000(1.02) (0.99) (1.00)
Government Consumption Volatility
Inflation Volatility
Exchange rate overvaluationVolatility
Instruments:
Constructed trade share (Frankel andRomer)
No No No No No No
Legal origin Yes Yes Yes Yes Yes YesEtnolinguistic fraction Yes Yes Yes Yes Yes YesFraction of the population speakingEnglish
Yes Yes Yes Yes Yes Yes
Fraction of the population speakingone of the major languages of WesternEurope
Yes Yes Yes Yes Yes Yes
Distance from Equator of capital city. Yes Yes Yes Yes Yes YesR-squared 0.52 0.53 0.53 0.52 0.52 0.53Number of observations 78 75 75 72 78 75
Note: T tests are in brackets*Significant at 1% level; **Significant at 5% level; *** Significant at 10% level
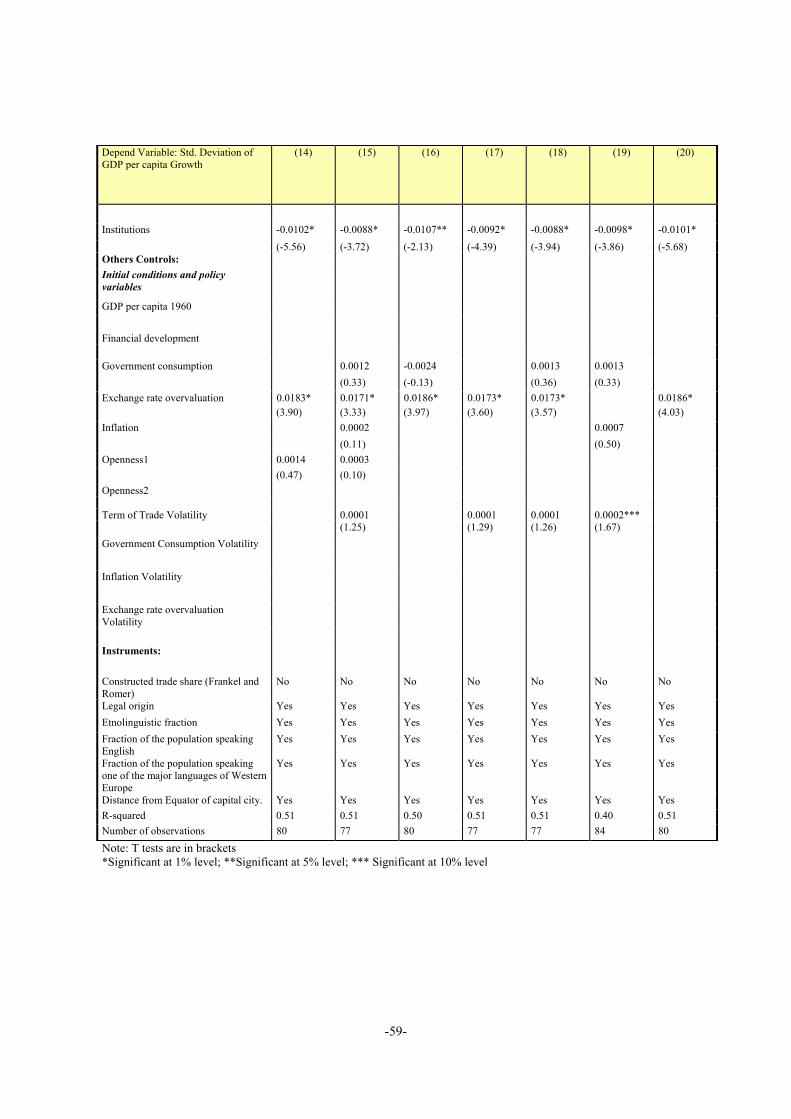
-59-
Depend Variable: Std. Deviation ofGDP per capita Growth
(14) (15) (16) (17) (18) (19) (20)
Institutions -0.0102* -0.0088* -0.0107** -0.0092* -0.0088* -0.0098* -0.0101*(-5.56) (-3.72) (-2.13) (-4.39) (-3.94) (-3.86) (-5.68)
Others Controls:Initial conditions and policyvariables
GDP per capita 1960
Financial development
Government consumption 0.0012 -0.0024 0.0013 0.0013(0.33) (-0.13) (0.36) (0.33)
Exchange rate overvaluation 0.0183* 0.0171* 0.0186* 0.0173* 0.0173* 0.0186*(3.90) (3.33) (3.97) (3.60) (3.57) (4.03)
Inflation 0.0002 0.0007(0.11) (0.50)
Openness1 0.0014 0.0003(0.47) (0.10)
Openness2
Term of Trade Volatility 0.0001 0.0001 0.0001 0.0002***(1.25) (1.29) (1.26) (1.67)
Government Consumption Volatility
Inflation Volatility
Exchange rate overvaluationVolatility
Instruments:
Constructed trade share (Frankel andRomer)
No No No No No No No
Legal origin Yes Yes Yes Yes Yes Yes YesEtnolinguistic fraction Yes Yes Yes Yes Yes Yes YesFraction of the population speakingEnglish
Yes Yes Yes Yes Yes Yes Yes
Fraction of the population speakingone of the major languages of WesternEurope
Yes Yes Yes Yes Yes Yes Yes
Distance from Equator of capital city. Yes Yes Yes Yes Yes Yes YesR-squared 0.51 0.51 0.50 0.51 0.51 0.40 0.51Number of observations 80 77 80 77 77 84 80
Note: T tests are in brackets*Significant at 1% level; **Significant at 5% level; *** Significant at 10% level
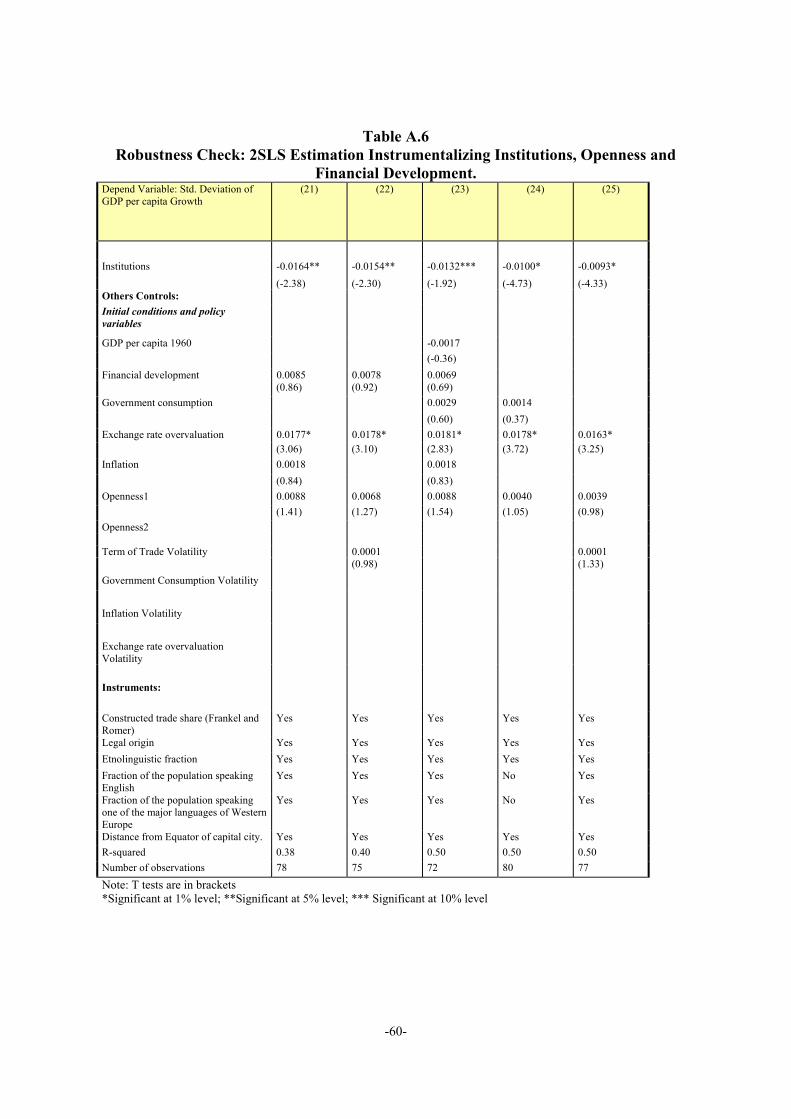
-60-
Table A.6Robustness Check: 2SLS Estimation Instrumentalizing Institutions, Openness and
Financial Development.Depend Variable: Std. Deviation ofGDP per capita Growth
(21) (22) (23) (24) (25)
Institutions -0.0164** -0.0154** -0.0132*** -0.0100* -0.0093*(-2.38) (-2.30) (-1.92) (-4.73) (-4.33)
Others Controls:Initial conditions and policyvariables
GDP per capita 1960 -0.0017(-0.36)
Financial development 0.0085 0.0078 0.0069(0.86) (0.92) (0.69)
Government consumption 0.0029 0.0014(0.60) (0.37)
Exchange rate overvaluation 0.0177* 0.0178* 0.0181* 0.0178* 0.0163*(3.06) (3.10) (2.83) (3.72) (3.25)
Inflation 0.0018 0.0018(0.84) (0.83)
Openness1 0.0088 0.0068 0.0088 0.0040 0.0039(1.41) (1.27) (1.54) (1.05) (0.98)
Openness2
Term of Trade Volatility 0.0001 0.0001(0.98) (1.33)
Government Consumption Volatility
Inflation Volatility
Exchange rate overvaluationVolatility
Instruments:
Constructed trade share (Frankel andRomer)
Yes Yes Yes Yes Yes
Legal origin Yes Yes Yes Yes YesEtnolinguistic fraction Yes Yes Yes Yes YesFraction of the population speakingEnglish
Yes Yes Yes No Yes
Fraction of the population speakingone of the major languages of WesternEurope
Yes Yes Yes No Yes
Distance from Equator of capital city. Yes Yes Yes Yes YesR-squared 0.38 0.40 0.50 0.50 0.50Number of observations 78 75 72 80 77
Note: T tests are in brackets*Significant at 1% level; **Significant at 5% level; *** Significant at 10% level
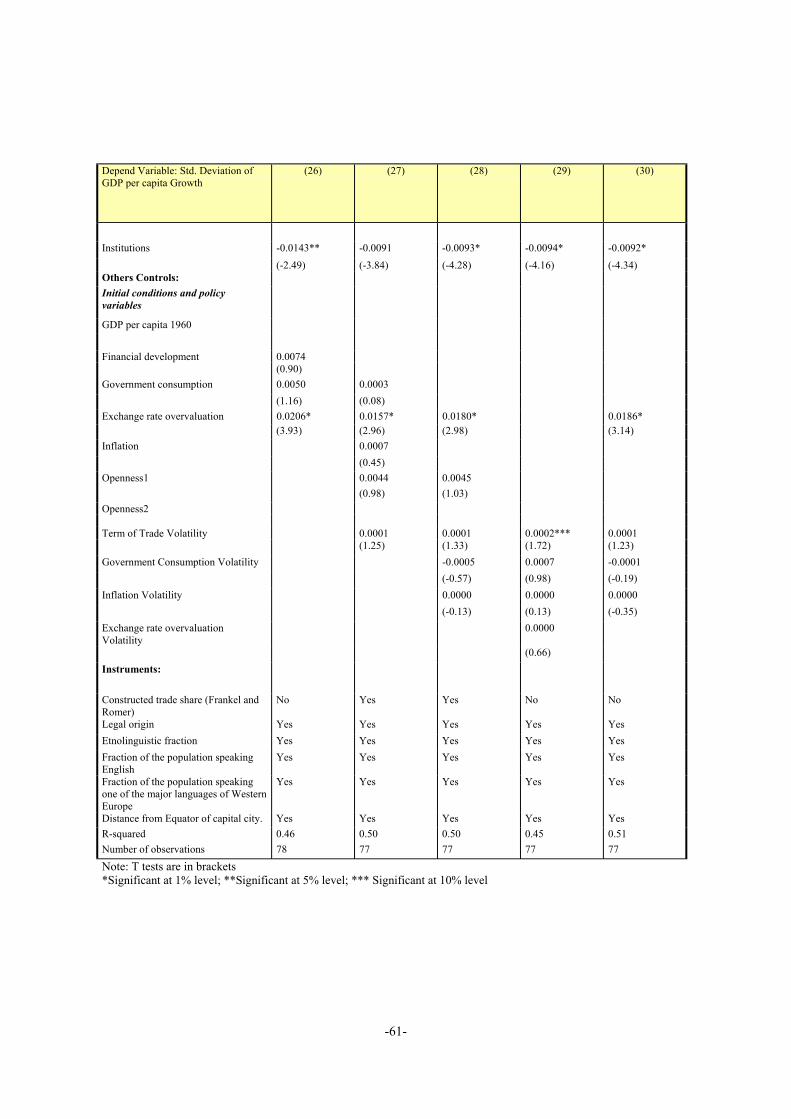
-61-
Depend Variable: Std. Deviation ofGDP per capita Growth
(26) (27) (28) (29) (30)
Institutions -0.0143** -0.0091 -0.0093* -0.0094* -0.0092*(-2.49) (-3.84) (-4.28) (-4.16) (-4.34)
Others Controls:Initial conditions and policyvariables
GDP per capita 1960
Financial development 0.0074(0.90)
Government consumption 0.0050 0.0003(1.16) (0.08)
Exchange rate overvaluation 0.0206* 0.0157* 0.0180* 0.0186*(3.93) (2.96) (2.98) (3.14)
Inflation 0.0007(0.45)
Openness1 0.0044 0.0045(0.98) (1.03)
Openness2
Term of Trade Volatility 0.0001 0.0001 0.0002*** 0.0001(1.25) (1.33) (1.72) (1.23)
Government Consumption Volatility -0.0005 0.0007 -0.0001(-0.57) (0.98) (-0.19)
Inflation Volatility 0.0000 0.0000 0.0000(-0.13) (0.13) (-0.35)
Exchange rate overvaluationVolatility
0.0000
(0.66)Instruments:
Constructed trade share (Frankel andRomer)
No Yes Yes No No
Legal origin Yes Yes Yes Yes YesEtnolinguistic fraction Yes Yes Yes Yes YesFraction of the population speakingEnglish
Yes Yes Yes Yes Yes
Fraction of the population speakingone of the major languages of WesternEurope
Yes Yes Yes Yes Yes
Distance from Equator of capital city. Yes Yes Yes Yes YesR-squared 0.46 0.50 0.50 0.45 0.51Number of observations 78 77 77 77 77
Note: T tests are in brackets*Significant at 1% level; **Significant at 5% level; *** Significant at 10% level
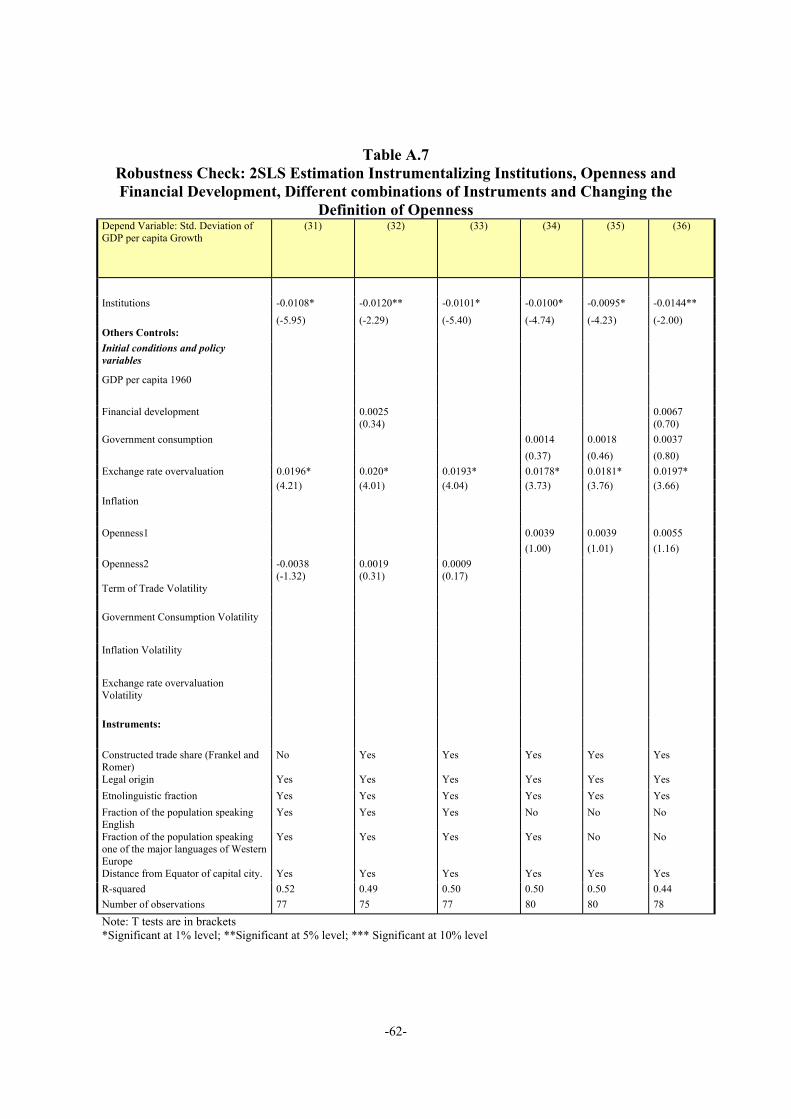
-62-
Table A.7Robustness Check: 2SLS Estimation Instrumentalizing Institutions, Openness andFinancial Development, Different combinations of Instruments and Changing the
Definition of OpennessDepend Variable: Std. Deviation ofGDP per capita Growth
(31) (32) (33) (34) (35) (36)
Institutions -0.0108* -0.0120** -0.0101* -0.0100* -0.0095* -0.0144**(-5.95) (-2.29) (-5.40) (-4.74) (-4.23) (-2.00)
Others Controls:Initial conditions and policyvariables
GDP per capita 1960
Financial development 0.0025 0.0067(0.34) (0.70)
Government consumption 0.0014 0.0018 0.0037(0.37) (0.46) (0.80)
Exchange rate overvaluation 0.0196* 0.020* 0.0193* 0.0178* 0.0181* 0.0197*(4.21) (4.01) (4.04) (3.73) (3.76) (3.66)
Inflation
Openness1 0.0039 0.0039 0.0055(1.00) (1.01) (1.16)
Openness2 -0.0038 0.0019 0.0009(-1.32) (0.31) (0.17)
Term of Trade Volatility
Government Consumption Volatility
Inflation Volatility
Exchange rate overvaluationVolatility
Instruments:
Constructed trade share (Frankel andRomer)
No Yes Yes Yes Yes Yes
Legal origin Yes Yes Yes Yes Yes YesEtnolinguistic fraction Yes Yes Yes Yes Yes YesFraction of the population speakingEnglish
Yes Yes Yes No No No
Fraction of the population speakingone of the major languages of WesternEurope
Yes Yes Yes Yes No No
Distance from Equator of capital city. Yes Yes Yes Yes Yes YesR-squared 0.52 0.49 0.50 0.50 0.50 0.44Number of observations 77 75 77 80 80 78
Note: T tests are in brackets*Significant at 1% level; **Significant at 5% level; *** Significant at 10% level
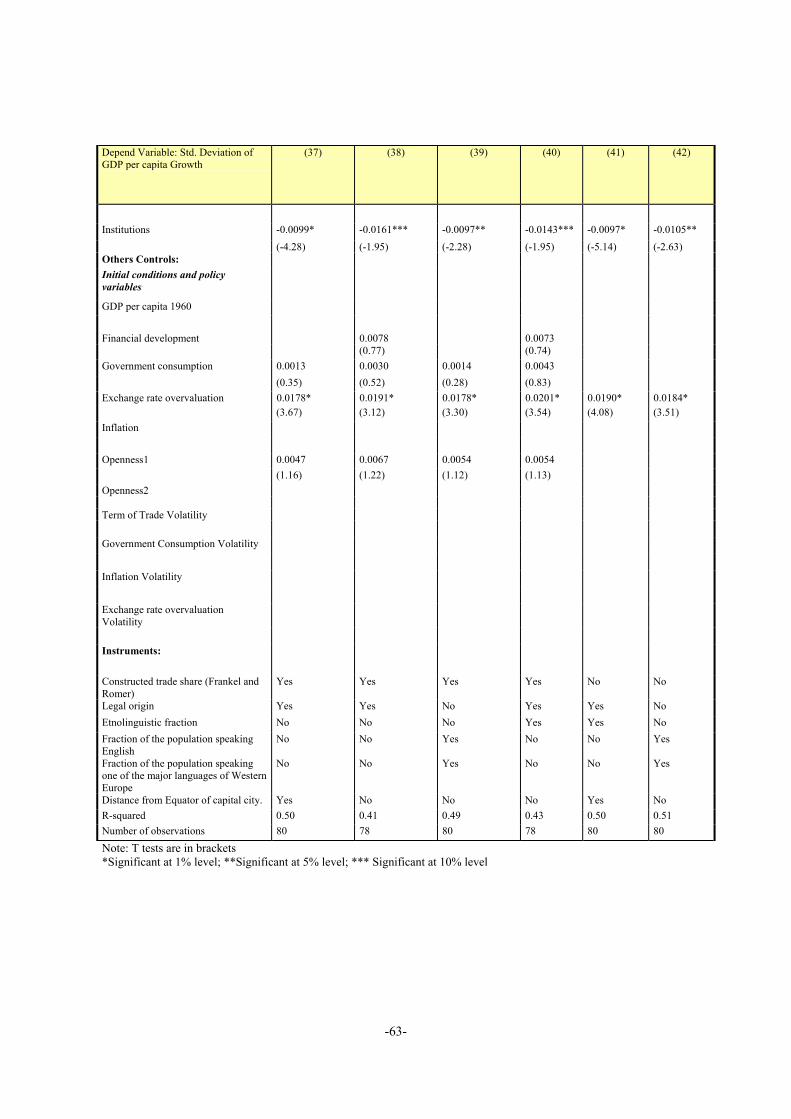
-63-
Depend Variable: Std. Deviation ofGDP per capita Growth
(37) (38) (39) (40) (41) (42)
Institutions -0.0099* -0.0161*** -0.0097** -0.0143*** -0.0097* -0.0105**(-4.28) (-1.95) (-2.28) (-1.95) (-5.14) (-2.63)
Others Controls:Initial conditions and policyvariables
GDP per capita 1960
Financial development 0.0078 0.0073(0.77) (0.74)
Government consumption 0.0013 0.0030 0.0014 0.0043(0.35) (0.52) (0.28) (0.83)
Exchange rate overvaluation 0.0178* 0.0191* 0.0178* 0.0201* 0.0190* 0.0184*(3.67) (3.12) (3.30) (3.54) (4.08) (3.51)
Inflation
Openness1 0.0047 0.0067 0.0054 0.0054(1.16) (1.22) (1.12) (1.13)
Openness2
Term of Trade Volatility
Government Consumption Volatility
Inflation Volatility
Exchange rate overvaluationVolatility
Instruments:
Constructed trade share (Frankel andRomer)
Yes Yes Yes Yes No No
Legal origin Yes Yes No Yes Yes NoEtnolinguistic fraction No No No Yes Yes NoFraction of the population speakingEnglish
No No Yes No No Yes
Fraction of the population speakingone of the major languages of WesternEurope
No No Yes No No Yes
Distance from Equator of capital city. Yes No No No Yes NoR-squared 0.50 0.41 0.49 0.43 0.50 0.51Number of observations 80 78 80 78 80 80
Note: T tests are in brackets*Significant at 1% level; **Significant at 5% level; *** Significant at 10% level
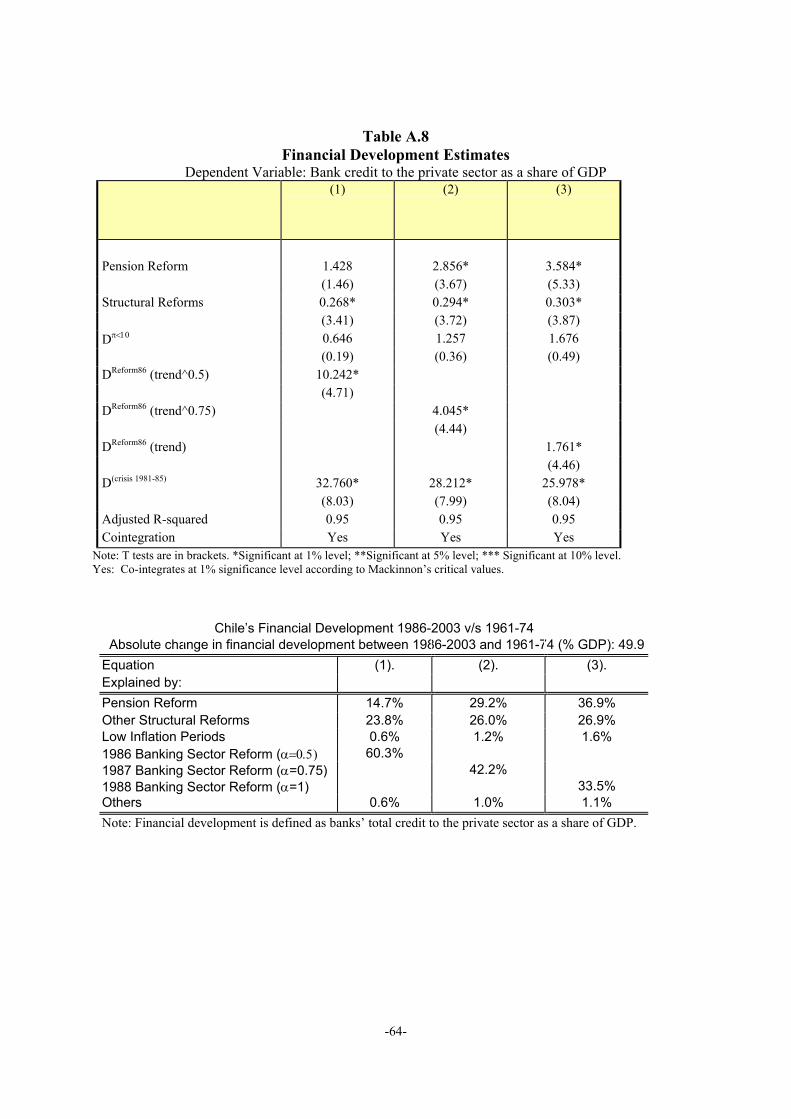
-64-
Table A.8Financial Development Estimates
Dependent Variable: Bank credit to the private sector as a share of GDP(1) (2) (3)
Pension Reform 1.428 2.856* 3.584*(1.46) (3.67) (5.33)
Structural Reforms 0.268* 0.294* 0.303*(3.41) (3.72) (3.87)
Dπ<10 0.646 1.257 1.676(0.19) (0.36) (0.49)
DReform86 (trend^0.5) 10.242*(4.71)
DReform86 (trend^0.75) 4.045*(4.44)
DReform86 (trend) 1.761*(4.46)
D(crisis 1981-85) 32.760* 28.212* 25.978*(8.03) (7.99) (8.04)
Adjusted R-squared 0.95 0.95 0.95Cointegration Yes Yes Yes
Note: T tests are in brackets. *Significant at 1% level; **Significant at 5% level; *** Significant at 10% level.Yes: Co-integrates at 1% significance level according to Mackinnon’s critical values.
Chile’s Financial Development 1986-2003 v/s 1961-74Absolute change in financial development between 1986-2003 and 1961-74 (% GDP): 49.9
Equation (1). (2). (3).Explained by:Pension Reform 14.7% 29.2% 36.9%Other Structural Reforms 23.8% 26.0% 26.9%Low Inflation Periods 0.6% 1.2% 1.6%1986 Banking Sector Reform (α=0.5) 60.3%1987 Banking Sector Reform (α=0.75) 42.2%1988 Banking Sector Reform (α=1) 33.5%Others 0.6% 1.0% 1.1%Note: Financial development is defined as banks’ total credit to the private sector as a share of GDP.
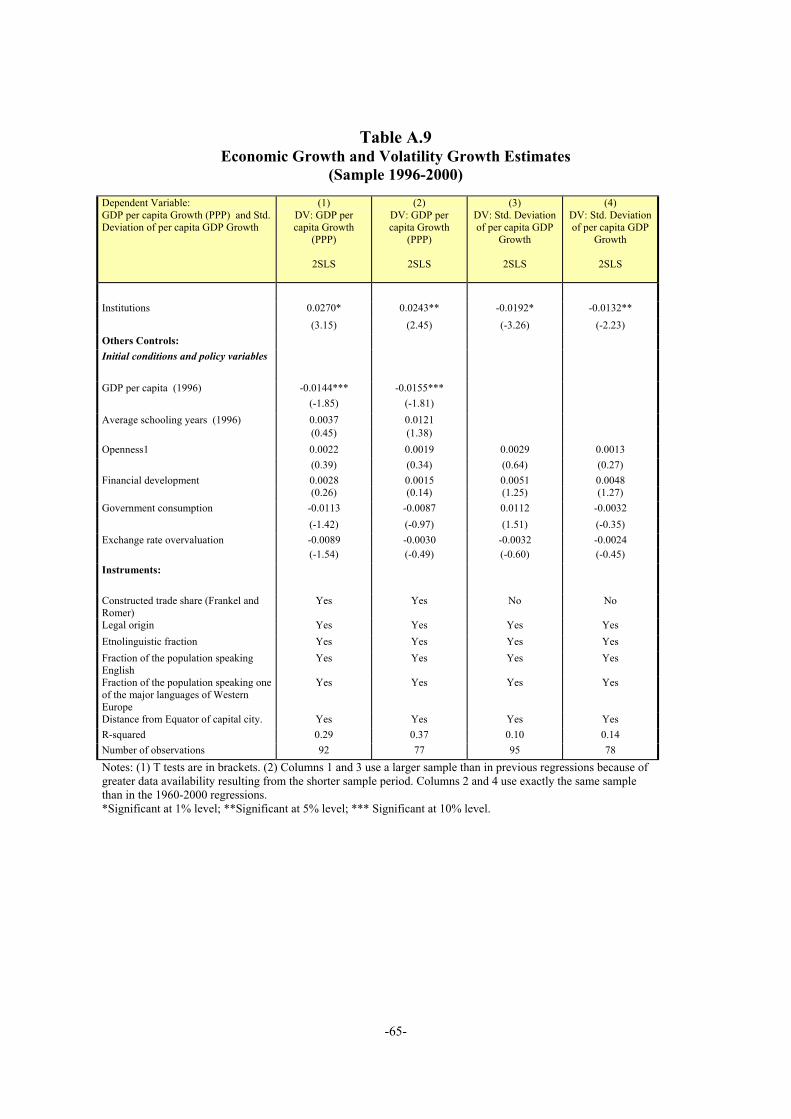
-65-
Table A.9Economic Growth and Volatility Growth Estimates
(Sample 1996-2000)
Dependent Variable:GDP per capita Growth (PPP) and Std.Deviation of per capita GDP Growth
(1)DV: GDP percapita Growth
(PPP)
2SLS
(2)DV: GDP percapita Growth
(PPP)
2SLS
(3)DV: Std. Deviationof per capita GDP
Growth
2SLS
(4)DV: Std. Deviationof per capita GDP
Growth
2SLS
Institutions 0.0270* 0.0243** -0.0192* -0.0132**(3.15) (2.45) (-3.26) (-2.23)
Others Controls:Initial conditions and policy variables
GDP per capita (1996) -0.0144*** -0.0155***(-1.85) (-1.81)
Average schooling years (1996) 0.0037 0.0121(0.45) (1.38)
Openness1 0.0022 0.0019 0.0029 0.0013(0.39) (0.34) (0.64) (0.27)
Financial development 0.0028 0.0015 0.0051 0.0048(0.26) (0.14) (1.25) (1.27)
Government consumption -0.0113 -0.0087 0.0112 -0.0032(-1.42) (-0.97) (1.51) (-0.35)
Exchange rate overvaluation -0.0089 -0.0030 -0.0032 -0.0024(-1.54) (-0.49) (-0.60) (-0.45)
Instruments:
Constructed trade share (Frankel andRomer)
Yes Yes No No
Legal origin Yes Yes Yes YesEtnolinguistic fraction Yes Yes Yes YesFraction of the population speakingEnglish
Yes Yes Yes Yes
Fraction of the population speaking oneof the major languages of WesternEurope
Yes Yes Yes Yes
Distance from Equator of capital city. Yes Yes Yes YesR-squared 0.29 0.37 0.10 0.14Number of observations 92 77 95 78
Notes: (1) T tests are in brackets. (2) Columns 1 and 3 use a larger sample than in previous regressions because ofgreater data availability resulting from the shorter sample period. Columns 2 and 4 use exactly the same samplethan in the 1960-2000 regressions.*Significant at 1% level; **Significant at 5% level; *** Significant at 10% level.