Embed Size (px)
Citation preview
33O?73
ECONOMIC REPORTOF THE PRESIDENT
Transmitted to the CongressJanuary 1964
Slilliiiiiii
-lilliliill lllli1 Wii^ 3p?::S|:;K iSt^^^WF^fg^fi^^rWJP^mi^^SS^'^^^y-
iti'lii
a!
u
ill
pi'lip
Digitized for FRASER http://fraser.stlouisfed.org/ Federal Reserve Bank of St. Louis

Digitized for FRASER http://fraser.stlouisfed.org/ Federal Reserve Bank of St. Louis
Economic Report
of the President
Transmitted to the Congress
January 1964
TOGETHER WITH
THE ANNUAL REPORTOF THE
COUNCIL OF ECONOMIC ADVISERS
UNITED STATES GOVERNMENT PRINTING OFFICE
WASHINGTON : 1964
Digitized for FRASER http://fraser.stlouisfed.org/ Federal Reserve Bank of St. Louis

Digitized for FRASER http://fraser.stlouisfed.org/ Federal Reserve Bank of St. Louis
LETTER OF TRANSMITTAL
THE WHITE HOUSEWashington, D.C., January 20, 1964
The Honorable the PRESIDENT PRO TEMPORE OF THE SENATE,The Honorable the SPEAKER OF THE HOUSE OF REPRESENTATIVES.
SIRS:As required by the Employment Act of 1946, I am sending to the
Congress my annual Economic Report.
I am also sending the Annual Report of the Council of EconomicAdvisers.
Sincerely,
III
Digitized for FRASER http://fraser.stlouisfed.org/ Federal Reserve Bank of St. Louis

Digitized for FRASER http://fraser.stlouisfed.org/ Federal Reserve Bank of St. Louis
CONTENTS
ECONOMIC REPORT OF THE PRESIDENTPage
T H E $100 BILLION EXPANSION 4
Economic Milestones 4Extent of the Advance 4Comparative Gains 4Contributions of Business, Labor, and Government 5Federal Purchases and Tax Cuts 6
T H E J O B AHEAD OF U S 6
EARLY TAX REDUCTION 7
Greatest Fiscal Stimulus 7Sustained Expansion 8Safeguard Against Recession 8
T H E 1964 ECONOMIC OUTLOOK . , 9
PRICE-WAGE POLICY IN 1964 10
OTHER POLICIES FOR 1964 11
Monetary Policy and Balance-of-Payments Measures 11Trade Expansion and Development Assistance 12Agriculture 12Labor and Manpower Policies 13Transportation and Technology 14Housing and Community Development 14
T H E W A R ON POVERTY 14
The Role of Prosperity and Faster Growth 15Building Individual Earning Power 15Providing a Decent Living 17A Versatile Attack 17
America's Economic Challenge 17
A N N U A L R E P O R T O F T H E C O U N C I L O F E C O N O M I C A D V I S E R S *
INTRODUCTION 29
CHAPTER 1. ECONOMIC EXPANSION AND FEDERAL POLICY 32
CHAPTER 2. T H E PROBLEM OF POVERTY IN AMERICA 55
CHAPTER 3. T H E PROMISE AND PROBLEMS OF TECHNOLOGICAL CHANGE . 8 5
CHAPTER 4. PRICE AND WAGE POLICY FOR HIGH EMPLOYMENT. . 112
CHAPTER 5. T H E BALANCE OF PAYMENTS AND THE INTERNATIONAL
MONETARY SYSTEM 121
CHAPTER 6. U.S. ASSISTANCE OF ECONOMIC DEVELOPMENT OVER-
SEAS 149
*For a detailed table of contents of the Council's Report, seepage 23.
Digitized for FRASER http://fraser.stlouisfed.org/ Federal Reserve Bank of St. Louis
PageAPPENDIX A. TESTIMONY OF THE COUNCIL OF ECONOMIC ADVISERS
BEFORE THE SUBCOMMITTEE ON EMPLOYMENT AND MANPOWER OF
THE SENATE COMMITTEE ON LABOR AND PUBLIC WELFARE, OCTOBER
28, 1963 165APPENDIX B. REPORT TO THE PRESIDENT ON THE ACTIVITIES OF THE
COUNCIL OF ECONOMIC ADVISERS DURING 1963 191
APPENDIX C. STATISTICAL TABLES RELATING TO INCOME, EMPLOY-
MENT, AND PRODUCTION 201
VI
Digitized for FRASER http://fraser.stlouisfed.org/ Federal Reserve Bank of St. Louis
ECONOMIC REPORT
OF THE PRESIDENT
Digitized for FRASER http://fraser.stlouisfed.org/ Federal Reserve Bank of St. Louis

Digitized for FRASER http://fraser.stlouisfed.org/ Federal Reserve Bank of St. Louis
ECONOMIC REPORT OF THE PRESIDENT
To the Congress of the United States:This is my first report to you under the Employment Act of 1946.As a member of the Congress at that time, I was proud to vote for this
historic Act.As your President today, I am proud to respond to its challenge—
to its mandate "to promote maximum employment, production, andpurchasing power" within the framework of "free competitiveenterprise."
Nothing less than the maximum will meet our needs.Our gross national product (GNP) for the fourth quarter of 1963
rose to a $600 billion annual rate.But an unemployment rate of 5 / 2 percent continues to
—cast a long shadow over our pride in this achievement;—remind us that far too much of our precious human potential
still lies idle.As I stated in outlining my political philosophy six years ago:
I regard achievement of the full potential of our re-sources—physical, human, and otherwise—to be the highestpurpose of governmental policies next to the protection ofthose rights we regard as inalienable.
The road to that full potential is still a long one. But we havemoved steadily and impressively forward in the past three years.
And the tax cut will speed our climb toward our goals of fullemployment, faster growth, equal opportunity, balance in our externalpayments, and price stability.
As the Employment Act requires, I shall in this report—assess our progress toward our economic goals,—review the current and foreseeable trends in the U.S. economy
in relation to its potential, and—set forth my policy and program for achieving our national
economic potential.
Digitized for FRASER http://fraser.stlouisfed.org/ Federal Reserve Bank of St. Louis
THE $100 BILLION EXPANSION
As we face the tasks ahead, we have much to build on.
Economic MilestonesOur record $100 billion expansion since early 1961 has carried us
past important milestones in the march toward a better life. In 1963,for the first time in history:
—GNP passed the $600 billion mark, by year-end.—Average earnings in manufacturing exceeded $100 a week, by
year-end.—Personal income (before taxes) reached an average rate of some
$2,500 per capita, by year-end.—After-tax income of individuals exceeded $400 billion, for the
year.—Corporate profits exceeded $50 billion before taxes and $25
billion after taxes, for the year.—Residential construction passed $25 billion, for the year.—Civilian employment exceeded 70 million, during the year.
Extent of the AdvanceThese striking statistics tell us where we are. But they do not tell us
how far and how fast we have come.In the nearly three years of unbroken expansion since early 1961:
—GNP is up 16 percent, measured in constant dollars.—Industrial production is up 23 percent.—Civilian nonfarm jobs are up 2^4 million.—Personal income is up $70 billion, or 17 percent.—Corporate profits before taxes are up $17 billion, or 44 percent.—Net income per farm for 1963 is up almost $375, or 12 percent.—Total after-tax income of the American people is up $56 billion,
or 16 percent.—Real disposable income per family is up more than $600, or 8
percent.Comparative Gains
It is fair to ask how the 1961-63 expansion in output and incomescompares with earlier upswings in the American economy. Here is theanswer:
1. The $100 billion rise in output in 2^4 years knows no parallelin our peacetime economic annals.
2. The advance of $51 billion in labor income is also unparalleled.Average real income of nonfarm workers has risen by $345 a year,a gain not exceeded in any previous comparable period.
Digitized for FRASER http://fraser.stlouisfed.org/ Federal Reserve Bank of St. Louis
3. The rise in corporate profits from a rate of $38 / 2 billion inearly 1961 to roughly $55 billion at the end of 1963 is notablefor three reasons:
a. The 14-percent annual rate of advance is high by previousstandards.
b. The rise is not only large, but prolonged—at this stagein past expansions, profits had already declined from theirpeaks.
c. The rise has occurred even as the liberalized depreciationguidelines of 1962 were transferring $2}4 billion of busi-ness receipts out of taxable profits into nontaxable depre-ciation.
Most heartening to me is that these gains to American labor andAmerican business were not at the expense of
—the American consumer—whose income is no longer being erodedby inflation, as prices have held steadier in the United States thanin any other major industrial country;
—the competitive position of U.S. exports—which has benefittedfrom several years of stable domestic wholesale prices, our bestrecord since the war and better than that of any other majorindustrial country.
Contributions of Business, Labor, and Government
An expansion as long, strong, and free of excesses as the one we arenow experiencing does not "just happen."
—Business has generally held prices in check, kept inventories onan even keel, and avoided excesses in capital financing.
—Labor has been constructive in its collective bargaining and inits contributions to rising productivity. Average wage rate in-creases over the period 1961-63 have been the most modest sinceWorld War II, thereby helping to stabilize unit labor costs and im-prove our ability to compete with Europe and Japan.
—Government has steadily pursued fiscal and monetary policiesdesigned to promote recovery, accelerate expansion, and en-courage business and consumer confidence:
in 1961, when the Administration's quick anti-recession pro-gram got recovery off to a flying start;
in 1962, when, in sharp contrast to 1960 and 1957, risingFederal purchases, new tax incentives to investment, andcontinued credit ease lent a steadying hand to an economywhose advance was faltering;
in 1963, when prospects of a timely tax cut buoyed a reassuredand resurgent economy.
Digitized for FRASER http://fraser.stlouisfed.org/ Federal Reserve Bank of St. Louis
Federal Purchases and Tax CutsRising Federal purchases have played an important role in sustaining
the 1961-63 expansion. They accounted directly for 11 percent of thegrowth in GNP, quite apart from their substantial indirect effects in in-creasing business and consumer outlays.
Our fiscal program for 1964-65 will shift emphasis sharply fromexpanding Federal expenditure to boosting private consumer demandand business investment.
The $11 billion tax cut will challenge American businessmen, in-vestors, and consumers to put their enlarged incomes to work in theprivate economy to expand output, investment, and jobs.
I am confident that our private decision makers will rise to thischallenge.
I am confident of their growing agreement—that "new records" in output and employment are not enough;—that four million unemployed and 13 percent idle factory capacity
are intolerable;—that the acid test of economic policy is whether we can make
full use of our growing labor force and our rising productivity—our full potential.
THE JOB AHEAD OF US
We have not yet met this test. New high ground is not the summit.That still lies ahead.
Our 1961-63 advance—though impressive, sustained, and nonin-flationary—has not gone far enough and fast enough
—to create the jobs needed by our unemployed,—to get our factories humming to desired capacity,—to lift our GNP to its reasonable potential,—to restore the growth rate of our productive potential to the
pace we took for granted in the early postwar period,—to raise the incomes of farm families to a level more comparable
to those of nonfarm families,—to expand investment and profits to levels that will hold more
of our capital funds at home and thereby shrink our externalpayments deficit.
The size of the job that lies ahead of us is measured by—
1. Unemployment—5*4 percent of our labor force is still idle, evenafter a year-to-year advance of $30 billion in our GNP. Takinginto account the added workers who seek employment as jobsbecome more plentiful, we would need at least two million morejobs today just to get rid of stubborn excess unemployment.
Digitized for FRASER http://fraser.stlouisfed.org/ Federal Reserve Bank of St. Louis
2. Productivity advance—we need about two million new jobs eachyear to offset the labor-saving effects of rising output per worker.
3. Labor force growth—more than a million added jobseekers enterthe labor market each year—indeed we will soon need 75 millionjobs.
4. Unused capacity—operating rates in manufacturing still averageonly 87 percent of capacity, against the 92-percent rate preferredby business managers.
5. Wasting potential—men, machines, and materials that lie idletoday could readily add about $30 billion more to our $600billion GNP.
6. The balance-of-payments deficit—although sharply reduced bythe determined steps announced in July, the deficit is still with us.And gold outflows—though only half as large in 1963 as in 1962,and less than half as large in the three years 1961-63 as in 1958-60—have not been eliminated.
EARLY TAX REDUCTION
If we are to master these problems, we must above all enact thetax bill (H.R. 8363)
—not in one or two or three months, but now;—not in diluted, but in strengthened form, with an immediate
drop from an 18-percent to a 14-percent withholding rate.
Far too long, our economy has labored under the handicap of Federalincome tax rates born of war and inflation:
—Those rates were designed to curb demand in an economybursting at the seams.
—But now, when demand and incentives are not strong enoughto make full use of our manpower and machines, the tax brakeis set far too tight.
—We need to release that brake quickly to put billions of dollarsof new consuming and investing funds into the hands of theprivate economy.
Greatest Fiscal StimulusSpeedy passage of the tax cut, at the 14-percent withholding rate
—will cut individual income tax collections by $8.8 billion in 1964,over $2 billion of which will come from lowering the withholdingrate to 14 percent instead of 15 percent;
—will cut corporate tax liabilities by $11/2 billion in 1964;—will provide a net fiscal stimulus, taking both expenditures and
tax cut into account, that will be three times as great in 1964 asin any of the years 1961, 1962, and 1963;
Digitized for FRASER http://fraser.stlouisfed.org/ Federal Reserve Bank of St. Louis
—will, in fact, provide a greater net stimulus to the economy in1964—to jobs, production, income, and profits—than in anyother peacetime year in history.
The economics of efficiency is in no way inconsistent with the economicsof expansion. By combining efficiency with expansion, frugality withcompassion:
—we shall hold the fiscal 1965 budget below the fiscal 1964budget, and cut the deficit in half;
—we shall get a dollar's value for a dollar spent, while not fearingto spend a dollar when and where the Nation will reap a fulldollar or more in benefit;
—we shall strengthen our programs to meet pressing human needs;fully satisfy our defense requirements; and respond to the de-mands of economic progress;
—and we shall, at the same time, provide an unparalleled fiscalstimulus to the economy.
Sustained Expansion
The tax cut will give a sustained lift, year-in and year-out, to theAmerican economy.
When fully effective in 1965, it will send well over $11 billion annuallycoursing through the arteries of the private economy.
The resulting stream of purchases by willing consumers and of in-vestment by responsive businessmen will, at full strength, expand thetax cut's initial impact several-fold.
The Nation will then, year-after-year, reap this benefit in the form of—$35 to $45 billion more GNP,—$25 to $30 billion more consumption,—$5 to $7 billion more profits,
than we would attain without the tax cut.These gains, growing steadily, will at long last lead to a balanced
budget in a balanced economy at full potential.
Safeguard Against Recession
For the near term, the tax cut will give us the vital fiscal safeguardwe need against recession. It will convert what is already a long andstrong advance into the longest and strongest expansion in our peace-time history:
—By April, it will have outdistanced all but the long and incompleteclimb out of the Great Depression from 1933 to 1937.
—By mid-1965, it will have outlasted even that expansion.
I do not say that we can, at one stroke, wipe out recession or legislatethe business cycle out of existence. But vigilant, bold, and flexible
Digitized for FRASER http://fraser.stlouisfed.org/ Federal Reserve Bank of St. Louis
policy can prevent some recessions and nip others in the bud. And wehave a great stake in doing so.
The American economy suffered two recessions in quick succession in1957-58 and 1960-61. If a recession of the same average force wereto hit us in 1964 or 1965, it would cost us
—a loss of $25 billion or more of output;—a rise of two million in unemployment;—a drop of nearly 12 percent in industrial production;—a sag of more than $5 billion in after-tax profits.
Clearly, by enabling us to avoid a recession, the tax cut will pay us ahandsome quick bonus quite apart from its basic long-run benefits.
THE 1964 ECONOMIC OUTLOOK
We enter 1964 with optimism—riding the strong mount of an expansion that has already crossed
the $600 billion mark, and—responding to the expected spur of a quickly enacted $11 billion
tax cut.With the tax cut, promptly enacted, our gross national product for
1964 should rise from $585 billion for 1963 to a projected $623 billion(understood as the midpoint of a $10 billion range). But, without thetax cut, our sights would have to be set $10 to $15 billion lower—anddashed expectations could turn expansion into recession.
With the tax cut, the state of business confidence is strong: businessforecasters today foresee a 5- to 6-percent, or even greater, rise in GNPfrom 1963 to 1964. In contrast, a year ago they foresaw only a 3- to 4-percent rise. Today's business optimism is one of our strongest eco-nomic assets in 1964.
With the tax cut, unemployment will decline significantly in 1964.With the tax cut, profits will continue to rise, avoiding the decline
that usually sets in after the first year or two of a business expansion.With the tax cut, our balance of payments will benefit from basic
improvements—in our ability to compete in world markets as costs are cut di-
rectly through lower taxes and indirectly through modernization;—and in our ability to retain and attract capital as returns on
domestic investment rise with higher volume and lower unit costs.With the tax cut, consumer spending—fueled by the extra $8.8 bil-
lion of take-home pay—will propel the economy forward in 1964.With the tax cut, business fixed investment should rise more in 1964
than in 1963, and housing and automobile demand should remainstrong.
Digitized for FRASER http://fraser.stlouisfed.org/ Federal Reserve Bank of St. Louis
With the tax cut, in short, 1964 will be a year of strong, sustainedeconomic advance.
But all this will not come about automatically. It requires, and Iconfidently expect:
—that the Congress will act swiftly;—that taxpayers will respond by putting the released funds to work
in the private economy;—that business will resist the temptation to exploit stronger markets
by unneeded price boosts;—that labor will resist the temptation to exploit stronger job oppor-
tunities by excessive wage demands;—that Government will follow a balanced policy to maintain a
favorable monetary climate, while meeting the requirements ofour balance-of-payments situation;
—that both public and private action will be taken as needed toovercome those pockets of excessive unemployment that remaineven in the face of the job-creating stimulus of the tax cut.
PRICE-WAGE POLICY IN 1964
Prospects are favorable for continuing in 1964 our good record ofprice stability and stable unit labor costs:
First, the price and wage record from which we start is excellent:a. The wholesale price index is still below the level of 3 years ago.b. The consumer price index has risen only 1.2 percent a year,
mostly in services.c. Average wage increases have stayed generally within the
bounds of productivity increases.
Second, because of wage moderation and rising productivity,labor costs per unit of output have held steady, while volume hasrisen.
Third, the tax cut will further reduce costs, increase take-homepay, and keep sales and profits rising.
Fourth, with ample supplies of labor and industrial capacity, theforce of expanding demand touched off by the tax cut can expressitself in more output, income, jobs, and profits rather thaninflationary price or wage increases.
Nevertheless, a series of specific price increases in recent months—especially in manufactured goods—gives me some cause for concern.
I do not anticipate a renewal of the price-wage spiral—a spiral thatwould weaken our expansion and worsen our balance-of-paymentsposition.
10
Digitized for FRASER http://fraser.stlouisfed.org/ Federal Reserve Bank of St. Louis
I count on the sense of responsibility of the Nation's industrialistsand labor leaders
—to extend the excellent price and cost records of recent years—to maintain price and wage policies that accord with the non-
inflationary guideposts that I have asked the Council of Eco-nomic Advisers to reaffirm in its attached Report.
In the face of a 44 percent increase in corporate profits in less thanthree years and the prospect of further increases to come with the tax cut,I see no warrant for inflationary price rises.
On the heels of solid increases in real wages, plus the rise in take-homepay under the tax cut, I see no warrant for inflationary wage increases.
Accordingly:—I shall keep a close watch on price and wage developments, with
the aid of an early warning system which is being set up in theappropriate agencies.
—I shall not hestitate to draw public attention to major actionsby either business or labor that flout the public interest in non-inflationary price and wage standards.
—And I shall translate into action the viewa. that antitrust policy must remain keenly alert to illegal
price-fixing and other practices that impair competition;b. that we must resist new steps to legalize price-fixing where
competition should prevail.
OTHER POLICIES FOR 1964
Monetary "Policy and Balance-of-Payments Measures
A strong upswing in the economy after the tax cut need not bringtight money or high interest rates, especially when
—our balance of payments is improving so sharply in response tomeasures begun in 1961 and reinforced last July;
—the budget for fiscal year 1965 will cut the Federal deficit in halfand ease pressures on interest rates from Treasury borrowing.
It would be self-defeating to cancel the stimulus of tax reduction bytightening money. Monetary and debt policy should be directed towardmaintaining interest rates and credit conditions that encourage privateinvestment.
But monetary policy must remain flexible, so that:—It can quickly shift to the defense if, unexpectedly, inflation
threatens or the balance of payments worsens.—When monetary measures are not needed as defensive shock
troops, they can reinforce fiscal policy in promoting domesticexpansion.
II
715-113 O-64-2Digitized for FRASER http://fraser.stlouisfed.org/ Federal Reserve Bank of St. Louis
Our balance of payments will continue to benefit from the specialprogram launched last July. This requires
—early enactment of the interest equalization tax, designed to raisethe costs of foreign borrowing in our capital market without forc-ing up domestic interest rates,
—further economies in dollar outflows from Government pro-grams, without compromising our efforts to maintain the strengthof the free world,
—continued price stability and export promotion to maintain or im-prove the competitive position of our exports.
Trade Expansion and Development Assistance
1. The Kennedy Round. The United States' 30-year campaign toreduce barriers to world trade—and the intensified pursuit of that goalsignalled by the passage of the Trade Expansion Act of 1962—willreach a climax in 1964.
U.S. industry and agriculture are in excellent condition to seize thenew opportunities offered by trade liberalization and to weather the ad-justments that may be required.
Our goal is a more prosperous America in a more prosperous world.2. The developing countries. Reduced trade barriers will expand
exports and help an increasing number of developing countries to be-come self-supporting.
But for most poorer countries full self-support is still some distance off.We must help them find a path to development through freedom—andfreedom through development.
Our development assistance effort must and will be more sharplyfocused and rigorously administered. We shall encourage others toshare more of its burden and seek a larger role for private investment.But a strong development assistance program continues to be vital toour pursuit of peace and stability in the free world.
Agriculture
The contribution to our Nation's economic growth made by risingagricultural productivity is too often overlooked.
We need only look at the restraints placed on national growth inSoviet Bloc countries to understand what a failure in the growth ofagricultural productivity can mean to a nation and its people.
Looking forward in 1964, we face a number of challenges inagriculture:
—While net income per farm his grown 12 percent in 1961-63,chronic problems of overproduction remain.
—We need improved commodity legislation this year for manyof our major commodities.
12
Digitized for FRASER http://fraser.stlouisfed.org/ Federal Reserve Bank of St. Louis
—The highly successful Food For Peace program requires newlegislative authority this year.
—We must also provide the research and development supportnecessary to the continued strength, adaptability and growth ofAmerican agriculture.
Labor and Manpower PoliciesNo matter how mechanized it becomes, our economy is still an
organization of people—working with tools. In 1964 we must redoubleour efforts to meet these problems of our working people:
1. Automation. Technological change is a prime mover of our eco-nomic growth—but it can lead to painful job displacement.
—A special high-level commission should be established to deter-mine how we can best gain the benefits of automation whileminimizing its human costs.
—As a starting point, I commend to it the analysis of this problemwhich the Council of Economic Advisers has made in Chapter3 of its accompanying report.
2. More efficient labor markets.—Displaced workers must be retrained and helped by improved
Federal-State placement and counseling services to find theirway back to fully productive lives.
—And we must strengthen our education and training facilities atevery level to give our youth the background and skills de-manded by our rapidly developing economy. The Youth Em-ployment Act remains high on our agenda.
3. Unemployment insurance. The burden of displacement on theindividual must be eased by extending the coverage and increasing thebenefits of our unemployment insurance programs.
4. The Fair Labor Standards Act. Coverage should be extended toover 2^2 million workers who lack overtime coverage or are not protectedat all—among them, 650,000 hotel, motel, restaurant, laundry, dry-cleaning, and farm-processing workers.
5. Working hours. We should and will solve our present unemploy-ment problem by expanding demand, not by forcing the standard workweek down to 35 hours. This would only redistribute work, not expand it.
At the same time, the regular use of heavy overtime may be unrea-sonably curtailing job opportunities in some industries.
Accordingly I shall ask for legislation authorizing higher overtimepenalty rates on an industry-by-industry basis where tripartite industrycommittees determine that such rates could create more jobs withoutunduly raising costs.
Digitized for FRASER http://fraser.stlouisfed.org/ Federal Reserve Bank of St. Louis
Transportation and TechnologyOur expanding economy and growing population place ever-rising
demands on the Nation's transportation system. It is particularly urgentthat the Congress now enact legislation before it
—to assist our cities in modernizing their mass transportationfacilities;
—to revise and strengthen our national transportation policy andplace more reliance on the creative force of competition.
The Federal Government provides major support for the researchand development which underlie our striking technological advances.In the past much of our research and development has been connectedwith national defense. Now, as military outlays level off, we face
—a challenge to apply the Nation's growing scientific and engineer-ing resources to new socially profitable uses;
—an opportunity to accelerate the technological progress of ourcivilian industries.
The Federal Government should join with private business and ouruniversities in speeding the development and spread of new technology.I have directed the Department of Commerce to explore new ways toaccomplish this.Housing and Community "Development
Americans generally are better housed than the citizens of any othernation. Much of this could not have been accomplished withoutthe encouragement and help Government has given to our private finan-cial institutions.
Authorizations expire this year for several of our major programs.They need to be renewed and extended
—to renew the decaying areas of our cities, while minimizing theburden of dislocation on families and small businesses;
—to allow cities to acquire land for open-space urban use and tofacilitate better urban planning;
—to strengthen our program of low-rent public housing;—to provide for construction of more specialized housing for the
elderly.THE WAR ON POVERTY
In the State of the Union Message, I announced that this Adminis-tration was declaring unconditional war on poverty in America. I shallpresent the details of the attack, including legislative proposals, in alater special message to the Congress.
Americans today enjoy the highest standard of living in the historyof mankind. But for nearly a fifth of our fellow citizens, this is ahollow achievement. They often live without hope, below minimumstandards of decency.
Digitized for FRASER http://fraser.stlouisfed.org/ Federal Reserve Bank of St. Louis

The per capita money income of these 35 million men, women, andchildren was only $590 in 1962—against $1,900 per capita for theNation as a whole.
We cannot and need not wait for the gradual growth of the economyto lift this forgotten fifth of our Nation above the poverty line.
We know what must be done, and this Nation of abundance cansurely afford to do it.
The Role of Prosperity and Faster GrowthToday, as in the past, higher employment and speedier economic
growth are the cornerstones of a concerted attack on poverty:—In the Great Depression mass unemployment made poverty all
too common an experience.—Since 1947, prosperity and progress have reduced the incidence of
substandard incomes from one-third to one-fifth of the Nation.—But the erosion of poverty slowed measurably after 1957.—The tax cut will once again generate jobs and income at a pace
that will provide an escape from poverty for many of our leastfortunate families.
But general prosperity and growth leave untouched many of theroots of human poverty. In the decade ahead, the forgotten fifth mustbe given new opportunities for a better life.
There are two major prongs to our specific attack on poverty inAmerica:
First, to enable every individual to build his earning power to fullcapacity
Second, to assure all citizens of decent living standards regardlessof economic reverses or the vicissitudes of human life andhealth.
Building Individual Earning Power
The first approach is the more fundamental.Let us deny no one the chance to develop and use his native talents to
the full.Let us, above all, open wide the exits from poverty to the children of
the poor.These are the keys to earning power:
1. Education. Poverty and ignorance go hand in hand:—Of families headed by a person with only a grade school educa-
tion, 37 percent are poor. Of those headed by high schoolgraduates, only 8 percent are poor.
—We must upgrade the education of all our youth, both to ad-vance human well-being and to speed the Nation's economicgrowth.
Digitized for FRASER http://fraser.stlouisfed.org/ Federal Reserve Bank of St. Louis
—But, most vitally, and with Federal support, we must upgradethe education of the children of the poor, so that they need notfollow their parents in poverty.
2. Health. The poor, and the children of the poor, are handicappedby illness and disability that could be avoided:
—Largely as a result of the ill health that grows out of poverty,we rank below many other countries in the conquest of infantand maternal mortality, in average life expectancy and nutrition.
—We must speed and intensify our efforts to make good healthmore accessible to the poor.
3. Skills and jobs. We need to help both young adults and olderworkers acquire marketable skills by the programs already indicated.
4. Community and area rehabilitation. Concerted communityaction, with new Federal assistance, can break the dismal and viciouscycle found in too many of our rural and urban areas:
—The cycle of poverty: inadequate schools, drop-outs, poorhealth, unemployment—creating delinquency, slums, crime,disease, and broken families—thereby breeding more poverty.
—The cycle of chronic depression: regions needing new economicuses for their idle or underutilized human and physical resources,but too poor to provide them alone—and therefore unable tobreak out of their depression.
The Area Redevelopment Act must be renewed and improved, andrural communities must be helped to find new economic strength.
Furthermore, in a forthcoming special message, I shall propose a newprogram to deal with our Nation's most distressed major region,Appalachia.
5. Equal opportunity. Forty-four percent of nonwhite families arepoor. Deficiencies of education and health and continuing job dis-crimination depress the earnings of Negroes, and other nonwhites,throughout their lives.
—Only 40 percent of nonwhites—compared to 70 percent ofwhites—complete high school.
—Infant mortality is nearly twice as high, maternal mortality fourtimes as high, for nonwhites.
—The life expectancy of a nonwhite man at age 20 is nearly 5 yearsshorter than for his white contemporary, and shorter than theaverage life expectancy reported in some 40 foreign countries.
—Unemployment rates for nonwhites are generally double thoseof whites.
Even beyond civil rights legislation, the fight to end discriminationrequires constructive action by all governments and citizens to makesure—in practice as well as in principle—that all Americans have equalopportunities for education, for good health, for jobs, and for decenthousing.
16
Digitized for FRASER http://fraser.stlouisfed.org/ Federal Reserve Bank of St. Louis
Providing a Decent LivingThe second prong of the attack on poverty is to protect individuals
and their families from poverty when their own earnings are insufficientbecause of age, disability, unemployment, or other family circumstances.
1. Too many of the poor and disabled today fail to receive aidunder the eligibility requirements of our Federal, State, andlocal network of programs of insurance and assistance.
2. For the aged, enactment of the proposed program for hospitalinsurance under social security is the first order of business.
3. For the unemployed, permanent legislation to strengthen un-employment insurance is urgently needed, as indicated above.
A Versatile AttackThe tactics of our attack on this ancient enemy must be versatile and
adaptable. For the sources of poverty vary from family to family, cityto city, region to region:
—A solution will not be found in any single new progam, directedfrom Washington and applied indiscriminately everywhere.
—Instead, we urgently need to bring together the many existingprograms—Federal, State, local, and private—and focus themmore effectively in a frontal assault on the sources of poverty.
—Most important, we shall encourage and assist communities andregions to develop their own plans of action; to mobilize theirown resources sis well as those available under Federal programs.
Only in this way can we assure that the Federal funds devoted to thewar on poverty—over $1 billion of new funds in the first year—will beinvested wisely and well.
AMERICA'S ECONOMIC CHALLENGE
In 1964 and beyond we seek a free and growing economy which—offers productive employment to all who are willing and able to
work;—operates at the full potential of our human and material
resources;—encourages free enterprise, innovation, and competition by
citizens in all walks of life;—avoids setbacks from recession or inflation;—generates steady and rapid growth in productivity—the ultimate
source of higher living standards—while providing the new skillsand jobs needed for displaced workers;
—meets ever more fully the needs and preferences of our citizens,
Digitized for FRASER http://fraser.stlouisfed.org/ Federal Reserve Bank of St. Louis
as freely expressed in the market place and in the halls ofgovernments;
—provides increasing leisure, and satisfying ways to use the time,to those who wish it;
—safeguards the security of the Nation and the free world by as-sisting efficiently the economic development and political inde-pendence of the less developed countries;
—promotes mutually advantageous trade with other countries, andprogressively reduces barriers to international competition;
—earns enough in free international transactions to balance ourexternal payments and yet meet our world responsibilities;
—distributes fairly the fruits of economic growth among consumersand producers, workers and employers;
—moves steadily toward the American dream of equality of oppor-tunity for all citizens—regardless of race, religion, sex, or resi-dence, regardless of social and economic status at birth;
—permits every American to produce and to earn to the full meas-ure of his basic capacities;
—eliminates, with the compassion and foresight of which a free andabundant economy is capable, avoidable suffering and insecurityfrom the lives of our citizens.
These aspirations are not easy to fulfill—but neither are they beyondour powers.
The policies—public and private—we must pursue are not waitingto be discovered. They are at hand and we must use them.
Our main reliance is on private ingenuity, initiative, and industry.But it is the obligation of government
—to support the vibrant, steady growth of the economy;—to expand the opportunities of free enterprise;—to guard against its excesses;—and to serve the economic interests of all the people.
The Federal Government,—working closely with labor, business, and agriculture, yet respect-
ing the economic and political freedoms of individuals;—working closely with State and local governments, yet careful
not to trespass on their domainfaces the economic challenges of 1964 with confidence.
Strengthened by the programs I have outlined in this Report, theNation will move steadily toward the realization of its full potential.
18
Digitized for FRASER http://fraser.stlouisfed.org/ Federal Reserve Bank of St. Louis
THE ANNUAL REPORT
OF THE
COUNCIL OF ECONOMIC ADVISERS
Digitized for FRASER http://fraser.stlouisfed.org/ Federal Reserve Bank of St. Louis

Digitized for FRASER http://fraser.stlouisfed.org/ Federal Reserve Bank of St. Louis
LETTER OF TRANSMITTAL
COUNCIL OF ECONOMIC ADVISERS,
Washington, D.C., January 13, 1964.T H E PRESIDENT:
SIR: The Council of Economic Advisers herewith submits its AnnualReport, January 1964, in accordance with Section 4(c) (2) of the Employ-ment Act of 1946.
Respectfully,
WALTER W. HELLER.,
Chairman.
GARDNER ACKLEY
JOHN P. LEWIS
21
Digitized for FRASER http://fraser.stlouisfed.org/ Federal Reserve Bank of St. Louis

Digitized for FRASER http://fraser.stlouisfed.org/ Federal Reserve Bank of St. Louis
CONTENTS
Page
INTRODUCTION 29
CHAPTER 1. ECONOMIC EXPANSION AND FEDERAL POLICY 32
Review of the Expansion 32Expansion of Demand 32Moderation in Price Increases 35Expansion in Incomes 35Unemployment and Unused Potential Output 36
Maintenance of the Expansion 37Federal Policy and Full Employment 39The Full-Employment Budget 41Fiscal Policy in a Growing Economy 42The Role of Monetary Policy 42Federal Policy in the Expansions of 1954-57 and 1958-60— 44Fiscal Policy in the Present Expansion 46Monetary Policy in the Present Expansion 47
The Current Situation and Outlook 48The Economy in 1963 48Residential Construction 48Automobiles 49The Outlook for GNP in 1964 51
Beyond 1964 53CHAPTER 2. THE PROBLEM OF POVERTY IN AMERICA 55
Eliminating Poverty—A National Goal 55The Nature and Extent of Poverty 57
Needs and Resources 57The Changing Extent of Poverty 59The Composition of Today's Poor 61
The Roots of Poverty 62Earned Income 62Property Income and Use of Savings 67Transfer Payments and Private Pensions 68The Vicious Circle 69Recent Changes in the Pattern of Poverty 72
Strategy Against Poverty . 73Maintaining High Employment 73Organizing the Attack on Poverty -. 77
Digitized for FRASER http://fraser.stlouisfed.org/ Federal Reserve Bank of St. Louis
CHAPTER 3. T H E PROMISE AND PROBLEMS OF TECHNOLOGICALPage
CHANGE 85
The Fruits of Advancing Technology 86The Nature of Technological Change 86The Growth of Output and Incomes 88Effects on Labor Income 89The Opportunity for Leisure 90Some Nonmeasurable Gains 90America's Role in the World 91
Sources of Technological Progress 92Invention and Innovation 92Investment and Technological Change 93
Technological Change and Aggregate Demand 94The Expansion of Demand 94The Trend of Labor Productivity 96
Adjustment to Technological Change 98The Changing Distribution of Job Requirements 99The Adjustment Process 100Defects of the Adjustment Process 101Private Policies Facilitating Adjustment 102
Public Policy and Technological Change 103Tax Stimulus for Investment 104Government Support of Technological Advance 104Reasons for Underinvestment in Research and Innovation 105The Extent and Distribution of R&D 107A Federal Civilian Technology Program 108Federal Support for Basic Research 109Government's Role in Aiding Adjustment 110Conclusion . 111
CHAPTER 4. PRICE AND WAGE POLICY FOR HIGH EMPLOYMENT 112
The Price-Wage Situation and the Prospects 112Anti-Inflationary Policies for High Employment 116
The Need for Stability 116Government Actions 117Private Decisions and the Price-Wage Guideposts 118
Conclusion 120CHAPTER 5. T H E BALANCE OF PAYMENTS AND THE INTERNATIONAL
MONETARY SYSTEM 121
The Balance of Payments: Developments, Policies, andOutlook 122
The Nature of the Balance-of-Payments Problem 122Recent Developments in the Balance of Payments 123Policies to Improve the Balance of Payments 127The Outlook for the Balance of Payments 130
Digitized for FRASER http://fraser.stlouisfed.org/ Federal Reserve Bank of St. Louis
CHAPTER 5—Continued page
The Future of the International Monetary System 133Objectives To Be Served 134The Present System 135Actual or Potential Shortcomings of the System 138Proposals for Strengthening or Changing Existing Ar-
rangements 142Concluding Comments .„ 148
CHAPTER 6. U.S. ASSISTANCE OF ECONOMIC DEVELOPMENT OVER-
SEAS 149
Evolution and Rationale 149Shifting Policy Goals 150The Case for Development Assistance 151
Role of Development Assistance 152Strategies for Achieving Self-Support 154Implementing Self-Support ,_ 155
The United States and Other Donors 157Accomplishments and Needs 160
The Incomplete Record 160Why Are We "Suddenly So Fatigued"? 163
APPENDIXES
A. Testimony of the Council of Economic Advisers Before theSubcommittee on Employment and Manpower of theSenate Committee on Labor and Public Welfare, October28, 1963 165
B. Report to the President on the Activities of the Council ofEconomic Advisers During 1963 191
C. Statistical Tables Relating to Income, Employment, andProduction 201
List of Tables and ChartsTables
1. Changes in Real Gross National Product in Three Postwar Ex-pansions 34
2. Share of Disposable Personal Income Used for Consumer Dur-able Expenditures, 1954-63 50
3. Money Income of Families, 1947 and 1950-62 594. Selected Characteristics of All Families and of Poor Families,
1962 615. Incidence of Poverty, by Characteristics Relating to Labor Force
Participation, 1962 646. Incidence of Poverty by Education, Color, and Residence, 1962— 667. Number of Families and Incidence of Poverty, by Selected
Family Characteristics, 1947 and 1962 718. Selected Characteristics of Poor Families, 1947 and 1962 72
Digitized for FRASER http://fraser.stlouisfed.org/ Federal Reserve Bank of St. Louis
List of Tables and Charts—ContinuedTables x page
9. Number and Money Income of Unrelated Individuals, by Se-lected Characteristics, 1962 - — - 79
10. Number and Distribution of Poor Families, by Education andOther Selected Characteristics, 1959 80
11. Number of Families and Distribution of Poor Families, by Resi-dence and Other Selected Characteristics, 1959— 81
12. Incidence of Poverty, by Occupation of Family Head, 1962 8113. Number of Families and Incidence of Poverty, by Residence
and Other Selected Characteristics, 1959 - - 8214. Number of Families and Incidence of Poverty, by Education and
Other Selected Characteristics, 1959^_ — 8315. Earnings of Elementary School Graduates, By Color and Oc-
cupation, 1959— — . 8416. Distribution of Spending Units With Income Under $3,000, by
Age of Head and Amount of Liquid Assets, 1962-. 8417. Changes in Output per Man-Hour in the Private Economy,
1919-63—™ : — — 9718. Research and Development Performed by Industry, 1961- ,- 10719. Research and Development Expenditures, 1953-54 to 1962-63- 10820. Prices, Wages, Profits, and Productivity in the Private Economy,
1948-63- - - — 114•21. Productivity in the Private Economy and Prices, Wages, and
Profits in Manufacturing, 1948-63— - — - 11522. Changes in Wholesale Prices in Selected Industrialized Coun-
tries, 1953 to 5 8 . — - - - — — H623. United States Balance of Payments, 1958-63 .- 12424. United States Private Portfolio Investment Abroad, 1960-63—. 12525. World Exports: Current Value by Regions, 1953-62- 15326. World Trade: Volume and Unit Value Indexes of Exports by
Regions, 1953-63 „ — 15427. Bilateral Economic Aid Commitments and Various Measures of
Donor Capacity and Interest, 1962 — — - 15828. Terms of Official Bilateral Economic Aid Commitments of De-
velopment Assistance Committee, 1962 . 15929. Selected Characteristics of Less Developed Countries Receiving
Since 1946 U.S. Economic Assistance of More Than $300 Mil-lion or More than $30 Per Capita—— — — — 160
Charts1. Indicators of Production and Income ; - — 302. Real Gross National Product in Three Postwar Expansions 333. Corporate Profits After Taxes and Capital Consumption
Allowances — . — — 36
Digitized for FRASER http://fraser.stlouisfed.org/ Federal Reserve Bank of St. Louis
List of Tables and Charts—ContinuedChdTtS Page
4. Gross National Product, Actual and Potential, and Unemploy-ment Rate- —— - . -— 38
5. Federal Budget (National Income Accounts Basis) — — 406. Federal Surplus or Deficit: Actual and Full-Employment Esti-
mates (National Income Accounts Basis) ._— — 437. Number of Families by Family Income—.-.-. — — . .— 608. Characteristics of Poor Families (Compared With All
Families) — . — - — — — — — — — - 639. Incidence of Poverty—— -—•*-——— — — . — 65
10. Real Hourly Compensation and Productivity in Manufacturing— 8911. Prices in Three Postwar Expansions—— — . 11312. Comparative Prices and Unit Labor Costs (Seven Industrial
— — — — — ^ —— — 132
27
715-113 O-64-3Digitized for FRASER http://fraser.stlouisfed.org/ Federal Reserve Bank of St. Louis

Digitized for FRASER http://fraser.stlouisfed.org/ Federal Reserve Bank of St. Louis
INTRODUCTION
The Nation's economic gains in 3 years of expansion reached the $100billion mark in the last quarter of 1963. In early 1961 the country was inits third recession since the end of the Korean conflict. Gross nationalproduct was barely at the $500 billion rate of a year earlier, and manyfeared that it would go lower. Yet less than 3 years later, sustained eco-nomic expansion had carried GNP to an annual rate of $600 billion forthe fourth quarter of 1963. This unprecedented gain in gross nationalproduct was accompanied by a record of price stability unsurpassed in anyexpansionary period since World War II.
As Chart 1 shows, the economy has made a strong and sustained advancebeyond the records of earlier years. The expansion has demonstrated thevitality of the private economy in an environment of progressive Federalpolicy. But the Nation's performance must be measured against its poten-tial levels of output and employment, not simply against past records.Compared with the past, there is much to be proud of. Compared withthe Nation's potential, there is much yet to do. This Report is in largepart addressed to the goals that lie ahead and to the policies needed foradvancing toward them.
By all odds, the country's number one economic problem is persistent un-employment. Indeed, this would stand near the top of any list of ills afflict-ing our society. The unemployment problem has many dimensions, and soit must be attacked on many fronts. It is clear, however, that more rapidgrowth in domestic and international markets for the Nation's output is thecentral prerequisite for full employment. Tax reduction is urgently neededas the prime mover toward this target. Programs of education and retrain-ing, aid to depressed areas and disadvantaged groups, and measures toimprove labor mobility are also essential in this endeavor, but they can havetheir full effects only if there is adequate over-all demand for the productsof labor. Chapter 1 of this Report appraises the gains of the past 3 yearsand the prospects for 1964 and discusses the role of Federal fiscal andmonetary policy in generating enough demand to use the economy's fullpotential.
Solution of the unemployment problem and its associated waste of poten-tial output is essential to a successful attack on many of our social evils.But we cannot expect a reduction in unemployment alone to eliminate thepoverty that afflicts 20 percent of American families. This degrading andself-perpetuating condition can be fully overcome only by programs thatattack directly the many sources of impoverishment in our society. Chapter
29
Digitized for FRASER http://fraser.stlouisfed.org/ Federal Reserve Bank of St. Louis
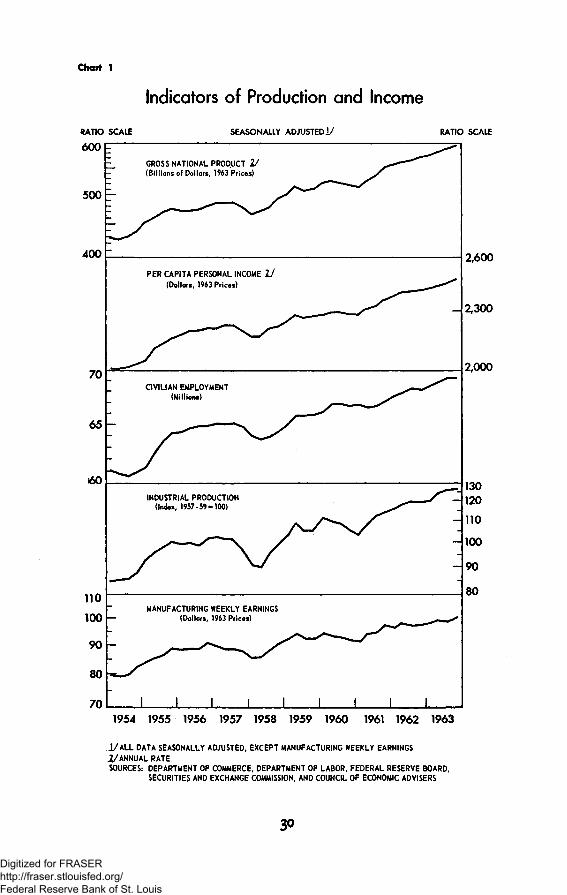
Chart 1
RATIO SCALE
600F
Indicators of Production and Income
SEASONALLY ADJUSTED!/
500
400
70
65
110
100
90
80
70
GROSS NATIONAL PRODUCT 1 /(Billions of Dollars, 1963 Prices)
PER CAPITA PERSONAL INCOME U
(Dollars, 1963 Prices)
CIVILIAN EMPLOYMENT(Millions)
INDUSTRIAL PRODUCTION(Index, 1957-59-100)
MANUFACTURING WEEKLY EARNINGS(Dollars, 1963 Prices)
RATIO SCALE
J I I J I J I
2,600
2,300
2,000
130120
110
100
90
80
1954 1955 1956 1957 1958 1959 1960 1961 1962 1963
I / A L L DATA SEASONALLY ADJUSTED. EXCEPT MANUFACTURING WEEKLY EARNINGS
1/ANNUAL RATE.
SOURCES: DEPARTMENT OF COMMERCE, DEPARTMENT OF LABOR, FEDERAL RESERVE BOARD,SECURITIES AND EXCHANGE COMMISSION. AND COUNCIL OF ECONOMIC ADVISERS
Digitized for FRASER http://fraser.stlouisfed.org/ Federal Reserve Bank of St. Louis
2 of this Report contains an analysis of the roots of poverty in America andthe broad outlines of a program to attack it.
In the long run the growth of economic abundance in any society dependsheavily on improvements in its technology. The current stage of tech-nological development promises a continued growth in productivity and areduction in toil. But technological progress always creates problems ofadjustment, and many fear that today's problems may be more severe thanthose of earlier periods. Chapter 3 examines the process of innovation inproduction, ways of speeding it up, and ways of easing the painful humanproblems it creates.
The return to full employment will put to a test the ability of the Ameri-can economy to make full use of its productive potential without a renewalof the price-wage spiral. Chapter 4 evaluates the economy's capacities foravoiding inflation in 1964 and beyond and emphasizes the need for respon-sible private price and wage making.
The importance of maintaining price stability is heightened by the needto eliminate the deficit in the United States' balance of international pay-ments, which remains a problem in spite of substantial inroads that havebeen made in the past year. After reviewing recent developments in thisarea, Chapter 5 turns to a question that will inevitably be raised by thereduction in this country's payments deficits—namely, the effectiveness ofthe free world's present international monetary system.
Since the end of World War II, the United States has become increasinglyaware that its own interests are closely interwoven with those of the devel-oping nations. Chapter 6 re-examines this interplay of interests and ex-plores its implications for American development assistance1 policies.
On October 28, 1963, the Council of Economic Advisers testified beforethe Subcommittee on Employment and Manpower of the Senate Committeeon Labor and Public Welfare. The testimony dealt with the unemploymentproblem, its relationship to changing production methods, and the role ofthe pending tax legislation in attacking the problem. Because the testimonyrelates to matters discussed in Chapters 1 and 3, it is reproduced in thisReport as Appendix A.
31
Digitized for FRASER http://fraser.stlouisfed.org/ Federal Reserve Bank of St. Louis
Chapter 1
Economic Expansion and Federal Policy
.HE AMERICAN ECONOMY has recorded nearly 3 years of solidexpansion since early 1961. But it urgently needs the tax cuts now pendingto complete the climb back toward full employment and full productionthat began 3 years ago. After reviewing the impressive record of these yearsand examining the role of Federal fiscal and monetary policy in achievingthis record, this chapter discusses the economic situation at the end of1963; the prospects for 1964; and the broad outlines of policy that can com-plete the return to full employment.
REVIEW OF THE EXPANSION
By April of this year, the present expansion will have become the secondlongest peacetime expansion of this century—exceeded only by the prolongedclimb out of the depths of the Great Depression. As Chart 2 shows, the$100 billion expansion since early 1961 has eclipsed the brief 1958-60 ex-pansion in both extent and duration, and has achieved in its first 11quarters a greater increase in total real output—16 percent—than wasachieved in the 13 quarters of the 1954-57 expansion. With early enact-ment of the pending tax bill it has every prospect of continuing throughout1964 at an accelerated pace.
EXPANSION OF DEMAND
While all major components of demand have contributed to the ex-pansion of the past 3 years, much of the advance has come from risingFederal, State, and local purchases of goods and services. Federal purchasesin constant dollars rose by 16 percent from the first quarter of 1961 to thefourth quarter of 1963 and accounted for 11 percent of the total increasein demand. As Table 1 indicates, this contrasts sharply with the twoprevious expansions, when declining real Federal purchases detracted fromthe increase in gross national product. State and local purchases rose by13 percent in constant dollars over the recent period, accounting for 9percent of the total demand increase.
A second major source of demand strength in the present expansionhas been private nonfarm residential construction. In contrast to theexperience of the two previous expansions, housing expenditure has risenfairly steadily since the beginning of 1961. From the first quarter of that
32
Digitized for FRASER http://fraser.stlouisfed.org/ Federal Reserve Bank of St. Louis
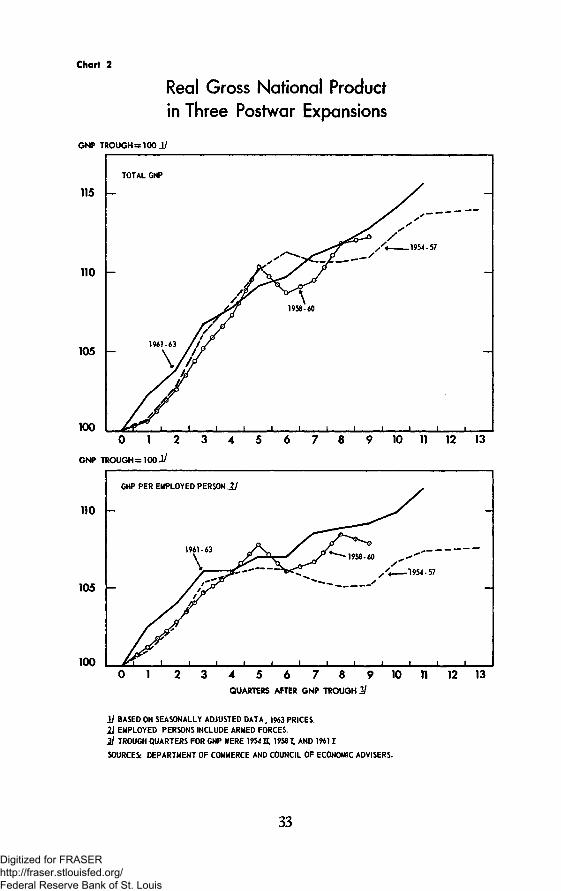
Chart 2
Real Gross National Productin Three Postwar Expansions
GNP TROUGH =100 Jj
115
110
105
100
TOTAL GNP
1961-63
0 1 2 3 4 5 6 7 8 9 10 11 12 13
0 1 2 3 4 5 6 7 8 9 10 Tl 12 13QUARTERS AFTER GNP TROUGH 1 /
JJ BASED ON SEASONALLY ADJUSTED DATA, 1963 PRICES.
21 EMPLOYED PERSONS INCLUDE ARMED FORCES.
2l TROUGH QUARTERS FOR GNP WERE 1954 H, 19581 AND 19611
SOURCES: DEPARTMENT OF COMMERCE AND COUNCIL OF ECONOMIC ADVISERS.
33
Digitized for FRASER http://fraser.stlouisfed.org/ Federal Reserve Bank of St. Louis
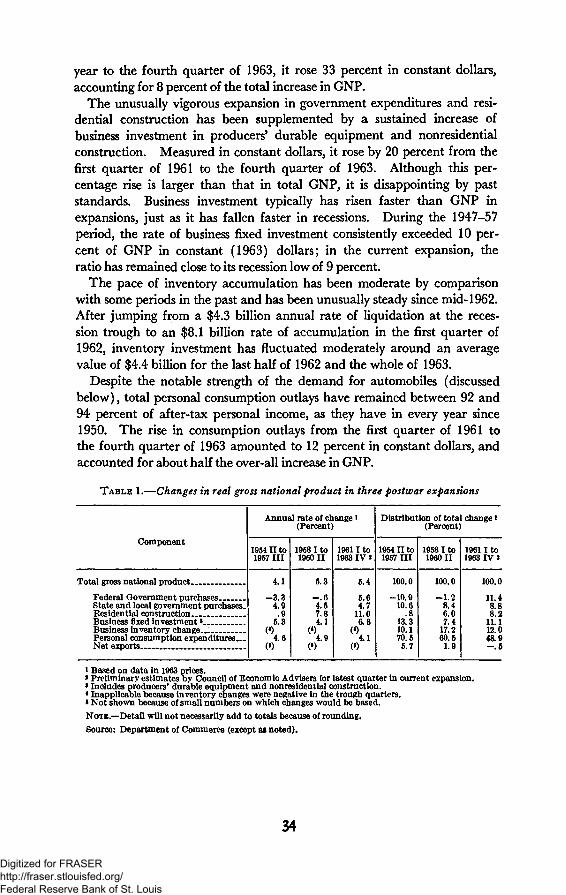
year to the fourth quarter of 1963, it rose 33 percent in constant dollars,accounting for 8 percent of the total increase in GNP.
The unusually vigorous expansion in government expenditures and resi-dential construction has been supplemented by a sustained increase ofbusiness investment in producers' durable equipment and nonresidentialconstruction. Measured in constant dollars, it rose by 20 percent from thefirst quarter of 1961 to the fourth quarter of 1963. Although this per-centage rise is larger than that in total GNP, it is disappointing by paststandards. Business investment typically has risen faster than GNP inexpansions, just as it has fallen faster in recessions. During the 1947-57period, the rate of business fixed investment consistently exceeded 10 per-cent of GNP in constant (1963) dollars; in the current expansion, theratio has remained close to its recession low of 9 percent.
The pace of inventory accumulation has been moderate by comparisonwith some periods in the past and has been unusually steady since mid-1962.After jumping from a $4.3 billion annual rate of liquidation at the reces-sion trough to an $8.1 billion rate of accumulation in the first quarter of1962, inventory investment has fluctuated moderately around an averagevalue of $4.4 billion for the last half of 1962 and the whole of 1963.
Despite the notable strength of the demand for automobiles (discussedbelow), total personal consumption outlays have remained between 92 and94 percent of after-tax personal income, as they have in every year since1950. The rise in consumption outlays from the first quarter of 1961 tothe fourth quarter of 1963 amounted to 12 percent in constant dollars, andaccounted for about half the over-all increase in GNP.
TABLE 1.—Changes in real gross national product in three postwar expansions
Component
Total gross national product
Federal Government purchasesState and local government purchases.Residential constructionBusiness fixed investment *Business inventory cbangc_IPersonal consumption expendituresNet exports
Annual rate of change1
(Percent)
1954II to1957 III
4.1
- 3 . 34.9
.95.3
(«)4.6
(»)
1958 I to1960 II
5.3
- . 64.57.84.1
( \ 9
(»)
19611 to1963 IV «
5.4
5.64.7
11.06.8
(4)4.1
(»)
Distribution of total change1(Percent)
1954II to1957 III
100.0
-10.910.6
.813.310.170.55.7
1958 I to1960 II
100.0
-1 .28.46.07.4
17.260.51.9
1961 I to1963 IV »
100.0
11.48.88.2
11.112.048.9- . 5
» Based on data in 1963 prices.»Preliminary estimates oy Council of Economic Advisers for latest quarter in current expansion.»Includes producers' durable equipment and nonresidential construction.4 Inapplicable because inventory changes were negative in the trough quarters.• Not shown because of small numbers on which changes would be based.
NOTE.—Detail will not necessarily add to totals because of rounding.
Source: Department of Commerce (except as noted).
34
Digitized for FRASER http://fraser.stlouisfed.org/ Federal Reserve Bank of St. Louis
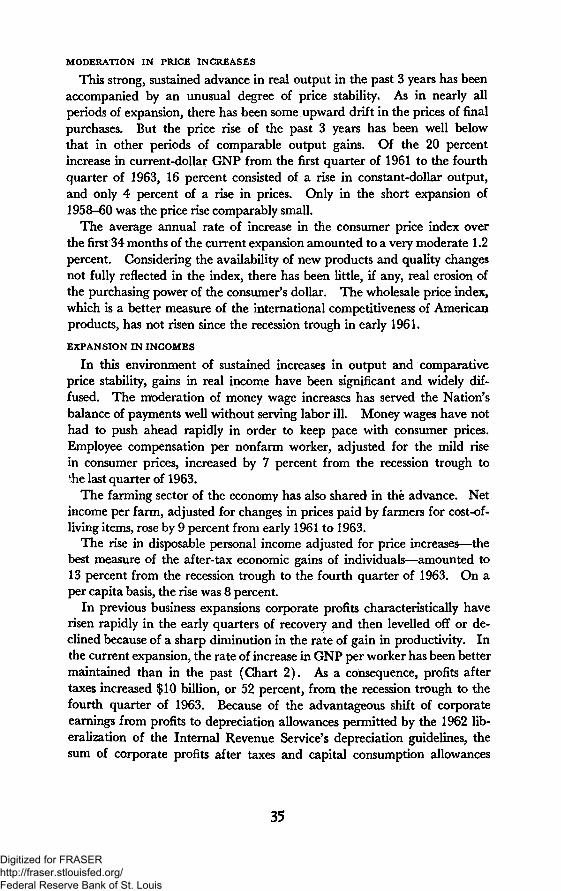
MODERATION IN PRICE INCREASES
This strong, sustained advance in real output in the past 3 years has beenaccompanied by an unusual degree of price stability. As in nearly allperiods of expansion, there has been some upward drift in the prices of finalpurchases. But the price rise of the past 3 years has been well belowthat in other periods of comparable output gains. Of the 20 percentincrease in current-dollar GNP from the first quarter of 1961 to the fourthquarter of 1963, 16 percent consisted of a rise in constant-dollar output,and only 4 percent of a rise in prices. Only in the short expansion of1958-60 was the price rise comparably small.
The average annual rate of increase in the consumer price index overthe first 34 months of the current expansion amounted to a very moderate 1.2percent. Considering the availability of new products and quality changesnot fully reflected in the index, there has been little, if any, real erosion ofthe purchasing power of the consumer's dollar. The wholesale price index,which is a better measure of the international competitiveness of Americanproducts, has not risen since the recession trough in early 1961.
EXPANSION IN INCOMES
In this environment of sustained increases in output and comparativeprice stability, gains in real income have been significant and widely dif-fused. The moderation of money wage increases has served the Nation'sbalance of payments well without serving labor ill. Money wages have nothad to push ahead rapidly in order to keep pace with consumer prices.Employee compensation per nonfarm worker, adjusted for the mild risein consumer prices, increased by 7 percent from the recession trough tothe last quarter of 1963.
The farming sector of the economy has also shared in the advance. Netincome per farm, adjusted for changes in prices paid by farmers for cost-of-living items, rose by 9 percent from early 1961 to 1963.
The rise in disposable personal income adjusted for price increases—thebest measure of the after-tax economic gains of individuals—amounted to13 percent from the recession trough to the fourth quarter of 1963. On aper capita basis, the rise was 8 percent.
In previous business expansions corporate profits characteristically haverisen rapidly in the early quarters of recovery and then levelled off or de-clined because of a sharp diminution in the rate of gain in productivity. Inthe current expansion, the rate of increase in GNP per worker has been bettermaintained than in the past (Chart 2). As a consequence, profits aftertaxes increased $10 billion, or 52 percent, from the recession trough to thefourth quarter of 1963. Because of the advantageous shift of corporateearnings from profits to depreciation allowances permitted by the 1962 lib-eralization of the Internal Revenue Service's depreciation guidelines, thesum of corporate profits after taxes and capital consumption allowances
35
Digitized for FRASER http://fraser.stlouisfed.org/ Federal Reserve Bank of St. Louis
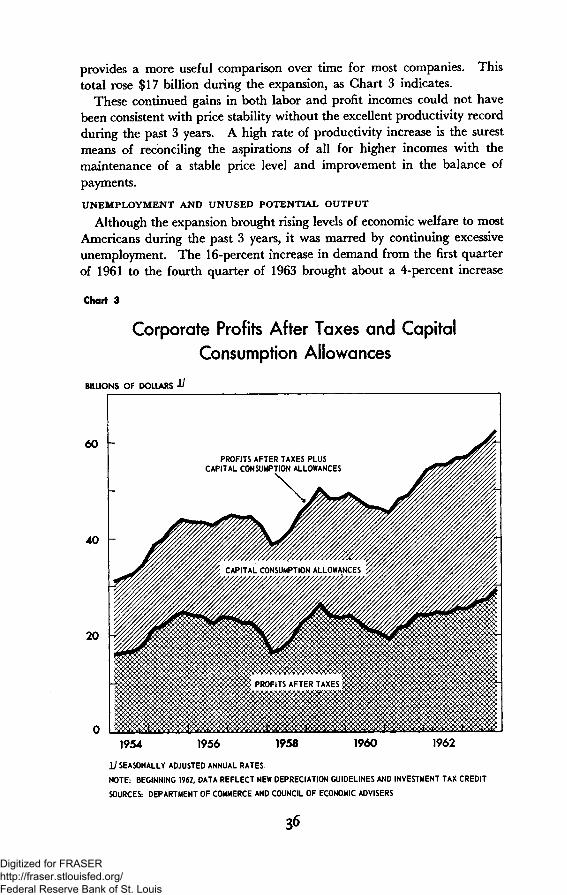
provides a more useful comparison over time for most companies. Thistotal rose $17 billion during the expansion, as Chart 3 indicates.
These continued gains in both labor and profit incomes could not havebeen consistent with price stability without the excellent productivity recordduring the past 3 years. A high rate of productivity increase is the surestmeans of reconciling the aspirations of all for higher incomes with themaintenance of a stable price level and improvement in the balance ofpayments.
UNEMPLOYMENT AND UNUSED POTENTIAL OUTPUT
Although the expansion brought rising levels of economic welfare to mostAmericans during the past 3 years, it was marred by continuing excessiveunemployment. The 16-percent increase in demand from the first quarterof 1961 to the fourth quarter of 1963 brought about a 4-percent increase
Chart 3
Corporate Profits After Taxes and CapitalConsumption Allowances
BILLIONS OF DOLLARS II
60 -
40
20
PROFITS AFTER TAXES PLUSCAPITAL CONSUMPTION ALLOWANCES
1954 1956 1958 1960 1962
1 / SEASONALLY ADJUSTED ANNUAL RATES.
NOTE: BEGINNING 1962, DATA REFLECT NEW DEPRECIATION GUIDELINES AND INVESTMENT TAX CREDIT
SOURCES: DEPARTMENT OF COMMERCE AND COUNCIL OF ECONOMIC ADVISERS
Digitized for FRASER http://fraser.stlouisfed.org/ Federal Reserve Bank of St. Louis
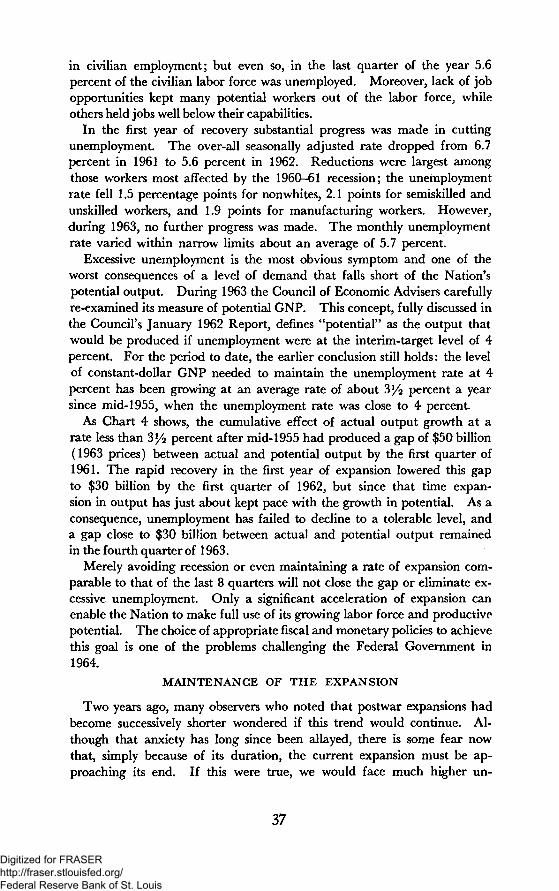
in civilian employment; but even so, in the last quarter of the year 5.6percent of the civilian labor force was unemployed. Moreover, lack of jobopportunities kept many potential workers out of the labor force, whileothers held jobs well below their capabilities.
In the first year of recovery substantial progress was made in cuttingunemployment. The over-all seasonally adjusted rate dropped from 6.7percent in 1961 to 5.6 percent in 1962. Reductions were largest amongthose workers most affected by the 1960-61 recession; the unemploymentrate fell 1.5 percentage points for nonwhites, 2.1 points for semiskilled andunskilled workers, and 1.9 points for manufacturing workers. However,during 1963, no further progress was made. The monthly unemploymentrate varied within narrow limits about an average of 5.7 percent.
Excessive unemployment is the most obvious symptom and one of theworst consequences of a level of demand that falls short of the Nation'spotential output. During 1963 the Council of Economic Advisers carefullyre-examined its measure of potential GNP. This concept, fully discussed inthe Council's January 1962 Report, defines "potential" as the output thatwould be produced if unemployment were at the interim-target level of 4percent. For the period to date, the earlier conclusion still holds: the levelof constant-dollar GNP needed to maintain the unemployment rate at 4percent has been growing at an average rate of about 3 / 2 percent a yearsince mid-1955, when the unemployment rate was close to 4 percent.
As Chart 4 shows, the cumulative effect of actual output growth at arate less than 3y2 percent after mid-1955 had produced a gap of $50 billion(1963 prices) between actual and potential output by the first quarter of1961. The rapid recovery in the first year of expansion lowered this gapto $30 billion by the first quarter of 1962, but since that time expan-sion in output has just about kept pace with the growth in potential. As aconsequence, unemployment has failed to decline to a tolerable level, anda gap close to $30 billion between actual and potential output remainedin the fourth quarter of 1963.
Merely avoiding recession or even maintaining a rate of expansion com-parable to that of the last 8 quarters will not close the gap or eliminate ex-cessive unemployment. Only a significant acceleration of expansion canenable the Nation to make full use of its growing labor force and productivepotential. The choice of appropriate fiscal and monetary policies to achievethis goal is one of the problems challenging the Federal Government in1964.
MAINTENANCE OF THE EXPANSION
Two years ago, many observers who noted that postwar expansions hadbecome successively shorter wondered if this trend would continue. Al-though that anxiety has long since been allayed, there is some fear nowthat, simply because of its duration, the current expansion must be ap-proaching its end. If this were true, we would face much higher un-
37
Digitized for FRASER http://fraser.stlouisfed.org/ Federal Reserve Bank of St. Louis
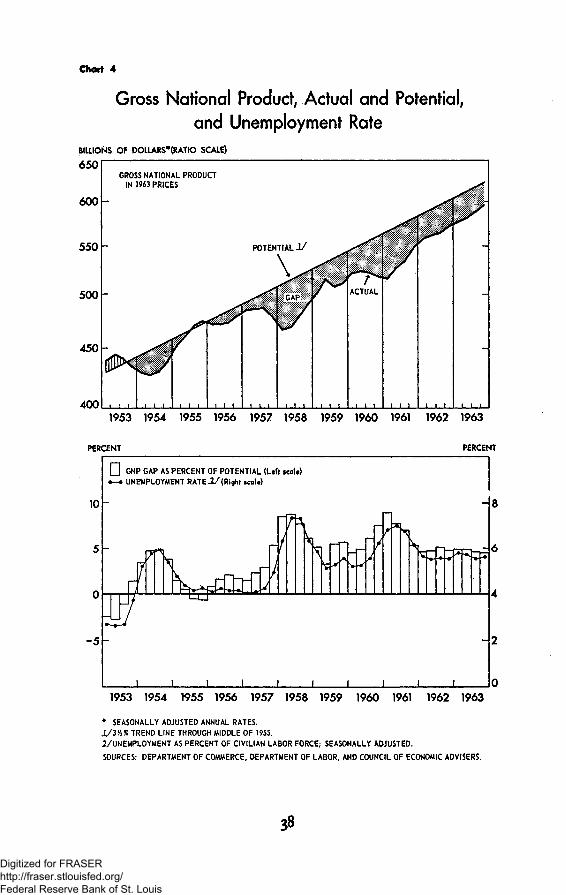
Chart 4
Gross National Product Actual and Potential,and Unemployment Rate
BILLIONS OF DOLLARS*(RATIO SCALE)
650
600
550
500
450
400
GROSS NATIONAL PRODUCTIN 1963 PRICES
pxfj\ I 1 1 t I
1953 1954 1955 1956 1957 1958 1959 1960 1961 1962 1963
PERCENT PERCENT
D GNP GAP AS PERCENT OF POTENTIAL (Left scale)
• - • UNEMPLOYMENT RATE 1/ (Right scale)
-5
j I I I
1953 1954 T955 1956 1957 1958 1959 1960 1961 1962 1963
* SEASONALLY ADJUSTED ANNUAL RATES.
±/2V2% TREND LINE THROUGH MIDDLE OF 1955.
I /UNEMPLOYMENT AS PERCENT OF CIVILIAN LABOR FORCE; SEASONALLY ADJUSTED.
SOURCES: DEPARTMENT OF COMMERCE, DEPARTMENT OF LABOR, AND COUNCIL OF ECONOMIC ADVISERS.
Digitized for FRASER http://fraser.stlouisfed.org/ Federal Reserve Bank of St. Louis
employment and greater wasted potential instead of a return to fuller useof our available resources.
The fact is that over-all business fluctuations have no fixed rhythms, andrecessions are not in any scientific sense inevitable. There are, it is true, cer-tain systematic features of the economic process leading to the onset of re-cession. During periods of prosperity, a larger part of the Nation's out-put is used to increase productive capacity through investment in plant,equipment, and business inventories. If over-all demand rises rapidlyenough to justify the added capacity, incentives for further growth of capi-tal are maintained, and the expansion of economic activity continues. Butwhen the growth of demand does not keep pace, business firms curtailfurther additions to capacity by trimming their investment outlays. Thereduction in investment, in turn, reduces employment and income, thus con-verting the initial slowdown in the growth of demand into an actual declinein general economic activity—a recession.
While individual recessions have their own features and their own proxi-mate causes, reversals from expansion can typically be traced to a failureof demand to keep pace with the expansion of capital facilities. Therehave been many occasions in the past when timely Federal policy actionscould have maintained the balance between demand and capacity andthereby changed our economic history. It is vital that such opportunitiesbe seized in the future.
FEDERAL POLICY AND FULL EMPLOYMENT
To comply with the mandate of the Employment Act of 1946 "to promotemaximum employment, production, and purchasing power," the FederalGovernment must adjust its programs to complement private demand.Given the magnitude of its expenditure commitments, its revenue collec-tions, its public debt management obligations, and its money and creditresponsibilities, the Government inevitably exerts a powerful impact ondemand. It is, therefore, a first principle of responsible Federal economicpolicy to try, insofar as possible, to adjust this impact in a way that promotesexpansion and price stability.
The instruments of fiscal policy—Federal taxes, transfer payments, sub-sidies, grants-in-aid, and purchases of goods and services—are the Govern-ment's most powerful tools for promoting expansion. Federal purchases ofgoods and services are themselves a component of demand, and indirectlythey affect the other components. Through their impact on employmentand income, they influence the level of consumption. By increasing salesand profits, they encourage investment expenditures. Similarly, taxes,transfers, and subsidies affect consumption and investment through theirobvious effects on disposable incomes, after-tax profits, and incentives.Federal grants-in-aid finance many State and local expenditure programs.
These fiscal policy tools, while powerful, can at present be used by theExecutive with only limited flexibility. Major expenditure programs mustbe related to a variety of domestic and international objectives as well as to
39
Digitized for FRASER http://fraser.stlouisfed.org/ Federal Reserve Bank of St. Louis
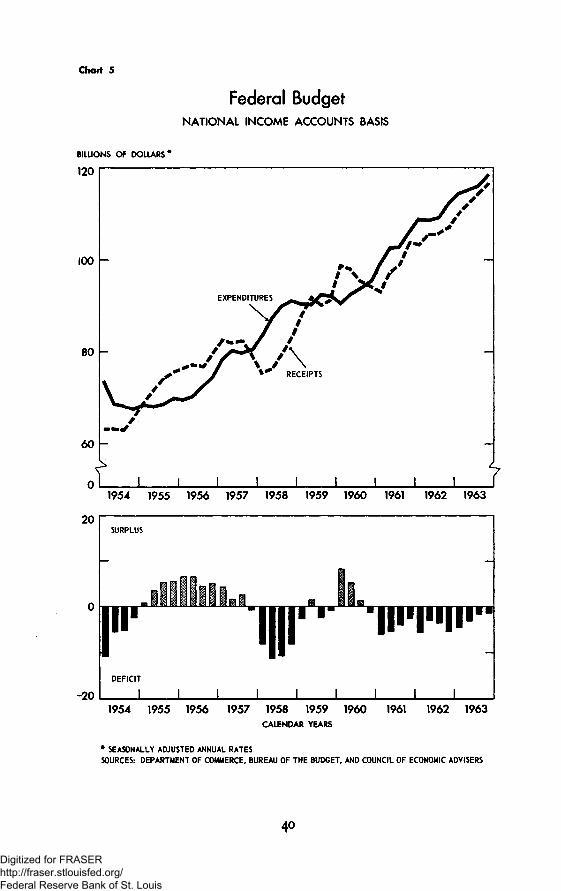
Chart 5
Federal BudgetNATIONAL INCOME ACCOUNTS BASIS
BILLIONS OF DOLLARS
120
100
80
EXPENDITURES
RECEIPTS
1 1 1 1 I 11954 1955 1956 1957 1958 1959 1960 1961 1962 1963
20SURPLUS
lull !•••••••••DEFICIT
-20 J I J I J I1954 1955 1956 1957 1958 1959 1960 1961 1962 1963
CALENDAR YEARS
* SEASONALLY ADJUSTED ANNUAL RATES
SOURCES: DEPARTMENT OF COMMERCE, BUREAU OF THE BUDGET, AND COUNCIL OF ECONOMIC ADVISERS
40
Digitized for FRASER http://fraser.stlouisfed.org/ Federal Reserve Bank of St. Louis
the requirements of economic efficiency. They are therefore sometimesdifficult to reconcile with income and employment goals in the annualbudgetary process. Moreover, under our constitutional system, legislationneeded to implement fiscal policies is the prerogative of the Congress. TheCongress has demonstrated its ability to enact tax and expenditure legisla-tion quickly in time of emergency, and the Executive Branch does havesome flexibility in the timing of expenditures. This limited flexibility wasused to good advantage in 1961. But without legislation to establish inadvance specific rules designed to facilitate flexible fiscal policy—such asthose requested by President Kennedy in 1962—tax and expenditure policiescannot be adjusted with sufficient speed to cope with the swift changesin private demand that bring recession or inflation. Greater flexibilitywould be desirable. However, the main function of fiscal policy mustcontinue to be the provision of a good supporting framework for expansion.
THE FULL-EMPLOYMENT BUDGET
The Federal budget on a national income and product accounts basisgives the most comprehensive picture available of the revenue and expendi-ture activities of the Government as these affect private demands and thelevel of economic activity. This budget includes the receipts and expendi-tures of the Federal trust fund accounts, as well as those in the administrativebudget, but excludes credit transactions. Unlike the administrative budget,it records corporate tax liabilities at the time they accrue rather than whencollections are made. These and other differences between the administra-tive budget and the national income and product accounts budget are out-lined in the January 1962 Report of the Council of Economic Advisers.
Federal policy decisions determine budgeted expenditures and a set oflaws governing tax rates and transfer payments. The actual surplus ordeficit position of the budget depends partly on the planned levels of expen-diture and the rates incorporated in the tax structure, and partly on thegeneral strength of private income and demand. Since both receipts andexpenditures are affected by the level of private demand, the budget servesas an automatic stabilizer, moving into deficit in a recession and toward asurplus in recovery. This pattern is evident in Chart 5.
The economic impact of a given budget program is best measured byits surplus or deficit at full-employment income levels. The surplus in thefull-employment budget is too large when the Government demand con-tained in the budget, and private investment and consumption demandsforthcoming from after-tax incomes, are insufficient to bring total outputto the full-employment level. The actual budget will then show a smallersurplus or larger deficit than the full-employment budget.
If the fiscal structure is biased in this direction, it can be corrected eitherby expanding Government purchases to employ idle resources in satisfyingpublic needs; or by expanding private business and personal after-tax in-comes through reduced tax rates or increased transfer payments to employ
Digitized for FRASER http://fraser.stlouisfed.org/ Federal Reserve Bank of St. Louis
idle resources in satisfying the demands of the private sector. When thebudget is too expansionary, the combination of public and private demandswill eventually exceed productive capacity, and excessive upward pressureon prices will develop. In this event, sound fiscal policy calls for loweringexpenditures or raising tax rates, or both.
The appropriate size of the surplus or deficit in the full-employmentbudget depends on the strength of private demand and its responsiveness tofiscal policy. The budget must counterbalance private demand. Theweaker the underlying determinants of private demand, the more expansion-ary the budget should be; the stronger these determinants, the more restrain-ing the budget should be.
Whether a given budget is too expansionary or restrictive depends alsoon other Government policies affecting private spending, of which monetarypolicy is the most important. Other things being equal, a strongly expan-sionary monetary policy permits a larger surplus by strengthening businessinvestment, residential construction, and other expenditures that are sensi-tive to the cost and availability of credit.
FISCAL POLICY IN A GROWING ECONOMY
In a growing economy, periodic budget adjustments are required tomaintain adequate expansion of total demand. The volume of tax revenuesrises as incomes grow if tax rates remain unchanged. At present tax rates,the revenues that the Federal Government would collect at full employmentincrease by more than $6 billion a year. If program needs do not requireexpenditures to grow at the same rate, tax rates must be reduced, or agrowing full-employment surplus will result, with increasingly restrictiveeffects on the economy.
In the past this very process has been a major factor in slowing ex-pansions and precipitating downturns. Thus the consequences of excessivepotential surpluses have been large actual deficits, unemployment, andinability to achieve steady growth.
To avoid these consequences, an appropriate expansion-promoting fiscalprogram would call for tax and expenditure policies that prevent a constric-tive rise in the full-employment surplus. As Chart 6 suggests, the experi-ence of the past 10 years has illustrated the tendency of the full-employmentsurplus to build up to expansion-retarding levels as the economy grows.The tax reductions of 1964 will be a giant step to remove a burdensomefiscal restraint before the economy levels off or goes into a recession, andto provide a framework for continued vigorous growth.
THE ROLE OF MONETARY POLICY
Establishing a suitable fiscal framework is not the only step the Govern-ment can take to promote full employment. The ability of the economyto maintain expansion in both its actual and its potential output is signifi-cantly affected by the monetary and debt management policies of theFederal Reserve System and the Treasury Department. Expenditures on
42
Digitized for FRASER http://fraser.stlouisfed.org/ Federal Reserve Bank of St. Louis
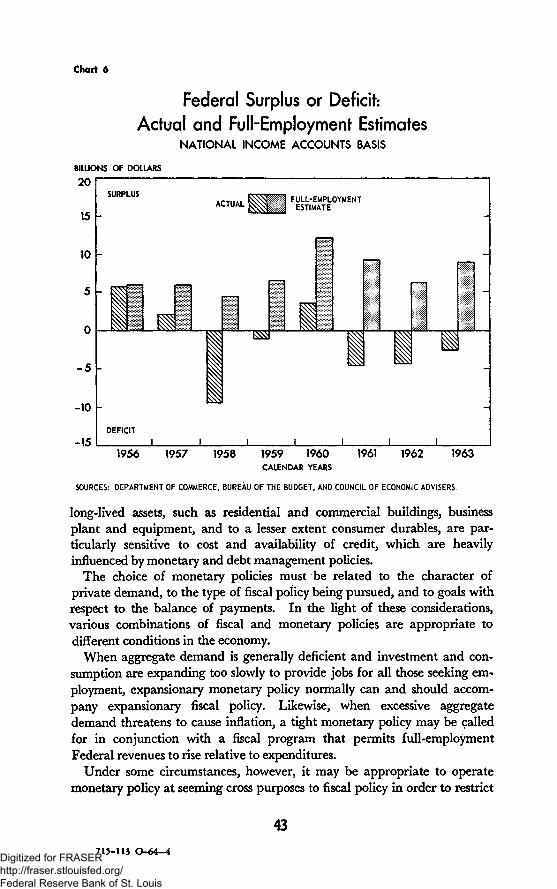
Chart 6
Federal Surplus or Deficit:Actual and Full-Employment Estimates
NATIONAL INCOME ACCOUNTS BASIS
BILLIONS OF DOLLARS
20
15
10
5
0
-5
-10
-15
SURPLUS
ACTUALFULL-EMPLOYMENT
ESTIMATE
rI
DEFICIT
1956 1957 1958 1959 1960 1961 1962 1963CALENDAR YEARS
SOURCES: DEPARTMENT OF COMMERCE, BUREAU OF THE BUDGET, AND COUNCIL OF ECONOMIC ADVISERS.
long-lived assets, such as residential and commercial buildings, businessplant and equipment, and to a lesser extent consumer durables, are par-ticularly sensitive to cost and availability of credit, which are heavilyinfluenced by monetary and debt management policies.
The choice of monetary policies must be related to the character ofprivate demand, to the type of fiscal policy being pursued, and to goals withrespect to the balance of payments. In the light of these considerations,various combinations of fiscal and monetary policies are appropriate todifferent conditions in the economy.
When aggregate demand is generally deficient and investment and con-sumption are expanding too slowly to provide jobs for all those seeking em-ployment, expansionary monetary policy normally can and should accom-pany expansionary fiscal policy. Likewise, when excessive aggregatedemand threatens to cause inflation, a tight monetary policy may be calledfor in conjunction with a fiscal program that permits full-employmentFederal revenues to rise relative to expenditures.
Under some circumstances, however, it may be appropriate to operatemonetary policy at seeming cross purposes to fiscal policy in order to restrict
43
715-113 O-64-4Digitized for FRASER http://fraser.stlouisfed.org/ Federal Reserve Bank of St. Louis
or expand the share of output devoted to investment. In general, an easiermonetary policy will permit a higher sustainable rate of investment andcapacity growth. Together with a slightly restrictive full-employmentbudget, such a policy mix may raise the growth rate of potential outputwhile keeping total demand within noninflationary bounds. Alternatively,if investment is so large relative to consumption and Government purchasesas to threaten a rapid buildup of excess capacity or serious bottlenecks incapital-goods industries, the need may be for monetary restraints on invest-ment and stimulus to consumption through a tax reduction.
A partially offsetting mix of fiscal and monetary policies also becomesappropriate when, as now, the Nation's balance-of-payments deficit is exces-sive at the same time that domestic expansion needs to be stimulated. Inthis case, however, it is useful to differentiate among types of monetary poli-cies. Efforts can be made—as they have been in the current expansion—to use the various tools of monetary and debt-management policy to keepthe cost and availability of long-term credit favorable to domestic expansion,while maintaining short-term interest rates at a level necessary to restrainshort-term capital outflows. Meanwhile, other more direct measures todeal with the balance-of-payments problem need to be pushed vigorously tocorrect the basic causes of the deficit and in the process provide more scopefor monetary policy in promoting domestic expansion.
Against the background of these general considerations, an understandingof the problems and possibilities of Federal policy in the maintenance ofexpansion can best be gained by examining the experience of the past threeexpansions.
F E D E R A L P O L I C Y I N T H E E X P A N S I O N S O F 1 9 5 4 - 5 7 A N D 1 9 5 8 - 6 0
The recovery from the 1954 recession was aided by a substantial tax cutand by the fact that materials shortages and controls during the Koreanconflict had limited the buildup of capacity to produce civilian goods. Theresult was a period of rapid expansion in late 1954 and early 1955, centeringfirst in inventories, automobiles, and housing. This was followed by aremarkable boom in fixed investment from the third quarter of 1955 throughthe third quarter of 1957.
The absence of price-wage restraint in the 1955-57 period contributed toa widespread inflation despite the lack of any general excess of demandover capacity output. Excess demand was confined to the durable goodsmanufacturing industry, where orders strained capacity in many lines.But sharp price and wage increases in this sector were imitated in otherindustries that did not share similar demand pressures.
Indeed, the lack of real output increases in early 1956 prompted predic-tions of recession. Despite the capital goods boom, total output levelled offat that time as automobiles, residential construction, and Federal purchasesall declined. But defense outlays increased sharply from mid-1956 to mid-1957, and capital goods purchases remained strong. By the time the
44
Digitized for FRASER http://fraser.stlouisfed.org/ Federal Reserve Bank of St. Louis
investment boom had run its course, total demand had not grown suffi-ciently to use fully the added capacity that had been created. Federaloutlays levelled off early in 1957 and then declined, just at a time whenexpansionary policy was needed to avoid a downturn. And the FederalReserve, which had been tightening money and credit conditions throughoutmost of the expansion, raised the discount rate in August 1957, just asthe downturn in production was beginning.
The entire expansion of 1958-60 was characterized by price stability,ample productive capacity, and excessive unemployment. Wholesale priceswere virtually steady throughout the expansion. The capacity utilizationrate in manufacturing had dropped to 73 percent in the 1958 recession,nearly 20 points below its peak level in the fourth quarter of 1955. Exceptfor brief periods of rapid inventory accumulation before and after the lengthysteel strike of 1959, the utilization rate never regained much more thanhalf this loss. Consequently the recovery of investment expenditure wasweak. The unemployment rate fell only to 5.0 percent, and that for only1 month. The average unemployment rate from January 1959 to May1960 (when the peak of the recovery was reached) was 5.4 percent.
Yet Federal policy was restrictive and wholly inappropriate to aperiod of insufficient demand. The full-employment surplus was allowedto rise drastically from a $4*4 billion level in 1958 to more than $12 billionin 1960. The expenditure line was held firmly while the only tax-ratechanges made were increases in social insurance and excise tax rates. Theturnaround from actual deficit to actual surplus was even more striking.Between the third quarter of 1958 and the first quarter of 1960, there wasa swing of nearly $20 billion (annual rate) from a $10.7 billion deficit toan $8.2 billion surplus. At a time when private investment demand wasdepressed by excess capacity, this fiscal restraint was clearly inconsistentwith continued expansion. If it had not been for a slow rise throughoutthe period in the share of disposable income consumed, it is doubtful thatthis shortest of all recent recoveries would have lasted even as long as it did.
The restrictive fiscal policy of 1958-60 was accompanied early in theexpansion by a shift toward monetary restraint that became progressivelymore severe and by late 1959 resulted in the tightest monetary and creditconditions of the postwar period. Treasury bill yields rose by 3*/2 percent-age points from mid-1958 to the end of 1959. Long-term Governmentbond yields increased by a full percentage point during the same period.The sector most adversely affected by this monetary tightness was housing.Private housing starts, which had risen strongly during the period of mone-tary ease immediately following the 1958 recession, fell by one-fourth fromthe beginning of 1959 to the middle of 1960. This reduced the demand forbuilding materials and, through its effect on incomes earned in the construc-tion industry, the demand for consumer goods. The combination of fiscaland monetary tightness contributed to a halt in the expansion of businessinvestment expenditures and led to a downturn after only 25 months ofexpansion.
45
Digitized for FRASER http://fraser.stlouisfed.org/ Federal Reserve Bank of St. Louis
FISCAL POLICY IN THE PRESENT EXPANSION
When the new Administration came to office in early 1961, the 1960-61recession was near its trough. The unemployment rate was close to 7 per-cent, and the rate of capacity utilization in manufacturing had fallen to77 percent. The economic task of first priority was to end the unnecessarywaste of resources.
The fiscal program adopted by Congress and the Administration loweredthe $12 billion full employment surplus of 1960 to $6 billion by 1962.This reduction was accomplished through both tax reductions and expendi-ture increases.
The expenditure increases of the 1961-62 period, undertaken to bolsterour defense and space programs and to provide for unmet civilian needs,were highly stimulating to the economy. Total Federal expenditures in-creased by $10 billion (annual rate) between the first quarter of 1961 andthe first quarter of 1962, making a major contribution to the 8.8 percentrise in GNP during the first recovery year. Increases in Federal expendi-tures continued beyond the initial recovery year. From the first quarter of1961 to the fourth quarter of 1963, Federal purchases of goods and servicesin current prices increased by $ll}/2 billion at annual rates, or 21 percent.Total Federal expenditures, which include transfer payments, subsidies,interest, and grants-in-aid as well as purchases of goods and services,increased by $19*/2 billion, or 20 percent, over the same period.
Two tax reduction measures—the new depreciation guidelines announcedby the Treasury in July 1962 and the investment tax credit enacted by theCongress in the Revenue Act of 1962—were adopted to stimulate laggingprivate investment. Their details are discussed in Appendix A of the Jan-uary 1963 Report of the Council of Economic Advisers. Their net effectwas to raise the annual cash flow to corporations by $2.5 billion in 1963 andto increase the after-tax rate of return on new investment projects. Thesemeasures contributed to the rapid rise in plant and equipment outlaysthat occurred after the first quarter of 1963. Since there are substan-tial lags in the investment decision-making and spending process, their fulleffects have not yet been realized.
In early 1963 the Administration proposed a program of tax reductionand revision designed to move the country toward full employment. Failureto enact this key part of the fiscal program by mid-1963 led to a rise in thefull-employment surplus when a reduction was needed. By the fourth quar-ter of 1963, with output still about $30 billion short of potential and anunemployment rate of 5.6 percent, the full-employment surplus was $9billion, and the actual budget deficit, on a national income and productbasis, fell close to zero. However, early enactment of the tax bill and enact-ment of the President's budget for fiscal 1965 will bring a sharp and neededreduction in the full-employment surplus. The tax and expenditure pro-gram will give a bigger fiscal stimulus in calendar 1964 than in any of thepast 3 years and will provide a strong, fresh impetus to the expansion.
46
Digitized for FRASER http://fraser.stlouisfed.org/ Federal Reserve Bank of St. Louis
MONETARY POLICY IN THE PRESENT EXPANSION
The fiscal policy of the 1961-63 years was complemented by a monetarypolicy designed to encourage an expanding economy while also defendingthe balance of payments. Actions were taken to raise short-term interestrates and to maintain them at levels that would reduce outflows of funds tomoney markets abroad. Within the limits established by this policy, theFederal Reserve provided money and bank credit to support the expansionand generally avoided placing upward pressure on long-term rates.
In attempting to pursue both its domestic and its balance-of-paymentsobjectives, the Federal Reserve used its policy instruments flexibly. InFebruary 1961 it began to supply a portion of new bank reserves throughthe purchase of longer-term securities. Meanwhile the Treasury concen-trated its new offerings of securities largely in short maturities to exertupward pressure on short-term interest rates. In the autumn of 1962 theFederal Reserve reduced reserve requirements on time and savings deposits,thereby releasing reserves for seasonal growth in money and credit withoutpurchasing short-term securities in the open market.
A particularly important factor that exerted upward pressure on short-term rates but held long-term rates down was the two-step change inRegulation Q in January 1962 and July 1963, which permitted banks topay higher interest rates on time and savings deposits. These steps acceler-ated the flow of savings into commercial banks, which in turn investedheavily in mortgages and State and local securities, thereby putting down-ward pressure on mortgage and other long-term yields. At the same timecommercial banks began to issue negotiable time certificates of depositin substantial quantities, which in effect added to the supply of short-termsecurities and helped to push up short-term interest rates.
In July 1963 the Federal Reserve increased the discount rate from 3to 31/2 percent, largely to reinforce efforts to raise short-term interest ratesfor balance-of-payments reasons.
Analysis of the results of Federal Reserve actions on the growth of de-posits and bank credit is especially difficult for this expansion periodbecause of the changes in Regulation Q. The recorded growth in moneysupply—at an average rate of 2.8 percent a year during the expansion—understates the degree to which monetary policy provided a stimulus tothe economy, since many business firms and individuals were induced toshift idle balances from demand to time deposits in order to take advantageof the higher interest rates.
On the other hand, the increase in time deposits—at an average rateof 15.2 percent a year—exaggerates the expansionary stimulus from mone-tary policy. The interest-rate increases on commercial bank time depositsraised their attractiveness relative to direct holdings of securities or depositsat other financial intermediaries. Thus, while bank credit expansion wasparticularly rapid, part of it reflected lending that otherwise would have
47
Digitized for FRASER http://fraser.stlouisfed.org/ Federal Reserve Bank of St. Louis
occurred through nonbank financial institutions or directly through thesecurities markets.
THE CURRENT SITUATION AND OUTLOOK
T H E ECONOMY IN 1 9 6 3
The economic expansion in 1963 substantially outdistanced most ex-pectations and even exceeded the forecast by the Council of EconomicAdvisers in its January 1963 Report, which was one of the more optimisticof the period. That forecast projected a range from $573 billion to$583 billion. Preliminary estimates indicate an actual figure of $585billion.
Much of the strength in 1963 centered in residential construction andautomobile buying. If the strength of those expenditures represented anunsustainable buildup of stocks or an excessive resort to credit, it wouldamount to borrowing from the future. If, however, it reflected long-termforces, it would be cause of optimism.
RESIDENTIAL CONSTRUCTION
Among the major demand components, the most surprising performerin 1963 was housing. Many observers expected that private nonfarmresidential construction expenditures would no more than hold their 1962level. Instead, because of the boom in construction of multifamily units,such expenditures increased by $l}/2 billion for the year as a whole, and thefourth-quarter-to-fourth-quarter advance was even larger.
The increase in housing activity is attributable partly to the success ofmonetary policy and Federal housing credit policies in maintaining an ade-quate supply of mortgage funds at favorable interest rates. Mortgage yieldscontinued to decline during the first half of 1963 and then levelled off. Theaverage term to maturity of conventional mortgages extended on new homepurchases increased from 23.3 years in December 1962 to 24.6 years inOctober 1963, and the average ratio of loan to value on such mortgagesincreased from 72.1 percent to 73.4 percent over the same period. Termson FHA mortgages were also liberalized.
Liberalization of mortgage credit makes more potential home buyerseligible to enter the market. But it also reduces the equity protection ofthose homeowners who borrow up to the limit, increasing their vulnerabilityto personal misfortune or general economic reversals. It is difficult toevaluate recent developments because of the lack of consensus on criteriaof soundness in mortgages and because the safety of the credit structuredepends basically on the general health of the economy. During the pastyear, the Federal Home Loan Bank Board has issued or proposed a series ofregulations that will help preserve sound credit practices of savings and loanassociations, the major source of home mortgage credit.
Digitized for FRASER http://fraser.stlouisfed.org/ Federal Reserve Bank of St. Louis
The future of residential building depends heavily on the sustainability ofconstruction of multifamily units. Multifamily housing starts have risen to36 percent of total starts in 1963, compared to an average of 13 percent dur-ing the 1950's. Rental, vacancy rates have been rising in the last year, andin some metropolitan areas are quite high. But in the aggregate they arestill below the levels that prevailed in 1961 at the beginning of the currenthousing boom. While an attitude of caution and concern about rentalhousing in 1964 is certainly justified, there are several favorable factors inthe outlook. Part of the great expansion of multifamily housing in the pastfew years has come in response to demographic changes. The increasedrelative importance of households at the two extreme ends of the adult agespectrum has raised the demand for apartment units. This demand hasnot yet been fully met in many communities, and builders of multifamilyunits can look forward to its acceleration in 2 or 3 years as the early post-war babies enter the housing market. Moreover, there continue to be unmetneeds for housing among lower-income and minority groups. The pro-posed tax cut will provide some support to multifamily construction by in-creasing the number of those able to afford better rental apartments.
However, given the large volume of multifamily construction already inthe pipeline, there is little probability of a further sizable expansion in 1964.Housing demand could decline in the coming year if the availability andterms of mortgage credit are not maintained in the face of rising businessdemands for credit.
AUTOMOBILES
While the share of their incomes that consumers devoted to auto purchasesduring 1963 was not far above the average for the past 10 years (as Table 2shows), the stock of automobiles in use has, nonetheless, grown considerably,both in quantity and in quality. In a static economy, this would suggest asizable decline in purchases in the following year. However, two considera-tions are reassuring.
First, the economy will not be static in 1964. The rate of cna,n5c of after-tax income next year will be extraordinarily large, both because of the cutin taxes and because of a substantial increase in before-tax incomes. More-over, the number of licensed drivers should continue to grow by at least2J/2 million a year.
Second, the buildup of car stocks during 1963 offers significant contrastswith that in 1955, which was the one clear case of substantial borrowingof demand from the future. Both real disposable income and the numberof licensed drivers are about 30 percent greater now than they were in 1955,while the number of domestic and imported cars sold in 1963 was notappreciably greater than in the earlier year. Moreover, a rising scrappagerate restrained the growth of the stock of cars. Hence, relative to popula-tion and income, the increase in automobile ownership in 1963 was notnearly so great as it was in 1955.
49
Digitized for FRASER http://fraser.stlouisfed.org/ Federal Reserve Bank of St. Louis
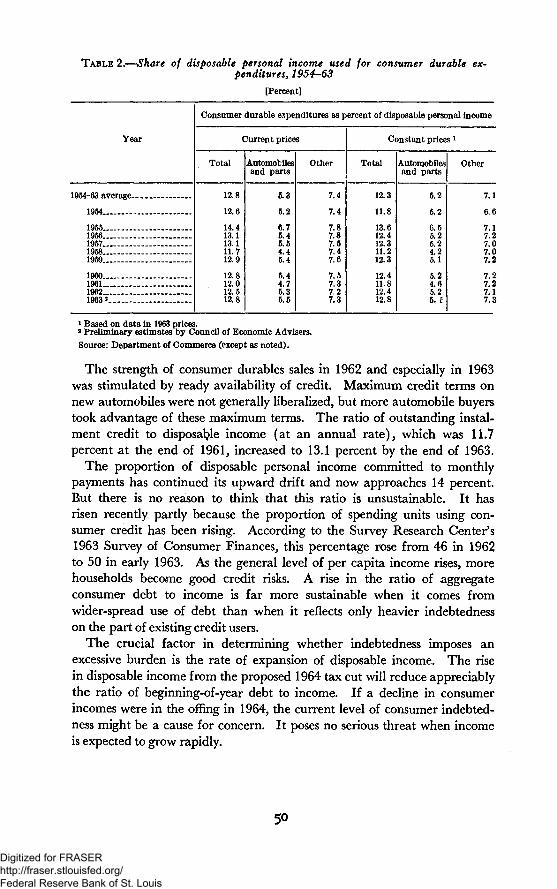
TABLE 2.—Share of disposable personal income used for consumer durable ex-penditures, 1954-63
[Percent]
Year
1954-63 average--
1954
19551956 _195719581959 —
I960 _196119621963 2
Consumer durable expenditures as percent of disposable personal income
Current prices
Total
12.8
12.6
14.413.113.111.712.9
12.812.012.512.8
Automobilesand parts
5.3
5.2
6.75.45.54.45.4
5.44.75.35.5
Other
7.4
7.4
7.87.87.57.47.6
7.57.37.27.3
Constant prices l
Total
12.3
11.8
13.612.412.311.212.3
12.411.812.412.8
Automobilesand parts
5.2
5.2
6.55.25.24.25.1
5.24.65.25. t
Other
7.1
6.6
7.17.27.07.07.2
7.27.27.17.3
* Based on data in 1963 prices.2 Preliminary estimates by Council of Economic Advisers.Source: Department of Commerce (except as noted).
The strength of consumer durables sales in 1962 and especially in 1963was stimulated by ready availability of credit. Maximum credit terms onnew automobiles were not generally liberalized, but more automobile buyerstook advantage of these maximum terms. The ratio of outstanding instal-ment credit to disposable income (at an annual rate), which was 11.7percent at the end of 1961, increased to 13.1 percent by the end of 1963.
The proportion of disposable personal income committed to monthlypayments has continued its upward drift and now approaches 14 percent.Rut there is no reason to think that this ratio is unsustainable. It hasrisen recently partly because the proportion of spending units using con-sumer credit has been rising. According to the Survey Research Center's1963 Survey of Consumer Finances, this percentage rose from 46 in 1962to 50 in early 1963. As the general level of per capita income rises, morehouseholds become good credit risks. A rise in the ratio of aggregateconsumer debt to income is far more sustainable when it comes fromwider-spread use of debt than when it reflects only heavier indebtednesson the part of existing credit users.
The crucial factor in determining whether indebtedness imposes anexcessive burden is the rate of expansion of disposable income. The risein disposable income from the proposed 1964 tax cut will reduce appreciablythe ratio of beginning-of-year debt to income. If a decline in consumerincomes were in the offing in 1964, the current level of consumer indebted-ness might be a cause for concern. It poses no serious threat when incomeis expected to grow rapidly.
Digitized for FRASER http://fraser.stlouisfed.org/ Federal Reserve Bank of St. Louis
THE OUTLOOK FOR GNP IN 1964
The demands for automobiles and housing should continue at high levelsin 1964, but they cannot be expected to provide fresh impetus to expansion.Nor is a substantial independent thrust likely to come from business invest-ment or government purchases. Thus a favorable outlook for 1964 is heavilydependent upon the passage and timing of the proposed tax reductions.
The process by which tax reduction will stimulate consumption and invest-ment demand is outlined in Appendix A of this Report. If the tax cuts werenot forthcoming, business and consumers not only would have to do withouttheir direct effect but would have to adjust to sharp disappointment. Withthe tax cuts, and taking into account the projected budget expenditures, theeconomy will receive a powerful stimulus. Indeed, it will be operating withlittle if any full-employment surplus for the first time since the Korean con-flict. The elimination of the estimated $9 billion full-employment sur-plus of calendar 1963 will mark an unprecedented use of fiscal policy forthe maintenance and acceleration of expansion. It must be recognizedthat, while the expansive effects of the projected tax cuts will be very sizable,the month-to-month timing of their impacts upon expenditures is not pre-cisely predictable. For this reason, it is especially appropriate this year toattach a range of plus or minus $5 billion to the forecast of the GNP for 1964.
Administration forecasts are always in some degree projections becausethey rest on assumptions about the enactment of the President's program.The dependence of this year's forecast on assumptions made about thenature and timing of the tax cuts is particularly heavy. The date of enact-ment and the initial withholding rate applied to wages and salaries areboth critical.
The assumptions underlying the present projection are—
First, that reduction of tax liabilities as recommended in thePresident's Budget Message will be enacted by February 1;
Second, that the withholding rate will be reduced from 18 per-cent to 14 percent by this legislation, to take effect as soon as pos-sible thereafter.
Under these assumptions, it is estimated that GNP for calendar 1964 willfall within a $10 billion range centering on $623 billion. If eventsdepart from the above assumptions, prospects for the year will be signifi-cantly altered. For example, if passage of the tax bill were delayed by1 month, the projected GNP range would center on $621 billion.
Prospects for the major components of demand appear to be thefollowing:
Government expenditures. State and local purchases of goods and serv-ices are expected to rise by at least $4 billion, the trend rate for the last fewyears. Although the President's Budget will call for a decline in Adminis-
Digitized for FRASER http://fraser.stlouisfed.org/ Federal Reserve Bank of St. Louis
trative Budget expenditures from fiscal 1964 to fiscal 1965, Federal pur-chases of goods and services are projected to increase by $2j/2 billion, fromcalendar 1963 to calendar 1964. This will be a smaller increase thanthose of the past few years.
Residential construction. Outlays for residential construction are notlikely to rise from their level at the end of 1963, but a small year-to-year in-crease seems probable.
Business fixed investment. The basic determinants of expenditures onfixed investment—both real and financial—are favorable to further ex-pansion. According to the business plant and equipment survey made bythe Department of Commerce and the Securities and Exchange Commis-sion, the annual rate of such expenditures (which account for over three-fourths of business fixed investment) will be about $1 billion higher in thefirst half of 1964 than in the latter half of 1963. The demand and profitstimulus provided by the tax cut should be sufficient to accelerate the rateof increase in the second half of 1964, giving a somewhat higher year-to-year increase than in 1963.
Inventory investment. With inventory-sales ratios quite favorable, in-ventory investment should respond fairly promptly to a step-up in the rateof increase in final demand and proceed at a rate well above the 1963 level,particularly toward the end of the year.
Consumption. Under the stimulus of a cut of nearly $9 billion in per-sonal tax collections, consumption expenditures will be a substantial forcein economic expansion in 1964, providing more than two-thirds of the totaldemand increase. Substantial year-to-year gains should be realized in allmajor expenditure categpries. While the dollar volume of automobile out-lays should rise with a tax cut, their share of disposable personal income mayfall slightly. A rise in the income share spent on other durables is quiteprobable.
In summary, the outlook this year calls for a significant acceleration inthe growth of output. At the midpoint of the forecast range, current-dollarGNP for 1964 is estimated to increase 6/2 percent above the level of 1963,and the real GNP, about 5 percent. Because last year's gains in the laborforce and productivity somewhat exceeded past trends, the 1963 growth of3.8 percent in real output was not sufficient to reduce the unemploymentrate. It seems likely that potential will continue in the year ahead to growslightly faster than its 3J4 percent average annual rate since 1955. Never-theless, the more rapid expansion of production in 1964 should lower theunemployment rate. By the end of the year, it is expected to fall to approx-imately 5 percent. Thus the year promises progress in reducing unem-ployment, but attainment of the interim goal of 4 percent lies beyond 1964.
Digitized for FRASER http://fraser.stlouisfed.org/ Federal Reserve Bank of St. Louis
BEYOND 19 6 4
Demand will continue to benefit in the years ahead from the powerfulstimulus of the current tax-reduction program. Prospects for 1964 areenormously improved by the impending tax legislation, but even so, thefull effect will not be felt this year. It will take some time for consumer out-lays to adjust fully to the rise in household incomes; somewhat longer delaysare likely in the response of capital expenditures. As these adjust to higheroperating rates and higher after-tax profits, the underlying strength of busi-ness demand for new capital should become evident for the first time innearly a decade.
Private demand will get support from fiscal policy throughout the 1965fiscal year. On January 1, 1965, a second instalment of tax reductionwill take effect. As a result, the gradual leveling off of Federal outlays,desired for—and permitted by—increasing efficiency in the government,can be consistent with a continued movement toward full employment.
A return to full employment will yield many benefits, as succeedingchapters make clear. It will reinforce programs to aid the disadvantagedand to promote smooth adjustment to technological change. It will in-crease the mobility of labor and capital. It will improve our productivityperformance, so important to the international competitiveness of ourproducts. Once demand matches our productive potential, efforts toaccelerate the growth of potential will become more effective and merit ahigher priority. In combination, full employment and accelerated growthcan produce a sharp improvement in U.S. economic performance for therest of the 1960's.
On November 17, 1961, the United States joined with the other 19member nations of the Organization for Economic Cooperation andDevelopment in setting as a target the attainment of a 50 percent (4.1percent a year) increase in their combined real gross national productsduring the decade from 1960 to 1970. The average year-to-year rate ofincrease of this Nation's GNP in the first 3 years of the decade, 3.9 percent,did not match the target rate for the OEGD countries as a whole. For theUnited States to raise its output by one-half during the decade, it willneed to grow at an average annual rate of 4.2 percent in the next 7 years.That rate is within our grasp.
Any lessening in international tensions that permits significant armsreductions consistent with national security will increase our ability to raiseour rate of economic growth. Resources no longer used in arms productioncan be used to upgrade the skills and equipment of the labor force, as wellas to raise the levels of private and public consumption. An economicpolicy ensuring that these resources are used for such purposes rather thanleft idle can raise the growth rate of potential output.
If we are to achieve the full benefits of our rising productive potentialand to avoid excessive unemployment, aggregate demand will have to con-
53
Digitized for FRASER http://fraser.stlouisfed.org/ Federal Reserve Bank of St. Louis
tinue to expand more rapidly than it has in the past. With the majorrelaxation in fiscal restraint in 1964, we will get a new and more accurateassessment of the strength of private demand as we move toward full em-ployment. This information will help to guide the monetary and budgetaryprograms for the years ahead. But the principles to guide policy are clear.They were stated in the Employment Act; they have been dramatized bythe experience of recent years. If this Nation is to achieve and maintain"maximum employment, production and purchasing power." it will be thecontinuing task of fiscal and monetary policy to support a strong, sustainablepace in the expansion of aggregate demand.
54
Digitized for FRASER http://fraser.stlouisfed.org/ Federal Reserve Bank of St. Louis
I
Chapter 2
The Problem of Poverty in America
N HIS MESSAGE on the State of the Union, President Johnson declaredall-out war on poverty in America. This chapter is designed to providesome understanding of the enemy and to outline the main features of astrategy of attack.
ELIMINATING POVERTY—A NATIONAL GOAL
There will always be some Americans who are better off than others. Butit need not follow that "the poor are always with us." In the United Statestoday we can see on the horizon a society of abundance, free of much of themisery and degradation that have been the age-old fate of man. Steadilyrising productivity, together with an improving network of private andsocial insurance and assistance, has been eroding mass poverty in America.But the process is far too slow. It is high time to redouble and to concen-trate our efforts to eliminate poverty.
Poverty is costly not only to the poor but to the whole society. Its uglyby-products include ignorance, disease, delinquency, crime, irresponsibility,immorality, indifference. None of these social evils and hazards will, ofcourse, wholly disappear with the elimination of poverty. But their severitywill be markedly reduced. Poverty is no purely private or local concern.It is a social and national problem.
But the overriding objective is to improve the quality of life of individualhuman beings. For poverty deprives the individual not only of materialcomforts but of human dignity and fulfillment. Poverty is rarely a builderof character.
The poor inhabit a world scarcely recognizable, and rarely recognized,by the majority of their fellow Americans. It is a world apart, whose in-habitants are isolated from the mainstream of American life and alienatedfrom its values. It is a world where Americans are literally concerned withday-to-day survival—a roof over their heads, where the next meal is comingfrom. It is a world where a minor illness is a major tragedy, where prideand privacy must be sacrificed to get help, where honesty can become aluxury and ambition a myth. Worst of all, the poverty of the fathers isvisited upon the children.
55
Digitized for FRASER http://fraser.stlouisfed.org/ Federal Reserve Bank of St. Louis
Equality of opportunity is the American dream, and universal educationour noblest pledge to realize it. But, for the children of the poor, educationis a handicap race; many are too ill prepared and ill motivated at home tolearn at school. And many communities lengthen the handicap by provid-ing the worst schooling for those who need the best.
Although poverty remains a bitter reality for too many Americans, itsincidence has been steadily shrinking. The fruits of general economicgrowth have been widely shared; individuals and families have respondedto incentives and opportunities for improvement; government and privateprograms have raised the educational attainments, housing standards,health, and productivity of the population; private and social insurancehas increasingly protected families against loss of earnings due to death,disability, illness, old age, and unemployment. Future headway againstpoverty will likewise require attacks on many fronts: the active promotionof a full-employment, rapid-growth economy; a continuing assault on dis-crimination; and a wide range of other measures to strike at specific rootsof low income. As in the past, progress will require the combined effortsof all levels of government and of private individuals and groups.
All Americans will benefit from this progress. Our Nation's most pre-cious resource is its people. We pay twice for poverty: once in the pro-duction lost in wasted human potential, again in the resources diverted tocoping with poverty's social by-products. Humanity compels our action,but it is sound economics as well.
This chapter considers, first, the changing numbers and composition ofAmerica's poor. Second, it presents a brief report on the factors thatcontribute to the continuation of poverty amidst plenty. Although theanalysis is statistical, the major concern is with the human problems thatthe numbers reflect. The concluding part concerns strategy against povertyin the 1960's and beyond. Supplementary tables at the end of the chapterprovide further data on the dimensions of poverty in America.
The sections below will chart the topography of poverty. A fewsignificant features of this bleak landscape deserve emphasis in advance.Poverty occurs in many places and is endured by people in many situations;but its occurrence is nonetheless highly concentrated among those with cer-tain characteristics. The scars of discrimination, lack of education, andbroken families show up clearly from almost any viewpoint. Here aresome landmarks:
—One-fifth of our families and nearly one-fifth of our total populationare poor.
—Of the poor, 22 percent are nonwhite; and nearly one-half of all non-whites live in poverty.
—The heads of over 60 percent of all poor families have only gradeschool educations.
—Even for those denied opportunity by discrimination, education sig-nificantly raises the chance to escape from poverty. Of all non-
56
Digitized for FRASER http://fraser.stlouisfed.org/ Federal Reserve Bank of St. Louis
white families headed by a person with 8 years or less of schooling,57 percent are poor. This percentage falls to 30 for high schoolgraduates and to 18 percent for those with some college education.
—But education does not remove the effects of discrimination: whennonwhites are compared with whites at the same level of education,the nonwhites are poor about twice as often.
—One-third of all poor families are headed by a person over 65, andalmost one-half of families headed by such a person are poor.
—Of the poor, 54 percent live in cities, 16 percent on farms, 30 percentas rural nonfarm residents.
—Over 40 percent of all farm families are poor. More than 80 per-cent of nonwhite farmers live in poverty.
—Less than half of the poor are in the South; yet a southerner's chanceof being poor is roughly twice that of a person living in the rest ofthe country.
—One-quarter of poor families are headed by a woman; but nearlyone-half of all families headed by a woman are poor.
—When a family and its head have several characteristics frequentlyassociated with poverty, the chances of being poor are particularlyhigh: a family headed by a young woman who is nonwhite and hasless than an eighth grade education is poor in 94 out of 100 cases.Even if she is white, the chances are 85 out of 100 that she and herchildren will be poor.
THE NATURE AND EXTENT OF POVERTY
Measurement of poverty is not simple, either conceptually or in practice.By the poor we mean those who are not now maintaining a decent standardof living—those whose basic needs exceed their means to satisfy them. Afamily's needs depend on many factors, including the size of the family,the ages of its members, the condition of their health, and their place ofresidence. The ability to fulfill these needs depends on current incomefrom whatever source, past savings, ownership of a home or other assets,and ability to borrow.
NEEDS AND RESOURCES
There is no precise way to measure the number of families who do nothave the resources to provide minimum satisfaction of their own particularneeds. Since needs differ from family to family, an attempt to quantifythe problem must begin with some concept of average need for an averageor representative family. Even for such a family, society does not havea clear and unvarying concept of an acceptable minimum. By the stand-ards of contemporary American society most of the population of the worldis poor; and most Americans were poor a century ago. But for our societytoday a consensus on an approximate standard can be found. One suchstandard is suggested by a recent study, described in a publication of the
57
Digitized for FRASER http://fraser.stlouisfed.org/ Federal Reserve Bank of St. Louis
Social Security Administration, which defines a "low-cost" budget for anonfarm family of four and finds its cost in 1962 to have been $3,955.The cost of what the study defined as an "economy-plan" budget was$3,165. Other studies have used different market baskets, many of themcosting more. On balance, they provide support for using as a boundary,a family whose annual money income from all sources was $3,000 (beforetaxes and expressed in 1962 prices). This is a weekly income of lessthan $60.
These budgets contemplate expenditures of one-third of the total on food,i.e., for a $3,000 annual budget for a 4-person family about $5 per personper week. Of the remaining $2,000, a conservative estimate for hous-ing (rent or mortgage payments, utilities, and heat) would be another$800. This would leave only $1,200—less than $25 a week—for clothing,transportation, school supplies and books, home furnishings and supplies,medical care, personal care, recreation, insurance, and everything else.Obviously it does not exaggerate the problem of poverty to regard $3,000 asthe boundary.
A family's ability to meet its needs depends not only on its money incomebut also on its income in kind, its savings, its property, and its ability toborrow. But the detailed data (of the Bureau of the Census) available forpinpointing the origins of current poverty in the United States refer tomoney income. Refined analysis would vary the income cut-off byfamily size, age, location, and other indicators of needs and costs. Thishas not been possible. However, a variable income cut-off was used in thesample study of poverty ;n 1959 conducted at the University of MichiganSurvey Research Center. This study also estimates the over-all incidenceof poverty at 20 percent; and its findings concerning the sources of povertycorrespond closely with the results based on an analysis of Census data.
A case could be made, of course, for setting the over-all income limiteither higher or lower than $3,000, thereby changing the statistical measureof the size of the problem. But the analysis of the sources of poverty, andof the programs needed to cope with it, would remain substantiallyunchanged.
No measure of poverty as simple as the one used here, would be suitablefor determining eligibility for particular benefits or participation in par-ticular programs. Nevertheless, it provides a valid benchmark for assess-ing the dimensions of the task of eliminating poverty, setting the broad goalsof policy, and measuring our past and future progress toward their achieve-ment.
If it were possible to obtain estimates of total incomes—including non-money elements—for various types of families, those data would be pref-erable for the analysis which follows. The Department of Commerce doesestimate total nonmoney incomes in the entire economy in such forms asthe rental value of owner-occupied dwellings and food raised and consumedon farms, and allocates them to families with incomes of different size.
58
Digitized for FRASER http://fraser.stlouisfed.org/ Federal Reserve Bank of St. Louis
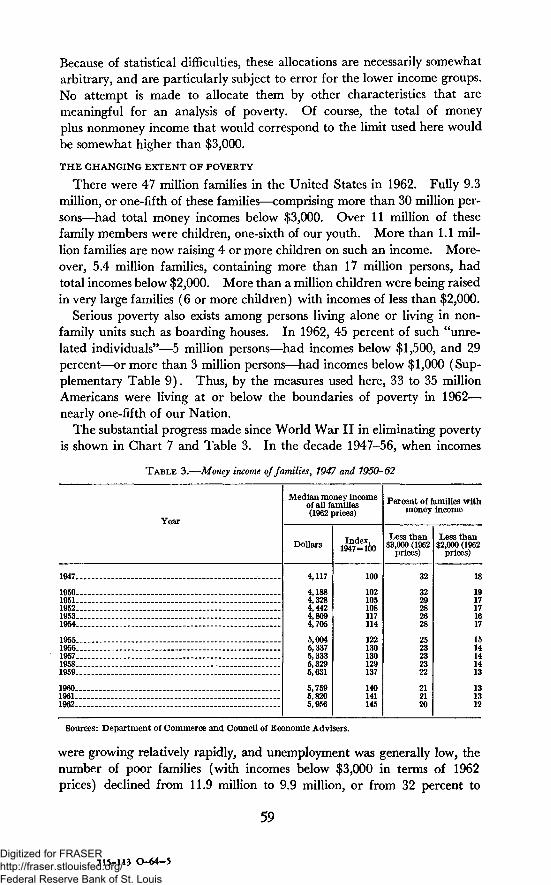
Because of statistical difficulties, these allocations are necessarily somewhatarbitrary, and are particularly subject to error for the lower income groups.No attempt is made to allocate them by other characteristics that aremeaningful for an analysis of poverty. Of course, the total of moneyplus nonmoney income that would correspond to the limit used here wouldbe somewhat higher than $3,000.
THE CHANGING EXTENT OF POVERTY
There were 47 million families in the United States in 1962. Fully 9.3million, or one-fifth of these families—comprising more than 30 million per-sons—had total money incomes below $3,000. Over 11 million of thesefamily members were children, one-sixth of our youth. More than 1.1 mil-lion families are now raising 4 or more children on such an income. More-over, 5.4 million families, containing more than 17 million persons, hadtotal incomes below $2,000. More than a million children were being raisedin very large families (6 or more children) with incomes of less than $2,000.
Serious poverty also exists among persons living alone or living in non-family units such as boarding houses. In 1962, 45 percent of such "unre-lated individuals"—5 million persons—had incomes below $1,500, and 29percent—or more than 3 million persons—had incomes below $1,000 (Sup-plementary Table 9) . Thus, by the measures used here, 33 to 35 millionAmericans were living at or below the boundaries of poverty in 1962—nearly one-fifth of our Nation.
The substantial progress made since World War II in eliminating povertyis shown in Chart 7 and Table 3. In the decade 1947-56, when incomes
TABLE 3.—Money income of families, 1947 and 1950-62
Year
1947 . — _
1950 _195119521953 —1954
1955195619571958 . —1959
I96019611962
Median money incomeof all families(1962 prices)
Dollars
4,117
4,1884,3284,4424,8094,705
5,0045,3375,3335,3295,631
5,7595,8205,956
Index,1947=100
100
102105108117114
122130130129137
140141145
Percent of families withmoney income
Less than$3,000 (1962
prices)
32
3229282628
2523232322
212120
Less than$2,000 (1962
prices)
18
1917171617
1514141413
131312
Sources: Department of Commerce and Council of Economic Advisers.
were growing relatively rapidly, and unemployment was generally low, thenumber of poor families (with incomes below $3,000 in terms of 1962prices) declined from 11.9 million to 9.9 million, or from 32 percent to
59
715-113 O-64-5Digitized for FRASER http://fraser.stlouisfed.org/ Federal Reserve Bank of St. Louis
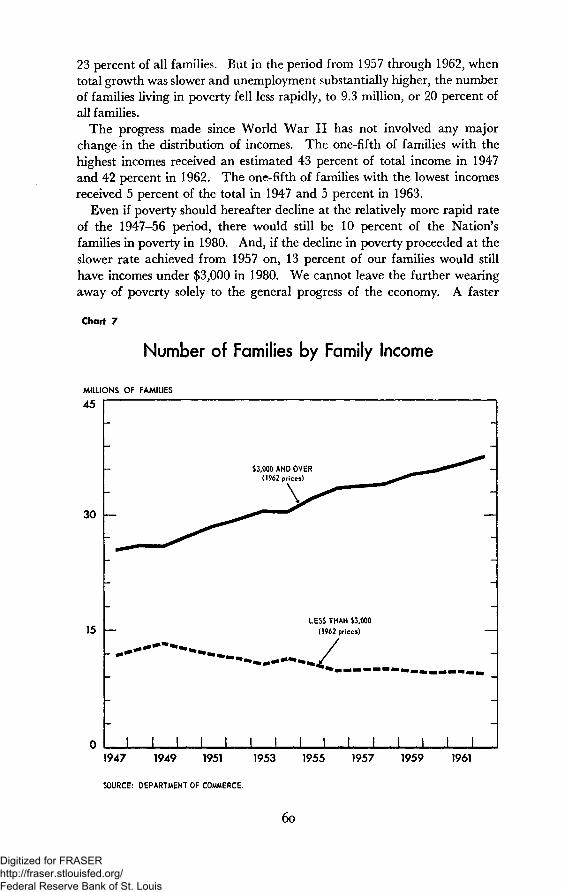
23 percent of all families. But in the period from 1957 through 1962, whentotal growth was slower and unemployment substantially higher, the numberof families living in poverty fell less rapidly, to 9.3 million, or 20 percent ofall families.
The progress made since World War II has not involved any majorchange in the distribution of incomes. The one-fifth of families with thehighest incomes received an estimated 43 percent of total income in 1947and 42 percent in 1962. The one-fifth of families with the lowest incomesreceived 5 percent of the total in 1947 and 5 percent in 1963.
Even if poverty should hereafter decline at the relatively more rapid rateof the 1947-56 period, there would still be 10 percent of the Nation'sfamilies in poverty in 1980. And, if the decline in poverty proceeded at theslower rate achieved from 1957 on, 13 percent of our families would stillhave incomes under $3,000 in 1980. We cannot leave the further wearingaway of poverty solely to the general progress of the economy. A faster
Chart 7
Number of Families by Family Income
MILLIONS OF FAMILIES
45
$3,000 AND OVER(1962 prices)
30
15LESS THAN $3,000
(1962 prices)
I 1 I 1 I I I 11947 1949 1951 1953
SOURCE: DEPARTMENT OF COMMERCE.
1955 1957 1959 1961
6o
Digitized for FRASER http://fraser.stlouisfed.org/ Federal Reserve Bank of St. Louis
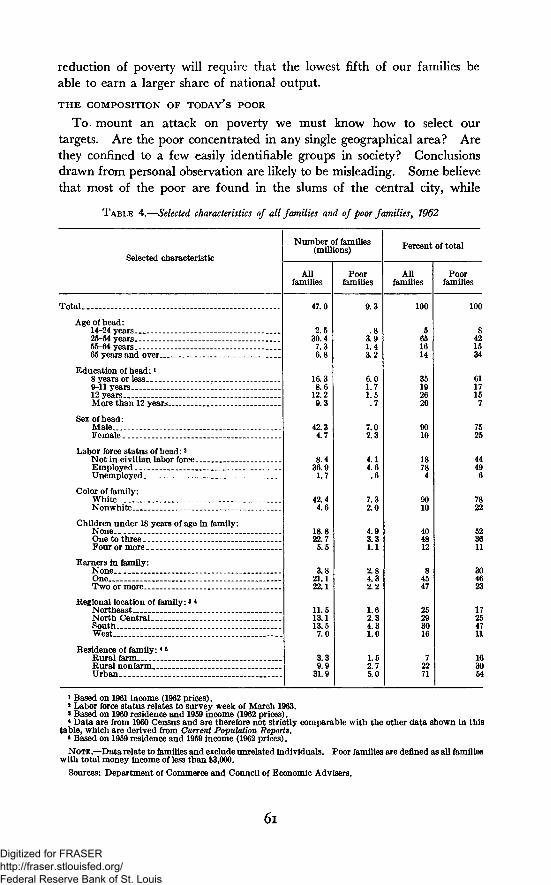
reduction of poverty will require that the lowest fifth of our families beable to earn a larger share of national output.
THE COMPOSITION OF TODAY'S POOR
To mount an attack on poverty we must know how to select ourtargets. Are the poor concentrated in any single geographical area? Arethey confined to a few easily identifiable groups in society? Conclusionsdrawn from personal observation are likely to be misleading. Some believethat most of the poor are found in the slums of the central city, while
TABLE 4.—Selected characteristics of all families and of poor families, 1962
Selected characteristic
Number of families(millions)
Allfamilies
Poorfamilies
Percent of total
Allfamilies
Poorfamilies
Total.
Age of head:14-24 years25-54 years.-55-64 years65 years and over..
Education of head: i8 years or less9-11 years12 yearsMore than 12 years..
Sex of head:MaleFemale
Labor force status of head: 2Not in civilian labor force_Employed _Unemployed
Color of family:WhiteNonwhite. . .
Children under 18 years of age in family:NoneOne to three .-_ _Four or more
Earners in family:NoneOneTwo or more__.
Regional location of family: 3 4NortheastNorth CentralSouthWest
Residence of family:4
Rural farmRural nonfarmUrban
47.0
2.530.47.36.8
16.38.6
12.29.3
42.34.7
8.436.9
1.7
42.44.6
18.822.75.5
3.821.122.1
11.513.113.57.0
3.39.9
31.9
9.3
.83.91.43.2
6.01.71.5.7
7.02.3
4.14.6
7.32.0
4.93.31.1
2.84.32.2
1.62.34.31.0
1.52.75.0
100 100
421534
6117157
7525
4449
7822
523611
304623
17254711
163054
1 Based on 1961 income (1962 prices).2 Labor force status relates to survey week of March 1963.* Based on 1960 residence and 1959 income (1962 prices).* Data are from 1960 Census and are therefore not strictly comparable with the other data shown in this
table, which are derived from Current Population Reports.» Based on 1959 residence and 1959 income (1962 prices).
NOTE.—Data relate to families and exclude unrelated individuals,with total money income of less than $3,000.
Poor families are defined as all families
Sources: Department of Commerce and Council of Economic Advisers.
61
Digitized for FRASER http://fraser.stlouisfed.org/ Federal Reserve Bank of St. Louis
others believe that they are concentrated in areas of rural blight. Somehave been impressed by poverty among the elderly, while others are con-vinced that it is primarily a problem of minority racial and ethnic groups.But objective evidence indicates that poverty is pervasive. To be sure,the inadequately educated, the aged, and the nonwhite make up substantialportions of the poor population. But as Table 4 shows, the poor are foundamong all major groups in the population and in all parts of the country.Further data on the composition of the poor population are found in Supple-mentary Tables 10 and 11.
Using the income measure of poverty described above, we find that78 percent of poor families are white. Although one-third of the poorfamilies are headed by a person 65 years old and over, two-fifths are headedby persons in the 25 to 54 year range. Although it is true that a great deal ofpoverty is associated with lack of education, almost 4 million poor families(39 percent) are headed by a person with at least some education beyondgrade school. The data show that less than half the poor live in the South.And the urban poor are somewhat more numerous than the rural poor.In Chart 8 the poor and the non-poor are compared in terms of these andother characteristics.
Yet there are substantial concentrations of poverty among certain groups.For example, families headed by persons 65 years of age and older represent34 percent of poor families. Moreover, they appear among the poor 2 5/2times as frequently as they appear among all families. The last 2 columnsof Table 4 show 5 additional major categories of families that appear morethan twice as often among the poor as among the total population: non-white families, families'headed by women, families headed by individualsnot in the civilian labor force, families with no wage earners, and ruralfarm families. Of course, some of these groups overlap considerably; butthe data help to identify prospective targets for an antipoverty attack. Thenext section pinpoints these targets further.
THE ROOTS OF POVERTY
Poverty is the inability to satisfy minimum needs. The poor are thosewhose resources—their income from all sources, together with their assetholdings—are inadequate. This section considers why those in poverty lackthe earned income, property income and savings, and transfer paymentsto meet their minimum needs.
EARNED INCOME
Why do some families have low earned incomes? Some are unemployedor partially unemployed. High over-all employment is a remedy of firstimportance. It would provide earned income for those unemployed whoare able to accept jobs and greater earnings for many presently workingpart-time. Yet it is clear that this is only a partial answer. Even for thoseable and willing to work, earnings are all too frequently inadequate, and a
62
Digitized for FRASER http://fraser.stlouisfed.org/ Federal Reserve Bank of St. Louis
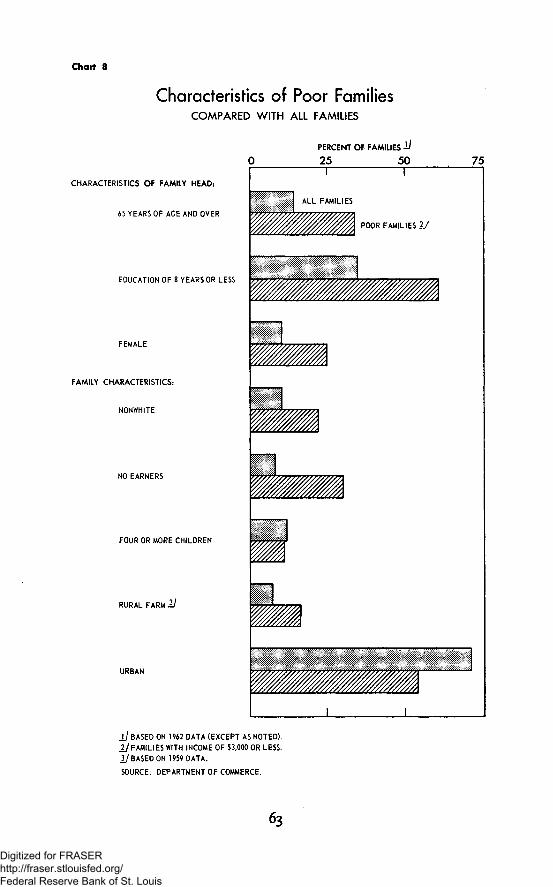
Chart 8
Characteristics of Poor FamiliesCOMPARED WITH ALL FAMILIES
PERCENT OR FAMILIES l /
0 25 50
CHARACTERISTICS OF FAMILY HEAD:
65 YEARS OF AGE AND OVER
EDUCATION OF 8 YEARS OR LESS
FEMALE
FAMILY CHARACTERISTICS:
NONWHITE
NO EARNERS
FOUR OR MORE CHILDREN
RURAL FARM 1 /
URBAN
I
ALL FAMILIES
POOR FAMILIES 1 /
±1 BASED ON 1962 DATA (EXCEPT AS NOTED).
17FAMILIES WITH INCOME OF $3,000 OR LESS.
Xl BASED ON 1959 DATA.
SOURCE: DEPARTMENT OF COMMERCE.
75
63
Digitized for FRASER http://fraser.stlouisfed.org/ Federal Reserve Bank of St. Louis
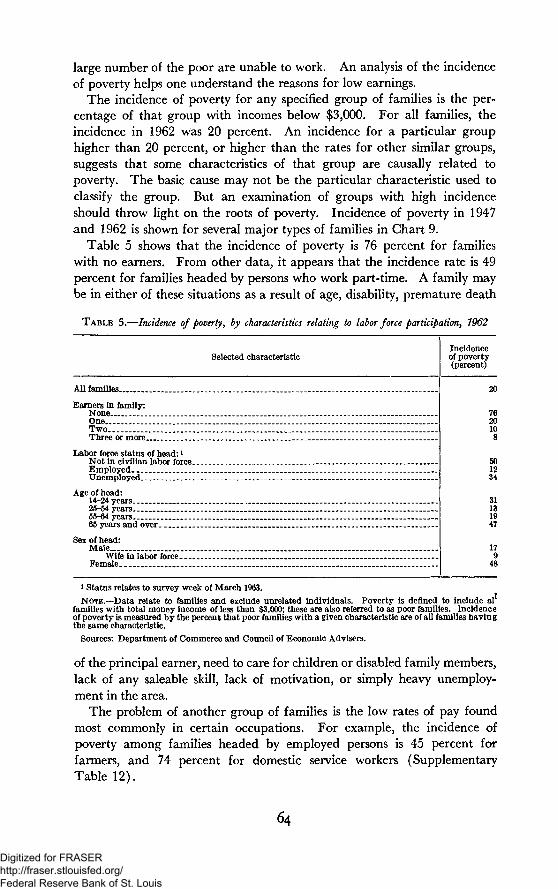
large number of the poor are unable to work. An analysis of the incidenceof poverty helps one understand the reasons for low earnings.
The incidence of poverty for any specified group of families is the per-centage of that group with incomes below $3,000. For all families, theincidence in 1962 was 20 percent. An incidence for a particular grouphigher than 20 percent, or higher than the rates for other similar groups,suggests that some characteristics of that group are causally related topoverty. The basic cause may not be the particular characteristic used toclassify the group. But an examination of groups with high incidenceshould throw light on the roots of poverty. Incidence of poverty in 1947and 1962 is shown for several major types of families in Chart 9.
Table 5 shows that the incidence of poverty is 76 percent for familieswith no earners. From other data, it appears that the incidence rate is 49percent for families headed by persons who work part-time. A family maybe in either of these situations as a result of age, disability, premature death
T A B L E 5.—Incidence of poverty, by characteristics relating to labor force participation, 7962
Selected characteristicIncidenceof poverty(percent)
All families
Earners in family:NoneOneTwo _.Three or more-
Labor force status of head:»Not in civilian labor force.EmployedUnemployed
Age of head:14-24 years25-54 years55-64 years65 years and over.
Sex of head:Male _
Wife in labor force.Female. _
20
762010
501234
31131947
17948
i Status relates to survey week of March 1963.
NOTE.—Data relate to families and exclude unrelated individuals. Poverty is defined to include alfamilies with total money income of less than $3,000; these are also referred to as poor families. Incidenceof poverty is measured by the percent that poor families with a given characteristic are of all families havingthe same characteristic.
Sources: Department of Commerce and Council of Economic Advisers.
of the principal earner, need to care for children or disabled family members,lack of any saleable skill, lack of motivation, or simply heavy unemploy-ment in the area.
The problem of another group of families is the low rates of pay foundmost commonly in certain occupations. For example, the incidence ofpoverty among families headed by employed persons is 45 percent forfarmers, and 74 percent for domestic service workers (SupplementaryTable 12).
64
Digitized for FRASER http://fraser.stlouisfed.org/ Federal Reserve Bank of St. Louis
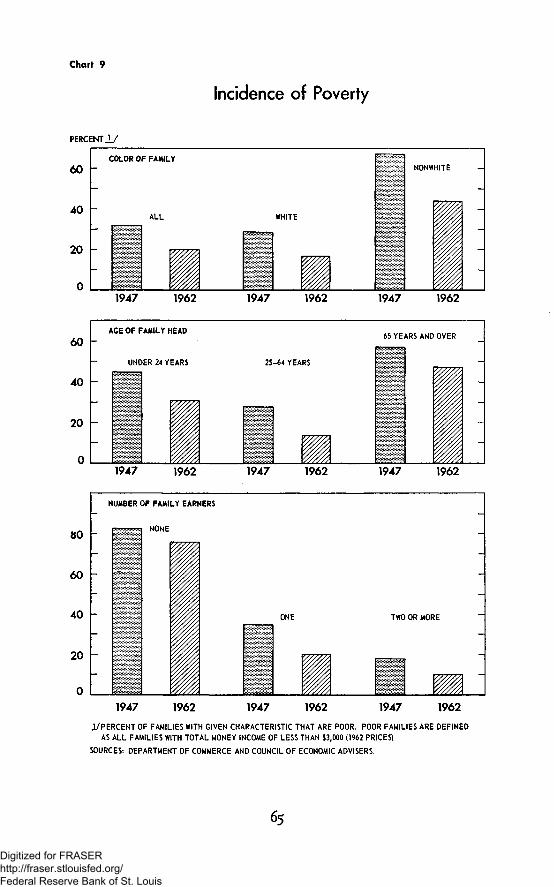
Chart 9
Incidence of Poverty
PERCENT U
60
40
20
COLOR OF FAMILY
ALL WHITE
NONWHITE
1947 1962 1947 1962 1947 1962
60
40
20
AGE OF FAMILY HEAD
UNDER 24 YEARS 25-64 YEARS
65 YEARS AND OVER
1947 1962 1947 1962 1947 1962
40 -
20 ~
1947 1962 1947 1962 1947 1962
i /PERCENT OF FAMILIES WITH GIVEN CHARACTERISTIC THAT ARE POOR. POOR FAMILIES ARE DEFINED
AS ALL FAMILIES WITH TOTAL MONEY INCOME OF LESS THAN $3,000 (1962 PRICES)
SOURCES: DEPARTMENT OF COMMERCE AND COUNCIL OF ECONOMIC ADVISERS
Digitized for FRASER http://fraser.stlouisfed.org/ Federal Reserve Bank of St. Louis
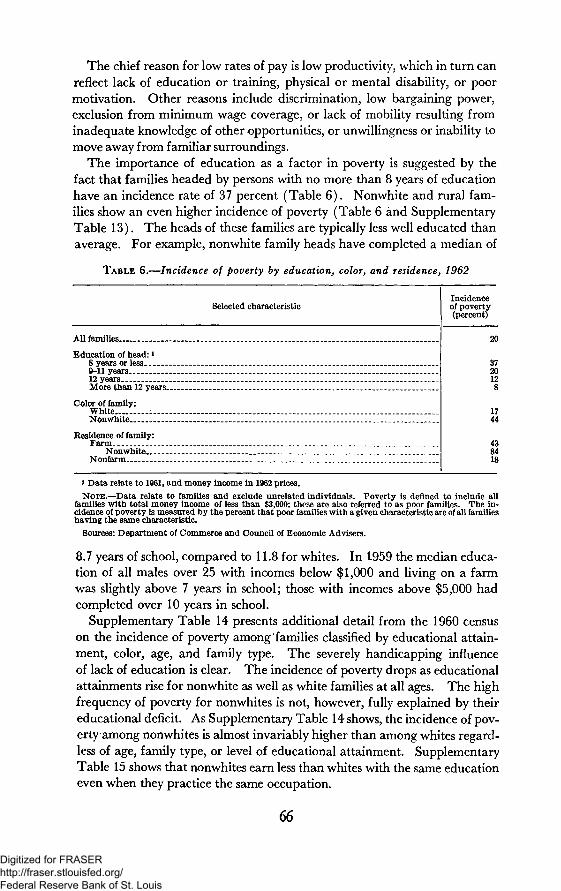
The chief reason for low rates of pay is low productivity, which in turn canreflect lack of education or training, physical or mental disability, or poormotivation. Other reasons include discrimination, low bargaining power,exclusion from minimum wage coverage, or lack of mobility resulting frominadequate knowledge of other opportunities, or unwillingness or inability tomove away from familiar surroundings.
The importance of education as a factor in poverty is suggested by thefact that families headed by persons with no more than 8 years of educationhave an incidence rate of 37 percent (Table 6). Nonwhite and rural fam-ilies show an even higher incidence of poverty (Table 6 and SupplementaryTable 13). The heads of these families are typically less well educated thanaverage. For example, nonwhite family heads have completed a median of
TABLE 6.—Incidence of poverty by education, color, and residence, 1962
Selected characteristicIncidenceof poverty(percent)
All families
Education of head: 18 years or less...ye9-11 years12 yearsMore than 12 years..
Color of family:WhiteNonwhite—
Residence of family:Farm
Nonwhite,.Nonfarm..
20
3720128
1744
438418
* Data relate to 1961, and money income in 1962 prices.
NOTE.—Data relate to families and exclude unrelated individuals. Poverty is denned to include allfamilies with total money income of less than $3,000; these are also referred to as poor families. The in-cidence of poverty is measured by the percent that poor families with a given characteristic are of all familieshaving the same characteristic.
Sources: Department of Commerce and Council of Economic Advisers.
8.7 years of school, compared to 11.8 for whites. In 1959 the median educa-tion of all males over 25 with incomes below $1,000 and living on a farmwas slightly above 7 years in school; those with incomes above $5,000 hadcompleted over 10 years in school.
Supplementary Table 14 presents additional detail from the 1960 censuson the incidence of poverty among families classified by educational attain-ment, color, age, and family type. The severely handicapping influenceof lack of education is clear. The incidence of poverty drops as educationalattainments rise for nonwhite as well as white families at all ages. The highfrequency of poverty for nonwhites is not, however, fully explained by theireducational deficit. As Supplementary Table 14 shows, the incidence of pov-erty among nonwhites is almost invariably higher than among whites regard-less of age, family type, or level of educational attainment. SupplementaryTable 15 shows that nonwhites earn less than whites with the same educationeven when they practice the same occupation.
66
Digitized for FRASER http://fraser.stlouisfed.org/ Federal Reserve Bank of St. Louis
Some families are forced into poverty by society's own standards. Theirpotential earners, otherwise able to hold a job, cannot free themselves fromthe family responsibilities which they must fulfill. Such is the case, forexample, with families headed by women with small children.
Customary or mandatory retirement at a specified age also limits earn-ings by some healthy, able-bodied persons. However, retirement is oftenassociated with deteriorating health, and poverty among the aged is greatestat ages over 70 or 75 and for aged widows—persons for whom employmentis not a realistic alternative.
PROPERTY INCOME AND USE OF SAVINGS
Some families with inadequate current earnings from work can avoidpoverty thanks to past savings—which provide an income and, if necessary,can be used to support consumption. Savings are particularly importantfor the elderly. More than half of those over 65 have money incomesabove $3,000, and many also own homes. Others, although their moneyincomes are below $3,000, have adequate savings that can be drawn uponto support a decent standard of consumption.
But most families with low earnings are not so fortunate. If avoidingpoverty required an income supplement of $1,500 a year for a retired manand his wife, they would need a capital sum at age 65 of about $19,000 toprovide such an annuity. Few families have that sum. The median networth for all spending units (roughly equivalent to the total of familiesand unrelated individuals) was only $4,700 in 1962. For all spendingunits whose head was 65 years or more, the median net worth was $8,000.Meeting contingencies caused by illnesses is often a crucial problem forolder people. About half of the aged, and about three-fourths of the agedpoor, have no hospital insurance, although their medical care costs are 2J4times as high as those of younger persons. Their resources are typicallyinadequate to cover the costs of a serious illness.
The median net worth of the fifth of all spending units having the lowestincomes was only $1,000. Much of what property they have is in the formof dwellings. (About 40 percent of all poor families have some equity ina house.) Although this means that their housing costs are reduced,property in this form does not provide money income that can be used forother current expenses.
Most families—including the aged—whose incomes are low in any oneyear lack significant savings or property because their incomes have alwaysbeen at poverty levels. This is clear in the results of the Michigan studyalready cited. Among the reporting families classified in that study as poorin 1959, 60 percent had never earned disposable income as high as $3,000,and nearly 40 percent had never reached $2,000. The comparable figuresfor all families were 17 percent and 10 percent, respectively. Among theaged poor reporting, 79 percent had never reached $3,000, and fully one-half had never earned $2,000. While nearly 60 percent of all families have
67
Digitized for FRASER http://fraser.stlouisfed.org/ Federal Reserve Bank of St. Louis
enjoyed peak incomes above $5,000, among all poor families only 14 percenthad ever reached that level; and a mere 5 percent of the aged poor hadever exceeded $5,000.
The persistence of poverty is reflected in the large number who have beenunable to accumulate savings. The Survey Research Center study foundthat more than one-half of the aged poor in 1959 had less than $500 in liquidsavings (bank deposits and readily marketable securities), and they hadnot had savings above that figure during the previous 5 years. Less thanone-fifth of all poor families reported accumulated savings in excess of $500.The mean amount of savings used by poor families in 1959 was $120; andonly 23 percent of the poor drew on savings at all.
It is clear that for most families property income and savings do notprovide a buffer against poverty. Some 1962 data on liquid savings arecontained in Supplementary Table 16.
TRANSFER PAYMENTS AND PRIVATE PENSIONS
Poverty would be more prevalent and more serious if many familiesand individuals did not receive transfer payments. In 1960, these payments(those which are not received in exchange for current services) constitutedonly 7 percent of total family income, but they comprised 43 percent of thetotal income of low-income spending units. At the same time, however,only about half of the present poor receive any transfer payments at all.And, of course, many persons who receive transfers through social insuranceprograms are not poor—often as a result of these benefits.
Transfer programs may be either public or private in nature and may ormay not have involved past contributions by the recipient. Public transferprograms include social insurance—such as Unemployment Compensation,Workmen's Compensation, and Old-Age, Survivors', and Disability Insur-ance (OASDI); veterans' benefits; and public assistance programs, such asOld Age Assistance (OAA) and Aid to Families with Dependent Children(AFDC).
Private transfer programs include organized systems such as private pen-sion plans and supplementary unemployment benefits, organized privatecharities, and private transfers within and among families.
It is important to distinguish between insurance-type programs and assist-ance programs, whether public or private. Assistance programs are ordi-narily aimed specifically at the poor or the handicapped. Eligibility fortheir benefits may or may not be based upon current income; but neithereligibility nor the size of benefits typically bears any direct relationship topast income. Eligibility for insurance-type programs, on the other hand,is based on past employment, and benefits on past earnings.
The Federal-State unemployment insurance system covers only about 77percent of all paid employment and is intended to protect workers with aregular attachment to the labor force against temporary loss of income.Benefits, of course, are related to previous earnings.
68
Digitized for FRASER http://fraser.stlouisfed.org/ Federal Reserve Bank of St. Louis
While the largest transfer-payment program, OASDI, now covers ap-proximately 90 percent of all paid employment, there are still several mil-lion aged persons who retired or whose husbands retired or died beforeacquiring coverage. Benefits are related to previous earnings, and theaverage benefit for a retired worker under this program at the end of 1963was only $77 a month, or $924 a year. The average benefit for a retiredworker and his wife if she is eligible for a wife's benefit is $1,565 a year.
Public insurance-type transfer programs have made notable contributionsto sustaining the incomes of those whose past earnings have been adequate,and to avoiding their slipping into poverty as their earnings are inter-rupted or terminated. These programs are of least help to those whoseearnings have never been adequate.
Public assistance programs are also an important support to low-incomeand handicapped persons. Money payments under OAA average about$62 a month for the country as a whole, with State averages ranging from$37 to about $95 a month. In the AFDG program the national averagepayment per family (typically of 4 persons) is about $129 a month,including services rendered directly. State averages range from $38 amonth to about $197 a month.
Private transfers within and between families are included in the totalmoney income figures used in this chapter only to the extent that they areregular in nature, e.g., alimony or family support payments, and are ex-cluded when they take the form of casual or irregular gifts or bequests.While data are lacking on the value of such gifts, they are clearly not amajor source of income for the poor.
Private pensions, providing an annuity, are additional resources for somepersons and families. In 1961 the beneficiaries of such plans numberedabout 2 million (as against about 12 million receiving OASDI benefits), andtotal benefits paid were about $2 billion. While the combination of OASDIand private pensions serves to protect some from poverty, most persons re-ceiving OASDI receive no private pension supplement. In any case, bene-fits under private pension plans range widely, and since they are typicallyrelated to the individual's previous earnings, they are low when earningshave been low.
Thus, although many families do indeed receive supplements to earningsin the form of pensions, social insurance benefits, and incomes from pastsaving, those families with a history of low earnings are also likely to havelittle of such supplementary income. And since most poor families havesmall amounts of property, they cannot long meet even minimum needsby depleting their assets.
THE VICIOUS CIRCLE
Poverty breeds poverty. A poor individual or family has a high prob-ability of staying poor. Low incomes carry with them high risks of illness;limitations on mobility; limited access to education, information, and train-
Digitized for FRASER http://fraser.stlouisfed.org/ Federal Reserve Bank of St. Louis
ing. Poor parents cannot give their children the opportunities for betterhealth and education needed to improve their lot. Lack of motivation,hope, and incentive is a more subtle but no less powerful barrier than lackof financial means. Thus the cruel legacy of poverty is passed from parentsto children.
Escape from poverty is not easy for American children raised in familiesaccustomed to living on relief. A recent sample study of AFDG recipientsfound that more than 40 percent of the parents were themselves raised inhomes where public assistance had been received. It is difficult for chil-dren to find and follow avenues leading out of poverty in environments whereeducation is deprecated and hope is smothered. This is particularly truewhen discrimination appears as an insurmountable barrier. Education maybe seen as a waste of time if even the well-trained are forced to accept meniallabor because of their color or nationality.
The Michigan study shows how inadequate education is perpetuated fromgeneration to generation. Of the families identified as poor in that study,64 percent were headed by a person who had had less than an eighth gradeeducation. Of these, in turn, 67 percent had fathers who had also gone nofurther than eighth grade in school. Among the children of these poorfamilies who had finished school, 34 percent had not gone beyond theeighth grade; this figure compares with 14 percent for all families. Fewerthan 1 in 2 children of poor families had graduated from high school, com-pared to almost 2 out of 3 for all families.
Of 2 million high school seniors in October 1959 covered by a Censusstudy, 12 percent did not graduate in 1960. Of these drop-outs 54 percenthad IQ's above 90, and 6 percent were above 110. Most of them had theintellectual capabilities necessary to graduate. The drop-out rate for non-white male students, and likewise for children from households with anonworking head, was twice the over-all rate. And it was twice as high forchildren of families with incomes below $4,000 as for children of familieswith incomes above $6,000. Moreover, many of the children of the poorhad dropped out before reaching the senior year.
A study of drop-outs in New Haven, Connecticut, showed that 48 percentof children from lower-class neighborhoods do not complete high school.The comparable figure for better neighborhoods was 22 percent.
Other studies indicate that unemployment rates are almost twice as highfor drop-outs as for high school graduates aged 16-24. Moreover, averageincomes of male high school graduates are 25 percent higher than those ofhigh school drop-outs, and nearly 150 percent higher than those of menwho completed less than 8 years of schooling.
There is a well-established association between school status and juveniledelinquency. For example, in the New Haven study cited above, 48 percentof the drop-outs, but only 18 percent of the high school graduates, had oneor more arrests or referrals to juvenile court.
70
Digitized for FRASER http://fraser.stlouisfed.org/ Federal Reserve Bank of St. Louis
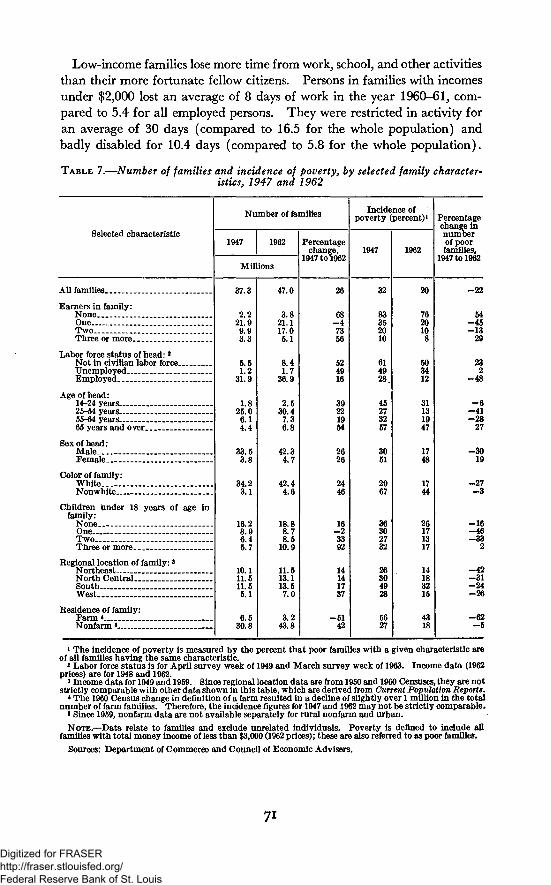
Low-income families lose more time from work, school, and other activitiesthan their more fortunate fellow citizens. Persons in families with incomesunder $2,000 lost an average of 8 days of work in the year 1960-61, com-pared to 5.4 for all employed persons. They were restricted in activity foran average of 30 days (compared to 16.5 for the whole population) andbadly disabled for 10.4 days (compared to 5.8 for the whole population).
TABLE 7.—Number of families and incidence of poverty, by selected family character-istics, 1947 and 1962
Selected characteristic
All families
Earners in family:NoneOneTwoThree or more. _
Labor force status of head: *Not in civilian labor forceUnemployedEmployed
Age of head:14-24 years25-54 years55-64 years _ _65 years and over
Sex of head:MaleFemale _ _ _
Color of family:WhiteNonwhite
Children under 18 years of age infamily:
NoneOneTwo _—Three or more
Regional location of family: 'NortheastNorth CentralSouthWest
Residence of family:Farm *Nonfann • . . .
Number of families
1947 1962
Millions
37.3
2.221.99.9Q O
5.51.2
31.9
1.825.06.14.4
33.53.8
34.23.1
16.28 96.45.7
10.111.511.55.1
6.530.8
47.0
3.821.117.05.1
8.41.7
36.9
2.530.47.36.8
42.34.7
42.44.6
18.88.78.5
10.9
11.513.113.57.0
3.243.8
Percentagechange,
1947 to 1962
26
68- 47356
524916
39221964
2626
2446
16—23392
14141737
5142
Incidence ofpoverty (percent)1
1947
32
83352010
614928.
45273257
3051
2967
36302732
26304928
5627
1962
20
7620108
503412
31131947
1748
1744
26171317
14183215
4318
Percentage
numberof poorfamilies,
1947 to 1962
- 2 2
54- 4 5—13
29
232
- 4 8
—6- 4 1- 2 8
27
- 3 019
- 2 7- 3
-16—46- 3 3
2
-42- 3 1- 2 4-26
-62- 5
1 The incidence of poverty is measured by the percent that poor families with a given characteristic areof all families having the same characteristic.
2 Labor force status is for April survey week of 1949 and March survey week of 1963. Income data (1962prices) are for 1948 and 1962.
3 Income data for 1949 and 1959. Since regional location data are from 1950 and 1960 Censuses, they are notstrictly comparable with other data shown in this table, which are derived from Current Population Reports.
* The 1960 Census change in definition of a farm resulted in a decline of slightly over 1 million in the totalnumber of farm families. Therefore, the incidence figures for 1947 and 1962 may not be strictly comparable.
« Since 1959, nonfarm data are not available separately for rural nonfann and urban.
NOTE.—Data relate to families and exclude unrelated individuals. Poverty is denned to include allfamilies with total money income of less than $3,000 (1962 prices); these are also referred to as poor families.
Sources: Department of Commerce and Council of Economic Advisers.
Digitized for FRASER http://fraser.stlouisfed.org/ Federal Reserve Bank of St. Louis
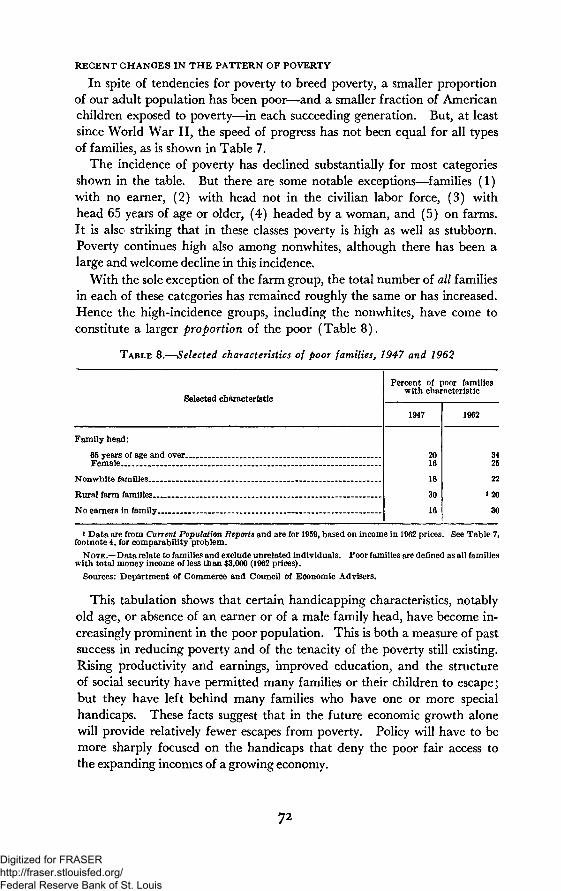
REGENT CHANGES IN THE PATTERN OF POVERTY
In spite of tendencies for poverty to breed poverty, a smaller proportionof our adult population has been poor—and a smaller fraction of Americanchildren exposed to poverty—in each succeeding generation. But, at leastsince World War II, the speed of progress has not been equal for all typesof families, as is shown in Table 7.
The incidence of poverty has declined substantially for most categoriesshown in the table. But there are some notable exceptions—families (1)with no earner, (2) with head not in the civilian labor force, (3) withhead 65 years of age or older, (4) headed by a woman, and (5) on farms.It is also striking that in these classes poverty is high as well as stubborn.Poverty continues high also among nonwhites, although there has been alarge and welcome decline in this incidence.
With the sole exception of the farm group, the total number of all familiesin each of these categories has remained roughly the same or has increased.Hence the high-incidence groups, including the nonwhites, have come toconstitute a larger proportion of the poor (Table 8).
TABLE 8.—Selected characteristics of poor families, 1947 and 1962
Selected characteristic
Family head:
65 years of age and over „Female *
Rural farm families...
No earners in family
Percent of poor familieswith characteristic
1947
2016
18
30
16
1962
3425
22
l 20
30
1 Data are from Current Population Reports and are for 1959, based on income in 1962 prices. See Table 7,footnote 4, for comparability problem.
NOTE .—Data relate to families and exclude unrelated individuals. Poor families are defined as all familieswith total money income of less than $3,000 (1962 prices).
Sources: Department of Commerce and Council of Economic Advisers.
This tabulation shows that certain handicapping characteristics, notablyold age, or absence of an earner or of a male family head, have become in-creasingly prominent in the poor population. This is both a measure of pastsuccess in reducing poverty and of the tenacity of the poverty still existing.Rising productivity and earnings, improved education, and the structureof social security have permitted many families or their children to escape;but they have left behind many families who have one or more specialhandicaps. These facts suggest that in the future economic growth alonewill provide relatively fewer escapes from poverty. Policy will have to bemore sharply focused on the handicaps that deny the poor fair access tothe expanding incomes of a growing economy.
Digitized for FRASER http://fraser.stlouisfed.org/ Federal Reserve Bank of St. Louis
But the significance of these shifts in composition should not be ex-aggerated. About half of the poor families are still headed neither by anaged person nor by a woman, and 70 percent include at least one earner.High employment and vigorous economic growth are still of major import-ance for this group. And it is essential to remember that one-third of thepresent poor are children. For them, improvements in the availabilityand quality of education offer the greatest single hope of escaping povertyas adults.
STRATEGY AGAINST POVERTY
Public concern for the poor is not new. Measures to prevent, and par-ticularly to relieve, poverty have an ancient origin in every civilization.Each generation in America has forged new weapons in the public andprivate fight against this perennial enemy. Until recent decades the focuswas primarily on the alleviation of distress, rather than on prevention orrehabilitation. Yet all the while, the sources of poverty have been erodedas a by-product of a general advance in economic well-being and of meas-ures designed to achieve other social goals. Universal education has beenperhaps the greatest single force, contributing both to social mobility andto general economic growth.
The social legislation of the New Deal, strengthened and expanded inevery subsequent national administration, marked a turning point by rec-ognizing a national interest in the economic well-being and security of indi-viduals and families. The social insurance programs established in the1930's were designed principally to alleviate poverty in old age and toshield families from the loss of all income during periods of unemployment.The tasks for our generation are to focus and coordinate our older programsand some new ones into a comprehensive long-range attack on the povertythat remains. A new federally led effort is needed, with special emphasison prevention and rehabilitation.
A forthcoming special Presidential message will describe the new attackand propose specific programs. The purpose of this section is not to presentthose measures, but rather to outline some leading elements of an over-allattack on poverty, recognizing the wide array of existing antipoverty pro-grams, pointing to ways in which they might be reinforced and focused inthe years ahead, and taking account of programs proposed in the past threeyears and awaiting consideration.
MAINTAINING HIGH EMPLOYMENT
The maintenance of high employment—a labor market in which thedemand for workers is strong relative to the supply—is a powerful forcefor the reduction of poverty. In a strong labor market there are new andbetter opportunities for the unemployed, the partially employed, and thelow paid. Employers have greater incentive to seek and to train workerswhen their own markets are large and growing. For these reasons, taxreduction is the first requisite in 1964 of a concerted attack on poverty. To
73
Digitized for FRASER http://fraser.stlouisfed.org/ Federal Reserve Bank of St. Louis
fight poverty in a slack economy with excess unemployment is to tie onehand behind our backs. We need not do so.
Accelerating economic growth. In the longer run the advance of stand-ards of living depends on the rate of growth of productivity per capita, andthis in turn depends on science and technology, capital accumulation, andinvestments in human resources, as Chapter 3 has indicated. Growth alsoexpands the resources available to governments and private organizations tofinance specific programs against poverty.
Fighting discrimination. A program to end racial discrimination inAmerica will open additional exits from poverty, and for a group with anincidence of poverty at least twice that for the Nation as a whole. Dis-crimination against Negroes, Indians, Spanish-Americans, Puerto Ricansand other minorities reduces their employment opportunities, wastes theirtalents, inhibits their motivation, limits their educational achievement andrestricts their choice of residence and neighborhood. Almost half ofnonwhite Americans are poor. For nonwhites infant mortality is twice ashigh as for whites; maternal deaths are four times as frequent; expectationof life for males at age 20 is almost five years less.
Discriminatory barriers have been erected and maintained by manygroups. Business and labor, other private organizations and individuals,and all levels of government must share in their removal.
The economic costs of discrimination to the total society are also large.By discrimination in employment, the Nation denies itself the output ofwhich the talents and training of the nonwhite population are alreadycapable. By discrimination in education and environment, the Nation deniesitself the potential talents of one-ninth of its citizens. But the basic caseagainst discrimination is not economic. It is that discrimination affrontshuman dignity.
The Executive Branch is vigorously pursuing nondiscriminatory policiesand practices. It has proposed comprehensive Civil Rights legislation thatwould help make it possible for all Americans to develop and use theircapabilities. But it will have its full effect only when all Americans joinin dedicating themselves to the justice of this cause.
Improving regional economies. In a dynamic economy, whole regionslose their economic base when their natural resources are depleted or changesin taste and technology pass them by. Appalachia and the cutover areasof the Northern Lakes States are contemporary examples. State andregional programs, assisted by the Federal Government through the AreaRedevelopment Administration, seek to restore in such regions a viable eco-nomic base suitable to their physical and human resources.
Rehabilitating urban and rural communities. Overcrowded, unsanitary,and unsafe neighborhoods are a drag on the economic progress of a wholecity. Eradication of slums can provide improved opportunities for theirresidents and enable them to contribute more to the community. Improvedrelocation programs are essential to avoid pushing the poor from an old
74
Digitized for FRASER http://fraser.stlouisfed.org/ Federal Reserve Bank of St. Louis

slum to a new one. Improved community facilities and services, includingday care centers for children of working mothers, are needed in low-incomeurban areas. (Nine million children under 12 have mothers who workoutside the home. Of these fully 400,000 are now expected to care forthemselves while their mothers work full time.) Among facilities that arecritically needed for slum families are adequate housing, hospitals, parks,libraries, schools, and community centers. Improvement of the physicalenvironment, however, is not enough. Especially when newcomers to urbanareas are involved, there need to be programs to facilitate adaptation to thenew environments. The Administration's proposed National Service Corpscould aid and supplement local efforts to provide these and other urgentlyneeded services.
Parallel programs for rehabilitation are needed in depressed rural areas.In some rural communities, even in whole counties, almost every familyis at the poverty level. In such situations local resources cannot possiblyprovide adequate schools, libraries, and health and community centers.A healthy farm economy is basic to the strength of farm communities;and the Rural Area Development program and the ARA are also ofassistance in improving income and employment opportunities on and offthe farm. Particular attention must be paid to the special problems ofdepressed nonfarm rural areas—such as the Ozarks or the larger part ofrural Appalachia; of Indians on reservations; and of migrant workers.
Improving labor markets. Improved employment information can helppotential workers learn about and take advantage of new job opportunities,sometimes in different industries, occupations, and locations. A strengthenedFederal-State Employment Service, better guidance and counseling serv-ices, development of a system for early warning of labor displacement re-sulting from technological change, assistance in worker relocation (as pro-vided by the Trade Expansion Act and in the recent amendments to theManpower Development and Training Act), increased amounts and dura-tion of unemployment insurance benefits and extension of its coverage—all these will enable more persons to maintain or increase their earnings.
Expanding educational opportunities. If children of poor families canbe given skills and motivation, they will not become poor adults. Toomany young people are today condemned to grossly inadequate schoolsand instruction. Many communities lack resources for developing ade-quate schools or attracting teachers of high quality. Other communitiesconcentrate their resources in the higher income areas, providing inadequateeducational opportunities to those at the bottom of the economic ladder.Effective education for children of poor families must be tailored to theirspecial needs; and such education is more costly and surely more difficultthan for children from homes that are economically and socially more secure.The school must play a larger role in the development of poor youngstersif they are to have, in fact, "equal opportunity." This often means that
75715-113 O-64-6
Digitized for FRASER http://fraser.stlouisfed.org/ Federal Reserve Bank of St. Louis

schooling must start on a pre-school basis and include a broad range ofmore intensive services. The President's program against poverty will pro-pose project grants to strengthen educational services to children of the poor.
Where such special efforts have been made, it has become clear thatfew children are unable to benefit from good education. Only a small per-centage of those born each year are incapable of acquiring the skills,motivation, and attitudes necessary for productive lives. The idea thatthe bulk of the poor are condemned to that condition because of innatedeficiencies of character or intelligence has not withstood intensive analysis.
Enlarging job opportunities for youth. Recent legislation for VocationalEducation will help to improve the preparation of teen-agers for productiveemployment. Improved counseling and employment services are neededfor those leaving school. The Administration's proposed Youth Employ-ment Act will strengthen on-the-job training and public service employ-ment programs, and will establish a Youth Conservation Corps.
Improving the Nation's health. The poor receive inadequate medicalcare, from before birth to old age. And poverty is perpetuated by poorhealth, malnutrition, and chronic disabilities. New and expanded schoolhealth and school lunch programs will improve both health and education.The recent Report of the President's Task Force on Manpower Conserva-tion, based on a survey of Selective Service rejectees, lends particularemphasis to the importance of improving our health programs, especiallythose aimed at children and young people. That Report also underlinesthe need to cope with educational deficiencies by expanded vocational andliteracy training and improved counseling.
Legislation has recently been enacted to increase the supply of physiciansand dentists, and to expand mental health services. The poor have aspecial stake in our ongoing programs of medical research. Many agedpersons are confronted by medical needs beyond their financial means.Passage of the program to provide hospital insurance for the aged underthe social security system is an urgent immediate step.
Promoting adult education and training. In an economy characterizedby continual technological advance, many adults will not be able to earnincomes above the poverty line without new skills and training. TheManpower Training and Development Act and the training programsunder the Area Redevelopment Act represent public recognition of thisneed. These and other programs to train and retrain workers must be ex-panded and strengthened, placing more emphasis on those with the great-est educational deficiencies. In particular, our relatively modest effortsto provide basic literacy have proved the value of such training. Manywho have been regarded (and have often regarded themselves) as un-educable can and do learn the basic skills, and these in turn equip themfor training programs supplying the specific skills sought by employers.Such basic education is now being made available to many more adults.
Assisting the aged and disabled. Continued long-run improvement ofsocial insurance benefits, along with expanded programs to cover hospital-
Digitized for FRASER http://fraser.stlouisfed.org/ Federal Reserve Bank of St. Louis

related costs for the aged, and augmented construction of housing to meetthe particular needs of the aged, are necessary steps in a continuing cam-paign against poverty.
ORGANIZING THE ATTACK ON POVERTY
In this latest phase of the Nation's effort to conquer poverty, we mustmarshal already developed resources, focus already expressed concerns, andback them with the full strength of an aroused public conscience.
Poverty, as has been shown, has many faces. It is found in the North andin the South; in the East and in the West; on the farm and in the city.It is found among the young and among the old, among the employed andthe unemployed. Its roots are many and its causes complex. To defeatit requires a coordinated and comprehensive attack. No single programcan embrace all who are poor, and no single program can strike at all thesources of today's and tomorrow's poverty.
Diverse attacks are needed, but we must not lose sight of their commontarget—poverty. Many programs are directed against social problemswhich the poor share with the non-poor—insecurity of income, depressedregional economies, inefficient and unattractive rural and urban environ-ments, disabilities of health and age, inadequate educational opportunities,racial discrimination. These are all to the good. But we must not letpoor individuals and families get lost between these programs. Programsmust be sufficiently coordinated that, whatever else they individually accom-plish, they act together to lift the economic and social status of America'spoor. And soon. For war has now been declared on poverty as such.
This coordinated attack must be adapted to local circumstances. Theneeds of the poor are not the same in East Kentucky and in West Harlem.Coordinated programs of community action will play a critical role in theassault on poverty. Communities will be encouraged and helped to developindividual programs aimed at the special problems of their own poor families.Individual communities thus can participate in a nationwide action, re-search, and demonstration program, backed by the interest and resources ofState and local governments and private organizations, and the coordinatedefforts of Federal agencies working in such fields as education, health,housing, welfare, and agriculture.
Conquest of poverty is well within our power. About $11 billion ayear would bring all poor families up to the $3,000 income level wehave taken to be the minimum for a decent life. The majority of theNation could simply tax themselves enough to provide the necessary incomesupplements to their less fortunate citizens. The burden—one-fifth ofthe annual defense budget, less than 2 percent of GNP—would certainlynot be intolerable. But this "solution" would leave untouched most of theroots of poverty. Americans want to earn the American standard of livingby their own efforts and contributions. It will be far better, even if moredifficult, to equip and to permit the poor of the Nation to produce and toearn the additional $11 billion, and more. We can surely afford greatergenerosity in relief of distress. But the major thrust of our campaign must
77Digitized for FRASER http://fraser.stlouisfed.org/ Federal Reserve Bank of St. Louis

be against causes rather than symptoms. We can afford the cost of thatcampaign too.
The Nation's attack on poverty must be based on a change in nationalattitude. We must open our eyes and minds to the poverty in our midst.Poverty is not the inevitable fate of any man. The condition can be eradi-cated; and since it can be, it must be. It is time to renew our faith in theworth and capacity of all human beings; to recognize that, whatevertheir past history or present condition, all kinds of Americans can con-tribute to their country; and to allow Government to assume its respon-sibility for action and leadership in promoting the general welfare.
Digitized for FRASER http://fraser.stlouisfed.org/ Federal Reserve Bank of St. Louis
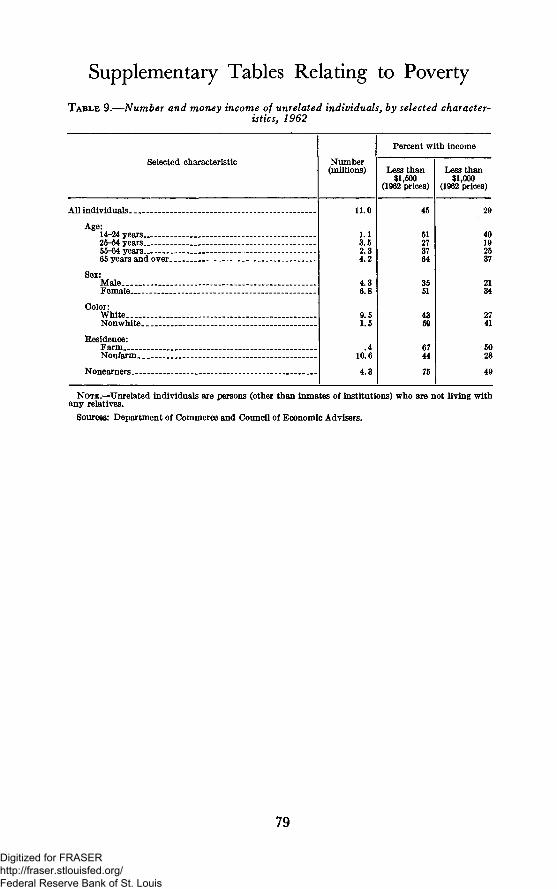
Supplementary Tables Relating to Poverty
TABLE 9.—Number and money income of unrelated individuals, by selected character-istics, 1962
Selected characteristic Number(millions)
Percent with income
Less than$1,500
(1962 prices)
Less than$1,000
(1962 prices)
All individuals.
Age:14-24 years25-64 years55-64 years65 years and over.
Sex:Male. . . ,Female-
Color:WhiteNonwhite.
Residence:FarmNonfarm..
Nonearners
11.0
1.13.52.34.2
4.36.8
9.51.5
.410.6
4.3
45
43
75
29
40192537
2134
2741
5028
49
NOTE.—Unrelated individuals are persons (other than inmates of institutions) who are not living withany relatives.
Sources: Department of Commerce and Council of Economic Advisers.
79
Digitized for FRASER http://fraser.stlouisfed.org/ Federal Reserve Bank of St. Louis
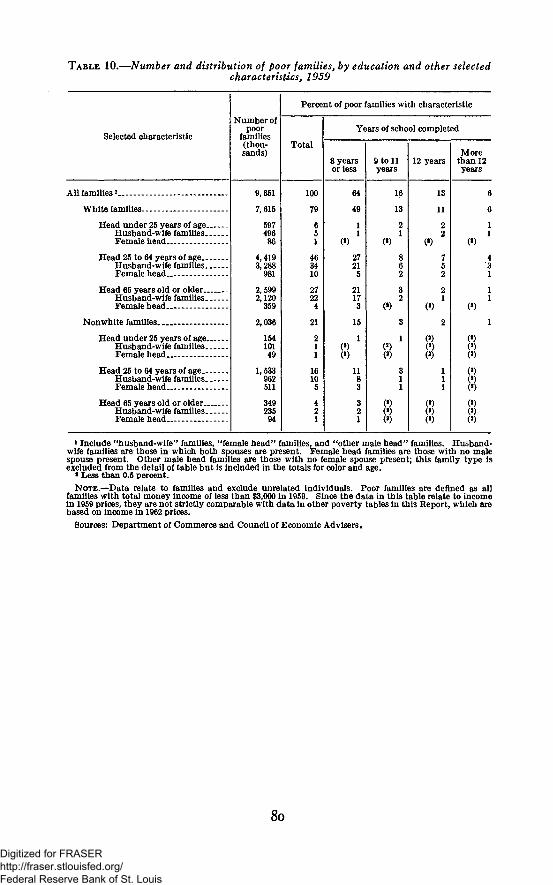
TABLE 10.—Number and distribution of poor families, by education and other selectedcharacteristics, 1959
Selected characteristic
Allfamiliesi
White families
Head under 25 years of ageHusband-w ife familiesFemale head
Head 25 to 64 years of ageHusband-wife familiesFemale head
Head 65 years old or olderHusband-wife familiesFemale head
Nonwhite families
Head under 25 years of ageHusband-wife familiesFemale head
Head 25 to 64 years of age.Husband-wife familiesFemale head
Head 65 years old or olderHusband-wife familiesFemale head
Number ofpoor
families(thou-sands)
9,651
7,615
59749686
4,4193,288
981
2,5992,120
359
2,036
15410149
1,533962511
34923594
Percent of poor families with characteristic
Total
100
79
651
463410
27224
21
211
16105
421
Years of school completed
8 yearsor less
64
49
1
(2) *
27215
21173
15
1183
321
9 to 11years
16
13
2
(>) *
862
32
3
1
311
$
12 years
13
11
22
752
21
(2)
2
(2)
111
(2)(2)(2)
Morethan 12years
6
6
1
(2)
431
11
1
(2)
(2)
i Include "husband-wife" families, "female head" families, and "other male head" families. Husband-wife families are those in which both spouses are present. Female head families are those with no malespouse present. Other male head families are those with no female spouse present; this family type isexcluded from the detail of table but is included in the totals for color and age.
3 Less than 0.5 percent.
NOTE.—Data relate to families and exclude unrelated individuals. Poor families are defined as allfamilies with total money income of less than $3,000 in 1959. Since the data in this table relate to incomein 1959 prices, they are not strictly comparable with data in other poverty tables in this Report, which arebased on income in 1962 prices.
Sources: Department of Commerce and Council of Economic Advisers.
8o
Digitized for FRASER http://fraser.stlouisfed.org/ Federal Reserve Bank of St. Louis
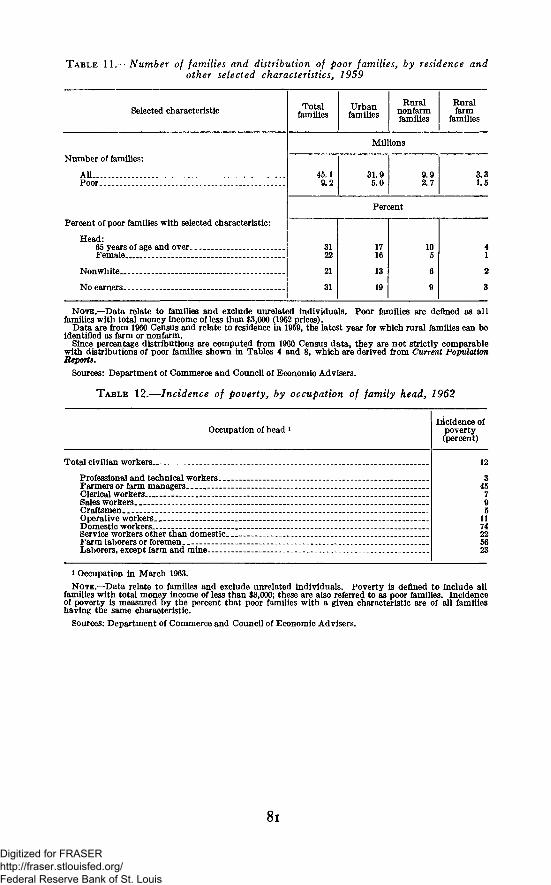
TABLE 11.—Number of families and distribution of poor families, by residence andother selected characteristics, 1959
Selected characteristic
Number of families:
All . . . . . .Poor
Percent of poor families with selected characteristic:
Head:65 years of age and over. . _Female _
Nonwhite .
No earners
Totalfamilies
Urbanfamilies
Ruralnonfarmfamilies
Ruralfarm
families
Millions
45.19.2
31.95.0
9.92.7
3.31.5
Percent
3122
21
31
1716
13
19
105
6
9
41
2
3
NOTE.—Data relate to families and exclude unrelated Individuals. Poor families are defined as allfamilies with total money income of less than $3,000 (1962 prices).
Data are from 1960 Census and relate to residence in 1959, the latest year for which rural families can beidentified as farm or nonfarm.
Since percentage distributions are computed from 1960 Census data, they are not strictly comparablewith distributions of poor families shown in Tables 4 and 8, which are derived from Current PopulationReports.
Sources: Department of Commerce and Council of Economic Advisers.
TABLE 12.—Incidence of poverty, by occupation of family head, 1962
Occupation of head iIncidence of
poverty(percent)
Total civilian workers -
Professional and technical workers..Farmers or farm managersClerical workersSales workersCraftsmen -Operative workers. _-Domestic workersService workers other than domestic.Farm laborers or foremenLaborers, except farm and mine
12
345795
1174225623
i Occupation in March 1963.
NOTE.—Data relate to families and exclude unrelated individuals. Poverty is defined to include allfamilies with total money income of less than $3,000; these are also referred to as poor families. Incidenceof poverty is measured by the percent that poor families with a given characteristic are of all familieshaving the same characteristic.
Sources: Department of Commerce and Council of Economic Advisers.
8i
Digitized for FRASER http://fraser.stlouisfed.org/ Federal Reserve Bank of St. Louis
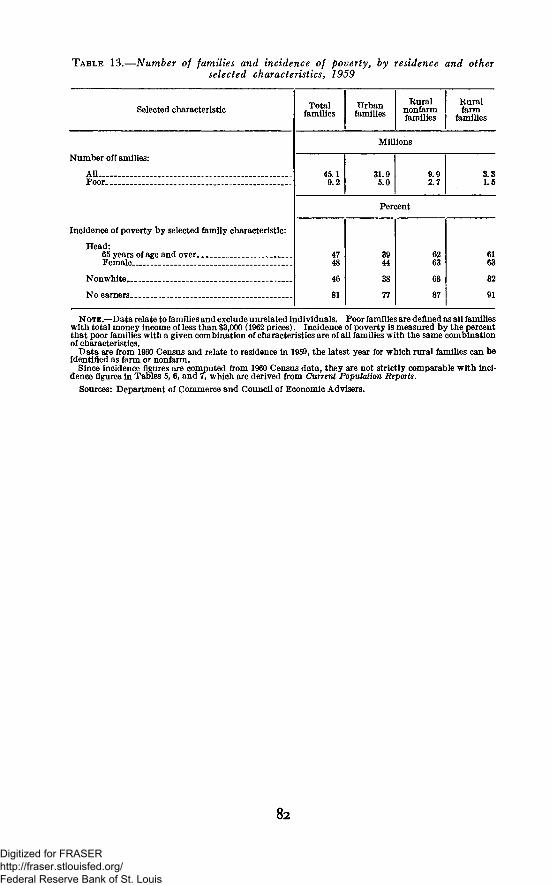
TABLE 13.—Number of families and incidence of poverty, by residence and otherselected characteristics, 1959
Selected characteristic
Number off amilies:
All. _.Poor
Incidence of poverty by selected family characteristic:
Head:65 years of age and overFemale
Nonwhite,
No earners _. __
Totalfamilies
Urbanfamilies
Ruralnonfarmfamilies
Ruralfarm
families
Millions
45.19.2
31.95.0
9.92.7
3.31.5
Percent
4748
46
81
3944
38
77
6263
68
87
6163
82
91
NOTE.—Data relate to families and exclude unrelated individuals. Poor families are denned as all familieswith total money income of less than $3,000 (1962 prices). Incidence of poverty is measured by the percentthat poor families with a given combination of characteristics are of all families with the same combinationof characteristics.
Data are from 1960 Census and relate to residence in 1959, the latest year for which rural families can beidentified as farm or nonfarm.
Since incidence figures are computed from 1960 Census data, they are not strictly comparable with inci-dence figures in Tables 5, 6, and 7, which are derived from Current Population Reports.
Sources: Department of Commerce and Council of Economic Advisers.
Digitized for FRASER http://fraser.stlouisfed.org/ Federal Reserve Bank of St. Louis
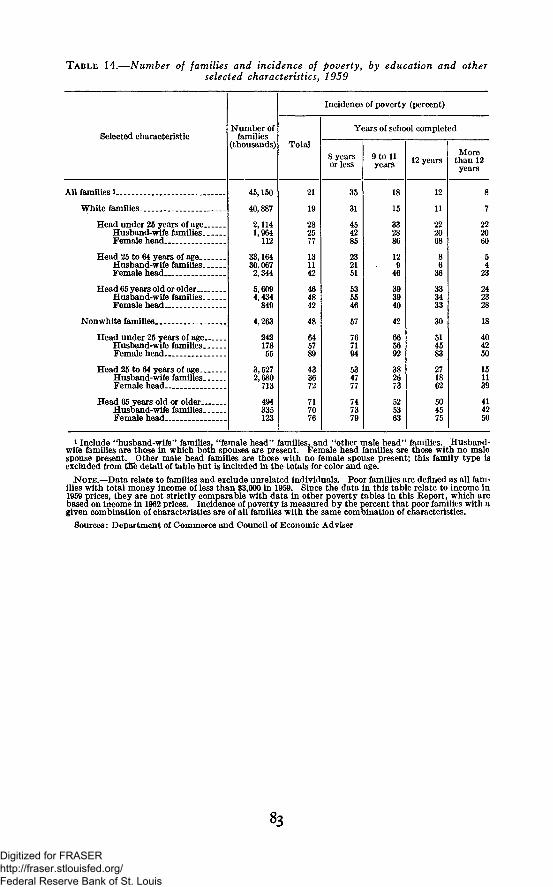
TABLE 14.—Number of families and incidence of poverty, by education and otherselected characteristics} 1959
Selected characteristic
All families i
White families
Head under 25 years of ageHusband-wife familiesFemale head___
Head 25 to 64 years of age __Husband-wife families _Female head
Head 65 years old or olderHusband-wife families _Female head___
Nonwhite families
Head under 25 years of ageHusband-wife families"Fp/malfi hflad
Head 25 to 64 years of ageHusband-wife familiesFemale head. .
Head 65 years old or older _Husband-wife familiesFemale head
Number offamilies
(thousands)
45,150
40,887
2,1141,964
112
33,16430,0672,344
5,6094,434
849
4,263
24217855
3,5272,680
713
494335123
Incidence of poverty (percent)
Total
21
19
282577
131142
464842
48
645789
433672
717076
Years of school completed
8 yearsor less
35
31
454285
232151
535546
57
767194
534777
747379
9 to 11years
18
15
332886
129
46
393940
42
665692
382673
525363
12 years
12
11
222068
86
36
333433
30
514583
271862
504575
Morethan 12years
8
7
222060
54
23
242328
18
404250
151139
414250
1 Include "husband-wife" families, "female head" families, and "other male head" families. HusbaDd-wife families are those in which both spouses are present. Female head families are those with no malespouse present. Other male head families are those with no female spouse present; this family type isexcluded from tne detail of table but is included in the totals for color and age.
.NOTE.—Data relate to families and exclude unrelated individuals. Poor families are defined as all fam-ilies with total money income of less than $3,000 in 1959. Since the data in this table relate to income in1959 prices, they are not strictly comparable with data in other poverty tables in this Report, which arebased on income in 1962 prices. Incidence of poverty is measured by the percent that poor families with agiven combination of characteristics are of all families with the same combination of characteristics.
Sources: Department of Commerce and Council of Economic Adviser
Digitized for FRASER http://fraser.stlouisfed.org/ Federal Reserve Bank of St. Louis
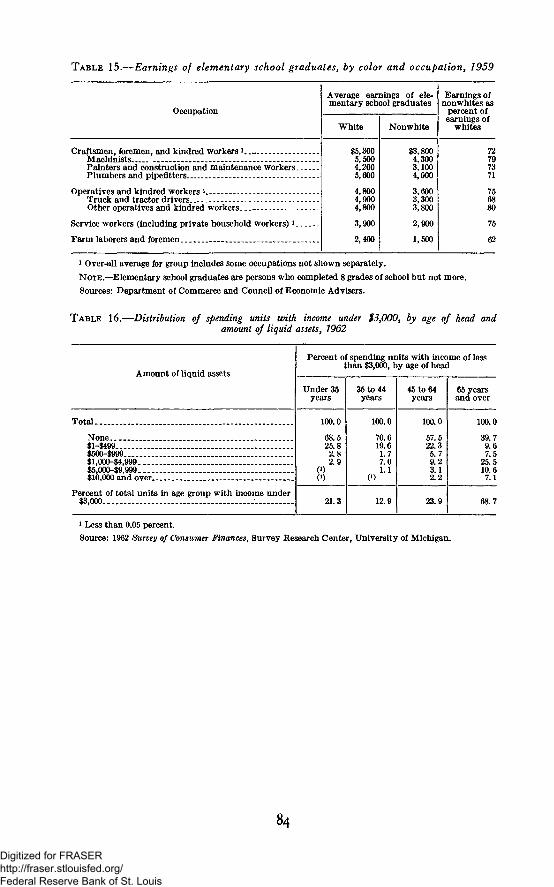
TABLE 15.—Earnings of elementary school graduates, by color and occupation, 1959
Occupation
Average earnings of ele-mentary school graduates
White Nonwhite
Earnings ofnonwhites as
percent ofearnings of
whites
Craftsmen, foremen, and kindred workers1.—Machinists _Painters and construction and maintenance workersPlumbers and pipefitters
Operatives and kindred workers iTruck and tractor drivers
Other operatives and kindred workers. _.
Service workers (including private household workers) i.
Farm laborers and foremen ._.
$5,3005,5004,2005,600
4,8004,9004,800
3,900
2,400
$3,8004,3003,1004,000
3,6003,3003,800
2,900
1,500
72797371
756880
75
62
1 Over-all average for group includes some occupations not shown separately.
NOTE.—Elementary school graduates are persons who completed 8 grades of school but not more.
Sources: Department of Commerce and Council of Economic Advisers.
T A B L E 16.—Distribution of spending units with income under $3,000, by age of head andamount of liquid assets, 1962
Amount of liquid assets
Total
None$l-$499$500-$999$l,000-$4,999$5,000-$9,999$10,000 and over _
Percent of total units in age group with income under$3,000
Percent of spending units with income of lessthan $3,000, by age of head
Under 35years
100.0
68.525.82.82.9
(0(0
21.3
35 to 44years
100.0
70.619.61.77.01.1
(0
12.9
45 to 64years
100.0
57.522.35.79.23.12.2
23.9
65 yearsand over
100.0
39.79.67.5
25.510.67.1
68.7
i Less than 0.05 percent.
Source: 1962 Survey of Consumer Finances, Survey Eesearch Center, University of Michigan.
84
Digitized for FRASER http://fraser.stlouisfed.org/ Federal Reserve Bank of St. Louis

Chapter 3
The Promise and Problems of TechnologicalChange
ONE LESSON of man's history is unmistakable: the crucial ele-ment in the rise in our material well-being has been the pro-
gressive utilization of our ever-growing store of knowledge of the worldin which we live. From the wheel to the electronic computer, newdiscoveries have been put to work for man's benefit—benefit that hastaken the form of shorter hours of work, the elimination of backbreaking toil,a continuing stream of new goods and services, and a total output per capitathat has risen 5-fold in the United States since the Civil War.
While technological change is as old as man, its character and pace, andtherefore its impact, have changed in recent centuries. The modern eco-nomic history of the industrial nations constitutes a decisive break with allof prior history. For thousands of years, a man followed the path of hisfather and grandfather before him, doing the same things in essentially thesame way. Major technological changes came infrequently, and theiradoption was spread over many centuries. The whole structure ofmodern society, however, is geared to innovations—those who initiateor adapt to change are rewarded, those who do not or cannot arepenalized. The businessman who refuses to adopt new technology willnot merely see his profits stand still; they will surely dwindle and turninto losses as his more adventuresome competitor adopts newer andmore efficient production techniques.
Moreover, in a modern society, technological change is self-reinforcingand almost self-generating. Major new breakthroughs in technology soonpave the way for a multitude of other changes. The production ofcheap electricity for example, not only replaced gaslights, but made pos-sible the assembly line, modern communications, and the computer.
Even if we wished to, we could not eliminate pervasive and continuoustechnological and economic change without remaking—on a muchinferior basis—the whole fabric of our social and economic institutions.And we would not wish to. Its benefits are essential for continued economicgrowth, higher standards of living, and the elimination of poverty. Ourobjective should be to foster and encourage it.
But recognition of the many benefits of technological change must not ob-scure the human toll often exacted in this process of job transition—the un-
85
Digitized for FRASER http://fraser.stlouisfed.org/ Federal Reserve Bank of St. Louis

employed coal miners of West Virginia, the rural migrants who crowd urbanslums, the older workers forced into unwanted retirement, and the middle-aged workers whose earnings power and entitlement to fringe benefits havebeen eroded by the obsolescence of their skills and the loss of their seniority.We can and should reduce that toll by appropriate public and privatepolicies.
This chapter will explore some issues and policies related to techno-logical change in this country's economy. Some of these issues haverecently been the subject of considerable public attention. There hasbeen dispute whether the newest and most dramatic form of technicalchange, "automation," is a monster that threatens to destroy our wholeeconomic order or an economic and social boon. Others debate whetherautomation must share the blame for the persistence for six years of anunacceptably high rate of unemployment. President Kennedy pro-posed—and President Johnson has repeated the proposal—that a high-level Commission on Automation be created to explore carefully theseand other questions.
This chapter first points to the benefits of technological change, boththose easily measurable and others less so but perhaps equally impor-tant. It then turns to a brief review of the sources of such change.It analyzes the extent to which rapid technological change maythreaten the maintenance of high over-all employment and the way inwhich our system adjusts to the unequal impacts of technological change onregions, industries, and skills. Finally, it reviews the policies that Govern-ment can use to foster rapid technological change while at the same timehelping workers to adapt to the resulting dislocations.
THE FRUITS OF ADVANCING TECHNOLOGY
The state of technological knowledge determines what man can do withhis labor, his capital, and the natural resources he finds—what canbe produced and how it can be produced. Increases in our standard of liv-ing—"economic progress"—come about in considerable part from the ap-plication of new technical knowledge to production.
THE NATURE OF TECHNOLOGICAL CHANGE
By technological change we mean the introduction of new arrangementsin the process of production and distribution which enable us either toproduce new products, or to produce existing products more efficiently andcheaply, employing fewer real resources. The basic characteristic of tech-nological change is that it permits us to use a given set of resources in away that better satisfies human wants. It includes not only narrowlytechnical changes but also the application of new organizational and mana-gerial concepts.
86
Digitized for FRASER http://fraser.stlouisfed.org/ Federal Reserve Bank of St. Louis
It is useful, if imprecise, to distinguish between technological changes thatreduce the cost of turning out already existing private and public consump-tion goods, and those that create completely new or substantially improvedproducts which enlarge the menu of final goods. Television, penicillin, ny-lon, and the airplane are examples of technological change that producedgoods not previously available. Color television, the electric typewriter,and the automobile with automatic transmission represent substantial qual-ity improvements. The Bessemer process for making steel, the catalyticrefining of oil, the mechanical picking of cotton, and the automation ofbookkeeping are examples of advances enabling industries to produce morecheaply goods or services that were already produced. Yet each of theexamples of new products might also be said to be merely better or cheaperways of producing already existing services—television as a substitute forthe radio or motion picture in communication, penicillin for sulfa drugs andhospital care in the treatment of pneumonia, nylon for cotton in tires or forsilk in blouses, the airplane for the automobile or the ship in transportingpersons or goods.
Technological change is only one of several major elements thatcontribute to economic growth. Others include:
1. Increases in the available quantity of the basic resources used in pro-duction—growth of the labor force and accumulation of capital.
2. Improvements in the quality of labor as a result of the better health,education, training, or motivation of members of the labor force.
3. Reductions in cost resulting from expansion in the size of markets—described by economists as economies of scale.
An increased stock of physical capital, embodied in buildings, machineryand equipment, land improvements, mines, stocks in trade, and so on, is oneof the more important of these sources. And, since the stock of capital hasincreased considerably faster than the number of workers, each worker nowcommands a larger complement of inanimate productive resources. But ithas been possible to employ this rising amount of capital per worker pri-marily through the progress of technology. Equipping a worker with asturdier or larger shovel does not necessarily raise his output very much.But the invention of a ditch-digging machine or bulldozer allows eachworker to use a great deal more capital and thereby to increase his outputenormously. Because the added output is the joint product of technologicalchange and an added use of capital, it is impossible fully to separate theircontributions.
The same close interrelationship with technological change exists inconnection with other sources of expanded output. The improvededucation and skill of workers often require technical rearrangements ofproduction to make them effective. The availability of a larger supply oftrained mathematicians will not significantly improve the productivity ofan accounting department based on pencil and paper technology. But amathematician, developing programs for a computer, may cut the cost of
87
Digitized for FRASER http://fraser.stlouisfed.org/ Federal Reserve Bank of St. Louis
accounting in half. Many of the economies of mass production associatedwith wider markets have been possible only because technological inno-vations—for example, the assembly line—opened up new possibilities fororganizing the production process on a larger scale.
A fixed quantity of available land, together with a continually depletedstock of fuel and mineral resources might well have inhibited economicgrowth and rising living standards for an exploding population. Yet in theWest, at least, technological change has fully overcome "diminishingreturns," as proved by the fact that prices of food and minerals are, ingeneral, no higher relative to other prices today than they were 100years ago.
THE GROWTH OF OUTPUT AND INCOMES
The most inclusive measure of the gains from technological improve-ment is the enlargement of total incomes. Technological advance is amajor source of higher output; and in the broadest sense higher output andhigher incomes are synonomous.
Since the turn of the century, the Nation's real total output—measuredas GNP in 1963 prices—has risen by 760 percent, from $68 billion in1900 to $585 billion in 1963. This represents an annual growth rate aver-aging 3 / 2 percent for the whole period. With the population rising from76.1 million to 189.3 million over this period, real output per personclimbed from $890 at the start of the century to $3,091 last year. Althoughmany benefits are not captured in GNP measurements, this is perhaps thesingle best summary index of the increased material well-being of theAmerican people.
An alternative measure of our gains is private consumption per capita,which reflects rising living standards. But it is an incomplete measure,even of living standards, because it omits the growing public servicesprovided by all levels of government. Since 1929, the earliest date forwhich this measure is available, real private consumption per capita hasrisen by 66 percent, while total output per capita has risen by 76 percent.
Rising total output, as noted earlier, is the joint product of: a risinginput of labor; a larger input of physical capital; and the increased pro-ductive efficiency of these inputs—as a combined result of improvementsin the quality of labor, advances in technology, and economies of scale.A simpler approach divides the total output gain into two parts: a risinginput of labor, measured in total man-hours worked; and an increasedaverage output per hour of work—which reflects both the rise in capitalinput and the increase in productive efficiency. Output in the privateeconomy in 1963 was 720 percent of 1900. This is the product of: (1) totalman-hours worked in 1963 equal to 180 percent of 1900; times (2) anoutput per man-hour in 1963 equal to 400 percent of 1900.
88
Digitized for FRASER http://fraser.stlouisfed.org/ Federal Reserve Bank of St. Louis
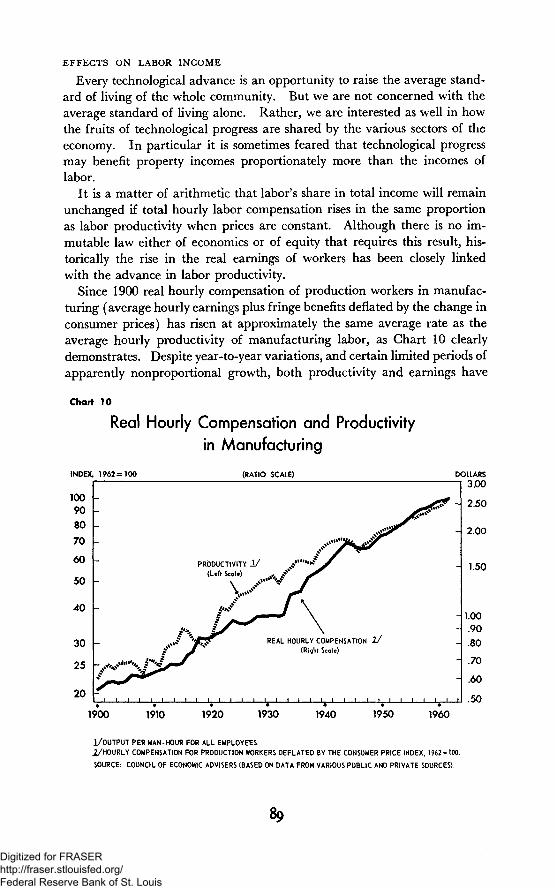
EFFECTS ON LABOR INCOME
Every technological advance is an opportunity to raise the average stand-ard of living of the whole community. But we are not concerned with theaverage standard of living alone. Rather, we are interested as well in howthe fruits of technological progress are shared by the various sectors of theeconomy. In particular it is sometimes feared that technological progressmay benefit property incomes proportionately more than the incomes oflabor.
It is a matter of arithmetic that labor's share in total income will remainunchanged if total hourly labor compensation rises in the same proportionas labor productivity when prices are constant. Although there is no im-mutable law either of economics or of equity that requires this result, his-torically the rise in the real earnings of workers has been closely linkedwith the advance in labor productivity.
Since 1900 real hourly compensation of production workers in manufac-turing (average hourly earnings plus fringe benefits deflated by the change inconsumer prices) has risen at approximately the same average rate as theaverage hourly productivity of manufacturing labor, as Chart 10 clearlydemonstrates. Despite year-to-year variations, and certain limited periods ofapparently nonproportional growth, both productivity and earnings have
Chart 10
Real Hourly Compensation and Productivity
in Manufacturing
INDEX,
10090
80
70
60
50
40
30
25
20
1962 = 100
_
-
-
-
-
-
(RATIO SCALE) DC
^T -
PRODUCTIVITY 1/ ^"«#^f
(Left Scale) ^ % t ^ S^
_£r-J\ :'OJ%? REAL HOURLY COMPENSATION 1/f S (Right Scale)
DOLLARS
3.00
2.50
2.00
- 1.50
1.00
.90
.80
.70
.60
.50
1900 1910 1920 1930 1940 1950 1960
I/OUTPUT PER MAN-HOUR FOR ALL EMPLOYEES.
I/HOURLY COMPENSATION FOR PRODUCTION WORKERS DEFLATED BY THE CONSUMER PRICE INDEX, 1962 = 100.
SOURCE: COUNCIL OF ECONOMIC ADVISERS (BASED ON DATA FROM VARIOUS PUBLIC AND PRIVATE SOURCES).
Digitized for FRASER http://fraser.stlouisfed.org/ Federal Reserve Bank of St. Louis
risen strongly and consistently, and their movement has been essentiallyparallel.
THE OPPORTUNITY FOR LEISURE
One of the most important choices that technological improvement permitsis that between increased output, incomes, and consumption, on the onehand, and increased leisure on the other. The growth in output percapita cited earlier underestimates the improvement in the well-being of thepopulation to the extent that workers have voluntarily chosen to take someof the potential rise in their incomes in the form of shorter hours, longervacations, or later entry into, or earlier retirement from, the labor force.When workers voluntarily choose to reduce their working time—preferringan extra hour of leisure to its equivalent in income—these extra hours ofleisure might properly be given a monetary value equal to the incomesforegone.
It is estimated that average annual hours per employee were reduced byabout 25 percent between 1909 and 1963. In manufacturing, where meas-ures are best, the average workweek of production workers fell from 51 hoursin 1909 to 40.4 hours last year. Moreover, the average number of daysworked in a year has declined substantially, through longer vacations andmore frequent holidays. Between 1900 and 1960 male life expectancy atbirth rose by 19 years. But the expected number of male working yearsrose by only 9, primarily because of typically earlier retirement from, andlater entry into, the work force.
Not only average annual hours per worker, but also average annual hoursworked per member of the total population have declined appreciablysince 1900. As a result output per capita rose by 250 percent, a consid-erably smaller increase than the 350 percent rise in output per man-hour.
On the whole, the discipline of modern production permits neither theindividual worker nor, except very crudely, workers as a group to weigh andto choose freely the precise combination of income and leisure that best suitstheir preferences. Nevertheless, we may expect that over the longer run,some further reduction is likely to occur in hours worked and that this will,in a general way, reflect an increasing preference for leisure over income asfurther increases in potential income occur at the existing level of hours.
SOME NONMEASURABLE GAINS
Even if we adjust for potential gains taken in the form of leisure, the in-crease in measured output per capita fails to account for a wide range of real,but unmeasurable benefits of technical progress. We have no satisfactoryway of measuring the additional output value incorporated in completelynew products, and our methods of measurement probably often undervaluethe contribution to real incomes of improvements in the quality of existingproducts.
For example, can anyone measure how much better off people are as a
Digitized for FRASER http://fraser.stlouisfed.org/ Federal Reserve Bank of St. Louis
result of telephone communication? The benefit is surely not measured bycomparing the cost of messages delivered by mail and messages spoken alonga wire. Nylon is not only cheaper than silk, it is more durable, easier tocare for, more resistant to stains. The benefit of transoceanic air travel isnot measured solely by the reduction of cost relative to sea travel—thesaving of travel time permits many persons to visit Europe or the Far Eastwho would never otherwise be able to do so. Examples abound in the areaof medical care. How do we measure the benefit of a vaccine that prac-tically eliminates smallpox or polio—a medicine that conquers tuberculosisor pneumonia—scientific discoveries that permit us to attack mentalretardation?
Technological change has permitted everyone to share experiences pre-viously, by their very nature, limited to a few—to attend a World Seriesgame, a class taught by a great teacher, a recital by Pablo Casals.
Moreover, no measure of gross national product attempts to take accountof the reduced human costs of producing it. A job on an assembly linemay be dull; but it is a vast improvement over the backbreaking drudgeryof many jobs a century earlier. And if one complains that our outputmeasures fail to take account of the pollution of urban air and water, itmust be noted that they also fail to take account of the fact that inexpen-sive automobile transportation permits city dwellers to escape to the oceanbeaches, the mountains, the areas of forest wilderness.
Thus technological advance and the rising productivity associated withit have many human payoffs: higher incomes and consumption, longerlife, reduced suffering and illness, reduced drudgery, greater leisure, andan improved quality of life that cannot be measured in income statistics.Philosophers may debate whether all this contributes to human happinessor the edification of the soul. Ordinary men—those who have not yet en-joyed the fruits of technological advance, those who have tasted them, andthose grown accustomed to the diet—all pursue them with fervor un-diminished by the philosophers5 doubts.
AMERICA'S ROLE IN THE WORLD
America's position of free world leadership carries heavy responsibilities—for our own defense and that of our allies, and for assistance to the newlyawakened nations of Latin America, Africa, and Asia. These burdens arenot easy. But continued rapid technological advance can permit themto be borne with minimum strain.
The burden of maintaining our defense and aid programs is not onlythat of producing the value of output that we wish to devote to thesepurposes. In a world of fixed exchange rates and free convertibility ofcurrencies into each other and of the dollar into gold, it is also a problemof our balance of payments.
Continued rapid technological advance can help in three ways. First,by contributing to a rise in productivity, it can permit us to hold our pricelevel steady in the face of rising wage rates. Combined with some tendency
91
715-113 O-64-7Digitized for FRASER http://fraser.stlouisfed.org/ Federal Reserve Bank of St. Louis
for prices to rise in other industrial countries, this will permit us to competemore effectively in world trade. Second, the higher rates of profit thatarise from investments exploiting new technological advances will reducethe outflow of capital and attract it from abroad. Third, and perhapsmost important, the continued development of new products is one of thesurest roads to export expansion. Within a few years after the introduc-tion of almost any new product in today's world, a dozen nations will be ableto compete with us in its production. To maintain or expand our shareof world exports we must continually be in the vanguard of product devel-opment. This requires continuous innovation, increasing technologicaldevelopment, and the most rapid possible exploitation of the new oppor-tunities that emerge from scientific advance.
Thus, rapid technological change needs to be fostered not alone for itseffects on the growth of our internal comfort and well-being. It is also anurgent necessity for the solution of our international economic problems. Itis the answer to those who say that America must choose between twosets of irreconcilable objectives—domestic prosperity and international pay-ments equilibrium. Combined with the responsible price and wage makingdiscussed in Chapter 4 of this Report, rapid technological gains can permitus to reconcile policies for high employment and growing incomes domesti-cally with our objective of achieving equilibrium in our international pay-ments. It is truly the "great reconciler."
SOURCES OF TECHNOLOGICAL PROGRESS
Technical change occurs in several ways. In its most distinctive andeasily identified form, it is a process that begins with an advance in basicscientific knowledge. Such an advance may then lead—often after yearsor even decades—to the application of the new scientific knowledge toa "practical" problem: the "invention" of a way to produce an existinggood or service in a more efficient (i.e., less costly) way or the productionof a new good or service.
INVENTION AND INNOVATION
Today the process of invention has been increasingly organized andsystematized, and we now identify "R&D" (research and development)as a major activity in our economy. Nonetheless, it must be recognizedthat significant inventions are often still the product of the individualworking alone, sometimes with little formal scientific training. And someof the principal breakthroughs in pure science—particularly, the develop-ment of new theoretical concepts—are often still the product of individualscholars.
The final step in the process of technological advance comes after theapplication has been proved technically feasible and seems to promiseeconomic gain—when it is actually introduced and used. It is at this
92
Digitized for FRASER http://fraser.stlouisfed.org/ Federal Reserve Bank of St. Louis
point that technological change really occurs, a step identified as "innova-tion." It is important to emphasize that new knowledge and even itsapplication in a technically successful way has, by itself, no direct economicsignificance. Innovation is the key element in the process of technicalchange from the standpoint of economic progress. The innovator, whetherthe inventor himself, a small entrepreneur, the manager of a giant firm, ora government official, must make the decision to take the risks of intro-ducing a new and untried process, good, or service. The costs of using anew process or the acceptability of a new product are uncertain until testedon the production line or in the market place. And as cost and demandconditions change, inventions that previously had no chance of successfulapplication may become economically feasible.
Technological change can also come about without any conscious deci-sion to "innovate," but through the many minor changes that occur fromday to day as existing processes are used. It may also come about withlittle or no change in the physical circumstances of production. For ex-ample, the discovery that a furnace performs more effectively at a higheror lower temperature than previously supposed may be applied through onlythe adjustment of a valve.
INVESTMENT AND TECHNOLOGICAL CHANGE
But much technological change requires an alteration of the physicalapparatus of production. And where the innovation is of any significance,such an alteration will ordinarly require an act of investment—the modi-fication of existing apparatus, the installation of new machines or equipment,even, the construction of new buildings. This fact has several importantconsequences.
One such consequence is that the rate at which technological progresscan be incorporated in production is closely tied to the rate of gross in-vestment. Stepping up the rate of growth of the stock of plant andequipment accelerates the improvement in its quality and productivity.
A second consequence of the tie between technology and physical in-vestment is that normally new technology is not introduced all at once. Par-ticularly where the change represents a new process for accomplishing some:productive task, it will often pay business firms to introduce it only as theiiexisting facilities become less efficient with age, thus permitting the differ-ential efficiency of the new equipment to compensate for its additionalcapital cost. But even if the new equipment is so superior in its productivitythat it would pay to scrap the previous equipment immediately, productionof new equipment takes time. It would have been impossible to convert allrailroads from steam to diesel in one year, simply because the makers ofdiesel engines could not economically expand their production fast enough.
The physical investment lag—and a perhaps equally important informa-tion lag—mean that it often takes years, sometimes decades, for newtechnology to spread throughout an industry or an economy. The in-
93
Digitized for FRASER http://fraser.stlouisfed.org/ Federal Reserve Bank of St. Louis
troduction of automation is a case in point. In many applications,automated facilities—which control productive processes through servo-mechanical ("feed-back") devices—accomplish dramatic savings in directlabor. As with previous major technological changes, one can expect thisinnovation to be applied to an increasing number of activities. But merelybecause automation is technically feasible in many applications, it is notnecessarily economically feasible, even though it may greatly reduce directlabor costs. Higher capital costs, lack of flexibility, and the necessity forlarge runs make automation noneconomic in thousands of applicationswhere it is technically feasible. Moreover, even where it is economicallyadvantageous eventually to substitute automated for nonautomated equip-ment, its introduction may well be delayed until the relative cost ofoperating the older equipment increases substantially. In a previous gen-eration, electric power did not displace the steam engine overnight, nordid the steam engine in its time take over from the waterwheel overnight.Only a small fraction of the ultimate benefits of automation have yet beenrealized.
TECHNOLOGICAL CHANGE AND AGGREGATE DEMAND
Like all previous technological change, automation creates the neces-sity for many workers to change jobs during their lifetimes and for sonsto find different work from that of their fathers. The problem created bythese labor market adjustments is discussed in a later part of this chapter,together with the policies that can lubricate such adjustments and easetheir human toll.
THE EXPANSION OF DEMAND
Quite apart from these adjustment problems many are convinced thatrecent and current technological change is somehow different in its employ-ment effects from all previous changes. This conviction rests upon one orboth of the following propositions: (1) that our productive powers are nowoutstripping our wants and needs and ability to buy our own output, andthus our economy's ability to create new jobs; and (2) that technologicalchange is now destroying jobs at a much faster rate than ever before.
If the Nation's ability and eagerness to buy output can and does keeppace with its ability to produce, a speeded-up pace of technological advancemeans that standards of living and economic security can rise more rapidlythan ever. In this case, faster progress of productivity is to be sought andwelcomed. Only if demand cannot keep pace (or if the required adjust-ments cannot readily be accommodated) is there a basis for fearing morerapid technological change.
Historically, there is surely no evidence of any inability of demand torise along with productive capacity, or of any permanent inadequacy oftotal job opportunities. Rather, our technologically progressive economyhas brought higher output and incomes, and more and better consumption
94
Digitized for FRASER http://fraser.stlouisfed.org/ Federal Reserve Bank of St. Louis
and investment, along with the voluntary decision to take some of thefruits of progress in the form of leisure. Since 1929, for instance, outputper worker has almost doubled. If total demand had not grown since1929, and if we were still producing the 1929 level of output, using presentmethods of production and the present shorter workweek, it would take just26 million workers to do it. This would leave two-thirds of our presentlabor force unemployed. Instead, the demand for output is almost threetimes as high, and employment is 50 percent higher than in 1929. If totaldemand had grown since 1929 only as fast as population, 46 percent of ourlabor force would now be unemployed as a result of the higherproductivity.
Clearly, the increase in total demand for our potential output is the factorthat has reconciled advancing technology with rising employment.
And it should continue to do so far into the future. Despite dramaticincreases in average family income, American consumers have continued tospend a remarkably constant proportion of their disposable income on con-sumer goods and services. And a very large proportion of our familiesstill earn very modest incomes. Millions of families live in actual poverty,as the preceding chapter has shown, and half of American families in 1963had incomes below $6,200. If median family income increased at the samerate in the next 17 years as it has since 1947, half of American families in1980 would still have incomes below $9,300 in today's prices. Today, evenfamilies at twice that level have no trouble finding ways to spend extraincome. There is surely no reason to believe that any plausible rate oftechnical progress could lead to consumer satiation in the lifetimes ofpersons now on earth.
Technological change permits any given level of output to be producedwith less labor and, in that sense, destroys jobs. But it also provides asignificant spur to investment and consumption and thus creates jobs. Tech-nological change makes existing capital equipment obsolete. New processesand products increase the profitability of investment and stimulate businessdemand for new machines, new equipment, and new buildings. Techno-logical change both generates high levels of investment and gives consumersnew purchasing incentives. Historically periods of rapid technologicalchange have generally been periods of high and rising employment.
There is, of course, no automatic mechanism which guarantees that actualdemand will grow each year at exactly the same rate as potential full-employ-ment output. An economy characterized by technological change andgrowth always faces the challenge of maintaining a growth in demandsufficient for full employment, but not so high as to lead to inflation.Fortunately, growing sophistication in the uses of economic policy, par-ticularly fiscal and monetary policy, make this goal more nearly attainablethan ever before.
These tools of economic policy are capable of righting the balancewhenever the job-destroying effects of technological progress outweighits job-creating effects. They will succeed in this task, however, only if
95Digitized for FRASER http://fraser.stlouisfed.org/ Federal Reserve Bank of St. Louis
they are adjusted to take account of changes in the rate of productivitygains, whether from an altered pace of technological advance or from othersources.
THE TREND OF LABOR PRODUCTIVITY
Some recent developments have been cited frequently to support thebelief that technological change is accelerating. In certain instances, auto-mation has greatly lifted output per man-hour and has revolutionized theproductive process. These instances are highly dramatic, but they areinsufficient for evaluating the over-all impact of technological progress.Such an evaluation must be based on a study of the trend in over-all pro-ductivity—output per man-hour—for the private economy.
The main difficulty in assessing the trend of productivity is that currentoutput per man-hour is also affected by numerous transitory factors, mostsignificantly by fluctuations in output and changes in the average age ofthe machinery in use. For example, during recessions employment fallsproportionately less than output as a result of lags in employer reaction,uncertainty about the future, the need to retain the same supervisory andmaintenance personnel over wide ranges of output, and hiring and firingcosts. Employed manpower is not fully utilized, and the level of outputper man-hour is depressed. This is usually followed by rapid rates of increasein labor productivity during the early phases of cyclical expansions (Chart 2).
Moreover, our statistical measures of productivity are far from exact.Productivity is a ratio of recorded output to recorded labor input, andrelatively small errors in measuring either the numerator or denominatorcan distort the pattern of change in productivity. Particularly in measuringproductivity for individual sectors of the economy, there are statistical prob-lems associated with the measurement of output change; and measures oflabor input are also a source of difficulty. (Currently there are two separateofficial series on employment and man-hours—one based primarily on payrolldata reported by business establishments and the other based on a monthlysurvey of households.) The Department of Commerce is now engaged inmajor revisions of output data, and the Bureau of Labor Statistics is plan-ning to.publish revised productivity indexes during 1964, based on therevised output data. Recorded changes in productivity for individual yearsand sectors must be viewed as a broad gauge—rather than a precise read-ing—of economic performance.
With these qualifications, productivity measurements for recent yearsare presented in Table 17, accompanied by some comparisons with longer-run trends. Labor input data are based on information collected primarilyfrom establishments. The table shows that productivity gains have beenhealthy but not unprecedentedly large during the past 3 years. Whileimprovement has varied among sectors, the average gain in each case hasbeen greater during the past 3 years than in the preceding decade, but lessthan the average of 1947-50.
Digitized for FRASER http://fraser.stlouisfed.org/ Federal Reserve Bank of St. Louis
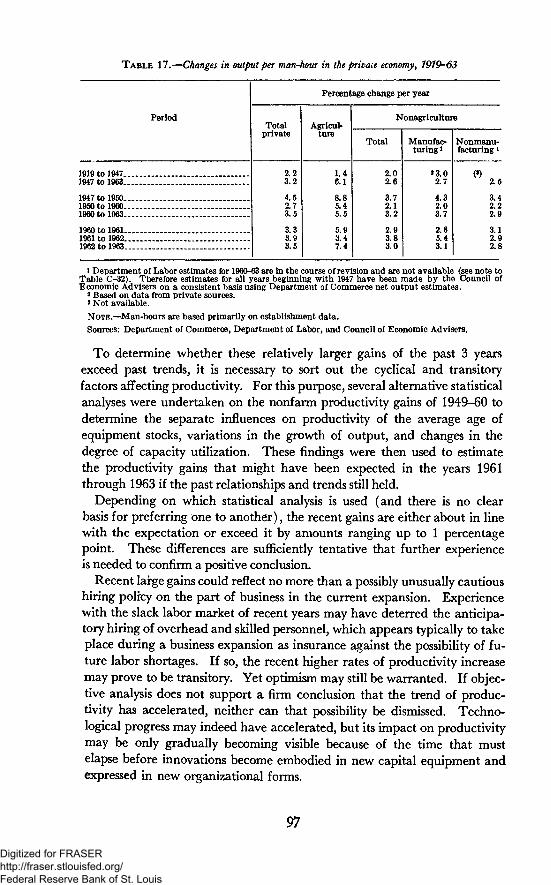
T A B L E 17.—Changes in output per man-hour in the private economy•, 1979-63
Period
1919 to 19471947 to 1963
1947 to 19501950 to 19601960 to 1963
1960 to 19611961 to 19621962 to 1963
Percentage change per year
Totalprivate
2.23.2
4.52.73.5
3.33.93.5
Agricul-ture
1.46.1
8.85.45.5
5.93.47.4
Nonagriculture
Total
2.02.6
3.72.13.2
2.93.83.0
Manufac-turing i
*3.02.7
4.32.03.7
2.65.43.1
Nonmanu-facturing *
(»)2.5
3.42.22.9
3.12.92.8
» Department of Labor estimates for 1960-63 are in the course of revision and are not available (see note toTable C-32). Therefore estimates for all years beginning with 1947 have been made by the Council ofEconomic Advisers on a consistent basis using Department of Commerce net output estimates.
2 Based on data from private sources.s Not available.
NOTE.—Man-hours are based primarily on establishment data.
Sources: Department of Commerce, Department of Labor, and Council of Economic Advisers.
To determine whether these relatively larger gains of the past 3 yearsexceed past trends, it is necessary to sort out the cyclical and transitoryfactors affecting productivity. For this purpose, several alternative statisticalanalyses were undertaken on the noinfarm productivity gains of 1949-60 todetermine the separate influences on productivity of the average age ofequipment stocks, variations in the growth of output, and changes in thedegree of capacity utilization. These findings were then used to estimatethe productivity gains that might have been expected in the years 1961through 1963 if the past relationships and trends still held.
Depending on which statistical analysis is used (and there is no clearbasis for preferring one to another), the recent gains are either about in linewith the expectation or exceed it by amounts ranging up to 1 percentagepoint. These differences are sufficiently tentative that further experienceis needed to confirm a positive conclusion.
Recent large gains could reflect no more than a possibly unusually cautioushiring policy on the part of business in the current expansion. Experiencewith the slack labor market of recent years may have deterred the anticipa-tory hiring of overhead and skilled personnel, which appears typically to takeplace during a business expansion as insurance against the possibility of fu-ture labor shortages. If so, the recent higher rates of productivity increasemay prove to be transitory. Yet optimism may still be warranted. If objec-tive analysis does not support a firm conclusion that the trend of produc-tivity has accelerated, neither can that possibility be dismissed. Techno-logical progress may indeed have accelerated, but its impact on productivitymay be only gradually becoming visible because of the time that mustelapse before innovations become embodied in new capital equipment andexpressed in new organizational forms.
97
Digitized for FRASER http://fraser.stlouisfed.org/ Federal Reserve Bank of St. Louis
ADJUSTMENT TO TECHNOLOGICAL CHANGE
The benefits to society from technological change are not costless. Forsome individual workers, businesses, and communities technological changebrings new opportunity: better jobs, higher profits, greater prosperity. Forothers it imposes burdens and even hardships. For technical change mayreduce the value of—or even make obsolete—particular labor skills, plantand equipment, or natural resources.
By and large our enterprise system works well in producing the shifts ofcapital and managerial resources from one activity to another that changedcircumstances—including technical progress—dictate. But unless the in-dividual worker who is displaced from his job by technological change findsother employment soon, both he and society lose.
Even when over-all employment opportunities are adequate, job securityfor the individual worker is never certain. Technological change has per-haps been the most perennially disruptive influence on job security; butchanges in consumer tastes and business organization, increased competi-tion, and decisions of public policy also frequently and unpredictably dis-rupt existing job patterns. And even in a strong labor market, it almostalways takes time for displaced workers to find new jobs.
The development of new processes directly alters the labor requirementsof particular firms and industries and of the whole economy. More indi-rectly, by raising real incomes and changing relative prices, technologicaladvance induces shifts in the industrial composition of output and employ-ment. A faster-than-average pace of technological change reduces costs ofproduction in the industry where it occurs and is ordinarily reflected eitherin a decline in the relative price, or in an improvement in the relativequality, of the products of that industry.
Sometimes the technologically induced lowering of price or raising ofquality leads to enough expansion of demand actually to increase employ-ment in the industry where the change occurs. Where technological changegives birth to an entire new industry, this is, of course, true. Automobilesin the 1920's and, more recently, airlines, office machinery, and electronicand communications equipment are clear cases of this sort. In other activi-ties, of which farming and coal mining are good examples, spectacular pro-ductivity advances have not led to equivalent increases in sales, and em-ployment has declined sharply.
If rates of technological advance were not too unequal among industriesand over-all growth is rapid, employment might still expand in some indus-tries without requiring layoffs in others. Normally, however, transitionalproblems arise, as the number of jobs in specific firms, industries, occupa-tions, or geographic areas declines more rapidly than the number of workersseeking to fill them, even after account is taken of retirements and voluntaryjob changes.
Digitized for FRASER http://fraser.stlouisfed.org/ Federal Reserve Bank of St. Louis
THE CHANGING DISTRIBUTION OF JOB REQUIREMENTS
In the past decade, jobs have been destroyed and created at very unequalrates in various regions, occupations, and industries.
Changing regional requirements are illustrated by the fact that nonagri-cultural employment actually declined between 1953 and 1963 in RhodeIsland, Pennsylvania, Michigan, and West Virginia, remained essentiallyunchanged in Maine and Ohio, and rose by 1.5 million (almost 40 percent)in California, 65 percent in Florida, 80 percent in Arizona, and 97 percentin Nevada. Even more striking disparities can be found among metro-politan areas.
Shifts in the occupational distribution of jobs have been equally dramatic.The number of farmers and farm workers declined by 2.8 million, or 40 per-cent, between 1950 and 1960. In more narrowly defined occupations, therewere employment declines of 25 percent among locomotive engineers andfiremen, 38 percent among textile weavers and spinners, 42 percent amongtelegraph operators, and 50 percent among fishermen. During this sameperiod, employment rose by 45 percent among professional nurses, 49 per-cent among teachers, and 60 percent among engineers and draftsmen.
Changes in the industrial composition of jobs were highlighted by thecontinued decline in the importance of goods-producing industries assources of employment. Total employment in manufacturing, mining, andconstruction declined by 2 percent between 1953 and 1963. In contrast,employment increased by 65 percent in State and local government, 41percent in services, 33 percent in finance, and J6 percent in trade.
Automation is often regarded as having a qualitatively different effecton worker displacement than did earlier forms of technological change.Specifically, it is suggested that automation requires a higher average levelof education or skills than did earlier forms of technology, and that thiscomplicates the adjustment process for displaced blue-collar workers whoseold skills have been rendered obsolete while lack of adequate educationalbackground disqualifies them from filling the new jobs created byautomation.
However, the current changes in skill requirements appear to continuea long evolutionary process. Professional and technical workers and crafts-men, for instance, accounted for about 15 percent of the work force in1900, 23 percent in 1950, and 26 percent in 1960. In contrast, unskilledfarm and nonfarm workers accounted for 30 percent of the labor force in1900, 11 percent in 1950, and only 8 percent in 1960. It is not clear whetherautomation has caused any acceleration in these trends. Further studiesare needed, to which the proposed Commission on Automation shouldcontribute.
Whatever the exact pace and cause, it is clear that the proportion of jobscalling for the exercise of considerable responsibility and for a substantialeducational background is rising.
99
Digitized for FRASER http://fraser.stlouisfed.org/ Federal Reserve Bank of St. Louis
THE ADJ USTMENT PROCESS
With the dramatic changes we have experienced in recent decades inthe distribution of available job openings and in the nature of job require-ments, it is remarkable that labor market adjustment takes place as ef-ficiently as it does. But American workers are highly mobile.
Although many workers, particularly older ones, are reluctant to severlocal ties, even when they become unemployed, there is nevertheless an im-pressive degree of geographical mobility. On the average, during eachyear of the past decade over 6 percent of the civilian population moved itsresidence across county lines, and 3 percent across State lines. During pros-perous periods, the rates of mobility out of labor surplus areas are con-siderably higher. Today only 55 percent of all persons aged 25 and overstill live in the State of their birth. Rapidly growing areas have managedto attract large numbers of workers from sections of the country where thenatural population increase has exceeded the expansion of job opportunities.The net in-migration rate between 1950 and 1960 was over 50 percent inFlorida and Nevada, and between 20 and 45 percent in Arizona, Alaska,California, and Delaware. In contrast, the net out-migration rate was 20percent or higher from such States as Arkansas, West Virginia, andMississippi.
During 1961 some 8.1 million workers changed jobs, including about2.6 million who changed voluntarily in order to improve their economicstatus. Mobility declines rapidly with age; still, almost 6 percent of men45-64 years old changed jobs in 1961. Fifty-six percent of all job changesinvolved a shift between major industry groups, and 47 percent betweenmajor occupation groups.
The extensive training and retraining programs conducted by many,though not by enough, private employers contribute significantly to theoccupational flexibility of the work force. In 1962, establishments ac-counting for almost 50 percent of private nonfarm employment had sometype of training program and were providing training for 15 percent oftheir employees. The natural turnover in the labor force also contributesto this flexibility. An average of 1,275,000 older persons will die or retireduring each year of the current decade, while an average of 425,000 womenwill leave for family reasons. At the same time an average of 2.6 millionyoung persons will enter the labor market each year, so that by 1970, 30percent of the labor force will consist of persons who were not in thejob market in 1960. This substantial inflow of new workers can providea supply of relatively well educated and mobile labor for expandingactivities.
Indeed, improved education has been the primary factor permitting therapid adjustment of the labor supply to the demands of changing tech-nology. The average educational attainment of new workers currentlyentering the labor force is about 40 percent higher than that of thosecurrently retiring. Just since the beginning of World War II the median
100
Digitized for FRASER http://fraser.stlouisfed.org/ Federal Reserve Bank of St. Louis
level of education among the entire adult male labor force aged 18-64 hasrisen by more than 50 percent. The proportion of the labor force withan 8th grade education or less declined from 36 percent in 1952 to 26 per-cent in 1962. In contrast, the proportion who were college graduates rosefrom 8 to 11 percent. And this educational upgrading will certainly con-tinue. More than 1 million persons are expected to graduate from collegein 1964 and 1965, and an additional 220,000 persons will receive advanceddegrees. The total number of degree recipients will be 70 percent greaterthan a decade earlier. Unsatisfied as we are, and rightfully so, with oureducational accomplishments, it is clear that rising levels of education havebeen the major force permitting the rapid—and on the whole successful—adjustment of the work force to changing occupational requirements.
DEFECTS OF THE ADJUSTMENT PROCESS
Displaced workers rarely find new jobs instantaneously. Time is requiredfor the flow of job information and for matching the location, education,skill, wage, working conditions, and other preferences of job hunters with therequirements of employers. Personal contacts, employment services, andhelp-wanted advertisements provide important channels of communicationbetween employers hunting for workers, and workers hunting for jobs.Nonetheless, the flow of labor market information is unnecessarily slow andcircumscribed. Because of insufficient staff and, in some instances, becauseof the failure of employers to provide information, local offices of theFederal-State Employment Service cannot provide complete information onlocal job opportunities, to say nothing of a full exchange of informationamong different localities. In the absence of adequate vocational guidance,many young workers are not properly prepared for the activities in whichemployment is expanding most rapidly. Geographic movement is oftenrestrained by lack of information and by the inability of workers to financetransportation, job search, and change of residence. Occupational mobilityis often inhibited by the absence of adequate educational background andthe inability to acquire needed skills.
The average displaced worker spends far too long between jobs, even inperiods of adequate demand. The average duration of unemployment was11.6 weeks during the period 1955-57, when the over-all unemployment rateaveraged 4.3 percent. And, during the boom years of 1951-53, when the un-employment rate averaged 3.1 percent and the number of unfilled jobs veryprobably exceeded the number of unemployed workers, the average durationof unemployment was still 8.7 weeks. These statistics do not refer specificallyto the average period of joblessness for workers displaced by technologicalchange, but they do indicate the time-consuming nature of the job-huntingprocess. They also suggest that reduction of the human cost of technologicalchange will require policies—both private and public—for improving andspeeding the matching of available jobs and workers.
Such policies can never be completely adequate. The burdens of transi-tional unemployment may be harsh, but they sometimes represent only part
IOI
Digitized for FRASER http://fraser.stlouisfed.org/ Federal Reserve Bank of St. Louis
of the cost of change to the displaced worker. The worker made permanent-ly unemployable by technological change is relatively rare, but it is frequentfor a displaced worker to find himself required to accept a less challengingand lower paying job. The specialized skill, experience, and seniority whichcontributed to earning power in the original job frequently do not havetransferable market value.
Moreover, the burden of technological displacement often falls mostheavily on those least able to bear it. As noted already, the general driftof technological change has tended to be toward increased rather than re-duced skill and education requirements and thus in favor of groups alreadyhigher up on the income ladder. To be sure, some of the elite of the laborforce have suffered—printers and flight engineers, to take two recent ex-amples. But overwhelmingly, the groups displaced have been the less-skilled, less-educated, and therefore poorer members of the labor force.But even if the incidence of technological change were entirely random, thewealthier community, the more prosperous business, the more highly trainedand better paid workers have greater adaptability, and greater resourcesto help them through the period of adaptation.
When technological change displaces considerable numbers of workersin a particular region or occupation, and these workers lack the skills ormobility necessary to find other jobs quickly, their continuing unemploy-ment can well be called "structural." Pockets of such structural unemploy-ment are never absent, and the problems they present for public policy areintensified (and partly .concealed) in a generally slack economy withexcessive over-all unemployment.
In its testimony before the Senate Subcommittee on Employment andManpower on October 28, 1963, the Council considered at some length theinterrelationships between slack labor markets resulting from insufficienttotal demand for goods and services and problems of structural unem-ployment. It dealt in particular with the question whether recent techno-logical change may have increased the incidence of structural unemploymentin the American economy and the possible relevance of this for policies toraise demand. The Council explained in detail its reasons for doubtingthat structural unemployment has increased, but emphasized that suchunemployment is both an economic and a human problem of serious pro-portions and that Government has a responsibility for taking appropriatemeasures to reduce it. The bulk of this testimony is reprinted as AppendixA to this Report.
PRIVATE POLICIES FACILITATING ADJUSTMENT
Recognition of the human toll that can result from technological changeand labor displacement has led to a wide range of private efforts to reducetransitional costs. Human adjustment problems are minimized whenneeded work force reductions can be accomplished by normal attrition andreassignment. This goal—toward which firms with enlightened personnelpolicies strive—is often made economically feasible by the limited scope
102
Digitized for FRASER http://fraser.stlouisfed.org/ Federal Reserve Bank of St. Louis
of many innovations or by a sufficiently high rate of voluntary employeeturnover. But it requires careful planning. The Bureau of Labor Statisticsrecently surveyed the work history of 2,800 persons employed in 18 officesdoing data processing work which was to be transferred to electronic com-puters. The firms tried to ensure employment security for their currentwork force by advance planning and curtailment of hiring. Twelve monthsafter the new installation, more than half of the workers were still in theiroriginal positions, and more than 30 percent had been transferred to otherpositions in the firm. Thirteen percent had quit or retired, and less than1 percent were laid off.
Collective bargaining agreements have been concerned increasingly withproblems of accommodating change while protecting worker security.In recent agreements, increasing stress has been placed on interplant senior-ity pools, relocation allowances, early retirement provisions, and severancepay plans that provide a lump sum payment or its equivalent as reimburse-ment for the income losses associated with displacement. The recent KaiserSteel-United Steelworkers and West Coast Longshoremen's agreements pro-vided employment guarantees or income assurances for workers displacedby technological change. The Railroad Arbitration Board decreed theeventual elimination of 90 percent of diesel locomotive firemen's jobs infreight and yard service, but it provided income guarantees for those with
2 to 10 years of seniority, and lifetime employment protection for thosewith greater seniority.
Private programs to minimize displacement or to reimburse displacedworkers are desirable because the burden of adjustment is prevented fromfalling exclusively on the displaced worker. Such programs serve a doublyuseful purpose when they facilitate the rapid introduction and economicaluse of new processes. However, they can often be only partial remedies.In many instances of major technological change, private programs eitherare impracticable (for example, if the displacement occurs in industry Aas a result of technological change in industry B), or else cannot providecomplete worker protection without unduly slowing the pace of technicaladvance, and preventing the flexible and efficient utilization of the laborforce.
PUBLIC POLICY AND TECHNOLOGICAL CHANGE
Two central points emerge from the preceding discussion. First, tech-nological advance is a key element in economic progress; achieving thegoals of rapid growth and higher living standards and better internationalbalance depends on maintaining and even increasing its pace. Second,technological change—like other kinds of change—demands adaptationson the part of labor, business, and the community at large; and these adapta-tions impose real burdens on adversely affected individuals.
Each of these points has significant implications for public policy. Theysuggest that Government should stimulate and facilitate rapid technological
103
Digitized for FRASER http://fraser.stlouisfed.org/ Federal Reserve Bank of St. Louis
change in order to enlarge its benefits, at the same time attempting tostrengthen processes of adaptation and to lighten the burdens of changeon affected individuals.
The single most important support the Government can provide foraccomplishing each of these purposes is to help the economy achieve andsustain high employment. Without strong markets for their products,businessmen will have inadequate incentives to undertake the risks inherentin innovation. Likewise, the economy's adaptation to technical change—and particularly its ability to transfer the resources released by technicalchange to other industries and activities—become immeasurably weakenedin the absence of strong demand.
TAX STIMULUS FOR INVESTMENT
Enactment of the pending tax bill is thus crucial to the achievementof our dual objectives. First, it helps insure the increase in demand neces-sary to provide markets for our growing productive potential. But the taxprogram of the Administration carries a further impact of great importancefor the encouragement of rapid technological innovation. This is thespecific emphasis on encouraging investment. The investment tax creditand the revised depreciation guidelines of 1962 were designed particularlyto reward firms which raised their rate of investment in new plant and equip-ment. And the pending bill carries this emphasis further, with a largereduction in corporate taxes, a cutback of risk-inhibiting top bracket in-dividual tax rates, and a further broadening of the investment credit.
The stimulus that tax reduction will give to investment both throughits effects on markets generally and through its specific improvement ininvestment incentives is one of the most powerful ways available to encour-age the rapid introduction of new and better technology.
GOVERNMENT SUPPORT OF
TECHNOLOGICAL ADVANCE
A healthy rate of innovation is encouraged by preserving freedom ofentry into markets by new competitors, and by a patent system which pro-vides positive incentives to both invention and innovation.
The Government has also provided more direct encouragement of tech-nological advance, and it can and should do more. Federal support isclearly warranted and appropriate when it encourages innovations thatwill be used directly to improve performance of a service recognized as adirect responsibility of the Federal Government. National defense is themost important current example of such an activity. But there are manyother activities in which government—Federal, State, or local—plays a majorrole: providing public highways, airways, inland waterways, weather services,and postal services; maintaining an atmosphere free from dangerous pollu-tion and an adequate supply of pure water; and a long list covering suchdiverse fields as criminology, recreation, and education. In such activitiesGovernment has a special responsibility to undertake, or to support, research
104
Digitized for FRASER http://fraser.stlouisfed.org/ Federal Reserve Bank of St. Louis
and development which promise improvements in public services—betterquality, greater safety and reliability, and lower cost. In none of thesefields can private incentives be expected to provide an adequate researcheffort.
But there are other situations that justify Federal support of invention andinnovation, even in areas that are and should remain the province of privateenterprise. This is surely true where the benefits to the community extendfar beyond the gains to the individual buyers of the new product or service.The benefits to these buyers may be quite insufficient to cover the privatecosts and risks of developing the new good or service; yet the benefits tosociety at large may pay a handsome return to the innovational activity.
Medical research is clearly an example of this kind of activity. Improve-ments in medical technology are certainly in the public interest; yet the costsof many such improvements could not—and perhaps should not—be borneby the immediate beneficiaries of the new knowledge. Through a politicalprocess society has determined that a larger effort should be made, andGovernment funds primarily support it.
REASONS FOR UNDERINVESTMENT INRESEARCH AND INNOVATION
Aside from medicine, the other principal field in which significant Federalsupport has been given to technological change in an essentially private,civilian industry is agriculture. This type of support has a long history,going back at least to 1887, when the Hatch Act established the nationalsystem of agricultural experiment stations, and to 1914, when the Agricul-tural Extension Service was founded. The basic justification for supportingagricultural research differs from that applicable to national defense ormedicine. And it is a justification which would seem to extend to otherindustries as well. In a number of industries the amount of organized pri-vate research undertaken is insignificant, and the technology of many of theselow-research industries has notably failed to keep pace with advances else-where in the economy.
Several factors can be identified to account for the underinvestment inresearch and development on the part of private firms in such industries.The primary one is an inability of the individual firm to recover the costsof research in its prices, even though the additional value to the direct con-sumers of the product would greatly exceed those costs. Particularly in thecase of basic research, the "product" is new knowledge; but scientific knowl-edge cannot be appropriated by an individual firm. Other firms and evenother industries—which have not incurred the research costs—share thebenefits. As a new development moves further along the research and de-velopment spectrum toward actual production, an individual firm may beable, through the patent system, to appropriate to itself rewards sufficient tojustify the costs and risks of developing and introducing the new process ornew product. The clearest case for public support thus applies to the morebasic forms of research. This case is reinforced by greater riskiness at this
105
Digitized for FRASER http://fraser.stlouisfed.org/ Federal Reserve Bank of St. Louis
early end of the R&D spectrum. Ordinarily, at least, uncertainty decreasesas a new process or product approaches specific economic application. In-deed, the research cycle can usefully be viewed as a process of progressivereduction of uncertainty as more knowledge is acquired.
Another reason for the virtual absence of organized research in manyindustries is the high cost of research in the relevant technologies in relationto the typical size of firms in those industries. Research plant and equip-ment costs are very high in nuclear physics, for example. In other cases,effective research may require large staffs of scientists and engineers sinceadvances may depend on contributions from many scientific specialties.Furthermore, the small establishment is unable to take advantage of thespreading of risks among a number of R&D projects under way at the sametime. The larger firm, able to support a number of projects, can safelytake the risk of many "failures" (i.e., projects that do not produce eco-nomically applicable results), since a few successes will ordinarily more thancompensate for the entire investment. The large firm has the additionaladvantage of being in a better position to market successfully the new prod-ucts of its research laboratory because of its broader market coverage. Forexample, in the chemicals industry—which is relatively active in research—many firms typically participate in a broad range of product markets. Inthis field, at least, where new R&D results are often profitably applicablein more than one market, the large firm is better able to recognize and takeadvantage of possible payoffs in several applications.
However, some industries characterized by large firms undertake rela-tively little R&D. Part of the explanation seems to lie in the age of the in-dustry. Industries which were already mature before sophisticated sci-entific and engineering techniques began to be applied to industry lacka research tradition. Many important newer industries, such as electronics,grew directly out of modern organized research and development, and theirmanagements find it natural and profitable to continue this emphasis onR&D as they mature.
The fact that some industries spend little on research does not in itselfprove that there would be high payoffs to additional research. It may bethat research effort is slight because it is clear that it would not pay. Nordoes it automatically follow that productivity gains in these fields are low.They may, and often do, show rapid gains based on innovations by thecapital goods industries which supply their equipment.
Nevertheless, the above analysis has suggested some reasons, quite unre-lated to the potential gains from accelerated R&D, that account for anunderinvestment in research in many fields—particularly where firms aresmall. The data at the bottom of Table 18 clearly show that manufactur-ing firms with R&D programs, and with 5,000 or more employees, did—onthe average—more than twice as much research as a percentage of salesas did smaller firms.
106
Digitized for FRASER http://fraser.stlouisfed.org/ Federal Reserve Bank of St. Louis
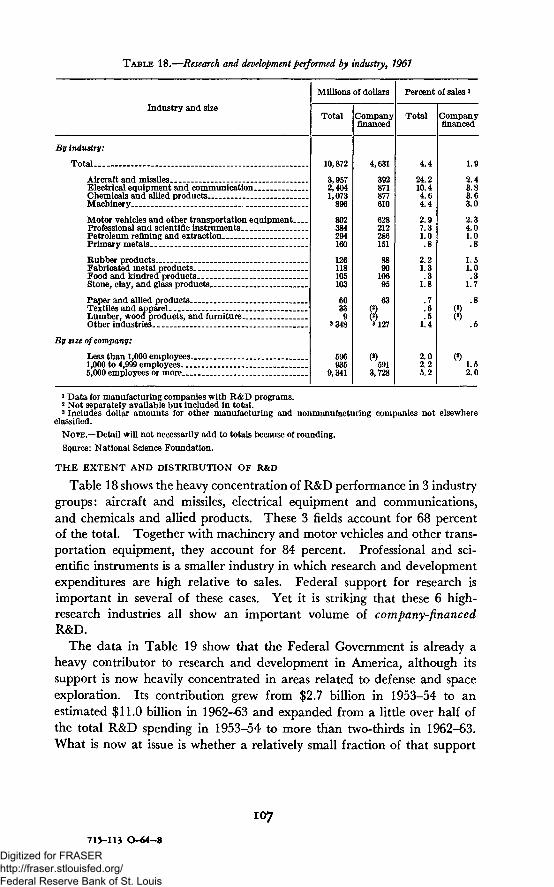
TABLE 18.—Research and development performed by industry, 1961
Industry and size
Millions of dollars
Total Companyfinanced
Percent of sales i
Total Companyfinanced
By industry:
Total—.
Aircraft and missilesElectrical equipment and communication.Chemicals and allied productsMachinery __ ___
Motor vehicles and other transportation equipmentProfessional and scientific instrumentsPetroleum refining and extractionPrimary metals _ ___
Rubber productsFabricated metal productsFood and kindred productsStone, clay, and glass products-
Paper and allied productsTextiles and apparelLumber, wood products, and furniture-Other industries
By size of company:
Less than 1,000 employees..1,000 to 4,999 employees-...5,000 employees or more
10,872
3,9572,4041,073
384294160
126118105103
60339
»348
9359,341
4,631
392871877610
212286151
9010695
3 127
()591
3,728
4.4
24.210.44.64.4
2.97.31.0
2.21.3
1.8
.7
.51.4
2.02.25.2
(2)
1.92.43.83.63.0
2.34.01.0.8
1.51.0.3
1.7
.8
.5
1.52.0
1 Data for manufacturing companies with R&D programs.2 Not separately available but included in total.3 Includes dollar amounts for other manufacturing and nonmanufacturing companies not elsewhere
classified.NOTE.—Detail will not necessarily add to totals because of rounding.Spurce: National Science Foundation.
THE EXTENT AND DISTRIBUTION OF R&D
Table 18 shows the heavy concentration of R&D performance in 3 industrygroups: aircraft and missiles, electrical equipment and communications,and chemicals and allied products. These 3 fields account for 68 percentof the total. Together with machinery and motor vehicles and other trans-portation equipment, they account for 84 percent. Professional and sci-entific instruments is a smaller industry in which research and developmentexpenditures are high relative to sales. Federal support for research isimportant in several of these cases. Yet it is striking that these 6 high-research industries all show an important volume of company-financedR&D.
The data in Table 19 show that the Federal Government is already aheavy contributor to research and development in America, although itssupport is now heavily concentrated in areas related to defense and spaceexploration. Its contribution grew from $2.7 billion in 1953-54 to anestimated $11.0 billion in 1962-63 and expanded from a little over half ofthe total R&D spending in 1953-54 to more than two-thirds in 1962-63.What is now at issue is whether a relatively small fraction of that support
107
715-113 O - 6 4 - 8
Digitized for FRASER http://fraser.stlouisfed.org/ Federal Reserve Bank of St. Louis
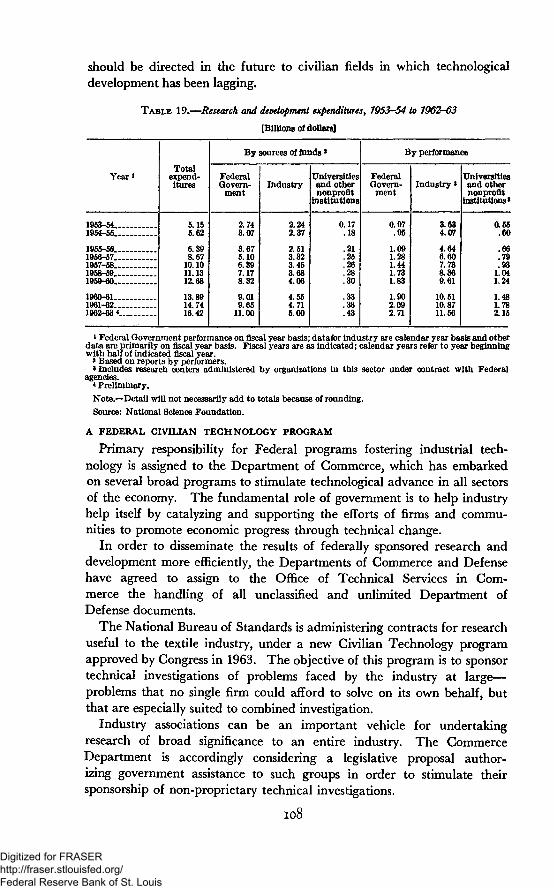
should be directed in the future to civilian fields in which technologicaldevelopment has been lagging.
TABLE 19.—Research and development expenditures, 1953-54 to 1962-63
[Billions of dollars]
Year*
1953-541954-55
1955-561956-57.1957-581958-591959-60
1960-611961-62.1962-63<
Totalexpend-itures
5.155.62
6.398.67
10.1011.1312.68
13.8914.7416.42
By sources of funds *
FederalGovern-
ment
2.743.07
3.675.106.397.178.32
9.019.65
11.00
Industry
2.242.37
2.513.323.453.684.06
4.554.716.00
Universitiesand othernonprofit
institutions
0.17.18
.21
.25
.26
.28
.30
.33
.38
.43
By performance
FederalGovern-
ment
0.97.95
1.091.281.441.731.83
1.902.092.71
Industry»
3.634.07
4.646.607.738.369.61
10.5110.8711.66
Universitiesand othernonprofit
institutions»
0.55.60
.66
.79
.931.041.24
1.481.782.15
» Federal Government performance on fiscal year basis; datafor industry are calendar year basis and otherdata are primarily on fiscal year basis. Fiscal years are as indicated; calendar years refer to year beginningwith half of indicated fiscal year.
2 Based on reports by performers.* Includes research centers administered by organizations in this sector under contract with Federal
* Preliminary.
Note.—Detail will not necessarily add to totals because of rounding.
Source: National Science Foundation.
A FEDERAL CIVILIAN TECHNOLOGY PROGRAM
Primary responsibility for Federal programs fostering industrial tech-nology is assigned to the Department of Commerce, which has embarkedon several broad programs to stimulate technological advance in all sectorsof the economy. The fundamental role of government is to help industryhelp itself by catalyzing and supporting the efforts of firms and commu-nities to promote economic progress through technical change.
In order to disseminate the results of federally sponsored research anddevelopment more efficiently, the Departments of Commerce and Defensehave agreed to assign to the Office of Technical Services in Com-merce the handling of all unclassified and unlimited Department ofDefense documents.
The National Bureau of Standards is administering contracts for researchuseful to the textile industry, under a new Civilian Technology programapproved by Congress in 1963. The objective of this program is to sponsortechnical investigations of problems faced by the industry at large—problems that no single firm could afford to solve on its own behalf, butthat are especially suited to combined investigation.
Industry associations can be an important vehicle for undertakingresearch of broad significance to an entire industry. The CommerceDepartment is accordingly considering a legislative proposal author-izing government assistance to such groups in order to stimulate theirsponsorship of non-proprietary technical investigations.
108
Digitized for FRASER http://fraser.stlouisfed.org/ Federal Reserve Bank of St. Louis

A further legislative proposal is under consideration to provide forFederal cooperation with States, universities, and industry groups to aid inthe development and dissemination of new technological information.The purpose of this program would be to bring the reservoir of technicalinformation available at scientific centers to bear on the problems of firmsthat are not able to support large research organizations. Such a technicalservice program should be tailored to the needs of the local area andconducted under local direction.
FEDERAL SUPPORT FOR BASIC RESEARCH
"Basic research" has sometimes been defined as research undertaken withno specific practical goal in mind—beyond a general conviction thatextending man's knowledge of his environment and of himself is boundto serve the purposes of human life and human society. Most basic researchis conducted in universities, sometimes supported by the Federal Govern-ment. A relatively small number of large business organizations supportbasic research in areas of their general interests.
Merely to agree that basic research is a "good thing" does not necessarilyjustify Federal support for it and, in particular, gives no basis for deter-mining how much support should be provided for what kinds of basicresearch.
It is inevitable that primary support should be given to those fields ofnatural science where potential payoff's in national security, health, andeconomic growth are obviously high even if uncertain in location andcharacter. The fact that many of our most dramatically "practical" tech-nological achievements have grown quite directly—and often quitepromptly—from new discoveries in these fields builds a solid case for theirsupport.
Recognizing this relationship between basic research in the natural sci-ences and practical achievements benefiting society in many diverse ways,the Congress has provided generous support for research in the naturalsciences, particularly through the Department of Defense, the AtomicEnergy Commission, the National Aeronautics and Space Administration,the Department of Health, Education, and Welfare, and the NationalScience Foundation. The breadth of Federal support of basic research isreflected in the work of the NSF, which supports and encourages researchover a spectrum including atmospheric sciences, high energy physics, ocean-ography, and metabolic biology—in each of which research costs are oftenhigh and the potential payoff to society may be very great.
Yet basic research in other fields may also have "practical" payoffs evenif not in industrial technology or national security. Thus Federal supportis given to investigations in psychology, where potential payoffs in more effi-cient organizations or better mental health can be large. The social sciences,where expanding knowledge of economic and social relationships may im-
109
Digitized for FRASER http://fraser.stlouisfed.org/ Federal Reserve Bank of St. Louis
prove the efficiency and effectiveness of government and private organiza-tions, also merit support even on "practical" grounds, and some modest be-ginnings in these fields are now being undertaken.
A strong system of university and technical education must underlie prog-ress in basic research. Institutions of higher education not only conductmuch of our national research effort, but they also train most of the scientificresearch workers on whom future progress depends. The National ScienceFoundation's program simultaneously supports both university research andhigher education, reflecting their close interrelationship. Higher educationis also supported through programs under the National Defense EducationAct and the new Higher Education Facilities Act.
GOVERNMENT'S ROLE IN AIDING ADJUSTMENT
Federal responsibility for fostering more rapid technical advance clearlycould not be successfully—or even appropriately—undertaken in an economyin which total demand perennially failed to rise enough to reemploy theworkers initially displaced as well as new additions to the labor force. Butmaintaining high demand and satisfactory over-all employment is notenough. There are other important policies which the Federal Governmentmust pursue if adjustments to change are to be successful, and if the effectson labor, business, and local communities are to be acceptable. Many ofthe programs needed for this purpose also form one cornerstone of the attackon poverty.
The labor market programs of the Federal Government have madestriking progress in recent years, and this progress must continue. Since1961 the Federal-State Employment Service has increased its nonfarm jobplacements by almost 25 percent. But its guidance and placement facili-ties must be further strengthened in order to improve the matching ofworkers and jobs. The vocational retraining program of the Departmentof Labor and the Area Redevelopment Administration has reduced transi-tion costs and improved future earning potential for a significant numberof displaced workers. Some 148,000 workers will be in training or retrain-ing during fiscal year 1964 in skills as diverse as drafting, stenography,nursing, auto repairing, and metalworking; and the program will be ex-panded to provide training and retraining for 288,000 workers in fiscalyear 1965. The recent broadening of the Manpower, Development andTraining Act will increase its effectiveness in coping with unemploymentamong low-skilled workers and youths. An important element includedas part of this program will be the provision of adult education courses infiscal year 1965 for 60,000 persons who are unable to acquire industrial skillsbecause of a lack of basic literacy, and vocational training will be providedfor 85,000 unemployed youths.
In this connection the recent passage by the Congress of a broad newprogram of aid to vocational education is of great significance. It shouldlead not only to a large expansion of existing programs but also to aconsiderable broadening and redirection, including new emphasis on busi-
IIO
Digitized for FRASER http://fraser.stlouisfed.org/ Federal Reserve Bank of St. Louis
ness and office occupations. The work-study program and provision inthe new legislation for residential vocational schools will greatly improveopportunities for young people previously unable to acquire vocationaltraining. In addition, passage of the Youth Employment Act will providework and training through conservation work camps and work projectsin local communities for 60,000 youths during 1964 and over 100,000 the fol-lowing year. The prevalence of discriminatory hiring practices has been sig-nificantly reduced by the vigorous efforts of the President's Committee onEqual Employment Opportunities.
The unemployment insurance system—first line of defense against the costsof unemployment—must be modernized in order to deal better with theunemployment that results from shifts of jobs from one occupation, industry,or area to another. The additional labor market programs that are beingrecommended will be discussed at greater length in the forthcoming Man-power Report of the President.
In our concern with the problems of today's unemployed, it should notbe forgotten that a strengthened system of basic education will be the bestguarantee against significant problems of displacement and dislocation intomorrow's full-employment economy.
Technical education and vocational guidance programs can be kept morecurrent by the creation of any early warning system on new technologicaladvances. But the possibility of accurately predicting occupational require-ments even 10 years into the future is highly limited. And the averagemale's working life now extends over 45 years. We can best prepare forthe occupational requirements of the labor market of 1970 through an edu-cational system that produces well-educated and technically versatile gradu-ates, able rapidly to acquire new skills. Such versatility will accelerate theprocess of matching jobs and workers and greatly reduce the loss of poten-tial earning power resulting from the obsolescence of specific skills.
CONCLUSION
Fears of technological advance are understandable on the part of thosewho feel its threat to their livelihoods. In the absence of wise and effectiveprivate and public action such fears are justified. But any comprehensiveappraisal can lead only to the conclusion that the benefits of technicalchange—in the future as in the past—are such that public policy shouldfoster rather than shun it. To yield to apprehension that the machine willbecome our master, that we are unable to absorb and adjust to rapid change,that we must deny ourselves the continued rise in material well-being thatever-growing knowledge and understanding place within our grasp and theincreased freedom it brings to pursue higher goals—such a defeatist viewis both unworthy of our heritage and unjustified. For as scientific andtechnical knowledge has grown over the years, so, too, has understandingof our social and economic system and institutions—including the properrole of government in a free society. Applying this knowledge, all citizenscan enjoy the fruits of rapid change.
I l l
Digitized for FRASER http://fraser.stlouisfed.org/ Federal Reserve Bank of St. Louis
Chapter 4
Price and Wage Policy for High Employment
XNFLATION need be no more of a threat in 1964 than it was in 1963 or1962 or 1961—and the threat was well contained in each of those years.But the good record of price stability in the expansion to date provides nobasis for relaxing our vigilance in 1964 and beyond. At stake are not onlyimportant domestic economic objectives but also our long-term balance-of-payments position.
The decisions that can make or break this country's price stability recordrest in private hands, and they should remain there. Yet it is the respon-sibility—and the determined purpose—of the Administration to do all itproperly can to promote the right outcome.
THE PRICE-WAGE SITUATION AND THE PROSPECTS
The impressive noninflationary record of this expansion thus far—thestability of wholesale prices and the slow upward movement of over-allconsumer prices—has been reviewed in Chapter 1 and is portrayed inChart 11. At the same time, as Tables 20 and 21 show, the price stabilityhas not been "paid for" either by a failure of wages to keep up with thetrend change in productivity in the economy as a whole or by a corporateprofits squeeze. (In the tables, "trend change in productivity" for anygiven year is defined as the 5-year moving average of the annual percentagechanges in the Bureau of Labor Statistics index of output per man-hour inthe total private economy. These estimates use labor input data collectedprimarily by establishments.) While money wages have not risen as fast as insome earlier expansions, the gain in purchasing power has been eroded verylittle by price increases. And while over-all profits have continued to rise,this has been achieved without substantial price increases. In terms of thebalance among wages, prices, and profits, the economy is in a good position,as it enters 1964, to avoid inflationary price and wage decisions.
The price stability of 1961-63 has resulted in part from persistent slackin the economy. But another major factor has been the responsible actionof most union and business leaders in making noninflationary wage andprice decisions. Although shifting patterns of demand and supply are themajor factors ruling prices, wages, and output in our market economy, there
112
Digitized for FRASER http://fraser.stlouisfed.org/ Federal Reserve Bank of St. Louis
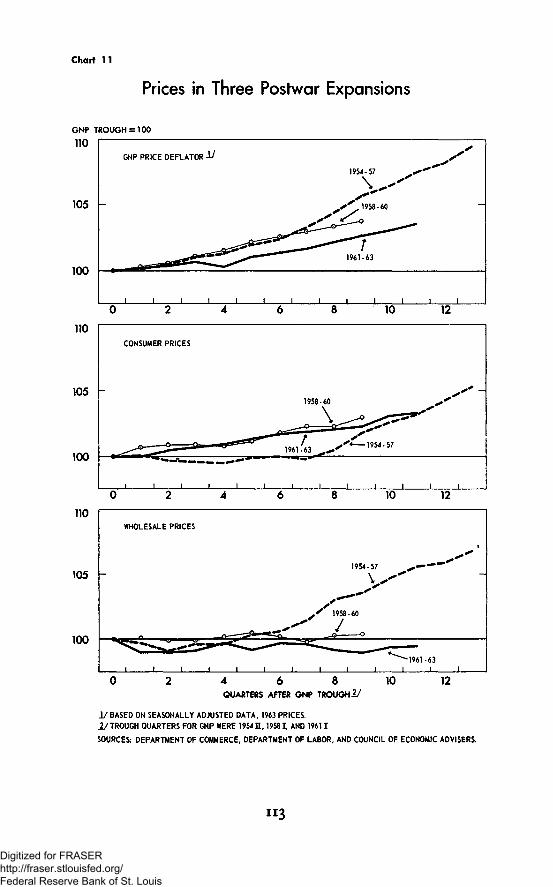
Chart 11
Prices in Three Postwar Expansions
GNP PRICE DEFLATOR 1 /
-
1 1 1 1 1 1
1954-57 *
> "
, ' y l»58-60
^ S ^ --1961-63
/* - -
I |
GNP TROUGH = 100
110
105 -
100
110
105 -
100
110
105 -
100
10 12
CONSUMER PRICES
-
i t i
1958-60
— * S s e S e S G ^ 1961-63 ^ * ^ * ~ ~
I 1 I I i I
1954-
1
57
1
10 12
WHOLESALE PRICES
I I t i 1
1954-57
S * 1958-60
i I i i 1
•MB
^-1961-63I i I
4 6 8 10QUARTERS AFTER GNP TROUGH!/
12
J / BASED ON SEASONALLY ADJUSTED DATA, 1963 PRICES.
I / T R O U G H QUARTERS FOR GNP WERE 1954I I , 19581, AND 19611
SOURCES: DEPARTMENT OF COMMERCE, DEPARTMENT OF LABOR, AND COUNCIL OF ECONOMIC ADVISERS.
113
Digitized for FRASER http://fraser.stlouisfed.org/ Federal Reserve Bank of St. Louis
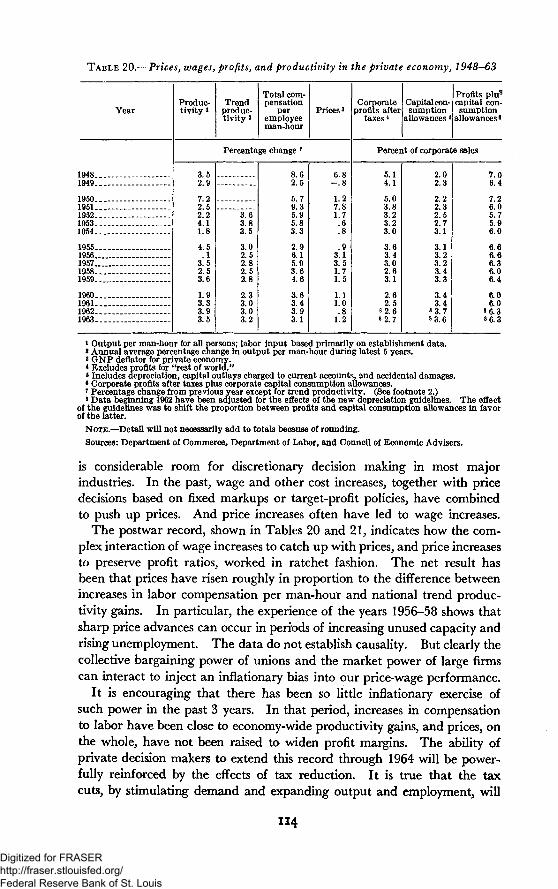
TABLE 20.—Prices, wages, profits, and productivity in the private economy, 1948-63
Year
19481949 _-_
19501951195219531954
195519561957 _19581959
I960 . .196119621963- .
Produc-tivity i
Trendproduc-tivity 2
Total com-pensation
peremployeeman-hour
Prices 3
Percentage change 7
3.52.9
7.22.52.24.11.8
4.5.1
3.52.53.6
1.93.33.93.5
3.63.83.5
3.02.52.82.52.8
2.33.03.03.2
8.62.5
5.79.35.95.83.3
2.96.15.93.64.6
3.63.43.93.1
6.8- . 8
1.27.81.7.6. 8
.93.13.51.71.5
1.11.0.8
1.2
Corporateprofits after
taxes4
Capital con-sumption
allowances 8
Profits plus
capital con-sumption
allowances8
Percent of corporate sales
5.14.1
5.03.83.23.23.0
3.63.43.02.63.1
2.62.5
8 2.68 2.7
2.02.3
2.22.32.52.73.1
3.13.23.23.43.3
3.43.4
8 3.783.6
7.06.4
7.26.05.75.96.0
6.66.66.36.06.4
6.06.0
8 6.38 6.3
i Output per man-hour for all persons; labor input based primarily on establishment data.* Annual average percentage change in output per man-hour during latest 5 years.3 GNP deflator for private economy.4 Excludes profits for "rest of world."«Includes depreciation, capital outlays charged to current accounts, and accidental damages.6 Corporate profits after taxes plus corporate capital consumption allowances.7 Percentage change from previous year except for trend productivity. (See footnote 2.)8 Data beginning 1962 have been adjusted for the effects of the new depreciation guidelines. The effect
of the guidelines was to shift the proportion between profits and capital consumption allowances in favorof the latter.
NOTE.—Detail will not necessarily add to totals because of rounding.
Sources: Department of Commerce, Department of Labor, and Council of Economic Advisers.
is considerable room for discretionary decision making in most majorindustries. In the past, wage and other cost increases, together with pricedecisions based on fixed markups or target-profit policies, have combinedto push up prices. And price increases often have led to wage increases.
The postwar record, shown in Tables 20 and 21, indicates how the com-plex interaction of wage increases to catch up with prices, and price increasesto preserve profit ratios, worked in ratchet fashion. The net result hasbeen that prices have risen roughly in proportion to the difference betweenincreases in labor compensation per man-hour and national trend produc-tivity gains. In particular, the experience of the years 1956-58 shows thatsharp price advances can occur in periods of increasing unused capacity andrising unemployment. The data do not establish causality. But clearly thecollective bargaining power of unions and the market power of large firmscan interact to inject an inflationary bias into our price-wage performance.
It is encouraging that there has been so little inflationary exercise ofsuch power in the past 3 years. In that period, increases in compensationto labor have been close to economy-wide productivity gains, and prices, onthe whole, have not been raised to widen profit margins. The ability ofprivate decision makers to extend this record through 1964 will be power-fully reinforced by the effects of tax reduction. It is true that the taxcuts, by stimulating demand and expanding output and employment, will
114
Digitized for FRASER http://fraser.stlouisfed.org/ Federal Reserve Bank of St. Louis
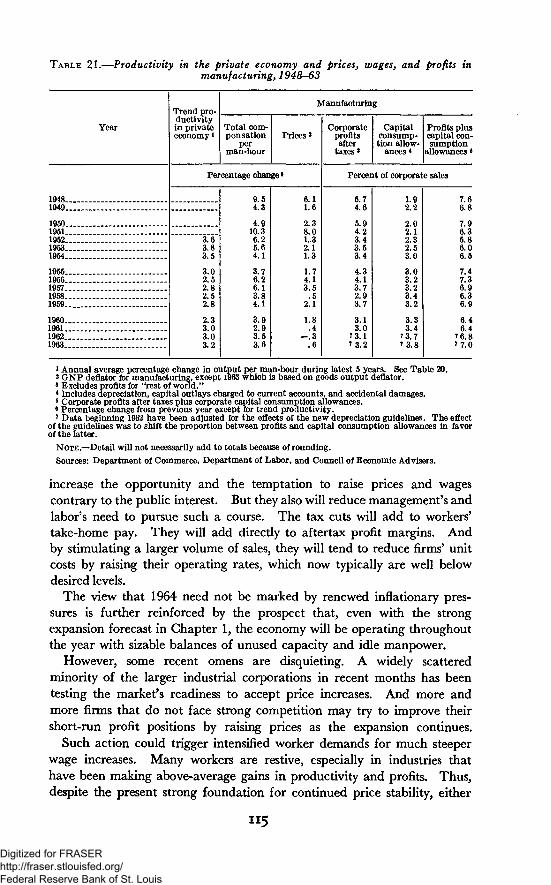
TABLE 21.—Productivity in the private economy and prices, wages, and profits inmanufacturing, 1948-63
Year
19481949
19501951195219531954
19551956195719581959..
1960196119621963
Trend pro-ductivityin privateeconomy l
Manufacturing
Total com-pensation
perman-hour
Prices *
Percentage change8
3.63.83.5
3.02.52.82.52.8
2.33.03.03.2
9.54.3
4.910.36.25.64.1
3.76.26.13.84.1
3.92.93.53.6
6.11.6
2.38.01.-32.11.3
1.74.13.5
.52.1
1.8.4
- . 3.6
Corporateprofitsafter
taxes 3
Capitalconsump-tion allow-
ances*
Profits pluscapital con-sumption
allowances«
Percent of corporate sales
5.74.6
5.94.23.43.53.4
4.34.13.72.93.7
3.13.0
7 3.17 3.2
1.92.2
2.02.12.32.53.0
3.03.23.23.43.2
3.33.4
73.77 3.8
7.66.8
7.96.35.86.06.5
7.47.36.96.36.9
6.46.4
7 6.87 7.0
1 Annual average percentage change in output per man-hour during latest 5 years. See Table 20.2 GNP deflator for manufacturing, except 1963 which is based on goods output deflator.3 Excludes profits for "rest of world."4 Includes depreciation, capital outlays charged to current accounts, and accidental damages.5 Corporate profits after taxes plus corporate capital consumption allowances.8 Percentage change from previous year except for trend productivity.7 Data beginning 1962 have been adjusted for the effects of the new depreciation guidelines. The effect
of the guidelines was to shift the proportion between profits and capital consumption allowances in favorof the latter.
NOTE.—Detail will not necessarily add to totals because of rounding.
Sources: Department of Commerce, Department of Labor, and Council of Economic Advisers.
increase the opportunity and the temptation to raise prices and wagescontrary to the public interest. But they also will reduce management's andlabor's need to pursue such a course. The tax cuts will add to workers'take-home pay. They will add directly to aftertax profit margins. Andby stimulating a larger volume of sales, they will tend to reduce firms' unitcosts by raising their operating rates, which now typically are well belowdesired levels.
The view that 1964 need not be marked by renewed inflationary pres-sures is further reinforced by the prospect that, even with the strongexpansion forecast in Chapter 1, the economy will be operating throughoutthe year with sizable balances of unused capacity and idle manpower.
However, some recent omens are disquieting. A widely scatteredminority of the larger industrial corporations in recent months has beentesting the market's readiness to accept price increases. And more andmore firms that do not face strong competition may try to improve theirshort-run profit positions by raising prices as the expansion continues.
Such action could trigger intensified worker demands for much steeperwage increases. Many workers are restive, especially in industries thathave been making above-average gains in productivity and profits. Thus,despite the present strong foundation for continued price stability, either
"5
Digitized for FRASER http://fraser.stlouisfed.org/ Federal Reserve Bank of St. Louis
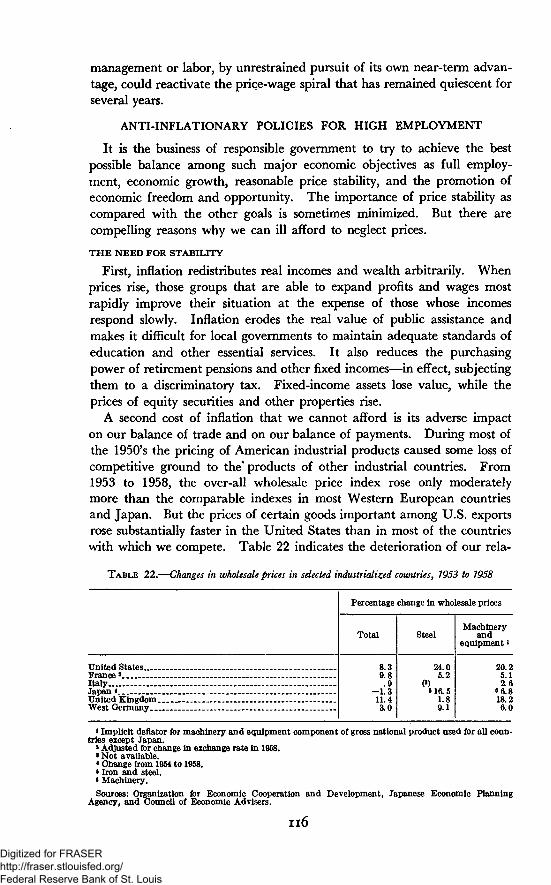
management or labor, by unrestrained pursuit of its own near-term advan-tage, could reactivate the price-wage spiral that has remained quiescent forseveral years.
ANTI-INFLATIONARY POLICIES FOR HIGH EMPLOYMENT
It is the business of responsible government to try to achieve the bestpossible balance among such major economic objectives as full employ-ment, economic growth, reasonable price stability, and the promotion ofeconomic freedom and opportunity. The importance of price stability ascompared with the other goals is sometimes minimized. But there arecompelling reasons why we can ill afford to neglect prices.
THE NEED FOR STABILITY
First, inflation redistributes real incomes and wealth arbitrarily. Whenprices rise, those groups that are able to expand profits and wages mostrapidly improve their situation at the expense of those whose incomesrespond slowly. Inflation erodes the real value of public assistance andmakes it difficult for local governments to maintain adequate standards ofeducation and other essential services. It also reduces the purchasingpower of retirement pensions and other fixed incomes—in effect, subjectingthem to a discriminatory tax. Fixed-income assets lose value, while theprices of equity securities and other properties rise.
A second cost of inflation that we cannot afford is its adverse impacton our balance of trade and on our balance of payments. During most ofthe 1950's the pricing of American industrial products caused some loss ofcompetitive ground to the* products of other industrial countries. From1953 to 1958, the over-all wholesale price index rose only moderatelymore than the comparable indexes in most Western European countriesand Japan. But the prices of certain goods important among U.S. exportsrose substantially faster in the United States than in most of the countrieswith which we compete. Table 22 indicates the deterioration of our rela-
TABLE 22.—Changes in wholesale prices in selected industrialized countries, 1953 to 1958
Percentage change in wholesale prices
Total
8.39.8.9
-1.311.43.0
Steel
24.05.2
(8)•16.5
1.89.1
Machineryand
equipmentl
20.25.12.6
«6.818.26.0
United StatesFrance 2ItalyJapan *United Kingdom.West Germany...
1 Implicit deflator for machinery and equipment component of gross national product used for all coun-tries except Japan.3 Adjusted for change in exchange rate in 1958.
»Not available.* Change from 1954 to 1958.»Iron and steel.• Machinery.Sources: Organization for Economic Cooperation and Development, Japanese Economic Planning
Agency, and Council of Economic Advisers.
n6
Digitized for FRASER http://fraser.stlouisfed.org/ Federal Reserve Bank of St. Louis
tive price position particularly in the crucial areas of steel and machineryand equipment during the period 1953 to 1958.
Since 1958 the relative movement of over-all prices has begun to be re-versed, partly because our unit labor costs have declined in comparison withthose in most European countries (Chart 12, Chapter 5) . The competitiveprice position of American producers has improved both in their home mar-kets and overseas. It would be foolishly complacent, however, to believe thatthese recent gains can be extended, or even retained, without special effort.The European countries have been striving to establish rigorous "incomespolicies" to restrain wages and prices. Despite recent setbacks, they willcontinue to press these efforts. In doing so, some European nations arewilling to accept substantial interventions into private decision making.The United States is not. If we would compete with them successfullyover the long pull, we shall need to achieve a high degree of price stabilityby means that are consistent with our traditions and values.
A third cost of inflation that we can ill afford is the compromise it couldimpose on our pursuit of full production and full employment. If costand price pressures should arise through the exercise of market power whilethe economy is still climbing toward high output and employment levels,we would be forced once more into the dreary calculus of the appropriatetrade-off between "acceptable" additional unemployment and "acceptable5*inflation. This could result in a serious setback to attainment of ournational goals.
The choice for key private decision makers is clear. It is a particularlycritical choice as the economy, after 6 years of excessive slack and unem-ployment, progresses toward full employment after enactment of the tax cut.For several years now many observers, including many leaders of the businessand labor communities, have been saying that we have solved the cost-pushinflation problem that appeared in the mid-fifties to have become endemic.This hopeful appraisal could not be demonstrated conclusively in a periodwhen unemployment averaged 6 percent. But, given a combination ofprivate and public efforts, we will have the opportunity to prove it in 1964and later years.
GOVERNMENT ACTIONS
For its part, the Government will be striving energetically to reinforce oneof the most significant comparative advantages that the American economyhas over nearly all other industrialized nations—namely, a tradition and aninstitutional structure that nurture vigorous internal competition.
In the period ahead the Administration plans actively to enforce the Na-tion's antitrust laws, in part choosing its cases and concentrating its enforce-ment energies so as to curb price-fixing and those proposed mergers and otherbusiness practices and structures that tend to make for anticompetitive en-hancement of prices. Likewise, it will resist proposals—such as the revivalof resale price maintenance now before the Congress in the so-called Quality
117
Digitized for FRASER http://fraser.stlouisfed.org/ Federal Reserve Bank of St. Louis
Stabilization Bill—that would inhibit price competition and reduce thecompetitive vitality of our marketing system. In its efforts to promote freerinternational trade the Government typically is not unmindful of theeffects that import competition has on domestic American pricing practices.And it will continue to promote and encourage vigorous price competition byUnited States exporters.
At the same time, existing, expanding, and new labor market pro-grams, already enacted by the Congress or proposed by the Adminis-tration, will help firms meet their labor needs without raising costs andprices. These programs will increase labor mobility, provide opportunitiesfor training and retraining, and improve education at all levels.
The Government also will be making a determined and continuing effort,as was pointed out in Chapter 3, to promote what are by all odds the bestanti-inflationary measures of all—large and sustainable productivity im-provements, which allow both wages and profits to increase with stableprices. The pending tax bill will have a major effect of this kind throughits lasting stimulus to investment.
Finally, as the economy's single largest buyer of goods and services, theFederal Government will redouble its efforts in 1964 to get full value for eachdollar it spends.
PRIVATE DECISIONS AND THE PRICE-WAGE GUIDEPOSTS
Government policies can only provide an environment conducive toresponsible private price and wage decision making. By choice, our Gov-ernment can advise, inform, and bring to bear the pressure of publicopinion—but it cannot direct.
With so much at stake, however, the Government's opportunity toadvise and inform the public is one it must seize. In the KennedyAdministration, general advice as to the pattern of private price-wagedecision making that would take account of the public's interest in avoid-ing market-power inflation was first formally set forth in the EconomicReport of January 1962. The "guideposts" therein described—and re-peated in the 1963 Report—offered standards by which union and businessleaders themselves—along with the general public—could appraise par-ticular wage and price decisions. They are restated here.
The guideposts contain two key propositions. The first—the generalguidepost for wages—says that, in a particular firm or industry, the appro-priate noninflationary standard for annual percentage increases in totalemployee compensation per man-hour (not just in straight-time hourlyrates) is the annual increase in national trend output per man-hour. Thestandard is not the productivity trend in the particular firm or industryin question. Nor is it the particular year's productivity change, which canbe influenced by short-run transitory factors.
The general guidepost for prices specifies that when an industry'strend productivity is growing less rapidly than the national trend, prices
n8
Digitized for FRASER http://fraser.stlouisfed.org/ Federal Reserve Bank of St. Louis
can appropriately rise enough to accommodate the labor cost increases indi-cated by the general wage guidepost. Similarly, in an industry whose trendproductivity is growing more rapidly than the national average, productprices should be lowered enough to distribute to the industry's customersthe labor-cost savings it would make under the general wage guidepost.
It should be emphasized that the general price guidepost does not counselagainst price changes per se in a particular firm or industry. On thecontrary, it contemplates changes in specific prices—downward in indus-tries with high rates of productivity gain, as well as upward in industrieswith lower-than-average productivity gains.
Adherence to these general guideposts not only would make for over-allprice stability but would be generally consistent with the tendencies ofcompetitive labor and product markets. The principles established by theguideposts do not imply that the entire gains from productivity improve-ment should go either to labor or to capital. Rather, they suggest a propor-tionate sharing of average national productivity gains among labor, capital,and the other related factors of production throughout the economy.
The general guideposts can cover the vast majority of wage and pricedecisions, but cannot provide for all of the adjustments the economy requires,especially over an extended period. Hence, the guideposts, as originallyexpounded in 1962, appropriately included a set of exceptions that reflectedcertain considerations of equity and resource allocation.
On the wage side, it was suggested that exceptions might be made toadjust for labor supply conditions and for wages that are exceptionallyhigh or low compared with the average for comparable work. Priceexceptions took into consideration capital requirements, nonlabor costs,and profits based on excessive market power.
The original formulation of the guideposts in the January 1962Report of the Council of Economic Advisers also noted that ". . . Althoughoutput per man-hour rises mainly in response to improvements in thequantity and quality of capital goods with which employees are equipped,employees are often able to improve their performance by means withintheir own control. It is obviously in the public interest that incentives bepreserved which would reward employees for such efforts."
These modifications of the general guideposts still apply, but it mustbe emphasized that they are intended to apply to only a relatively few cases.Particularly at a time when our national capabilities for responsible priceand wage making may undergo a more serious test than in recent years,the most constructive private policy in the great majority of situationswould be to arrive at price decisions and wage bargains consistent withthe general guideposts.
Two other comments on the guideposts seem appropriate this year.First, it is not the purpose of these advisory policies permanently to freezethe labor and nonlabor shares of total industrial income, as would a rigorous,unrelieved application of the general guideposts. The 1962 Report noted
l i p
Digitized for FRASER http://fraser.stlouisfed.org/ Federal Reserve Bank of St. Louis
that "The proportions in which labor and nonlabor income shares theproduct of industry have not been immutable throughout history . . ."It went on to point out that bargaining over the shares is consistentwith the guideposts if it is conducted "within the bounds of noninflationaryprice behavior." Specifically, this means that it is consistent with the guide-posts for wage and profit shares to be bid up or down in a particular industryso long as price behavior in that industry remains consistent with the generalprice guidepost indicated above.
Second, it is appropriate to focus special attention this year on price reduc-tions. The guideposts call for reductions in those industries whose trendproductivity gains exceed the national trend. It is fair to say that largeindustrial enterprises thus far have not widely heeded this advice. And yet,as noted earlier, there will be ample room for such price reductions in 1964.If they are not forthcoming, over-all price stability will be rendered moredifficult, since price increases are likely in industries that are progressingat a less-than-average rate. Moreover, in industries whose trend of produc-tivity rises faster than the national average, if wages conform more nearlyto national than to industry productivity trends (as the guideposts wouldhave them do), failure to follow the general price guide will cause profits topile up. Such profits become highly visible to the public and constitutea lure for strongly intensified wage demands.
Such circumstances pose a most unattractive dilemma from theviewpoint of the public interest. On the one hand, extra increases inwages or fringe benefits might tend to spread to other industries, creating ageneral cost-push from the wage side. On the other hand, there is no justifi-cation, on either economic or equity grounds, for distributing above-averagegains in productivity exclusively through the profits channel. The real wayout of this dilemma is for the firms involved to remove its cause by reducingprices.
CONCLUSION
In 1964, a year of still ample unused resources and a year in which bothafter-tax profits and labor incomes promise to rise substantially, there is nooccasion for actions that result in substantial price increases. The public,quite properly, will be intolerant of any major businesses or unions whoseshort-sighted actions tend to set inflation in motion. To discharge its ownresponsibility, the Administration is taking steps to follow emerging priceand wage developments with great care and to assemble data that willilluminate the price- and wage-making situations in particular industries.It will not hesitate to call public attention to major private decisions—byeither business or labor—that seriously overstep noninflationary price andwage standards.
Certainly it is reasonable to hope, however, that such instances will berare and that 1964 will be recorded as another year when American privateprice and wage makers demonstrated their capacity for responsible action.
120
Digitized for FRASER http://fraser.stlouisfed.org/ Federal Reserve Bank of St. Louis
Chapter 5
The Balance of Payments and the InternationalMonetary System
A HE UNITED STATES occupies a unique position in the world econ-omy. It provides the largest national source of exports, the largest marketfor imports, and the largest source of savings for investment abroad. Itundertakes substantial military expenditures abroad and has a large foreignaid program. Its currency, the dollar, is widely used as a means of ex-change—in transactions among foreign countries as well as with the UnitedStates—and as a store of value in foreign private balances and officialmonetary reserves. As a consequence, U.S. economic policy, at home andabroad, has special importance to the rest of the world.
The diverse international transactions of the United States—as trader,as investor, and as banker—are summarized in the U.S. balance-of-pay-ments accounts. In recent years, the U.S. accounts have shown an unde-sirably large deficit, while other countries—especially in ContinentalWestern Europe—have had undesirably large surpluses. The first part ofthis chapter reviews recent developments in the U.S. balance of paymentsand discusses the policies—notably those included in President Kennedy'sJuly message—that have been adopted and have begun to improve ourinternational financial position.
A declining U.S. payments deficit will affect the functioning of theinternational monetary system, since this deficit has been a major sourceof growth in world monetary reserves. Moreover, the large volume of out-standing short-term liabilities to foreigners, if combined with continuedlarge U.S. deficits, could raise questions about the effective working andcontinued stability of the system. To examine this and related long-termquestions, the leading industrial countries have undertaken a study of theinternational monetary system. The problems with which that study is con-cerned are discussed in the second part of this chapter.
121
Digitized for FRASER http://fraser.stlouisfed.org/ Federal Reserve Bank of St. Louis
THE BALANCE OF PAYMENTS: DEVELOPMENTS, POLICIES,AND OUTLOOK
Between 1950 and 1957, the United States sold $2/2 billion of gold andincurred $8*/2 billion in liquid liabilities to foreigners. These transfersof gold and dollars, through payments deficits averaging $1.3 bil-lion a year, made a welcome contribution to replenishing the internationalmonetary reserves of other countries. Since 1957, however, the annualdeficits, before taking into account special governmental transac-tions, have been in the range of $3 to $4 billion, and the additions to thedollar reserves of some surplus countries in Western Europe have tended toexceed the amounts that those countries regard as necessary or desirable.In the 6 years since 1957, U.S. gold sales have amounted to about $7*/2 bil-lion—of which $5 billion occurred during the 3 years, 1958-60—and liquiddollar liabilities to foreigners have increased about $8^2 billion.
In these circumstances the United States has adopted policies designedto bring its external accounts into equilibrium, to minimize its loss of gold,and to protect the dollar from possible speculative attack. At the sametime domestic policies designed to achieve high employment and more rapideconomic growth have been framed with a view to reinforcing the specificbalance-of-payments measures.
THE NATURE OF THE BALANCE-OF-PAYMENTS PROBLEM
The U.S. balance-of-payments problem does not reflect any over-alltendency for the United States to "live beyond its means." Americanscollectively do not spend more than their real incomes permit and thereforedo not absorb goods and services, on balance, from the rest of the world.On the contrary, the United States earns a large surplus on commercialaccount—that is, its exports of goods and services exceed its imports. Thedeficit in its external accounts arises from the fact that the United Statestransfers abroad—through military expenditures, foreign assistance,and private capital movements—a sum of dollars larger than the surplus ongoods and services. This excess of dollar payments measures the "deficiton regular transactions." In recent years, as discussed below, the transferof gold and liquid dollar balances abroad has been less than the deficit onregular transactions, as the result of a number of special transactions under-taken in cooperation with European surplus countries.
The United States deficit does not reflect a reduction in net worth inrelation to the rest of the world. In fact, U.S. assets abroad—in the formof private equity investment, short- and long-term credits, and governmentloans—have in general been increasing faster than U.S. liabilities. The U.S.deficit does reflect a loss of liquidity in the form of a reduction in goldreserves and a build-up of liquid liabilities to foreigners. This way ofcharacterizing the imbalance in the U.S. payments position does not lessenthe urgency of correcting it.
122
Digitized for FRASER http://fraser.stlouisfed.org/ Federal Reserve Bank of St. Louis
As it takes steps to restore equilibrium in its external accounts, the UnitedStates must perforce be conscious of these major considerations:
1. Its actions to correct the balance-of-payments problem need to beconsistent with its domestic objectives; a healthy domestic economy is im-portant not only to Americans but also to the rest of the world.
2. The United States carries heavy responsibilities for the military securityand the economic development of the countries of the free world. Theseresponsibilities should not be compromised by measures taken to improveour payments position.
3. In adopting measures to cope with the balance of payments, the UnitedStates should avoid any lapse in the effort, in which other free worldcountries join, to reduce barriers to international transactions.
4. Finally, in formulating policies it must recognize that the severalcomponents of its balance of payments are interrelated. For example, areduction in capital outflows or foreign aid would reduce the deficit onlyto the extent that it did not also cause a fall in exports. Similarly, a re-duction (or slower increase) in imports would improve our payments posi-tion only to the extent that it did not cause other countries to buy less fromus.
RECENT DEVELOPMENTS IN THE BALANCE OF PAYMENTS
Trade, services, and Government items. In recent years the surplus oncommercial goods and services (Table 23, lines 1-6) has shown a gradualupward trend if allowance is made for the temporary bulge in thissurplus in 1961, when cyclical factors dampened the U.S. demand forimports. Commercial exports have risen at a moderate but fairly steadypace as rapid economic growth in Western Europe and Japan has providedexpanding markets, and our prices have remained relatively stable. At thesame time, dividends and interest on our investments and loans abroad1 havebeen a large and growing element in our surplus on goods and services.
Net U.S. military expenditures abroad, although large, have steadilydeclined (line 9) . The Department of Defense has increased its procure-ment in the United States of supplies for use abroad, despite the frequentlyhigher cost of such procurement. In addition, some U.S. allies haveagreed to purchase military supplies from the United States, offsetting allor part of U.S. dollar defense outlays within their borders.
The gross amount of U.S. Government economic aid programs has con-tinued to be sizable, but the dollar payments to foreigners and interna-tional institutions (line 10) resulting from these programs have been main-tained at a much lower level. More than two-thirds of current outlaysunder the aid program of the Agency for International Development (AID)directly finance U.S. exports and thus result in no direct dollar outflows.This proportion is over 80 percent on new commitments. Export programsadministered by the Department of Agriculture and loans by the Export-Import Bank involve no direct dollar outflow abroad.
123
715-113 O-64-9Digitized for FRASER http://fraser.stlouisfed.org/ Federal Reserve Bank of St. Louis
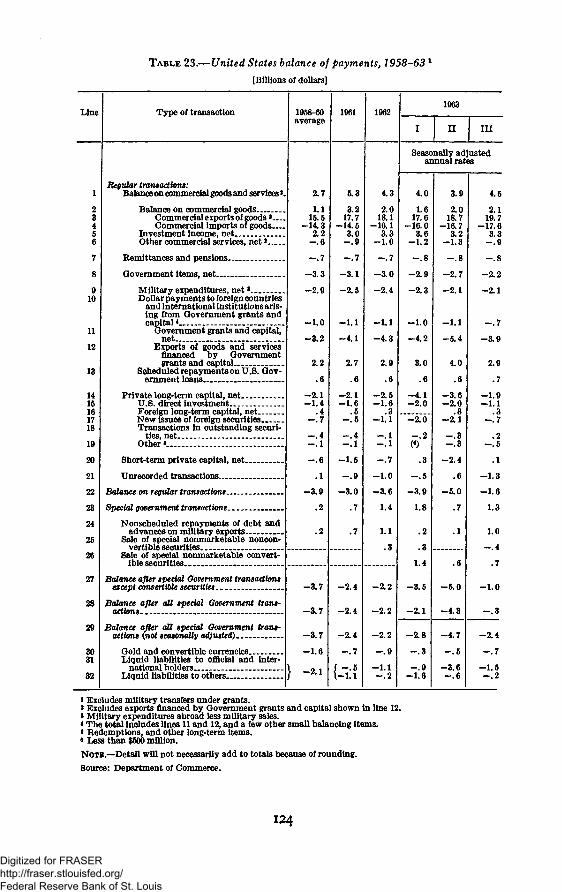
TABLE 23.—United States balance of payments, 1958-63 l
[Billions of dollars]
Line Type of transaction 1958-60average
1961 19621963
II I I I
11
12
13
1415161718
19
20
21
22
23
24
25
26
27
28
29
Regular transactions:Balance on commercial goods and services K
Balance on commercial goodsCommercial exports of goods «...Commercial imports of goods
Investment income, netOther commercial services, net*
Remittances and pensions
Government items, net
Military expenditures, net *Dollar payments to foreign countries
and international institutions aris-ing from Government grants andcapital* __.
Government grants and capital,net
Exports of goods and servicesfinanced by Governmentgrants and capital
Scheduled repayments on U.S. Gov-ernment loans
Private long-term capital, netU.S. direct investmentForeign long-term capital, netNew issues of foreign securitiesTransactions in outstanding securi-
ties, netOther*
2.7
1.115.5
-14.32.2
- . 7
-3.3
-2.9
-1.0
-3.2
2.2
.6
- 2 . 1- 1
5.3
3.217.7
-14.5
- . 7
-3.1
-2.5
-1.1
-4.1
2.7
-2.1-1.6
.5
Short-term private capital, net-
Unrecorded transactions
Balance on regular transactions
Special government transactions
Nonscheduled repayments of debt andadvances on military exports
Sale of special nonmarketable noncon-vertible securities
Sale of special nonmarketable convert-ible securities •
.1
-3.9
.2
.2
- . 5
- . 4- . 1
-1.6
- . 9
-3.0
.7
.7
4.3
2.018.1
-16.13.3
-1.0
- . 7
-3.0
-2.4
-1.1
-4.3
2.9
-2.5-1.6
.3-1 .1
- . 1- . 1
- . 7
-1.0
-3.6
1.4
1.1
.3
Balance after special Government transactionsexcept convertible securities_ -
Balance after all special Government trans-actions-.
Balance after all special Government trans-actions (not seasonally adjusted).
Gold and convertible currenciesLiquid liabilities to official and inter-
national holdersLiquid liabilities to others
-3.7
-3.7
-3.7
-1.6
-2.1
-2.4
-2.4
-2.4
- . 7
US
-2.2
-2.2
-2.2
-1.1- . 2
Seasonally adjustedannual rates
4.0
1.617.6
-16.03.6
-1.2
- . 8
-2.9
-2.3
-1.0
-4.2
3.0
-4.1-2.0
-2.0
- . 2
.3
- . 5
-3.9
1.8
.2
.3
1.4
-3.5
-2.1
-2.8o
- . 9-1.6
3.9
2.018.7
-16.73.2
-1.3
- . 8
-2.7
-2.1
-1.1
-5.4
4.0
.6
-3.6-2.0
.8-2.1
- . 3- . 3
-2.4
.6
-5.0
.7
.1
-5.0
-4.3
-4.7
- . 5
-3.6
4.52.1
19.7-17.6
3.3- . 9
-2.2
-2.1
- . 7
-3.9
2.9
.7
-1.9-1.1
.3- . 7
.2- . 5
.1
-1.3
-1.6
1.3
1.0
- . 4
.7
-1.0
- . 3
-2.4
- . 7
-1.5- . 2
i Excludes military transfers under grants.* Excludes exports financed by Government grants and capital shown in line 12.» Military expenditures abroad less military sales.« The total includes lines 11 and 12, and a few other small balancing items.» Redemptions, and other long-term items.« Less than $500 million.NOTE.—Detail will not necessarily add to totals because of rounding.Source: Department of Commerce.
124
Digitized for FRASER http://fraser.stlouisfed.org/ Federal Reserve Bank of St. Louis
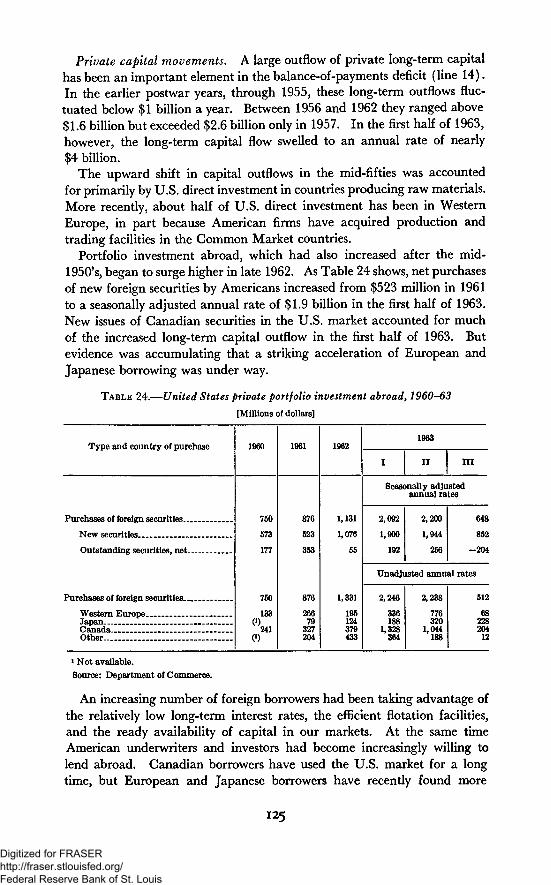
Private capital movements. A large outflow of private long-term capitalhas been an important element in the balance-of-payments deficit (line 14).In the earlier postwar years, through 1955, these long-term outflows fluc-tuated below $1 billion a year. Between 1956 and 1962 they ranged above$1.6 billion but exceeded $2.6 billion only in 1957. In the first half of 1963,however, the long-term capital flow swelled to an annual rate of nearly$4 billion.
The upward shift in capital outflows in the mid-fifties was accountedfor primarily by U.S. direct investment in countries producing raw materials.More recently, about half of U.S. direct investment has been in WesternEurope, in part because American firms have acquired production andtrading facilities in the Common Market countries.
Portfolio investment abroad, which had also increased after the mid-1950's, began to surge higher in late 1962. As Table 24 shows, net purchasesof new foreign securities by Americans increased from $523 million in 1961to a seasonally adjusted annual rate of $1.9 billion in the first half of 1963.New issues of Canadian securities in the U.S. market accounted for muchof the increased long-term capital outflow in the first half of 1963. Butevidence was accumulating that a striking acceleration of European andJapanese borrowing was under way.
TABLE 24.—United States private portfolio investment abroad, 1960-63
[Millions of dollars]
Type and country of purchase
Purchases of foreign securities
New securities
Outstanding securities, net ___
Purchases of foreign securities
Western Europe -Japan .Canada » _ . >Other
1960
750
573
177
750
133( l )
2410)
1961
876
523
353
876
26679
327204
1962
1,131
1,076
55
1,331
195124379433
1963
I II in
Seasonally adjustedannual rates
2,092
1,900
192
2,200
1,944
256
648
852
-204
Unadjusted annual rates
2,246
336188
1,328364
2,238
776320
1,044188
512
6822820412
i Not available.Source: Department of Commerce.
An increasing number of foreign borrowers had been taking advantage ofthe relatively low long-term interest rates, the efficient flotation facilities,and the ready availability of capital in our markets. At the same timeAmerican underwriters and investors had become increasingly willing tolend abroad. Canadian borrowers have used the U.S. market for a longtime, but European and Japanese borrowers have recently found more
125
Digitized for FRASER http://fraser.stlouisfed.org/ Federal Reserve Bank of St. Louis
ready acceptance. In many instances these borrowings were not relatedto any financing of imports from the United States nor even to anyparticular need for foreign exchange. For example, the proceeds of somesubstantial dollar bond issues have been used to finance the purchase ofalready existing domestic facilities in the borrowing countries.
Private short-term capital flows (Table 23, line 20) have been moreerratic in their effect on the payments balance. They increased abruptly inthe latter half of I960, and, though the flow decreased thereafter, itremained large in 1961 and rose again in the second quarter of 1963. Asubstantial part of the recorded outflow in 1960 was a movement of fundsinto higher-yielding short-term investments abroad. Since that time,monetary policy and debt management actions have been used to influencethe level of short-term rates in the United States in order to bring yields onshort-term assets here into closer alignment with those abroad.
U.S. bank loans and acceptance credits to foreigners appear to explain agreater proportion of changes in total recorded short-term flows than domovements of funds into and out of liquid assets abroad. In particular, ac-ceptance credits to Japan were large in 1960 and 1961. After the first quar-ter of 1962 short-term credits to foreigners by U.S. banks remained at amoderate level until the spring of 1963, when Japan again borrowed heavily.At that time there was also a renewal of the flow of U.S. funds into moneymarket assets and bank deposits abroad.
Unrecorded transactions (line 21)—thought to contain a large elementof Short-term capital—also contributed to a sizable outflow in 1961 and1962, but moved in opposite directions to the recorded short-term flows in1963.
The deficit before and after special transactions. The net outcome of theflows of funds related to exports, imports, Government outlays, and privatecapital movements was a deficit on regular transactions ranging between$3 and $4 billion in recent years. This deficit contracted temporarily in1961, owing to cyclical factors, and increased again in late 1962. In the firsthalf of 1963, as the result mainly of private capital outflows, the deficit in-creased sharply, to $3.9 billion in the first quarter and $5.0 billion in thesecond quarter, at seasonally adjusted annual rates.
The "balance on regular transactions" measures the outcome of our ex-ternal transactions before taking account of special governmental transac-tions with some of the surplus countries. These special transactions have in-cluded prepayments on Marshall Plan and Export-Import Bank loansand advance payments by our allies for future delivery of military items.Beginning in the fourth quarter of 1962, the Treasury arranged to sell specialnonmarketable, medium-term securities to foreign monetary authorities.Some of these securities are denominated in dollars, but most of them aredenominated in the currency of the purchasing country. More recently, aconvertibility feature was added, so that the foreign monetary authority mayredeem them for short-term claims prior to their stated maturity. This pro-
126
Digitized for FRASER http://fraser.stlouisfed.org/ Federal Reserve Bank of St. Louis
vision was intended to satisfy legal and traditional requirements governingthe liquidity of the instruments that certain foreign central banks may holdas a component of their monetary reserves. The official balance-of-payments statistics of the United States now present the balance-of-payments position before and after inclusion of these special transactions(lines 22-29).
POLICIES TO IMPROVE THE BALANCE OF PAYMENTS
President Kennedy's balance-of-payments message in July announcedcertain new policies together with an intensification of other policies thathad constituted the earlier balance-of-payments program of the UnitedStates.
The program before 1963. The Federal Government has given firstpriority to reducing its own direct contribution to the deficit. Thus effortshave been made to reduce and offset military outlays abroad, to minimizethe dollar drain associated with aid programs, and in general to scrutinizeall Federal transactions affecting the balance of payments.
The effort to improve the commercial balance on goods and services hasincluded export promotion measures and a new program of export creditinsurance and guarantees. The wage-price policies described in the pre-vious chapter—desirable in any event for domestic reasons—have taken onadditional urgency because of the necessity to maintain and improve theU.S. competitive position both at home and in other markets.
The Revenue Act of 1962 removed artificial tax inducements to invest-ment in developed countries by effectively neutralizing the so-called "taxhaven" form of operation.
The Federal Reserve and the Treasury have for some time been workingto maintain a level of short-term interest rates high enough to discourageoutflows of short-term capital while, at the same time, encouraging domesticcredit availability and a level of long-term interest rates conducive toeconomic expansion.
These measures to reduce the deficit were complemented by a series ofother arrangements designed to prevent or correct temporary disturbances inforeign exchange markets, as described in the second part of this chapter.These arrangements have been extremely helpful in stopping or smoothingthe effects of sudden and presumably reversible flows of funds, and in cush-ioning the impact of such potentially unsettling developments as the Berlincrisis, the revaluation of the mark and guilder in 1961, the stockmarketbreak of 1962, the Cuban crisis, and the assassination of President Kennedy.
Special government transactions and intergovernmental cooperation instabilizing foreign exchange and gold markets have, in addition to theirother benefits, provided major assistance in reducing incentives for the con-version of foreign-held dollar liabilities into gold. The gold outflow duringthe past three years has been cut to somewhat less than half of its total in thepreceding three years.
127
Digitized for FRASER http://fraser.stlouisfed.org/ Federal Reserve Bank of St. Louis
Progress made in reducing the U.S. deficit during 1961 and the first halfof 1962 aroused hopes that the U.S. payments problem was on its waytoward solution. But the worsening of the deficit at the end of 1962 andthe subsequent further deterioration during the first half of 1963—mainlyas a result of enlarged short- and long-term capital outflows—interruptedthis progress and indicated that further actions were necessary.
The President's July balance-of-payments program. After intensive dis-cussion within the Government, a series of new and expanded measureswas taken in July to deal with the balance-of-payments problem.
On July 16 the Federal Reserve announced an increase in the discountrate from 3 to Zl/2 percent. The Federal Reserve also raised interest rateceilings on time deposits payable in 90 days to 1 year, as did the FederalDeposit Insurance Corporation, thus enabling U.S. commercial banks tocompete more effectively with foreign banks for funds that might otherwisebe placed abroad.
On July 18 President Kennedy sent to the Congress a special messagethat announced a program of companion measures. These included:
1. A proposal for the enactment of an Interest Equalization Tax (IET)to be made generally effective as of the day following the message. Thismeasure, an excise tax on American purchases of new or outstanding foreignstocks and bonds, was designed to impose on foreign sellers the equivalentof 1 percentage point of additional interest cost.
2. Further "tying" of foreign aid to U.S. exports to reduce the dollar out-flow directly attributable to the program of the AID to $500 million byfiscal year 1965 (from $1 billion in fiscal 1961).
3. Important further reductions in overseas military expenditures toreduce the dollar drain on this account by approximately $300 million.
4. A further reduction of $200 million in purchases of strategic materialsabroad and another $100 million in other Government programs.
5. An intensified effort to expand exports, a "See America Now" programto encourage both Americans and foreigners to travel in this country, anda new effort to encourage foreigners to buy U.S. private securities.
6. An additional measure, designed not to reduce the deficit but to lessenforeign purchases of gold and to strengthen the dollar in foreign exchangemarkets, was a $500 million U.S. stand-by drawing, or line of credit, fromthe International Monetary Fund (IMF). This became desirable because,under its rules, the IMF could no longer accept additional dollars fromcountries other than the United States. Thus other countries that wishedto use some of their current dollar holdings for making repayments to theFund were about to be forced, instead, either to buy gold from the UnitedStates or to sell dollars for other currencies in the foreign exchange marketsin order to get means of repayment acceptable to the Fund. With thestand-by arrangement, the United States is in a position to draw othercurrencies, which it can sell, for dollars, to the countries needing them forrepayment. This stand-by arrangement also has broader significance as
X28
Digitized for FRASER http://fraser.stlouisfed.org/ Federal Reserve Bank of St. Louis
a visible indication that the United States is prepared to make appropriateuse of the resources of the Fund.
The President emphasized in his message that this series of immediateand specialized efforts, which would reduce the deficit by about $2 billionwhen fully effective, would provide the time needed for achievement of thebasic long-term program of improving the U.S. competitive position andincreasing the attractiveness of investment in the United States. The taxreduction bill and continuation of price-cost stability were essential aspectsof the long-term program.
Meanwhile the immediate steps taken in July were designed to be con-sistent with acceleration of domestic economic expansion. Thus increasesin interest rates were to be confined largely to the short-term sector of themarket, while the proposed IET would raise the cost of capital to foreignborrowers without increasing the domestic cost of long-term funds.
Achievement of equilibrum through expanding exports and increasingincentives for capital to remain at home will permit the United Statesgradually to remove the temporary measures it has been forced to applyin the past few years. The goal of the United States is to be able to untieits aid program, just as it now urges other countries with payments sur-pluses to untie theirs. The IET was proposed to retard temporarily, notpermanently, the outflow of U.S. capital. The stiffer "Buy American"policies for U.S. procurement—adopted for balance-of-payments reasons—can be relaxed when equilibrium is restored.
Developments subsequent to the July program. The balance-of-paymentsdeficit on regular transactions dropped from a seasonally adjusted annualrate of $5.0 billion in the second quarter to $1.6 billion in the third quar-ter—a reduction of about two-thirds—while the balance after special gov-ernment transactions was even lower as a result mainly of advance debtrepayments by France and the Netherlands.
It is, of course, too early to be able to evaluate the full effects ofthe July measures, but they clearly played a major role in thismarked improvement. There was a substantial reduction in the thirdquarter in the outflow of U.S. portfolio capital, mainly in purchases ofnew issues of foreign securities. Virtually the only new foreign securitiessold in the United States in the third quarter were those arranged for priorto July 18 and hence not affected by the tax proposal.
The proposed IET legislation would not apply to borrowers in lessdeveloped countries and would allow limited or full exemption of newissues of particular countries if necessary to avoid imperiling the stabilityof the international monetary system. The Administration has announcedits intention of allowing a new-issue exemption for Canada and believesthat this can be done without adverse effects on the United States. Inconnection with this exemption, Canadian authorities have agreed that itis not the intention of Canada to increase foreign exchange reserves
129
Digitized for FRASER http://fraser.stlouisfed.org/ Federal Reserve Bank of St. Louis
through the proceeds of borrowing in the United States, with the implicationthat borrowing would be restored to the more normal levels of earlier years.
Following passage of the proposed IET, some portfolio capital will con-tinue to flow abroad, both to exempt nations and to borrowers willing tobear the tax. But total outflows are likely to continue to be sharply cur-tailed. The President's message anticipated that this tax would remain ineffect only through 1965, when improvement in the U.S. balance of pay-ments and a strengthening and freeing of the capital markets of othermajor countries are expected to permit its abandonment.
A reversal in recorded short-term capital flows also contributed to the sub-stantial reduction in the payments deficit in the third quarter. In part, theshift reflected a cessation of the heavy lending in the form of bank loans andacceptance credits that had occurred in the preceding quarter. But follow-ing the increase in short-term interest rates—rates on 3-month Treasurybills rose from 2.99 percent on the average in June to 3.38 percent in Sep-tember—there was a net movement of short-term funds back to the UnitedStates as reported by both banks and nonfinancial concerns.
At the same time, the balance on commercial goods and services alsocontinued to improve and contributed to the reduction in the deficit onregular transactions.
Preliminary information concerning the fourth quarter indicates that thedeficit on regular transactions may have turned out to be of about the sameorder of magnitude as in the third quarter.
THE OUTLOOK FOR THE BALANCE OF PAYMENTS
The U.S. payments position can be expected to benefit from the proposedgeneral reduction of individual and corporate income taxes, as from theeffects of the investment tax credit in the Revenue Act of 1962 and thedepreciation changes of that year. Although accelerated economic expan-sion in the United States will bring a faster rise of imports, an offsettingbeneficial effect on capital flows and favorable effects on productivity andthe competitiveness of U.S. exports may also be expected. Improved profitopportunities resulting from a more vigorous economy and fuller use ofcapacity should reduce the net outflow of capital by encouraging domesticinvestment by Americans and by attracting more foreign capital to theUnited States. While corporations will have an enlarged volume of re-tained earnings, they will be confronted with an even greater increase inprofitable domestic uses for funds.
Success in bringing U.S. external payments into equilibrium will alsodepend, however, on developments and policies abroad. Not only willsustained economic expansion in the leading industrial countries benefittheir own citizens and the economies of the less developed countries, butalso it is important for the continuing expansion of U.S. exports.
The Brookings report. In the spring of 1962 a group of economists atthe Brookings Institution undertook a comprehensive study, The U.S.Balance of Payments in 1968, at the request of the Council of Economic Ad-
130
Digitized for FRASER http://fraser.stlouisfed.org/ Federal Reserve Bank of St. Louis
visers, the Treasury, and the Bureau of the Budget. The authors were askedto assess the effects on the U.S. balance of payments of a sustained expansionof the U.S. economy which, after the unemployment rate was reduced to 4percent, would proceed at an annual rate of 4 percent and later accelerateto 4% percent a year. The Council provided the Brookings group with aset of initial assumptions regarding growth and prices in the United Statesand with guidance concerning the assumptions about Western Europe.The group also calculated projections based on alternative assumptionsof its own.
The Brookings group analyzed the relationships of changes in importsand exports to expansion in GNP, given assumptions about costs and prices.From these analyses, projections were derived of the U.S. "basic balance,"i.e., the balance on goods and services, government items, and long-termcapital (and exclusive of short-term capital flows, unrecorded transactions,and special government transactions) in 1968. These projections indicatedthat the United States in 1968 would have a "basic" surplus ($1.9 billion)on the initial assumptions, or a modest deficit ($600 million) on the al-ternative assumptions, compared with the basic deficit of $2.1 billion in1962.
A principal factor in the projected improvement in the U.S. paymentsbalance was the assumption that the United States would be better ableto maintain internal cost and price stability than the countries of Europe,where slower growth of a fully employed labor force was expected to resultin greater upward pressure on money wage rates.
As the previous chapter has indicated, the recent cost and price record ofthe United States is quite good: wholesale prices have not increased since1958, and this has undoubtedly helped to maintain our export surplus duringthe current expansion period despite a cyclical increase in imports. How-ever, the United States must continue to maintain price stability and topursue other measures directed at improving the balance of payments.
Prices and costs in the United States and abroad. The international com-petitive position of any country is determined by many factors besides themovement of its prices relative to prices in other countries. But relativeprices are, of course, an important influence. Chart 12 presents themovements of prices and unit labor costs for a number of industrial coun-tries, after allowing for adjustments in exchange rates. The first panelshows that while the average of U.S. wholesale prices remained stable be-tween 1958 and 1963, French and Canadian prices, expressed in U.S. dol-lars, were lower in 1963 than in 1958 (both countries having undertakenexchange rate depreciations in the period). But prices in all the othercountries were higher (in the case of Germany, reflecting, in part, the ex-change rate appreciation of 1961).
The picture presented by relative changes in wholesale prices is supple-mented in the lower panel by a comparison of movements in labor costs perunit of output in manufacturing (again adjusted for exchange rate varia-
Digitized for FRASER http://fraser.stlouisfed.org/ Federal Reserve Bank of St. Louis
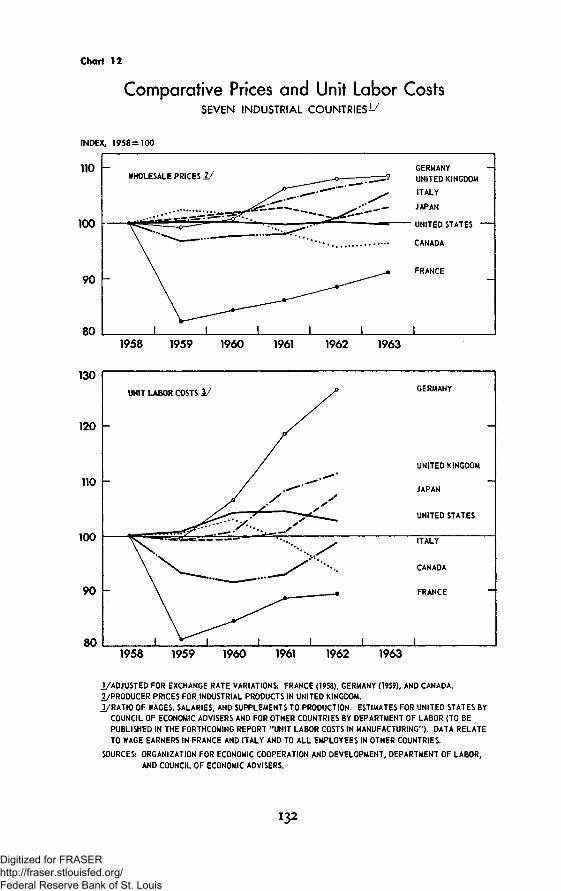
Chart 12
Comparative Prices and Unit Labor CostsSEVEN INDUSTRIAL COUNTRIES^
INDEX, 1958=100
110
100
90
80
WHOLESALE PRICES 1 /
I I
GERMANY
UNITED KINGDOM
ITALY
JAPAN
• UNITED STATES -
CANADA
FRANCE
1958 1959 1960 1961 1962 1963
130
120
UNIT LABOR COSTS 1 /
_L
GERMANY
UNITED KINGDOM
JAPAN
UNITED STATES
ITALY
CANADA
FRANCE
1958 1959 1960 1961 1962 1963
i/ADJUSTED FOR EXCHANGE RATE VARIATIONS: FRANCE (1958), GERMANY (1959), AND CANADA.I/PRODUCER PRICES FOR INDUSTRIAL PRODUCTS IN UNITED KINGDOM.i /RATIO OF WAGES, SALARIES, AND SUPPLEMENTS TO PRODUCTION. ESTIMATES FOR UNITED STATES BY
COUNCIL OF ECONOMIC ADVISERS AND FOR OTHER COUNTRIES BY DEPARTMENT OF LABOR (TO BEPUBLISHED IN THE FORTHCOMING REPORT "UNIT LABOR COSTS IN MANUFACTURING"). DATA RELATETO WAGE EARNERS IN FRANCE AND ITALY AND TO ALL EMPLOYEES IN OTHER COUNTRIES.
SOURCES: ORGANIZATION FOR ECONOMIC COOPERATION AND DEVELOPMENT, DEPARTMENT OF LABOR,AND COUNCIL OF ECONOMIC ADVISERS.
132
Digitized for FRASER http://fraser.stlouisfed.org/ Federal Reserve Bank of St. Louis
tion). The 1962 positions of the several countries in the two rankings arealmost identical.
Naturally, such over-all calculations obscure much relevant detail. Notall goods enter into foreign trade, and prices and costs of those importantfor trade may move quite differently from the over-all average (as shownin Table 21, Chapter 4) . Yet prices and costs of domestically produced,import-competing commodities are likely to be closely related to the generalindexes, and the competitive position of exports is unlikely to resist forvery long the basic economic forces at work in any economy.
Policies to curb inflation abroad. As was pointed out in Chapter 4,European policies are being adapted to counteract upward price pres-sures. The United States has no reason to expect surplus countries toaccept inflation, just as they have no reason to expect the United States toaccept unemployment and unused capacity because of its payments deficit.
In dealing with these domestic problems, the countries of the Organizationfor Economic Cooperation and Development (OECD) have been strivingto develop general principles of cooperative behavior for surplus and deficitcountries, as described in the second part of this chapter. All countriesshould be aware of the undesirability of initiating a chain of com-petitive upward movements in interest rates such as would occur if surpluscountries—in their efforts to stop advancing prices—took monetary actionsthat attracted large amounts of capital from deficit countries.
Trade policies. Relative costs and prices will play an even more signifi-cant role in the pattern of world commerce if negotiations under the TradeExpansion Act of 1962, now about to enter the formal stage, are successfulin reducing tariffs and other barriers to trade. This is a major objective ofU.S. policy for a host of reasons, both political and economic. One signifi-cant outcome of successful negotiations would be to prevent an increase indiscrimination against both agricultural and nonagricultural imports by theEuropean Economic Community as intra-Community trade barriers con-tinue to come down.
More broadly, there is much to be gained, by both industrial and develop-ing countries, from a progressive reduction not only in tariffs but in otherbarriers to international trade. The United States has a strong interest ina lowering of such barriers, quite apart from balance-of-paymentsconsiderations.
THE FUTURE OF THE INTERNATIONAL MONETARY SYSTEM
The leading industrial countries—known as the "Group of Ten"—agreedin October 1963 to undertake a study of the international monetary system—the set of mutual understandings, commitments, and institutional arrange-ments under which international trade and payments are now conducted. Acommunique was issued on October 2, 1963, by the Finance Ministers andCentral Bank Governors of the 10 countries: Belgium, Canada, France,
133
Digitized for FRASER http://fraser.stlouisfed.org/ Federal Reserve Bank of St. Louis
Germany, Italy, Japan, the Netherlands, Sweden, the United Kingdom,and the United States. It stated in part:
In reviewing the longer-run prospects, the Ministers and Governors agreedthat the underlying structure of the present monetary system—based on fixedexchange rates and the established price of gold—has proven its value as thefoundation for present and future arrangements. It appeared to them, however,to be useful to undertake a thorough examination of the outlook for the function-ing of the international monetary system and of its probable future needs forliquidity. This examination should be made with particular emphasis on thepossible magnitude and nature of the future needs for reserves and for supple-mentary credit facilities which may arise within the framework of nationaleconomic policies effectively aiming at the objectives of [high levels of economicactivity with a sustainable rate of economic growth and in a climate of pricestability]. The studies should also appraise and evaluate various possibilitiesfor covering such needs.
This examination, and a similar study by the International MonetaryFund, necessarily involves a careful appraisal of how well the existingsystem advances the basic economic objectives shared by the participatingcountries. How, and how effectively, do present arrangements operateto minimize imbalances in international payments and to finance thosethat inevitably arise? How resistant is the system to shocks arising fromunexpected political or economic events? Can it support a steady increase inworld trade and production? The Group of Ten and the IMF will attemptto answer questions like these and review various proposals for modifyingthe international monetary system.
It would be neither appropriate nor fruitful to try to anticipate here theoutcome of the studies now under way. But this section of the Report doesprovide a background to these studies by (1) suggesting the basic economicobjectives to be served by the international monetary system, (2) describingbriefly the international monetary system as it evolved at Bretton Woods andhas been strengthened more recently, (3) discussing some of the actual orpotential shortcomings of the existing system, and (4) summarizing some ofthe proposals for its modification, ranging from a further strengthening ofexisting arrangements to a major overhaul.
These discussions in the Group of Ten will focus on relationshipsamong the leading industrial countries. These are the countries thathold most of the world's reserves and whose payments problems can beserious enough to have a significant impact on the functioning of the wholeinternational monetary machinery. But this does not mean that the rest ofthe world is unaffected by these monetary arrangements. On the contrary,the less developed countries have a vital stake in a monetary system thatfosters steady growth in world trade and payments.
OBJECTIVES TO BE SERVED
A properly functioning international payments system, like any monetaryor financial arrangement, must be judged by its contribution to the basiceconomic objectives shared by all countries. These include: (1) full
134
Digitized for FRASER http://fraser.stlouisfed.org/ Federal Reserve Bank of St. Louis
employment, (2) a satisfactory rate of economic growth, (3) mutuallybeneficial trade that reflects and contributes to efficient international allo-cation of resources through freedom of international transactions, and (4)reasonable stability of prices.
In a world economy where technology is advancing, living standards arerising, and tastes are subject to change—and from which the business cyclehas not been banished—it is inevitable that the external accounts of individ-ual countries will, from time to time, develop surpluses and deficits of vary-ing size and duration. If the monetary reserves available to finance theseimbalances are too small or the credit facilities too limited, deficit countriesmay have to adopt monetary, fiscal, and. trade policies that depresseconomic activity both in their own economies and elsewhere. On the otherhand, if the funds available to finance imbalances are too large, deficit coun-tries may make excessive claims on, and may even impose inflationary pres-sures on, their trading partners—when, instead, they should be adoptingpolicies to restore equilibrium in their payments balances.
Along with the inevitable swings in payments positions, there are occa-sional economic and political shocks to which the international system issubject. Unless it is able to adjust smoothly to such disturbances, the result-ing instability in foreign exchange markets is likely to disrupt the normalflow of trade and payments.
What is sought ideally is an international monetary system that facili-tates attainment of all the economic objectives listed above, imposingneither inflation nor deflation, encouraging freedom of international trans-actions, and not giving way to disruptive instability when subjected to shock.Discipline to correct imbalances, whether surpluses or deficits, is necessary;but that discipline should exert its influence toward adoption of policies thatexpand rather than restrict real income, emancipate rather than shackleinternational trade, encourage rather than impede the flow of productivecapital.
THE PRESENT SYSTEM
Present international monetary arrangements have resulted partly fromdesign and partly from the unplanned evolution of private and officialpractices in international trade and payments. The basic principles gov-erning the existing international monetary system, laid down some 20 yearsago at the Bretton Woods Conference, call for the elimination of directcontrols over foreign exchange transactions and, consequently, free con-vertibility of one currency into another—at exchange rates that fluctuatenot more than 1 percent in either direction from declared parities. Theseexchange-rate parities are subject to adjustment only at times of "funda-mental disequilibrium" in the international payments positions of indi-vidual countries.
International reserves. Countries need international monetary reservesto support the market value of their currencies within 1 percent of parity.More broadly, they need reserves to meet possible shortfalls between
135
Digitized for FRASER http://fraser.stlouisfed.org/ Federal Reserve Bank of St. Louis
receipts and payments that may arise for a variety of reasons and may persistover periods ranging from one season to several years. These reserves areheld in the form of gold and foreign exchange (other national currencies).Actually only two national currencies—the dollar and the pound sterling—-serve to an important extent as monetary reserves for other countries. Andof these two, in recent years the dollar has been the principal reservecurrency.
A reserve currency country acts in effect as a banker to other countries.Foreign-held short-term claims denominated in dollars—liabilities of theUnited States Government or U.S. financial institutions—constitute inter-national money. Dollars and sterling are used as an international mediumof exchange—much of world trade is transacted in these currencies—and asa store of value for balances of foreign monetary authorities and foreignprivate institutions, businesses, and individuals.
In addition, the dollar plays a unique role as the currency unifying foreignexchange markets. Other countries, including the United Kingdom, main-tain their exchange rates within 1 percent of their declared par values, asrequired by the Articles of Agreement of the International Monetary Fund,by buying or selling dollars in exchange for their own currencies. TheUnited States, while it also chooses on occasion to buy and sell foreign cur-rencies for this purpose, meets its basic commitment to maintain the valueof the dollar in world markets by undertaking to buy gold from, or sell itto, foreign monetary authorities at a fixed price—$35 an ounce.
The reserve currency system, linked to gold through the dollar, was notcreated by a specific agreement. Rather it evolved from the use first ofsterling, then of the dollar as important trading currencies; as currenciesin which short- and long-term loans could be arranged; and as universallyacceptable currencies in which reserves could be safely, conveniently, andprofitably invested by both private and official holders.
Its pre-eminence as an industrial country and the strength of its financialstructure make the United States attractive to other countries as a place inwhich to hold liquid balances—and hence account for its role as banker tothe rest of the world. But this countiy also engages in wide-ranging activi-ties as a trader and investor and is responsible for much of the free world'seconomic and military assistance programs. Its transactions with the restof the world represent a commingling of its trading, investing, and foreignassistance activities with its banking activities.
Just as the successful operation of a bank depends on the continuing con-fidence of depositors that their claims on the bank will be freely usable andwill not lose their value, the viability of the present reserve currency systemdepends on the confidence of foreign holders, both official and private, thattheir dollar claims will not lose value for any type of use.
Everyone agrees that a bank must be subject to special limitations anddisciplines for the protection of its depositors and, indeed, of the whole com-munity. Similarly the system that makes the United States an interna-
136
Digitized for FRASER http://fraser.stlouisfed.org/ Federal Reserve Bank of St. Louis
tional bank imposes special responsibilities. Unless this country pursuespolicies that encourage confidence in the continued stability of the dollar,the entire international monetary system will become vulnerable to instabil-ity or even breakdown. This responsibility imposes limits on the policies,both domestic and international, that the United States, as a reserve cur-rency country, may pursue. It is equally clear, however, that other coun-tries, in. their own self-interest, share this responsibility for maintaining aviable international payments system.
When the United States has a deficit in its balance of payments, thecorresponding surpluses of other countries accrue largely in their officialholdings of dollars—usually in the form of deposits in United States banks orholdings of United States Government securities. To the extent that othercountries continue to hold these liquid dollar assets instead of using them topurchase gold from the United States, total world reserves are larger. Ifinstead they buy gold, U.S. reserves go down by the amount that the reservesof others rise.
Just as a deficit in the United States balance of payments may expandworld reserves, a surplus in its balance of payments may reduce them. Thiswould happen to the extent that countries with deficits (corresponding tothe U.S. surplus) financed them by drawing down their holdings of dollarassets. This would reduce their reserves without expanding those of theUnited States. If, on the other hand, deficit countries sold gold to theU.S., total world reserves would not be diminished, although there would,of course, be a shift of reserves from the rest of the world to this country.And, if we were to accumulate the currencies of deficit countries as partof our reserves, a U.S. surplus would not contract total world reserves,but rather would expand them. Such a development would, in effect,convert other currencies into a limited form of reserve currency.
It should also be noted that, under the existing system, the volume ofworld reserves can be affected by shifts in surpluses and deficits among othercountries, even though the U.S. balance-of-payments position remains un-changed. Other countries hold differing proportions of gold and dollarsin their official monetary reserves. If a country that holds a relatively highproportion of its reserves in dollars has a deficit and transfers dollars to asurplus country whose practice is to hold relatively fewer dollars and moregold, the second country is likely to use a good part of its dollar accruals tobuy gold from the United States. The result is a reduction in world mone-tary reserves, for the United States loses gold without gaining other re-serves and the total reserves of the rest of the world remain unchanged.
Role of the IMF. The International Monetary Fund stands at the cen-ter of the present international system as a source of financing for temporarybalance-of-payments deficits and as an influence toward freer internationaltransactions.
Digitized for FRASER http://fraser.stlouisfed.org/ Federal Reserve Bank of St. Louis
The Fund's resources are derived from subscriptions, equal in each caseto the "quota" assigned to the member country. These subscriptions werepaid, in most cases, one-fourth in gold and three-fourths in the membercountry's own currency. The total resources of the Fund amount to $15.8billion, including $2.3 billion in gold, $3.1 billion in dollars, and $3.5 billionin the currencies of other members of the Group of Ten.
The amount that each member can borrow from the IMF is related to itsquota, the first 25 percent of which (the so-called "gold tranche") can beused virtually on demand. Under present Fund policies, further borrow-ing is increasingly conditional upon adoption by the member country ofpolicies to eliminate the causes of the deficit. The total amount of Funddrawings that can be outstanding at any one time is considerably less thanthe total of its resources. This is so because, if the IMF is to make a netcontribution to financing imbalances, the funds it makes available mustordinarily be in the currencies of surplus countries. As a supplement to theFund's regular resources, there is a special arrangement under which theGroup of Ten countries, including the United States, have agreed to lend upto $6 billion of added resources to the Fund in case of need.
Additional bulwarks. The reserve currency system has been buttressedin other ways in recent years. These arrangements, like the special IMFborrowing agreement, represent cooperative action by governments andcentral banks to make the system less vulnerable to instability resulting fromspeculative activity in foreign exchange and gold markets.
Central banks of many of the leading industrial countries^ have cooperatedwith the Federal Reserve System in the past 3 years in developing currency"swap arrangements," which provide for reciprocal deposit balances to bedrawn as needed to help stabilize foreign exchange markets. The U.S.Treasury, also in cooperation with foreign monetary authorities, has engagedin both spot and forward exchange operations for the same purposes. An in-formal pooling arrangement has succeeded in reducing the destabilizingeffect of speculative activity in the London gold market. A number of thecentral banks that are membrs of the Bank for International Settlementshave entered into special ad hoc lending arrangements to help each other attimes of special need.
As was mentioned earlier, cooperation has likewise been stronglyevident in the willingness of various European surplus countries to prepaydebts to the United States, to purchase and make advance payments formilitary supplies, and to buy special nonmarketable, medium-term securitiesfrom the U.S. Treasury.
ACTUAL OR POTENTIAL SHORTCOMINGS OF THE SYSTEM
Within the framework described above, the world economy has enjoyedimpressive growth in the postwar era, and international trade has flourished.Nevertheless, private and official observers of the international mone-
138
Digitized for FRASER http://fraser.stlouisfed.org/ Federal Reserve Bank of St. Louis
tary system have raised questions concerning: (1) the weaknesses in theexisting adjustment process for restoring balance-of-payments equilibrium,(2) the potential instability associated with the large and growing volumeof short-term claims against the United States, and (3) the means of pro-viding for long-term growth of world reserves.
Weaknesses in the adjustment process* Under the textbook version ofthe 19th century gold standard, a country in deficit would lose gold to asurplus country, and an automatic process of adjustment would begin. Thegold-losing country would experience contraction of its domestic moneysupply, rising interest rates, and falling money incomes and prices (coupledpossibly with falling output and employment). The gold-gaining countrywould experience the opposite changes. The result would be a correctionof the balance-of-payments disequilibrium through a change in relativeprices of, and in demands for, the two countries' imports. This automaticadjustment in trade might be abetted and quickened by movements ofcapital, in response largely to interest rate differentials, from the surplus tothe deficit country.
In this idealized and perhaps partly imagined system—involving a smoothand quick correction of imbalances—the flow of gold from deficit to sur-plus country served two functions: (1) it set in motion the process of ad-justment, and meanwhile (2) it financed the imbalance.
The present international system resembles the textbook gold standardin one important respect: exchange rates are fixed within a narrow margin.But other conditions are very different. Domestic credit conditions in mostcountries today are to some degree independent of the volume of interna-tional monetary reserves. Prices and wages tend to resist downward move-ment. And most countries pursue domestic policies aimed at full employ-ment and price stability.
This means that internal deflation in deficit countries is not an acceptablemeans of reducing imports and making exports more competitive. By thesame token, surplus countries are understandably unwilling to accept infla-tion as a means of restoring balance in their external accounts.
While the Articles of Agreement of the IMF permit exchange-rate adjust-ment in case of a "fundamental disequilibrium"—an imbalance that ischronic and intractable at the existing exchange rate—most countries arereluctant to take this step. For a reserve currency country, this alternativeis not available. For other major industrial countries, even occasionalrecourse to such adjustments would induce serious speculative capitalmovements, thereby accentuating imbalances.
What then is the adjustment mechanism under modern conditions?Policies called for by a country's domestic situation frequently may also
help to correct an imbalance in its external accounts. If a country is suffer-ing from excessive total demand for its domestic output and also hasa deficit in its balance of payments—a combination of ills that hasfrequently been encountered—restrictive fiscal and monetary policies
*39715-113 O-64-10
Digitized for FRASER http://fraser.stlouisfed.org/ Federal Reserve Bank of St. Louis
are appropriate. If successfully applied, they serve to reduce excessivedomestic demand, and this effect in itself tends to reduce imports and en-courage exports. In addition, stopping domestic inflation will at leastprevent the country's competitive position from worsening further. More-over, restrictive monetary policy and higher interest rates tend to attractinterest-sensitive capital from other countries and to discourage domesticcapital from moving abroad.
Similarly, there is no conflict between internal and external objectives inthe case of a country experiencing deficient demand at home but a surplusin its balance of payments. Here the application of expansionary fiscal andmonetary policies helps to restore full use of domestic resources and tends toincrease imports relative to exports. This mix of policies also encouragesinterest-sensitive capital to move abroad.
It is not these combinations of internal and external problems thatraise questions about the adequacy of the adjustment process in today'sworld. Rather it is the less tractable combinations, such as a deficiency ofdemand at home and a deficit in the balance of payments—which theUnited States has faced in recent years—or excess demand internally alongwith a surplus in the external accounts—which some European countrieshave been experiencing.
Conventional notions as to policies for adjustment contain a clear biastoward imposing greater pressure on deficit countries to adopt restrictivefiscal and monetary policies than on surplus countries to adopt expansion-ary policies. This bias results in part from the simple fact that the lowerlimit to which a deficit country's reserves can ultimately fall (zero) ismore definite and compelling than the upper limit to which a surpluscountry's reserves can rise. To be sure, the availability of IMF and othercredit may extend the period during which a deficit can be sustained, butsuch borrowing brings with it added pressures for correction of the deficit.
Related to this asymmetry is the fact that a balance-of-payments deficitis often regarded as an indication of "profligacy"—in view of the traditionalassociation of deficits with domestic inflation—which requires the impositionof discipline on deficit countries. There is no disciplinary counterpart forsurplus countries. To some extent, this conventional view is institutional-ized in the IMF, whose long-standing policies require increasingly vigorouscorrective measures by deficit countries as their drawings from the Fundincrease beyond the first (gold) tranche. Fund policies do not place acorresponding emphasis on the need for adjustment by surplus countries.
The stability of liquid dollar claims. As was indicated at the beginning oithis chapter, the United States has had payments deficits since 1949. Untilthe late 1950's, however, most countries were anxious to enlarge their dollarholdings and welcomed our modest deficits. But after 1957 U.S. deficitswere larger; and, with a smaller appetite for dollar holdings, many for-eign countries converted a higher proportion of their dollar accruals intogold. Even so, foreign dollar balances have increased by about $8 billion
140
Digitized for FRASER http://fraser.stlouisfed.org/ Federal Reserve Bank of St. Louis
since 1957. Foreign central banks and governments held $8 billion ofshort-term dollar claims at the end of 1957 and $12J4 billion in late 1963;foreign banks, businesses, and individuals held $6 billion in December 1957and $9 billion in late 1963. Over the same period, the U.S. gold reservefell by $7/ 2 billion, from $23 billion to $15/2 billion.
The expanding total of liquid dollar claims, set against a declining goldstock, is sometimes viewed as a potential source of instability for the reservecurrency system. This is based on the possibility of a convergence ofdemands by foreign monetary authorities for conversion of dollar balancesinto gold. The more intractable the U.S. balance-of-payments deficit ap-peared to be, the less remote such a threat might be considered. Conversely,evidence of U.S. progress toward balance-of-payments equilibrium mitigatessuch destabilizing fears.
Potential instability is regarded by some observers as inherent in a reservecurrency system—or indeed in any fractional reserve system in which creditclaims convertible into gold are an important element. It is characteristicof such a system that growing needs for international monetary reserves can-not be met solely from gold becoming available for monetary use. In factmany observers believe that the currency or credit component of reservesmust rise relative to gold holdings. In these circumstances the system willalways be subject to the possibility of instability when for one reason or an-other private or official holders of a reserve asset become uneasy.
As was described earlier, international cooperation has led to the develop-ment in recent years of a series of measures designed to reduce these dangers.But the risks of instability have not been wholly eliminated.
Provision for growth of reserves. The total of official reserves held bythe industrial countries is generally regarded as adequate at the presenttime. The question is whether the present system for creating reserves willbe able to function so as to meet future requirements.
It is clearly impossible to devise an exact criterion for determining theworld's needs for reserves in the years ahead. This need will depend on atleast three factors: (a) the strength of the forces creating potential imbal-ances, (b) the effectiveness of the adjustment process which tends to limitand correct these imbalances, and (c) the availability of credit supplementsto official reserves.
It is an objective of the nations of the free world that trade and capitalmovements should be increasingly freed from restrictions. Yet, for a num-ber of reasons, increased freedom of international transactions is likely tomake each country's balance of payments more sensitive than before tochanges in economic conditions within its own borders and outside.
The extent to which tendencies toward imbalance actually create largeor prolonged deficits depends, of course, on the speed and effectiveness ofthe processes of adjustment. If the existing adjustment mechanisms areslow-acting, larger reserves will be needed; if they can be made quick and
141
Digitized for FRASER http://fraser.stlouisfed.org/ Federal Reserve Bank of St. Louis
effective—while consistent with the basic objectives of growth, sta-bility, and unrestricted trade—smaller reserves will suffice. Of course,there is an interaction among the supply of reserves, the adjustmentprocess, and the size of swings in payments balances. For example, if re-serves are too large, countries may not have to pay much attention tocurrent changes in their payments balances, and they may avoid or delaythe adjustments needed to restore equilibrium.
Similarly, the availability and dependability of credit sources to supple-ment "owned" reserves influence countries' views as to the volume of re-serves they need as well as the extent to which they feel compelled to takeprompt action against forces tending to disturb payments equilibrium.
Given the existing adjustment mechanisms and the priorities of economicpolicy in most countries, the supply of reserves and credit facilities will haveto be prepared to cope with substantial future imbalances.
In the years since World War II, the growth of world reserves has hadtwo major sources: (1) a growth of monetary gold stocks and (2) deficitsin the U.S. balance of payments. In the future, gold can be expected toprovide for only a part of the needed growth in world reserves, as it has inthe past. In the decade from 1953 through 1962, monetary gold reservesof all countries increased by about $5/2 billion, or by less than 15 percent oftotal monetary reserves at the end of 1952, whereas, over the same periodworld trade, as measured by total imports, increased by nearly 65 percent.During this decade, the total gold and foreign exchange reserves of the restof the world increased by about $19 billion, or nearly 75 percent. But abouttwo-fifths of this growth represented a transfer abroad of U.S. gold—aprocess which cannot continue indefinitely to provide a source of reservegrowth for the rest of the world.
The net outflow of dollars from the United States has been a majorsource of growth in world reserves over the past decade. But reliance onthis method of increasing reserves creates a dilemma. U.S. deficits areaccompanied by a growth of dollar liabilities relative to the gold stock,increasing the dangers of instability referred to earlier; yet, when the U.S.deficit is eliminated—or gives way to a surplus—world reserves will probablyrise too slowly (or even contract) under existing monetary arrangements.For these reasons a range of proposals has been put forward for modifyingthe existing method of generating monetary reserves.
PROPOSALS FOR STRENGTHENING OR CHANGING
EXISTING ARRANGEMENTS
Recognition of the problems discussed in the previous sections of thischapter has stimulated a wide range of suggestions for change. They varyfrom a careful building on the existing system, through a series of innova-tions and supplements, to a rather complete revision of the whole system.The proposals, which have stimulated discussion on both sides of theAtlantic, differ in many respects. The differences arise in part from varyingdiagnoses of the nature of present problems, in part from differing degrees of
142
Digitized for FRASER http://fraser.stlouisfed.org/ Federal Reserve Bank of St. Louis
preoccupation with the current U.S. situation as against a future situation inwhich our deficits will have disappeared. They also reflect divergences inrelative values placed on the several objectives of policy.
Most of the suggestions brought forward for strengthening or revising theinternational payments system are aimed at one or more of the followingpurposes: improving the balance-of-payments adjustment process, reduc-ing the dangers of instability in the system, and providing a satisfactorymeans for increasing international liquidity. This section first indicatessome of the possibilities for correcting payments imbalances more effectivelyby supplementing those built-in adjustment tendencies that now exist. Itthen describes a range of proposals—from a strengthening of the existingsystem to a major overhaul—that deal with potential instability and futuregrowth of reserves.
Improvements in the adjustment process. Recent experience and discus-sion indicate that it is possible to devise combinations of policies thatsimultaneously promote domestic and international objectives withoutimposing undue pressures toward contraction in the world economy.
Two major approaches merit attention: (1) changes in the mix offiscal and monetary policies and (2) acceleration by surplus countries ofmovements to relax barriers to international trade and payments.
As was pointed out above, there is no conflict between internal andexternal objectives if a country is subject to inflationary pressures at homeand has a balance-of-payments deficit, or if it has unemployed resources athome and a payments surplus. It is the other combinations that poseparticularly difficult policy problems.
In a world of relatively free capital movements, flexible changes in themix of fiscal and monetary policies can serve to reconcile internal andexternal policy goals. In using this approach, a deficit country with unem-ployment and idle capacity would be advised to emphasize expansionaryfiscal policy to deal with its domestic demand problem while pursuing arelatively restrictive monetary policy to deal with its balance-of-paymentsproblem, particularly by affecting capital movements. This, it will berecognized, is similar to the policy prescription that the United States hasbeen trying to apply—a large tax reduction program to spur domesticexpansion, and a monetary policy, in the past two or three years, that callsfor interest rates, in some sectors of the market, that are relatively high fora period of inadequate domestic investment. The United States has alsoused its monetary and debt management policies to influence the maturitystructure of interest rates so as to raise short-term rates while moderatingthe upward pressure on long-term rates.
For the surplus country with excess demand at home the opposite policymix is called for: restrictive fiscal policy and relatively easy monetary policy.Here the fiscal policy would tend to reduce internal inflationary pressures,while the monetary policy would discourage capital inflow and encouragecapital outflow.
143
Digitized for FRASER http://fraser.stlouisfed.org/ Federal Reserve Bank of St. Louis
It is clear that if changes in the mix of fiscal and monetary policies areto serve in this way to facilitate both correction of payments disequilibriumand pursuit of domestic goals of full employment and price stability, fiscalpolicies must become more flexible. But this is desirable, in any case, fordealing with problems of internal stabilization.
A second, although self-limiting, means of adjustment involves therelaxation of restrictions on trade and capital movements by surpluscountries. The removal of quantitative restrictions, reductions of tariffs,and freeing of capital flows is a continuing objective of the countries of thefree world. Constant efforts in these directions can be seen in the activitiesof the IMF, the General Agreement on Tariffs and Trade (GATT), andthe Organization for Economic Cooperation and Development (OECD).
A country prepared to relax a trade or payments restriction should notpostpone that action. On the other hand, countries with persistent balance-of-payments surpluses might well be encouraged to accelerate removalof barriers to both current and capital transactions, including unilateral(even if temporary) tariff reductions. This would contribute both to areduction in the external surplus and to an amelioration in the pressureof excess demand at home. While a permanent relaxation of restrictionsis preferable, even a temporary suspension of trade or capital accountimpediments may be helpful as a means of adjustment. A recent exampleis the inclusion of selected temporary tariff reductions in the French stabiliza-tion program.
There is not a corresponding acceptable prescription for deficit countriesthat are suffering from deficient demand at home. Clearly it would be un-desirable for a tightening of trade restrictions or an increase in tariffs to be-come part of the accepted means of adjustment. When a choice must bemade among undesirable alternatives, measures to retard the rate of capitalflow from deficit countries are preferable, in terms of effects on re-source allocation, to moves away from freedom of current account trans-actions. The proposed temporary interest equalization tax in the UnitedStates is an example of such a step.
It may be that still other adjustment policies can be found for reconcilinginternational and domestic goals. In this regard, the OECD and its vari-ous committees and working parties will no doubt continue to play an im-portant role. The success of these bodies in working to harmonize policiesand prevent a deflationary bias in the adjustment process stands out as asignificant achievement of the past few years.
Strengthening the existing reserve currency system. Most proposals forimprovement of international monetary arrangements, whatever their formand whether moderate or drastic, deal both with the problem of stabilityand with the adequacy of the means for providing reserves. One approach,emphasizing the evolution that has been taking place in the present systemin the past few years, seeks to build on and strengthen this system throughfurther gradual changes.
144
Digitized for FRASER http://fraser.stlouisfed.org/ Federal Reserve Bank of St. Louis
As for the problem of stability of the reserve currencies, this approachpoints to the success that has been achieved in stopping and reversing de-stabilizing speculative activity through the use of "swap" and other co-operative arrangements among central banks. With the special borrowingarrangement, the IMF can now provide up to $4 billion of additional financ-ing to meet any speculative run on the dollar. These arrangements couldpresumably be further strengthened and enlarged if the need should arisein the future.
This approach also includes the possible further development of sales bythe United States of special nonmarketable securities to surplus countries.These sales, initiated recently, provide a way of consolidating short-termdollar holdings that may be considered excessive. When denominated inthe currency of the country that purchases them (if this is mutually desired),these securities provide an exchange guarantee. Such securities can alsoprovide the holder with easily available resources when its surplus turnsinto a deficit.
Another element in this approach involves the recognition thatthere is already a mechanism whereby U.S. surpluses need not reducethe reserves of other countries. The United States can acquire the curren-cies of industrial countries that have deficits, thus preventing a decline inthe reserves of other countries as U.S. reserves increase. This practice hasbeen initiated on a small and exploratory scale over the past few months.The United States has acquired Italian lire, in effect reciprocating in partan earlier Italian purchase of medium-term U.S. securities that was madewhen Italy was in surplus. In fact, regardless of whether the UnitedStates has a deficit, a balance, or a surplus, it could acquire the currenciesof other industrial countries, with their agreement, thus providing addi-tional liquid dollar balances to those countries and to the system as a whole.
Such amendments to the present reserve currency system begin to breakthe automatic link between changes in the balance of payments of a re-serve currency country and changes in the liquid monetary reserves of therest of the world.
This general approach recognizes that the ratio of gold to currency hold-ings in world monetary reserves will continue to decline, but does not viewthis as involving increasing instability. Rather it rests on the belief thatso long as excessive and prolonged U.S. deficits are avoided, increasinglyclose cooperation among the leading countries and the growing availabilityof reciprocal credit facilities, both within or outside the IMF, can maintainconfidence in the currency element of monetary reserves, and permit theirexpansion as needed.
Overhauling the existing system. Some proposals for more drasticchanges in monetary arrangements are aimed mainly at reducing the po-tential for instability, and others are aimed mainly at improving themechanism for generating reserves. But most of them contain elements
145
Digitized for FRASER http://fraser.stlouisfed.org/ Federal Reserve Bank of St. Louis
that would achieve both purposes. The plans are here sketched only verybriefly, and no effort is made to deal with the problems that their imple-mentation might involve.
The plans that focus largely on lessening potential instability proposeto eliminate the possibility of disruptive and self-defeating efforts to convertnon-gold reserve assets into gold by establishing a fixed ratio of gold in eachcountry's total reserves (a ratio subject to change by general agreement).Some of these plans would also create a new type of reserve unit that wouldpartly or wholly replace national currencies in reserves.
A proposal put forward by Professor S. Posthuma of the NetherlandsBank would require that each member country of the Group of Ten agreeto hold a fixed proportion of its monetary reserves in the form of gold. Theremainder would be in the currencies of the other members, and theseofficial holdings would receive reciprocal exchange guarantees. Once theproposal had been put into effect, countries would finance deficits by reduc-ing gold and foreign exchange holdings proportionately so as to maintainthe agreed ratio, with similar provisions for countries gaining reserves.
This proposal would, after a period of time, effectively increase the num-ber of reserve currencies, since each country, including the United States andthe United Kingdom, would hold the currencies of the others. Thus thesystem would permit growth in reserves independently of individual deficitsand surpluses, so long as gold reserves were increasing. This system couldbe further adapted to the need for additional growth of reserves throughagreed reductions in the fixed ratio between gold and foreign exchangeholdings.
A somewhat similar approach, suggested by Dr. E. M. Bernstein, is alsodesigned to enhance international monetary stability. This proposal wouldestablish a "reserve unit" as a generalized liability of the IMF. The majorindustrial countries would pay over to the IMF a quantity of their owncurrencies in exchange for such reserve units and would undertake to holdreserve units in an agreed proportion—ultimately, one-half—of their goldreserves. This composite reserve unit would in time come to replace thereserve currencies. This plan too could be adapted to growth needs byadjusting from time to time the fixed relationship between reserve units andgold.
A number of proposals would increase international reserves and creditavailability by making IMF resources more readily usable by membercountries. Any such change in Fund practices would increase internationalcredit availability. To the extent that member countries came to regard alarger proportion of their maximum potential drawing rights at the Fundas freely available, the effect would be equivalent to an increase in "owned"reserves.
Such proposals for greater, and perhaps less conditional, use of Fundresources are usually accompanied by a plea for a change in member countryattitudes toward reliance on the IMF. Instead of regarding the Fund
146
Digitized for FRASER http://fraser.stlouisfed.org/ Federal Reserve Bank of St. Louis
as a lender of last resort, member countries, especially industrial countriesholding substantial amounts of reserves, would be encouraged to drawregularly on the Fund as a complement to the use of their owned reservesin financing a part of any deficits.
While these proposals aim at using the IMF more intensively, they arefrequently accompanied by suggestions for regular increases in Fund quotasto provide for needed expansion in liquidity over time. Such increasescould be negotiated periodically, or agreement might be reached on a regularautomatic expansion of quotas.
Another approach to increasing the volume of reserves is the proposal fora "mutual currency account" to be administered by the IMF. This pro-posal provides that the industrial countries form an arrangement underwhich a surplus country could deposit the currency of a deficit countryin the mutual currency account. This facility would encourage the pro-vision of financing to the deficit country—though definite limits wouldbe established—and would give the surplus country a claim against themutual currency account, which would receive the usual IMF gold-valueguarantee against exchange risks. Once established, such claims wouldbecome a new form of reserve, usable under certain conditions by theirholders when they in turn find themselves in deficit.
Perhaps the most far-reaching of the many plans that have been widelydiscussed—that of Professor Robert Triffin of Yale—aims to replace thepresent system so that reserve creation will no longer depend on additionsto the stock of monetary gold and to claims on reserve currency countries.Instead it proposes to place in the hands of an international institution(a reconstituted IMF) the power to regulate the creation of internationalmonetary reserves. Under this proposal reserve currencies would be re-placed by new claims on the expanded IMF, and these claims would betransferred from deficit to surplus countries in settlement of imbalances.
The new institution would be empowered to make loans to membersby creating additional claims on itself—as does a bank. And, as in the caseof bank loans, the member's policies would be scrutinized by the lendinginstitution. In addition the new IMF could expand reserves at its ownvolition or on some predetermined basis by purchasing government secur-ities of its members, with their agreement, paying for these securities bycreating deposits (claims against itself). Such loans and "open marketoperations" would be used to expand world reserves at an appropriate rate.
This proposal, like others related to it, takes inspiration from the his-torical development of central banking within individual countries. Recog-nizing that "money does not manage itself," individual countries have estab-lished centralized instititions that now regulate the aggregate creation ofnew money, regardless of the size of deficits of individual borrowers. Wheth-er such a development would also be desirable, practicable, and acceptableinternationally—and, if so, when—is understandably the subject of con-siderable controversy.
147
Digitized for FRASER http://fraser.stlouisfed.org/ Federal Reserve Bank of St. Louis
CONCLUDING COMMENTS
Without trying to anticipate the outcome of the studies now in process, itis possible to state some general propositions that follow from the precedingdiscussion:
1. International monetary arrangements are not an end in themselves buta means of fostering a steadily growing world economy, in which freedomof international transactions contributes to rising living standards, andprice stability helps to assure equitable distribution of the fruits of economicgrowth.
2. If it is to serve these purposes, the international monetary system shouldprovide both leeway and discipline: (a) It should encourage adjustmentof imbalances by both deficit and surplus countries in ways that avoid im-parting either a deflationary or an inflationary bias to the world economy,and it should encourage greater rather than less freedom of internationaltransactions, (b) It should reduce or eliminate the potential for disruptiveand speculative conversions of foreign exchange reserves into gold. And(c) it should make financial resources available in a volume and underconditions adequate to finance imbalances consistently with these objectives.
3. In evaluating specific plans that are put forward for modification orreform of the existing system, it is important not to confuse form withsubstance. Any plan—regardless of its outward trappings—can be adaptedso as to become too restrictive or too inflationary. Whatever the out-come of the present studies, it must be recognized that for any monetaryarrangement to function successfully, it is essential that there be an in-creasing degree of mutual understanding, cooperation, and responsibilityamong the countries whose reserve holdings and reserve needs account forthe bulk of the problem of international liquidity.
148
Digitized for FRASER http://fraser.stlouisfed.org/ Federal Reserve Bank of St. Louis
Chapter 6
U.S. Assistance of Economic DevelopmentOverseas
MUCH OF THE WORLD in which the United States conductsits economic affairs consists of poor countries now urgently striving
to modernize and develop their economic systems. Our economic relationswith these countries constitute a major aspect of U.S. foreign policy, andthey interact with our domestic economic performance and programs.Because of the sharp debate over the U.S. foreign aid program that wasmounted during the past year and still goes on, this is a particularly ap-propriate time for reviewing our economic relationships with these lessdeveloped countries.
Even if there were no other reasons, the sheer size of the United Stateswould give our economic performance and policies a particular significancefor the developing nations. These nations depend heavily on Americansavings as a major source of capital; on American science, technology, andmanagement as a major source of productive and organizational technique;and on American markets as a major source of demand. Rapid growth andprosperity in the United States make an important contribution to estab-lishing favorable conditions for economic development abroad.
A great variety of American activities—by U.S. businesses, consumers,tourists, and private nonprofit institutions, as well as Government—sig-nificantly affect the developing countries, and these activities reflect avariety of purposes. The focus of this chapter, however, is on the economicpolicies of the U. S. Government toward the developing countries.
EVOLUTION AND RATIONALE
In common usage "foreign aid" refers to transfers on concessionary termsof goods, services, or purchasing power from one government to an-other, either directly or through the medium of international organiza-tions. (Frequently, although the relations between sovereign nations re-quire that it be agreeable to the recipient government, aid is destinedfor specific private uses. Also the term "foreign aid" sometimes is extendedto foreign transfers by private nonprofit institutions.) While all such gov-ernmental transfers are intended to serve the general foreign policy inter-
149
Digitized for FRASER http://fraser.stlouisfed.org/ Federal Reserve Bank of St. Louis
ests of the donor country, the aid mechanism is a vehicle that can beadapted—and has been adapted by the United States—to many specificuses that vary over time and from place to place. For example, armsshipments coupled with military training have been supplied to nationsdirectly threatened by a foreign power hostile to our interests, but suchprograms may not be appropriate in other situations.
"Development assistance" is only one type of foreign aid. But it isa type that, while .guided by the basic criterion of our foreign policy in-terests, is properly based on economic analysis and evaluated in concreteeconomic terms. This chapter will deal primarily with this type of foreignaid, rather than with programs that are of necessity dominated by politicalor military considerations of a tactical nature. All the same, it is well torecognize that assistance can evolve from one form to another withinthe same administrative framework—as the cases of Greece and Taiwan,for example, well illustrate. Since our early aid efforts in these nationswere responses to military crises, internal and external, longer-run eco-nomic development considerations properly took a subsidiary position.Both countries soon gained a measure of internal security and politicalstability. Our interests, as well as theirs, then dictated embarking on aprogram of long-run economic development.
SHIFTING POLICY GOALS
American aid commitments during the early postwar period had shorttime horizons. The Marshall Plan and its various instrumentalities werea response to the postwar economic chaos and were designed to tide highlyindustrialized nations over a reconstruction period. The Marshall Plansucceeded handsomely and ended ahead of schedule.
Meanwhile, the social, political, and economic revolution sweeping theunderdeveloped world was beginning to give our aid program a new focus.Throughout much of Asia, Africa, and Latin America, rising economic ex-pectations coincided with the disintegration of traditional colonial empiresand the emergence of independent but inexperienced and vulnerable na-tions. Their desire for the benefits of the Industrial Revolution was notmatched by the skills, the social and political traditions, and the capitalrequired for an industrial economy.
Our initial response was President Truman's Point IV Program oftechnical assistance. Barely had his proposal been acted upon, however,when the Communists in mid-1950 invaded the Republic of Korea—highlighting the vulnerability of the emerging nations to military attackand their need for more than technical assistance or capital for develop-ment projects. For the next few years, reinforcement of the militarystrength of the free world received primary attention from Americanpolicymakers.
As the decade of the 1950's proceeded, however, military and technicalassistance was supplemented increasingly by economic aid designed to helpemerging nations cope with particular short-run problems or to galvanize
150
Digitized for FRASER http://fraser.stlouisfed.org/ Federal Reserve Bank of St. Louis
longer-run development potentialities. The Foreign Assistance Act of 1961marked the major reorientation of American foreign economic policy inthe direction of development assistance. This reorientation was basedpartly on the recognition that the threat to the internal security of thedeveloping countries from subversive elements within had become morepronounced than the threat to their external security.
THE CASE FOR DEVELOPMENT ASSISTANCE
Development assistance—the transfer of resources on concessionary termsin order to raise rates of output and living standards in less developed coun-tries—is thus a major aspect of our present foreign aid program. Whilethe rational case for it rests on political, security, and economic grounds,much of the American impulse in this direction comes from the heart as wellas the head. We have a development assistance program because we be-lieve in the dignity of human beings. Although simple humanitarianismmay not have a high place in diplomatic confrontations, it speaks with apowerful voice between peoples in the language of common wants, fearsand aspirations for themselves and for each other.
In addition to humane considerations, the prime case for developmentassistance rests on the Nation's international political and security interests.Over the long run the United States has a large stake in keeping the alterna-tive of orderly nontotalitarian paths to development open to the nonalignednations as well as to those who are allies. Even in the short run, moreover,instability, unrest, and subversion in the less developed areas constitute anever-present threat to our security. Since the end of World War II, ahigh proportion of the crises that have jeopardized the peace have beenlocated in the underdeveloped world. As tensions in such areas mount andincidents occur, the growing circle of parties to the conflict renders thedispute ever more incendiary. It is far healthier for us, and for the worldas a whole, if stability can be fostered by evolving economic growth andconstructive social change.
Development assistance also serves our own economic interests. Poorcountries make poor markets; we need good markets for our exports. Wealso need dependable sources of supply for a wide variety of imports. In-secure, undiversified, inefficient economies make weak partners in the net-work of international economic and financial institutions, and we needstrong partners. Developing countries have become better trading partnersas their incomes have grown. During the past decade, the total value ofimports into the developing countries has increased at a rate of about 5percent a year or somewhat more rapidly than their total income. Bycreating expanding markets abroad for U.S. products, agricultural andindustrial, we realize economic returns from our foreign economic develop-ment investments.
Nevertheless, it is well for us to be frank in admitting, both to ourselvesand to others, that our development assistance strategy rests primarily on
Digitized for FRASER http://fraser.stlouisfed.org/ Federal Reserve Bank of St. Louis
what are, in the broadest sense, national security grounds. It is well to berealistic about the uncertainties that run through our development assist-ance strategy—about the fact, for example, that economic developmentwill not necessarily insure democratic governments or peaceful internationalbehavior. But it is also wise to rest our policy on the probabilities—andthese seem to be the following:
—that free, progressing, open societies typically make better, safer,and friendlier neighbors and members of the international com-munity;
—that, in nations imbued with surging expectations, vigorous eco-nomic development is a necessary, although not a sufficient, con-dition for the maintenance of orderly political processes; and
—that for most such nations, substantial external public assistancefor a limited period is a necessary, although not a sufficient, con-dition for economic development.
In short, the premise of our development assistance effort has been—and remains—that, while the risks and uncertainties inherent in makingthe effort are substantial, the risks of not making it are even greater.
ROLE OF DEVELOPMENT ASSISTANCE
In those countries where development assistance is effective, the re-quirements curve for foreign capital is likely to be bell-shaped, rising atfirst, leveling off, then falling. As less developed countries succeed inpromoting more rapid rates of sustained economic growth, their verysuccess typically entails a period of severe foreign exchange shortage.
In many of the new nations the ability to use development assistanceeffectively is still very limited, in terms of dollar volume. These are thetraditional societies that have yet to break themselves loose from economicstagnation, whose production and consumption are largely those of self-sufficient households, and whose ability to absorb capital awaits the exten-sion of the market economy. The prime need in such cases is for technicalassistance—for teachers and technicians to build skills and institutions basicto economic growth.
As a country acquires the skills and institutions needed to help itself andadopts public policies that adroitly apply both the rein and the spur, itscapacity to carry out new investment activity is likely to grow more rapidlythan its ability to save. Moreover, since—at least for some time—it mustobtain from abroad the great bulk of the manufactured and semimanu-factured goods it uses in establishing new industries and raising incomes,its requirements for imports rise swiftly. Such a country, having generateda momentum of growth and typically having encountered balance-of-pay-ments problems as a result, can absorb substantial government-to-govern-ment capital assistance. Such assistance, by speeding the expension ofthe country's imports, can accelerate the expansion of output.
152
Digitized for FRASER http://fraser.stlouisfed.org/ Federal Reserve Bank of St. Louis
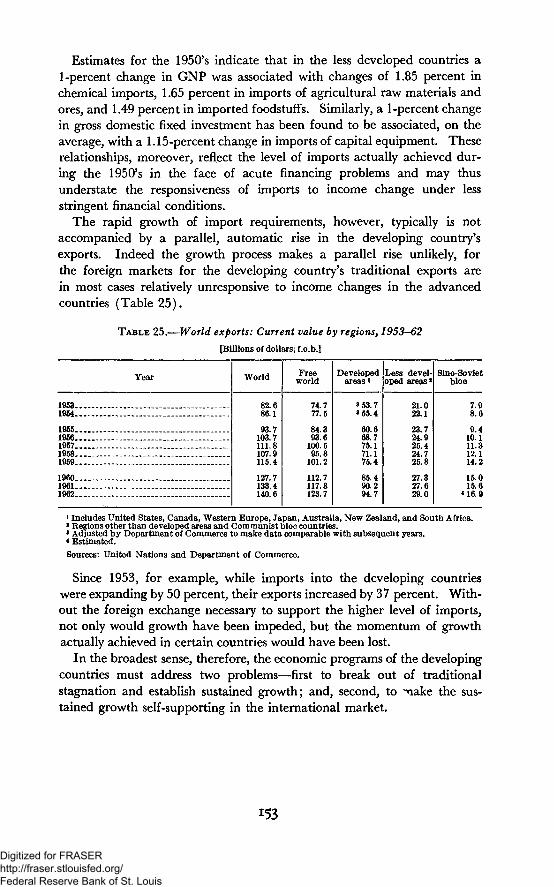
Estimates for the 1950's indicate that in the less developed countries a1-percent change in GNP was associated with changes of 1.85 percent inchemical imports, 1.65 percent in imports of agricultural raw materials andores, and 1.49 percent in imported foodstuffs. Similarly, a 1-percent changein gross domestic fixed investment has been found to be associated, on theaverage, with a 1.15-percent change in imports of capital equipment. Theserelationships, moreover, reflect the level of imports actually achieved dur-ing the 1950's in the face of acute financing problems and may thusunderstate the responsiveness of imports to income change under lessstringent financial conditions.
The rapid growth of import requirements, however, typically is notaccompanied by a parallel, automatic rise in the developing country'sexports. Indeed the growth process makes a parallel rise unlikely, forthe foreign markets for the developing country's traditional exports arein most cases relatively unresponsive to income changes in the advancedcountries (Table 25).
TABLE 25.—World exports: Current value by regions, 1953-62
[Billions of dollars; f.o.b.]
Year
1953 _.1954 _- . . .
1955 __19561957...1958... -1959
196019611962
World
82.686.1
93.7103.7111.8107.9115.4
127.7133.4140.6
Freeworld
74.777.5
84.393.6
100.595.8
101.2
112.7117.8123.7
Developedareas l
3 53.73 55.4
60.668.775.171.175.4
85.490.294.7
Less devel-oped areas3
21.022.1
23.724.925.424.725.8
27.327.629.0
Sino-Sovietbloc
7.98.6
9.410.111.312.114.2
15.015.6
«16.9
1 Includes United States, Canada, Western Europe, Japan, Australia, New Zealand, and South Africa.8 Regions other than developed areas and Communist bloc countries.3 Adjusted by Department of Commerce to make data comparable with subsequent years.* Estimated.Sources: United Nations and Department of Commerce.
Since 1953, for example, while imports into the developing countrieswere expanding by 50 percent, their exports increased by 37 percent. With-out the foreign exchange necessary to support the higher level of imports,not only would growth have been impeded, but the momentum of growthactually achieved in certain countries would have been lost.
In the broadest sense, therefore, the economic programs of the developingcountries must address two problems—first to break out of traditionalstagnation and establish sustained growth; and, second, to -make the sus-tained growth self-supporting in the international market.
153
Digitized for FRASER http://fraser.stlouisfed.org/ Federal Reserve Bank of St. Louis
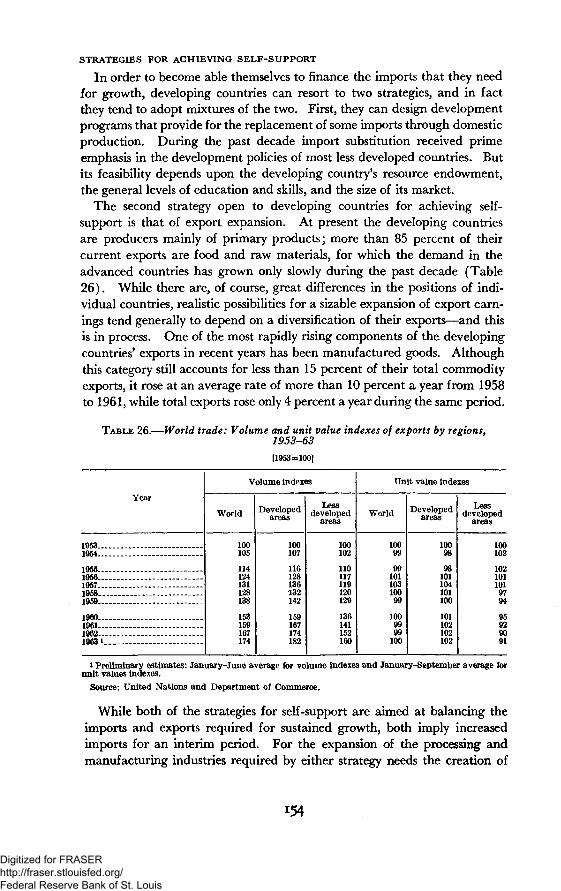
STRATEGIES FOR ACHIEVING SELF-SUPPORT
In order to become able themselves to finance the imports that they needfor growth, developing countries can resort to two strategies, and in factthey tend to adopt mixtures of the two. First, they can design developmentprograms that provide for the replacement of some imports through domesticproduction. During the past decade import substitution received primeemphasis in the development policies of most less developed countries. Butits feasibility depends upon the developing country's resource endowment,the general levels of education and skills, and the size of its market.
The second strategy open to developing countries for achieving self-support is that of export expansion. At present the developing countriesare producers mainly of primary products; more than 85 percent of theircurrent exports are food and raw materials, for which the demand in theadvanced countries has grown only slowly during the past decade (Table26). While there are, of course, great differences in the positions of indi-vidual countries, realistic possibilities for a sizable expansion of export earn-ings tend generally to depend on a diversification of their exports—and thisis in process. One of the most rapidly rising components of the developingcountries' exports in recent years has been manufactured goods. Althoughthis category still accounts for less than 15 percent of their total commodityexports, it rose at an average rate of more than 10 percent a year from 1958to 1961, while total exports rose only 4 percent a year during the same period.
TABLE 26.—World trade: Volume and unit value indexes of exports by regions,1953-63[1953=100]
Year
Volume indexes
World
100105
114124131128138
153159167174
Developedareas
100107
116128136132142
159167174182
Lessdeveloped
areas
100102
110117119120129
136141152160
Unit value indexes
World
10099
9910110310099
1009999
100
Developedareas
10098
98101104101100
101102102102
Lessdeveloped
areas
100102
1021011019794
95929091
1953..1954..
1955..1956..1957..1958__1959..
I960—1961...1962—19631.
l Preliminary estimates: January-June average for volume indexes and January-September average forunit values indexes.
Source: United Nations and Department of Commerce.
While both of the strategies for self-support are aimed at balancing theimports and exports required for sustained growth, both imply increasedimports for an interim period. For the expansion of the processing andmanufacturing industries required by either strategy needs the creation of
154
Digitized for FRASER http://fraser.stlouisfed.org/ Federal Reserve Bank of St. Louis
new productive facilities, the enlargement of existing capacity, and addi-tional materials and supplies that can still be obtained only from advancedcountries. Thus as the developing countries establish the basis for shiftingfrom sustained to self-supporting growth, success in their development effortintensifies their aid needs, and their requirements for foreign capital willreach a maximum—the top of the bell-shaped curve.
IMPLEMENTING SELF-SUPPORT
The financing problems that accompany growth will decrease in inten-sity—and the need for foreign aid diminish—as self-supplying capabilitiesof the developing countries increase and the composition and volume of theirexports more and more reflect the expanding size and diversity of their in-ternal economies. Success, however, requires, and will continue to require,a variety of adjustments. If the advanced countries are prosperous andexpanding, their demand for all products, including the exports of the devel-oping countries, will be buoyant, and the developing countries' foreign fi-nancing problem will be smaller. Vigorous economic expansion at homeis therefore one of the greatest contributions that the advanced countriescan make to the growth of the developing countries. Beyond this, the com-mercial policies of the advanced countries can maintain a congenial environ-ment for the poorer countries' exports. For example, the "KennedyRound" of tariff negotiations, which will begin in the spring of 1964, canmake a major contribution to the welfare of the developing countries. Inaddition, two steps taken in 1963 are worthy of note. The InternationalCoffee Agreement was completed, and legislation to permit U.S. participa-tion in it has reached an advanced stage in the Congress. And the Inter-national Monetary Fund in March 1963 created a new facility to make fundsavailable to member countries that experience temporary declines in exportearnings due to circumstances beyond their control.
However, the greater part of the responsibility for making adjustmentsthat will accomplish a progressive narrowing of their foreign exchangedeficiency lies with the developing countries themselves. They must orienttheir own development planning and administration, as well as the flow ofdevelopment assistance, away from overexpanded industries or those withdeclining demand toward industries in which they are—or are likely tobecome—most efficient. The concentration of production in areas of com-parative advantage will provide the basis for a sustainable expansion ofexports. At the same time, they must exploit any good import substitutionpossibilities they have thus far overlooked—for example, some of the lessdeveloped countries possess the climate and soil that would permit themeconomically to grow the basic foods they now import. The developingcountries need to manage their monetary, fiscal, and foreign exchange poli-cies so that resources are not diverted from export markets to uneconomicdomestic use. They need, in some instances and in certain quarters, furtherto encourage thrift and saving and a mobilization of domestic capital re-
155
715-1X3 O-64-11
Digitized for FRASER http://fraser.stlouisfed.org/ Federal Reserve Bank of St. Louis
sources. And they need to undertake far more determined, imaginative,and better organized efforts to adapt their products to foreign demands andto market them aggressively.
A major corollary of these efforts can be success in attracting privateforeign capital at reasonable terms and under constructive arrangements.It is easy to exaggerate the portion of the problem that private foreigncapital can solve in the near future. Nevertheless, the more successfullythe developing countries pursue stable, sustained growth, the more they willinduce foreign private investors to participate widely in their expansion.
Foreign development assistance can contribute significantly, if mar-ginally, to the attainment of sustained, self-supporting growth by a numberof less developed countries. On the other hand, carelessly provided, itcan be used by a less developed country to postpone economic self-dis-cipline. Such perversions of assistance should be resisted. For example,a developing country that yields to the temptation to spend its scarceresources on sophisticated military equipment for prestige reasons shouldnot expect foreign assistance to take care of its development needs. Themanagers of a development assistance effort should retain sufficient dis-cretion occasionally to risk using economic aid as an inducement to con-structive political and social change. But, in general, developmentassistance—particularly capital assistance—should be directed only to thosecountries that give convincing promise of effectively combining it withtheir own resources to promote growth.
In recent years the U.S. aid program has been tending toward a greaterconcentration of its development credits. This is the effect of its insistencethat, to qualify for substantial development assistance, recipients makeadequate showings of "self-help" and adopt economic programs and policiesthat promise effective use of the assistance. Further such emphasis iswarranted.
Because of its prominence in the U.S. development assistance program,special mention should be made of aid that, under Public Law 480, takesthe form of surplus farm commodities—conveyed mainly through the deviceof selling them for local currencies. Because the proceeds of such sales areinconvertible and because their disbursement within the host countries issubject to joint U.S.-host government determination, th-, farm commoditiesprovided constitute net contributions to the developing countries' resourcesand entail practically no claim on their foreign exchange.
While, in the abstract, there is no assurance that the particular physicalsurpluses the United States happens to have consist of goods the developingcountries need, in practice there is a happy convergence of interests inthe case of surplus foods. For, wisely channelled, the provision of suchAmerican foods, over and above what the developing countries can affordto buy in the international market, can meet much more than relief needs.It can supply the increments to local food supplies that allow host gov-
156
Digitized for FRASER http://fraser.stlouisfed.org/ Federal Reserve Bank of St. Louis
ernments, for example, to mobilize large amounts of idle manpower, es-pecially in rural areas, into labor-intensive investment projects withoutrunning serious inflationary dangers.
Trade and capital flows—both public and private—are interdependent.The necessity for aid depends on the level of domestic production andthe volume and direction of trade; but the volume and direction of tradeand the level of domestic production are themselves a function of the formand amount of public and private international capital flows. Becausetrade and aid are interdependent ways of coping with the foreign ex-change shortages that development efforts typically engender, the twoshould be more systematically related within the same comprehensive devel-opment programs. The combinations that can make the greatest contribu-tion to growth will vary not only among recipient countries, but for thesame country with the progress of its development effort.
THE UNITED STATES AND OTHER DONORS
All of the principal Western industrialized countries have now initiated,or substantially expanded, their own development assistance programs. Atthe same time, they have stepped up their contributions to multilaterallysupported programs. Despite the fact that the Communist countries arethemselves in many ways underdeveloped nations, they also have chosen todivert some of their scarce resources to a foreign aid program. The UnitedStates, which was at one time the only important source of aid to non-colonial areas now accounts for about 55 percent of the world total.
If "aid" is defined as government grants, public loans of more than 5years' duration, and contributions from official sources to multilateral agen-cies for use on behalf of the less developed countries, then disbursements ofall donor countries (net of repayments) are estimated at approximately$6/2 billion in 1962 and may have increased by $2OO-$5OO million in 1963.About 90 percent of this assistance in 1962 was provided by the 12 membersof the Development Assistance Committee (DAC) of the Organization forEconomic Cooperation and Development (OECD). Receipts by the less de-veloped countries have run somewhat behind the global assistance figures—about $500 million less in 1962—because disbursements by multilateralagencies have been lower than the sums made available to them by capitalsubscriptions, grants, and bond purchases.
The domestic resources of the developing countries are also augmentedby the inflow of foreign private capital that is invested either directly or bythe purchase of securities. The problems of measuring these private capitalflows are particularly severe. Probably, however, the total net flow ofprivate capital from the developed to the developing countries in 1962exceeded $2 billion. This brought total long-term receipts of developingcountries from public and private bilateral and multilateral sources to theneighborhood of $8J4 billion, an increase of about 50 percent over the1956 level.
157
Digitized for FRASER http://fraser.stlouisfed.org/ Federal Reserve Bank of St. Louis
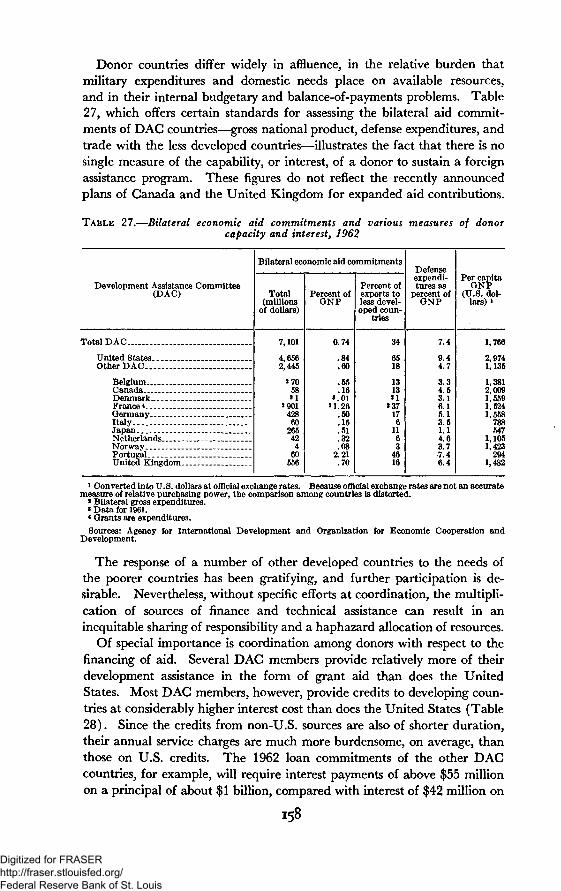
Donor countries differ widely in affluence, in the relative burden thatmilitary expenditures and domestic needs place on available resources,and in their internal budgetary and balance-of-payments problems. Table27, which offers certain standards for assessing the bilateral aid commit-ments of DAG countries—gross national product, defense expenditures, andtrade with the less developed countries—illustrates the fact that there is nosingle measure of the capability, or interest, of a donor to sustain a foreignassistance program. These figures do not reflect the recently announcedplans of Canada and the United Kingdom for expanded aid contributions.
TABLE 27.—Bilateral economic aid commitments and various measures of donorcapacity and interest, 1962
Development Assistance Committee(DAC)
Bilateral economic aid commitments
Total(millions
of dollars)
7,101
4,6562,445
a 7058»1
2 90142860
265424
60556
Percent ofONP
0.74
.84
.60
.55
.16».0l
M.26.50.15.51.32.08
2.21.70
Percent ofexports toless devel-oped coun-
tries
34
6518
131331
«37176
1163
4616
Defenseexpendi-tures as
percent ofGNP
7.4
9.44.7
3.34.53.16.15.13.51.14.63.77.46.4
Per capitaQNP
(U.S. dol-lars) »
Total DAC_
United States.Other D A C . . .
Belgium.Canada _DenmarkFrance*GermanyItalyJapanNetherlandsNorwayPortugalUnited Kingdom.
1,766
2,9741,135
1,3812,0091,5591,5241,558788547
1,1051,423294
1,482
1 Converted into U.S. dollars at official exchange rates. Because official exchange rates are not an accuratemeasure of relative purchasing power, the comparison among countries is distorted.
2 Bilateral gross expenditures.3 Data for 1961.«Grants are expenditures.Sources: Agency for International Development and Organization for Economic Cooperation and
Development.
The response of a number of other developed countries to the needs ofthe poorer countries has been gratifying, and further participation is de-sirable. Nevertheless, without specific efforts at coordination, the multipli-cation of sources of finance and technical assistance can result in aninequitable sharing of responsibility and a haphazard allocation of resources.
Of special importance is coordination among donors with respect to thefinancing of aid. Several DAC members provide relatively more of theirdevelopment assistance in the form of grant aid than does the UnitedStates. Most DAG members, however, provide credits to developing coun-tries at considerably higher interest cost than does the United States (Table28). Since the credits from non-U.S. sources are also of shorter duration,their annual service charges are much more burdensome, on average, thanthose on U.S. credits. The 1962 loan commitments of the other DAGcountries, for example, will require interest payments of above $55 millionon a principal of about $1 billion, compared with interest of $42 million on
158
Digitized for FRASER http://fraser.stlouisfed.org/ Federal Reserve Bank of St. Louis
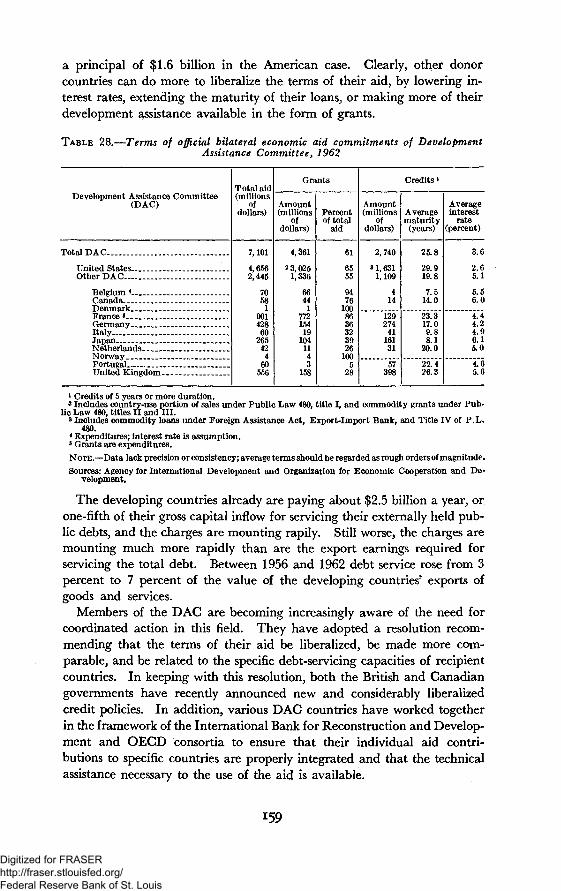
a principal of $1.6 billion in the American case. Clearly, other donorcountries can do more to liberalize the terms of their aid, by lowering in-terest rates, extending the maturity of their loans, or making more of theirdevelopment assistance available in the form of grants.
TABLE 28.—Terms of official bilateral economic aid commitments of DevelopmentAssistance Committee^ 1962
Development Assistance Committee(DAC)
Total DAC
United States.. _.Other DAC
Belgium *_Canada. - _. __ _DenmarkFrance *GermanyI t a l y -JapanNetherlands.. _ .NorwayPortugalUnited Kingdom
Total aid(millions
ofdollars)
7,101
4,6562,445
7058
90142860
265424
60556
Grants
Amount(millions
ofdollars)
4,36123,025
1,336
6644
177215419
1041143
158
Percentof total
aid
61
6555
9476
1008636323926
1005
28
Credits *
Amount(millions
ofdollars)
2,740
3 1,6311,109
414
12927441
16131
57398
Averagematurity
(years)
25.8
29.919.8
7.514.0
23.317.09.88.1
20.0
22.426.3
Averageinterest
rate(percent)
3.6
2.65.1
5.56.0
4.44.24.96.15.0
4.65.6
1 Credits of 5 years or more duration.^ Includes country-use portion of sales under Public Law 480. title I, and commodity grants under Pub-
lic Law 480, titles II and III.3 Includes commodity loans under Foreign Assistance Act, Export-Import Bank, and Title IV of P.L.
480.4 Expenditures; interest rate is assumption.8 Grants are expenditures.NOTE.—Data lack precision or consistency; average terms should be regarded as rough orders of magnitude.Sources: Agency for International Development and Organization for Economic Cooperation and De-
velopment.
The developing countries already are paying about $2.5 billion a year, orone-fifth of their gross capital inflow for servicing their externally held pub-lic debts, and the charges are mounting rapily. Still worse, the charges aremounting much more rapidly than are the export earnings required forservicing the total debt. Between 1956 and 1962 debt service rose from 3percent to 7 percent of the value of the developing countries' exports ofgoods and services.
Members of the DAG are becoming increasingly aware of the need forcoordinated action in this field. They have adopted a resolution recom-mending that the terms of their aid be liberalized, be made more com-parable, and be related to the specific debt-servicing capacities of recipientcountries. In keeping with this resolution, both the British and Canadiangovernments have recently announced new and considerably liberalizedcredit policies. In addition, various DAC countries have worked togetherin the framework of the International Bank for Reconstruction and Develop-ment and OECD consortia to ensure that their individual aid contri-butions to specific countries are properly integrated and that the technicalassistance necessary to the use of the aid is available.
159
Digitized for FRASER http://fraser.stlouisfed.org/ Federal Reserve Bank of St. Louis
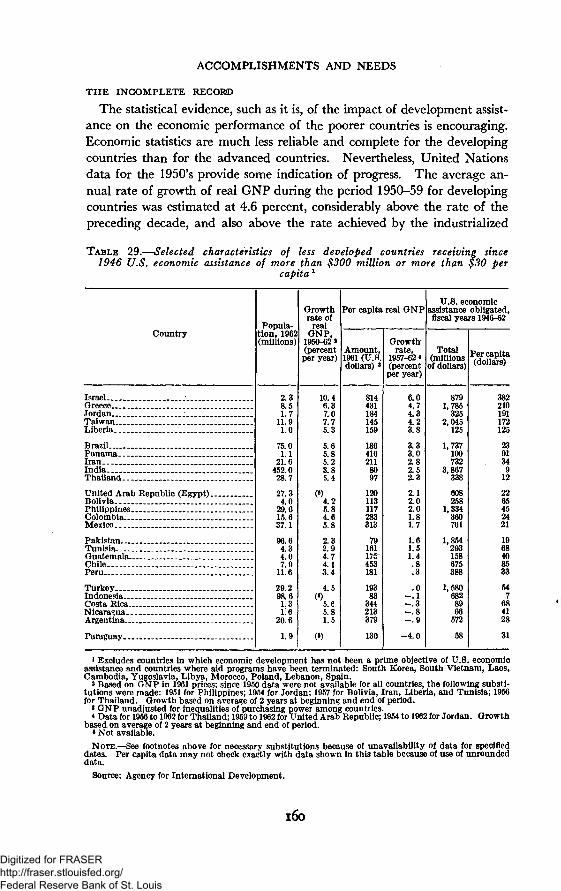
ACCOMPLISHMENTS AND NEEDS
THE INCOMPLETE RECORD
The statistical evidence, such as it is, of the impact of development assist-ance on the economic performance of the poorer countries is encouraging.Economic statistics are much less reliable and complete for the developingcountries than for the advanced countries. Nevertheless, United Nationsdata for the 1950's provide some indication of progress. The average an-nual rate of growth of real GNP during the period 1950-59 for developingcountries was estimated at 4.6 percent, considerably above the rate of thepreceding decade, and also above the rate achieved by the industrialized
TABLE 29.—Selected characteristics of less developed countries receiving since1946 U.S. economic assistance of more than $300 million or more than $30 per
capita x
Country
IsraelGreece _Jordan :TaiwanLiberia..
BrazilPanamaIran . _ _IndiaThailand
United Arab Republic (Egypt)BoliviaPhilippinesColombia __Mexico..
PakistanTunisiaGuatemala. . .Chile .Peru - . .
Turkey _IndonesiaCosta RicaNicaraguaArgentina
Paraguay
Popula-tion, 1962(millions)
2 38.51.7
11.91.0
75.01 l
21.6452.028.7
27.34.0
29.615.637.1
96 64.34 07 9
11.6
29.298 61 316
20.6
1.9
Growthrate of
realGNP,
1950-62 >(percentper year)
10 46.37.07.75.3
5.65 85.23.85.4
4.25.84.65.8
2 32.94.74 13.4
4.5
5 65.81.5
(•)
Per capita real GNP
Amount,1961 (U.S.dollars) »
814431184145159
1864162118097
120113117283313
79161175-453181
19383
344213379
130
Growth-rate,
1957-62 <(percent
per year)
6.04.74.34.23.8
3.33.02.82.52.3
2.12.02.01.81.7
1.61.51.4.8.3
.0- . 1—.3- . 8- . 9
- 4 . 0
U.S. economicassistance obligated,fiscal years 1946-62
Total(millions
of dollars)
8791,785
3252,045
125
1,737100732
3,867338
608258
1,334360761
1,854293158675388
1,5806828966
572
58
Per capita(dollars)
382210191172125
2391349
12
2265452421
1968408533
547
684128
31
1 Excludes countries in which economic development has not been a prime objective of U.S. economicassistance and countries where aid programs have been terminated: South Korea, South Vietnam, Laos,Cambodia, Yugoslavia, Libya, Morocco, Poland, Lebanon, Spain.
2 Based on GNP in 1961 prices; since 1950 data were not available for all countries, the following substi-tutions were made: 1951 for Philippines; 1954 for Jordan; 1957 for Bolivia, Iran, Liberia, and Tunisia; 1956for Thailand. Growth based on average of 2 years at beginning and end of period.
* GNP unadjusted for inequalities of purchasing power among countries.< Data for 1956 to 1962 for Thailand; 1959 to 1962 for United Arab Republic; 1954 to 1962 for Jordan. Growth
based on average of 2 years at beginning and end of period.• Not available.
NOTE.—See footnotes above for necessary substitutions because of unavailability of data for specifieddates. Per capita data may not check exactly with data shown in this table because of use of unroundeddata.
Source: Agency for International Development.
160
Digitized for FRASER http://fraser.stlouisfed.org/ Federal Reserve Bank of St. Louis
countries. Individual countries showed wide differences in achievement.Average annual rates of growth in real GNP since 1950, among countriesthat have received significant amounts of U.S. economic assistance andwhere economic development has been a principal objective of such assist-ance, varied from 10.4 percent for Israel and 7.7 percent for Taiwan to 1.5percent for Argentina. Growth rates in per capita income, 1957-62, whichin many cases are greatly depressed by high rates of population increase,have varied from 6.0 percent for Israel and 4.7 percent for Grece to —4.0percent for Paraguay. Table 29 illustrates the diversity of experience.
There is no one universally appropriate rate of growth. Still it isencouraging that 17 of the 26 countries that were the principal recipientsof U.S. aid have sustained during the years 1957-62 an annual rate ofgrowth of 1.5 percent or more in per capita income. In 13 of these coun-tries, the per capita rate of growth of GNP has met or exceeded an averageof 2 percent.
The phenomenon of population growth intervenes, of course, betweenrates of growth in total output and the per capita data just cited. Com-parisons of the two highlight two points. First, in many of the developingcountries it is clear that a moderation of population growth could ease thetask of accelerating per capita economic gains. It is for this reason thatthe United Nations and many of the developing countries themselves areshowing great interest in appropriate population policies and that the U.S.Congress, in its most recent appropriations for the aid program, authorizedthe support of research into the problems of population growth.
The second point, however, is that current rates of population growth inthe developing countries are not, in fact, outdistancing current averagerates of growth in output. Nor do they mean that it is useless to assistdevelopment until the "population explosion" has been "brought undercontrol." The logic of the matter runs just the other way: until popula-tion growth has slowed down, the need for productive expansion is doublyurgent.
The economic accomplishments of development assistance could bebetter gauged by the kind of detailed examination of concrete cases forwhich there is not space here. Such a review, for example, would includethe case of Taiwan, where an enviably rapid economic growth (estimatedat over 7 percent a year between 1950 and 1962) has been achievedwith U.S. assistance. Its total imports rose from $121 million in 1950 toan estimated $325 million in 1963, its exports from $93 million in 1950 toan approximate balance with imports in 1963. The private sector ofTaiwan's economy is growing rapidly, and Taiwan may soon be on its own.Less need for external assistance is also now foreseen for other successfulcountries, including the Philippines, Greece, Mexico, Israel, and Iran.
It would be appropriate to examine other examples also. The cases ofsix other countries—Korea, Vietnam, India, Pakistan, Turkey, and Brazil—which, along with Taiwan, the Philippines, Greece, and Israel, have received
161
Digitized for FRASER http://fraser.stlouisfed.org/ Federal Reserve Bank of St. Louis
about three-fifths of all U.S. economic assistance to developing nationsmerit attention. India and Pakistan, for example, are among thepoorest and most populous of the major recipients of U.S. aid. The rela-tively large amounts of economic assistance that India has received from theUnited States in recent years (averaging about $500 million during theperiod 1957-62) have amounted to only a little more than $1 per personper year, and self-support for India is still at least a decade away. Butthe progress made since 1950 provides grounds for cautious optimism.National income increased by 42 percent between 1950-51 and 1960-61,per capita income by 16 percent, agricultural production by 41 percent,industrial production by 94 percent, and school enrollment by 85 percent.
Even with a full set of such economic case studies, however, the recordof the accomplishments of development assistance would be incomplete—in three senses:
First—harking back to the United States' underlying rationale for de-velopment assistance—the record is incomplete until one can trace theinternal political consequences of economic growth in the developing coun-tries and the effects on the aided countries' international behavior. Whilethe Council of Economic Advisers has no special competence for makingsuch judgments, it seems to be the view of specialists that the balance ofevents in this regard has already been favorable. Fewer situations havedeteriorated, and more have improved than would have been the case inthe absence of development and of the development-assistance contribu-tion to it.
Second, the accomplishment record is incomplete in the sense that manyof the results of our past and present efforts to promote economic develop-ment in Asia, Africa, and Latin America have yet to appear. The Alli-ance for Progress, for example, is not yet 3 years old. The flow of develop-ment assistance has been substantial since 1958, but before that year de-velopment per se was hardly more than an incidental feature of foreign aidprograms. The process of economic development today is arduous andlong because the less developed countries have so far to go. The transfor-mation of agricultural nations, poor in capital and in trained manpower,into modern industrial states cannot be accomplished without time andtravail. Industrialization inevitably involves drastic adaptations of socialand economic institutions and the evolution of new attitudes and methodsof work. We have only to remind ourselves of the time it has taken toachieve sustained economic development in our own Southeast or in themore recently industrialized countries of Western Europe to appreciate thelags that inevitably intervene between inputs and results.
Finally, development assistance's record of accomplishments is incom-plete, because the needed effort itself still is in midstream. The job is notyet done. It is now, finally, well started. Sufficient growth momentumhas been established in many countries so that the emphases of their de-velopment programs can begin to shift from getting things started to keep-
162
Digitized for FRASER http://fraser.stlouisfed.org/ Federal Reserve Bank of St. Louis
ing them going—and to expanding export capabilities and private foreigninvestment opportunities enough so that gradually the need for govern-ment-to-government aid will be eliminated.
Moreover, as has been emphasized, there is room for increasing the effec-tiveness of specific aspects of our development assistance, for improving itsallocation, for improving its coordination with the efforts of other donors,and for increasing the share of the total that others provide. Continua-tion of our effort at this time will maintain momentum, avoid disruptionof growth processes that have been arduously established, and avoid wasteof much of the substance we already have committed.
WHY ARE WE "SUDDENLY SO FATIGUED" ?
At his last press conference, on November 14, 1963, President Kennedy,referring to the mood of the Congress toward authorizing foreign aid fundsfor the current fiscal year, remarked, "I don't understand why we aresuddenly so fatigued."
Probably the explanation of the fatigue lies partly in the fact that broadpublic understanding of the purposes of development assistance is stillincomplete. It lies partly also in a difficult administrative history, partlyin the inherently protracted character of the problems, and partly in thefact that the income gulf between the United States and the nations wehave been assisting is so large. As a result, Americans have trouble per-ceiving improvements that, in the aided countries' own terms, are verysignificant.
Most of all, however, our recent sense of fatigue is traceable to exces-sive expectations. Misled by the false analogy of our experience with theMarshall Plan, whose goal was reconstruction, not construction, we haveunderestimated the time it takes for development assistance to work itseffects. We have had exaggerated notions of how large a contributionan aid program can make to a country's internal development. And wehave overestimated the orderliness with which economic and social revo-lution typically can be conducted.
Especially have our expectations about success and failure been unreason-able. History and experience offer no precedents for this program. Itinvolves an attempt to influence the forces determining the historical evolu-tion of nation-States—about which even the wisest among us has littleinsight. Yet we have expected the program to have a nearly perfect recordof success. Such standards of accomplishment would appear too rigorousto any director of industrial research and development. We have mademistakes, of course. But we have also learned much, both from the mis-takes and from the experience of working with people in the developingcountries. While we can expect that the period of greatest mis-takes is behind us, we can never expect a record of 100 percent success untilthe definitive philosophy of history has been written.
163
Digitized for FRASER http://fraser.stlouisfed.org/ Federal Reserve Bank of St. Louis
Judged by our own interests and capabilities, the fatigue is inappropriate.It is inappropriate especially now that the program, as Chapter 5 pointedout, has been stripped of most of its adverse near-term balance-of-paymentseffects. Moreover, there is certainly no doubt at present of our domesticeconomic ability to continue the development assistance effort. Indeed,the program is generating several hundred thousand jobs, and many hun-dred million dollars worth of business that American workers and Ameri-can exporters would be loathe to lose.
In terms of the basic purpose of the development assistance program,however, the central point is that fatigue is inconsistent with the solidachievements beginning to emerge. It is out of step with the needs andprospects of the developing countries and with our strategic stake in them.In fact, the time has come for us to catch our second wind and moveahead.
164
Digitized for FRASER http://fraser.stlouisfed.org/ Federal Reserve Bank of St. Louis
Appendix A
TESTIMONY OF THE COUNCIL OF ECONOMIC ADVISERSBEFORE THE SUBCOMMITTEE ON EMPLOYMENT ANDMANPOWER OF THE SENATE COMMITTEE ON LABOR
AND PUBLIC WELFARE
OCTOBER 28, 1963
165
Digitized for FRASER http://fraser.stlouisfed.org/ Federal Reserve Bank of St. Louis
STATEMENT OF WALTER W. HELLER, CHAIRMAN,ACCOMPANIED BY GARDNER ACKLEY AND JOHN P.LEWIS, MEMBERS OF THE COUNCIL OF ECONOMICADVISERS, BEFORE THE SUBCOMMITTEE ON EMPLOY-MENT AND MANPOWER OF THE SENATE COMMITTEEON LABOR AND PUBLIC WELFARE, OCTOBER 28,1963*
Mr. Chairman and Members of the Committee, we are pleased to havean opportunity to participate in these hearings on Employment and Man-power. The employment problem is not only of the greatest importanceto the country and at the center of government economic policy, but is ofparticular interest to an agency operating, as the Council does, under themandate of the Employment Act of 1946.
Recent discussions may have generated an impression of greater disagree-ment among the Nation's economists about the origins and solutions of theemployment problem than actually exists. For in fact, the great majorityof those who have studied the matter carefully would agree with theAdministration's view that our excessive unemployment today cannot betraced to a single cause nor eliminated by a single cure. Rather, it has amixture of causes which must be dealt with by a mixture—an amalgam—of cures.
One problem, and a central one, is that total expenditures in the econ-omy—total demand for goods and services—are not sufficient to generatean adequate total number of jobs. We can, for convenience, call this kindof unemployment "demand-shortage" unemployment. In our view, de-mand-shortage unemployment can and must be attacked by vigorous poli-cies—principally tax reduction—to raise the total demand for goods andservices.
Another problem is that the characteristics of our available workers—their locations, skills, education, training, race, sex, age, and so on—do notfully match the characteristics employers are seeking in filling the jobsthat are available (or that would be available at full employment). In adynamic, changing economy there is always some of this mismatching,and we call the unemployment that results from it "frictional." But when
•Several passages and one entire section of the original have been deleted in re-printing this Statement, primarily where the same material is covered in the text of theReport either more fully or using more recent information. Footnotes added to theoriginal are indicated with asterisks.
166
Digitized for FRASER http://fraser.stlouisfed.org/ Federal Reserve Bank of St. Louis
the pockets of such unemployment become large and stubborn—especiallywhen they impose chronic burdens on particular disadvantaged groupsand regions—we speak of the unemployment problem as "structural."
This type of unemployment is also a serious problem, which requires majorpolicy actions to overcome its corrosive effects. Structural problems are notnew. And the available evidence does not show that the proportion of ourtotal unemployment problem that we label "structural" has increased sig-nificantly, nor that its character has materially changed. But this in no waydiminishes the need for attacking these structural problems with vigorouspolicies—principally education, training and retraining, and special regionalprograms—to match the supply of labor skills more closely to the changingdemand for labor skills.
Along with demand-shortage and structural unemployment, one alsohears a great deal about the problem of "technological unemployment"—ofmen being put out of work by machines and, more particularly, by the proc-ess which has come to be called "automation." This is, indeed, a serious andcontinuing problem. But two points should be emphasized at the outset.
First, "technological unemployment" is not a third form of unemploy-ment, separate from the other two. Rather, it expresses itself through theseother forms. Technological change causes obsolescence of skills and there-fore produces some of the mismatching between available workers and jobsthat we call "structural" unemployment. Moreover, by raising output perworker, technological change is one of the principal sources of growth in ourpotential total output or GNP—which, if not matched by correspondinggrowth in actual GNP, opens a gap in demand and thereby causes demand-shortage unemployment.
Second, those who maintain that the economy now faces a problem of"technological unemployment" that is somehow new, and more formidablethan in the past implicitly assert that the rate of technological change hasrecently speeded up. Unless this is the case, the problem is not new—it hasalways been with us and has not proved to be a long-run problem for theeconomy as a whole. The continuing process of rapid technological change,which has constituted the very core of the American economy's strengthand progressiveness for at least 150 years, has always put particular work-ers and businesses out of jobs and required particular adjustments that havebeen difficult and sometimes painful. It poses a new general problem forthe economy only if technological change becomes so rapid that the demandadjustments and labor market adjustments it requires cannot be accom-plished by the economic processes of the past. Whether technological changeindeed has accelerated, or is in process of accelerating, is a factual questionthat we consider at some length in this statement.*
* Treatment of this question has been deleted from the latter part of the Testimonyas reprinted here, because it is considered in the text of the Report (Chapter 3, sub-section headed "The Trend of Labor Productivity").
167
Digitized for FRASER http://fraser.stlouisfed.org/ Federal Reserve Bank of St. Louis
These, then—demand-shortage elements, structural elements, and apossible aggravation of both by accelerated technological change—are theprincipal ingredients of the unemployment problem your Committee isexamining. It would be unwise and imprudent to ignore any of these in-gredients either in diagnosing the problem or in prescribing remedies.
The primary attack on high unemployment must be through fiscalmeasures to speed the growth of total demand and thereby to create newjob opportunities. But this need not—indeed, must not—impede a simul-taneous attack on our stubborn structural problems. The two approachesare not merely complementary; they are mutually reinforcing. On the onehand, training and other programs to facilitate labor mobility can easeand speed the process by which demand-stimulated increases in output aretranslated into increases in employment. On the other, since structuralmaladjustments tend to flourish in slack markets, a vigorous expansion indemand helps cut structural problems down to size.
This statement deals first with the over-all dimensions of our unemploy-ment problem and the central role of tax reduction in eliminating exces-sive unemployment. Second, we turn to several issues which have figuredprominently in the Committee's hearings to date: the nature, extent, andrecent pattern of structural unemployment; the current rate of growthin productivity and the labor force; and the fears of automation and con-sumer satiation. In considering these issues, we are addressing ourselves tothree underlying questions:
1. Are the structural elements of the unemployment problem animportant barrier to the achievement of the objectives of thetax cut?
2. Are we likely to experience speedier increases in productivity andin the labor force which, while serving our objectives of fastereconomic growth and balance-of-payment equilibrium, wouldintensify our problems of re-employing displaced workers andgenerating enough total demand to achieve full employment?*
3. What is the nature of the labor market policies that must gohand-in-hand with the use of over-all fiscal and monetary policiesfor expansion if we are to achieve our multiple economic goals?
A final section will summarize our observations on these questions.
I. UNEMPLOYMENT AND TAX REDUCTION
The American economy has been plagued with persistently excessiveunemployment for 6 years. The unemployment rate has been 5 percentor more for 71 consecutive months. Since 1957, it has averaged 6 percent.Even in the face of annual advances of about $30 billion in GNP (annual
* Treatment of this question has been deleted from the latter part of the Testimonyas reprinted here, because it is considered in the text of the Report (Chapter 3, sub-section headed "The Trend of Labor Productivity").
168
Digitized for FRASER http://fraser.stlouisfed.org/ Federal Reserve Bank of St. Louis
rate), unemployment has not been diminishing. Thus, although GNProse from $556.8 billion in the third quarter of 1962 to $588.5 billion inthe third quarter of 1963, the unemployment rate remained the same inboth quarters. And even with a prospective increase of $100 billion in theGNP rate from early 1961 to early 1964 (a rise of 20 percent in currentdollars and about 15 percent in constant dollars), the unemployment ratewill have come down only about 1 l/<x percentage points in that 3-year period.
The persistence of this high level of unemployment is sometimes citedas evidence of structural difficulties which will blunt the effect of the pro-posed $11 billion tax cut now being considered by the Senate FinanceCommittee and make it difficult to reach the interim full-employment goalof 4-percent unemployment, let alone our ultimate goals beyond the 4-percent level. The structural problem will be examined in some detail laterin this statement. But here, several points should be noted to indicate whythe road to 4-percent unemployment is clearly open to demand-poweredmeasures:
1. The pre-1957 postwar performance of the U.S. economy givesample evidence of its ability to achieve 4 percent and even lowerlevels of unemployment without excessive strain.
2. The availability of 1.1 million excess unemployed workers (evenby the modest 4-percent criterion and not counting the labor forcedrop-outs resulting from slack job opportunities) and of sub-stantial excess capacity (even after large gains, the average operat-ing rate in manufacturing is running at only 87 percent of ca-pacity) demonstrates that we are still suffering from a seriousshortage of consumer and investment demand.
3. There are virtually no signs of economic tension, of the barriersthat would divert the force of demand stimulus away from higheroutput, more jobs and higher incomes into higher prices—thereare no visible bottlenecks in the economy, wage rate increaseshave been the most moderate in the postwar period, and the recordof price stability in recent years has been outstanding.
In reference to the first point, the unemployment rates in the first post-war decade deserve a further word. In the period of vigorous businessactivity in 1947 and 1948, unemployment averaged 3.8 percent of the laborforce. After the recession of 1949 and the recovery of 1950, the rate wasrelatively stable from early 1951 to late 1953, averaging 3.1 percent. Sincethat time, the rate has drifted upward. In the period of stable unem-ployment from mid-1955 to late 1957, unemployment averaged 4.3 per-cent, an increase of more than one-third above the 1951-53 period. In thefirst half of 1960, unemployment averaged 5.3 percent, nearly one-fourthabove the 1955-57 level. Following the recession and recovery of 1960-61, the rate fluctuated within a narrow range averaging 5.6 percent in1962 and 1963 to date, a little higher than early 1960. Looking at the 1947-
169
Digitized for FRASER http://fraser.stlouisfed.org/ Federal Reserve Bank of St. Louis
57 period, the average unemployment rate was below 4 percent in eachof the following years: 1947, 1948, 1951, 1952, and 1953, and below 4 / 2
percent in 1955,1956, and 1957.When one looks behind these figures to get a grasp of the economic con-
ditions that produced them, the most notable difference between the pre-1957 and post-1957 periods is found in the strength of market demand.In the first postwar decade, markets were strong. Backlogs of consumerdemand had to be worked off. The demands of the Korean conflict had tobe met. Outmoded plants and equipment had to be replaced or modern-ized, and capacity had to be enlarged. Deficiencies in housing, office fa-cilities, and public works had to be made up.
But 1957 marked a watershed. In the ensuing period, demand hasslackened at a time when our labor force growth has been accelerating inresponse to the postwar jump in the birth rate. Business fixed investmentdropped off from 10-11 percent of the GNP to only 9 percent—indeed, thelevel of such investment in 1962 barely struggled back to its level in 1956,while GNP was rising by nearly one-fifth (both in constant prices).
Thus, the clearest and most striking change since 1957 is the weakeningof demand. So the clearest and most urgent need today is to remove theoverburden of taxation which is retarding the growth in demand to fullemployment levels. Income tax rates enacted to finance war and fight in-flation—though reduced in 1954—are still so high that they would yielda large surplus of revenues over expenditures if we were at full employ-ment today. They are, in short, repressing demand and incentives in aneconomy operating well short of its capacity.
To avoid misunderstanding, it is important to stress that any employ-ment program would be unbalanced and incomplete without determinedmeasures (a) to upgrade and adapt the skills and education of the laborforce to the more exacting demands of our advancing technology and (b)to facilitate the flow of workers from job to job, industry to industry, andplace to place. Nevertheless, our principal reliance for a return to the 4-percent-or-better levels of unemployment we took for granted in the earlypostwar period must be on measures to boost demand for the productsof American industry and agriculture.
The amount of the increase in total demand which would be necessaryto reduce unemployment to the 4-percent interim-target level can be approx-imated in several ways. We have made direct estimates of the relationshipbetween unemployment rates and output levels; and we have independentlyestimated the potential GNP that the economy could produce at 4-percentunemployment. Both of these approaches yield consistent estimates of theoutput and demand requirements associated with 4-percent unemploymentat a given time. Except for small differences reflecting cyclical variationsin productivity and erratic fluctuations in labor force participation rates,these estimates of potential output (in constant prices) are very closelyapproximated by a 3 }4-percent trend line passing through actual GNP
170
Digitized for FRASER http://fraser.stlouisfed.org/ Federal Reserve Bank of St. Louis
in mid-1955. The several methods of computing potential GNP werereviewed in some detail in our Annual Reports both for 1962 and 1963, andare analyzed more fully in a recent paper by one of the Council's consult-ants.1 Although estimates of this kind cannot be precise—and efforts toimprove and update them as new data come in must continue—the carefulcross-checking by different methods provides confidence in their generalorder of magnitude.
These estimates show that the gap between actual GNP and the potentialGNP at 4-percent unemployment has been substantial in every year since1957. In both 1962 and 1963, it has approximated $30 billion.
Our analysis thus suggests that total demand for goods and services wouldhave had to average some $30 billion higher than it was in each of these past2 years for unemployment to average 4 percent. The basic purpose ofthe tax cut is to close that $30 billion gap—and to realize the benefits toemployment, growth and our international competitive position that willflow from this advance.
To be sure, by the time the full effects of the proposed two-stage tax cutwill be reflected in demand and output, the economy's potential will havegrown considerably, and total demand growth will therefore have to beconsiderably more than $30 billion. But when the tax cut lifts the expand-ing level of private demand in the U.S. economy by the extra $30 billion(in terms of 1963 GNP and price levels) that can confidently be expected,it will have achieved its basic purpose. Had this increase been effective dur-ing the past 6 years, it would have eliminated our persistent slack andallowed our unemployment rate to average 4 percent.
The process by which an $11.1 billion tax cut can add as much as $30billion to total demand has been frequently described and needs only to besummarized briefly here.
If the new proposed personal income tax rates were in full effect today,disposable after-tax incomes of consumers would be approximately $8.8billion higher than they are, at present levels of pretax incomes. In addi-tion, if the lower corporate tax rates were now in effect, after-tax profitswould be about $2.3 billion higher. Based on past dividend practice, onecan assume that corporate dividends received by individuals (after deduct-ing personal income taxes on such dividends) would then be more than$1 billion higher, giving a total increment of consumer after-tax incomes—at present levels of production—of about $10 billion.
Since consumer spending on current output has remained close to 93percent of disposable income in each of the past dozen years, one can safelyproject that consumer spending would rise by about 93 percent of the risein disposable incomes, or by over $9 billion.
1 Arthur M. Okun, "Potential GNP: Its,.Measurement and Significance," CowlesFoundation paper No. 190, reprinted from the 1962 Proceedings of the Business andEconomic Statistics Section of the American Statistical Association.
171
715-11J O-64-12
Digitized for FRASER http://fraser.stlouisfed.org/ Federal Reserve Bank of St. Louis
But this is far from the end of the matter. The higher production ofconsumer goods to meet this extra spending would mean extra employ-ment, higher payrolls, higher profits, and higher farm and professional andservice incomes. This added purchasing power would generate still furtherincreases in spending and incomes in an endless, but rapidly diminishing,chain. The initial rise of $9 billion, plus this extra consumption spendingand extra output of consumer goods would add over $18 billion to our an-nual GNP—not just once, but year-in and year-out, since this is a perma-nent, not a one-shot, tax cut. We can summarize this continuing processby saying that a "multiplier" of approximately 2 has been applied to thedirect increment of consumption spending.
But that is not the end of the matter either. For the higher volume ofsales, the higher productivity associated with fuller use of existing capacity,and the lower tax rates on corporate profits also provided by the tax billwould increase after-tax profits, and especially the rate of expected after-tax profit on investment in new facilities. Adding to this the financialincentives embodied in last year's tax changes, which are yet to have theirfull effect, one can expect a substantial induced rise in business plant andequipment spending, and a rise in the rate of inventory investment. Fur-ther, higher consumer incomes will stimulate extra residential construc-tion; and the higher revenues that State and local governments will receiveunder existing tax rates will prompt a rise in their investments in schools,roads, and urban facilities. The exact amount of each of these increasesis hard to estimate with precision. But it is reasonable to estimate theirsum as in the range of $5 to $7 billion. This extra spending would also besubject to a multiplier of 2 as incomes rose and consumer spending in-creased. Thus there would be a further expansion of $10 to $14 billionin GNP to add to the $18 billion or so from the consumption factor alone.The total addition to GNP would match rather closely the estimated $30billion gap.
II. T H E PERSISTENT PROBLEMS OF STRUCTURAL UNEMPLOYMENT
The tax cut would thus increase demand to levels consistent with a 4-percent rate of unemployment. It would ease our most pressing unemploy-ment problems. But no one can assume that our worries about unemploy-ment would then be over. Some of its most distressing and inequitableaspects would remain.
To be sure, tax-reduction will create new jobs in every community acrossthe Nation and expand employment in every industry. The overwhelmingmajority of American families will benefit directly from the income tax cutsthat will accrue to 50 million tax-paying individuals and 600,000 tax-paying corporations. Their direct rise in after-tax income will soon be trans-lated, through the marketplace, into stronger markets for all kinds of goodsand services and a quickening of the business pulse in all communities.
172
Digitized for FRASER http://fraser.stlouisfed.org/ Federal Reserve Bank of St. Louis
With average working hours already at a high level, this added demandand activity will in large part be translated, in turn, into additional jobs,and income for the unemployed. Thus, the non-taxpaying minority will,in a very real sense, be the greatest beneficiaries of the tax program.
Experience (which we will review later in this statement) clearly shows(1) that the unemployment rate will decline for every major category ofworkers and (2) that the sharpest declines will occur where the incidenceof unemployment is the highest: among teenagers, the Negroes, the less-skilled, the blue-collar groups generally.
But even so, the unemployment rates of many groups will still be intoler-ably high. Back in 1957, for instance, when the average unemploymentrate was just over 4 percent for the whole economy, the rates were muchhigher for many disadvantaged groups and regions—e.g., 10.8 percent forteenagers, 8.0 percent for nonwhites, 9.4 percent for unskilled manualworkers, and 11.5 percent for workers in Wilkes-Barre-Hazleton, Penn-sylvania.
These high specific unemployment rates, which persist even when the gen-eral rate falls to an acceptable level, are the essence of the problem of struc-tural unemployment. Even a fully successful tax cut cannot solve problemslike these by itself. They require a more direct attack.
To reduce the abnormally high and stubborn unemployment rate forNegroes requires a major improvement in their education and training andan attack on racial discrimination. To reduce the persistent high rate forthe unskilled and the uneducated groups demands measures to help themacquire skills and knowledge. To reduce excessive unemployment associatedwith declining industries and technological advance requires retraining andrelocation. To reduce high unemployment in distressed areas of Penn-sylvania, Michigan, Minnesota, and elsewhere calls for special measures torebuild the economic base of those communities and assist their workers.
Both the Administration and the Congress have recognized that thesemeasures must be taken concurrently with measures to expand aggregatedemand. Coal miners in Harlan County are structurally unemployed now,and so are Negro and Puerto Rican youths in New York City. Yet, pro-grams to reduce structural unemployment will run into severe limits in theabsence of an adequate growth of demand, i.e., in the absence of rapidexpansion of total job opportunities. Such expansion is needed to assurethat retrained and upgraded workers, for example, will find jobs at the endof the training period and will not do so at the expense of job opportunitiesfor other unemployed workers. As structural programs create new and up-graded skills, they will in some cases fit the participants for jobs that hadpreviously gone begging. But for the most part, the needed jobs must becreated by expansion of total demand.
Quite apart from the human significance of structural unemployment, italso has great economic importance. For only as we reduce structural and
173
Digitized for FRASER http://fraser.stlouisfed.org/ Federal Reserve Bank of St. Louis
frictional unemployment can we achieve the higher levels of total outputwhich would be associated with unemployment rates below our 4-percentinterim target. The Council emphasized this point in its 1963 Annual Report(p. 42), as follows:
"Success in a combined policy of strengthening demand and adapt-ing manpower supplies to evolving needs would enable us to achievean interim objective of 4 percent unemployment and permit us topush beyond it in a setting of reasonable price stability. Bottlenecksin skilled labor, middle-level manpower, and professional personnel[now] tend to become acute as unemployment approaches 4 percent.The result is to retard growth and generate wage-price pressures atparticular points in the economy. As we widen or break these bottle-necks by intensified and flexible educational, training, and retrainingefforts, our employment sights will steadily rise."
Every worker needlessly unemployed represents a human cost which of-fends the sensibilities of a civilized society. But each worker needlessly un-employed also represents a waste of potential goods and services, which evenan affluent society can ill afford. More intensive measures to attack struc-tural unemployment are necessary to reduce the unemployment rate notmerely to 4 percent, but beyond.
III . HAS STRUCTURAL UNEMPLOYMENT INCREASED?
The preceding section addressed itself to structural unemployment asa human and social problem and considered its role in the process of lower-ing the unemployment rate to and below 4 percent. But it is also appro-priate to ask: has structural unemployment increased to such an extentsince 1957—the last time unemployment was near 4 percent—that it willimpede the expansionary effects of demand-creating measures in generaland the tax cut in particular?
An affirmative answer would, we believe, represent a misreading of thefacts. As we have already pointed1 out, there are serious structural prob-lems, and prompt action is needed both to root out inequities and hardshipsthey inflict and to help us reach our employment goals. But this conclusionneed not—and does not—rest on a belief that there has been a dispropor-tionate surge in structural unemployment since 1957.
A reading of the evidence on this score must focus principally on whathappens, over time, to the unemployment rates of particular groups—teen-agers, untrained and unskilled workers, Negroes, and other disadvantagedgroups and regions—in relation to the total unemployment rate. It wouldclearly be misleading simply to compare unemployment rates for suchgroups in a year like 1957, when the total rate was about 4 percent, withthe corresponding rates in 1962-63, when the total rate has averaged 5.6percent. Rather, it is the relationship between the total rate and the groups'
174
Digitized for FRASER http://fraser.stlouisfed.org/ Federal Reserve Bank of St. Louis
rates—and its historical development—that reveals whether the structuralproblem is getting worse or not. And this relationship has been remarkablystable.
The disadvantaged groups almost invariably share more than propor-tionately—and the skilled and white-collar groups less than proportion-ately—in both decreases and increases in total employment. In the past,when the over-all unemployment rate has risen (or fallen) 1 percentagepoint, the rate for nonwhites and teenagers has risen (or fallen) by about2 percentage points, the rate for unskilled workers by about 2J4 percentagepoints. But the rate for professional and technical workers has risen orfallen by only about one-fourth of a percentage point.
One obvious reason for the disproportionate impact on teenagers isthat they are the most recent additions to the labor force. When new jobopportunities are few, there is a backing-up at the point of entry. Fur-thermore, even when they do find jobs, they tend to have the lowest seniorityand are therefore first to be laid off. Much the same is true of Negroes.Given existing patterns of discrimination, they are often in marginal jobsor at the bottom of seniority lists. Moreover, when jobs are scarce andlabor is plentiful, racial discrimination, where it exists, is more likely to enterinto hiring and firing decisions. And at such times, employers are also moreinclined to pass over inexperienced and untrained workers and less in-clined to press their own efforts to adapt such personnel to their needsvia in-service training programs. They tend to be less aggressive in seekingnew employees outside their own local labor markets. And labor supplyconsiderations are less likely to determine the location of new plants.
On the other hand, employers do not typically discharge many super-visory and technical personnel when output drops and, as a result, they donot need to expand their employment of such persons proportionately whenoutput rises.
Moreover, there are other reasons why the employment of many cate-gories of workers does not rise and fall in the same proportion as the total.Some disparities arise from the complex interrelationship between thecomposition and the level of total output. To cite just one example, therate of inventory accumulation is highly sensitive to the rate of expansionor contraction in total output, and goods that typically are inventoried tendto require large numbers of production workers. In contrast, the serviceindustries, whose output is not subject to inventory accumulation nor tosuch wide fluctuations in consumption, generally use more technical andwhite-collar workers.
Thus it is not surprising to find that slackened demand since 1957 has in-tensified inter-group and inter-regional disparities in unemployment ratesat the same time that it raised the total unemployment rate. Nonwhites,teenagers, unskilled and semi-skilled workers have suffered a greater-than-average increase in unemployment since 1957. But these same groups will
175
Digitized for FRASER http://fraser.stlouisfed.org/ Federal Reserve Bank of St. Louis
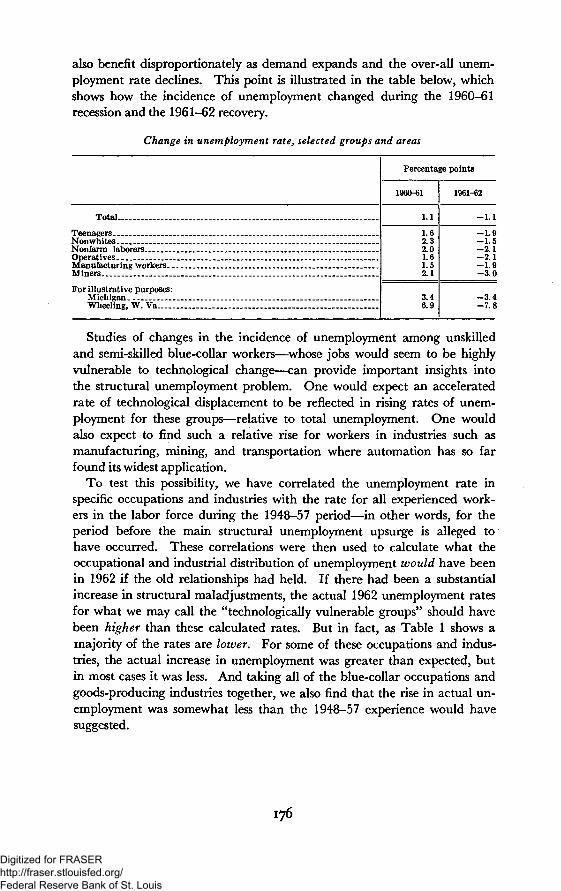
also benefit disproportionately as demand expands and the over-all unem-ployment rate declines. This point is illustrated in the table below, whichshows how the incidence of unemployment changed during the 1960-61recession and the 1961-62 recovery.
Change in unemployment rate,
Total
Teenagers.. __.NonwhitesNonfarm laborers __ _OperativesManufacturing workersMiners _
For illustrative purposes:MichiganWheeling, W. Va_
selected groups and areas
Percentage points
1960-61
1.1
1.62.32.01.61.52.1
3.46.9
1961-62
- 1 . 1
- 1 . 9- 1 . 5- 2 . 1- 2 . 1- 1 . 9- 3 . 0
- 3 . 4- 7 . 8
Studies of changes in the incidence of unemployment among unskilledand semi-skilled blue-collar workers—whose jobs would seem to be highlyvulnerable to technological change—can provide important insights intothe structural unemployment problem. One would expect an acceleratedrate of technological displacement to be reflected in rising rates of unem-ployment for these groups—relative to total unemployment. One wouldalso expect to find such a relative rise for workers in industries such asmanufacturing, mining, and transportation where automation has so farfound its widest application.
To test this possibility, we have correlated the unemployment rate inspecific occupations and industries with the rate for all experienced work-ers in the labor force during the 1948-57 period—in other words, for theperiod before the main structural unemployment upsurge is alleged tohave occurred. These correlations were then used to calculate what theoccupational and industrial distribution of unemployment would have beenin 1962 if the old relationships had held. If there had been a substantialincrease in structural maladjustments, the actual 1962 unemployment ratesfor what we may call the "technologically vulnerable groups" should havebeen higher than these calculated rates. But in fact, as Table 1 shows amajority of the rates are lower. For some of these occupations and indus-tries, the actual increase in unemployment was greater than expected, butin most cases it was less. And taking all of the blue-collar occupations andgoods-producing industries together, we also find that the rise in actual un-employment was somewhat less than the 1948-57 experience would havesuggested.
176
Digitized for FRASER http://fraser.stlouisfed.org/ Federal Reserve Bank of St. Louis
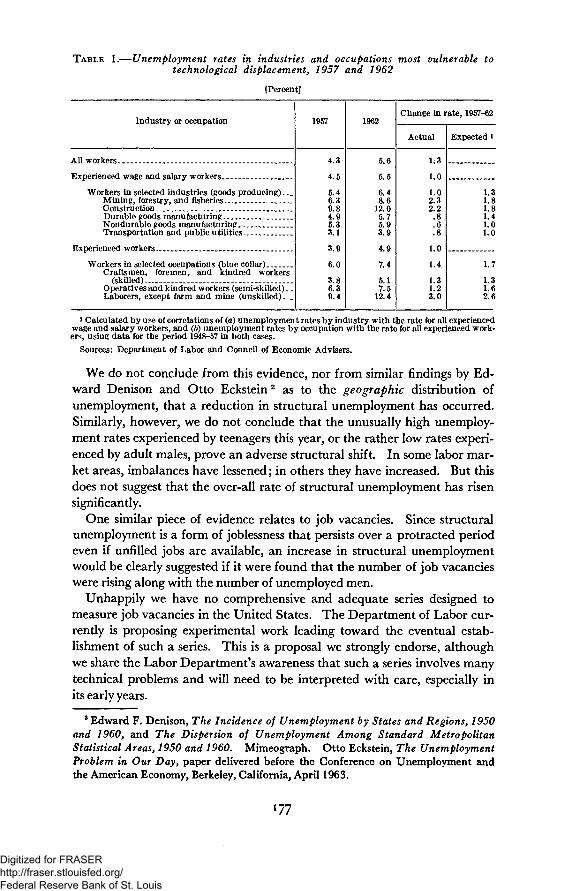
TABLE 1.—Unemployment rates in industries and occupations most vulnerable totechnological displacement, 1957 and 1962
[Percent]
Industry or occupation 1957 1962Change in rate, 1957-62
Actual Expected'
All workers _._
Experienced wage and salary workers.
Workers in selected industries (goods producing)...Mining, forestry, and fisheriesConstruction.Durable goods manufacturingNondurable goods manufacturingTransportation and public utilities
Experienced workers..
Workers in selected occupations (blue collar)Craftsmen, foremen, and kindred workers
(skilled)..Operatives and kindred workers (semi-skilled) _.Laborers, except farm and mine (unskilled)...
4.3
4.5
5.46.39.84.95.33.1
6.0
6.39.4
5.6
5.5
6.48.6
12.05.75.93.9
4.9
7.4
5.17.5
12.4
1.3
1.0
1.02.32.2.8.6.8
1.0
1.4
1.31.23.0
1.31.81.81.41.01.0
1.7
1.31.62.6
* Calculated by use of correlations of (a) unemployment rates by industry with the rate for all experiencedwage and salary workers, and (b) unemployment rates by occupation with the rate for all experienced work-ers, using data for the period 1948-57 in both cases.
Sources: Department of Labor and Council of Economic Advisers.
We do not conclude from this evidence, nor from similar findings by Ed-ward Denison and Otto Eckstein2 as to the geographic distribution ofunemployment, that a reduction in structural unemployment has occurred.Similarly, however, we do not conclude that the unusually high unemploy-ment rates experienced by teenagers this year, or the rather low rates experi-enced by adult males, prove an adverse structural shift. In some labor mar-ket areas, imbalances have lessened; in others they have increased. But thisdoes not suggest that the over-all rate of structural unemployment has risensignificantly.
One similar piece of evidence relates to job vacancies. Since structuralunemployment is a form of joblessness that persists over a protracted periodeven if unfilled jobs are available, an increase in structural unemploymentwould be clearly suggested if it were found that the number of job vacancieswere rising along with the number of unemployed men.
Unhappily we have no comprehensive and adequate series designed tomeasure job vacancies in the United States. The Department of Labor cur-rently is proposing experimental work leading toward the eventual estab-lishment of such a series. This is a proposal we strongly endorse, althoughwe share the Labor Department's awareness that such a series involves manytechnical problems and will need to be interpreted with care, especially inits early years.
2 Edward F. Denison, The Incidence of Unemployment by States and Regions, 1950and I960, and The Dispersion of Unemployment Among Standard MetropolitanStatistical Areas, 1950 and 1960. Mimeograph. Otto Eckstein, The UnemploymentProblem in Our Day, paper delivered before the Conference on Unemployment andthe American Economy, Berkeley, California, April 1963.
177
Digitized for FRASER http://fraser.stlouisfed.org/ Federal Reserve Bank of St. Louis
But meanwhile the only available indicator that bears upon the job-vacancy situation is the National Industrial Conference Board's index of thenumber of help-wanted advertisements published in the classified section ofa leading newspaper in each of 33 leading labor market areas. While thisseries does a good job of reporting what it is designed to report, obviouslyit provides a comparatively sketchy and imperfect indication of job vacan-cies. All the same, it is interesting that, after adjustment for changes in thesize of the labor force, the help-wanted index was substantially lower in1960 and 1962 than in 1955-57, when the total unemployment rate wasabout 4 percent. We have further adjusted the index for changes in the totalunemployment rate in order to screen out the effects of slack demand. Evenin this form the index fails to rise significantly since 1957—as one wouldexpect it to do if underlying structural unemployment had broadened.
The evidence reviewed above does not yield persuasive indications thatstructural elements are today a significantly larger factor in our unemploy-ment than in 1957. Nevertheless, it would not be surprising if some par-ticular aspects of structural unemployment have intensified. One wouldassume that the longer a period of slack persists, the more likely it would bethat the detailed structure of skills, experience, and training of the laborforce would fail to reflect fully the pattern of job requirements at highlevels of employment. High employment in 1967 will call for a somewhatdifferent pattern of jobs than existed in 1957, and a slack labor market doesnot accurately foretell what that pattern will be. Moreover, there is dangerthat, after a long period of slack, new hiring standards, habits of mind, andexpectations appropriate to an "easy" labor market will have becomeentrenched, rationalizing increased discriminations against disadvantagedgroups. Thus, after the period of prolonged slack since 1957, there is moreneed than in the usual "cyclical" recovery for an effective program of specificlabor-market policies to assist demand-stimulating policies in tailoring mento jobs and jobs to men.
IV. SHIFTING EDUCATIONAL REQUIREMENTS AND POSSIBLE SKILLED
MANPOWER BOTTLENECKS
In recent weeks—partly before this Committee, partly elsewhere—par-ticular attention has been given to one aspect of the problem of structuralmaladjustments. This is the question of whether a recent shift in the paceand character of technological change has accelerated the long-term risein job educational and skill requirements in a way that imposes a new bottle-neck an expansion. The issue merits special discussion because of theobstacle to the employment-expanding effects of the tax program that thisskilled-manpower bottleneck is alleged to present.
The argument is that the nature of recent technological change has causeda rapid shift in the pattern of manpower demand, pushing down the demandfor workers with little training and pushing up the demand for the highly
Digitized for FRASER http://fraser.stlouisfed.org/ Federal Reserve Bank of St. Louis
educated. Everyone agrees that the educational level of the Nation'spopulation has continued to advance, causing the supply of highly educatedmanpower to grow rapidly, and the supply of relatively uneducated man-power to decline. Thus the concern expressed is not about keeping pacewith an absolute increase in job educational requirements—which have beenrising right along—but about being unable to keep pace with an abruptrecent rise in such requirements.
It is feared that as demand increases, there will not be enough highlyeducated workers to fill the key technical and professional positions thatmust be manned if production is to expand to levels consistent with 4-per-cent unemployment; that, in consequence, expansion of output will be frus-trated; and that, because of this, high percentages of the remainder ofthe labor force—including poorly educated workers—will be left unem-ployed.
It is important to distinguish this quite specific point about near-termbottlenecks from other propositions about the economic importance of edu-cation. It is unquestionably true, we believe, that greatly reinforced edu-cation is needed to press the attack on the pockets of long-term structuralunemployment that have plagued the economy for a long time.
It is unquestionably true, moreover, that educational attainment enor-mously affects the employment prospects of the individual. Whether theeconomy is booming or stagnating, the poorly educated always come offsecond best. A grade school graduate is 5 times likelier to be unemployedthan is a college graduate. Today's school dropouts are tomorrow'sunemployed.
It is further well-known that long-term shifts, which can be projected tocontinue, in the relative importance of various industries, and long-termtrends in technological development, are, on the whole, raising (as well asaltering) educational requirements. The Report on Manpower Require-ments, Resources, Utilization, and Training by Secretary Wirtz last Marchindicated the nature of these continuing shifts, including projections bybroad groups to 1970 and 1975. The clearly indicated rise in the require-ment for professional, technical, and kindred workers—teachers, scientists,physicians, engineers, technicians, and nurses—pose obvious demands oneducation in general and higher education in particular. And increaseddemands for many special skills create needs for expanded programs ofvocational education and for more persons with a basic high school educa-tion. These long-term trends are not at issue in the present discussion.
Likewise, there can be little doubt about the enormous importance ofeducation as an engine for stimulating the long-term growth of our produc-tive potential. Edward Denison has estimated that 42 percent of the in-crease in output per worker between 1929 and 1957 was the result of edu-cation and another 36 percent the result of the general advance in the ap-plication of scientific and technological knowledge to which our educational
179
Digitized for FRASER http://fraser.stlouisfed.org/ Federal Reserve Bank of St. Louis
process and institutions clearly were heavy contributors. All of these areextremely important—in fact, conclusive—reasons for strengthening oureducational programs. But they should not be confused with the view thateducational deficiencies prevent the solution of our current problem ofexcessive unemployment, and, specifically, that near-term manpower bot-tlenecks will significantly restrain a demand expansion—stimulated by a taxcut—from accomplishing its employment objective.
The statistical testing of the educational bottleneck hypothesis turns out,if properly done, to be a very complex undertaking. There are problems ofthe noncomparability between Decennial Census data and informationdrawn from Current Population Surveys; of the lack of appropriate annualseries; of calculating appropriate current full-employment labor-force par-ticipation rates for particular age and educational-attainment groups insteadof arbitrarily projecting the rates of a remote year; and of including notmerely the male but the female components of our population . . .
. . . however, some reliable impressions already have emerged from thefigures at hand. One is that, while there does appear to have been some risein the demand for highly educated workers relative to their supply duringthe postwar period as a whole, the timing of this change is crucial for pur-poses of evaluating the bottleneck thesis. Since the economy operated atapproximately a 4-percent unemployment rate in the mid-fifties withoutencountering serious skilled-manpower bottlenecks the key question iswhether most of this shift occurred before or after the 1955-57 period.Hence a shift in job educational requirements relative to supply that hadoccurred before those years, and was not serious enough to obstruct expan-sion then, poses little threat to a new move back toward 4-percent unemploy-ment now.
The available unemployment data seems to show that whatever shift mayhave occurred in job educational requirements relative to supply did occurprior to 1957. Indeed it may have been partially reversed since that time.From 1957 to 1962, for example, the unemployment rate for male workerswith an 8th grade education or less rose by about one-half, roughly the sameas the rate of overall unemployment. But the unemployment rate for collegegraduates rose from 0,6 percent to 1.4 percent.
In addition to unemployment rates, the percentages of labor-force par-ticipation by groups of different educational attainments also have changedduring the postwar period. Here the data currently in hand do not permitus to locate the timing of these changes to the degree that has been possiblewith the unemployment rates. And so we simply do not know whether here,too, the shift toward greater participation by the well-educated, and lesserparticipation by the poorly educated, may largely have occurred before1957.*
* From data examined since the Testimony was prepared, it appears that the shifttoward greater participation by the well educated primarily occurred before 1957; asto the poorly educated, roughly half of the shift toward lower participation occurredprior to and half after 1957.
180
Digitized for FRASER http://fraser.stlouisfed.org/ Federal Reserve Bank of St. Louis
If, in the absence of information, one assumes that the shift in relativeparticipation rates occurred more recently, one might conclude that therehave been some withdrawals from the labor force by poorly educated maleworkers. Whenever they occurred, they present an obvious challenge toboth public and private training programs. But the magnitude of theseshifts is easily exaggerated—especially if one fails to make adequate allow-ance for the improvements in retirement programs during the past dozenyears. It is clear that the vast majority of the so-called "losses" of lesseducated workers from the male labor force were concentrated in the 65-and-older age group.
In any event . . . none of this goes to the real nub of the issue. Thatnub is the failure of the bottleneck hypothesis to make any allowance for theproven capacity of a free labor market—especially one endowed with ahigh average level of education and enterprise and expanding programsto improve labor skills and mobility—to reconcile discrepancies betweenparticular labor supplies and particular labor demands.
If relative shortages of particular skills develop, the price system and themarket will moderate them, as they always have done in the past. Em-ployers will be prompted to step up their in-service training programs and,as more jobs become available, poorly skilled and poorly educated workerswill be more strongly motivated to avail themselves of training, retraining,and adult education opportunities. Government manpower programs be-gun in the 1961-63 period will also be operating to help ease the adjustmentof specific shortages.
As for the personnel with the very highest skills, many—for the veryreason that they are scarce—have been "stockpiled" by their employersand are not working to capacity when business is slack. As business picksup, they will be used more fully—and they will be used more efficiently.As engineers become scarce, and more expensive, their talents will be con-centrated on engineering assignments, leaving drafting (for example) fordraftsmen, who can be trained more quickly.
Naturally, most college graduates will have jobs no matter how highthe unemployment rate in the whole economy, even if they have to workbelow the level for which they are qualified. If they are already in thesupervisory or technical jobs for which they are best qualified, their em-ployers will not have to increase by 10 percent the number of such jobs inorder to increase total employment by 10 percent. And to the extent thatthey are not already in such jobs, they are a hidden reservoir of superiortalent.
The highly-educated-manpower-bottleneck argument arrives at its alarm-ing conclusion by projecting to new situations a perfectly static set of educa-tional requirements. The argument makes no allowance for flexibility inthe system. Flexibility, of course, is not unlimited. If we were talking aboutaccomplishing a massive increase in output within a few months, manpowerbottlenecks might indeed become critical. But we find it unrealistic to be-
181
Digitized for FRASER http://fraser.stlouisfed.org/ Federal Reserve Bank of St. Louis
lieve that they represent a major constraint upon an extra $30 billion ofoutput in what will soon be a $600 billion economy—especially when (a)there are virtually no current signs of tension in either labor markets orproduct markets and (b) the demand expansion that will accomplish theclosure will be spread over 2 or more years in which continuing new sup-plies of highly trained manpower will be entering the labor market.
At the beginning of Section III the question was raised whether struc-tural elements in unemployment have grown so much since 1957 that theythreaten to impede an economic expansion induced by the tax cut. In Sec-tions I I I and IV we have examined this question from a number of direc-tions, and we now summarize our answer.
The answer is clear: The evidence we have assembled and the tests wehave made do not support the thesis that, over-all, the incidence of struc-tural unemployment has increased in importance since we last achieved highemployment. There may be some problems that seem more serious todaythan earlier; but in other areas we have probably progressed.
Expansion of the economy in response to a stepping-up of the growth ofdemand will not be impeded by pockets of surplus labor existing in a limitednumber of categories—we have always had distressing surpluses in certaincategories, and the tax cut will not fully eliminate them. Economic expan-sion could eventually be impeded by shortages in strategic categories of skillsand training, but the statistical evidence reveals no such shortages enroute to4-percent unemployment.
It is difficult to believe that an economy that was able to absorb thedramatic shifts needed to convert to war production in World War II,and that operated at unemployment levels as low as 1.2 percent during thatwar and more recently (1953) at 2.9 percent, could not move ratherreadily, over the space of 2 or 3 years, to our interim target of 4-percentunemployment.
Unsatisfied as we all must be with our Nation's achievements in educa-tion—and with the distressing problem of school dropouts—we must notdisregard the fact that our labor force today is better educated and, as aresult, more flexible than ever before. The median level of educationamong the adult male members of the labor force has risen by an astonish-ing 50 percent since the beginning of the Second World War. Newentrants into the labor force are on the average better equipped than everbefore to respond to a changing pattern of demand. By 1966, when thefull effects of the tax cut will be apparent, the ranks of trained workerswill have been swelled by two more annual graduating classes from our highschools, colleges, and professional and graduate schools. In each case, thesize of the groups will dwarf all previous records.3
8 For example, the projected numbers graduating from college (bachelors or firstprofessional-degrees) in 1964 and 1965 will be about 30 percent above the numbersgraduated in 1959 and 1960. By 1970, the estimated number will exceed 1960 by85 percent.
182
Digitized for FRASER http://fraser.stlouisfed.org/ Federal Reserve Bank of St. Louis
Our own recent economic history assures us of the economy's ability toadapt to rapid change. Additional assurance along this line is found in theexperience of other countries whose systems and values are similar to ourown. During the past decade, the Western European economy has under-gone staggering structural changes. France and Belgium have adjustedto the decline of important mining areas, Germany to the inflow of millionscf refugees from the East, and Italy to the problem of absorbing largenumbers of poorly educated rural migrants into urban occupations. Andall of Western Europe has adjusted to the replacement of obsolete capital,and of productive methods often unchanged for a century or more withmachinery and methods geared to the most advanced technology in theworld. The advance of productivity has been revolutionary. During the19505s, output per manufacturing worker increased 2^4 times as fast inGermany as in the United States, 3 times as fast in France, and 4 times asfast in Italy. In their adjustment to these changes the Europeans, thoughthey may have other advantages, did not have the advantage of a laborforce nearly as well educated, as well trained, as mobile, or as flexible asours.
Nonetheless, the Europeans have maintained unemployment rates con-siderably lower than ours. After adjustment for conceptual differences,the unemployment rate in 1960 was 1.0 percent in Germany, 1.9 percentin France, and 4.3 percent in Italy. In Italy and Germany these low ratesrepresented a considerable improvement over earlier postwar experience,and the higher Italian rate has subsequently declined materially.
The major explanation for such low unemployment rates in economiesundergoing such profound transitions lies in the maintenane of a very highlevel of demand. During the 1950's the average annual growth rate inFrance was 4 percent, in Italy, 6 percent, and in Germany, over 7 percent—and both Italy and France have had even higher rates so far in the 1960's.This experience demonstrates beyond any doubt that, under the stimulus ofadequate demand, and with the aid of active labor market policies, moderneconomies are sufficiently resilient to absorb poorly educated workers, toadapt to skill shortages, and to adjust to rapid technological change in amanner which maintains extremely low unemployment rates. This Euro-pean experience—which in broad outline has been matched in Japan—reassures us that, once high and growing demand presses our capacity, wetoo will adapt to rapid change and maintain our economic health.
Structural unemployment is a human and an economic problem that wemust attack by every means available. But the expansion of total demandthrough tax reduction remains the crucial central element in our attack uponunemployment.
Digitized for FRASER http://fraser.stlouisfed.org/ Federal Reserve Bank of St. Louis
V. T H E RATE OF GROWTH OF PRODUCTIVITY*
VI. T H E CHALLENGE OF AUTOMATION**
In a way it is surprising how reluctant we are to embrace the higherproductivity levels and living standards which "automation" makes pos-sible. Some of the more popular literature on the subject treats it as a newand frightening development. But in fact, it is only the most recent aspectof a continuing process of technological advance that dates back to the be-ginning of the Industrial Revolution. Taking full advantage of this process,the United States has built the most productive and most remunerativeeconomy in the world. Through time, brute strength has been progres-sively replaced by simple machines, mechanical power, complex machines,assembly lines, and today increasingly by sophisticated automatic feedbacksystems. At each stage of the process individuals were temporarily dis-placed from existing jobs, new skills were found to be needed and were ac-quired, and total output and employment expanded as demand increasedin line with the new higher production capabilities.
Ultimately the total effect has always in the past been a higher standardof living for almost everyone—higher pay for workers, cheaper and betterproducts for consumers, and larger profits for businessmen and stockholders.On the basis of our historical experience, automation should be recognizedfor what it is—an open door to a more productive economy, to higherlevels of private consumption, to more effective public services, and tolarger resources for the support of our international objectives.
Despite this historical record, it is occasionally argued that the newesttechniques are becoming so much more productive than those they replacethat we cannot possibly adjust to them as smoothly as in the past. As in-dicated earlier, the evidence available to date does not enable us to drawfirm conclusions about the prospective rate of increase in productivity.Yet, it is clearly possible that as the newest production techniques are in-creasingly embodied in new capital, the future growth of productivity willspeed up.
Should this possibility be a source of concern? Rather than viewing itwith concern or alarm, we would argue that we should work as hard aswe can for faster productivity growth—indeed, it holds the key to successof our national policies for faster economic growth and for the cost-cuttingthat is essential to our international competitive position. It is a primeobjective of this year's tax bill as well as last year's special tax stimulantsto investment.
Doubts about our ability to adjust to automation seem to be based on twoquestions: Can we really use the enlarged output of goods and services
*The text of this section has been deleted because the same material is covered—using more recent data—in Chapter 3 of the Report, especially in the subsectionheaded "The Trend of Labor Productivity."
**Parts of this section overlap with material contained in the text of the Report.
184
Digitized for FRASER http://fraser.stlouisfed.org/ Federal Reserve Bank of St. Louis
made possible by a rising rate of productivity advance? Will the new speedand character of technological change create impossible problems of ad-justment for the labor force?
Those who raise the first question sometimes argue that we cannot possiblyconsume all that the new techniques can produce—that the persistent highlevel of unemployment over the past few years is evidence of "satiation"—that the fantastic productivity of the American economy has outdistancedthe needs of the American people. What do the facts show?
First and most obvious, it is impossible to square this notion with thepersistence of poverty in the American economy. We are indeed an affluentsociety, by every comparative standard. Nonetheless, even in this age ofaffluence, one-fifth of American families still have annual incomes below$3,000—that is, they live in poverty. To them, the suggestion that we areeconomically satiated must seem ridiculous, if not cruel. Until our societyhas met the challenge of poverty in the midst of plenty, it is in no danger ofbeing satiated with goods and services.
But—quite apart from the persistence of poverty—there is nothing in theeconomic behavior of even the more affluent American consumers to sup-port the satiation hypothesis. At all income levels—except perhaps in thetop 2 or 3 percent of the income-wealth distribution—the ratio of consump-tion to disposable income is one of our most stable economic relationships.Year-in, year-out—ever since 1950—American consumers have continuedto spend from 92 to 94 percent of their aggregate disposable income—theirincome after taxes—on consumer goods and services. During this periodtotal income and average family income have both risen markedly; but thereis no evidence of any growing disinclination to spend a stable and highpercentage of each additional dollar of income on consumption. Even thosein the upper "middle" income groups who are already able to meet withoutstrain the basic requirements for food, clothing, housing, and transportationfind that they have ample, and often urgent uses, for additional incomes.This may take the form of an improved quality or manner in which basicrequirements are satisfied—a larger house, a newer car—or it may take theform of meeting new and different demands: longer and more rewardingvacations, better education for one's children, better medical care, morebooks and more concerts, and more expensive hobbies.
This does not, of course, rule out the possibility that—as in the past—some, many, or even all of us will prefer to forego still higher income in favorof greater leisure in the form of shorter hours, longer vacations, or earlierretirements. (There are indications, incidentally, that many people find iteasier to become satiated with leisure than with income!)
In addition to unsatisfied private consumption needs, there are pressingneeds for goods and services which are ordinarily and in some cases in-evitably provided by the public sector. Admittedly there is disagreementas to just which of these "public goods" most need to be increased. Thereare also differences of opinion as to which levels of government should under-
Digitized for FRASER http://fraser.stlouisfed.org/ Federal Reserve Bank of St. Louis
take expanded activities. Nevertheless, almost all major segments of theAmerican community support increases in the level of one or another of such"public" goods and services, whether they be, for example, urban renewal,or improved health services, or better schools, or better roads and airports,or purer water and air, or more adequate facilities in national parks. Cer-tainly none of this bespeaks a satiated society.
In a somewhat different vein, it should also be noted that technologicallyadvancing societies also generate high levels of investment demand, demandfor producer goods like machines, equipment, buildings. In large part, ofcourse, this reflects the favorable impact of new technological developmentson the profitability of investment. During most of our history, Americanbusiness has responded to such opportunities by enlarging its investment out-lays. Postwar Western Europe and Japan provide examples of economieswith impressive rates of productivity increase along with buoyant demand,reflecting—more than anything else—extremely high quotas of investment.
Clearly, we need not fear that the increasing productivity associated witheven a speeded-up rate of technological progress will founder upon a con-tradiction between our needs and our ability to satisfy them. As people con-tinue to receive the extra incomes which our enlarging production can gen-erate, they will also continue to use those extra incomes to buy the enlargedoutput—for private and public consumption and for investment.
The second question raised about our ability to adjust to automation con-cerns the labor force adjustments it necessitates.
If the advance of technological progress has speeded up, it is reasonableto suppose that, as a by-product, the rate at which particular skills arerendered obsolescent is also increasing. But a further and different pointis sometimes made, namely, that automation (in its narrower technicalsense) is shifting not merely the rate but the character of skill requirementsgenerated by technological change. Previously, it is suggested, technolog-ical change simplified the work process and hence created many semi-skilled jobs, which could be filled by workers with little training. Automa-tion, however, reintegrates the production process and thus eliminates manyunskilled and semi-skilled jobs.
Whether this interpretation is correct is a highly complex empiricalquestion. Many of the jobs displaced by automation are low-skilled andsome of the jobs added are extremely high-skilled. The design and installa-tion of automation equipment surely requires highly trained personnel.Yet the need for these people is clearly limited, and they do not stay withthe equipment long after installation. Once in operation, the equipmentmay actually diminish rather than raise skill requirements. Examples ofhighly automated installations have been cited where all of the maintenanceis done by high school graduates with a fairly short trade school course inelectronic repair. High skills are required for the programming function,but this also tends to be concentrated in the initial stages and "canned"programs are increasingly available in some applications. A good deal
186
Digitized for FRASER http://fraser.stlouisfed.org/ Federal Reserve Bank of St. Louis
more study and experience is needed before we can safely generalize aboutthe impact of automation on skill requirements for the labor force as awhole.
Beyond the question of how automation (in the narrow sense) affectsaverage skill requirements lies the broader question of the impact on labormarkets of any general acceleration that may occur in the rate of tech-nological advance. This broader question involves at least two dimensions.
A "vertical" dimension relates to the impact of speeded technologicalchange on the long-term rate of increase in the average educational contentof jobs. As noted repeatedly, our past rapid increase in educational levelshas both responded to and helped bring about our steady technologicaladvance and rising productivity. The exact nature of the complex inter-relationships between the average educational accomplishment of the laborforce, job educational requirements, and a further speeding up of the paceof technological advance is a matter for some speculaion. But whateverthe answer, more and better education will continue to have one of thehighest priorities among the values of American society.
The "horizontal" dimension of our question requires less speculation. Wecan be certain that a speeded pace of technological change will increase therate of job displacement, and will require even greater attention to measuresfor improving labor mobility, for training and retraining of workers, andfor an effective level of basic education to promote adaptability and flexi-bility. The possibility of an accelerated pace of technical change thusunderscores an already powerful case for stonger labor market policies tomeet existing problems of displacement.
Our past economic growth has brought unparalleled levels of well-beingfor all in our society. Today we need and we actively seek even higher levelsof productivity, to help us solve both domestic and international problems.If, as a result of our policies to stimulate investment and improve efficiency,or as an unexpected bonus from autonomous developments in technology,the U.S. rate of productivity growth accelerates, we may encounter problems,but we will reap large rewards. If we pursue appropriate policies, we canmeet the challenge of automation.
VII. CONCLUSIONS
This statement has been long and necessarily complex. But the issuesinvolved are of the highest urgency and significance for the economic futureof our Nation, and they are far from simple. In so characterizing them weknow we share the view of this Subcommittee, which has been so tirelesslypursuing all aspects of this subject.
We have tried to draw our conclusions from the evidence as we have gonealong, and therefore need only pull them together here. These are ourprincipal conclusions:
187
715-113 O-64-13
Digitized for FRASER http://fraser.stlouisfed.org/ Federal Reserve Bank of St. Louis
1. Enactment of the major tax reduction program which is now before theSenate is a necessary condition for solution of the problems that concernthis Subcommittee. It will directly add $30 billion to total output and create2 to 3 million extra jobs. Without the continuing lift in total demands forgoods and services that the tax program is designed to accomplish, littleprogress can be expected in reducing and eliminating problems of excessiveunemployment for the Nation as a whole. Had this lift in demand beeneffective in the years 1958 through 1963, it would have overcome economicslack; achieved a considerably higher level of output of needed goods andservices; maintained unemployment rates comparable with those realized inthe years before 1957; and—in the process—reduced or eliminated ourbudget deficits.
2. Although tax reduction will alleviate, it will not by itself cure, long-standing problems of structural unemployment, of incomplete adaptationof the structure of our labor force to the structure of demand, of regional im-balances, and of consequent hardship, inequity, and inefficiency. The needto attack these problems stems, first, from our concern to alleviate un-necessary human distress. Second, it stems from the desire to convert un-productive and unwanted idleness into productive employment, so that wecan increase our output of needed goods and services even beyond the poten-tial output associated with our interim target of a 4-percent rate of unem-ployment. And third, if the rate of technological displacement of workersis in the process of accelerating, it will need to be matched by a similarincrease in the mobility and adaptability of our labor force.
This Administration has placed high priority upon measures to accelerateour productivity gains—through the stimulation of investment by tax meas-ures, the improvement of technology in lagging sectors of the civilian econ-omy, and in other ways—with the urgent purpose of improving the com-petitive position of American producers in world markets and of steppingup our long-term growth rate. It has promoted policies designed to realizethe benefits of maximum productive efficiency—policies which may requireshifts in our resource use and consequent displacement of labor.
It would be irresponsible not to complement these policies with othersdesigned to facilitate the transfer of resources and to ease necessary burdensof adjustment—as, indeed, was done in the "adjustment" provisions of theTrade Expansion Act.
Without attempting to be comprehensive, we can indicate some of theimportant channels of attack on structural problems:
—improved labor market information services;—improved guidance and placement services;—improved programs of apprenticeship;—strengthened programs to reduce discriminatory hiring and employ-
ment practices by race, sex, or national origin;—expanded and more effective programs of vocational education, gen-
eral adult education, and retraining;
188
Digitized for FRASER http://fraser.stlouisfed.org/ Federal Reserve Bank of St. Louis
—basic improvements in the quality of our educational system at alllevels;
—measures to enlarge educational opportunities for children of low in-come families and minority groups;
—programs to assist the geographical movement of workers;—expanded policies to strengthen the economic base and to speed the
economic growth of distressed communities and regions.The tax cut and other measures to expand total demand are no substitute
for policies like these; while these policies, in turn, are no substitute for atax cut. Yet a more vigorous expansion of demand will release forces thatwill powerfully aid in the solution of structural problems. The existenceof a stronger demand for labor will by itself strengthen the incentives forworkers to undertake training or retraining and for employers to help pro-vide it; will attract workers to move to the places where jobs are plentifuland stimulate employers to assist such movement; will ease the financialburdens on local communities in undertaking improvements in their educa-tional systems; will reduce discriminatory practices both by employers andby unions; and will increase the effectiveness of the free-market price sys-tem in encouraging appropriate adjustments of both labor supply and labordemand, the need for which is now partly obscured by slack markets.
3. Important as is the attack on structural problems, we need not fearthat structural obstacles will block a healthy expansion of jobs and out-put resulting from the tax cut. The feasibility of our 4-percent interimtarget assumes not some newly perfected system of labor market adjust-ment but the labor market as it exists today with its present adjustmentmechanism. Possible and desirable improvements in our labor market ad-justment processes can smooth and accelerate achievement of the interimtarget. And they can permit us to penetrate beyond it to even lower un-employment rates. But it is on demand stimulus that we must rely to getto the provisional 4-percent objective.
4. There are hopeful hints in the most recent evidence that we may beachieving a somewhat higher rate of average productivity growth than inthe past, although it is too early to be sure. If our potential output perworker should grow more rapidly in the future than in the past, it wouldmean that an even more rapid expansion of total demand would be re-quired to reach and maintain reasonably full employment of the labor force.But we see no basis for fears that our wants and needs are already satiated,or that total spending will fail to rise with potential output and thus thwartfaster expansion. It is true that demand does not automatically adjust, year-by-year, to the growth of potential output. But there is no reason to supposethat demand is more likely to be deficient when potential output is morerapidly growing, than when growth in potential output is less dynamic.On the contrary, the conditions that are conducive to faster productivitygrowth are also conducive to more rapid expansion in private demands.
Digitized for FRASER http://fraser.stlouisfed.org/ Federal Reserve Bank of St. Louis
Instead of fearing an accelerated growth of productivity, we should anddo seek it
—to achieve more fully our private and public domestic economic goals;—to help us correct our balance-of-payments deficit;—and to raise the standard and quality of life for all of our citizens.
190
Digitized for FRASER http://fraser.stlouisfed.org/ Federal Reserve Bank of St. Louis
Appendix B
REPORT TO THE PRESIDENT ON THE ACTIVITIES OFTHE COUNCIL OF ECONOMIC ADVISERS DURING 1963
191
Digitized for FRASER http://fraser.stlouisfed.org/ Federal Reserve Bank of St. Louis
LETTER OF TRANSMITTAL
DECEMBER 31, 1963.
The PRESIDENT.
SIR : The Council of Economic Advisers submits this report on its activi-ties during the calendar year 1963 in accordance with the requirements ofCongress, as set forth in Section 4(d) of the Employment Act of 1946.
Respectfully,WALTER W. HELLER, Chairman.GARDNER AGKLEY
JOHN P. LEWIS
192
Digitized for FRASER http://fraser.stlouisfed.org/ Federal Reserve Bank of St. Louis
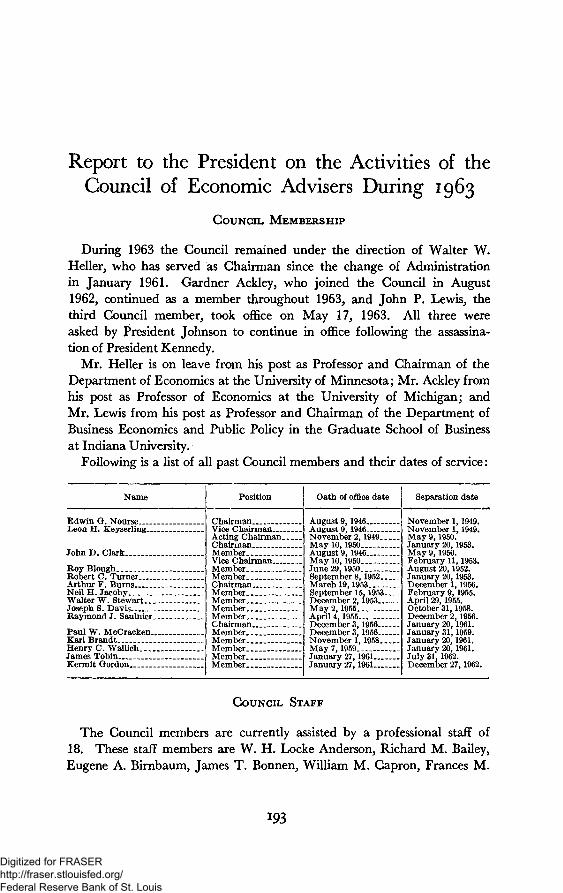
Report to the President on the Activities of theCouncil of Economic Advisers During 1963
COUNCIL MEMBERSHIP
During 1963 the Council remained under the direction of Walter W.Heller, who has served as Chairman since the change of Administrationin January 1961. Gardner Ackley, who joined the Council in August1962, continued as a member throughout 1963, and John P. Lewis, thethird Council member, took office on May 17, 1963. All three wereasked by President Johnson to continue in office following the assassina-tion of President Kennedy.
Mr. Heller is on leave from his post as Professor and Chairman of theDepartment of Economics at the University of Minnesota; Mr. Ackley fromhis post as Professor of Economics at the University of Michigan; andMr. Lewis from his post as Professor and Chairman of the Department ofBusiness Economics and Public Policy in the Graduate School of Businessat Indiana University.
Following is a list of all past Council members and their dates of service:
Name
Edwin O. NourseLeon H. Keyserling
John D. Clark.
Roy BloughRobert C. TurnerArthur F . BurnsNeil H. JacobyWalter W. Stewart. _Joseph S. DavisRaymond J. Saulnier
Paul W. McCrackenKarl Brandt _Henry C. Wallich ._.James TobinKermit Gordon
Position
ChairmanVice ChairmanActing ChairmanChairman ___MemberVice Chairman __Member __MemberChairmanMemberMember _ _MemberMemberChairmanMemberMemberMemberMemberMember
Oath of office date
August 9,1946August 9, 1946November 2,1949May 10,1950August 9,1946May 10,1950June 29,1950September8,1952March 19,1953September 15,1953. _December 2,1953May 2,1955April 4,1955December 3,1956December 3,1956November 1,1958May 7,1959January 27,1961January 27,1961
Separation date
November 1,1949.November 1,1949.May 9,1950.January 20,1953.May 9,1950.February 11,1953.August 20,1952.January 20,1953.December 1,1956.February 9,1955.April 29,1955.October 31,1958.December 2,1956.January 20,1961.January 31,1959.January 20,1961.January 20,1961.July 31,1962.December 27,1962.
COUNCIL STAFF
The Council members are currently assisted by a professional staff of18. These staff members are W. H. Locke Anderson, Richard M. Bailey,Eugene A. Birnbaum, James T. Bonnen, William M. Capron, Frances M.
193
Digitized for FRASER http://fraser.stlouisfed.org/ Federal Reserve Bank of St. Louis
James, Myron L. Joseph, Edward D. Kalachek, Marshall A. Kaplan, SusanJ. Lepper, David W. Lusher, Timothy W. McGuire, Fredric Q. Raines,Robert Solomon, Penelope H. Thunberg, Joseph J. Walka, Burton A. Weis-brod, and Betty J. Willis.
In addition, the Council draws on the expertise of leading members ofthe economics profession by making frequent use of outside consultants.During 1963 the following served the Council in this capacity: KennethJ. Arrow, Robert E. Asher, E. Cary Brown, Richard E. Caves, Charles A.Cooper, Richard N. Cooper, Robert Dorfman, James Duesenberry, OttoEckstein, Rashi Fein, W. Lee Hansen, Robert J. Lampman, David D.Martin, John R. Meyer, Richard A. Musgrave, Richard R. Nelson, ArthurM. Okun, Joseph A. Pechman, George L. Perry, Lee E. Preston, Jr., PaulA. Samuelson, Warren L. Smith, Robert M. Solow, Charles A. Taff, JamesTobin, Robert Triffin, and Lloyd Ulman.
Every year a number of staff members who have joined the Council ona leave-of-absence basis return to their posts in private life or in government.Those leaving the Council in 1963 were: Michael F. Brewer, Charles A.Cooper, Richard N. Cooper, Rashi Fein, Robert J. Lampman, Richard R.Nelson, George L. Perry, Vernon W. Ruttan, Paul S. Sarbanes, Norman J.Simler, Warren L. Smith, and Nancy H. Teeters.
Each summer, for the last three years, the Council has conducted a stu-dent intern program. Those selected in 1963 were Leslie Aspin, Peter A.Diamond, Donald A. Nichols, and Robert N. Stearns.
In addition, under an arrangement with the Great Lakes College Asso-ciation, a group of 12 liberal arts colleges, the Council in 1963 also hada summer faculty intern, Maurice L. Branch, Professor of Economics atAlbion College.
COUNCIL ACTIVITIES
The Council is charged by the Employment Act of 1946 with responsi-bility for analyzing and interpreting current and prospective economic de-velopments and trends and for developing and recommending economicpolicies that will promote the goals of "maximum employment, production,and purchasing power." This charge, and the increased responsibilitiesas an economic staff agency that have been assigned to it in recent yearsby the President, require the Council to consider a wide range of policyproblems and areas. As a consequence, the Council consults and worksclosely with other members of the Executive Office and White House staffand with numerous other Government departments and agencies in analyz-ing domestic and international economic issues and in formulating ap-propriate recommendations.
Participation in Interagency Activities
In addition to discharging its advisory duties through informal con-sultations with other Government agencies, the Council also participateson a formal basis in a number of interagency activities:
194
Digitized for FRASER http://fraser.stlouisfed.org/ Federal Reserve Bank of St. Louis
1. The Chairman regularly attends meetings of the Cabinet, where hefrequently briefs the President and Cabinet members on the current eco-nomic situation.
2. He is Chairman of the Cabinet Committee on Economic Growth.This Committee was established in August 1962 to coordinate Federalactivities and policies in this field and to advise the President on steps toaccelerate the growth of the U.S. economy. Other members are theSecretaries of the Treasury, Commerce, and Labor, and the Director ofthe Bureau of the Budget.
3. He is a member of the Cabinet Committee on the Balance of Pay-ments.
4. He is Vice-Chairman of the Interdepartmental Energy Study, under-taken by a group of 9 agencies organized in February to study the develop-ment and use of our total energy resources in order to help determine themost effective allocation of research and development efforts.
5. The Secretary of the Treasury, the Director of the Bureau of theBudget, and the Chairman of the Council form a coordinating commit-tee on economic, budgetary, and revenue developments and forecasts,which reports its findings to the President from time to time.
6. The Chairman of the Board of Governors of the Federal ReserveSystem joins the above officials and their associates to form an advisorygroup which meets periodically with the President to discuss domestic andinternational monetary matters.
7. Mr. Ackley serves as Chairman of the Interagency Committee on theEconomic Impact of Defense and Disarmament, which also includesrepresentatives of the Departments of Defense, Commerce, and Labor; theArms Control and Disarmament Agency, the Atomic Energy Commis-sion, the National Aeronautics and Space Administration, the Bureau ofthe Budget, and the Office of Emergency Planning. This Committee,which functioned on an informal basis for most of the year, was formallyestablished by President Johnson on December 21. In his memorandumthe President stated: "The Committee will be responsible for the reviewand coordination of activities in the various departments and agencies de-signed to improve our understanding of the economic impact of defenseexpenditures and of changes either in the composition or in the totallevel of such expenditures."
8. Mr. Lewis serves as a member of the Interagency Committee on Trans-portation Mergers, which advises the President as to positions the Govern-ment should take with respect to merger proposals that transportation com-panies have submitted to Federal regulatory agencies.
9. Mr. Ackley serves as Chairman of an interagency committee, includ-ing representatives of the Department of Labor and Commerce and theBureau of the Budget, which is responsible for developing and supervisingan integrated program of studies and projections of United States economicgrowth.
195
Digitized for FRASER http://fraser.stlouisfed.org/ Federal Reserve Bank of St. Louis
10. Members or staff of the Council served on a number of other inter-agency committees dealing with a wide variety of domestic economic mat-ters:
a. the Advisory Committee on Domestic Federal Credit Programs;b. the Interagency Committee to Review the Civil Aeronautics
Board Local Airline Subsidy Reduction Program;c. the Interagency Committee on Air User Charges;d. the Natural Resources Committees of both the Federal Council
for Science and Technology and the National Academy of Sci-ences;
e. the Water Resources Research Committee of the Federal Coun-cil for Science and Technology;
f. the Army-Interior Advisory Board on Passamaquoddy and UpperSt. John River;
g. the Committee on Federal Mental Health Programs;h. the Interdepartmental Advisory Committee on the U.S. National
Health Survey.
11. The Council continued its work with the President's Advisory Com-mittee on Labor-Management Policy, attending meetings of the Committeeand participating in planning a study of automation as part of its agendafor the coming year.
12. Along with the Bureau of the Budget and members of the WhiteHouse staff, the Council reviewed measures proposed for inclusion in thePresident's 1964 legislative program. The Council had primary responsi-bility for analysis and coordination of proposals for an assault on the prob-lem of poverty in the United States.
Consumer Advisory Council
Acting for the President, the Council of Economic Advisers was advisedon consumer matters by the Consumer Advisory Council. It had been estab-lished by the Chairman in July 1962 pursuant to the Presidential Messageon Consumers' Protection and Interest Programs. The Consumer AdvisoryCouncil made its First Report on September 30, 1963. It reviewed the his-tory of Federal activities on behalf of the consumer, noted recent progressin Federal consumer protection programs, and made numerous recom-mendations on behalf of consumers.
Dr. Helen G. Canoyer, Dean of the New York State College of HomeEconomics at Cornell University, was the first Chairman of the ConsumerAdvisory Council from its inception in July 1962 until November 1963.Mrs. John G. Lee, Past President of the League of Women Voters, thenserved as Acting Chairman.
At year-end, acting on recommendations made by the Council of Eco-nomic Advisers and concurred in by the other agencies concerned, thePresident approved the appointment of a White House Special Assistantfor Consumer Affairs and the establishment by executive order of the
196
Digitized for FRASER http://fraser.stlouisfed.org/ Federal Reserve Bank of St. Louis
President's Committee on Consumer Interests. This Committee will con-sist of (1) high-level representatives of 9 Federal agencies concerned withconsumer affairs, including the Council of Economic Advisers; (2) suchother governmental representatives as the President may name; and (3)private citizens especially qualified to represent the consumer interest.The third group will retain its identity as the Consumer Advisory Council,serving as the successor to the present group of that title. The Council ofEconomic Advisers will continue to look to this group for advice from aconsumer point of view on broad matters of economic policy.
Committee on Financial Institutions
President Kennedy established three interagency committees in 1962 toexamine the issues raised by the Report of the Commission on Money andCredit. The Council was represented on the two groups that reportedto the President late in 1962—the Committee on Federal Credit Programsand the Committee on Corporate Pension Funds and Other Private Re-tirement and Welfare Programs. The latter committee's report was re-ferred in turn to the President's Advisory Committee on Labor-Manage-ment Policy, which reported recently to the President.
The Chairman of the Council chaired the Committee on FinancialInstitutions, which made its report in April 1963. Other members of theCommittee were the Secretaries of the Treasury; Agriculture; and Health,Education, and Welfare; the Attorney General; the Administrator ofthe Housing and Home Finance Agency; the Chairman of the Board ofGovernors of the Federal Reserve System; the Chairman of the FederalHome Loan Bank Board; the Chairman of the Federal Deposit InsuranceCorporation; the Comptroller of the Currency; and the Director of theBureau of the Budget.
The Committee on Financial Institutions formulated goals and objec-tives of Federal policy designed to enable private financial institutions tofunction more effectively. It thereby indicated desirable directions of legis-lative action, but did not attempt to lay out a specific legislative program.The topics covered were reserve requirements, interest rate and portfolioregulations, Federal charters for financial institutions, deposit insurance,structural changes and competition, conflicts of interest, and supervisionand examination of institutions.
A number of bills have been introduced in the Congress this year whichwould implement some of the conclusions of the Committee.
International Economic Activities
Economic policy decisions in the United States must be made increasinglyin an international context. The Council participates in a number of in-ternational activities in order to exchange views with foreign officials andto obtain the necessary cooperation in economic matters among the coun-tries of the free world:
197
Digitized for FRASER http://fraser.stlouisfed.org/ Federal Reserve Bank of St. Louis
1. The Chairman was a member of the U.S. delegation to:
a. The eighth annual meeting of the Cabinet-level United States-Canada Joint Committee on Trade and Economic Affairs, whichmet in Washington on September 20-21;
b. The third annual meeting of a similar United States-JapanCabinet-level Committee, whose scheduled meeting in Japan inlate November was postponed until January 1964 because ofthe death of President Kennedy;
c. The September-October meetings in Washington of the Inter-national Monetary Fund and the International Bank for Recon-struction and Development.
2. The Council participated actively in the work of the Organizationfor Economic Cooperation and Development (OECD):
a. Mr. Heller continued to serve as Chairman of the U.S. delega-tion to meetings of the Economic Policy Committee of theOECD;
b. Mr. Ackley and Messrs. Robert Solomon, Richard Cooper, andWarren Smith of the Council staff were members of the U.S.delegation to the Committee's Working Party on Balance-of-Pay-ments Equilibrium;
c. Mr. Lewis was Chairman of the U.S. delegation to the Com-mittee's Working Party on Costs of Production and Prices;
d. Mr. Ackley served as Chairman of the U.S. delegation to theCommittee's Working Party on Policies for the Promotion ofEconomic Growth;
e. Mr. Ackley headed the U.S. delegation for the review of the U.S.economy carried on annually by the Economic Development andReview Committee of the OECD.
3. In addition to its participation in the work of the Cabinet Com-mittee on Balance of Payments, the Council was represented on the Com-mittee on Balance-of-Payments Information, the Interagency Committeeon Foreign Trade Statistics, the National Advisory Council on Interna-tional Monetary and Financial Problems and other groups concernedwith our foreign trade, our balance of payments, and international monetaryreform.
4. In January the Brookings Institution transmitted to the Councilits five-year outlook for the U.S. basic balance of payments. This reportwas financed in 1962 by the Council, in conjunction with the TreasuryDepartment and the Bureau of the Budget. The Report provides a de-tailed five-year outlook on factors that will affect the U.S. balance of pay-ments and was the subject of hearings by the Joint Economic Committeeof the Congress this year.
Digitized for FRASER http://fraser.stlouisfed.org/ Federal Reserve Bank of St. Louis
CONGRESSIONAL TESTIMONY
In addition to its testimony before Appropriations Committees in sup-port of its own budget request, the Council appeared before Congres-sional Committees as follows during 1963:
1. On January 28 Mr. Heller, accompanied by Mr. Ackley, openedtestimony on the 1963 Economic Report of the President before the JointEconomic Committee.
2. On May 1 Mr. Heller appeared before the Education Subcommitteeof the Senate Committee on Labor and Public Welfare as a participant inthe discussion on the proposed National Education Improvement Act of1963.
3. On July 25 Mr. Heller, accompanied by Mr. Ackley and Mr. Lewis,testified before the House Committee on Banking and Currency in theirhearings on Recent Changes in Monetary Policy and the Balance-of-Pay-ments Problem.
4. On the same day Mr. Lewis, accompanied by Mr. Capron and Mr.Lusher of the Council's staff, appeared before the Senate Commerce Com-mittee to discuss the economic impact of a possible railroad strike.
5. On October 28 Mr. Heller, accompanied by Mr. Ackley and Mr.Lewis, testified at hearings on the Nation's Manpower Revolution con-ducted by the Subcommittee on Employment and Manpower of the Sen-ate Committee on Labor and Public Welfare.
6. On November 12 Mr. Heller, accompanied by Mr. Ackley and Mr.Lewis, appeared before the Senate Committee on Finance in support ofthe tax bill, H.R. 8363.
Also, in response to a request from the Chairman of the Joint EconomicCommittee, Senator Paul H. Douglas, the Council provided the Committeein October with a Summary Analysis of the Probable Effects of the Pro-posed Quality Stabilization Act on Prices, Incomes, Employment, andProduction.
NONGOVERNMENTAL MEETINGS AND ACTIVITIES
The Council attempts to contribute to the process of informing publicopinion as it bears on current economic issues. The members and staff ofthe Council spoke during 1963 before a number of private and publicorganizations and institutes, appeared on radio and television programs,and wrote articles for popular and professional publications.
The Employment Act of 1946 explicitly provides for consultation with"representatives of industry, agriculture, labor, consumers, State and localgovernments, and other groups . . ." The Council has frequent informalinterchanges with such representatives and also meets from time to timewith four advisory groups (in addition to the Consumer Advisory Council):
1. The Economic Policy Committee of the AFL-CIO, including—inaddition to George Meany, President, and William F. Schnitzler, Secretary-
199
Digitized for FRASER http://fraser.stlouisfed.org/ Federal Reserve Bank of St. Louis
Treasurer, of the AFL-CIO—the following: Walter P. Reuther, Chairman,James B. Carey, David Dubinsky, George Harrison, A. J. Hayes, JosephKeenan, O. A. Knight, David J. McDonald, Paul L. Phillips, Emil Rieve,Joseph Rourke, Peter T. Schoemann, and James Suffridge.
2. The Liaison Committee of the Business Council, including—in addi-tion to Roger Blough, past Chairman, and Frederick Kappel, present Chair-man, of the Business Council—the following: Chairman of the Liaison Com-mittee, Donald K. David, Vice-Chairman, Ford Foundation; Paul C. Cabot,Chairman, State Street Investment Corporation; John Cowles, President,Minneapolis Star and Tribune; Joseph B. Hall, Chairman, Kroger Com-pany; and W. B. Murphy, President, Campbell Soup Company.
3. The Conference of Business Economists, an organization of almost50 members, chaired in 1963 by Ira T. Ellis of E. I. DuPont de Nemours &Company.
4. The AFL-CIO economists and research directors.
PUBLICATIONS
In January the Council transmitted to the Congress its 1963 Annual Re-port, together with the Economic Report of the President. As in the past,copies of the Report were distributed to members of the Congress, govern-ment officials, the press, and depository libraries. The Superintendent ofDocuments sold an additional 35,374 copies to the public, a 60 percent in-crease over the previous record sale of 22,125 copies of the 1962 Report.
The monthly Economic Indicators, an important source of current eco-nomic statistics, has been prepared since 1948 at the Council under the di-rection of Miss Frances M. James. It is published by the Joint EconomicCommittee of the Congress, and, under authority of a Joint Resolution ofthe Congress, copies are furnished to members of the Congress and to de-pository libraries. The Superintendent of Documents sells about 9,000copies a month to the public.
APPROPRIATIONS
The Council received an appropriation of $615,000 for fiscal year 1964.The Council's request for 1965, which assumes no increase in staff, is thesame as 1964 except for adjustments made necessary by the salary increasesresulting from the pay legislation of 1962 and by the increased cost to theCouncil of overtime, communications, printing, and other services.
200
Digitized for FRASER http://fraser.stlouisfed.org/ Federal Reserve Bank of St. Louis
Appendix C
STATISTICAL TABLES RELATING TO INCOME,EMPLOYMENT, AND PRODUCTION
201
Digitized for FRASER http://fraser.stlouisfed.org/ Federal Reserve Bank of St. Louis

Digitized for FRASER http://fraser.stlouisfed.org/ Federal Reserve Bank of St. Louis
CONTENTSNational income or expenditure: Page
C-l . Gross national product or expenditure, 1929-63 207C-2. Gross national product or expenditure, in 1963 prices, 1929-63 208O 3 . Gross national product or expenditure, in 1954 prices, 1929-63 210G-4. Gross national product by major type of product, 1947-63 212C-5. Gross national product by major type of product, in 1954 prices,
1947-63 213C-6. Implicit price deflators for gross national product, 1929-63 214C-7. Gross national product: Receipts and expenditures by major economic
groups, 1929-63 216C-8. Gross private and government product, in current and 1963 prices,
1929-63 218C-9. Personal consumption expenditures, 1929-63 219C-10. Gross private domestic investment, 1929-63 220O i l . National income by type of income, 1929-63 221C-l2. Relation of gross national product and national income, 1929-63 . . . . 222C-l 3. Relation of national income and personal income, 1929-63 223C-l 4. Sources of personal income, 1929-63 224C-15. Disposition of personal income, 1929-63 226C-l 6. Total and per capita disposable personal income and personal con-
sumption expenditures, in current and 1963 prices, 1929-63 227C-l 7. Financial saving by individuals, 1939-63 228C-l 8. Sources and uses of gross saving, 1929-63 229
Employment, wages, and productivity:C-l 9. Noninstitutional population and the labor force, 1929-63 230C-20. Employment and unemployment, by sex and age, 1947-63 232C-21. Employed persons not at work, by reason for not working, and special
groups of unemployed persons, 1946—63 233C-22. Selected measures of unemployment and part-time employment,
1948-63 234C-23. Unemployed persons, by duration of unemployment, 1947-63 235C-24. Unemployment insurance programs, selected data, 1940-63 236C-25. Number of wage and salary workers in nonagricultural establishments,
1929-63 237C-26. Average weekly hours of work in selected industries, 1929-63 239C-27. Average gross hourly earnings in selected industries, 1929-63 240C-28. Average gross weekly earnings in selected industries, 1929-63 241C-29. Average weekly hours and hourly earnings, gross and excluding over-
time, in manufacturing industries, 1939-63 242C-30. Average weekly earnings, gross and spendable, in manufacturing
industries, in current and 1963 prices, 1939-63 243C-31. Labor turnover rates in manufacturing industries, 1930-63 244C-32. Indexes of output per man-hour and related data, 1947-63 245
Production and business activity:O 3 3 . Industrial production indexes, market groupings, 1947-63 246C-34. Industrial production indexes, industry groupings, 1947-63 247C-35. Business expenditures for new plant and equipment, 1939 and 1945-64. 249O 3 6 , New construction activity, 1929-63 250
203
715-113 O-64-14Digitized for FRASER http://fraser.stlouisfed.org/ Federal Reserve Bank of St. Louis
Production and business activity—Continued PageC-37. New public construction activity, 1929-63 251C-38. New housing starts and applications for financing, 1929-63 252G-39. Sales and inventories in manufacturing and trade, 1947-63 254C-40. Manufacturers' sales, inventories, and orders, 1947-63 255
Prices:C-41. Wholesale price indexes, 1929-63 256C-42. Wholesale price indexes, by stage of processing, 1947-63 258G-43. Consumer price indexes, by major groups, 1929-63 260C-44. Consumer price indexes, by special groups, 1935-63 261
Money supply, credit, and finance:C-45. Money supply, 1947-63 262C-46. Bank loans and investments, 1929-63 263C-47. Federal Reserve Bank credit and member bank reserves, 1929-63 264C-48. Bond yields and interest rates, 1929-63 265C-49. Short- and intermediate-term consumer credit outstanding, 1929-63.. 267C-50. Instalment credit extended and repaid, 1946-63 268C-51. Mortgage debt outstanding, by type of property and of financing,
1939-63 269C-52. Net public and private debt, 1929-63 270
Government finance:C-53. U.S. Government debt, by kind of obligation, 1929-63 271C-54. Estimated ownership of U.S. Government obligations, 1939-63 . 272C-55. Average length and maturity distribution of marketable interest-bear-
ing public debt, 1946-63 273C-56. Federal budget receipts and expenditures and the public debt, 1929-65. 274C-57. Federal budget receipts by source and expenditures by function, fiscal
years 1946-65 275C—58. Government cash receipts from and payments to the public, 1946—65. 276C-59. Government receipts and expenditures in the national income ac-
counts, 1929-63 277C-60. Federal Government receipts and expenditures in the national income
accounts, 1946-65 278C—61. Reconciliation of Federal Government receipts and expenditures in
the conventional budget and the consolidated cash statement withreceipts and expenditures in the national income accounts, fiscalyears 1961-65 279
C-62. State and local government revenues and expenditures, selected fiscalyears, 1927-62 280
Corporate profits and finance:C-63. Profits before and after taxes, all private corporations, 1929-63 281C-64. Relation of profits after taxes to stockholders' equity and to sales,
private manufacturing corporations, by industry group, 1959-63. . . 282C-65. Relation of profits before and after taxes to stockholders' equity and
to sales, private manufacturing corporations, by asset size class,1959-63 284
C-66. Sources and uses of corporate funds, 1952-63 285C-67. Current assets and liabilities of United States corporations, 1939-63.. 286C-68. State and municipal and corporate securities offered, 1934-63 287C-69. Common stock prices, earnings, and yields and stock market credit,
1939-63 288C-70. Business population and business failures, 1929-63 289
204
Digitized for FRASER http://fraser.stlouisfed.org/ Federal Reserve Bank of St. Louis
Agriculture: PageG-71. Income from agriculture, 1929-63 290C-72. Indexes of prices received and prices paid by farmers, and parity ratio,
1929-63 291G-73. Farm production indexes, 1929-63 293C-74. Selected measures of farm resources and inputs, 1929-63 294G-75. Farm population, employment, and productivity, 1929—63 295C-76. Comparative balance sheet of agriculture, 1929-64 296
International statistics:G-77. United States balance of payments, 1947-63 297C-78. Major U.S. Government foreign assistance, by type and by area,
total postwar period and fiscal years 1959-63 299C-79. United States merchandise exports and imports, by economic category,
1949 and 1958-63 300C-80. United States merchandise exports and imports, by area, 1949 and
1958-63 301C-81. Gold reserves and dollar holdings of foreign countries and inter-
national organizations, 1949, 1953, and 1958-63 302C—82. U.S. gold stock and holdings of convertible foreign currencies by
U.S. monetary authorities, 1949-63 303C-83. Price changes in international trade, 1955-63 304
Note.—Detail in these tables will not necessarily add to totals because ofrounding.
Data for Alaska and Hawaii are not included unless specifically noted.Unless otherwise noted, all dollar figures are in current prices.
205
Digitized for FRASER http://fraser.stlouisfed.org/ Federal Reserve Bank of St. Louis

Digitized for FRASER http://fraser.stlouisfed.org/ Federal Reserve Bank of St. Louis
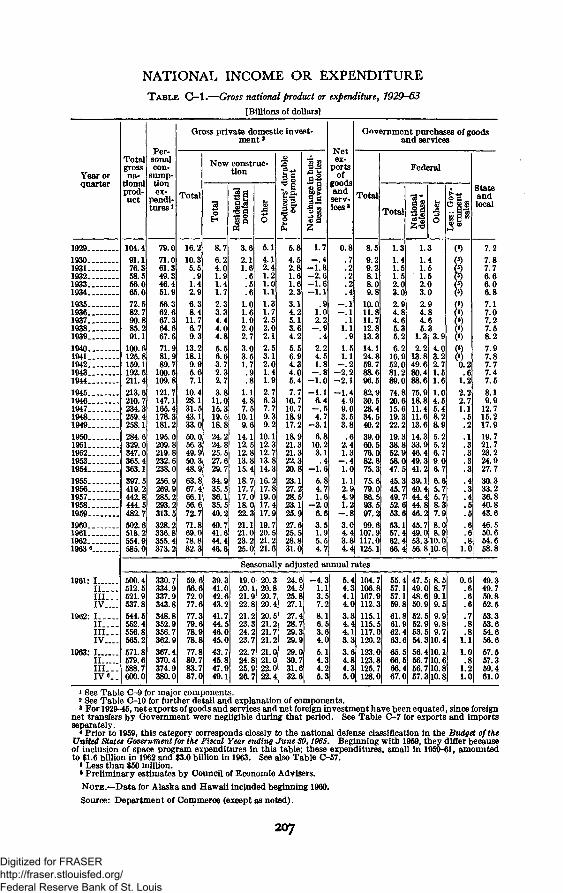
NATIONAL INCOME OR EXPENDITURETABLE G-l.—Gross national product or expenditure, 1929-63
[Billions of dollars]
Year orquarter
Totalgrossna-
tionalprod-uct
Per-sonalcon-
sump-tionex-
pendi-tures1
Gross private domestic invest-ment8
Total
New construc-tion
Netex-
portsof
goodsandserv-ices'
Government purchases of goodsand services
TotalStateandlocal
1929..1930..1931..1932..1933..1934..1935..1936..1937..1938..1939..1940..1941..1942..1943..1944..1945..1946..1947..1948..1949..1950..1951.1952.1953..1954..1955..1956..1957..1958..1959.I960..1961..1962..1963«.
1961: II I - - .I II . . .
1962: I
nil I!IV—
1963: III. . . .
rv«Il
104.491.176.358.556.065.072.582.790.885.291.1
100.6125.8159.1192.5211.4213.6210.7234.3259.4258.1284.6329.0347.0365.4363.1397.5419.2442.8444.5482.7502.6518.2554.9585.0
79.071.061.349.346.451.956.362.667.364.667.671.981.989.7
100.5109.8121.7147.1165.4178.3181.2195.0209.8219.8232.6238.0256.9269.9285.2293.2313.5328.2336.8355.4373.2
16.210.35.5.9
1.42.96.38.4
11.76.79.3
13.218.19.95.67.1
10.428.131.543.133.050.056.349.950.348.963.867.466.156.672.771.869.078.882.3
8.76.24.01.91.41.72.33.34.44.04.85.56.63.72.32.73.8
11.015.319.518.824.224.825.527.629.734.935.536.135.540.40.741.644.446.6
3.62.11.6
1.01.61.92.02.73.03.51.7
1.14.87.5
10.19.6
14.112.512.813.815.418.717.717.018.022.321.121.023.225.0
5.14.12.41.21.01.11.31.72.52.02.12.53.12.01.41.92.76.37.79.39.2
10.112.312.713.814.316.:17.819.017.417.919.720.521.221.6
5.84.52.81.61.62.33.14.25.13.64.25.56.94.34.05.47.7
10.716.18.917.18.921.321.322.320.823.127.28.523.125.927.625.528.831.0
1.7- . 4
- 1 . 3-2 .6- 1 .-1 .1
1.02.2
- . 9.4
2.24.51.8
- . 8-1 .0-1 .1
6.4- . 54.7
- 3 . 1
6.810.23.1.4
- 1 . 65.84.1.6
- 2 . 06.63.51.95.54.
0.8.7.2.2.2.4
- . 1- . 1
.11.1.9
1.51.1
-2.-2 .1-1 .4
4.99.03.53.8
.62.41.3
4i!o1.12.94.91.2
- . 83.04.43.84.4
Seasonally adjusted annual rates500.4512.5521.9537.8544.5552.4556.8565.2571.8579.6588.7600.0
330.7334.9337.9343.8348.8352.9356.7362.9367.4370.4374.9380.0
59.666.672.077.677.379.678.978.877.880.783.787.0
39.341.042.643.241.744.546.045.043.745.847.949.1
19.020.121.922.821.223.324.223.722.724.825.926.7
20.320.820.720.420.521.221.721.221.021.022.022.4
24.624.525.827.127.428.729.329.929.030.731.632.6
- 4 . 31.13.57.2
8.16.53.64.0
5.14.34.25.3
5.44.34.14.0
3.34.44.13.3
3.64.84.35.0
104.7106.8107.9112.3115.1115.5117.0120.2123.0123.8125.7128.0
55.457.157.159.861.861.962.463.665.566.566.467.0
47.549.048.650.952.552.953.554.356.456.756.757.3
8.58.79.19.5
9.99.89.7
10.410.110.610.810.8
0.6. 6.6.6
.7
.8
.81.1
1.0.8
1.21.0
49.349.750.852.553.353.654.656.657.557.359.461.0
1 See Table C-9 for major components.2 See Table C-10 for further detail and explanation of components.8 For 1929-45, net exports of goods and services and net foreign investment have been equated, since foreign
net transfers by Government were negligible during that period. See Table C-7 for exports and importsseparately.
* Prior to 1959, this category corresponds closely to the national defense classification in the Budget of theUnited States Government for the Fiscal Year ending June SO, 1965. Beginning with 1959, they differ becauseof inclusion of space program expenditures in this table; these expenditures, small in 1959-61, amountedto $1.6 billion in 1962 and $3.0 billion in 1963. See also Table C-57.
» Less than $50 million.«Preliminary estimates by Council of Economic Advisers.NOTE.—Data for Alaska and Hawaii included beginning 1960.Source: Department of Commerce (except as noted).
207
Digitized for FRASER http://fraser.stlouisfed.org/ Federal Reserve Bank of St. Louis
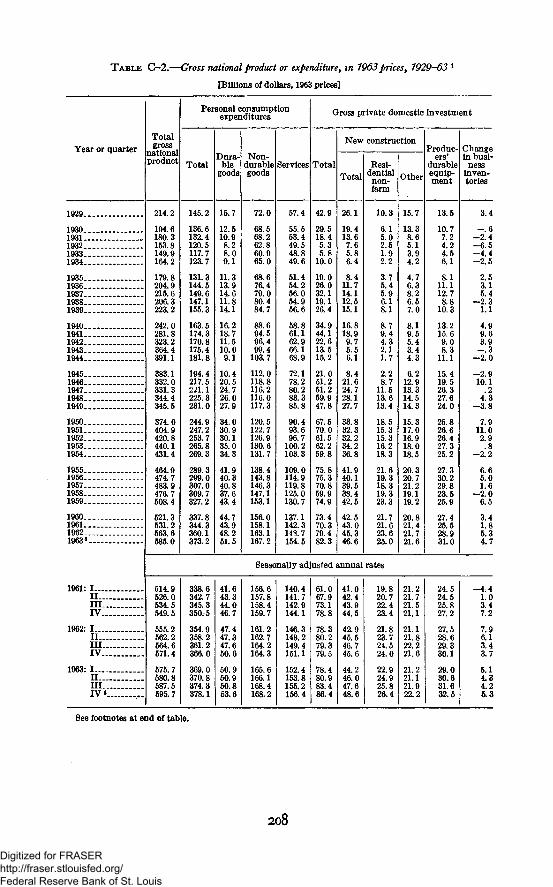
TABLE G-2.—Gross national product or expenditure, in 1963 prices, 1929-63 1
[Billions of dollars, 1963 prices]
Year or quarterTotalgross
nationalproduct
1929.
1930.1931.1932.1933.1934.
1935.1936.1937.1938.1939.
1940.1941.1942.1943.1944.
1945.1946.1947.1948.1949.
1950.1951.1952.1953.1954.
1955.1956.1957.1958.1959.
1960.1961.1962
1961: I—-II—ILL.IV. .
1962: I . . . .I I . . .I I I . .IV..
1963: I..._I I . . .I I I . .IV e.
214.2
194.6180.3153.8149.9164.2
179.8204.9215.6206.3223.2
242.0281.8323.2364.4391.1
383.1332.0331.3344.4345.5
374.0404.9420.8440.1431.4
464.9474.7483.9476.7508.4
521.3531.2563.6585.0
Personal consumptionexpenditures
TotalDura-
blegoods
145.2
136.6132.4120.5117.7123.7
131.3144.5149.6147.1155.3
163.5174.3170.8175.4181.8
194.4217.5221.1225.3231.0
244.9247.2253.7265.8269.3
289.3299.0307.0309.7327.2
337.8344.3360.1373.2
15.7
12.510.98.28.09.1
11.313.914.611.814.1
16.218.711.510.09.1
10.420.524.726.027.9
34.030.930.135.034.3
41.940.340.837.643.4
44.743.948.251.5
Non-lurablcgoods
durable Services Total
72.0
68.568.262.860.965.0
68.676.479.080.484.7
88.694.596.499.4
103.7
112.0118.8116.2116.0117.3
120.5122.7126.9130.6131.7
138.4143.8146.3147.1153.1
156.0158.1163.1167.2
57.4
55.553.449.548.849.6
51.454.256.054.956.6
58.861.162.966.168.9
72.178.280.283.385.8
90.493.696.7
100.2103.3
109.0114.9119.8125.0130.7
137.1142.3143.7154.5
Gross private domestic investment
42.9
29.518.45.35.8
10.0
19.026.032.119.126.4
34.944.122.613.515.2
21.051.251.259.947.8
67.570.061.562.259.8
75.875.370.859.974.9
73.470.379.482.3
New construction
Total
26.1
19.413.67.65.86.4
8.411.714.112.515.1
16.818.99.75.56.1
8.421.624.728.127.7
33.832.332.234.236.8
41.940.139.538.442.5
42.543.045.346.6
Eesi-dential
non-farm
10.3
6.15.02.51.92.2
3.75.45.96.18.1
8.79.44.32.11.7
2.28.7
11.513.613.4
18.515.315.316.218.3
21.619.318.319.323.3
21.721.623.625.0
Other
15.7
13.38.65.13.94.2
4.76.38.26.57.0
8.19.55.43.44.3
6.212.913.314.514.3
15.317.016.918.018.5
20.320.721.219.119.2
20.821.421.721.6
Produc-ers'
durableequip-ment
Seasonally adjusted annual rates
13.5
10.77.24.24.56.1
8.111.112.78.8
10.3
13.215.69.08.3
11.1
15.419.526.327.624.0
25.826.626.427.325.2
27.330.229.823.525.9
27.425.528.931.0
Changein busi-
nessinven-tories
514.9526.0534.5549.5
555.2562.2564.6571.4
575.7580.8587.5595.7
338.6342.7345.3350.5
354.9358.2361.2366.0
369.0370.8374.3378.1
41.643.344.046.7
47.447.347.650.6
50.950.950.853.6
156.6157.8158.4159.7
161.2162.7164.2164.3
165.6166.1168.4168.2
140.4141.7142.9144.1
146.3148.2149.4151.1
152.4153.8155.2156.4
61.067.973.178.8
78.380.279.379.5
78.480.983.486.4
41.042.443.944.5
42.945.546.745.6
44.246.047.648.6
19.820.722.423.4
21.823.724.524.0
22.924.925.826.4
21.221.721.521.1
21.121.822.221.6
21.221.121.922.2
24.524.525.827.2
27.528.629.330.1
29.030.631.632.5
3.4
- . 6- 2 . 4- 6 . 5-4 .4-2 .5
2.53.15.4
- 2 . 31.1
4.99.63.9
- . 3- 2 . 0
-2.910.1
.24.3
- 3 . 8
7.911.02.9.8
-2.2
6.65.01.6
- 2 . 06.5
3.41.86.34.7
-4 .41.03.47.2
7.96.13.43.7
5.14.34.26.3
See footnotes at end of table.
208
Digitized for FRASER http://fraser.stlouisfed.org/ Federal Reserve Bank of St. Louis
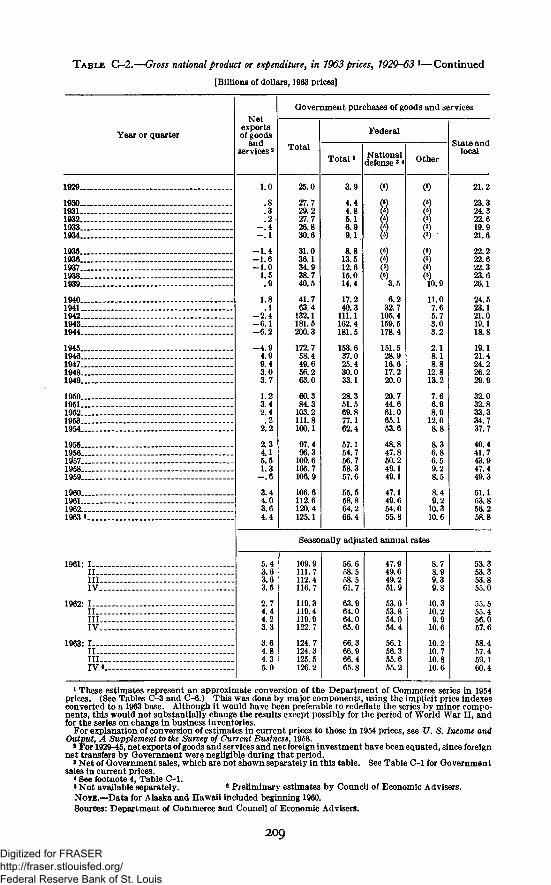
TABLE C-2.—-Gross national product or expenditure, in 1963 prices > 1929-63 1—Continued
[Billions of dollars, 1963 prices]
Year or quarter
1929
193019311932 _1933 _ _1934
1935193619371938 .1939 _
19401941194219431944
1945194619471948 -1949 .
19501951195219531954
1955195619571958 r1959
I9601961 — _19621963 •
1961: IIIIIIIV
1962: I -III I IIV
1963: I -- -IIHI .IV •
Netexportsof goods
andservices2
1.0
.8
.3
. 2- . 4- . 1
- 1 . 4- 1 . 6- 1 . 0
1.5. 9
1.8. 1
- 2 . 4- 6 . 1- 6 . 2
- 4 . 94.99.43.03.7
1.23.42.4.2
2.2
2.34.15.51.3
- . 6
3.44.03.64.4
Government purchases of goods and services
Total
25.0
27.729.227.726.830.6
31.036.134.938.740.5
41.763.4
132.1181.5200.3
172.758.449.656.263.0
60.384.3
103.2111.8100.1
97.496.3
100.6105.7106.9
106.6112.6120.4125.1
Federal
Total»
3.9
4.44.85.16.99.1
8.813.512.615.014.4
17.240.3
111.1162. 4181.5
153.637.025.430.033.1
28.351.569.877.162.4
57.154.756.758.357.6
55.558.864.266.4
Nationaldefense8 *
09
09090909
(*)0909(6)
3.5
6.232.7
105.4159.5178.4
151.528.916.617.220.0
20.744.661.065.153.6
48.847.850.249.149.1
47.149.654.055.8
Other
09
09(5)
CO09
09(5)
(5)10.9
11.07.65.73.03.2
2.18.18.8
12.813.2
7.66.98.9
12.0
8.36.86.59.28.5
8.49.2
10.310.6
State andlocal
21.2
23.324.322.619.921.6
22.222.622.323.626.1
24.523.121.019.118.8
19.121.424.226.229.9
32.032.833.334.737.7
40.441.743.947.449.3
51.153.856.258.8
Seasonally adjusted annual rates
5.43.63.63.5
2.74.44.23.3
3.64.84.35.0
109.9111.7112.4116.7
119.3119.4119.9122.7
124.7124.3125.5126.2
56.658. 558.561.7
63.964.064.065.0
66.366.966.465.8
47.949.649.251.9
53.653.854.054.4
56.156.355.655.2
8.78.99.39.8
10.310.29.9
10.6
10.210.710.810.6
53.353.353.855.0
55.555.456.057.6
58.457.459.160.4
1 These estimates represent an approximate conversion of the Department of Commerce series in 1954prices. (See Tables C-3 and C-6.) This was done by major components, using the implicit price indexesconverted to a 1963 base. Although it would have been preferable to redeflate the series by minor compo-nents, this would not substantially change the results except possibly for the period of World War II, andfor the series on change in business inventories.
For explanation of conversion of estimates in current prices to those in 1954 prices, see U. S. Income andOutput, A Supplement to the Survey of Current Business, 1958.
2 For 1929-45, net exports of goods and services and net foreign investment have been equated, since foreignnet transfers by Government were negligible during that period.
3 Net of Government sales, which are not shown separately in this table. See Table C-l for Governmentsales in current prices.
* See footnote 4, Table O-l.5 Not available separately. 8 Preliminary estimates by Council of Economic Advisers.NOTE.—Data for Alaska and Hawaii included beginning 1960.Sources: Department of Commerce and Council of Economic Advisers.
209
Digitized for FRASER http://fraser.stlouisfed.org/ Federal Reserve Bank of St. Louis
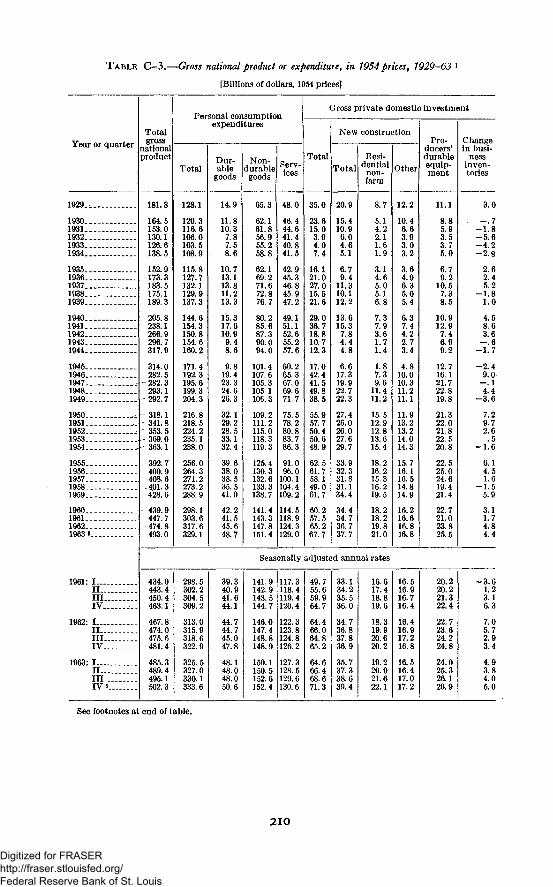
TABLE G-3.—Gross national product or expenditure, in 1954 prices, 1929-63 l
[Billions of dollars, 1954 prices]
Year or quarterTotalgross
nationalproduct
Personal consumptionexpenditures
Total
128.1
120.3116.6106.0103.5108.9
115.8127.7132.1129.9137.3
144.6154.3150.8154.6160.2
171.4192.3195.6199.3204.3
216.8218.5224.2235.1238.0
256.0264.3271.2273.2288.9
298.1303.6317.6329.1
Dur-able
goods
14.9
11.810.3
7.87.58.6
10.713.113.811.213.3
15.317.610.9
9.48.6
9.819.423.324.626.3
32.129.228.533.132.4
39.638.038.535.541.0
42.241.545.648.7
Non-durable
goods
65.3
62.161.856.955.258.8
62.169.271.672.876.7
80.285.687.390.094.0
101.4107.6105.3105.1106.3
109.2111.2115.0118.3119.3
125.4130.3132.6133.3138.7
141.4143.3147.8151.4
Serv-ices
Gross private domestic investment
Total
New construction
Total
Resi-dentialnon-farm
Other
Pro-ducers'durableequip-ment
Changein busi-
nessinven-tories
1929..
1930..1931..1932..1933..1934..
1935..1936..1937..1938..1939..
1940..1941..1942_.1943..1944..
1945..1946..1947-.1948..1949..
1950..1951-.1952..1953..1954..
1955..1956..1957..1958-.1959..
I960..1961..1962..1963 8
1961: I—.II—III..IV..
1962: I . . . .II—III..IV..
1963: I—.II. . .III..IV 5
181.8
164.5153.0130.1126.6138.5
152.9173.3183.5175.1
205.8238.1266.9296.7317.9
314.0282.5
- 282.3293.1292. 7
318.1- 341.8
353. 5-369.0- 363.1
392. 7400.9408.6
.4.01.3428.6
- 439.9447.7474.8493.0
48.0
46.444.641.440.841.5
42.945.346.845.947.2
49.151.152.655.257.6
60.205.367.069.671.7
75.578.280.883.786.3
91.096.0
100.1104.4109.2
114.5118.9124.3129.0
35.0
23.615.03.94.07.4
16.121.027.015.521.6
29.036.718.810.712.3
17.042.441.549.838.5
55.957.750.450.648.9
62.561.758.149.061.7
60.257.565.267.7
20.9
15.410.96.04.65.1
6.79.4
11.310.112.2
13.615.37.84.44.8
17.319.922.722.3
27.426.026.027.629.7
33.932.331.831.134.4
34.434.736.737.7
8.7
5.14.22.11.61.9
3.14.65.05.16.8
7.37.93.61.71.4
1.87.39.6
11.411.2
15.512.912.813.615.4
18.216.215.316.219.5
18.218.219.821.0
12.2
10.46.63.93.03.2
3.64.96.35.05.4
6.37.44.22.73.4
4.810.010.311.211.1
11.913.213.214.014.3
15.716.116.514.814.9
16.216.616.816.8
Seasonally adjusted annual rates
11.1
5.93.53.75.0
6.79.2
10.57.38.5
10.912.97.46.99.2
12.716.121.722.819.8
21.322.021.822.520.8
22.525.024.619.421.4
22.721.023.825.5
434.0443.4450.4463.1
467.8474.0475.6481.4
485.3489.4495.1502.3
298.5302.2304.5309.2
313.0315.9318.6322.9
325.5327.0330.1333. 6
39.340.941.644.1
44.744.745.047.8
48.148.048.050.6
141.9142.9143.5144.7
146.0147.4148.8148.9
150.1150.5152.6152.4
117.3118.4119.4120.4
122.3123.8124.8126.2
127.3128.5129.6130. 6
49.755.659.964.7
64.466.064.865.2
64.666.468.671.3
33.134.235.536.0
34.736.837.836.9
35.737.338.639.4
16.617.418.819.6
18.319.920.620.2
19.220.921.622.1
16.516.916.716.4
16.416.917.216.8
16.516.417.017.2
20.220.221.322.4
22.723.624.224.8
24.025.326.126.9
3.0
- . 7- 1 . 8- 5 . 6- 4 . 2- 2 . 8
2.62.45.2
- 1 . 81.0
4.58.63.6
- . 6- 1 . 7
- 2 . 49.0
- . 14.4
- 3 . 6
7.29.72.6.5
- 1 . 6
6.14.51.6
- 1 . 55.9
3.11.74.84.4
-3.61.23.16.3
7.05.72.93.4
4.93.84.05.0
See footnotes at end of table.
2 1 0
Digitized for FRASER http://fraser.stlouisfed.org/ Federal Reserve Bank of St. Louis
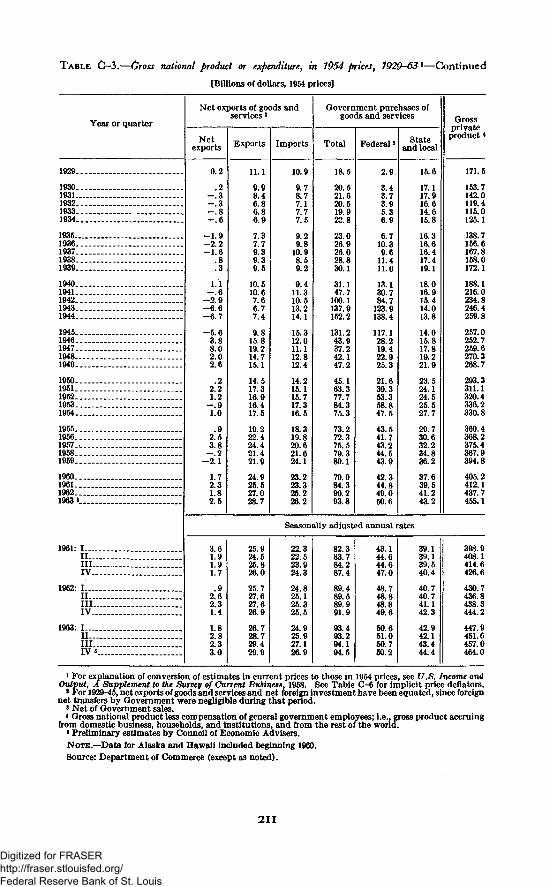
TABLE C-3.—Gross national product or expenditure, in 1054 prices, 1929-631—Continued
[Billions of dollars, 1954 prices]
Year or quarter
Net exports of goods and
Netexports
0.2
.2- . 3- . 3- . 8- . 6
- 1 . 9- 2 . 2- 1 . 6
.8
.3
i . i- . 6
- 2 . 9- 6 . 6- 6 . 7
-5 .63.88.02.02.6
.22.21.2
- . 91.0
.92.53.8
- . 2- 2 . 1
1.72.31.82.5
services*
Exports
11.1
9.98.46.86.86.9
7.37.79.39.39.5
10.510.67.66.77.4
9.815.819.214.715.1
14.517.316.916.417.5
19.222.424.421.421.9
24.925.527.028.7
Imports
10.9
9.78.77.17.77.5
9.29.8
10.98.59.2
9.411.310.513.214.1
15.312.011.112.812.4
14.215.115.717.316.5
18.319.820.621.624.1
23.223.325.226.2
Government purchases ofgoods and services
Total
18.5
20.521.620.519.922.8
23.026.926.028.830.1
31.147.7
100.1137.9152.2
131.243.937.242.147.2
45.163.377.784.375.3
73.272.375.579.380.1
79.984.390.293.8
Federal 3
2.9.
3.43.73.95.36.9
6.710.39.6
11.411.0
13.130.784.7
123.9138.4
117.128.219.422.925.3
21.639.353.358.847.5
43.541.743.244.543.9
42.344.849.050.6
Stateand local
15.6
17.117.916.614.615.8
16.316.616.417.419.1
18.016.915.414.013.8
14.015.817.819.221.9
23.524.124.525.527.7
29.730.632.234.836.2
37.639.541.243.2
Grossprivate
product *
1929.
1930.1931..1932.1933.1934.
1935..1936.1937.1938.1939.
1940.1941.1942.1943.1944.
1945..1946-.1947..1948-1949_.
1950..1951..1952..1953..1954..
1955...1956.-.1957...1958...1959...
1960...1961...1962...1963*..
1961: I...IIIIIIV
1962: I...IIIIIIV_
1963: I...IIIIIIV
Seasonally adjusted annual rates
3.61.91.91.7
.92.62.31.4
1.82.82.33.0
25.924.525.826.0
25.727.627.626.9
26.728.729.429.9
22.322.523.924.3
24.825.125.325.5
24.925.927.126.9
82.383.784.287.4
89.489.589.991.9
93.493.294.194.5
43.144.644.647.0
48.748.848.849.6
50.651.050.750.2
39.139.139.540.4
40.740.741.142.3
42.942.143.444.4
171.5
153.7142.0119.4115.0125.1
138.7156.6167.8158.0172.1
188.1216.0234.8246.4259.8
257.0252.7259.6270.3268.7
293.3311.1320.4336.2330.8
360.4368.2375.4367.9394.8
405.2412.1437.7455.1
398.9408.1414.6426.6
430.7436.8438.3444.2
447.9451.6457.0464.0
1 For explanation of conversion of estimates in current prices to those in 1954 prices, see U.S. Income andOutput, A Supplement to the Survey of Current BuMness, 1958. See Table C-6 for implicit price deflators.
2 For 1929-45, net exports of goods and services and net foreign investment have been equated, since foreignnet transfers by Government were negligible during that period.
8 Net of Government sales.* Gross national product less compensation of general government employees; i.e., gross product accruing
from domestic business, households, and institutions, and from the rest of the world.* Preliminary estimates by Council of Economic Advisers.NOTE.—Data for Alaska and Hawaii included beginning 1960.Source: Department of Commerce (except as noted).
211
Digitized for FRASER http://fraser.stlouisfed.org/ Federal Reserve Bank of St. Louis
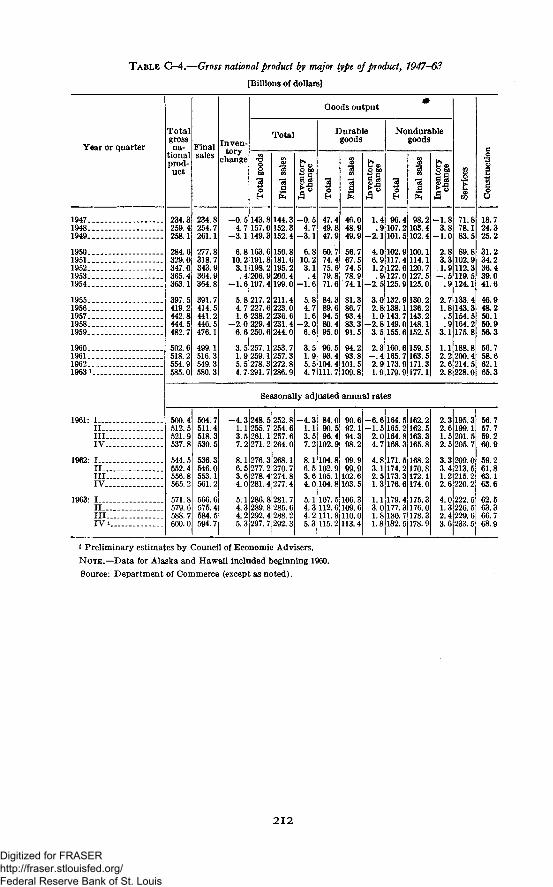
TABLE C-4.—Gross national product by major type of product, 7947-63
[Billions of dollars]
Year or quarter
Totalgrossna-
tionalproduct
FinalInven-
torychange
Goods output
TotalDurablegoods
Nondurablegoods
1947.1948..1949.
1950..1951.1952.1953..1954..
1955.1956.1957.1958.1959..
1960.1961.1962.19631
1961: I . .I I .IIIIV
1962: I__II .IIIIV
1963: I . .II .IIIIV
234.3259.4258.1
284.6329.0347.0365.4363.1
397.5419.2442.8444. 5482.7
502.6518.2554.585.0
234.8254.7261.1
277.8318.7343.9364.9364.8
391.7414.5441.2446.5476.1
499.1516.3549.3580. 3
- 0 . 5 143.-0.4.7
-3.1
:. 8 144.3157.0 152.3149.3 152.4
10.3.1
163. 6 156.8. 8 181. 6
198.2 195.2>. 9 206. 4
2 191
4 206.-1.6 197.4 199.0
7.2 211.47.6 223.08. 2 236.6
-2.0 229.4 231. 46. 6 250. 6 244.0
8 217.7 227.6 238.
3. 5 257.11.9 259.5.4.
5 278.7 291
253.7>. 1 257. 3;. 3 272. 8.. 7 286. 9
-0.54.7
-3.1
10.23.1.4
- 1 .
5.84.71.6
-2.06.6
3.51.95.4.7
47.449.847.9
60.774.475.679.871.6
84.389.694.580.495.0
96.593.4
46.048.949.9
56.767.574.578.974.1
81.386.793.483.391.5
94.293.8
1.49 107.
98.27.2 103.4
-2.1 101.5 102.4
-1.83.8-1.0
4.06.1.
102.9 100.16.9 117.42 122.2.6 120. 7
7.0 127. 5-2. 5 125.9 125.0
9 127. i
3.0 132.9 130.22.81.0 143. 7
136.2143.2
- 2 . 8 149.0 148.13. 5 155. 6 152. 5
71.878.183.5
2.8 89.83.3 102.91.9 112.3
- . 5 119.5, 9 124.1
2.7 133.41.8 143.3
5 154.59 164.2
5 104.4 101. 5111.7 109.8
2.3 160. 6- . 4 165.7
159.5163.5
2.9 173.9 171.31.9 179.9 177.1
3.1
1.12.2 200.2.6 214.
175.8
188.8
2.8 228.0
Seasonally adjusted annual rates
500.4512.5521.9537.8
544.5552.4556.8565.2
571.8579.6588. 7600.0
504.7511.4518.3530.5
536.3546.0553.1561.2
566.6575.4584.5594.7
- 4 . 3 248.1255.
- 4 .1.3.5 261.17. 2 271.2 264.0
5.14.
L 5 252. 8». 7 254. 6
257.6
8.1 276.3 268.16. 5 277.2 270. 7
I. 4 274. 8.. 4 277. 4
6 278.0 281.
». 8 281. 7I. 8 285. 6
4.2 292.4 288. 25. 3 297. 7 292. 3
3 289.
-4.31.13.57.2 102.9
5.14.4.5.3
84.090.596.4
8.16. 5 102.3. 6 105.14. 0 104.8 103. 5
104.89
107. 5 106. 33 112.6 109. 6
111.8 110.0115.2 113.4
90.692.194.398.2
1.9102.6
- 6 . 6 164.5 162.2- 1 . 5 165.2
2.0 164.8 163.34. 7 168.3 165.8
8 1714.3.12. 5 173. 3 172.11.3 176.6
1.13.1. 8 180.1.8 182. 5 178. 9
0 177.
162.5
. 5 168.2174.2 170.8
3 72174.0
179.4 175.3'. 3 176.0
178.3
2.3 195.32. 6 199.1.2.
5 2015 205.
3.3 209.03.4 213. 51.2 215.22.6 220.2
4.0 222.51.3 226. 52.4 229.63.6 233. 5
18.724.325.2
31.234.236.439.041.6
46.948.250.150.956.3
56.758.662.165.3
56.757.759.260.9
59.261.863.1
62.563.366.7
i Preliminary estimates by Council of Economic Advisers.
NOTE.—Data for Alaska and Hawaii included beginning 1960.
Source: Department of Commerce (except as noted).
2 1 2
Digitized for FRASER http://fraser.stlouisfed.org/ Federal Reserve Bank of St. Louis
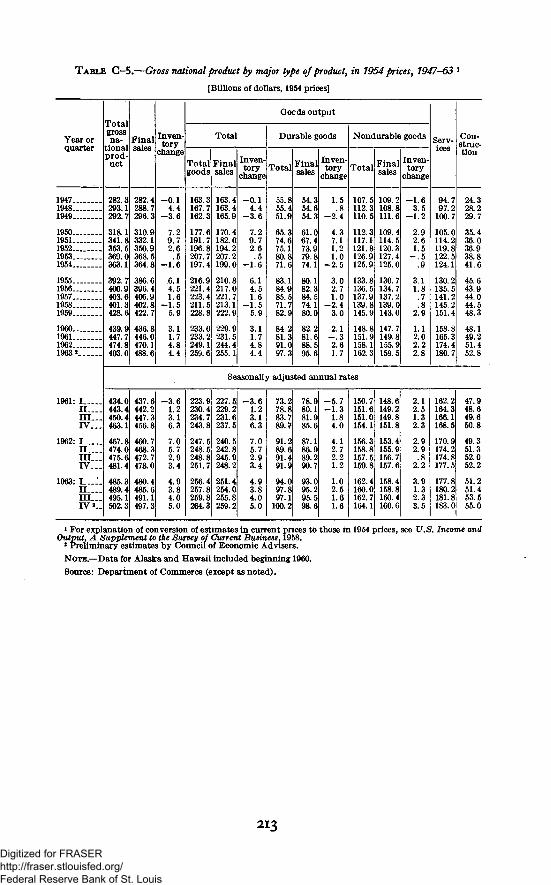
TABLE C-5.—Gross national product by major type of product, in 1954 prices, 1947-63 l
[Billions of dollars, 1954 prices]
Year orquarter
Totalgrossna-
tionalprod-
uct
1961: III I I—I V . .
1962: II I—Ill—IV..
1963: _ —I I —I I I —IV 2 -
282.3293.1292.7
318.1341.8353.5369.0363.1
392.7400.9403.6401.3428.6
439.9447.7474.8493.0
Final
282.4288.7296.3
310.9332.1350.9368.5364.8
386.6396.4406.9402.8422.7
436.8446.0470.1488.6
Inven-tory
change
- 0 . 14.4
- 3 . 6
7.29.72.6.5
- 1 . 6
6.14.51.6
- 1 . 55.9
3.11.74.84.4
Gocds output
Total
Total Finalgoods
163.3167.7162.3
177.6191.7196.8207.7197.4
216.9221.4223.4211.5228.8
233.0233.2249.1259.6
sales
163.4163.4165.9
170.4182.0194.2207.2199.0
210.8217.0221.7213.1222.9
229.9231.5244.4255.1
Inven-tory
changeTotal
-0 .14.4
-3 .6
7.29.72.6.5
-1 .6
6.14.51.6
- 1 . 55.9
3.11.74.84.4
Durable goods Nondurable goods
55.855.451.9
65.374.675.180.871.6
83.184.985.571.782.9
84.281.391.097.3
Final
54.354.654.3
61.0«7.473.979.874.1
80.182.384.574.180.0
82.281.688.595.6
Inven-tory
changeTotal
1.5.8
-2 .4
4.37.11.21.0
- 2 . 5
3.02.71.0
- 2 . 43.0
2.1- . 32.61.7
107.5112.3110.5
112.3117.1121.8126.9125.9
133.8136.5137.9139.8145.9
148.8151.9158.1162.3
Final
109.2108.8111.6
109.4114.5120.3127.4125.0
130.7134.7137.2139.0143.0
147.7149.8155.9159.5
Inven-tory
change
-1 .63.5
-1 .2
2.92.61.5
.9
3.11.8.7.8
2.9
1.12.02.22.8
Serv-ices
94.797.2
100.7
105.0114.2119.8122.5124.1
130.2135.5141.2145.2151.4
158.8165.3174.4180.7
Con-struc-tion
24.328.229.7
35.436.036.938.841.6
45.643.944.044.548.3
48.149.251.452.8
Seasonally adjusted annual rates
434.0443.4450.4463.1
467.8474.0475.6481.4
485.3489.4495.1502.3
437.6442.2447.3456.8
460.7468.3472.7478.0
480.4485.6491.1497.3
- 3 . 61.23.16.3
7.05.72.93.4
4.93.84.05.0
223.9230.4234.7243.8
247.5248.5248.8251.7
256.4257.8259.8264.3
227.5229.2231.6237.5
240.5242.8245.9248.2
251.4254.0255.8259.2
- 3 . 61.23.16.3
7.05.72.93.4
4.93.84.05.0
73.278.883.789.7
91.289.691.491.9
94.097.897.1
100.2
78.980.181.985.6
87.186.989.290.7
93.095.295.598.6
-5 .7- 1 . 3
1.84.0
4.12.72.21.2
1.02.51.61.6
150.7151.6151.0154.1
156.3158.8157.5159.8
162.4160.0162.7164.1
148.6149.2149.8151.8
153.4155.9156.7157.6
158.4158.8160.4160.6
2.12.51.32.3
2.92.9.8
2.2
3.91.32.33.5
162.2164.3166.1168.5
170.9174.2174.8177.5
177.8180.2181.8183.0
47.948.649.650.8
49.351.352.052.2
51.251.453.555.0
1 For explanation of conversion of estimates in current prices to those in 1954 prices, see U.S. Income andutput, A Supplement to the Survey of Current Business, 1958.2 Preliminary estimates by Council of Economic Advisers.
NOTE.—Data for Alaska and Hawaii included beginning 1960.
Source: Department of Commerce (except as noted).
213
Digitized for FRASER http://fraser.stlouisfed.org/ Federal Reserve Bank of St. Louis
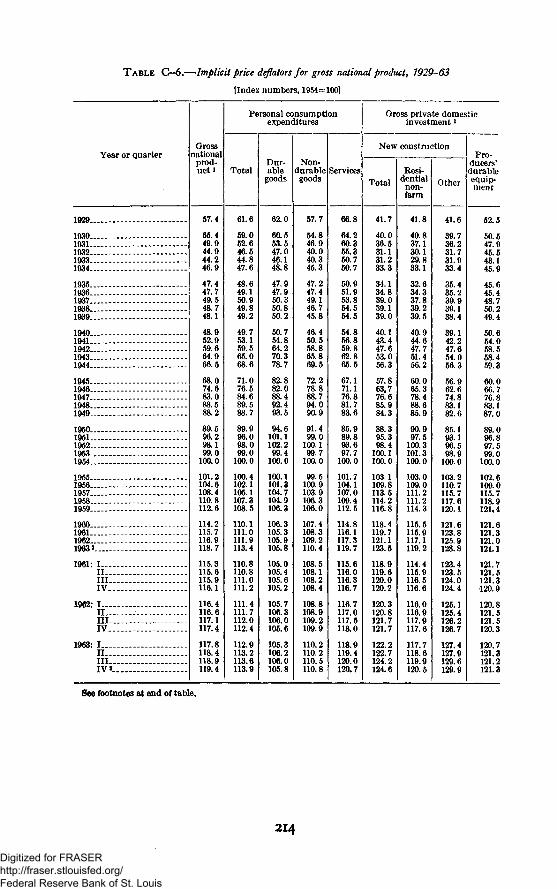
TABLE C-6.—Implicit price deflators for gross national product, 1929-63
[Index numbers, 1954=100]
Gross private domesticinvestment1
Year or quarterGross
nationalprod-u c t '
57.4
55.449.944.944.246.9
47.447.749.548.748.1
48.952.959.664.966.5
68.074.683.088.588.2
89.596.298.199.0
100.0
101.2104.6108.4110.8112.6
114.2115.7116.9118.7
115.3115.6115.9116.1
116.4116.6117.1117.4
117.8118.4118.9119.4
Pe
Total
61.6
59.052.646.544.847.6
48.649.150.949.849.2
49.753.159.565.068.6
71.076.584.689.588.7
89.996.098.099.0
100.0
100.4102.1105.1107.3108.5
110.1111.0111.9113.4
110.8110.8111.0111.2
111.4111.7112.0112.4
112.9113.2113.6113.9
rsonal consumptionexpenditures
Dur-able
goods
62.0
60.553.547.046.148.8
47.947.950.350.850.2
50.754.864.270.378.7
82.882.088.492.493.5
94.6101.1102.299.4
100.0
100.1101.3104.7104.9106.3
106.3105.3105.9105.8
105.0105.4105.6105.2
105.7106.3106.0105.6
105.3106.2106.0105.8
Non-durablegoods
57.7
54.846.940.040.345.3
47.247.449.146.745.8
46.450.558.865.869.5
72.278.888.794.090.9
91.499.0
100.199.7
100.0
99.5100.9103.9106.3106.0
107.4108.3109.2110.4
108.5108.1108.2108.4
108.8108.9109.2109.9
110.2110.2110.5110.8
Services
66.8
64.260.355.350.750.7
50.951.953.854.554.5
54.856.859.862.865.5
67.171.176.881.783.6
85.989.893.697.7
100.0
101.7104.1107.0109.4112.5
114.8116.1117.3119.7
115.6116.0116.3116.7
116.7117.0117.5118.0
118.9119.4120.0120.7
New construction
Total
41.7
40.036.531.131.233.3
34.134.839.039.139.0
40.143.447.653.056.3
57.863,776.685.984.3
88.395.398.4
100.1100.0
103.1109.8113.5114.2116.8
118.4119.7121.1123.5
118.9119.6120.0120.2
120.3120.8121.7121.7
122.2122.7124.2124.6
Resi-dentialnon-farm
41.8
40.837.130.129.833.1
32.634.337.839.239.5
40.944.647.751.456.2
60.065.378.488.685.9
90.997.5
100.3101.3100.0
103.0109.0111.2111.2114.3
115.5115.9117.1119.2
114.4115.9116.5116.6
116.0116.9117.9117.6
117.7118.6119.9120.5
Other
41.6
39.736.231.731.933.4
35.435.239.939.138.4
39.142.247.654.056.3
56.962.674.883.182.6
85.193.196.598.9
100.0
103.2110.7115.7117.6120.1
121.6123.8125.9128.8
123.4123.5124.0124.4
125.1125.4126.2126.7
127.4127.9129.6129.9
Pro-ducers'durableequip-ment
1929
19301931193219331934
19351936193719381939 -.
19401941194219431944
1945 -.1946194719481949
1950 -19511952 -.19531954
19551956195719581959
19601961196219633
1961: I —I I -III.IV.
1962: I —I I -III.IV_.
1963: I . . .I I -III-IV*
52.5
50.547.945.543.145.9
45.645.448.750.249.4
50.654.058.558.459.3
60.066.776.883.187.0
89.096.897.599.0
100.0
102.6109.0115.7118.9121,4
121.6121.3121.0121.1
121.7121.5121.3•120.9
120.8121.5121.5120.3
120.7121.3121.2121.3
See footnotes at end of table.
214
Digitized for FRASER http://fraser.stlouisfed.org/ Federal Reserve Bank of St. Louis
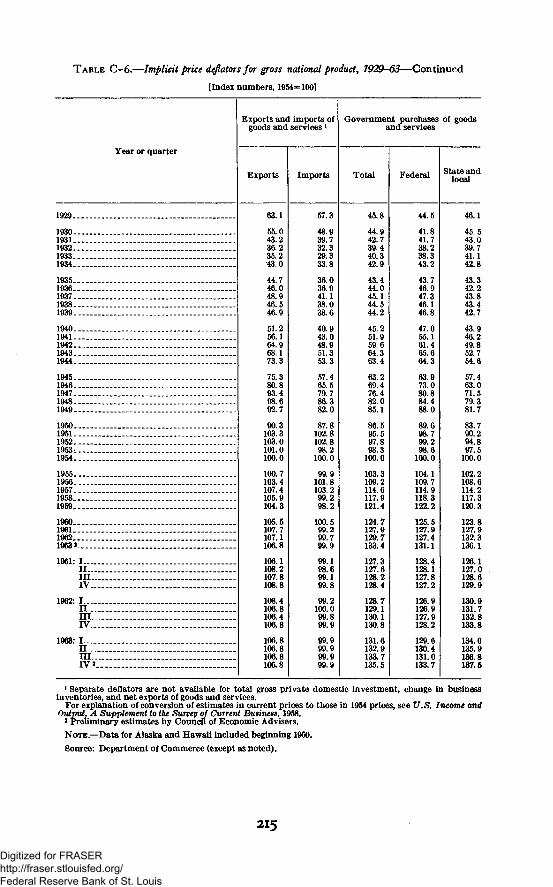
TABLE C-6.—Implicit price deflators for gross national product, 1929-63—Continued
[Index numbers, 1954= 100]
Year or quarter
1929. .
19301931193219331934...
193519361937... _19381939 . .
19401941194219431944
1945. .194619471948 .1949 . -
1950195119521953i1954
19551956 —195719581959...
I960,1961-19621963 * .
1961: I .IIIII _
1962: I._IIIII _ _rv
1963: IIII l l
Exports and imports ofgoods and services *
Exports
63.1
55.043.236.235.2'43.0
44.746.048.946.546.9
51.256.164.968.173.3
75.380.893.498.692.7
90.3103.3103.0101.0100.0
100.7103.4107.4105.9104.3
105.5107.7107.1106.8
106.1108.2107.8108.8
108.4106.8106.4106.8
106.8106.8106.8106.8
Imports
57.3
48.939.732.329.333.8
36.036.941.138.038.6
40.943.048.951.353.3
57.465.579.786.382.0
87.8102.8102.898.2
100.0
99.9101.8103.299.298.2
100.599.299.799.9
99.198.699.199.8
99.2100.099.899.9
99.999.999.999.9
Government purchasesand services
Total
45.8
44.942.739.440.342.9
43.444.045.144.544.2
45.251.959.664.363.4
63.269.476.482.085.1
86.595.597.898.3
100.0
103.3109.2114.6117.9121.4
124.7127.9129.7133.4
127.3127.6128.2128.4
128.7129 1130.1130.8
131.6132.9133.7135.5
Federal
44.5
41.841.738.238.343.2
43.746.947.346.146.8
47.055.161.465.664.3
63.973.080.884.488.0
89.698.799.298.6
100.0
104.1109.7114.9118.3122.2
125.5127.9127.4131.1
128.4128.1127.8127.2
126.9126.9127.9128.2
129.6130.4131.0133.7
of goods
State andlocal
46.1
45.543.039.741.142.8
43.342.243.843.442.7
43.946.249.852.754.6
57.463.071.579.381.7
83.790.294.897.5
100.0
102.2108.6114.2117.3120.3
123.8127.9132.3136.1
126.1127.0128.6129.9
130.9131.7132.8133.8
134.0135.9136.8137.6
1 Separate deflators are not available for total gross private domestic investment, change in businessinventories, and net exports of goods and services.
For explanation of conversion of estimates in current prices to those in 1954 prices, see U.S. Income andOutput, A Supplement to the Survey of Current Business, 1958.
a Preliminary estimates by Council of Economic Advisers.
NOTE.—Data for Alaska and Hawaii included beginning 1960.
Source: Department of Commerce (except as noted).
215
Digitized for FRASER http://fraser.stlouisfed.org/ Federal Reserve Bank of St. Louis
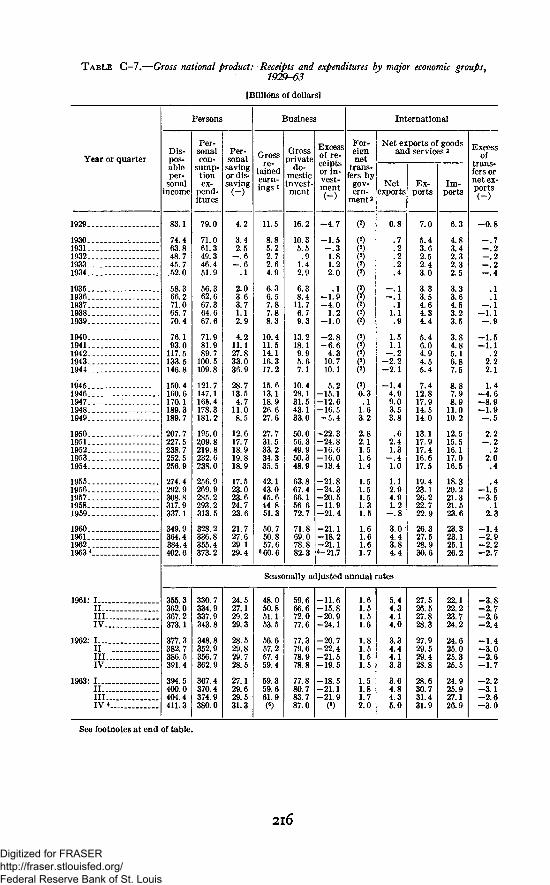
T A B L E C-7.—Gross national product: Receipts and expenditures by major economic groups,1929-63
[Billions of dollars!
Year or quarterDis-pos-ableper-
sonalincome
Persons
Per-sonalcon-
sump-tionex-
pend-itures
Per-sonalsavingor dis-saving
Business
Grossre-
tainedearn-ings^
Grossprivate
do-mesticinvest-ment
Excessof re-ceiptsor in-vest-ment
For-eignnet
trans-fers by
gov-ern-
ment2
International
Netexports
Net exports of goodsand services 2
Ex-ports
Im-ports
Excessof
trans-fers ornet ex-ports()
1929..
1930..1931..1932..1933..1934..
1935..1936.1937.1938.1939.
1940.1941.1942.1943.1944.
1945.1946.1947.1948.1949.
1950.1951.1952.1953.1954.
1955.1956.1957.1958..1959.
I960..1961..1962..1963 f
1961: I...II.IIIIV
1962: I._IIIIIIV
1963: L -II.IIIIV
83.1
74.463.848.745.752.0
58.366.271.065.770.4
76.193.0
117.5133.5146.8
150.4160.6170.1189.3189.7
207.7227.5238.7252.5256.9
274.4292.9308.8317.9337.1
349.9364.4384.4402.6
355.3362.0367.2373.1
377.3382.7386.5391.4
394.5400.0404.4411.3
79.0
71.061.349.346.451.9
56.362.667.364.667.6
71.981.989.7
100.5109.8
121.7147.1165.4178.3181.2
195.02,09.8219.8232.6238.0
256.9269.9285.2293.2313.5
328.2336.8355.4373.2
4.2
3.42.5
—.6- . 6
.1
2.03.63.71.12.9
4.211.127.833.036.9
28.713.54.7
11.08.5
12.617.718.919.818.9
17.523.023.624.723.6
21.727.629.129.4
11.5
8.85.22.72.64.9
6.57.87.88.3
10.411.514.116.317.2
15.613.118.926.627.6
27.731.533.234.335.5
42.143.045.644 851.3
50.750.857.6
8 60. 6
16.2
10.35.5
.91.42.9
8.411.76.79.3
13.218.19.95.67.1
10.428.131.543.133.0
50.056.349.950.3
63.867.466.156 672.7
71.869.078.882.3
-4.7
- 1 . 5- . 31.81.22.0
.1- 1 . 9- 4 . 0
1.2- 1 . 0
- 2 . 8- 6 . 6
4.310.710.1
5.2-15 .1-12.6-16.5- 5 . 4
-22 .3-24.8-16 .6-16.0-13.4
-21.8-24 .3-20.5-11.9-21.4
-21 .1-18.2-21 .18-21.7
0.8
.7
.2
.2
.2
.4
- . 1- . 1
.11.1
1.51.1
- . 2- 2 . 2- 2 . 1
- 1 . 44.99.03.53.8
.62.41.3
- . 41.0
1.12.94.91.2
- . 8
3.04.43.84.4
7.0
5.43.62.52.43.0
3.33.54.64.34.4
5.46.04.94.55.4
7.412.817.914.514.0
13.117.917.416.617.5
19.423.126.222.722.9
26.327.528.930.6
6.3
4.83.42.32.32.5
3.33.64.53.23.5
3.84.85.16.87.5
7.98.9
11.010.2
12.515.516.117.016.5
18.320.221.321.523.6
23.323.125.126.2
Seasonally adjusted annual rates
330.7334.9337.9343.8
348.8352.9356.7362.9
367.4370.4374.9380.0
24.527.129.229.3
28.529.829.728.5
27.129.629.531.3
48.050.851.153.5
56.657.257.459.4
59.359.661.9(6)
59.666.672.077.6
77.379.678.978.8
77.880.783.787.0
-11.6-15.8-20.9-24 .1
-20.7-22.4-21.5-19 .5
-18 .5-21 .1-21.9
(6)
1.6L.5L.5L.6
L.8L.5L.5L.5
1.51.81.72.0
5.44.34.14.0
3.34.44.13.3
3.64.84.35.0
27.526.527.828.3
27.929.529.428.8
28.630.731.431.9
22.122.223.724.2
24.625.025.325.5
24.925.927.126.9
- 0 . 8
- . 7- . 2- . 2- . 2- . 4
.1
.1- . 1
- 1 . 1
- 1 . 5- 1 . 1
.22.22.1
1.4- 4 . 6- 8 . 9- 1 . 9- . 5
2.2- . 2
.22.0.4
.4- 1 . 5- 3 . 5
.12.3
- 1 . 4- 2 . 9- 2 . 2- 2 . 7
-2.7-2.6-2.4
-1 .4-3 .0-2 .6-1 .7
-2.2-3 .1-2.6-3.0
See footnotes at end of table.
216
Digitized for FRASER http://fraser.stlouisfed.org/ Federal Reserve Bank of St. Louis
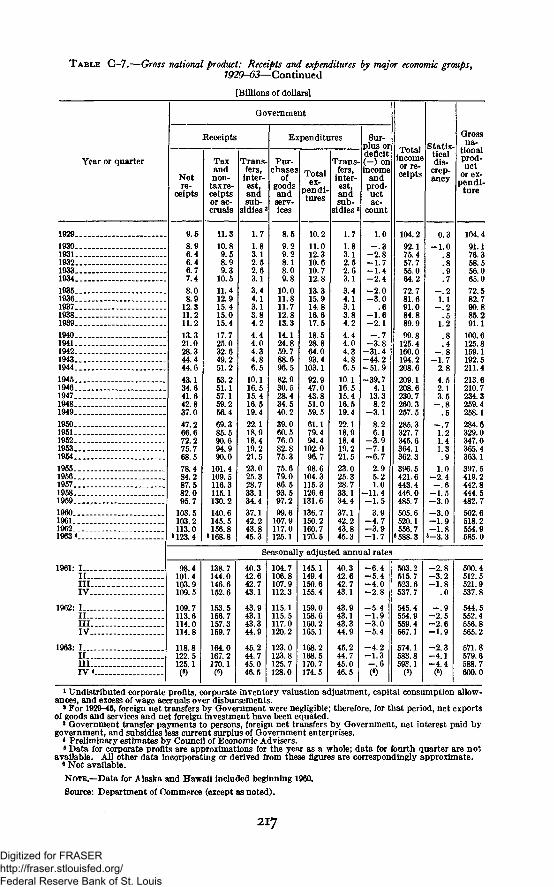
TABLE C—7.—Gross national product: Receipts and expenditures by major economic groups,7929-63—Continued
[Billions of dollars]
Year or quarter
1929.1930.1931.1932.1933.1934.
1937..1938..1939..
1940..1941..1942..1943..1944..
1945..1946..1947..1948..1949..
1950..1951..1952..1953..1954..
1955..1956..1957..1958..1959..
1960..1961..1962..1963*.
1961: I....IE...III.IV..
1962:
III.IV..
1963: I.....II....III...IV«-.
Government
Receipts
Netre-
ceipts
9.58.96.46.46.77.48.08.9
12.311.211.213.321.028.344.444.643.134.641.642.837.0
47.266.672.275.768.578.484.287.582.095.7
103.5103.2113.0
«123.4
Taxandnon-tax re-ceiptsor ac-cruals
11.310.89.58.99.3
10.511.412.915.415.015.4
17.725.032.649.251.253.251.157.159.256.4
85.590.694.990.0
101.4109.5116.3115.1130.2140.6145.5156.8
«168.8
Trans-fers,inter-est,andsub-
sidies ;
1.71.83.12.52.63.13.44.13.13.84.24.44.04.34.86.5
10.116.515.416.519.422.118.918.419.221.523.025.328.733.134.437.142.243.845.3
Expenditures
Pur-chases
ofgoodsandserv-ices
8.59.29.28.18.09.8
10.011.811.712.813.314.124.859.788.696.582.930.528.434.540.239.060.576.082.875.375.679.086.593.597.2
107.9117.0125.1
Totalex-
penditures
10.211.012.310.610.712.813.315.914.816.617.5
18.528.864.093.4
103.192.947.043.851.059.561.179.494.4
102.096.798.6
104.3115.3126.6131.6136.7150.2160.7170.5
Trans-fers,
inter-est,andsub-
sidies !
1.71.83.12.52.63.13.44.13.13.84.24.44.04.34.86.5
10.116.515.416.519.422.118.918.419.221.523.025.328.733.134.437.142.243.845.3
Sur-plus ordeficit(-) onincome
andprod-uctac-
count
1.0- . 3
- 2 . 8- 1 . 7-1 .4-2 .4-2 .0-3 .0
.6- 1 . 6- 2 . 1- . 7
- 3 . 8-31.4-44.2-51.9-39,7
4.113.38.2
- 3 . 18.26.1
-3.9- 7 . 1- 6 . 7
2.95.21.0
-11.4- 1 . 5
- 4 . 7- 3 . 9- 1 . 7
Totalincomeor re-ceipts
104.292.175.457.755.064.272.781.691.084.8
125.4160.0194.2208.6209.1208.6230.7260.3257.5285.3327.7345.6364.1362.3396.5421.6443.4446.0485.7505.6520.1556.7588.3
Statis-ticaldis-
crep-ancy
0.3-1 .0
.7
- . 21.1
- . 2.5
1.2
.4- . 8
-1 .72.84.52.13.5
- . 8.5
L21.41.3.9
1.0-2 .4- . 6
-1 .5- 3 . 0- 3 . 0- 1 . 9- 1 . 8
6-3.3
Grossna-
tionalprod-uct
or ex-pendi-ture
Seasonally adjusted annual rates98.4
101.4103.9109.5
109.7113.6114.0114.8
118.8122.5125.1
138.7144.0146.6152.6
153.5156.7157.3159.7
164.0167.2170.1
(6)
40.342.642.743.1
43.943.143.344.9
45.244.745.046.5
104.7106.8107.9112.3
115.1115.5117.0120.2
123.0123.8125.7128.0
145.1149.4150.6155.4
159.0158.6160.2165.1
168.2168.5170.7174.5
40.342.642.743.1
43.943.143.344.9
45.244.745.046.5
- 6 . 4- 5 . 4- 4 . 0- 2 . 8
- 5 . 4- 1 . 9- 3 . 0- 5 . 4
- 4 . 2- 1 . 3- . 6(6)
503.2515.7523.6537.7
545.4554.9559.4567.1
574.1583.8593.1
(8)
- 2 . 8- 3 . 2- 1 . 8
. 0
- . 9- 2 . 5- 2 . 6- 1 . 9
- 2 . 3-4 .1- 4 . 4
(«)
104.491.176.358.556.065.0
72.582.790.885.291.1
100.6125.8159.1192.5211.4213.6210.7234.3259.4258.1284.6329.0347.0365.4363.1397.5419.2442.8444.5482.7502.6518.2554.9585.0
500.4512.5521.9537.8
544.5552.4556.8565.2
571.8579.6588.7600.0
1 Undistributed corporate profits, corporate inventory valuation adjustment, capital consumption allow-ances, and excess of wage accruals over disbursements.
* For 1929-45, foreign net transfers by Government were negligible; therefore, for that period, net exportsof goods and services and net foreign investment have been equated.1 Government transfer payments to persons, foreign net transfers by Government, net interest paid bygovernment, and subsidies less current surplus of Government enterprises.
* Preliminary estimates by Council of Economic Advisers.« Data for corporate profits are approximations for the year as a whole; data for fourth quarter are not
available. All other data incorporating or derived from these figures are correspondingly approximate.«Not available.NOTE.—Data for Alaska and Hawaii included beginning 1960.Source: Department of Commerce (except as noted).
217
Digitized for FRASER http://fraser.stlouisfed.org/ Federal Reserve Bank of St. Louis
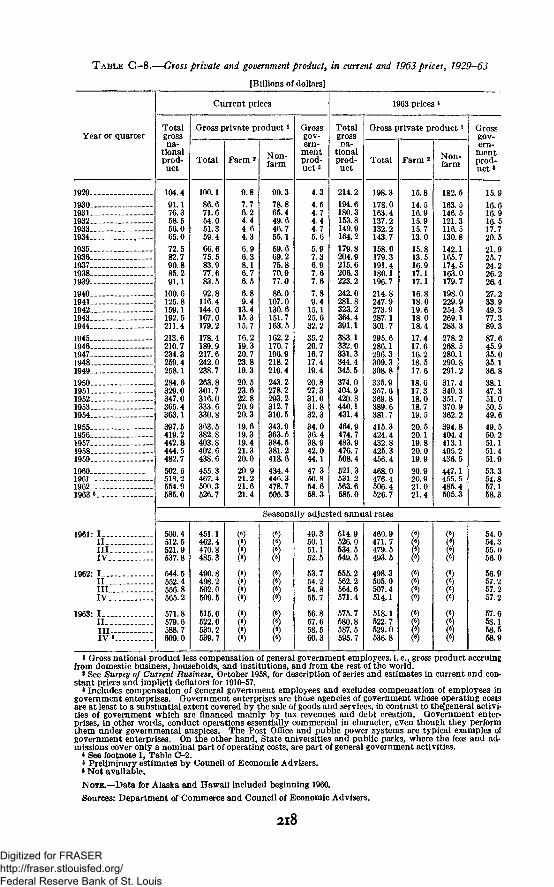
TABLE C-8.—Gross private and government product', in current and 7963 prices, 7929-63
[Billions of dollars]
Year or quarter
Current prices
Totalgrossna-
tionalprod-uct
Gross private productl
Total Farm 2 Non-farm
Grossgov-ern-
mentprod-uct s
1963 prices«
Totalgrossna-
tionalprod-uct
Gross private product'
Total Farm 2 Non-farm
Grossgov-ern-
mentprod-uct3
1929
1930193119321933.1934 , . —
1935193619371938... - -1939.
1940194119421943 -1944
19451946...194719481949
1950...195119521953...1954
19551956_.__1957. —19581959
1960196119621963« -
1961: I . .I I .IIIIV.
1962: I . .I I .I I I .IV.
1963: I . .I I .I l lIV
104.491.176.358.556.065.0
72.582.790.885.291.1
100.6125.8159.1192.5211.4
213.6210.7234.3259.4258.1284.6329.0347.0365.4363.1397.5419.2442.8444.5482.7502.6518.2554.9585.0
100.186.671.654.051.359.4
66.675.583.977.683.592.8
116.4144.0167.0179.2
178.4189.9217.6242.0238.7263.8301.7316.0333.6330.83G3.5382.8403.8402.6438.6
455.3467.4500.3526.7
9.8
7.76.24.44.64.3
6.38.16.76.5
6.89.4
13.415.315.7
16.219.320.723.819.3
20.523.622.820.920.3
19.619.319.421.320.0
20.921.221.621.4
90.378.865.449.646.755.1
59.669.275.870.977.0
86.0107.0130.6151.7163.5
162.2170.7196.9218.2219.4
243.2278.2293.2312.7310.5
343.9363.5384.5381.2418.6
434.4446.3478.7505.3
4.34.54.74.44.75.6
5.97.36.97.67.6
7.89.4
15.125.632.2
35.220.716.717.419.4
20.827.331.031.832.3
34.036.438.942.044.1
47.350.854.658.3
214.2
194.6180.3153.8149.9164.2
179.8204.9215.6206.3223.2
242.0281.8323.2364.4391.1
383.1332.0331.3344.4345.5
374.0404.9420.8440.1431.4
464.9474.7483.9476.7508.4
521.3531.2563.6585.0
198.3
178.0163.4137.2132.2143.7
158.0179.3191.4180.1196.7
214.8247.9273.9287.1301.7
295.6286.1296.3309.3308.8
335.9357. 6369.8389.6381.7
415.3424.4432.8425.3456.4
468.0476.4506.4526.7
15.8
14.516.915.915.713.0
15.813.516.917.117.1
16.818.019.618.018.4
17.417.616.218.517.6
18.617.318.018.719.5
20.520.119.820.019.9
20.920.921.021.4
182.5
163.5146.5121.3116.5130.8
142.1165.7174.5163.0179.7
198.0229.9254.3269.1283.3
278.2268.5280.1290.8291.2
317.4340.3351.7370.9362.2
394.8404.4413.1405.2436.5
447.1455.5485.4505.3
Seasonally adjusted annual rates
500.4512.5521.9537.8
544.5552.4556.8565.2
571.8579.6588.7600.0
451.1462.4470.8485.3
490.8498.2502.0509.5
515.0522.0530.2539.7
(6)
(6)
(8)(6)
(6)(6)(6)
(6)
(6)
(6)(8)(8)
( 6 )
(6)(6)
(9)
(6)(6)
(8)(8)
(fl)
(8)(8)(8)
49.350.151.152.5
53.754.254.855.7
56.857.658.560.3
514.9526.0534.5549.5
555.2562.2564.6571.4
575.7580.8587.5595.7
460.9471.7479.5493.5
498.3505.0507.4514.1
518.1522.7529.0536.8
(6 )
(6)(6)
(6)
(6)(6)(6)
(8)
(6)(6)
(8)(8)
li(6)
(8)(8)(6)
(6)
(8)(8)(8)
15.9
16.616.916.517.720.5
21.925.724.226.226.4
27.233.949.377.3
87.645.935.035.136.8
38.147.351.050.549.649.550.251.151.451.9
53.354.857.158.3
54.054.355.056.0
56.957.257.257.2
57.658.158.558.9
1 Gross national product less compensation of general government employees, i. e., gross product accruingfrom domestic business, households, and institutions, and from the rest of the world.
2 See Survey of Current Business, October 1958, for description of series and estimates in current and con-stant prices and implicit deflators for 1910-57.
3 Includes compensation of general government employees and excludes compensation of employees ingovernment enterprises. Government enterprises are those agencies of government whose operating costsare at least to a substantial extent covered by the sale of goods and services, in contrast to theSgeneral activi-ties of government which are financed mainly by tax revenues and debt creation. Government enter-prises, in other words, conduct operations essentially commercial in character, even though they performthem under governmental auspices. The Post Office and public power systems are typical examples ofgovernment enterprises. On the other hand, State universities and public parks, where the fees and ad-missions cover only a nominal part of operating costs, are part of general government activities.
* See footnote 1, Table O-2.• Preliminary estimates by Council of Economic Advisers.«Not available.
NOTE.—Data for Alaska and Hawaii included beginning 1960.
Sources: Department of Commerce and Council of Economic Advisers.
218
Digitized for FRASER http://fraser.stlouisfed.org/ Federal Reserve Bank of St. Louis
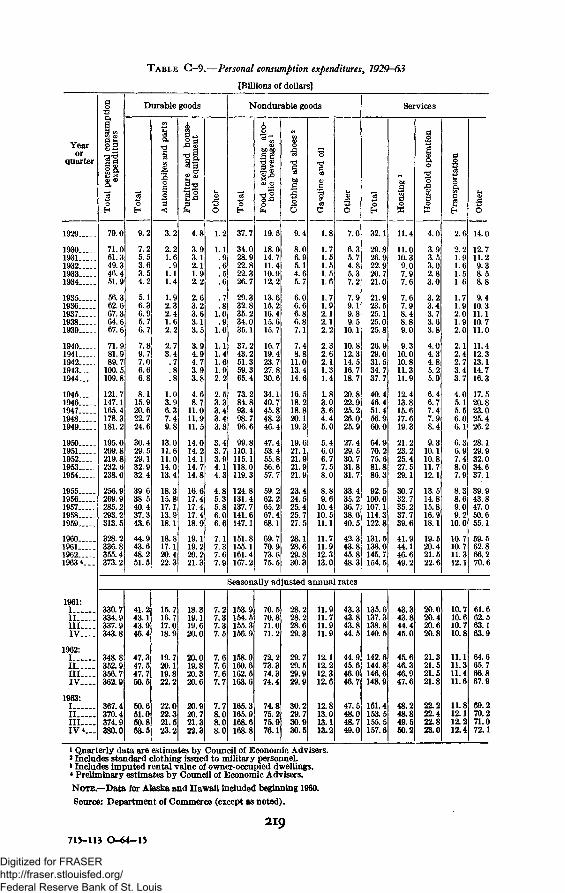
TABLE C-9.—Personal consumption expenditures, 1929-63
[Billions of dollars]
Yearor
quarter
1929
19301931193219331934
19351936193719381939
19401941194219431944
1945 . . . .1946194719481949
19501951195219531954
19551956195719581959
1960196119621963*__.
1961:IIIIII—_I V —
1962:IIII l l—.I V —
1963:IIII l l —IV «...
o
1
!§•a*3"oH
79.0
71.061.349.346.451.9
56.362.667.364.667.6
71.981.989.7
100. 5109.8
121.7147.1165.4178.3181.2
195.0209.8219.8232.6238.0
256.9269.9285.2293.2313.5
328.2336.8355.4373.2
Durable goods
3o
9.2
7.25.53.63.54.2
5.16.36.95.76.7
7.89.77.06.66.8
8.115.920.622.724.6
30.429.529.132.932.4
39.638.540.437.343.6
44.943.648.251.5
d pa
rts
1o3
3.2
2.21.6
. 91.11.4
1.92.32.41.62.2
2.73.4
. 7
. 8
. 8
1.03.96.37.49.8
13.011.611.014.013.4
18.315.817.313.918.1
18.817.120.422.3
hous
e-Le
nt
^1
i!4.8
3.93.12.11.92.2
2.63.23.63.13.5
3.94.94.73.93.8
4.68.7
11.011.911.5
14.014.214.114.714.8
16.617.417.417.418.9
19.119.220.221.3
a>
o1.2
1.1. 9.6. 5.6
.7
. 81.0
. 91.0
1.11.41.61.92.2
2.53.33.43.43.3
3.43.73.94.14.3
4.85.35.86.06.6
7.17.37.67.9
Nondurable goods
3"oH
37.7
34.028.922.822.326.7
29.332.835.234.035.1
37.243.251.359.365.4
73.284.893.498.796.6
99.8110.1115.1118.0119.3
124.8131.4137.7141.6147.1
151.8155.1161.4167.2
1-
excl
udi
c be
vei
o
19.5
18.014.711.410.912.2
13.615.216.415.615.7
16.719.423.727.830.6
34.140.745.848.246.4
47.453.455.856.657.7
59.262.265.267.468.1
69.770.973.675.5
1•s
tig a
nd
thii
O
9.4
8.06.95.14.65.7
6.06.66.86.87.1
7.48.8
11.013.414.6
16.518.218.820.119.3
19.621.121.921.921.9
23.424.525.425.727.5
28.128.629.830.3
'©
le a
nd
"•§
O
1.8
1.71.51.51.51.6
1.71.92.12.12.2
2.32.62.11.31.4
1.83.03.64.45.0
5.46.06.77.58.0
8.89.6
10.410.511.1
11.711.912.313.0
O
7.0
6.35.74.85.37.2
7.99.19.89.5
10.1
10.812.314.516.718.7
20.822.925.226.025.9
27.429.530.731.831.7
33.435.236.738.040.5
42.343.845.848.3
Services
3o
32.1
29.826.922.920.721.0
21.923.525.125.025.8
26.929.031.534.737.7
40.446.451.456.960.0
64.970.275.681.886.3
92.5100.0107.1114.3122.8
131.5138.0145.7154.5
CO
•§o
w11.4
11.010.39.07.97.6
7.67.98.48.89.0
9.310.010.811.311.9
12.413.815.617.619.3
21.223.225.427.529.1
30.732.735.237.739.6
41.944.146.649.2
1O
"o
Io
4.0
3.93.53.02.83.0
3.23.43.73.63.8
4.04.34.85.25.9
6.46.77.47.98.4
9.310.110.811.712.1
13.514.815.816.918.1
19.520,421.522.6
po
t12.6
2.21.91.61.51.6
1.71.92.01.92.0
2.12.42.73.43.7
4.05.15.56.06.1
6.36.97.48.07.9
8.38.69.09.2
10.0
10.710.711.312.1
o<£<O
14.0
12.711.29.38.58.8
9.410.311.110.711.0
11.412.313.114.716.3
17.520.823.025.426.2
28.129.932.034.637.1
39.943.847.050.655.1
59.562.866.270.6
Seasonally adjusted annual rates
330.7334.9337.9343.8
348.8352.9356.7362.9
367.4370.4374.93S0.0
41.243.143.946.4
47.347.547.750.5
50.651.050.853.5
15.716.717.018.9
19.720.119.822.2
22.022.321.523.2
18.319.119.620.0
20.019.820.320.6
20.920.721.322.3
7.27.37.37.5
7.67.67.67.7
7.78.08.08.0
153.9154.5155.3156.9
158.9160.6162.5163.6
165.3165.9168.6168.8
70.570.871.071.2
72.273.374.374.4
74.875.275.976.1
28.228.228.629.3
29.729.529.929.9
30.229.730.930.5
11.911.711.911.9
12.112.212.312.6
12.813.013.113.2
43.343.843.844.5
44.945.646.046.7
47.548.048.749.0
135.6137.3138.8140.5
142.6144.8146.6148.9
151.4153.5155.5157.6
43.343.844.445.0
45.646.346.947.6
48.248.849.550.2
20.020.420.620.8
21.321.521.521.8
22.222.422.823.0
10.710.610.710.8
11.111.311.411.6
11.812.112.212.4
61.662.563.163.9
64.665.766.867.9
69.270.271.072.1
* Quarterly data are estimates by Council of Economic Advisers.* Includes standard clothing issued to military personnel.»Includes imputed rental value of owner-occupied dwellings.« Preliminary estimates by Council of Economic Advisers.
NOTE—Data for Alaska and Hawaii included beginning 1960.
Source: Department of Commerce (except as noted).
219715-113 O-64-15
Digitized for FRASER http://fraser.stlouisfed.org/ Federal Reserve Bank of St. Louis
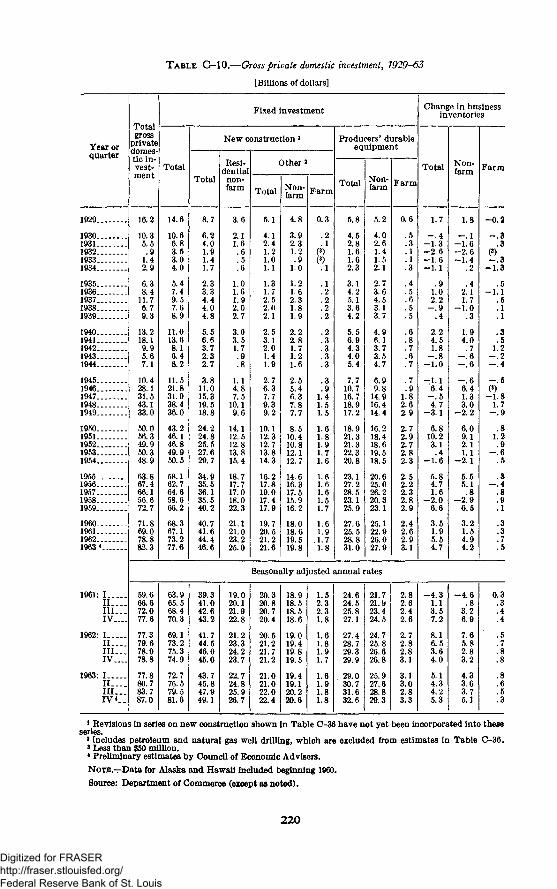
TABLE C-10.—Gross private domestic investment, 7929-63
[Billions of dollars]
Year orquarter
Totalgross
privatedomes-tic in-vest-ment
1929
19301931193219331934
19351936193719381939
19401941194219431944
19451946194719481949
19.501951195219531954
19551956195719581959
1960196119621963 *._._
1961: IIIIII—IV...
1962: III..._I I I . . .IV....
1963: II I . . .
16.2
10.35.5.9
1.42.9
6.38.4
11.76.79.3
13.218.19.95.67.1
10.428.131.543.133.0
50.056.349.950.348.9
63.867.466.156.672.7
71.869.078.882.3
Fixed investment
Total
14.6
10.66.83.53.04.0
5.47.49.57.68.9
11.013.68.16.48.2
11.521.831.938.436.0
43.246.146.849.950.5
58.162.764.658.666.2
68.367.173.277.6
New construction l
Total
8.7
6.24.01.91.41.7
2.33.34.44.04.8
5.56.63.72.32.7
3.811.015.319.518.8
24.224.825.527.629.7
34.935.536.135.540.2
40.741.644.446.6
Residential
non-farm
3.6
2.11.6.6.5
1.01.61.92.02.7
3.03.51.7
1.14.87.5
10.19.6
14.112.512.813.815.4
18.717.717.018.022.3
21.121.023.225.0
Other 2
Total
5.1
4.12.41.21.01.1
1.31. 72.52.02.1
2.53.12.01.41.9
2.76.37.79.39.2
10.112.312.713.814.3
16.217.819.017.417.9
19.720.521.221.6
Non-farm
4.8
3.92.31.2.9
1.0
1.21.62.31.81.9
2.22.81.71.21.6
2.55.46.37.87.7
8.510.410.812.112.7
14.616.317.515.916.2
18.018.619.519.8
Farm
0.3
. 2
. 1
.7
1.61.61.61.51.7
1.61.9
.1.71.8
Producers' durableequipment
Total
5.8
4.52.81.61.62.3
3.14.25.13.64.2
5.56.94.34.05.4
7.710.716.718.917.2
18.921.321.322.320.8
23.127.228.523.125.9
27.625.528.831.0
Non-farm
5.2
4.02.61.41.52.1
2.73.64.53.13.7
4.96.13.73.54.7
9.814.916.414.4
16.218.418.619.518.5
20.625.026.220.323.1
25.122.926.027.9
Farm
0.6
.5
.3
.1
.1
.3
.4
.5
.6
.5
.5
.6
.8
.7
.6
.7
1.82.62.9
2.72.92.72.82.3
2.52.22.32.82.9
2.42.62.93.1
Change in businessinventories
Total
1.7
- . 4- 1 . 3-2 .6-1 .6- 1 . 1
.91.02.2
- . 9.4
2.24.51.8
- . 8- L 0
- 1 . 1"6.4- . 54.7
-3 .1
6.810.23.1.4
-1 .6
5.84.71.6
-2 .0
3.51.95.54.7
Non-farm
1.8
—. 1-1 .6- 2 . 6- 1 . 4
.42.11.7
-1 .0.3
1.94.0.7
- . 6- . 6
- . 66.41.33.0
- 2 . 2
6.09.12.11.1
- 2 . 1
5.55.1.8
- 2 . 9
3.21.54.94.2
Seasonally adjusted annual rates
Farm
-0.2
- . 3.3
(8)- . 3
- 1 . 3
.6- 1 . 1
.5
.1
.1
.3
.51.2
- . 2- . 4
- . 5(8)
-1 .81.7
- . 9
.81.2
.5
.3- . 4
.8
.9
.1
.3
.3
.7
.5
59.666.672.077.6
77.379.678.978.8
77.880.783.787.0
63.965.568.470.3
69.173.275.374.9
72.776.579.581.6
39.341.042.643.2
41.744.546.045.0
43.745.847.949.1
19.020.121.922.8
21.223.324.223.7
22.724.825.926.7
20.320.820.720.4
20.521.221.721.2
21.021.022.022.4
18.918.518.518.6
19.019.419.819.5
19.419.120.220.6
1.52.32.31.8
1.61.81.91.7
1.61.91.81.8
24.624.525.827.1
27.428.729.329.9
29.030.731.632.6
21.721.923.424.5
24.725.826.626.8
25.927.628.829.3
2.82.62.42.6
2.72.82.83.1
3.13.02.83.3
- 4 . 31.13.57.2
8.16.53.64.0
5.14.34.25.3
- 4 . 6. 8
3.26.9
7.65.82.83.2
4.33.63.75.]
0.3.3.4.4
.5
.7
.5
.3
1 Revisions in series on new construction shown in Table C-36 have not yet been incorporated into these
»Includes petroleum and natural gas well drilling, which are excluded from estimates in Table 0-36.» Less than $50 million.
* Preliminary estimates by Council of Economic Advisers.
NOTE.—Data for Alaska and Hawaii included beginning 1060.
Source: Department of Commerce (except as noted).
220
Digitized for FRASER http://fraser.stlouisfed.org/ Federal Reserve Bank of St. Louis
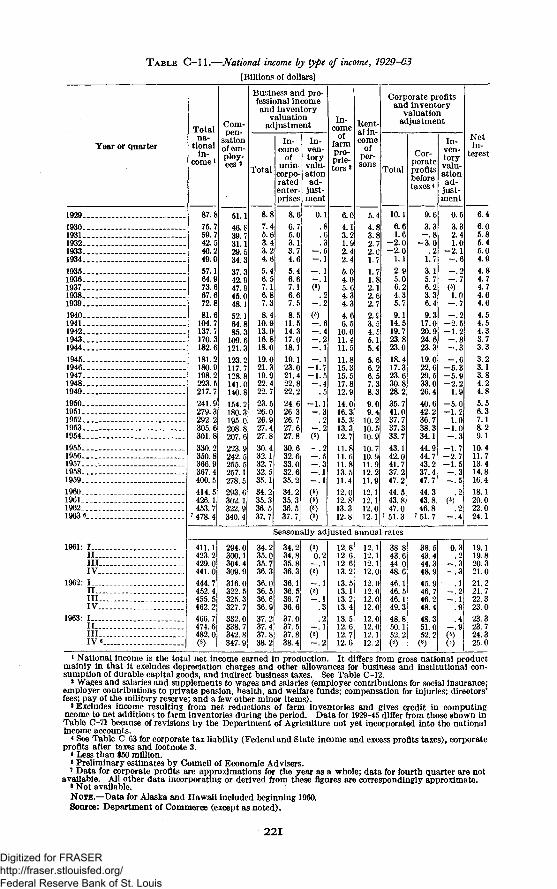
TABLE C-ll.—National income by type of income, 1929-63
[Billions of dollars]
Year or quarter
Totalna-
tionalin-
come1
Com-pen-
sationof em-ploy-ees »
Business and pro-fessional incomeand inventory
valuationadjustment
Total
In-come
ofunin-
corpo-ratedenter-prises
In-ven-toryvalu-ationad-
just-ment
In-come
offarmpro-prie-tors 3
Rent-al in-come
ofper-sons
Corporate profitsand inventory
valuationadjustment
Total
10.16.61.6
-2 .0-2 .0
1.1
2.95.06.24.35.7
9.114.519.723.823.018.417.323.630.828.235.741.037.737.333.743.142.041.737.247.244.543.847.0
7 51.3
Cor-porateprofitsbeforetaxes*
9.6
3.3- . 8
-3 .0. 2
1.7
3.15.76.23.36.4
9.317.020.924.623.319.022.629.533.026.440.642.236.738.334.144.944.743.237.447.744.343.846.8
7 51.7
In-ven-toryvalu-ationad-
just-ment
Netin-
terest
1929-_
1930-.1931-_1932_.1933-.1934-.
1935..1936--1937._1938..
87.875.759.42.540.249.0
51.146.839.31.129.534.
1940..1941__1942..1943..1944..
1945..1946..1947-.1948-.1949..
1950- .1951..1952..1953..1954..
1955..1956...1957...1958..1959...
I960-..1961...1962...1963 6..
57.164.973.667.672.881.6
104.137.170.182.
181.180.198.223.217.
241.279.292.305.6301.8
330.2350.8366.9367. 4400.5414.5426.1453.7
7 478. 4
37.342.947.945.048.152.164.885.3
109.6121.3123.2117.128.8141.0140.8154.2180.3195.0208.8207.6223.9242.5255.5257.1278.5293.6302.1322.9340.4
8.87.45.63.43.24.65.46.57.16.87.38.4
10.913.916.818.019.021.319.922.422.
23.526.026.927.427.830.432.132.732.535.134.235.336.537.7
8.66.75.03.13.74.65.46.67.16.67.58.S
ll.fi14.317.018.119.123.021.422.822.2
24.626.326.727.627.8
30.632.633.032.635.234.235.336.537.7
0.1.8.6.3
- ! l- . 1- . 1
0)—. 4—. 2- . 1
- . 1- 1 . 7- 1 .- . 4
- 1 . 1- . 3
- .2- . 5- . 3- . 1- . 1
0)(5)
6.04.13.21.92.42.4
5.04.05.64.34.3
4.66.5
10.011.41111.815.315.517.812.9
14.016.315.313.312.711.811.611.813.511.412.012.813.312.8
5.44.83.82.72.01.7
1.71.82.12.62.7
3.54.55.15.45.66.26.57.38.39.09.4
10.10.510.9
10.10.911.912.211.912.112.112.012.1
0.53.32.41.0
- 2 . 1- . 6
- 2 .- 1 .- . 8
q- . 6
- 5 .-5 .9-2 .2
1.9-5 .0-1 .2
1.0-1 .0- . 3
-1 .7-2 .7-1 .5
q
- . 5
. 2
. 2- . 4
6.46.05.85.45.04.94.84.74.74.64.64.54.54.33.73.33.23.13.84.24.85.56.37.18.29.1
10.411.713.414.816.418.120.022.024.1
Seasonally adjusted annual rates
1961: IIIIIIIV
1962: III . .I l lIV
1963: IIIIIIIV 6
411.1423.2429.0441.0444.7452.4455.5462.2466.7474.6482.0()
294.0300.1304.4309.9316.0322.5325.3327.7332.0338.7342.8347.9
34.235.035.736.336.036.536.636.937.237.437.838.2
34.234.835.836.336.136.536.736.637.037.537.838.4
(5)0.2
- . 1(«)- . 1(5)
. 3
.2- . 1(8)- . 2
12.812.612.613.213.513.113.213.413.512.612.712.6
12.112.112.112.012.012.012.012.012.012.012.112.2
38.843.644.048.646.146.546.149.348.850.152.2CO
38.543.444.348.945.946.746.248.448.351.052.2
(8)
0.3.2
- . 3- . 3
.1- . 2- . 1
.9
.4- . 9(5)(8)
19.119.820.321.021.221.722.323.023.323.724.325.0
i National income is the total net income earned in production. It differs from gross national productmainly in that it excludes depreciation charges and other allowances for business and institutional con-sumption of durable capital goods, and indirect business taxes. See Table C-12.
a Wages and salaries and supplements to wages and salaries (employer contributions for social insurance;employer contributions to private pension, health, and welfare funds; compensation for injuries; directors'fees; pay of the military reserve; and a few other minor items).
3 Excludes income resulting from net reductions of farm inventories and gives credit in computingncome to net additions to farm inventories during the period. Data for 1929-45 differ from those shown inTable C-71 because of revisions by the Department of Agriculture not yet incorporated into the nationalIncome accounts.
* See Table C-63 for corporate tax liability (Federal and State income and excess profits taxes), corporateprofits after taxes and footnote 3.
* Less than $50 million.« Preliminary estimates by Council of Economic Advisers.i Data for corporate profits are approximations for the year as a whole; data for fourth quarter are not
available. All other data incorporating or derived from these figures are correspondingly approximate.8 Not available.NOTE.—Data for Alaska and Hawaii included beginning 1960.Source: Department of Commerce (except as noted).
221
Digitized for FRASER http://fraser.stlouisfed.org/ Federal Reserve Bank of St. Louis
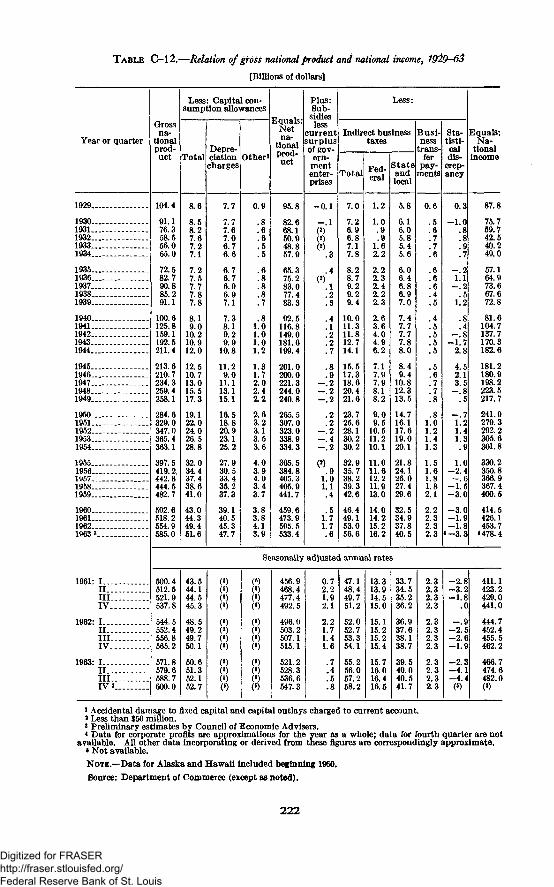
TABLE C-l 2.—Relation of gross national product and national income, 7929-63
[Billions of dollars]
Year or quarter
Grossna-
tionalprod-uct Total
Less: Capital con-sumption allowances
Depre-ciationcharges
Other*
Equals:Netna-
tionalprod-uct
Plus:Sub-sidiesless
currentsurplusof gov-
ern-mententer-
Less:
Indirect business
Total
7.0
7.26.96.87.17.8
8.28.79.29.29.4
10.011.311.812.714.1
15.517.318.620.421.6
23.725.628.130.230.2
32.935.738.239.342.6
46.449.153.056.6
taxes
Fed-eral
1.2
1.0. 9. 9
1.62.2
2.22.32.42.22.3
2.63.64.04.96.2
7.17.97.98.18.2
9.09.5
10.511.210.1
11.011.612.211.913.0
14.014.215.216.2
Stateandlocal
5.8
6.16.05.85.45.6
6.06.46.86.97.0
7.47.77.77.88.0
8.49.4
10.812.313.5
14.716.117.619.020.1
21.824.126.027.429.6
32.534.937.840.5
Busi-ness
trans-fer
pay-ments
0.6
. 5
. 6
. 7
. 7
. 6
. 6
. 6
. 6
.4
. 5
.4
. 5
. 5
. 5
. 5
. 5
. 6
. 7
. 7
. 8
. 81.01.21.41.3
1.51.61.81.82.1
2.22.32.32.3
Sta-tisti-caldis-
crep-ancy
0.3
- 1 . 0. 8. 8. 9.7
- . 21.1
- . 2. 5
1.2
.8
.4- . 8
- 1 . 72.8
4.52.13.5
- . 8r
—. 71.21.41.3
. 9
1.0- 2 . 4—.6
- 1 . 5- 3 . 0
- 3 . 0- 1 . 9- 1 . 8
*-3.3
Equals:Na-
tionalincome
1929..
1930..1931..1932..1933..1934..
1935..1936..1937..1938-.1939-
1940..1941..1942..1943..1944..
1945..1946-.1947-.1948..1949..
1950..1951-1952..1953..1954..
1955..1956..1957-1958..1959..
I960..1961..1962._1963 3
1961: I — .I I . ..III..IV..
1962: I.._.II . . .I II .IV..
1963: I.._.II . . .III .IV 3
104.4
91.176.358.556.065.0
72.582.790.885.291.1
100.6125.8159.1192.5211.4
213.6210.7234.3259.4258.1
284.6329.0347.0365.4363.1
397.5419.2.442.8444.5482.7
502.6518.2554.9585.0
8.6
8.58.27.67.27.1
7.27.57.77.87.8
8.19.0
10.210.912.0
12.510.713.015.517.3
19.122.024.026.528.8
32.034.437.438.641.0
43.044.349.451.6
7.7
7.77.67.06.76.6
6.76.76.96.97.1
7.38.19.29.9
10.8
11.29.0
11.113.115.1
16.518.820.923.125.2
27.930.533.435.237.3
39.140.545.347.7
0.9
1.01.01.01.2
1.31.72.02.42.2
2.63.23.13.53.6
4.03.94.03.43.7
3.84.13.9
95.8
82.668.150.948.857.9
65.375.283.077.483.3
92.5116.8149.0181.6199.4
201.0200.0221.3244.0240.8
265.5307.0323.0
334.3
365.5384.8405.3405.9441.7
459.6473.9505.5533.4
- 0 . 1
- . 1
8
.9- . 2- . 2- . 2
.2
.2- . 2- . 4- . 2
1.01.1.4
.51.71.7
Seasonally adjusted annual rates
500.4512.5521.9537.8
544.5552.4556.8565.2
571.8579.6588.7600.0
43.544.144.545.3
48.549.249.750.1
50.651.352.152.7
(5)(5)(5)(8)
(s)(s)(6)(*)
(5)(5)(5)(8)
(5)(s)(5)(5)
(5)(*)(«)(')
(8)(5)
8
456.9468.4477.4492.5
496.0503.2507.1515.1
521.2528.3536.6547.3
0.72.21.92.1
2.21.71.41.6
.7A. 5. 8
47.148.449.751.2
52.052.753.354.1
55.256.057.258.2
13.313.914.515.0
15.115.215.215.4
15.716.016.416.5
33.734.535.236.2
36.937.638.138.7
39.540.040.541.7
2.32.32.32.3
2.32.32.32.3
2.32.32.32.3
- 2 . 8- 3 . 2- 1 . 8
.0
- . 9- 2 . 5- 2 . 6- 1 . 9
- 2 . 3- 4 . 1- 4 . 4<6)
87.8
75.759.742.540.249.0
57.164.973.667.672.8
81.6104.7137.7170.3182.6
181.2180.9198.2223.5217.7
241.9279.3292.2305.6301.8
330.2350.8366.9367.4400.5
414.5426.1453.7
•478.4
411.1423.2429.0441.0
444.7452.4455. 5462.2
466.7474.6482.0(*)
1 Accidental damage to fixed capital and capital outlays charged to current account.* Less than $50 million.3 Preliminary estimates by Council of Economic Advisers.* Data for corporate profits are approximations for the year as a whole; data for fourth quarter are not
available. All other data incorporating or derived from these figures are correspondingly approximate.«Not available.
NOTE.—Data for Alaska and Hawaii included beginning 1960.
Source: Department of Commerce (except as noted).
222
Digitized for FRASER http://fraser.stlouisfed.org/ Federal Reserve Bank of St. Louis
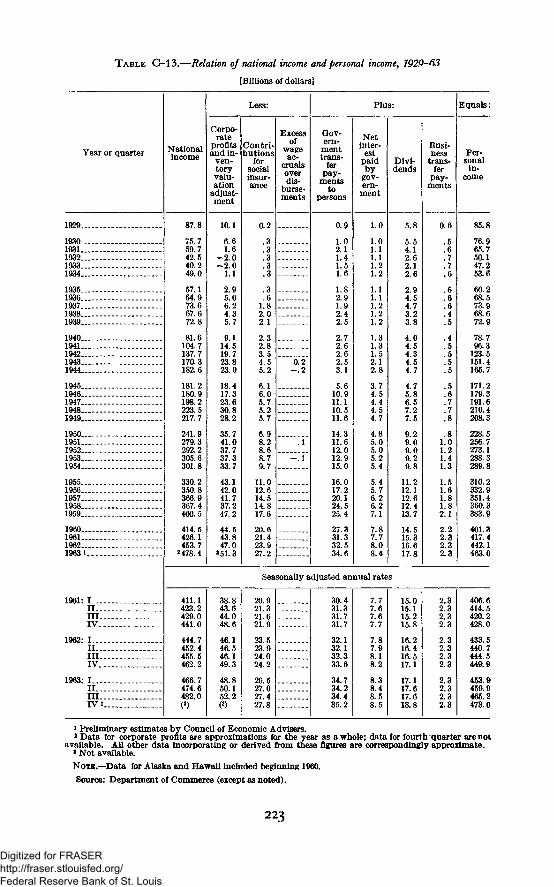
TABLE C-l 3.—Relation of national income and personal income^ 792Q-G3
[Billions of dollars]
Year or quarter
1929 - -
19301931193219331934
1935 . . .1936193719381939
19401941194219431944
19451946194719481949
1950 ,1951195219531954
19551956 _195719581959
1960196119621963 1
1961: IIIIIIIV
1962: III . . .IllIV
1963: III .III.IV».
Nationalincome
87.8
75.759.742.540.249.0
57.164.973.667.672.8
81.6104.7137.7170.3182.6
181.2180.9198.2223.5217.7
241.9279.3292.2305.6301.8
330.2350.8366.9367.4400.5
414.5426.1453.7
2 478.4
Less:
Corpo-rate
profitsand in-
ven-toryvalu-ation
adjust-ment
10.1
6.61.6
-2 .0- 2 . 0
1.1
2.95.06.24.35.7
9.114.519.723 823.0
18.417.323.630.828.2
35.741.037.737.333.7
43.142.041.737.247.2
44.543.847.0
251.3
Contri-butions
forsocialinsur-ance
0.2
.3
.3
.3
.3
.3
.3
.61.82.02.1
2.32 83.54 55.2
6.16.05.75.25.7
6 98.28.68.79.7
11.012.614.514.817.6
20.621.423.927.2
Excessof
wageac-
crualsoverdis-
burse-ments
0.2- . 2
. 1
— . 1
Plus:
Gov-ern-
menttrans-
ferpay-
mentsto
persons
0.9
1.02.11.41.51.6
1.82.91.92.42.5
2.72.62.62.53.1
5.610.911.110.511.6
14.311.612.012.915.0
16.017.220.124.525.4
27.331.332.534.6
Netinter-
estpaidby
gov-ern-ment
1.0
1.01 1L.I.2
.1L.IL.21.2L.2
L.3
2.12.8
3.74.54.44.54.7
4.85.05.05.25.4
5.45.76.26.27.1
7.87.78.08.4
Divi-dends
5.8
5.54 12.62.12.6
2.94.54.73.23.8
4.04 54.34 54.7
4.75.86.57.27.5
9 29.09.09.29.8
11.212.112.612.413.7
14.515.316.617.8
Busi-ness
trans-fer
pay-ments
0.6
.56
.7
.7
.6
.6
.6
.6
.4
.5
.4
.5
.55
.5
.5
.6
.7
.7
.8
81.01.21.41.3
1.51.61.81.82.1
2.22.32.32.3
Equals:
Per-sonalin-
come
85.8
76.965.750.147.253.fi
60.268.573.968.672.9
78.796.3
123.5151.4165.7
171.2179.3191.6210.4208.3
228.5256.7273.1288.3289.8
310.2332.9351.4360.3383.9
401.3417.4442.1463.0
Seasonally adjusted annual rates
411.1423.2429.0441.0
444.7452.4455.5462.2
466.7474.6482.0
38.843.644.048.6
46.146.546.149.3
48.850.152.2
20.921.321.621.9
23.523.924.024.2
26.527.027.427.8
30.431.331.731.7
32.132.132.333.6
34.734.234.435.2
7.77.67.67.7
7.87.98.18.2
8-8iii
;.4151.5
15.015.115.215.8
16.216.416.517.1
17.117.617.618.8
2.32.32.32.3
2.32.32.32.3
2.32.32.32.3
406.6414.5420.2428.0
433.5440.7444.5449.9
453.9459.9465.2473.0
1 Preliminary estimates by Council of Economic Advisers.8 Data for corporate profits are approximations for the year as a whole; data for fourth quarter are not
available. All other data incorporating or derived from these figures are correspondingly approximate.8 Not available.
NOTE.—Data for Alaska and Hawaii included beginning 1960.
Source: Department of Commerce (except as noted).
223
Digitized for FRASER http://fraser.stlouisfed.org/ Federal Reserve Bank of St. Louis
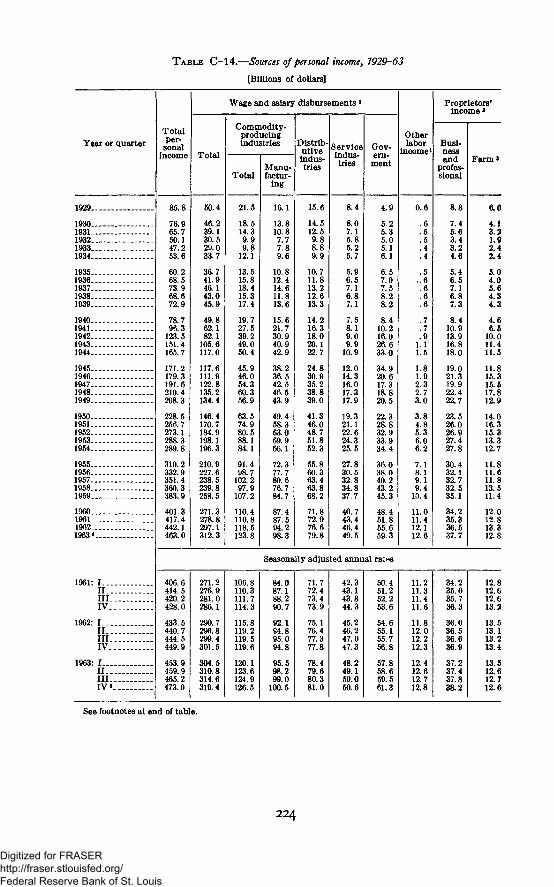
TABLE C-14.—Sources of personal income, 1929-63
[Billions of dollars]
Year or quarterTotalper-sonal
income
Wage and salary disbursements *
Total
Commodity-producingindustries
TotalManu-factur-
ing
Distrib-utiveindus-tries
Serviceindus-tries
Gov-ern-
ment
Otherlabor
income1
Proprietors'income3
Busi-nessand
profes-sional
Farm*
1929.
1930.1931..1932_1933.1934-
1935-1936..1937..1938..1939..
1940-1941-1942-1943-1944-
1945-1946-1947-1948-1949-
1950-1951..1952-1953-1954-
1955-1956-1957-1958-1959..
1960..1961..1962,.1963«
1961: I..II.IIIIV.
1962: I..II.IIIIV.
1963: I..II-IIIIV
85.8
76.965.750.147.253.6
60.268.573.968.672.9
78.796.3
123.5151.4165.7
171.2179.3191.6210.4208.3
228. 5256.7273.1288.3
310.2332.9351.4360.3383.9
401.3417.4442.1463.0
50.4
46.239.130.529.033.7
36.741.946.143.045.9
49.862.182.1
105.6117.0
117.6111.9122.8135.2134.4
146.4170.7184.9198.1196.3
210.9227.6238.5239.8258.5
271.3278.8297.1312.3
21.5
18.514.3
12.1
13.515.818.415.317.4
19.727.539.249.050.4
45.946.054.360.356.9
63.574.980.588.184.1
91.498.7
102.297.9
107.2
110.4110.8118.5123.8
16.1
13.810.87.77.89.6
10.812.414.611.813.6
15.621.730.940.942.9
38.236.542.546.543.9
49.458.363.069.966.1
72.377.780.676.784.7
87.487.594.298.3
15.6
14.512.59.88.8
10.711.813.212.613.3
14.216.318.020.122.7
24.830.935.238.839.0
41.346.048.751.852.3
55.860.363.463.868.2
71.872.976.679.8
8.4
8.07.15.85.25.7
5.96.57.16.87.1
7.58.19.09.9
10.9
12.014.316.017.317.9
19.321.122.624.325.5
27.830.532.834.837.7
40.743.446.449.5
4.9
5.25.35.05.16.1
6.57.97.58.28.2
8.410.216.026.633.0
34.920.617.318.820.5
22.328.832.933.934.4
36.038.040.243.245.3
48.451.855.659.3
0.6
.5
.5
.4
.4
.5..6
.7
.7
.9i. r1.51.81.92.32.73.0
3.84.85.36.06.2
7.18.19.19.4
10.4
11.011.412.112.6
Seasonally adjusted annual rat«s
8.8
7.45.63.43.24.6
5.46.57.16.87.3
8.410.913.916.818.0
19.021.319.922.422.7
23.526.026.927.427.8
30.432.132.732.535.1
34.235.336.537.7
406.6414.5420.2428.0
433.5440.7444.5449.9
453. 9459.9465.2473.0
271.2276.9281.0286.1
290.7296.8299.4301.5
304.5310.8314.6319.4
106.8110.3111.7114.3
115.8119.2119.5119.6
120.1123.6124.9126.5
84.087.188.290.7
92.1S4.895.094.8
95.598.299.0
100.5
71.772.473.473.9
75.176.477.377.8
78.479.680.381.0
42.343.143.844.3
45.246.247.047.3
48.249.150.050.6
50.451.252.253.6
54.655.155.756.8
57.858.659.561.3
11.211.311.411.6
11.812.012.212.3
12.412.612.712.8
34.235.035.736.3
36.036.536.636.9
37.237.437.838.2
6.0
4.13.21.02.42.4
5.04.05.64.34.3
4.66.5
10.011.411.5
11.815.315.517.812.9
14.016.315.313.312.7
11.811.611.813.511.4
12.012.813.312.8
12.812.612.613.2
13.513.113.213.4
13.512.612.712.6
See footnotes at end of table.
224
Digitized for FRASER http://fraser.stlouisfed.org/ Federal Reserve Bank of St. Louis
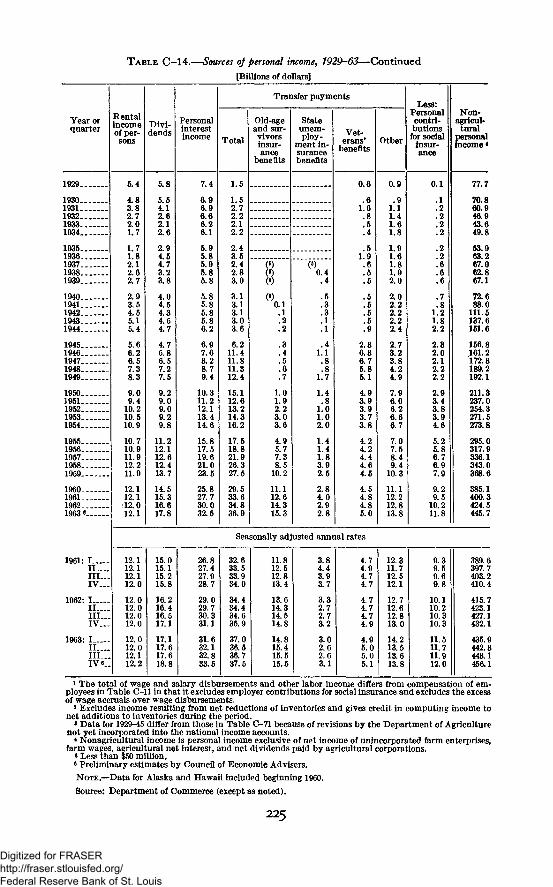
TABLE C-14.—Sources of personal income, 7929-63—Continued
[Billions of dollars]
Year orquarter
Rentalincomeof per-sons
1929.
1931 . .1932..1933..1934..
1935..1936..1937..1938..1939..
1940..1941..1942..1943..1944..
1945..1946..1947..1948..1949..
1950..1951.1952.1953.1954.
1955.1956.1957.1958.1959..
1960196119621963 6
1961: I
III . . .IV—
1962: I . . . .II—_III . .IV—
1963: II I . . . .I II . .IV«.
5.4
4.83.82.72.01.7
1.71.82.12.62.7
2.93.54.55.15.4
5.66.26.57.38.3
9.09.4
10.210.510.9
10.710.911.912.211.9
12.112.112.012.1
Divi-dends
12.112.112.112.0
12.012.012.012.0
12.012.012.112.2
5.8
5.54.12.62.12.6
2.94.54.73.23.8
4.04.54.34.54.7
4.75.86.57.27.5
9.29.09.09.2
11.212.112.612.413.7
14.515.316.617.8
Personalinterestincome
7.4
6.96.96.66.26.1
5.95.85.95.85.8
5.85.85.85.86.2
6.97.68.28.79.4
10.311.212.113.414.6
15.817.519.621.023.5
25.827.730.032.5
Transfer payments
Total
1.5
1.52.72.22.12.2
2.43.52.42.83.0
3.13.13.13.03.6
6.211.411.811.312.4
15.112.613.214.316.2
17.518.821.926.327.5
29.5
36.9
Old-ageand sur-vivorsinsur-ance
benefits
()0.1.1.2.2
.3
.4
.5
.6
.7
1.01.92.23.03.6
4.95.77.38.5
10.2
11.112.614.315.3
Stateunem-ploy-
ment in-surancebenefits
0.4.4
.5
.3
.3
.1
.1
.41.1.8.8
1.7
1.4.8
1.01.02.0
1.41.41.83.92.5
2.84.02.92.8
Vet-erans'
benefits
0.6
1.6.8.5.4
.51.9.6.5.5
.5
.5
.5
.5
2.86.86.75.85.1
4.93.93.93.73.8
4.24.24.44.64.5
4.54.84.85.0
Other
0.9
1.11.41.61.8
1.91.61.81.92.0
2.02.22.22.22.4
2.73.23.84.24.9
7.96.06.26.66.7
7.07.58.49.4
10.3
11.112.212.813.8
Less:Personalcontri-butionsfor social
insur-ance
Seasonally adjusted annual rates
0.1
.1
.2
.2
.2
.2
.2
.2
.7
.81.21.82.2
2.32.02.12.22.2
2.93.43.83.94.6
5.25.86.76.97.9
9.29.5
10.211.8
Non-agricul-
turalpersonalincome *
77.7
70.860.946.943.649.8
53.963.267.062.867.1
72.688.0
111.5137.6151.6
156.8161.2172.8189.2192.1
211.3237.0254.3271.5273.8
295.0317.9336.1343.0
385.1400.3424.5445.7
15.015.115.215.8
16.216.416.517.1
17.117.617.618.8
26.827.427.928.7
29.029.730.331.1
31.632.132.833.5
32.633.533.934.0
34.434.434.635.9
37.036.536.737.5
11.812.512.813.4
13.614.314.514.8
14.815.415.515.5
3.84.43.93.7
3.32.72.73.2
3.02.62.63.1
4.74.94.74.7
4.74.74.74.9
4.95.05.05.1
12.311.712.512.1
12.712.612.813.0
14.213.513.613.8
9.39.59.69.8
10.110.210.310.3
11.511.711.912.0
389.6397.7403.2410.4
415.7423.1427.1432.1
435.9442.8448.1456.1
* The total of wage and salary disbursements and other labor income differs from compensation of em-ployees in Table C-ll in that it excludes employer contributions for social insurance and excludes the excessof wage accruals over wage disbursements.
3 Excludes income resulting from net reductions of inventories and gives credit in computing income tonet additions to inventories during the period.
» Data for 1929-45 differ from those in Table C-71 because of revisions by the Department of Agriculturenot yet incorporated into the national income accounts.
* Nonagricultural income is personal income exclusive of net income of unincorporated farm enterprises,farm wages, agricultural net interest, and net dividends paid by agricultural corporations.
* Less than $50 million.« Preliminary estimates by Council of Economic Advisers.
NOTE.—Data for Alaska and Hawaii included beginning 1960.
Source: Department of Commerce (except as noted).
225
Digitized for FRASER http://fraser.stlouisfed.org/ Federal Reserve Bank of St. Louis
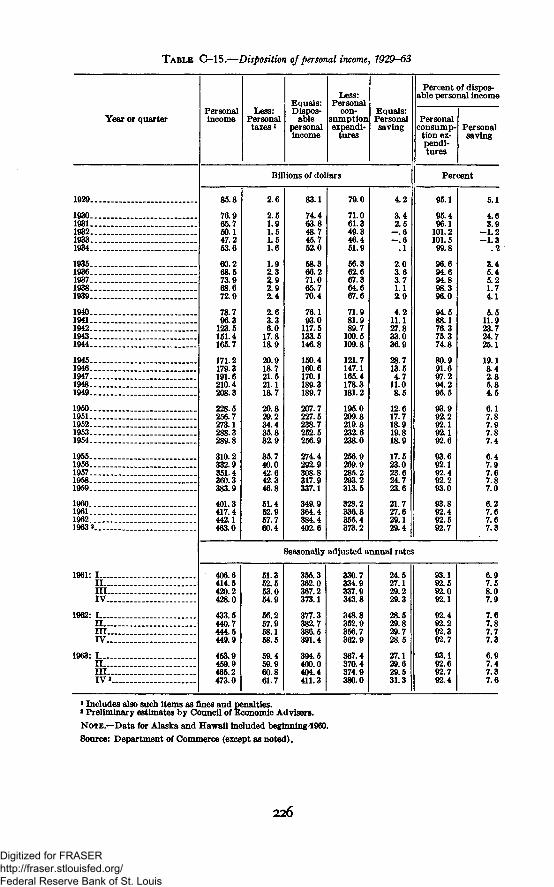
TABLE G-15.—Disposition of personal income, 7929-63
Year or quarter
1929
19301931193219331934
19351936.193719381939
1940. .19411942.19431944
1945.194619471948..1949
1950195119521953.1954
1955195619571958-1959
19601961 _.__19621963 a _ _
1961: IIII I I . . .IV
1962: IIII I I .
1963: I -I I —IIIIV 2
Personalincome
Less:Personaltaxes i
Equals:Dispos-
ablepersonalincome
Less:Personal
con-sumptionexpendi-
tures
Equals:Personalsaving
Billions of dollars
85.8
76.965.750.147.253.6
60.268.573.968.672.9
78.796.3
123.5151.4165.7
171.2179.3191.6210.4208.3
228.5256.7273.1288.3289.8
310.2332.9351.4360.3383.9
401.3417.4442.1463.0
406.6414.5420.2428.0
433.6440.7444.5449.9
453.9459.9465.2473.0
2.6
2.51.91.51.51.6
1.92.32.92.92.4
2.63.36.0
17.818.9
20.918.721.521.118.7
20.829.234.435.832.9
35.740.042.642.346.8
51.452.957.760.4
51.352.553.054.9
56.257.958.158.5
59.459.960.861.7
83.1
74.463.848.745.752.0
58.366.271.065.770.4
76.193.0
117.5133.5146.8
150.4160.6170.1189.3189.7
207.7227.5238.7252.5256.9
274.4292.9308.8317.9337.1
349.9364.4384.4402.6
79.0
71.061.349.346.451.9
56.362.667.364.667.6
71.981.989.7
100.5109.8
121.7147.1165.4178.3181.2
195.0209.8219.8232.6238.0
256.9269.9285.2293.2313.5
328.2336.8355.4373.2
4.2
3.42.5
—.6—.6
.1
2.03.63.71.12.9
4.211.127.833.036.9
28.713.54.7
11.08.5
12.617.718.919.818.9
17.523.023.624.723.6
21.727.629.129.4
Seasonally adjusted annual rates
355.3362.0367.2373.1
377.3382.7386.5391.4
394.5400.0404.4411.3
330.7334.9337.9343.8
348.8352.9356.7362.9
367.4370.4374.9380.0
24.527.129.229.3
28.529.829.728.5
27.129.629.531.3
Percent of dispos-able personal income
Personalconsump-
tion ex-pendi-tures
Personalsaving
Percent
95.1
95.496.1
101.2101.599.8
96.694.694.898.396.0
94.588.176.375.374.8
80.991.697.294.295.5
93.992.292.192.192.6
93.692.192.492.293.0
93.892.492.592.7
93.192.592.092.1
92.492.292.392.7
93.192.692.792.4
5.1
4.63.9
—1.2—1.3
.2
3.45.45.21.74.1
5.511.923.724.725.1
19.18.42.85.84.5
6.17.87.97.87.4
6.47.97.67.87.0
6.27.67.67.3
6.97.58.07.9
7.67.87.77.3
6.97.47.37.6
1 Includes also such items as fines and penalties.
* Preliminary estimates by Council of Economic Advisers.
NOTE.—Data for Alaska and Hawaii included beginning4960.
Source: Department of Commerce (except as noted).
226
Digitized for FRASER http://fraser.stlouisfed.org/ Federal Reserve Bank of St. Louis
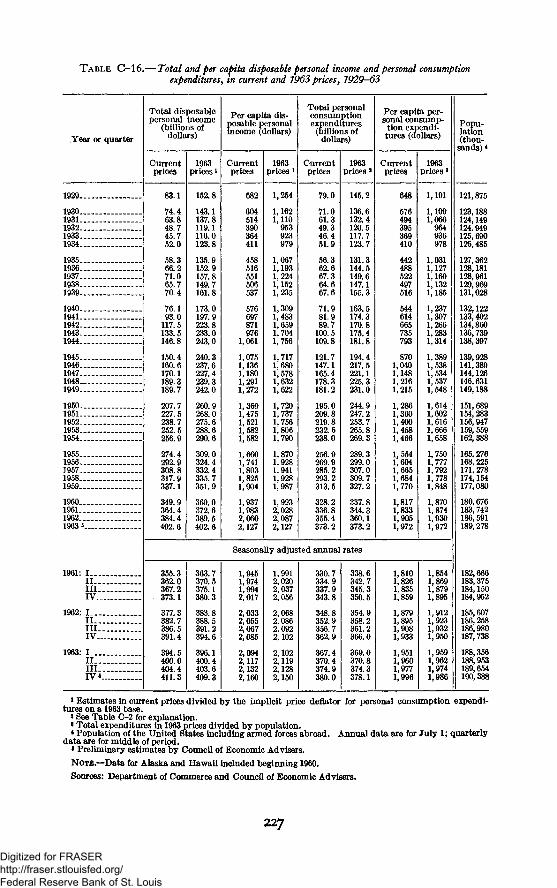
TABLE C-16.—Total and per capita disposable personal income and personal consumptionexpenditures, in current and 1963 prices, 7929-63
Year or quarter
Total disposablepersonal income
(billions ofdollars)
Currentprices
1963prices'
Per capita dis-posable personalincome (dollars)
Currentprices
1963prices :
Total personalconsumptionexpenditures(billions of
dollars)
Currentprices
1963prices a
Per capita per-sonal consump-tion expendi-tures (dollars)
Currentprices
1963prices 3
Popu-lation(thou-sands) *
1929
19301931.19321933.1934
19351936.1937.1938.1939
1940.1941.1942.1943.1944-
1945.1946-1947.19481949
1950195119521953-1954-
195519561957.1958-1959
1960.1961-1962.1963 8
1961: I...IIIII.IV..
1962: I...II..III.IV-
1963: I...II-.III.IV».
83.1
74.463.848.745.752.0
58.366.271.065.770.4
76.193.0117.5133.5146.8
150.4160.6170.1189.3189.7
207.7227.5238.7252.5256.9
274.4292.9308.8317.9337.1
364.4384.4402.6
355.3362.0367.2373.1
377.3382.7386.5391.4
394.5400.0404.4411.3
152.8
143.1137.8119.1116.0123.8
135.9152.9157.8149.7161.8
173.0197.9223.8233.0243.0
240.3237.6227.4239.3242.0
268.0275.6288.6290.6
309.0324.4332.4335. 7351.9
360.0372.6389.5402.6
682
604514390364411
458516551506537
576697871976
1,061
1,0751,136',180,291,272
,475,521,582,582
,660,741,803, 825,904
2,0602,127
1,254
1,1621,110953923979
,067,193,224,152,235
1,9932,0282,0872,127
79.0
71.061.349.346.451.9
56.362.667.364.667.6
71.981.989.7
100.5109.8
121.7147.1165.4178.3181.2
195.0209.8219.8232.6238.0
256.9269.9285.2293.2313.5
328.2336.8355.4373.2
145.2
136.6132.4120.5117.7123.7
131.3144.5149.6147.1155.3
163.5174.3170.8175.4181.8
194.4217.5221.1225.3231.0
244.9247.2253.7265.8269.3
289.3299.0307.0309.7327.2
337.8344.3360.1373.2
Seasonally adjusted annual rates
648
576494395369410
442488522497516
544614665735
8701,0401,1481,2161,215
1,2861,3601,4001,4581,466
1,5541,6041,665, 684,770
,817,833,905,972
363.7370.5375.1380.3
383.8388.5391.2394.6
396.1400.4403.6409.3
1,9451,9741,9942,017
2,0332,0552,0672,085
2,0942,1172,1322,160
1,9912,0202,0372,056
2,0682,0862,0922,102
2,1022,1192,1282,150
330.7334.9337.9343.8
348.8352.9356.7362.9
367.4370.4374.9380.0
338.6342.7345.3350.5
354.9358.2361.2366.0
369.0370. 8374.3378.1
1,8101,8261,8351,859
1,8791,8951,9081,933
1,9511,9601,9771,996
1,191
1,1091,066964936978
1,0311,1271,1601,1321,185
1,2371,3071,2661,2831,314
1,3891,5381,5341,5371,548
1,6141,6021,6161,6661,658
1,7501,7771,7921,7781,848
1,8701,8741,9301,972
1,8541,8691,8791,895
1,9121,9231,9321,950
1,9591,9621,9741,986
121,875
123,188124,149124,949125,690126,485
127,362128,181128,961129,969131,028
132,122133,402134,860136,739138,397
139,928141,389144,126146,631149,188
151,689154,283156,947159, 559162,388
165,276168,225171,278174,154177,080
180,676183,742186,591189,278
182,666183,375184,150184,952
185,607186,258186,980187,738
188,356188,953189,654190,388
1 Estimates in current prices divided by the implicit price deflator for personal consumption expendi-tures on a 1963 base.
2 See Table C-2 for explanation.»Total expenditures in 1963 prices divided by population.4 Population of the United States including armed forces abroad. Annual data are for July 1; quarterly
data are for middle of period.• Preliminary estimates by Council of Economic Advisers.NOTE.—Data for Alaska and Hawaii included beginning 1960.Sources: Department of Commerce and Council of Economic Advisers.
227
Digitized for FRASER http://fraser.stlouisfed.org/ Federal Reserve Bank of St. Louis
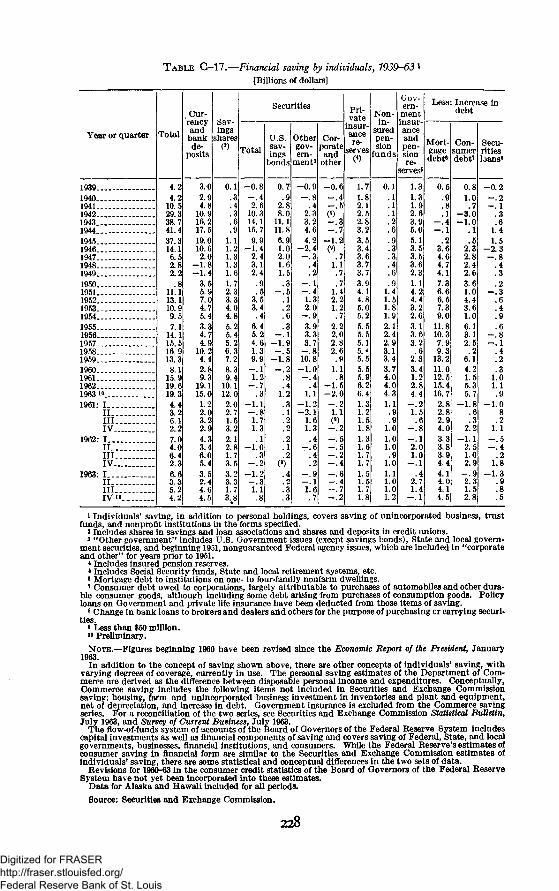
TABLE G-17.—Financial saving by individuals, 1939-63l
[Billions of dollars]
Year or quarter
1939 .
1940194119421943 . . —1944 _.19451946194719481949195019511952 - . _195319541955r95619571958195919601961 . . . .196219631°1961: I ._
IIIIIIV
1962: II I - . .IIIIV—.
1963: IIII I IIV io
Total
4.24.2
10.529.338.741.437.314.16.52 82.2
.811.113.110.99.57.1
14.115.516 913.3
8.115.919.619.34.43.26 12.27.04.06.42.36.63.35.24.2
Cur-rencyandbankde-
posits
3.02.94.8
10.916.217.519.010.62.0
— 1.8- 1 . 4
3.55.97.04.75.43.34.74.9
10.24.42.89.3
19.115.01.22.03 22.94.33.46.05.43.52.44.64.5
Sav-ings
shares
0.1. 3.4. 3.6.9
1.11.21.31 31.61.72.33.34.04.85.25.45.26.37.28.39.4
10.112.02.02.71 53.22.12.81.73.53.23.31.73.8
Securities
Total
- 0 . 8- . 42.6
10.314.115.79.9
- 1 . 42.43.12.4
.9
. 53.53.4
.46.45.24.61.39.9
- . 11.2
- . 7. 3
- 1 . 1- . 81 71.3
.1- 1 . 0
. 3- . 2
- 1 . 2- . 31.1.8
U.S.sav-ings
bonds
0.7.9
2.88.0
11.111.86.91.02.01.61.5. 3
- . 5. 1.2.6. 3
- . 1- 1 . 9- . 5
- 1 . 8- . 2
.8
.41.2. 3. 12
.2
.2
. 1
.2
.4
.2
. 3
. 3
Othergov-ern-
ment3
- 0 . 9- . 8
.42.33.24.64.2
- 2 . 4- . 3
.4
. 2- . 1- . 41.32.0
- . 93.93.33.7
- . 810.8
- 1 . 0- . 4
.41.1
- 1 . 2- 2 . 1
1 61.3
.4- . 6
.4
.2
- . 9- . 11.6.7
Cor-porateand
other
- 0 . 6- . 4- . 5
- . 3- . 7
- 1 . 2
.71 l.7.7
1.42.21.2.7
2.22.02.82.6
.91.1
.8- 1 . 5- 2 . 0- . 21.1
- . 2— 5- . 5- . 2- . 4- . 6- . 4- . 7- . 2
Pri-vate
insur-ancere-
serves(*)
1.71.82.12.52.83.23.53.43.63.73.73.94.14.85.05.25.55.55.15.65.55.55.96.26.4
1.3.2
.8
.3
.6
.7
.7
.5
.5
.7L.8
Non-in-
suredpen-sion
funds
0.1. 1. 1. 1. 2.6. 9. 3. 3.4.6.9
1.41.51.81.92.12.42.93.13.43.74.04.04.31.1
.9
.91.01.01.0
.91.01.11.01.01.2
Gov-ern-
mentinsur-anceandpen-sionre-
serves8
1.31.31.92.63.95.05.13.53.53.62.31.14.24.43.22.63.13.63.2
.62.33.41.22.84.4
- . 21.5
6- . 8—.12.01.0
- . 1.4
2.71.4
- . 1
Less
Mort-gagedebt«
0.5.9. 8. 1
- . 4- . 1
. 23.64.64.74.17.36.66.57.39.0
11.810.37.99.3
13.211.012.515.416.72.82.82 94.03.33.83.94.44.14.04.14.5
Increase Indebt
Con-sumerdebt*
0.81.0.7
—3.0- 1 . 0
. 1
. 52.32.82.42.63.61.04.43.61.06.13.12.5
. 26.14.21.55.35.7
- 1 . 8. 6. 3
2.2- 1 . 1
2.51.02.9
- . 92.31.52.8
Secu-ritiesloans8
-0.2- . 2- . 1
. 3
. 61.41.5
-2 .3- . 8
4. 3. 2
—.3.6.4. 9.6
- . 8- . 1
.4
. 2
. 31.01.1.9
-1.082
1.1—.5- . 4
.21.8
-1 .3. 9. 8. 5
1 Individuals' saving, in addition to personal holdings, covers saving of unincorporated business, trustfunds, and nonprofit institutions in the forms specified.
2 Includes shares in savings and loan associations and shares and deposits in credit unions.3 "Other government" includes U.S. Government issues (except savings bonds), State and local govern-
ment securities, and beginning 1951, nonguaranteed Federal agency issues, which are included in "corporateand other" for years prior to 1951.
* Includes insured pension reserves.«Includes Social Security funds, State and local retirement systems, etc.fl Mortgage debt to institutions on one- to four-family nonfarm dwellings.7 Consumer debt owed to corporations, largely attributable to purchases of automobiles and other dura-
ble consumer goods, although including some debt arising from purchases of consumption goods. Policyloans on Government and private life insurance have been deducted from those items of saving.
8 Change in bank loans to brokers and dealers and others for the purpose of purchasing cr carrying securi-ties.
» Less than $50 million.10 Preliminary.
NOTE.—Figures beginning 1960 have been revised since the Economic Report of the President, January1963.
In addition to the concept of saving shown above, there are other concepts of individuals' saving, withvarying degrees of coverage, currently in use. The personal saving estimates of the Department of Com-merce are derived as the difference between disposable personal income and expenditures. Conceptually,Commerce saving includes the following items not included in Securities and Exchange Commissionsaving: housing, farm and unincorporated business investment in inventories and plant and equipment,net of depreciation, and increase in debt. Government insurance is excluded from the Commerce savingseries. For a reconciliation of the two series, see Securities and Exchange Commission Statistical Bulletin,July 1963, and Survey of Current Business, July 1963.
The flow-of-funds system of accounts of the Board of Governors of the Federal Reserve System includescapital investments as well as financial components of saving and covers saving of Federal, State, and localgovernments, businesses, financial institutions, and consumers. While the Federal Reserve's estimates ofconsumer saving in financial form are similar to the Securities and Exchange Commission estimates ofindividuals' saving, there are some statistical and conceptual differences in the two sets of data.
Revisions for 1960-63 in the consumer credit statistics of the Board of Governors of the Federal ReserveSystem have not yet been incorporated into these estimates.
Data for Alaska and Hawaii included for all periods.
8ource: Securities and Exchange Commission.
228
Digitized for FRASER http://fraser.stlouisfed.org/ Federal Reserve Bank of St. Louis
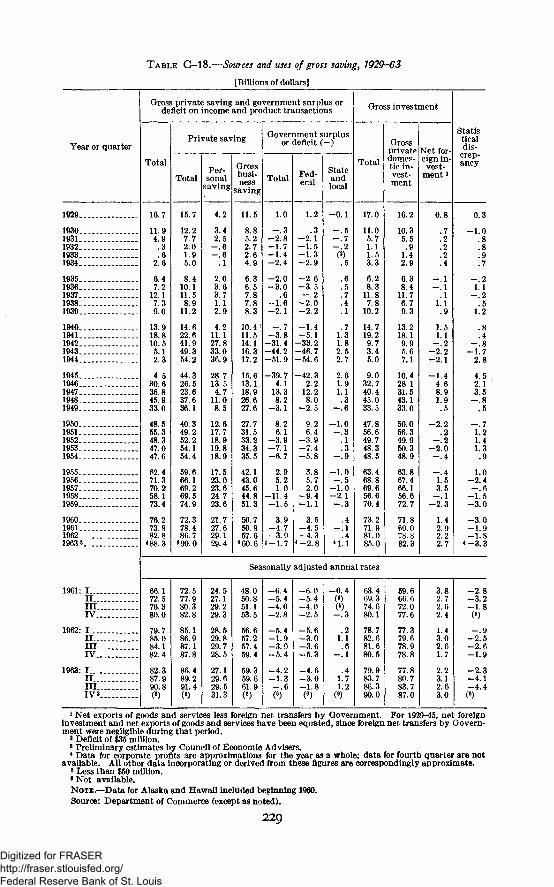
TABLE C-18.—Sources and uses of gross saving, 1929-63
[Billions of dollars]
Year or quarter
1929
1930-193119321933. .1934
1935 _19361937.19381939
19401941194219431944 __.
19451946194719481949
195019511952-19531954
195519561957 . _19581959.
1960196119621963 3
1961: I .IIIIIIV
1962: IIII l lIV
1963: IIII l lIVK .
Gross private saving and government surplus ordeficit on income and product transactions
Total
16.7
11.94.9
. 3
.62.6
6.47.2
12.17.39.0
13.918.810.55.12.3
4 530.636.845.933.0
48.555.348.347.047.6
62.471.370.258.173.4
76.273.882 8
4 88.3
Private saving
Total
15.7
12.27.72.01.95.0
8.410.111.58.9
11.2
14.622.641.949.354.2
44.326.523.637.636.1
40.349.252.254.154.4
59.666.169.269.574.9
72.378.486.7
4 90.0
Per-sonal
saving
4.2
3.42.5
- . 6- . 6
.1
2.03.63.71.12.9
4.211.127.833.036.9
28.713.54.7
11.08.5
12.617.718.919.818.9
17.523.023.624.723.6
21.727.629.129.4
Grossbusi-ness
saving
11.5
8.85.22.72.64.9
6.36.57.87.88.3
10.4 !11.514.116.317.2
15.613.118.926.627.6
27.731.533.234.335.5
42.143.045.644.851.3
50.750.857.6
4 60.6
Government surplusor deficit (-)
Total
1.0
- . 3- 2 . 8-1 .7-1 .4-2 .4
-2 .0-3 .0
.6-1 .6-2 .1
rj
-3 .8-31.4-44.2-51.9
-39.74.1
13.38.2
-3 .1
8.26.1
-3 .9- 7 . 1-6 .7
2.95.21.0
—11.4- 1 . 5
3.9-4 .7
3.94-1.7
Fed-eral
1.2
.3-2 .1-1 .5-1.3-2.9
-2.6-3.5- . 2
-2.0-2.2
-1.4-5.1
-33.2-46.7-54.6
-42.32.2
12.28.0
-2.5
9.26.4
-3.9-7.4-5.8
3.85.72.0
-9.4-1 .1
3.5-4.5-4.3
4-2.8
Stateandlocal
- 0 . 1
- . 5- . 7- . 2
.5
.6
.5
.7
.4
.1
.71.31.82.52.7
2.61.91.1.3
- . 6
-1 .0- . 3
.1
.3- . 9
-1 .0- . 5
-1 .0-2 .1- . 3
.4- . 1
.4
Gross investment
Total
17.0
11.05.71.11.53.3
6.28.3
11.87.8
10.2
14.719.29.73.45.0
9.032.740.445.033.5
47.856.649.748.348.5
63.468.869.656.670.4
73.271.981.085.0
Grossprivatedomes-tic in-vest-ment
16.2
10.35.5.9
1.42.9
6.38.4
11.76.79.3
13.218.19 95.67.1
10.428.131.543.133.0
50.056.349.950.348.9
63.867.466.156.672.7
71.869.078.882.3
Net for-eign in-vest-
ment l
0.8
.7
.2
.2
.2
.4
- . 1—.1
. 11.1.9
1.51.1
— 2-2 .2- 2 . 1
-1 .44.68.91.9.5
-2 .2.2
—.2-2 .0—.4
—.41.53.5
—.1- 2 . 3
1.42.92 22.7
Statisticaldis-
ancy
0.3
-1 .0.88
.9
.7
- . 21 l
- . 2.5
1.2
.8
.4— 8
- 1 . 72.8
4.52.13.6
- . 8.5
- . 71.21.41.3.9
1.0-2 .4—.6
—1.5-3 .0
-3 .0- 1 . 9—1.8
4-3.3
Seasonally adjusted annual rates
66.172.576.380.0
79.785.084.182.4
82.387.990.8
72.577.980.382.8
85.186.987.187.8
86.489.291.4
24.527.129.229.3
28.529.829.728.5
27.129.629.531.3
48.050.851.153.5
56.657.257.459.4
59.359.661.9
-6 .45.4
-4 .0-2 .8
-5 .4- 1 . 9-3 .0-5 .4
-4 .2- 1 . 3- . 6
-6.0-5.4-4.0-2.5
-5.6-3.0-3.6-5 .3
-4.6-3.0-1.8
- 0 . 4
(5)
.21.1.6
— 1
.41.71.2
(0)
63.469.374.680.1
78.782.681.680.5
79.983.786.390.0
59.666.672.077.6
77.379.678.978.8
77.880.783.787.0
3.82.72.62.4
1.43.02.61.7
2.23.12.63.0
-2.8-3.2-1.8
- . 9-2 .5-2.6-1.9
-2.3-4.1-4.4
1 Net exports of goods and services less foreign net transfers by Government. For 1929-45, net foreigninvestment and net exports of goods and services have been equated, since foreign net transfers by Govern-ment were negligible during that period.
* Deficit of $35 million.8 Preliminary estimates by Council of Economic Advisers.4 Data for corporate profits are approximations for the year as a whole; data for fourth quarter are not
available. All other data incorporating or derived from these figures are correspondingly approximate.* Less than $50 million.6 Not available.NOTE.—Data for Alaska and Hawaii included beginning 1960.Source: Department of Commerce (except as noted).
229
Digitized for FRASER http://fraser.stlouisfed.org/ Federal Reserve Bank of St. Louis
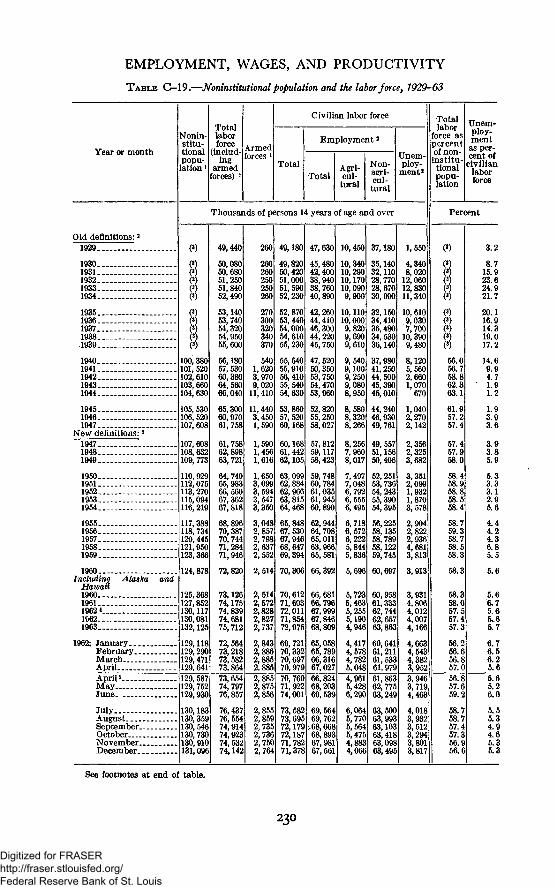
EMPLOYMENT, WAGES, AND PRODUCTIVITY
TABLE Q-\9—Noninstitutional population and the labor force, 1929-63
Year or month
Old definitions: 21929.
1930.1931.1932.1933.1934.
1935.1936.1937.1938.1939.
1940 _1941.1942.1943.1944.
194519461947
New definitions:1947.-19481949
1950 _1951.1952.1953.1954.
1955.1956.1957.1958.1959.
1960Including
Hawaii196019611962*....10621963
Alaska and
1962: January...February.MarchApril
Nonin-stitu-tionalpopu-lation 1
Totallaborforce
(includ-ing
armedforces) 1
Armedforces l
Civilian labor force
Total
Employment2
TotalAgri-cul-
tural
Non-agri-cul-tural
Unem-ploy-
ment2
Thousands of persons 14 years of age and over
J00,380101,520102,610103,660104,630
105, 530106, 520107,608
107, 608108,632109, 773
110,929112,075113, 270115,094116,219
117, 388118, 734120,445121, 950123,366
124,878
125, 368127,852130.117130,081132,125
129.118129,290129,471129.641
49,440
50,08050,68051,25051, 84052,490
53,14053, 74054,32054,95055,600
56,18057, 53060,38064,56066,040
65,30060,97061,758
61,75862, 89863,721
64, 74965,98366, 56067,36267, 818
70,38770,74471,28471,946
72, 820
73,12674,17574,83974,68175,712
72,56473,21873,58273,864
260
260260250250260
270300320340370
5401,6203,9709,02011,410
11,4403,4501,590
1,5901,4561,616
1,6503,0993,5943,5473,350
3,0482,8572,7982,6372,552
2,514
2,5142,5722,8282,8272,737
2,8432,8862,8852.885
49,180
49,82050,42051,00051, 59052,230
52, 87053,44054,00054,61055,230
55,64055, 91056,41055, 54054,630
53,86057, 52060,168
60,16861, 44262,105
63,09962, 88462,96663,81564,468
65,84867,53067, 94668,64769,394
70,306
70,61271,60372,01171,85472,975
69,72170,33270,69770.979
47,630
45,48042,40038,94038,76040,890
42,26044, 41046,30044,22045,750
47, 52050,35053,75054,470
52,82055,25058,027
57,81259,11758,423
59, 74860,78461,03561,94560,890
62,94464,70865,01163,96665, 581
66,392
66,68166,79667,99967,84668,809
65,05865,78966,31667,027
10,450
10,34010,29010,17010,0909,900
10,11010,0009,8209,6909,610
9,5409,1009,250
8,950
8,5808,3208,266
8,2567,r"8,017
7,4977,0486,7926,5556,495
6,7186,5726,2225,8445,836
5,696
5,7235,4635,2555,1904,946
4,4174,5784,7825,048
37,180
35,14032,11028,77028,67030,990
32,15034,41036,48034, 53036,140
37,98041.25044,50045,39045,010
44,24046,93049, 761
49, 55751,15650,406
52.25153,73654,24355,39054,395
56,22558,13558,78958,12259,745
60, 95861,33362, 74462,65763,863
60,64161,21161, 53361,979
1,550
4,3408,02012,06012,83011,340
10,6109,0307,70010,3909,480
8,1205,5602, f'"1,070670
1,0402,2702,142
2,3562,325
3,3512,0991,9321,8703,578
2,9042,8222,9364,6813,813
3,913
3,9314,4,0124,0074,166
4,6634,5434,3823,952
Totallabor
force aspercentof non-institu-tionalpopu-lation
Unem-ploy-mentas per-cent of
civilianlaborforce
Percent
56.056.758.862.363.1
61.957.257.4
57.457.958.0
58.458.958.858.558.4
58.759.358.758.558.3
58.3
58.358.057.557.457.3
56.256.656.857.0
3.2
8.715.923.624.921.7
20.116.914.319.017.2
14.69.94.71.91.2
1.93.93.6
3.85.9
5.33.33.12.95.6
4.44.24.36.85.5
5.6
5.66.75.65.65.7
6.76.56.25.65.65.26.0
ApriP.M a y -June. .
JulyAugustSeptember-OctoberNovember..December..
129,587129,752129,930
130,183130,359130,546130, 730130,910131,096
73,65474,79776,857
76,43776,55474,91474,92374,53274,142
2,8852,8752,856
2,8552,8592,7352,7362,7502,764
70,76971,92274,001
73, 58273,69572,17972,18771,78271,378
66,82468,20369,539
69,56469,762.68,668
67, 98167,561
4,9615,4286,290
6,0645,7705,5645,4754,8834,066
61,86362, 77563,249
63,500
63,10363,41863,09863,495
3,9463,7194,463
4,0183,9323,5123,2943,8013,817
56.857.659.2
58.58.757.457.356.956.6
5.55.34.94.65.35.3
See footnotes at end of table.
23O
Digitized for FRASER http://fraser.stlouisfed.org/ Federal Reserve Bank of St. Louis
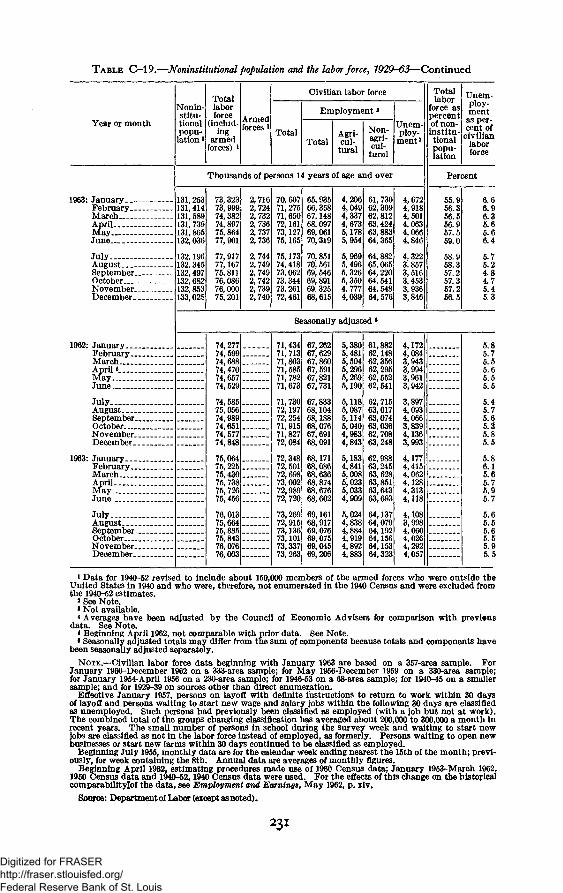
TABLE C-19.—Noninstitutional population and the labor force, 1929-63—Continued
Year or month
Nonin-stitu-tionalpopu-lation i
Totallaborforce
(includ-ing
armedforces) *
Armedforces i
Civilian labor force
Total
Employment i
TotalAgri-cul-
tural
Non-agri-cul-
tural
Unem-ploy-
ment2
Totallabor
force aspercentof non-institu-tional
lation
Unem-ploy-ment
as per-cent of
civilianlaborforce
1962: January...February.MarchApril «.„_MayJune
1963: January..February.MarchApril.M a y -
JulyAugustSeptember..OctoberNovember..December..
Thousands of persons 14 years of age and over Percent
1963: January. _.February..MarchAprilMayJune
JulyAugustSeptember.October....November.December.
131,253131,414131,589131, 739131, 865132,036
132,196132,345132,497132,682132,853133,025
73,32373, 99974,38274,89775, 86477,901
77, 91777,16775,81176,08676,00075,201
2,7162,7242,7322,7362,7372,736
2,7442,7492,7492,7422,7392,740
70,60771,27571,65072,16173,12775,165
75,17374,41873,06273,34473,26172,461
65,93566,35867,14868,09769,06170,319
70,85170, 56169, 54669, 89169,32568,615
4,2064,0494,3374,6735,1785,954
5,9695,4965,3265,3504.7774,039
61,73062,30962,81263,42463,88364,365
64,88265,06564,22064,54164, 54864,576
4,6724,9184,5014,0634,0664,846
4,3223,8573,5163,4533,9363,846
55.956.356.556.957.559.0
58.958.357.257.357.256.5
6.96.35.65.66.4
5.75.24.84.75.45.3
Seasonally adjusted6
JulyAugustSeptember..OctoberNovemberDecember
74,27774,59974,68874,47074,65774, 529
74,58575,05674,98974,65174,57774,848
75,06475,22575,43075,73875,72675,456
76,01375,66475,88575,84376,07676,003
71,43471,71371,80371,58571,78271,673
71,73072,19772,25471,91571,82772,084
72,34872,50172,69873,00272,98972,720
73,26972,91573,13673,10173,33773,263
67,26267,62967,86067,59167,82167,731
67,83368,10468,18868,07667,69168,091
68,171
68,87468,67668,602
69,16168,91769,07669,07569,04569,206
5,3805,4815,5045,2965,2695,190
5,1185,0875,1145,0404,r~4,8435,1834,8415,0085,0235,0334,909
5,0244,8384,8844,9194,8924,883
61,88262,14862,35662,29562,55262,541
62,71563,01763,074
62,70863,248
63,24563,62863,85163,64363,693
64,13764,07964,19264,15664,15364,323
4,1724,084
3,9943,9613,942
3,8974,0934,0663,8394,1363,993
4,1774,4154,0624,1284,3134,118
4,108
4,0604,0264,2924,057
5.85.75.55.65.55.5
5.45.75.65.55.85.5
5.86.15.65.75.95.7
5.65.55.65.55.95.5
1 Data for 1940-52 revised to include about 150,000 members of the armed forces who were outside theUnited States in 1940 and who were, therefore, not enumerated in the 1940 Census and were excluded fromthe 1940-52 estimates.
a See Note.»Not available.* Averages have been adjusted by the Council of Economic Advisers for comparison with previous
data. See Note.* Beginning April 1962, not comparable with prior data. See Note.»Seasonally adjusted totals may differ from the sum of components because totals and components have
been seasonally adjusted separately.
NOTE.—Civilian labor force data beginning with January 1963 are based on a 357-area sample. ForJanuary 1960-December 1962 on a 333-area sample; for May 1956-December 1959 on a 330-area sample;for January 1954-April 1956 on a 230-area sample; for 1946-53 on a 68-area sample; for 1940-45 on a smallersample; and for 1929-39 on sources other than direct enumeration.
Effective January 1957, persons on layoff with definite instructions to return to work within 30 daysof layoff and persons waiting to start new wage and salary jobs within the following 30 days are classifiedas unemployed. Such persons had previously been classified as employed (with a job but not at work).The combined total of the groups changing classification has averaged about 200,000 to 300,000 a month inrecent years. The small number of persons in school during the survey week and waiting to start newjobs are classified as not in the labor force instead of employed, as formerly. Persons waiting to open newbusinesses or start new farms within 30 days continued to be classified as employed.
Beginning July 1955, monthly data are for the calendar week ending nearest the 15th of the month; previ-ously, for week containing the 8th. Annual data are averages of monthly figures.
Beginning April 1962, estimating procedures made use of 1960 Census data; January 1953-March 1962,1950 Census data and 1940-52,1940 Census data were used. For the effects of this change on the historicalcomparabilitylof the data, see Employment and Earnings, May 1962, p. xiv.
Source: Department of Labor (except as noted).
231
Digitized for FRASER http://fraser.stlouisfed.org/ Federal Reserve Bank of St. Louis
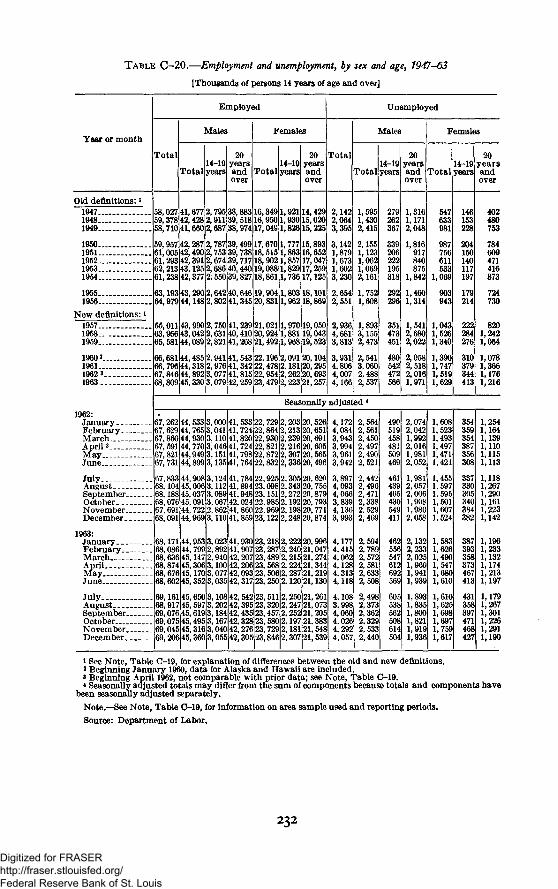
TABLE C-20.—Employment and unemployment, by sex and age, 1947-63
[Thousands of persons 14 years of age and over]
Year or month
Total
Employed
14-19Total years
Males
20yearsandover
14-19Total years
Females
20yearsandover
Total
Unemployed
14-19Total years
Males
20yearsandover
Total years
Females
2014-19 years
and
Old definitions: *194719481949
19501951195219531954
1955.1956
New definitions:1957—1958 _1959
1960219611962 31963
58,027 41,677 2,795 38,883 16,349 1,92114,42959,378 42,428 2,911 39, 518 16,950 1,930 15,02058,710 41,660 2,687 38,97417,049 1,826 15,225
59,957 42,287 2,787 39,499 17,61,005 42,490 2,753 39, 738 18,61,293 42,391 2,674 39,717 18,9021,857 17,
670 1,777 15,8935151,86316, " ",652
,04762; 213 43; 125 2,686 40; 440 19,088 1,829 17,25961,238 42,377 2,550 39,827 18,8611,73617,125
63,19343,290 2,64264,979 44,148 2,802 41,345
40,64619,9041,80318,10120,8311,96218,869
65,01143,990 2,750 41,239 21,0211,970 19,966 43,042 2,631 40,410 20,924 1,58144,089 2,82141,268 21,492 1,968 Vd,
1,0501,0431,523
66,681 44,485 2, 941 41,543 22,196 2,091 20,10466, 796 44,318 2,976 41,342 22,478 2,181 20,29567,846 44, 892 3, 07768,809 45,330 3,079 42; 259 23,479 2,223 21,257
41,815 22,954 2,262 20,693
2,1422,0643,395
3,1421,8791,6731,6023,230
2,6542,551
2,9364,6813,813
3,9314,8064,0074,166
1,5951,4302,415
2,1551,1231,0621,0692,161
1,7521,608
1,83,1552,473
2,5413,0602,4882,537
279262367
339206222195318
292296
351473451
480542472566
1,3161,1712,048
1,816917840875
1,842
1,4601,314
1,5412,6802,022
2,0582,5182,0161,971
547633981
987756611533
1,069
903943
1,0431,5261,340
1,3901,7471,5191,
146153228
204150140117197
179214
222284276
310379344413
402480753
784609471416873
724730
8201,2421,064
1,0781,3661,1761,216
Seasonally adjusted *1962:
January...February..MarchAprilsMayJune
67,262 44,533 3,000 41,533 22,729 2,203 20, 52667,629 44, 765 3,041 41,724 22,864 2,213 20,65167,860 44,930 3,110 41,820 22,930 2,239 20,69167, 591 44,770 3,046 41,724 22,821 2,216 20,60567,821 44,949 3,151 41,798 22,872 2,307 20,56567, 731 44,899 3,135f41, 764 22,832 2,336 20, 496
JulyAugustSeptember..OctoberNovember..December..
1963:JanuaryFebruary. _.MarchAprilMayJune
67,833 44,908 3,124 41,784 22,925 2,68,104 45,006 3,112 41,894 23,098 2,343 20,',
2,305 20,620"1,755
68; 188 45; 037 3,089 4i; 948 23,151 % 272 20,87968,076 45,091 3,067 42,024 22,985 2,192 20,79367,691 44,722 2,862 41, 860 22,969 2,198 20,77168,091 44,969 3,110 41,859 23,122 2,248 20,874
JulyAugustSeptember-OctoberNovember.December..
1,045 45,316 3,1,20645,360 3,
953 3,023 41,930 23, 218 2,222 20,996799 2,892 41,907 23,287 2,240 21,047
21,274,344
68; 676 45; 170 3,077 42; 093 23, 506 2, 287 21,21968,602 45,352 3,035 42,317 23,250 2,120 21,130
69,161 45,650 3,108 42, 542 23, ,68,917 45, 597 3,202 42,395 23,320 2,247 2169,076 45,619 3,184 42,435 23,457 2,252 216 9 7 5 45495 3167 42328 23 580 2197 21
511 2,250 21, 261,073,205
69; 075 45,495 3,167 42,328 23, 580 2,197 21,383729 2,18121,54823,8462,307 21,539
,040 42,276 23,',055 42,305 5
4,1724,0843,9433,9943,9613,942
3,8974,0934,0663,8394,136
4,1774,4154,0624,1284,3134,118
4,1083,9984,0604,0264,2924,057
2,5642,5612,4502,4972,4902,521
2,4422,4962,4712,3382,5292,469
2,5942,7892,5722,5812,6332,508
2,4982,3732,3622,3292,5332,440
490519458481509469
465430549411
462556547612692569
605538562508614504
2,0742,0421,9922,0161,9812,052
1,9812,0572,0061,9081,9802,058
2,1322,2332,0251,1,9411S
1,?1,8351,8001,8211,9191,
1,6081,5231,4931,4971,4711,421
1,4551,5971,5951,5011,6071,524
1,5831,61,4901,5471,6801,610
1,6101,625I,1""1,1,7591,617
354359354387356
330305340384382
387393358373467413
431358397471468427
,254,164,139,110,115,113
,118,267,290,161,223,142
,196,233132174213197
179267,301,226,2911,190
1 See Note, Table C-19, for explanation of differences between the old and new definitions.2 Beginning January 1960, data for Alaska and Hawaii are included.3 Beginning April 1962, not comparable with prior data; see Note, Table C-19.* Seasonally adjusted totals may differ from the sum of components because totals and components have
been seasonally adjusted separately.
Note.—See Note, Table C-19, for information on area sample used and reporting periods.
Source: Department of Labor.
232
Digitized for FRASER http://fraser.stlouisfed.org/ Federal Reserve Bank of St. Louis
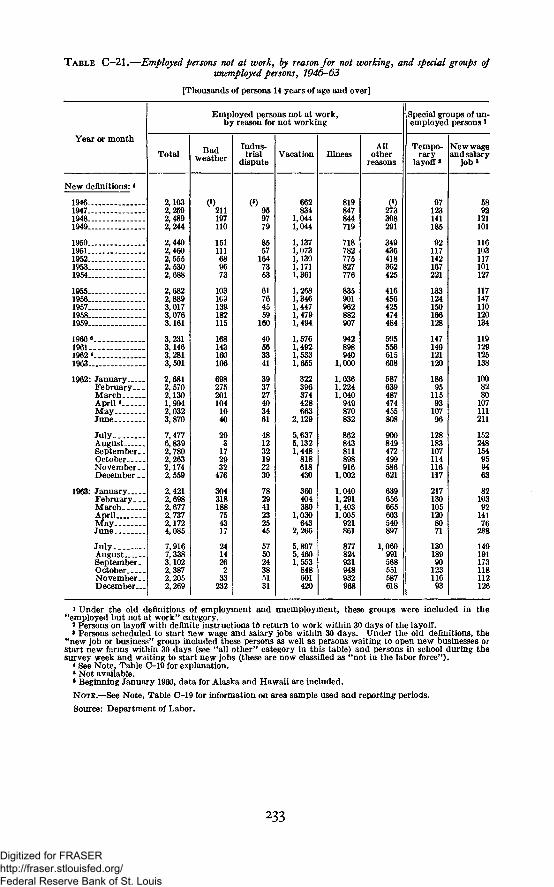
T A B L E C—21.—Employed persons not at work, by reason for not working, and special groups ofunemployed persons, 1946—63
[Thousands of persons 14 years of age and over]
Year or month
Employed persons not at work,by reason for not working
Total Badweather
Indus-trial
disputeVacation Illness
Allother
reasons
Special groups of un-employed persons l
Tempo-rary
layoff 8
New wageand salary
job»
New definitions: *
1946 _1947.19481949....
1950..19511952.. .._1953..1954-...
1955.1956..195719581959.
I960'19611962* _1963
1962: JanuaryFebruary. _MarchApril*MayJune
July__AugustSeptember-OctoberNovember.December _
1963: January.. . .February. _MarchAprilMayJune
JulyAugustSeptember-OctoberNovember.December..
2,1032,2592,4892,244
2,4402,4602,5552.5302,688
2,6822,8893,0173,0763,161
3,2313,1463,2813,501
2,6812,5702,1301,9942,0323,870
7,4776,8392,7802,2632,1742,559
2,421
2,6772,7372,1724,085
7,9167,3383,1022,3872,2052,269
(*)211197110
151111689673
103103139182115
168143160106
2752011041040
293172932476
304318188754317
241426233232
959779
8557
1647353
61764559
160
40563341
393727403461
662834
1,0441,044
1,1371,0731,1301,1711,361
1,2681,3461,4471,4791,494
1,5761,4921,5331,655
322396374428663
2,129
5,6375,1321,448818618430
360404380
1,030643
2,266
5,8975,4601,553848601420
819847844719
718782775827776
835901962882907
942898940
1,000
1,0361,2241,040949870832
862843811898916
1,002
1,0401,2911,4031,005921861
877824931948932
()273308291
349436418362425
416456425474484
505556615
587639487474455
900849472499586621
639656665603540897
1,060991568551587618
97123141185
92117142167221
133124150166128
147149121120
186951159310796
128183107114116117
2171301051208071
13018990123116
5892121101
116103117101127
117147110120134
119129125138
1008280107111211
152248154959463
821039214176
149191173118112126
* Under the old definitions of employment and unemployment, these groups were included in the"employed but not at work" category.
8 Persons on layoff with definite instructions to return to work within 30 days of the layoff.« Persons scheduled to start new wage and salary jobs within 30 days. Under the old definitions, the
"new job or business" group included these persons as well as persons waiting to open new businesses orstart new farms within 30 days (see "all other" category in this table) and persons in school during thesurvey week and waiting to start new jobs (these are now classified as "not in the labor force").
* See Note, Table C-19 for explanation.8 Not available.* Beginning January 1960, data for Alaska and Hawaii are included.
NOTE.—See Note, Table 0-19 for information on area sample used and reporting periods.
Source: Department of Labor.
233
Digitized for FRASER http://fraser.stlouisfed.org/ Federal Reserve Bank of St. Louis
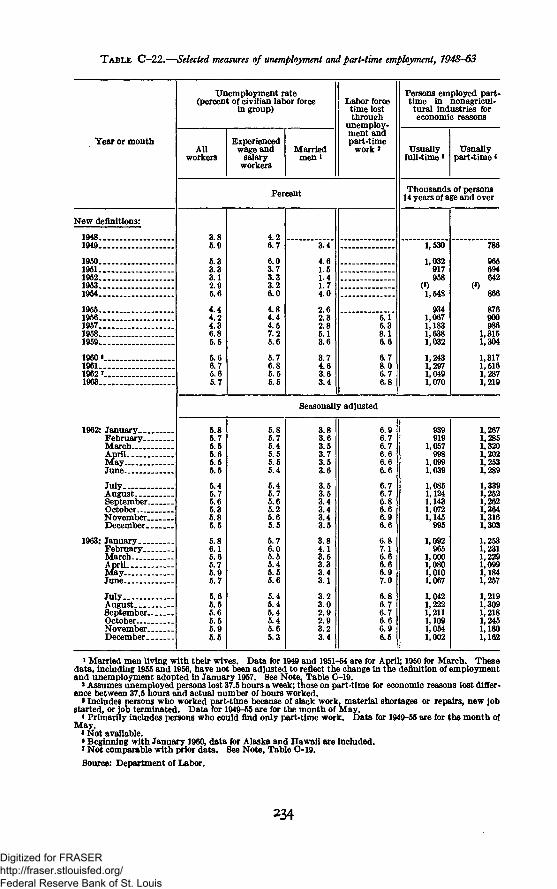
TABLE C—22.—Selected measures of unemployment and part-time employment, 1948-63
Year or month
New definitions:
1948...1949
195019511952._.19531954. .
1955 .195619571958.. .1959
I960"19611962 7 .1963
1962: January. .February.MarchAprilMayJnnp.
JulyAugustSeptemberOctoberNovemberDecember
1963: JanuaryFebruaryMarchAprilMay. .
JulyAugustSeptember.... __OctoberNovemberDecember
Unemployment rate(percent of civilian labor force
in group)
Allworkers
Experiencedwage and
salaryworkers
Marriedmen i
Labor forcetime lostthrough
unemploy-ment andpart-time
work '
Percent
3.85.9
5.33.33.12.95.6
4.44.24.36.85.5
5.66.75.65.7
4.26.7
6.03.73.33.26.0
4.84.44.57.25.6
5.76.85.55.5
3.4
4.61.51.41.74.0
2.62.32.85.13.6
3.74.63.63.4
5.15.38.16.6
6.78.06.76.8
Persons employed part-time in nonagricul-tural industries foreconomic reasons
Usuallyfull-time»
Usuallypart-time *
Thousands of persons14 years of age and over
1,530
1,032917958
1,548
9341,0671,1831,6381,032
1,2431,2971,0491,070
786
965694642
866
876900086
],315,304
,317L,516,?87
Seasonally adjusted
5.85.75.55.65.55.5
5.45.75.65 36.85.5
5.86.15.65.75.95.7
5.65.55.65.55.95.5
5.85.75.45.55.55.4
5.45.75.65.25.65.5
5.76.05.55.45.55.6
5.45.45.45.45.65.3
3.83.63.53.73.53.6
3.53.53.43.43.43.5
3.84.13.53.33.43.1
3.23.02.92.93.23.4
6.96.76.76.66.66.6
6.76.76.86.66.96.6
6.87.16.66.66.97.0
6.86.76.76.66.96.5
939919
1,057998
1,0991,039
1,0851,1241,1431,0721,145
995
1,092965
1,0001,0801,0101,067
1,0421,2221,2111,1091,0541,002
1,2671,2851,3201,2021,2531,289
1,3391,2521,2621,3641,3161,303
).2/a]
]
]
]
L 231t',2291,099,184
L,257
,309
l' 2451,1801,162
1 Married men living with their wives. Data for 1949 and 1951-54 are for April; 1950 for March. Thesedata, including 1955 and 1956, have not been adjusted to reflect the change in the definition of employmentand unemployment adopted in January 1957. See Note, Table C-19.2 Assumes unemployed persons lost 37.5 hours a week; those on part-time for economic reasons lost differ-ence between 37.5 hours and actual number of hours worked.
• Includes persons who worked part-time because of slack work, material shortages or repairs, new jobstarted, or job terminated. Data for 1949-55 are for the month of May.4 Primarily includes persons who could find only part-time work. Data for 1949-55 are for the month ofMay.
«Not available.• Beginning with January I960, data for Alaska and Hawaii are included.' Not comparable with prior data. See Note, Table C-19.Source: Department of Labor.
234
Digitized for FRASER http://fraser.stlouisfed.org/ Federal Reserve Bank of St. Louis
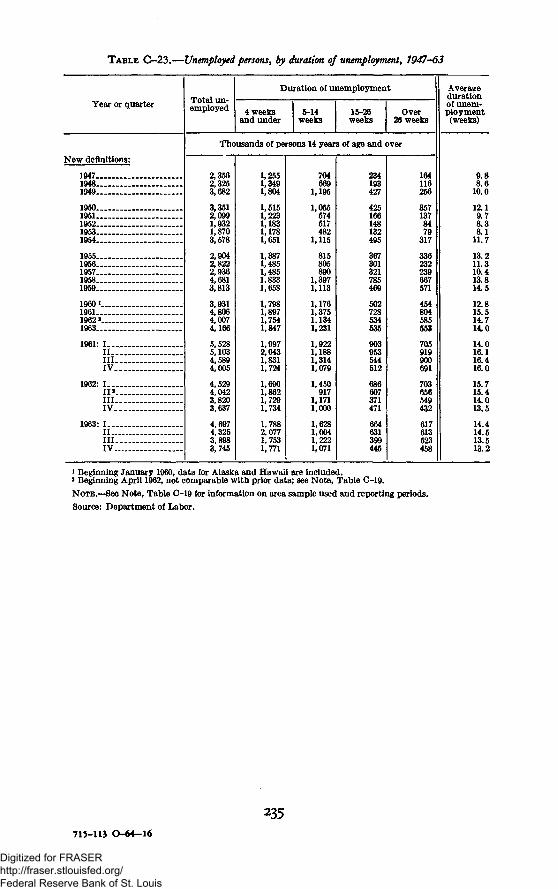
TABLE C-23.—Unemployed persons, by duration of unemployment, 1947-63
Year or quarter
New definitions:
194719481949
19501951195219531954
19551956195719581959 _
19601196119622 - -1963
1961: IIIIIIIV
1962: III*I l lIV
1963: III _IIIIV
Total un-employed
Duration of unemployment
4 weeksand under
5-14weeks
15-26weeks
Over26 weeks
Thousands of persons 14 years of age and over
2,3562,3253,682
3,3512,0991,9321,8703,578
2,9042,8222,9364,6813,813
3,9314,8064,0074,166
5,5285,1034,5894,005
4,5294,0423,8203,637
4,6974,3253,8983,745
1,2551,3491,804
1,5151,2231,1831,1781,651
1,3871,4851,4851,8331,658
1,7981,8971,7541,847
1,9972,0431,8311,724
1,6901,8621,7291,734
1,7882,0771,7531,771
704669
1,195
1,055574517482
1,115
815805890
1,3971,113
1,1761,3751.1341,231
1,9221,1881,3141,079
1,450917
1,1711,000
1,6281,0041,2221,071
234193427
425166148132495
367301321785469
502728534535
903953544512
686607371471
664631399445
164116256
3571378479
317
336232239667571
454804585553
705919900691
703656549432
617613523458
Averagedurationof unem-ployment(weeks)
9.S8.6
10.0
12.19.78.38.1
11.7
13.211.310.413.814.5
12.815.514.714.0
14.016.116.416.0
15.715.414.013.5
14.414.513.513.2
* Beginning January 1960, data for Alaska and Hawaii are included.
* Beginning April 1962, not comparable with prior data; see Note, Table C-19.
NOTE.—See Note, Table 0-19 for information on area sample used and reporting periods.
Source: Department of Labor.
235715-113 O-64-16
Digitized for FRASER http://fraser.stlouisfed.org/ Federal Reserve Bank of St. Louis
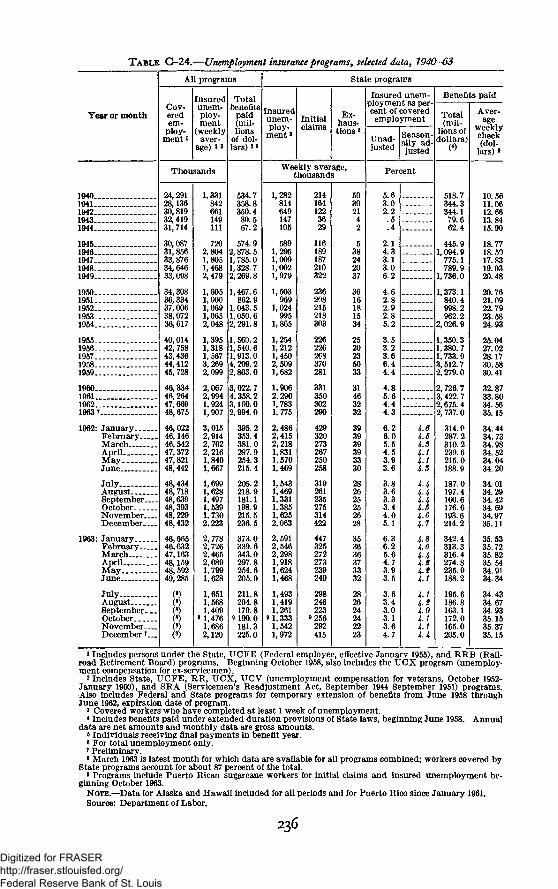
TABLE G-24.—Unemployment insurance programs^ selected data, 1940-63
Year or month
All programs
Cov-eredem-
ploy-ment1
Insuredunem-ploy-ment
(weeklyaver-
age) 2 3
Totalbenefits
paid(mil-lions
of dol-lars)»«
Insuredunem-ploy-
ment 3
State programs
Initialclaims
Ex-haus-tions «
Insured unem-ployment as per-cent of covered
employment
Unad-justed
Season-ally ad-justed
Total(mil-
lions ofdollars)
(4)
Benefits paid
Aver-age
weeklycheck(dol-
lars) •
Thousands Weekly average,thousands Percent
19401941_____1942 ___1943___ _1944
19-151946194719481949
1950195119521953__1954.._
19551956195719581959
1960196119621963 7
1962: J a n u a r yFebruaryMarchAprilMayJune
JulyAugustSeptemberOctoberNovemberDecember
1963: JanuaryFebruaryMarchAprilMayJune
JulyAugustSeptemberOctoberNovemberDecember *
24,29128,13630,81932, 41931,714
30,08731,85633,87634, 64633,098
34,30836,33437,00638,07236,617
40,01442,75843,43644,41245,728
46,33446,26447,66948,675
46,02246,14646,54247,37247,82148,442
48,43448,71848,63948,39348,22948,432
46,66546,63247,16348,15948, 59249,285
()
88
1.331842661149111
7202.8041,8051,4682,479
1,6051,0001,0691,0652,048
1,3951,3181,5673,2692,099
2,0672,9941,9241,907
3,0152,9142,7022,2161,8401,667
1,6991,6281,4971,5391,7302,223
2,7782,7262,4652,0891,7991,628
1,6511,5681,409
"1,4761,6862,120
534.7358.8350.480.567.2
574.92,878.51, 785.01,328. 72,269.8
1,467. 6862.9
1,043. 51,050.62, 291.8
1, 560.21, 540. 61,913.04, 209.22,803.0
3,022.74,358.23,160.02,994.0
395.2353.4381.0297.9254.3215.4
205.2218.9181.1198.9215.5236.5
373.0339.6343.0297.8254.6205.0
211.8204.8179.8
9 190.0181.3225.0
1,282814649147105
5891,2951,0091,0021,979
1,503969
1,024995
1,865
1,2541,2121,4502,5091,682
1,9062,2901,7831,775
2,4862,4152,2181,8311,5701,469
1,5431,4691,3311,3851,6252,063
2,5912,5462,2981,9181,6241,468
1,4931,4191,261
9 1,3331,5421,972
2141641223629
116189187210322
236208215218303
22622626S370281
331350302290
429320273267250258
319261235275314422
447325272273239240
298246223
9 256292415
5.63.02.2.5.4
2.14.33.13.06.2
4.62.82.92.85.2
3.53.23.66.44.4
4.85.64.44.3
6.26.05.54.53.93.6
3.83.63.33.44.05.1
6.36.25.64.73.93.5
3.63.43.03.13.64.7
1615IS4.14.14-3
i4.5
t?it4-44.24.24.1
V.4.04.14.14.4
518.7344.3344.179.662.4
445.91,094.9
775.1789.9
1,736.0
1,373.1840.4998.2962.2
2,026.9
1.350.31,380. 71,733.93, 512.72,279.0
2,726.73, 422. 72.675.42, 737.0
314.9287.2310.2239.6215.0188.9
187.0197.4160.6176.6193.6214.2
342.4313.3316.4274.8235.9188.2
195.6186.8163.1172.0165.0205.0
10.5611.0612.6613.8415.90
18.7718.5017.8319.0320.48
20.7621.0922.7923.5824.93
25.0427.0228.1730.5830.41
32.8733.8034.5635.15
34.4434.7334.9834.5234.0434.20
34.0134.2934.4234.6934.9735.11
35.5335.7235.8235.5434.9134.34
34.4334.6734.9335.1535.3735.15
1 Includes persons under the State, UCFE (Federal employee, effective January 1955), and RRB (Rail-road Retirement Board) programs. Beginning October 1958, also includes the UCX program (unemploy-ment compensation for ex-servicemen).
2 Includes State, UCFE, RR, UCX, UCV (unemployment compensation for veterans, October 1952-January 1960), and SRA (Servicemen's Readjustment Act, September 1944-September 1951) programs.Also includes Federal and State programs for temporary extension of benefits from June 1958 throughJune 1962, expiration date of program.
3 Covered workers who have completed at least 1 week of unemployment.4 Includes benefits paid under extended duration provisions of State laws, beginning June 1958. Annual
data are net amounts and monthly data are gross amounts.6 Individuals receiving final payments in benefit year.6 For total unemployment only.7 Preliminary.s March 1963 is latest month for which data are available for all programs combined; workers covered by
State programs account for about 87 percent of the total.9 Programs include Puerto Rican sugarcane workers for initial claims and insured unemployment be-
ginning October 1963.NOTE.—Data for Alaska and Hawaii included for all periods and for Puerto Rico since January 1961.Source: Department of Labor.
236
Digitized for FRASER http://fraser.stlouisfed.org/ Federal Reserve Bank of St. Louis
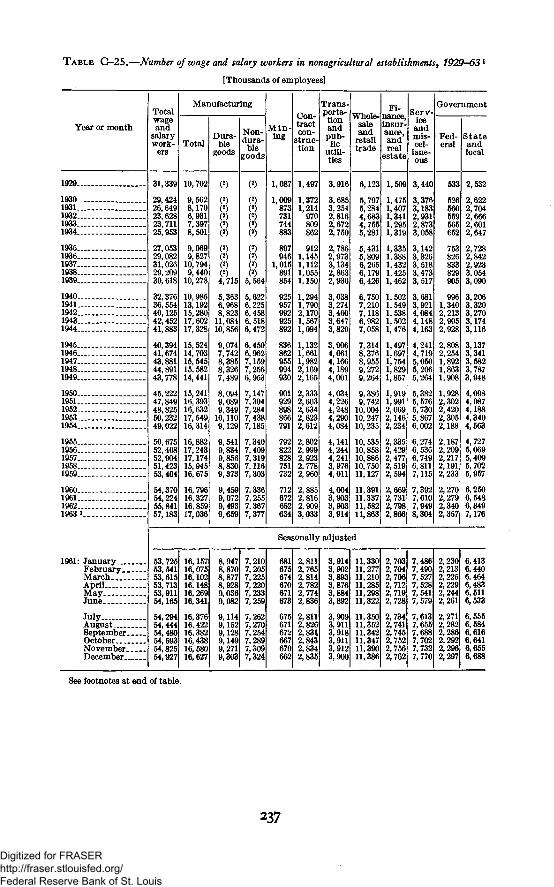
TABLE G-25.—Number of wage and salary workers in nonagricultural establishments, 1929-63X
[Thousands of employees]
Year or month
Totalwageand
salary-work-
ers
Manufacturing
TotalDura-
blegoods
Non-dura-ble
goods
Min-ing
Con-tractcon-
struc-tion
Trans-porta-tionandpub-he
utili-ties
Fi-Whole- nance,
insur-ance,andreal
estate
andretailtrade
Serv-iceandmis-cel-
lane-ous
Government
Fed-eral
Stateandlocal
1929..
1930..1931..1932..1933..1934..
1935..1936..1937..1938..1939..
1940..1941..1942..1943..1944..
1945..1946..1947..1948..1949..
1950..1951..1952..1953..1954._
1955..1956..1957..1958..1959..
I960..1961..1962..1963 3.
1961: JanuaryFebruaryMarchAprilMay._.June _._
JulyAugustSeptemberOctoberNovemberDecember
31,339
29,42426,64923,62823,71125,953
27,05329,08231,02629,20930, 618
32,37636,55440,12542,45241,883
40,39441.67443,88144,89143,778
45,22247,84948,82550,23249,022
50.67552,40852,90451,42353,404
54,37054,22455,84157,183
10.702
9,5628,1706,9317,3978,501
9,0699,82710,7949,44010,278
10,98513,19215,28017,60217,328
15,52414.70315,54515,58214,441
15,24116,39316,63217,54916,314
16,88217,24317,17415,94516, 675
16,79616,32716,85917,036
()4,715
5,3636,9688,82311,08410,856
9,0747,7428,3858,3267,489
8,0949,0899,34910,1109,129
9,5419,8349,856
9,373
9,4599,0729,4939,659
()5,554
5,6226,2256,4586,5186,472
6,4506,9627,1597,2566,953
7,1477,3047,2847,4387,185
7,3407,4097,3197,1167,303
7,3367,2557,3677,377
1,087
1,009873731744
9461,015891"854
925957992925
836862955994930
901929898866791
792822828751732
712672652634
1,497
1,3721,214
970809862
9121,1451,1121,0551,150
1,2941,7902,1701,5671,094
1,1321,6611,9822,1692,165
2,3332,6032,6342,6232,612
2,8022,9992,9232,7782,960
2,8852,8162,9093,033
3,916
3,6853,2542,8162,6722,750
2,7862,9733,1342,8632,936
3,0383,2743,4603,6473,829
3,9064,0614,1664,1894,001
4,0344,2264,2484,2904,084
4,1414,2444,2413,9764,011
4,0043,9033,9033,914
6,123
5,7975,2844,r~~4,7555,281
5,4315,8096,2656,1796,426
6,7507,2107,1186,9827,058
7,3148,3768,9559,2729,264
9,3869,74210,00410,24710,235
10,53510,85810,88610,75011,127
11,39111,33711, 58211,863
1,509
1,4751,4071,3411,2951,319
1,3351,1,4321,4251,462
,502,549,538,502,476
,497,697,754,829,857
1,9191,9912,0692,1462,234
2,3352,4292,4772,5192,594
2,7312,7982,866
3,440
3,3763,1832,9312,8733,058
3,1423,3263,5183,4733,517
3,6813,9214,0844,1484,163
4,2414,7195,0505,2065,264
5,3825,5765,7305,8676,002
6,2746,5366,7496,8117,115
7,3927,6107,9498,304
533
560559565652
753
829905
1,3402,2132,9052,928
2,8082,2541,8921,8631,908
1,9282,3022,4202,3052,188
2,1872,2092,2172,1912,233
2,2702,2792,3402,357
2,532
2,6222,7042,6662,6012,647
2,7282,8422,9233,0543,090
3,2063,3203,2703,1743,116
3,1373,3413,5823,7873,948
4,0984,0874,1884,3404,563
4,7275,0695,4095,7025,957
6,2506,5486,8497,176
Seasonally adjusted
53,72553,54153, 61553, 71353,91154,165
54,294
54^48054,59354,82554,927
16,15716,07516,10216,14816,26916,341
16,37616,42216,38216,43816,58016,627
8,9478,8708,8778,9289,0369,082
9,1149,1529,1289,1499,2719,303
7,2107,2057,2257,2207,2337,259
7,2627,2707,2547,2897,3097,324
681675674670671673
675671672667670662
2,8112,7652,8142,7822,7742,836
2,8112,8262,8312,8432,8342,835
3,9143,9023,8933,8763,8843,892
3,9093,9113,9183,9113,9123,900
11,33011,27711,21011, 28511,29811,322
11,35011,35211,34211,34711,39011,386
2,7032,7042,7062,7122,7192,728
2,7342,7412,7452,7522,7562,762
7,4867,4907,5277,5287,5417,579
7,6137,6557,6887,7027,7327,770
2,2302,2132,2252,2292,2442,261
2,2712,2822,2862,2922,2962,297
6,4136,4406,4646,4836,5116,533
6,5556,5846,6166,6416,655
See footnotes at end of table.
237
Digitized for FRASER http://fraser.stlouisfed.org/ Federal Reserve Bank of St. Louis
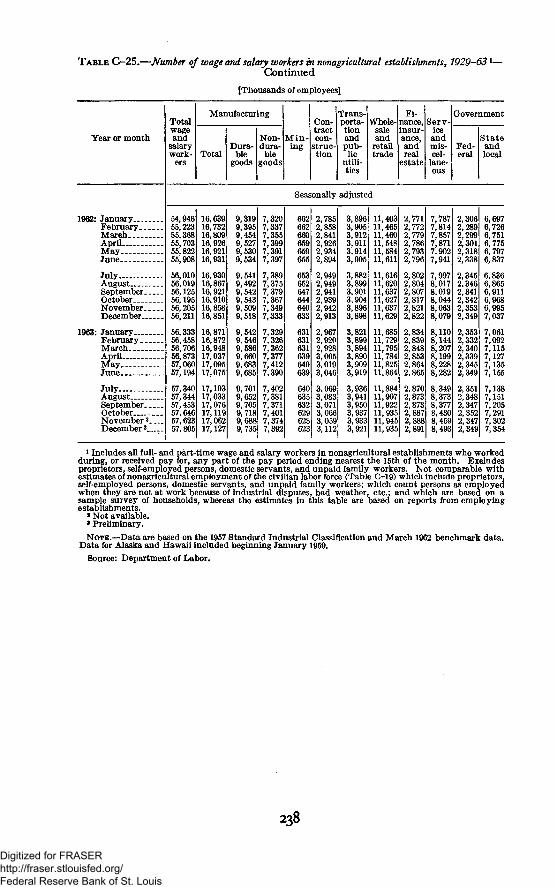
TABLE C—25.—Number of wage and salary workers in nonagricultural establishments, 1929-631—Continued
[Thousands of employees]
Year or month
Totalwageand
salarywork-
ers
Manufacturing
TotalDura-
blegoods
Non-dura-
blegoods
Min-ing
Con-tractcon-
struc-tion
Trans-porta-tionandpub-lic
utili-ties
Whole-saleand
retailtrade
Fi-nance,insur-ance,andreal
estate
Serv-iceandmis-cel-
lane-ous
Government
Fed-eral
Stateandlocal
Seasonally adjusted
1962: JanuaryFebruaryMarchAprilMayJune
JulyAugustSeptemberOctoberNovemberDecember
1963: JanuaryFebruaryMarch ___AprilMayJune
JulyAugustSeptemberOctoberNovember3
December3
54,94655,22355,36855,70355,82255,908
56,01056,01956,12556,19556,20556,211
56,33356,45856,70656,87357,06057,194
57,34057,34457,45357,64657,62357, 805
16,63916,73216,80916,92616,92116,931
16,93016,86716,92116.91016,85816,851
16,87116,87216,94817,03717,09517,075
17,10317,03317,07617,11917,06217,127
9,3199,3959,4549,5279,5309,534
9,5419,4929,5429,5439,5099,518
9,5429,5469,5869,6609,6839,685
9,7019,6529,7059,7189,6889,735
7,3207,3377,3557,3997,3917,397
7,3897,3757,3797,3677,3497,333
7,3297,3267,3627,3777,4127,390
7,4027,3817,3717,4017,3747,392
662662660659659655
653652647644640633
631631631639640639
640635632629628623
2,7852,8582,8412,9262.9342,894
2,9492,9492,9412,9392,9422,913
2,9672,9202,9283,0053,0193,046
3,0693,0833,0713,0663,0593,112
3,8963,9053,9123,9113,9143,905
3,8823,8993,9013,9043,8963,898
3,8213,8993,8943,8903,9093,919
3,9363,9413,9503,9373,9333,921
11,40311,46511,46011,54811,58411,611
11,61611,62011,63711,62711,63711,629
11,68511,72911,79511,78411,82511,864
11,88411,90711,92211,93511,94511,935
2,7712,7722,7792,7862,7932,796
2,8022,8042,8072,8172,8212,822
2,8342,8392,8482,8532,8642,865
2.8702,8732,8732,8872,8882,891
7,7877,8147,8577,8717,9027,941
7,9978,0178,0198,0448,0638,079
8,1108,1448,2078,1998,2288,282
8,3498,3738,3778,4308,4598,493
2,3062,2892,2992,3012,3182,338
2,3452.3462,3412,3422,3532,349
2,3532,3322,3402,3392,3452,349
2,3512,3482,3472,3522,3472,349
6,6976,7266,7516,7756,7976,837
6,8366,8656,9116,9686,9957,037
7,0617,0927,1157,1277,1357,155
7,1387,1517,2057,2917,3027,354
i Includes all full- and part-time wage and salary workers in nonagricultural establishments who workedduring, or received pay for, any part of the pay period ending nearest the 15th of the month. Excludesproprietors, self-employed persons, domestic servants, and unpaid family workers. Not comparable withestimates of nonagricultural employment of the civilian labor force (Table C-19) which include proprietors,self-employed persons, domestic servants, and unpaid family workers; which count persons as employedwhen they are not at work because of industrial disputes, bad weather, etc.; and which are based on asample survey of households, whereas the estimates in this table are based on reports from employingestablishments.
8 Not available.* Preliminary.
NOTE.—Data are based on the 1957 Standard Industrial Classification and March 1962 benchmark data.Data for Alaska and Hawaii included beginning January 1959.
Source: Department of Labor.
238
Digitized for FRASER http://fraser.stlouisfed.org/ Federal Reserve Bank of St. Louis
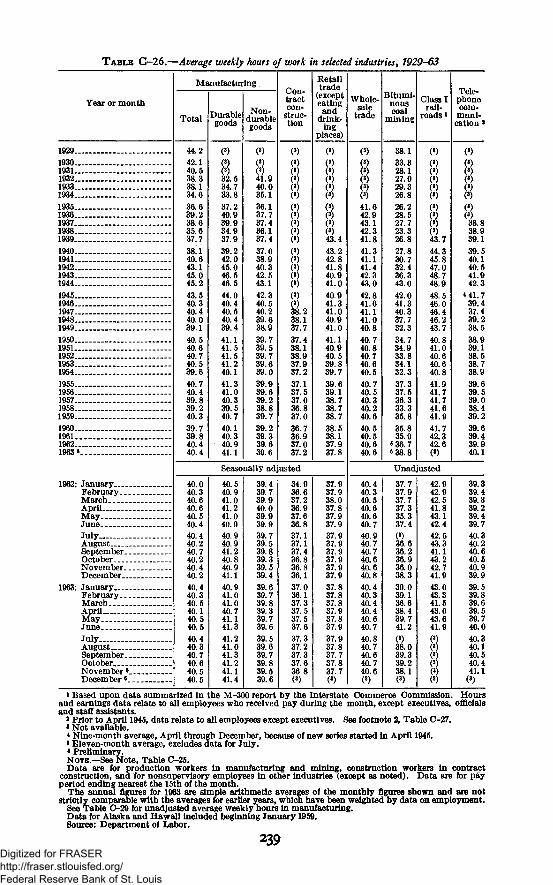
TABLE C-26.—Average weekly hours of work in selected industries, 7929-63
Year or month
Manufacturing
Total Durablegoods
Non-durablegoods
Con-tractcon-
struc-tion
Retailtrade
(excepteating
anddrink.
ingplaces)
Whole-sale
trade
Bitumi-nouscoal
mining
Class Irail-
roads *
Tele-phonecom-
muni-cation a
1929..1930..1931..1932..1933..1934..1935..
1937—-1938—.1939—1940....1941—1942—,1943....1944....
1945....1946—1947—1948—1949....
1950....1951—1952—1953....1954....
1955....1956....1957—.1958....1959—I960....1961....1962....1963 «._
1962: January...February.MarchAprilMayJuneJulyAugustSeptember .OctoberNovember.December..
1963: JanuaryFebruary..MarchAprilMay _JuneJuly _._.AugustSeptember. _.OctoberNovember 8_.December8..
44.242.140.538.338.134.636.639.238.635.637.738.140.643.145.045.243.540.340.440.039.140.540.640.740.539.640.740.439.839.240.339.739.840.440.4
40.040.340.640.640.540.440.440.240.740.240.440.2
40.440.340.540.140.540.540.440.340.740.640.540.5
()32.534.733.837.240.939.934.937.939.242.045.046.546.5
44.040.440.540.439.441.141.541.541.240.141.341.040.339.540.740.140.340.941.1
()
2.940.035.136.137.737.436.137.4
37.038.940.342.543.1
42.340.540.239.638.939.739.539.739.639.039.939.639.238.839.739.239.339.639.6
()38.238.137.737.438.138.937.937.237.137.537.036.837.036.736.937.037.2
43.4
43.242.841.840.941.040.941.341.040.941.041.140.940.539.839.739.639.138.738.738.738.538.137.937.8
38.133.328.127.029.326.826.228.527.723.326.827.830.732.436.343.042.041.340.337.732.334.734.933.834.132.337.337.536.333.335.835.835.9
«36.7«38.8
Seasonally adjusted Unadjusted
40.540.941.041.241.040.940.940.941.240.840.941.140.941.041.040.741.141.341.241.041.341.241.141.4
39.439.739.940.039.939.939.739.539.839.339.639.439.639.739.839.339.739.639.539.639.739.839.539.6
34.936.637.236.937.636.837.137.137.436.836.836.137.036.137.337.537.537.637.337.237.337.636 8(3)
37.937.938.037.837.937.937.937.937.937.937.937.937.837.837.837.937.837.937.937.837.737.837.7(
40.440.340.540.640.640.740.940.740.740.640.640.840.440.340.440.440.640.740.840.740.640.740.6()
37.737.937.737.335.337.4(3)36.636.236.936.038.339.039.136.638.439.741.2
(3)38.039.339.238.1
42.942.942.541.843.142.442.543.341.143.242.741.943.043.341.543.043.641.9
38.838.939.139.540.140.541.942.3
«41.739.437.439.238.538.939.138.538.738.939.639.539.038.439.239.639.439.940.1
39.339.439.339.239.439.740.340.240.640.540.939.939.539.839.639.539.740.040.340.140.540.441.1
1 Based upon data summarized in the M-300 report by the Interstate Commerce Commission. Hoursand earnings data relate to all employees who received pay during the month, except executives, officialsand staff assistants.
2 Prior to April 1945. data relate to all employees except executives. See footnote 2. Table C-27.»Not available.* Nine-month average, April through December, because of new series started in April 1945.4 Eleven-month average, excludes data for July.• Preliminary.NOTE.—See Note, Table C-25.Data are for production workers in manufacturing and mining, construction workers in contract
construction, and for nonsupervisory employees in other industries (except as noted). Data are for payperiod ending nearest the 15th of the month.
The annual figures for 1963 are simple arithmetic averages of the monthly figures shown and are notstrictly comparable with the averages for earlier years, which have been weighted by data on employment.
See Table C-29 for unadjusted average weekly hours in manufacturing.Data for Alaska and Hawaii included beginning January 1959.Source: Department of Labor.
239Digitized for FRASER http://fraser.stlouisfed.org/ Federal Reserve Bank of St. Louis
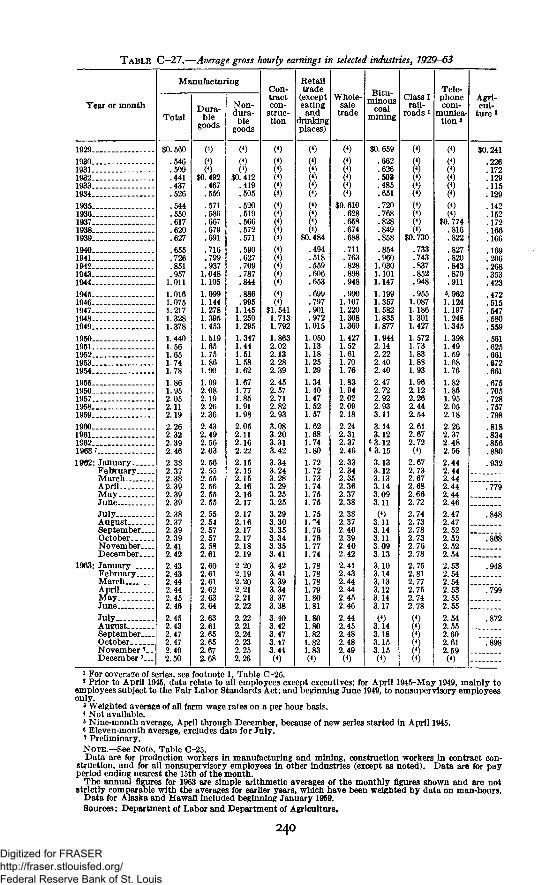
TABLE
Year or month
1929
19301931 .193219331934
19351936193719381939 _
1940 _.1941194219431944
19451946 _-194719481949
195019511952 _ _—19531954
19651956195719581959
1960196119621963 7
1962: January .FebruaryMarchAprilMayJuneJulyAugustSeptemberOctoberNovemberDecember
1963: JanuaryFebruaryMarchAprilMayJuneJulyAugustSeptemberOctoberNovember 7
December ?___
C—27.—Average gross hourly earnings in selected industries, 1929-63
Manufacturing
Total
$0.560
.546
.509
.441
.437
.526
.544
.550
.617
.620
.627
.655
.726
.851
.9571.011
1.0161.0751 2171.3281.378
1 4401.561.651 741.78
1.861.952.052.112.19
2 262.322.392.46
2.382.37
2 392.392 39
2.382.372.392.392.412.42
2.432.432.442.442.452 46
2.452 432.472 472.492.50
Dura-ble
goods
$0.492.467.550
.571
.580
.667
.679
.691
.716
.799
.9371.0481.105
1.0991.1441.2781.3951.453
1.5191.651.751.861.90
1.992.082.192.262.36
2.432.492.562.63
2.562.552.552.562.552.55
2.552.542.572.572.582.61
2.602.612.612.622.632 64
2.632.612.652 652.672.68
Non-dura-ble
goods
(*)$0. 412
.419
.505
.520
.519
.566
.572
.571
.590
.627
.709
.787
.844
.886
.9951.1451.2501.2951.3471.441.511.581.62
1.671.771.851.911.98
2.052.112.162.22
2.152.152.152.162.162.17
2.172.162.172.172.182.19
2.202.192.202.212.212 22
2.222.212.242 232.252.26
Con-tractcon-
struc-tion
w(4)
(4)
to(4)
$1. 5411.7131.792
1.8632.022.132.282.39
2.452.572.712.822.93
3.083.203.313.42
3.343.243.283.293.253.25
3.293.303.353.343.353.413.423.413.393.343.373 38
3.403.423.473 473.44
Retailtrade
(excepteating
anddrinkingplaces)
(4)
%
(4)$0,484
.494
.518
.559
.606
.653
.699
.797
.901
.9721.015
1.0501.131.181.251.29
1.341.401.471.521.57
1.621.681.741.80
1.721.721.731.741.751.75
1.75
1.761.761.771.74
1.781.781.781.791.801 81
1.801.801.821 821.83
Whole-sale
trade
W
$0.610.628.658.674.688
.711
.763
.828
.898
.948
.9901.1071.2201.3081.360
1.4271.521.611.701.76
1.831.942.022.092.18
2.242.312.372.46
2.332.342.352.362.372.38
2.382.372.402.392.402.422.412.432.442.442.452.46
2.442.452.482.482.49
minouscoal
mining
$0.659
.662
.626
.503
.485.651
.720
.768
.828
.849
.858
.854
.9601.0301.1011.147
1.1991.3571.5821.8351.8771.9442.142.222.402.40
2.472.722.922.933.11
3.143.12
6 3.126 3.15
3.133.123.133.143.093.11
3.113.143.113.093.13
3.103.143.133.123.143 17
3.143.183.153.15
Class Irail-
roads *
iS(4)
$0.730
.733
.743
.837
.852
.948
.9551.0871.1861.3011.427
1.5721.731.831.881.93
1.962.122.262.442.54
2.612.672.72
2.672.732.672.682.662.72
2.742.732.782.732.762.78
2.752.812.772.752.742.78
(4)
(4)
(4)
Tele-phonecom-
munica-tions
(4)
(4)
(4)$0.774
.816
.822
.827
.820
.843
.870
.911
«.9621.1241.1971.2481.345
1.3981.491.591.681.76
1.821.861.952.052.18
2 262.372.482.56
2.442.442.442.442.442.46
2.472.472.522.522.522.542.532.542.542.532.552 55
2.542 552.602.612.59
Agri-cul-
ture 3
$0,241
.226
.172
.129115
.129
.142152
.172166
.166
.169206268
.353
.423
472.515547
.580
.559
561.625.661672
.661
.675705
.728757
.798
818834
.856
.880
932
779
.848
.868
.948
.799
.872
.898
1 For coverage of series, see footnote 1, Table C-26.2 Prior to April 1945, data relate to all employees except executives; for April 1945-May 1949, mainly to
employees subject to the Fair Labor Standards Act; and beginning June 1949, to nonsupervisory employeesonly.
» Weighted average of all farm wage rates on a per hour basis.4 Not available.« Nine-month average, April through December, because of new series started in April 1945.o Eleven-month average, excludes data for July.7 Preliminary.NOTE.—See Note, Table C-25.Data are for production workers in manufacturing and mining, construction workers in contract con-
struction, and for all nonsupervisory employees in other industries (except as noted). Data are for payperiod ending nearest the 15th of the month.
The annual figures for 1963 are simple arithmetic averages of the monthly figures shown and are notstrictly comparable with the averages for earlier years, which have been weighted by data on man-hours.
Data for Alaska and Hawaii included beginning January 1959.Sources: Department of Labor and Department of Agriculture.
240
Digitized for FRASER http://fraser.stlouisfed.org/ Federal Reserve Bank of St. Louis
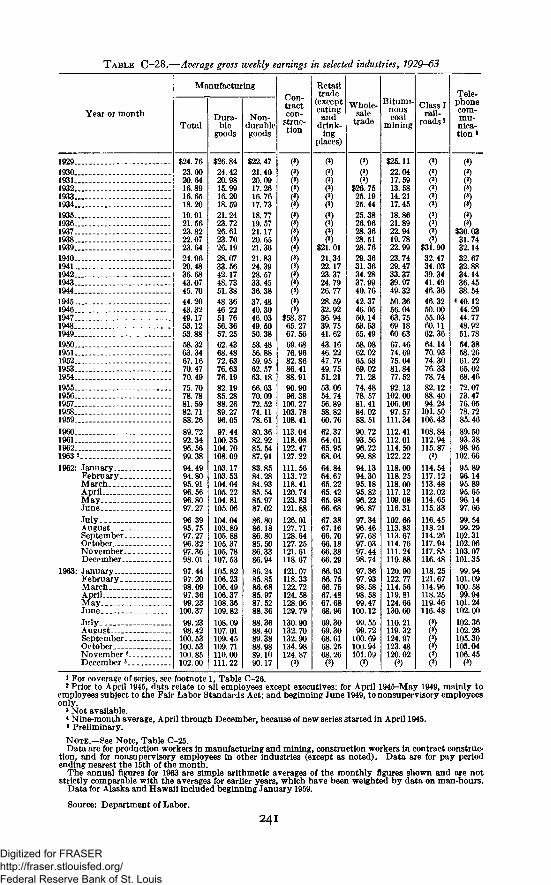
TABLE C-28.—Average gross weekly earnings in selected industries, 1929-63
Year or month
19291930....193119321933193419351936193719381939194019411942194319441945194619471948194919501951 .1952195319541955._- _.1956195719581959
1960196119621963 5
1962: January. . .February..MarchAprilMayJune
JulyAugustSeptember.October, __November.December.
1963: January.-.February.MarchAprilMayJune
JulyAugustSeptemberOctober,. .NovemberDecember >
Manufacturing
Total
$24. 7623.0020.6416.8916.6518.2019.9121.5623.8222.0723.6424.9629.4836.6843.0745.7044.2043.3249.1753.1253.8858.3263.3467.1670.4770.4975.7078.7881.5982.7188.26
89.7292.3496.5699.38
94.4994.8095.9196.5696.8097.27
96 3995. 7597.2796.3297.3698.01
97.4497.2098.0997.3699.23
100.37
99.2398.42100.53100. 53100.85102.00
Dura-ble
goods
$26.8424.4220.9815.9916.2018.5921.2423.7226.6123.7026.1928.0733.5642.1748.7351.3848.3646.2251.7656.3657.2562.4368.4872.6376.6376.1982.1985.2888.2689.2796.05
97.44100.35104.70108.09
103.17103.53104.04105. 22104.81105.06
104.04103.89105.88105.37105.78107.53
105.82106.23106.49106.37108.36109.82
108.09107.01109.45109. 71110.00111.22
Non-durablegoods
$22.4721.4020.0917.2616.7617.7318.7719.5721.1720.6521.3621.8324.3928.5733.45
37.4840.3046.0349.5050.3853.4856.8859.9562.5763.1866.6370.0972.5274.1178.61
80.3682.9285.5487.91
83.8584.2884.9385.5485.9787.02
86.8086.18
85.5086.3386.9486.2485.8586.6885.9787.5288.36
88.3688.4089.38
89.1090.17
Con-tractcon-
struc-tion
Retailtrade
(excepteatingand
drink-ing
places)
()
(*)$21. 0121.3422.1723.3724.7926.7728.5932.9236.9439.7541.6243.1646.2247.7949.7551.2163.0654.7456.8958.8260.7662.3764.0165.9568.04
64.8464.6765.2265.4265.9866.68
67.3867.1666.7066.1866.3866.29
66.9366.7566.7567.4867.6868.96
69.3069.3068.6168.2568.26
Whole-sale
trade
()
8$26.7525.1925.4425.3826.9628.3628.5128.7629.3631.3634.2837.9940.7642.3746.0550.1453.6355.4958.0862.0265.5369.0271.2874.4878.5781.4184.0288.5190.7293.5696.2299.8894.1394.3095.1895.8296.2296.87
97.3496.4697.6897.0397.4498.74
97.3697.9398.5898.5899.47
100.12
99.5599.72100.69100.94101.09
Bitumi-nouscoal
mining
$25.1122.0417.5913.5814.2117.4518.8621.8922.9419.7822.9923.7429.4733.3739.9749.3250.3656.0463.7569.1860.6367.4674.6975.0481.8477.5292.13
102.00106.0097.57111.34112.41112. 01114.50122.22
118.00118.25118.00117.12109.08116.31
102.66113.83113.67114. 76111.24119.88
120.90122. 77114. 56119.81124.66130.60
110.21119.32124.97123.48120.02
Class Iraij-
roads *
8$31.9032.4734.0339.3441.4946.3646.3250.0055.0360.1162.3664.1470.9374.3076.3378.7482.1288.4094.24
101. 50106.43108.84112.94115.87
(3)114.54117.12113.48112.02114. 65115.33116.45118.21114.26117.94117.85116.48
118.25121.67114.96118.25119.46116.48
Tele-phonecom-mu-nica-tion»
(3)
8(3)()
$30.0331.7432.1432.6732.8834.1436.4538.54
* 40.1244.2944.7748.9251.7854.3858.2661.2265.0268.4672.0773.4776.0578.7285.46
89.5093.3898.95102.66
95.8996.1495.8995.6596.1497.66
99.5499.29
102.31102.06103.07101.3599.94101.09100.5899.94101.24102.00
102.36102.26105.30105.04106.45
1 For coverage of series, see footnote 1, Table C-26.2 Prior to April 1945, data relate to all employees except executives; for April 1945-May 1949, mainly to
employees subject to the Fair Labor Standards Act; and beginning June 1949, tononsupervisory employeesonly.
3 Not available.4 Nine-month average, April through December, because of new series started in April 1945.8 Preliminary.
NOTE.—See Note, Table C-25.Data are for production workers in manufacturing and mining, construction workers in contract construc-
tion, and for nonsupervisory employees in other industries (except as noted). Data are for pay periodending nearest the 15th of the month.
The annual figures for 1963 are simple arithmetic averages of the monthly figures shown and are notstrictly comparable with the averages for earlier years, which have been weighted by data on man-hours.
Data for Alaska and Hawaii included beginning January 1959.
Source: Department of Labor.
241
Digitized for FRASER http://fraser.stlouisfed.org/ Federal Reserve Bank of St. Louis
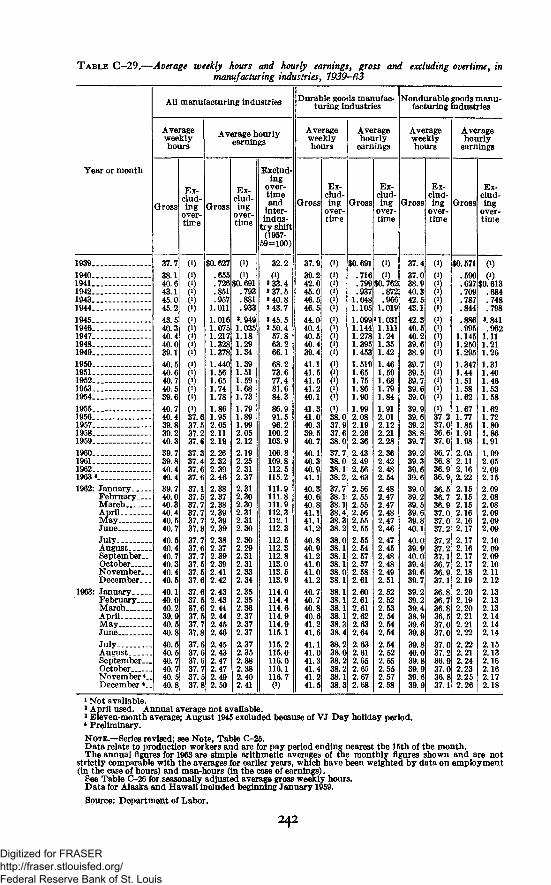
TABLE C-29.—Average weekly hours and hourly earnings, gross and excluding overtime, inmanufacturing industries, 7939—63
Year or month
Gross
All manufacturing industries
Averageweeklyhours
ingover-time
Gross
Average hourlyearnings
Exclud-ing
over-timeand
inter-indus-
try shift(1957
59=100)
Durable goods manufac-turing industries
Nondurable goods manu-facturing industries
Averageweeklyhours
Gross
Ex-clud-ing
over-time
Gross
Averagehourly
earnings
Ex-clud-ing
over-time
Gross
Averageweeklyhours
Ex-clud-ing
over-time
Gross
Averagehourly
earnings
Ex-clud-ing
over-time
193919401941 „19421943194419451946194719481949195019511952 _1953-1954 _„19551956 -.195719581959
37.7
38.140.643.145.045.243.540.340.440.039.140.540.640.740.539.640.740.4
$0.627.655.726$0..851.957
1.011
.793
.881
.933
1960196119621963*1962: January
FebruaryMarchAprilMayJuneJulyAugustSeptember-OctoberNovember-December. .
1963: JanuaryFebruaryMarchAprilMayJuneJulyAugustSeptember-OctoberNovember*.December <_
39.240.3
39.739.840.440.439.740.040.340.440.540.740.540.440.740.340.440.540.140.040.239.940.540.840.540.540.740.740.540.8
37.437.637.6
37.137.537.7
37.737.637.737.537.537.637.637.537.637.537.737.837.637.637.637.737.537.8
.016
.075
1.78
2.262.322.392.462.382.372.382.392.392.392.382.372.392.392.412.422.432.432.442.442.452.46
2.452.432.472.472.492.50
».9491.035
1.73.79.89
1.992.052.122.192.252.312.372.312.302.302.312.312.302.302.292.312.312.332.342.352.352.362.372.372.372.372.352.382.382.402.41
32.2
0)3 33.43 37.5»40.83 43.73 45.53 50.4
57.863.266.168.273.677.481.684.386.991.596.2
100.2103.9106.8109.8112.5115.2111.9111.8111.9112.3112.1112.3112.5112.3112.8113.0113.5113.9114.0114.4114.6114.9114.9115.1115.2115.0116.0116.1116.7(0
37.939.242.045.046.546.544.040.440.540.439.441.141.541.541.240.141.341.040.339.540.740.140.340.941.140.340.640.841.141.141.240.840.941.241.041.041.240.740.740.840.641.241.641.141.041.341.441.241.5
0).716 (0.799 $0,762
37.738.038.138.237.738.138.138.438.338.238.038.138.138.138.038.138.138.138.138.138.338.438.238.038.238.238.138.3
.9371.0481.1051.0991.1441.2781.3951.4531.5191.651.751.861.901.992.082.192.262.362.432.492.56
2.562.552.552.562.552.552.552.542.572.572.582.612.602.612.612.622.632.642.632.612.652.652.672.68
.872
.9661.019
31.0311.1111.241.351.421.461.591.681.791.841.912.012.122.212.282.362.422.482.542.482.472.472.482.472.462.472.452.482.482.492.512.522.522.532.542.542.542.542.522.552.552.572.58
37.4
37.038.940.342.543.142.340.540.239.638.939.739.539.739.639.039.939.639.238.839.739.239.339.639.639.039.239.539.639.840.140.039.940.039.439.639.739.239.239.438.939.639.839.40.0
39.639.9
(0
8(00)0)880)0)0)0)0)0)0)37.237.036.637.036.736.836.936.936.536.736.937.037.037.237.237.237.136.736.937.136.836.736.836.537.037.037.037.236.937.036.837.1
$0,571.590
(00)
627 $0.613.709.787.844.886.995
1.1451.2501.2951.3471.441.511.581.621.671.771.851.911.982.052.112.162.222.152.152.152.162.162.172.172.162.172.172.182.192.202.192.202.212.212.222.222.212.242.232.252.26
.684
.748
.798».841.962
1.111.211.261.311.401.461.531.581.621.721.801.861.911.992.052.092.152.092.082.082.092.092.092.102.092.092.102.112.122.132.132.132.142.142.142.152.132.162.162.172.18
1 Not available.2 April used. Annual average not available.3 Eleven-month average; August 1945 excluded because of VJ Day holiday period.* Preliminary.NOTE.—Series revised; see Note, Table C-25.Data relate to production workers and are for pay period ending nearest the 15th of the month.The annual figures for 1963 are simple arithmetic averages of the monthly figures shown and are not
strictly comparable with the averages for earlier years, which have been weighted by data on employment(in the case of hours) and man-hours (in the case of earnings).
See Table C-26 for seasonally adjusted average gross weekly hours.Data for Alaska and Hawaii included beginning January 1959.Source: Department of Labor.
242
Digitized for FRASER http://fraser.stlouisfed.org/ Federal Reserve Bank of St. Louis
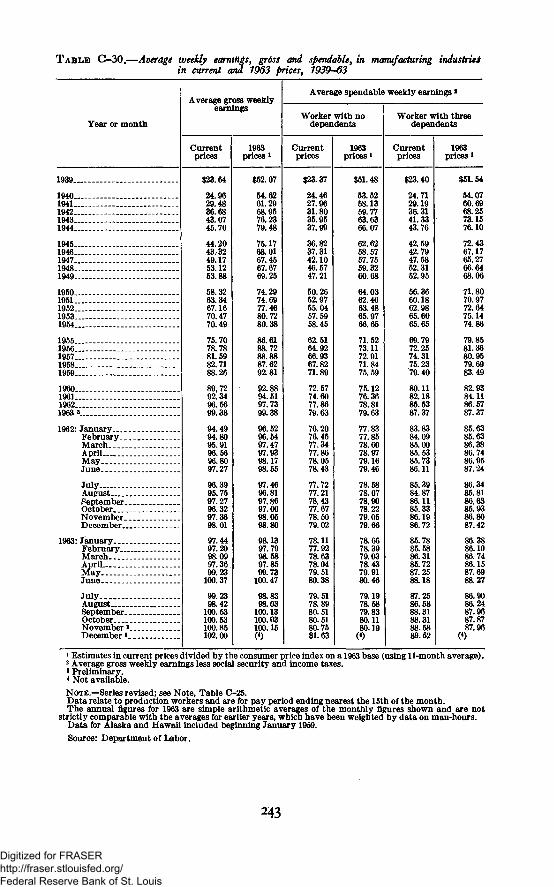
T A B L E C-30.—Average weekly earnings, gross and spendable, in manufacturing industriesin current and 1963 prices, 1939-63
Year or month
1939
1940 ,19411942 _-.-19431944
19451946194719481949
1950 - -1951195219531954
19551956195719581959
1960196119621963 s
1962: JanuaryFebruaryMarch. . __ _.April .May __ _June
July .August.SeptemberOctoberNovember.December
1963: JanuaryFebruary _.March. -ApriLMayJune
JulyAugustSeptember _ -October-November'December8 .
Average gross weeklyearnings
Currentprices
$23.64
24.9629.4836.6843.0745.70
44.2043.3249.1753.1253.88
58.3263.3467.1670.4770.49
75.7078.7881.5982.7188.26
89,7292.3496.5699.38
94.4994.8095.9196.5696.8097.27
96.3995.7597.2796.3297.3698.01
97.4497.2098.0997.3699.23
100.37
99.2398.42
100.53100.53100.85102.00
1963prices»
$52.07
54.6261.2968.9576.2379.48
75.1768.0167.4567.6769.25
74.2974.6977.4680.7280.38
86.6188.7288.8887.6292.81
92.8894.5197.7399.38
96.5296.5497.4797.9398.1798.55
97.4696.8197.8697.0098.0598.80
98.1397.7998.5897.8599.73
100.47
98.8398.03
100.13100.03100.15
Average spendable weekly earnings *
Worker with nodependents
Currentprices
$23.37
24.4627.9631.8035.9537.99
36.8237.3142.1046.5747.21
50.2652.9755.0457.5958.45
62.5164.9266.9367.8271.89
72.5774.6077.8679.63
76.2076.4577.3477.8678.0578.43
77.7277.2178.4377.6778.5079.02
78.1177.9278.6378.0479.5180.38
79.5178.8980.5180.5180.7581.63
1963prices»
$51.48
53.5258.1359.7763.6366.07
62.6258.5757.7559.3260.68
64.0362.4663.4865.9766.65
71.5273.1172.9171.8475.59
75.1276.3678.8179.63
77.8377.8578.6078.9779.1679.46
78.5878.0778.9078.2279.0579.66
78.6678.3979.0378.4379.9180.46
79.1978.5879.8380.1180.19
Worker with threedependents
Currentprices
$23.40
24.7129.1936.3141.3343.76
42.5942.7947.5852.3152.95
56.3660.1862.9865.6065.65
69.7972.2574.3175.2379.40
80.1182.1885.5387.37
83.8384.0985.0085.5385.7386.11
85.3984.8786.1185.3386.1986.72
85.7885.5886.3185.7287.2588.18
87.2586.5888.3188.3188.5889.52
1963prices1
$51.54
54.0760.6968.2573.1576.10
72.4367.1765.2766.6468.06
71.8070.9772.6475.1474.86
79.8581.3680.9579.6983.49
82.9384.1186.5787.37
85.6385.6386.3886.7486.9587.24
86.3485.8186.6385.9386.8087.42
86.3886.1086.7486.1587.6988.27
86.9086.2487.9687.8787.96
<*)
1 Estimates in current prices divided by the consumer price index on a 1963 base (using 11-month average).2 Average gross weekly earnings less social security and income taxes.* Preliminary.* Not available.
NOTE.—Series revised; see Note, Table C-25.Data relate to production workers and are for pay period ending nearest the 15th of the month.The annual figures for 1963 are simple arithmetic averages of the monthly figures shown and are not
strictly comparable with the averages for earlier years, which have been weighted by data on man-hours.Data for Alaska and Hawaii included beginning January 1959.
Source: Department of Labor.
243
Digitized for FRASER http://fraser.stlouisfed.org/ Federal Reserve Bank of St. Louis
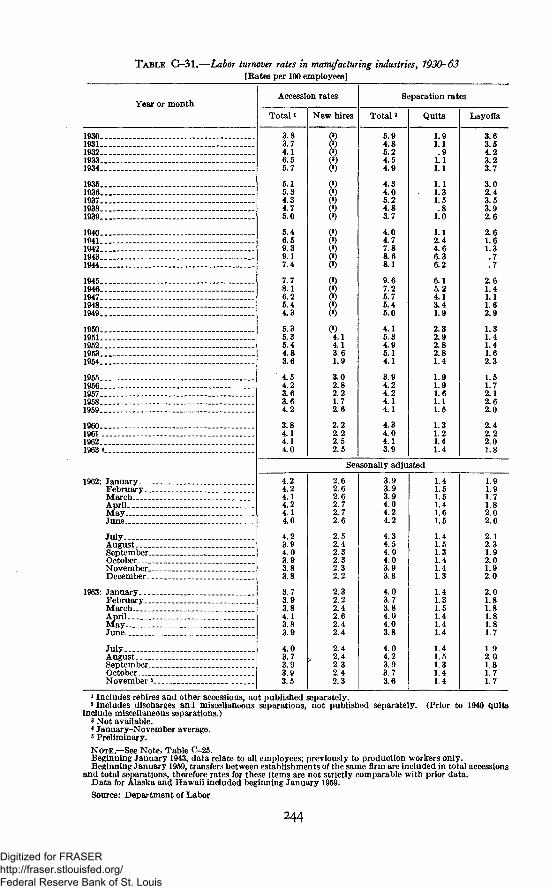
TABLE C-31.—Labor turnover rates in manufacturing industries, 7030-63[Rates per 100 employees]
Year or month
19301931193219331934
19351936 —-193719381939
19401941 _ _ _194219431944 ___ __
1945 ___ _ _1946 - _ -194719481949 -__
1950 __19511952 -__ _ --19531954
1955 .1956195719581959 _
I96019611962 _ .__ _ _1963 *
1962: January .FebruaryMarchApril __M a yJune _. , L
JulyAugustSeptemberOctober __NovemberDecember
1963: JanuaryFebruaryMarchAprilMay.. _June ._
JulyAugustSeptemberOctoberNovember 5_ _ -
Accession rates
Total i
3.83.74.16.55.7
5.15.34.34.75.0
5.46.59.39.17.4
7.78.16.25.44.3
5.35.35.44.83.6
4.54.23.63.64.2
3.84.14.14.0
New hires
(3)
18?(3)(3)(3)
(3)
(3)(3)
( 3 )
4.14.13.61.9
3.02.82.21.72.6
2.22.22.52.5
Total 2
5.94.85.24.54.9
4.34.05.24.83.7
4.04.77.88.68.1
9.67.25.75.45.0
4.15.34.95.14.1
3.94.24.24.14.1
4.34.04.13.9
Separation rates
Quits
1.91.1.9
1.11.1
1.11.31.5
. 81.0
1.12.44.66.36.2
6.15.24.13.41.9
2.32.92.82.81.4
1.9
Seasonally adjusted
4.24.24.14.24.14.0
4.23.94.03.93.83.8
3.73.93.84.13.83.9
4.03.73.93.93.5
2.62.62.62.72.72.6
2.52.42.32.32.32.2
2.32.22.42.62.42.4
2.42.42.32.42.3
coco
CO
CO
3.94.04.24.2
4.34.54.04.03.93.8
4.03.73.84.04.03.8
4.04.23.93.73.6
]
. 9
. 6
. 1
. 5
. 3
. 2
.4
.4
1.4L.5L 5,4
L.65
L.4L.5L.3L.4L.4L.3
L.435
L.4L.4L.4
L.4L.51.3.4.4
Layoffs
3.63.54.23 23.7
3.02.43.53.92.6
2.61.61.3.7.7
2.61.41.11.62.9
1.31.41.41.62.3
1.51.72.12.62.0
2.42.22.0
1.91.91.71.82.02.0
2.12.31.92.01.92.0
2.01.81.81.81.81.7
1.92.01.81.71.7
1 Includes rehires and other accessions, not published separately.2 Includes discharges and miscellaneous separations, not published separately. (Prior to 1940 quits
include miscellaneous separations.)3 Not available.* January-November average.a Preliminary.NOTE.—See Note, Table C-25.Beginning January 1943, data relate to all employees; previously to production workers only.Beginning January 1959, transfers between establishments of the same firm are included in total accessions
and total separations, therefore rates for these items are not strictly comparable with prior data.Data for Alaska and Hawaii included beginning January 1959.Source: Department of Labor
244
Digitized for FRASER http://fraser.stlouisfed.org/ Federal Reserve Bank of St. Louis
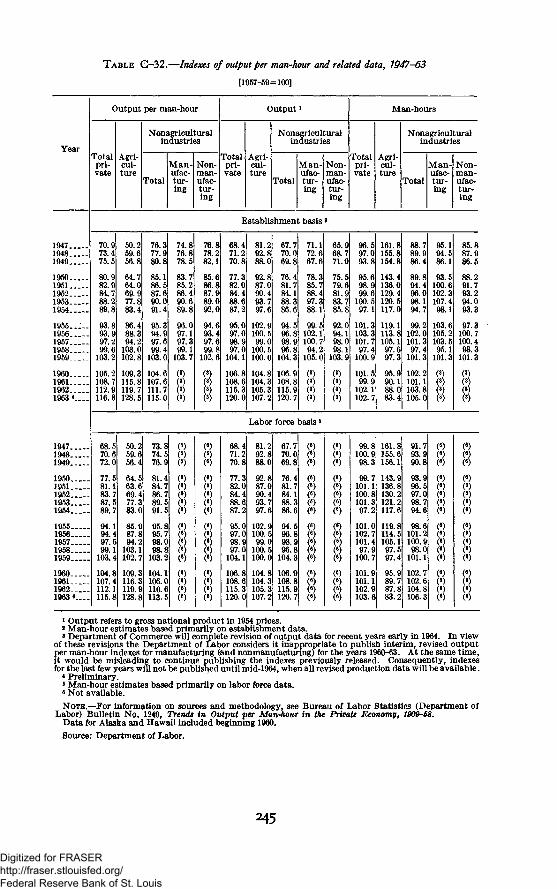
TABLE C-32.—Indexes of output per man-hour and related data, 1947-63
[1957-59=100]
Year
194719481949
19501951195219531954
19551956195719581959
1960196119621963 * . „ .
194719481949
19501951195219531954
19551956195719581959
1960196119621963 <____
Output per man-hour
Totalpri-vate
Agri-cul-ture
Nonagriculturalindustry
Total
Man-ufac-tur-ing
;s
Non-man-ufac-tur-ing
Totalpri-vate
Output
Agri-cul-ture
l
Nonagriculturalindustries
Total
Man-ufac-tur-ing
Non-man-ufac-tur-ing
Man-hours
Totalpri-vate
Agri-cul-ture
Nonagriculturalindustries
Total
Man-ufac-tur-ing
Non-man-ufac-tur-ing
Establishment basis3
70.973.475.5
80.982.984.788.289.8
93.893.997.299.6
103.2
105.2108.7112.9116.8
68.570.672.0
77.581.183.787.589.7
94.194.497.599.1
103.4
104.8107.4112.1115.8
50.259.656.8
64.764.069.977.883.4
86.488.394.2
103.0102.8
109.3115.8119.7128.5
50.259.656.4
64.563.669.477.383.0
85.987.894.2
103.1102.7
109.3116.3119.9128.8
76.377.980.8
85.186.587.690.091.4
95.394.997.699.4
103.0
104.6107.6111.7115.0
73.874.576.9
81.484.786.789.591.5
95.895.798.098.8
103.2
104.1106.0110.6113.5
74.876.878.5
83.785.286.490.689.8
96.097.197.399.1
103.7
(3)
(3)
(8)
(8)
(6)
(8)(8)
(8)(8)CO(6)
CO(8)(8)(8)CO
76.878.282.1
85.686.887.989.092.0
94.693.497.699.8
102.6
(3)
(3)
(6)
(6)
CO(6)
( 6 )
(8)
1(8)(8)(8)
( 6 )
68.471.270.8
77.382.084.488.687.2
95.097.098.997.0
104.1
106.8108.6115.3120.0
68.471.270.8
77.382.084.488.687.2
95.097.098.997.0
104.1
106.8108.6115.3120.0
81.292.888.0
92.887.090.493.797.6
102.9100.599.0
100.5100.0
104.8104.3105.3107.2
Labor
81.292.888.0
92.887.090.493.797.6
102.9100.599.0
100.5100.0
104.8104.3105.3107.2
67.770.069.8
76.481.784.188.386.6
94.596.898.996.8
104.3
106.9108.8115.9120.7
71.172.667.6
78.385.788.497.388.1
99.5102.1100.794.2
105.0
(3)(3)(3)
(3)
force basis»
67.770.069.8
76.481.784.188.386.6
94.596.898.996.8
104.3
106.9108.8115.9120.7
(8)
(6)
CO(6)
CO
(8)(6)
(8)(6)
(8)
65.968.771.0
75.579.681.983.785.8
92.094.198.098.1
103.9
(3)
( 3 )
(8)
(8)
(8)
(8)
1(6)(6)(8)(8)(8)CO
96.597.093.8
95.698.999.6
100.597.1
101.3103.3101.797.4
100.9
101.599.9
102.1102.7
99.8100.998.3
99.7101.1100.8101.397.2
101.0102.7101.497.9
100.7
101.9101.1102.9103.6
161.8155.8154.8
143.4136.0129.4120.5117.0
119.1113.8105.197.697.3
95.990.188.083.4
161.8155.6156.1
143.9136.8130.2121.2117.6
119.8114.5105.197.597.4
95.989.787.883.2
88.789.986.4
89.894.496.098.194.7
99.2102.0101.397.4
101.3
102.2101.1103.8105.0
91.793.990.8
93.996.597.098.794.6
98.6101.2100.998.0
101.1
102.7102.6104.8106.3
95.194.586.1
93.5100.6102.3107.498.1
103.6105.2103.595.1
101.3
(3)
(3)
(8)
(8)
(8)(6)
(6)(8)
(*)
(6)
(8)(6)
CO
85.887.986.5
88.291.793.294.093.3
97.3100.7100.498.3
101.3
(3)
(3)
CO(8)CO
(6)
CO(8)(8)
COCOCO(8)(•)
CO(8)(6)
CO
1 Output refers to gross national product in 1954 prices.2 Man-hour estimates based primarily on establishment data.3 Department of Commerce will complete revision of output data for recent years early in 1964. In view
of these revisions the Department of Labor considers it inappropriate to publish interim, revised outputper man-hour indexes for manufacturing (and nonmanufacturing) for the years 1960-63. At the same time,it would be misleading to continue publishing the indexes previously released. Consequently, indexesfor the last few years will not be published until mid-1964, when all revised production data will be available.
* Preliminary.* Man-hour estimates based primarily on labor force data.* Not available.NOTE.—For information on sources and methodology, see Bureau of Labor Statistics (Department of
Labor) Bulletin No. 1249, Trends in Output per Man-hour in the Private Economy, 1909-68.Data for Alaska and Hawaii included beginning 1960.
Source: Department of Labor.
245
Digitized for FRASER http://fraser.stlouisfed.org/ Federal Reserve Bank of St. Louis
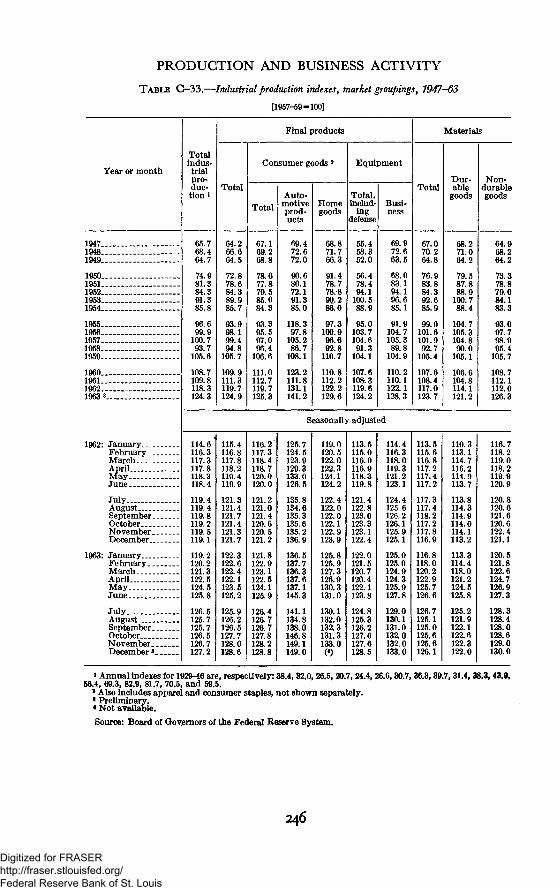
PRODUCTION AND BUSINESS ACTIVITY
TABLE C—33.—Industrial production indexes, market groupings, 1947-63
[1957-59=100]
Year or month
1947_.1948..1949..
1950_.1951-1952_.1953-.1954..
1955..1956_.1957__1958-1959.-
1960_.1961..1962..1963 3.
1962: JanuaryFebruary. _MarchAprilMayJune
JulyAugustSeptember.OctoberNovember,December..
1963: JanuaryFebruary. _MarchAprilMayJune
JulyAugustSeptember.OctoberNovember.December'.
Totalindus-trialpro-duc-tion^
65.768.464.7
74.981.384.391.385.8
96.699.9
100.793.7
105.6
108.7109.8118.3124.3
Final products
Total
64.266.664.5
72.878.684.389.985.7
93.998.199.494.8
105.7
109.9111.3119.7124.9
Consumer goods 2
Total
67.169.268.8
78.677.879.585.084.3
93.395.597.096.4
106.6
111.0112.7119.7125.3
Auto-motiveprod-ucts
69.472.672.0
90.680.172.191.385.0
118.397.8
105.286.7
108.1
123.2111.8131.1141.2
Homegoods
Total,includ-
ingdefense
68.871.766.3
91.478.778.890,286.0
97.3100.996.692.8
110.7
110.8112.2122.2129.6
Equipment
55.458.352.0
56.478.494.1
100.588.9
95.0103.7104.691.3
104.1
107.6108-.3119.6124.2
Busi-ness
69.972.663.5
68.083.194.196.685.1
91.9104.7105.389.8
104.9
110.2110.1122.1128.3
Materials
Total
67.070.264.8
76.983.884.392.685.9
99.0101.6101.992.7
105.4
107.6108.4117.0123.7
Dur-able
goods
68.271.064.2
79.587.888.9
100.788.4
104.7105.3104.890.0
105.1
106.6104.8114.1121.2
Non-durablegoods
64.968.264.2
73.378.879.084.183.3
97.798.995.4
105.7
108.7112.1112.0126.3
Seasonally adjusted
114.6116.3117.3117.8118.3118.4
119.4119.4119.8119.2119.5119.1
119.2120.2121.3122.5124.5125.8
126.5125.7125.7126.5126.7127.2
115.4116.8117.8118.2119.4119.9
121.3121.4121.7121.4121.3121.7
122.3122.6122 A122.1123.5125.2
125.9126.2126.5127.7128.0128.6
116.2"117.3118.4118.7120.0120.0
121.2121.0121.4120.6120.5121.2
121.8122.9123.1122.5124.1125.9
126.4126.7126.7127.8128.2128.8
125.7124.5123.9129.3133.0126.5
135.8134.6135.3135.6135.2136.9
136.5137.7136.3137.6137.1145.3
141.1134.8138.0146.8149.1149.0
119.0120.5122.0122.3124.1124.2
122.4122.0122.0122.1122.9123.9
125.8125.9127.3126.9130.3131.0
130.1132.0132.3131.3133.0(<)
113.5115.0116.0116.9118.3119.8
121.4122.8123.0123.3123.1122. 4
122.0121.5120.7120.4122.1123.8
124.8125.3126.2127.6127.6128.5
114.4116.3118.0119.3121.2123.1
124.4125.6126.2126.1125.9125.1
125.0125.0124.9124.3125.9127.8
129.0130.1131.0132.0132.0133.0
113.5115.6116.8117.2117.4117.2
117.3117.4118.2117.2117.8116.9
116.8118.0120.2122.9125.7126.6
126.7125.1125.0125.6125.6126.1
110.3113.1114.7116.2114.9113.7
113.8114.3114.9114.0114.1113.2
113.3114.4118.0121.2124.5125.8
125.2121.9122.1122.6122.3122.0
116.7118.2119.0118.2119.9120.9
120.8120.6121.6120.6122.4121.1
120.5121.8122.6124.7126.9127.3
128.3128.4128.0128.6129.0130.0
i Annual indexes for 1929-46 are, respectively: 38.4, 32.0, 26.5, 20.7,24.4, 26.6,30.7, 36.3,39.7, 31.4, 38.3,43.9,56.4, 69.3, 82.9, 81.7, 70.5, and 59.5.
J Also includes apparel and consumer staples, not shown separately.1 Preliminary.* Not available.
Source: Board of Governors of the Federal Reserve System.
246
Digitized for FRASER http://fraser.stlouisfed.org/ Federal Reserve Bank of St. Louis
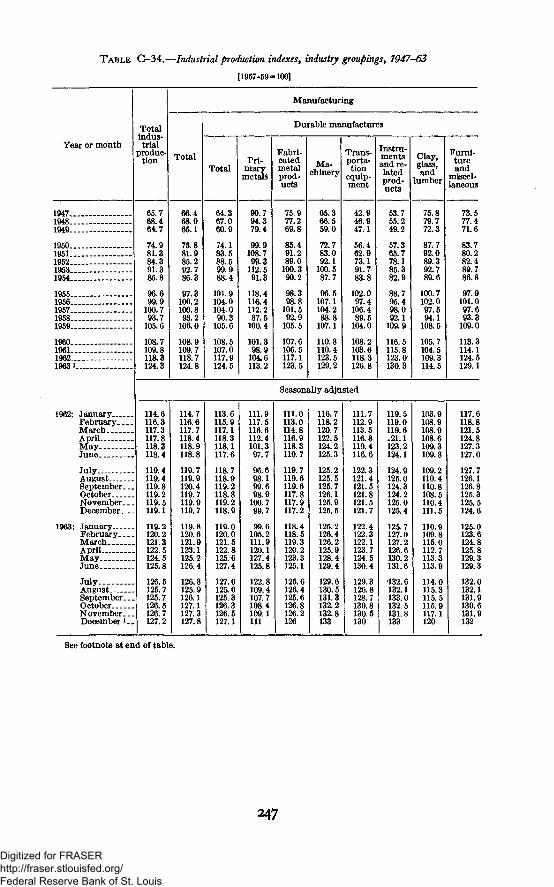
TABLE G-34.—Industrial production indexes, industry groupings, 7947-63
[1957-59=100]
Year or month
Totalindus-trial
produc-tion
Manufacturing
Total
Durable manufactures
TotalPri-
marymetals
Fabri-catedmetalprod-ucts
Ma-chinery
Trans-porta-tion
equip-ment
Instru-mentsand re-latedprod-ucts
Clay,glass,and
lumber
Furni-tureand
miscel-laneous
1947..1948..1949..
1950..1951. .1952..1953_.1954.
1955..1956._1957..1958..1959..
I960 . . .1961. . .1962...1963 1..
1962: January.. . .February..MarchAprilMayJune
JulyAugustSeptember..OctoberNovember..December. _
1963: JanuaryFebruary...MarchAprilMayJune ...
JulyAugustSeptember.OctoberNovember..December l.
65.768.464.7
74.981.384.391.385.8
96.699.9
100.793.7
105.6
108.7109.8118.3124.3
66.468.965.1
75.881.985.292.786.3
97.3100.2100.893.2
106.0
108.9109.7118.7124.8
64.367.060.9
74.183.588.599.988.4
101.9104.0104.090.3
105.6
108.5107.0117.9124.5
90.794.379.4
99.9108.799.3
112.591.3
118.4116.4112.287.5
100.4
101.398.9
104.6113.2
75.977.2
85.491.289.0
100.390.2
98.398.8
101.592.9
105.5
107.6106.5117.1123.5
65.366.559.0
72.783.092.1
100.587.7
96.5107.1104.288.8
107.1
110.8110.4123.5129.2
42.946.947.1
56.462.973.191.7
102.097.4
106.489.5
104.0
108.2103.6118.3126.8
53.755.249.2
57.365.778.185.3
88.795.498.092.1
109.9
116.5115.8123.0130.3
75.879.772.3
87.792.089.392.7
100.7102.097.594.1
108.5
105.7104.5109.3114.5
Seasonally adjusted
114.6116.3117.3117.8118.3118.4
119.4119.4119.8119.2119.5119.1
119.2120.2121.3122.5124.5125.8
126.5125.7125.7126.5126.7127.2
114.7116.6117.7118.4118.9118.8
119.7119.9120.4119.7119.9119.7
119.8120.6121.9123.1125.2126.4
126.8125.9126.1127.1127.3127.8
113.6115.9117.1118.3118.1117.6
118.7118.9119.2118.8119.2118.9
119.0120.0121.5122.8125.6127.4
127.0125.0125.3126.3126.5127.1
111.9117.5116.6112.4101.397.7
96.698.199.698.9
100.799.7
99.6105.2111.9120.1127.4125.8
122.8109.4107.7108.4109.1111
111.0113.0114.8116.9118.3119.7
119.7119.6119.6117.8117.9117.2
118.4118.5119.3120.2123.3125.1
125.6126.4125.6126.8126.2126
116.7118.2120.7122.5124.2125.3
125.2125.5125.7126.1125.9125.5
125.2126.4126.2125.9128.4129.4
129.6130.5131.3132.2132.8133
111.7112.9113.5116.8119.4116.6
122.3121.4121.5121.8121.5121.7
122.4122.3122.1123.7124.5130.4
129.3126.8128.7130.8130.5130
119.5119.0119.6.21.1123.2124.1
124.9125.0124.3124.2125.0125.4
125.7127.0127.2126.6130.2131.6
•132.6132.1133.0132.5131.8133
103.9108.9108.9108.6109.3109.8
109.2110.4110.8108.5110.4111.5
110.9109.8115.0112.7113.3113.9
114.0115.3115.5115.9117.1120
73.577 A71.6
83.780.282.489.786.8
97.9101.097.693.3
109.0
113.3114.1124.5129.1
117.6118.8121.5124.8127.3127.0
127.7126.1126.8125.3125.5124.6
125.0123.6124.8125.8129.3129.3
132.0132.1131.9130.6131.9132
See footnote at end of table.
247
Digitized for FRASER http://fraser.stlouisfed.org/ Federal Reserve Bank of St. Louis
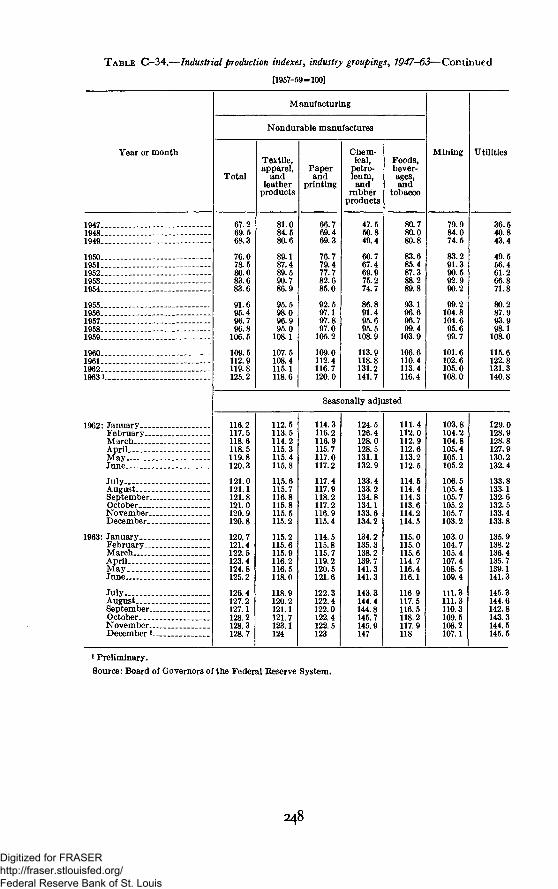
TABLE C-34.—Industrial production indexes, industry groupings, 7947-63— Continued
[1957-59=100]
Year or month
Manufacturing
Nondurable manufactures
Total
Textile,apparel,
andleather
products
81.084.580.6
89.187.489.590.786.9
95.598.096.995.0
108.1
107.5108.4115.1118.6
Paperand
printing
66.769.469.3
76.779.477.782.685.0
92.597.197.897.0
105.2
109.0112.4116.7120.0
Chem-ical,
petro-leum,and
rubberproducts
47.550.849.4
60.767.469.975.274.7
86.891.495.695.5
108.9
113.9118.8131.2141.7
Foods,bever-ages,and
tobacco
Mining Utilities
1947.1948-.1949-.
1950..1951..1952-1953..1954..
1955-1956-1957-1958-1959-
1960..1961-1962_.1963 i.
1962: JanuaryFebrua ry -March-AprilMayJune
JulyAugustSeptember-OctoberNovember..December—
1963: JanuaryFebruary-..MarchAprilMayJune
JulyAugustSeptember-OctoberNovember .December 1
67.269.568.3
76.078.580.083.683.6
91.695.496.796.8
106.5
109.5112.9119.8125.2
80.780.080.8
83.685.487.388.289.8
93.196.696.799.4
103.9
106.6110.4113.4116.4
Seasonally adjusted
79.984.074.5
83.291.390.592.990.2
99.2104.8104.695.699.7
101.6102.6105.0108.0
116.2117.5118.6118.5119.8120.3
121.0121.1121.8121.0120.9120.8
120.7121.4122.5123.4124.8125.2
126.4127.2127.1128.2128.3128.7
112.5113.5114.2115.3115.4115.8
115.6115.7116.8115.8115.5115.2
115.2115.6115.9116.2116.5118.0
118.9120.2121.1121.7123.1124
114.3116.2116.9115.7117.0117.2
117.4117.9118.2117.2116.9115.4
114.5115.8115.7119.2120.5121.6
122.3122.4122.0122.4122.5123
124.5126.4128.0128.5131.1132.9
133.4133.2134.8134.1133.6134.2
134.2135.3138.2139.7141.3141.3
143.3144.4144.8145.7145.9147
111.4112.0112.9112.6113.2112.5
114.5114.4114.3113.6114.2114.5
115.0115.0115.6114.7116.4116.1
116.9117.5116.5118.2117.9118
103.8104.2104.8105.4105.1105.2
106.5105.4105.7105.2105.7103.2
103.0104.7105.4107.4108.5109.4
111.3111.3110.3109.5108.2107.1
36.540.843.4
49.556.461.266.871.8
80.287.993.998.1
108.0
115.6122.8131.3140.8
129.0128.9128.8127.9130.2132.4
133.8133.1132-6132.5133.4133.8
135.9138.2136.4135.7139.1141.3
145.3144.6142.8143.3144.5145.5
1 Preliminary.
Source: Board of Governors of the Federal Reserve System.
248
Digitized for FRASER http://fraser.stlouisfed.org/ Federal Reserve Bank of St. Louis
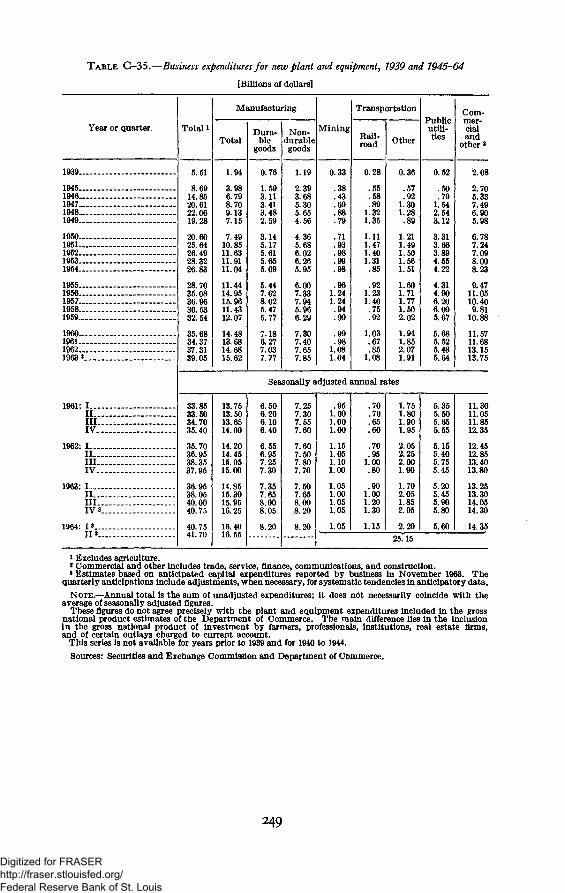
T A B L E C—35.—Business expenditures for new plant and equipment, 7939 and 1945-64
[Billions of dollars]
Year or quarter. Total i
Manufacturing
TotalDura-
blegoods
Non-durable
goods
Mining
Transportation
Rail-road Other
Publicutili-ties
Com-mer-cialand
other *
1939—
1945—1946...1947...1948—1949—
1950—1951—.1952....1953—1954—
1955—1956—1957—1958...1959....
I960—.1961—1962—1963 3..
1961: I —II..III.IV..
1962: I....II...III..IV..
1963: I—.II...III..IV a
1964: I».-.II».
5.51
14.8520.6122.0619.28
20.6025.6426.4928.3226.83
28.7035.0836.9630.5332.54
35.6834.3737.3139.05
1.94
3.986.798.709.137.15
7.4910.8511.6311.9111.04
11.4414.9515.9611.4312.07
14.4813.6814.6815.62
0.76
1.593.113.413.482.59
3.145.175.615.655.09
5.447.628.025.475.77
7.186.277.037.77
1.19
2.393.685.305.654.56
4.365.686.026.265.95
6.007.337.945.966.29
7.307.407.657.85
0.33
.38
.43
.79
.71
.961.241.24.94
.99
1.081.04
0.28
.55
.58
.891.321.35
1.111.471.401.31.85
.921.231.40.75.92
1.03.67.85
1.08
0.36
.57
.921.301.28
1.211.49.50.56.51
.60
.71
.77
.502.02
1.941.852.071.91
Seasonally adjusted annual rates
33.8533.5034.7035.40
35.7036.9538.3537.95
36.9538.0540.0040.75
40.7541.70
13.7513.5013.6514.00
14.2014.4515.0515.00
14.8515.3015.9516.25
16.4016.55
6.506.206.106.40
6.556.957.257.30
7.357.658.008.05
8.20
7.257.307.557.60
7.607.507.807.70
7.507.658.008.20
8.20
.951.001.001.00
1.151.051.101.00
1.051.001.051.05
.70
.70
.65
.60
.70
.951.00.80
.901.001.201.30
1.751.801.901.95
2.052.252.001.90
1.702.051.852.05
1.05 1.15 2.20 5.
25.15
0.52
.50
.791.542.543.12
3.313.663.894.554.22
4.314.906.206.095.67
5.685.525.485.64
5.355.505.655.55
5.155.405.755.45
5.205.455.905.80
2.08
2.705.337.496.905.98
6.787.247.098.008.23
9.4711.0510.409.81
10.88
11.5711.6813.1513.75
11.3011.0511.8512.35
12.4512.8513.4013.80
13.2513.3014.0514.30
14.35
1 Excludes agriculture.* Commercial and other includes trade, service, finance, communications, and construction.* Estimates based on anticipated capital expenditures reported by business in November 1963. The
quarterly anticipations include adjustments, when necessary, for systematic tendencies in anticipatory data.NOTE.—Annual total is the sum of unadjusted expenditures; it does not necessarily coincide with the
average of seasonally adjusted figures.These figures do not agree precisely with the plant and equipment expenditures included in the gross
national product estimates of the Department of Commerce. The main difference lies in the inclusionin the gross national product of investment by farmers, professionals, institutions, real estate firms,and of certain outlays charged to current account.
This series is not available for years prior to 1939 and for 1940 to 1944.
Sources: Securities and Exchange Commission and Department of Commerce.
249
Digitized for FRASER http://fraser.stlouisfed.org/ Federal Reserve Bank of St. Louis
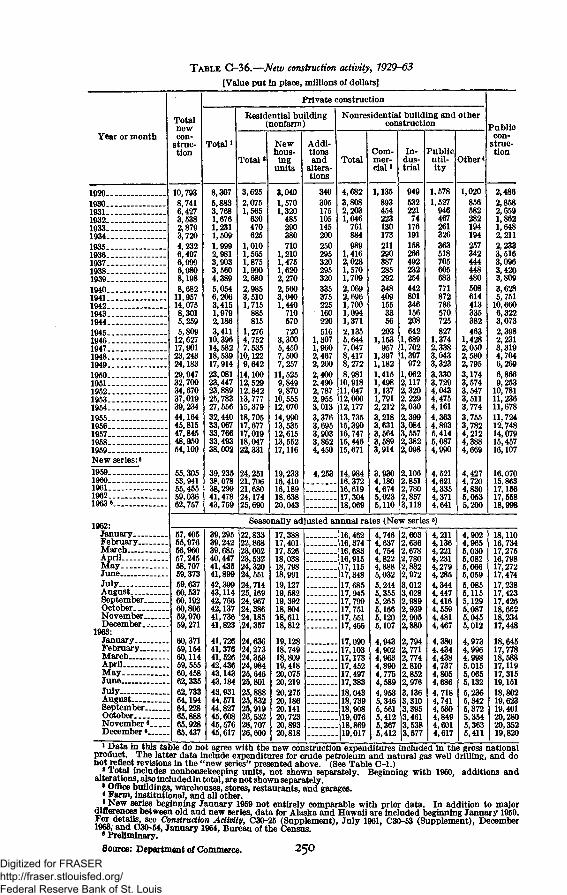
TABLE C-36.—New construction activity, 1929-63
[Value put In place, millions of dollars]
Year or month
192919301931193219331934 -19351936193719381939194019411942 —19431944194519461947194819491950195119521953195419551956195719581959New series:»19591960196119621963«
1962:JanuaryFebruaryMarchAprilMay._JuneJulyAugustSeptemberOctoberNovemberDecember..
1963:JanuaryFebruaryMarchAprilMay._JuneJulyAugustSeptemberOctoberNovember'December •
Totalnewcon-
struc-tion
10,7938,7416,4273,5382,8793,7204,2326,497
6,9808,198
11,95714,0758,3015,2595,80912,62717,90123,24324,18329,94732,70034,67037,01939,23444,16445,81547,84548,95054,109
55,30553,94155,45559,03662,757
Private construction
Total1
Total *
8,3075,8833,7681,6761,2311,5091,9992,9813,9033,5604,3895,0546,2063,4151,9792,1863,41110,39614,58218,53917,91423,08123,44723,88925,78327,55632,44033,06733,76633,49338,002
39,23538,07838,29941,47843,759
Eesidential building(nonfarm)
3,6252,0751,565
630470625
1,0101,5651,8751,9902,6802,9853,5101,715
885815
1,2764,7527,535
10,1229,642
14,10012,52912.84213,77715,37918,70517,67717,01918,04722,331
24,25121,70621,68024,17425,690
Newhous-
ingunits
3,0401,5701,320
485290380710
1,2101,4751,6202,2702,5603,0401,440
710570720
3,3005,4507,5007,257
11,5259,8499,870
10,55512,07014,99013,53512,61513,55217,116
19,23316,41016,18918,63820,043
Addi-tionsand
altera-tions
340305175105145200250295320295320335375225160220516
1,3071,9602,4672,2002,4002.4902,7872,9553,0133,3763,6953,9033,8624,450
4,253
Nonresidential building and otherconstruction
Total
4,6823,8082,2031,046
761884989
1,4162,0281,5701,7092,069
1,7001,0941,3712,1355,6447,0478,4178,2728,981
10,91811,04712,00612,17713,73515,39016,74715,44615,671
14,98416,37216,61917,30418,069
Com-mer-cial*
1,1358934542231301732112903872852923484091553356
2031,153
9571,3971,1821,4151,4981,1371,7912,2123,2183,6313,5643,5893,914
4,1804,6745,0235,110
In-dus-trial
Publicutil-ity
94953222174
176191158266492232254442801346156208642
1,6891,7021,397
9721,0622,1172,3202.2292,030
3,0843,5572,3822,098
2,1062,8512,7802,8573,118
Other*
1,5781.527
946467261326363518705605683771872786570725827
1,3742,3383,0433,3233,3303,7294,0434,4754,1614,3634,8935,4145,0874,990
4,5214,6214,3354,3714,641
Publiccon-
struc-tion
1,020856582282194194257342444448480508614413335382463
1,4282,0502,5802,7953,1743,5743,5473,5113,7743,7553,7824,2124,3884,669
4,4274,7204,8305,0535,200
Seasonally adjusted annual rates (New series«)
57,40555,97656,96057,24558,70759,37359,63760,53760,19260,80659,97059,271
60,37159,15460,11459,55560,45862,33562,73364,19464,22865,88865,92865,437
39,29539,24239,68540,44741,43541,89942,39943,11442,76642,13741,73641,823
41,72641,37641,62642,43643,14343,18443,93144,57144,82745,60845,57645,617
22,83322,86823,00223,53224,32024,55124,71425,16924,96724,38624,18524,357
24,63624,27324,35324,98425,64625,80125,88825,83225,91926,53226,70726,600
17,38817,40117,52618,03818, 79818,99119,12719,58219,39218,80418,61118,812
19,12818,74918,80919,41820,07520,21920,27520,18620,14120,72320,89320,818
2,4862,8582,6591,8621,6482,2112,2333,5163,0963,4203,8093,6285,751
10,6606,3223,0732,3982,2313,3194,704
9,25310,78111,23611,67811,72412,74814,07915,45716,107
16,07015,86317,18617,55818,998
16,46216,37416,68316,91517,11517,34817,68517,94517,79917,75117, 55117,466
17,09017,10317,17317,45217,49717,38318,04318,73918,90819,07618,86919,017
4,7464,6374,7544,8224,8885,0325,2445,3555,2655,1665,1205,107
4,9434,9024,9634,8904,7754,5894,9535,3465,5615,4125,3675,412
2,6032,6362,6782,7802,8822,9723,0123,0282,9892,9392,9052,880
2,7942,7712,7742,8102,8522,9763,1363,3103,3953,4613,5383,577
4,2114,1364,2214,2314,2794,2854,3444,4474,4164,5594,4814,467
4,3804,4344,4384,7374,8054,6864,7184,7414,5804,8494,6014,617
4,9024,9655,0305,0825,0665,0595,0855,1155,1295,0875,0455,012
4,9734,9964,9985,0155,0655,1325,2365,3425,3725,3545,3635,411
18,11016,73417,27516,79817,27217,47417,23817,42317,42618,66818,23417,448
18,64517,77818,58817,11917,31519,15118,80219,62319,40120,28020,35219,820
1 Data in this table do not agree with the new construction expenditures included in the gross nationalproduct. The latter data include expenditures for crude petroleum and natural gas well drilling, and donot reflect revisions in the "new series" presented above. (See Table O-l.)
I Total includes nonhousekeeping units, not shown separately. Beginning with 1960, additions andalterations, also included in total, are not shown separately.
! Office buildings, warehouses, stores, restaurants, and garages.* Farm, institutional, and all other.• New series beginning January 1959 not entirely comparable with prior data. In addition to major
differences between old and new series, data for Alaska and Hawaii are included beginning January 1959.For details, see Construction Activity, C30-25 (Supplement), July 1961, C30-53 (Supplement), December1963, and C30-54, January 1964, Bureau of the Census.
e Preliminary.Source: Department of Commerce. 250
Digitized for FRASER http://fraser.stlouisfed.org/ Federal Reserve Bank of St. Louis
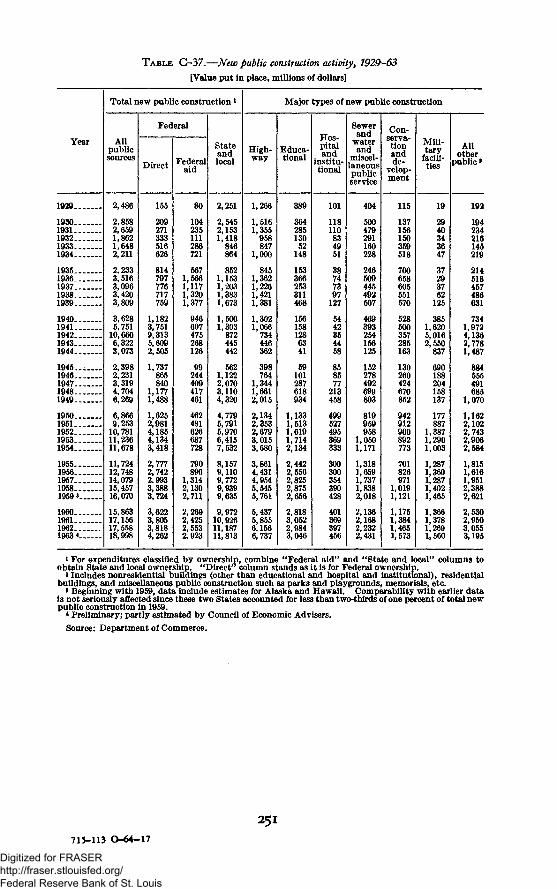
TABLE C-37.—New public construction activity, 1929-63
[Value put in place, millions of dollars]
Year
1929.
19301931193219331934
19351936193719381939
1940.1941194219431944
1 9 4 5 - - — . .1946194719481949-
19501951195219531954
1955.1956195719581959 3
19601-96119621963 «
Total new public construction l
Allpublicsources
2,486
2,8582,6591,8621,6482,211
2,2333,5163,0963,4203,809
3,6285,751
10,6606,3223,073
2,3982,2313,3194,7046,269
6,8669,253
10,78111,23611,678
11,72412,74814,07915,45716,070
15,86317,15617,55818,998
Federal
Direct
155
209271333516626
814797776717759
1,1823,7519,3135,6092,505
1,737865840
1,1771,488
1,6252,9814,1854,1343,418
2,7772,7422.9933,3883,724
3,6223,8053,8184,262
Federalaid
80
104235111286721
5671,5661,1171,3201,377
946697475268126
99244409417461
462481626687728
790896
1,3142,1302,711
2,2692,4252,5532,923
Stateandlocal
2,251
2,5452,1531,418
846864
8521,1531,2031,3831,673
1,5001,303
872445442
5621,1222,0703,1104,320
4,7795,7915,9706,4157,532
8,1579,1109,7729,9399,635
9,97210,92611,18711,813
Major types of new public construction
High-way
1,266
1,5161,355
958847
1,000
8451,3621,2261,4211,381
1,3021,066
734446362
398764
1,3441,6612,015
2,1342,3532,6793,0153,680
3,8614,4314,9545,5455,761
5,4375,8556,1566,737
Educa-tional
389
36428513052
148
153366253311468
1561581286341
59101287618934
1,1331,5131,6191,7142,134
2,4422,5562,8252,8752,656
2,8183,0522,9843,046
Hos-pitaland
institu-tional
101
118110834951
38747397
127
5442354458
858577
213458
499527495369333
300300354390428
401369397456
Sewerand
waterand
miscel-laneouspublicservice
404
500479291160228
246509445492507
469393254156125
152278492699803
819959958
1,0501,171
1,3181,6591,7371,8382,018
2,1362,1682,2322,431
Con-serva-tionandde-
velop-ment
115
137156150359518
700658605551570
528500357285163
130260424670852
942912900892773
701826971
1,0191,121
1,1751,3841,4651,573
Mili-tary
facili-ties
19
2940343647
37293762
125
3851,6205,0162,550
837
690188204158137
177887
1,3871,2901,003
1,2871,3601,2871,4021,465
1,3661,3781,2691,560
Allother
public *
193
194234218145219
214518457486631
7341,9724,1362,7781,487
884555491685
1,070
1,1622,1022,7432,9062,584
1,8151,6161,9512,3882,621
2,5302,9503,0553,195
* For expenditures classified by ownership, combine "Federal a id" and "State and local" columns toobtain State and local ownership. "Direct" column stands as it is for Federal ownership.
* Includes nonresidential buildings (other than educational and hospital and institutional), residentialbuildings, and miscellaneous public construction such as parks and playgrounds, memorials, etc.
* Beginning with 1959, data include estimates for Alaska and Hawaii. Comparability with earlier datais not seriously affected since these two States accounted for less than two-thirds of one percent of total newpublic construction in 1959.
4 Preliminary; partly estimated by Council of Economic Advisers.
Source: Department of Commerce.
251715-11J O-64-17
Digitized for FRASER http://fraser.stlouisfed.org/ Federal Reserve Bank of St. Louis
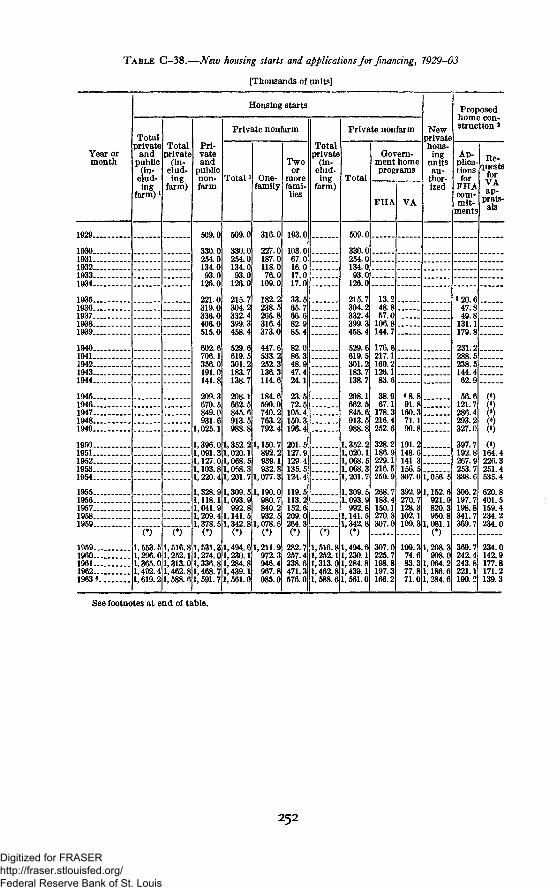
TABLE C-38.—New housing starts and applications for financing, 1929-63
[Thousands of units]
Year ormonth
1929
19301931193219331934 ._
19351936193719381939
19401941194219431944
19451946194719481949
195019511952.19531954
1955195619571958.. _1959
19591960196119621963 6
Housing starts
Totalprivate
andpublic
(in-clud-ing
farm)1
(*)
1,553. 51,296.01,365.01,492.41,619.2
Totalprivate
(in-clud-ing
farm)
(*)
1,516.81,252.11,313.01,462.81, 588. 6
Pri-vateand
publicnon-farm
509.0
330.0254.0134.093.0
126.0
221.0319.0336.0406.0515.0
602.6706.1356.0191.0141.8
209.3670.5849.0931.6
1,025.1
1,396.01,091.31,127.01,103.81,220.4
1,328.91,118.11,041.91,209.41,378.5
(*)
1,531.31,274.01,336.81,468.71,591.7
Private nonfarm
Total »
509.0
330.0254.0134.093.0
126.0
215.7304.2332.4399.3458.4
529.6619.5301.2183.7138.7
208.1662.5845.6913.5988.8
1,352.21,020.11,068.51,068.31,201.7
1,309.51,093.9
992.81,141.51,342.8
(*)
1,494.61,230.11,284.81,439.11,561.0
One-family
316.0
227.0187.0118.076.0
109.0
182.2238.5265.8316.4373.0
447.6533.2252.3136.3114.6
184.6590.0740.2763.2792.4
1,150.7892.2939.1932.8
1,077.3
1,190.0980.7840.2932.5
1,078.5(*)
1,211.9972.3946.4967.8985.0
Twoor
morefami-lies
193.0
103.067.016.017.017.0
33.565.766.682.985.4
82.086.348.947.424.1
23.572.5
105.4150.3196.4
201.5127.9129.4135.5124.4
119.5113.2152.6209.0264.3(*)
282.7257.4338.6471.3576.0
Totalprivate
(in-clud-ing
farm)
(*)
1,516.81,252.11,313.01,462.81,588.6
Private nonfarm
Total
509.0
330.0254.0134.093.0
126.0
215.7304.2332.4399.3458.4
529.6619.5301.2183.7138.7
208.1662.6845.6913.5988.8
1,352.21,020.11,068.51,068.31,201.7
1,309.51,093.9
992.81,141. 51,342.8
(*)
1,494.61,230.11,284.81,439.11,561.0
Govern-ment homeprograms
FHA
13.248.857.0
106.8144.7
176.6217.1160.2126.183.6
38.967.1
178.3216.4252.6
328.2186.9229.1216.5250.9
268.7183.4150.1270.3307.0
307.0225.7198.8197.3166.2
VA
*8.891.8
160.371.190.8
191.2148.6141.3156.5307.0
392.9270.7128.3102.1109.3
109.374.683.377.871.0
Newprivatehous-ing
unitsau-
thor-ized
-------
1,056.5
1,152. 6921.9820.3950.8
1,081.1C)
1,208.3998.0
1,064.21,186.61,284. 6
Proposedhome con-struction 3
plica-tionsfor
FHAcom-mit-
ments
3 20.647:849.8
131.1179.8
231.2288.5238.5144.462.9
56.6121.7286.4293.2327.0
397.7192.8267.9253.7338.6
306.2197.7198.8341.7369.7
369.7242.4243.8221.1190.2
Re-quests
forVAap-
prais-als
(*)/ j \
( * )/ 8 \
(*)164.4226.3251.4535.4
620.8401.5159.4234.2234.0
234.0142.9177.8171.2139.3
See footnotes at end of table.
252
Digitized for FRASER http://fraser.stlouisfed.org/ Federal Reserve Bank of St. Louis
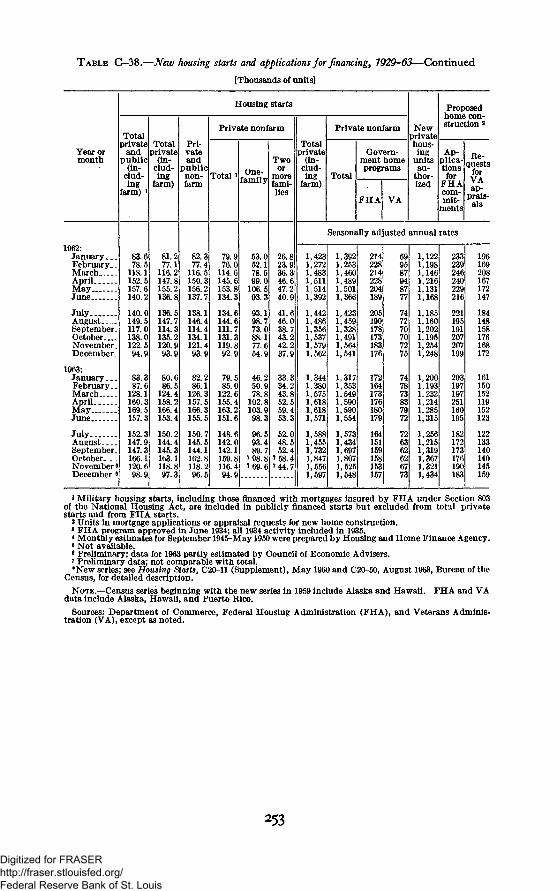
TABLE C-38.—New housing starts and applications for financing, 1929-63—Continued
[Thousands of units]
Year ormonth
Totalprivate
andpublic
(in-clud-ing
farm)
Housing starts
Totalprivate
(in-clud-ing
farm)
Pri-vateand
publicnon-farm
Total
Private nonfarm
One-family
Twoor
morefami-lies
Totalprivate
(in-clud-ing
farm)
Private nonfarm
Total
Govern-ment homeprograms
F H A VA
Newprivatehous-ing
unitsau-
thor-ized
Proposedhome con-struction 3
Ap-plica-tionsfor
FHAcom-mit-
ments
Re-quests
forVAap-
prais-als
Seasonally adjusted annual rates
1962:January. __February..MarchAprilMay -June _-
JulyAugustSeptember.OctoberNovember.December.
1963:January. __February..MarchAprilMayJune
JulyAugustSeptember.OctoberNovember«December
83.678.5
118.1152.5157.6140.2
140.0149.5117.0138.0122.594.9
83.387.6
128.1160.3169.5157.3
152.3147.9147.3166.1120.698.9
81.277.1
116.2147.8155.2136.8
136.5147.7114.3135.2120.993.9
80.86.5
124.4158.2166.4153.4
150.2144.4145.3163.1118.897.3
82.377.4
116.5150.3156.2137.7
138.1146.4114.4134.1121.493.9
82.286.1
126.3157.5166.3155.5
150.7145.5144.1162.8118.296.5
79.976.0
114.6145.6153.8134.3
134.6144.6111.7131.3119.892.9
79.585.0
122.6155.4163.2151.6
148.6142.0142.1159.8116.494.9
53.052.178.599.0
106.593.3
93.198.773.088.177.654.9
46.50.978.8
102.8103.9
96.593.489.
26.823.936.346.647.240.9
41.646.038.743.242.237.9
33.334.243.852.559.453.3
52.048.552.4
7 58.47 44.7
1,4231,272
1,4421,4861,3561,5371,5791,562
1,3441,3801,5751,6181,6181,571
1,5881,4551,7321,8471,5561,597
1,3921,2531,4601,4891,5011,366
1,4231,4591,3281,4911,5641,541
1,3171,3531,5491,5901,5901,554
1,5731,4341,6971,8071,5251,548
214228214228204189
205190178173183176
172164173176180179
164151159158153157
699587948777
747270707275
747873837972
726362626773
]:
]
]i:
:]
]i]
]
i]
L,1221,1981,146L,216L,1311,168
L,1851,1601,2021,1951,2541,248
L,200L,1931,2321,214L,285L,315
1,2561,215L,3191,3671,3211,434
233239246240229216
221195191207207199
203197197251160195
182172173176190183
196169208167172147
184148158176168172
161150152119152123
122133140140145159
* Military housing starts, including those financed with mortgages insured by FHA under Section 803of the National Housing Act, are included in publicly financed starts but excluded from total privatestarts and from FHA starts.
2 Units in mortgage applications or appraisal requests for new home construction.3 FHA program approved in June 1934; all 1934 activity included in 1935.* Monthly estimates for September 1945-May 1950 were prepared by Housing and Home Finance Agency.8 Not available.8 Preliminary; data for 1963 partly estimated by Council of Economic Advisers.7 Preliminary data; not comparable with total.*New series; see Housing Starts, C20-11 (Supplement), May 1960 and C20-50, August 1963, Bureau of the
Census, for detailed description.NOTE.—Census series beginning with the new series in 1959 include Alaska and Hawaii. FHA and VA
data include Alaska, Hawaii, and Puerto Rico.Sources: Department of Commerce, Federal Housing Administration (FHA), and Veterans Adminis-
tration (VA), except as noted.
253
Digitized for FRASER http://fraser.stlouisfed.org/ Federal Reserve Bank of St. Louis
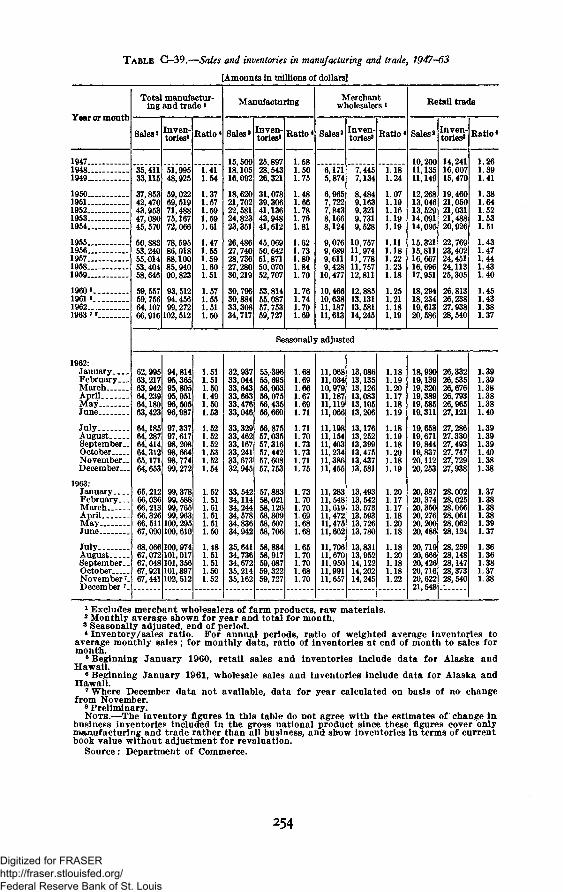
TABLE C-39.—Sales and inventories in manufacturing and trade, 1947-63
[Amounts in millions of dollars)
Year or month
1947...1948...1949...
1950...1951...1952...1953...1954...
1955...1956...1957...1958...1959...
1960«..19616..1962..._.1963 i«_.
1962:JanuaryFebruary. . .MarchAprilMayJune
J u l y . . .AugustSeptember.OctoberNovember.December..
1963:JanuaryFebruary..MarchAprilMayJune
JulyAugustSeptember.OctoberNovember»December K
Total manufactur-ing and t rade l
Sales 3
35,41133,115
37,85342,47043,95347,08045,570
50,88353,24055,01453,40458,646
Inven-tories'
51,99548,925
59,02269,51971,48875,16772,066
78,59586,01888,10085,94090,823
59,55759,75664,10766,916 102,512
93,51294,45699,272
Ratio
1.411.54
1.371.571.591.591.61
1.471.551.591.601.51
1.571.551.511.50
Manufacturing
Sales» Inven-tories"
15,50018.10516,092
18,62021,70222,58124,82323,351
26,48627,74028,73627,28030,219
30,79630,88433,30834,717
25,89728,54326,321
31,07839,30641,13643,94841,612
45,06950,64251,87150,07052,707
53,81455,08757, 75359,727
Ratio *
1.581.501.75
1.481.661.78.76.81
.62
.73
.80
.84
.70
.76
.74
.70
Merchantwholesalers i
Sales 2
6,1715,874
6,9657,7227,8438,1668,124
9,0769,6899,6119,428
10,477
10,46610,63811,18711,613
Inven-tories*
7,4457,134
8,4849,1639,3219,7319,528
10,75711,97411,77811,75712,811
12,88513,13113,58114,245
Ratio *
1.071.191.161.191.19
1.111.181.221.231.18
1.251.211.181.19
Retail trade
Sales)
10,20011,13511,149
12,26813,04613,52914,09114,095
15,32115,81116,66716,69617,951
18,29418,23419,61320,586
Inven-tories*
14,24116,00715,470
19,46021,05021,03121,48820,926
22,76923,40224,45124,11325,305
26,81326,23827,93828,540
Ratio*
Seasonally adjusted
62,99563,21763,94264,23964,18063,423
64,18564,28764,41464,31265,17164,653
65,21266,03666,21366,32666, 51167,090
68,06667,07267,04867,92167,441
94,81495,36595,80595,95196,50596,987
97,33797,61798,20898,66498,77499,272
99,37899,58899,76599,963100,295100,610
100,974101,017101,356101,897102,512
L.511.511.50L.49L.50L.53
1.521.52L.52L.53L.52L.54
L.521.511.51L.51L.51L.50
1.481.511.511.501.52
32,93733,04433,64333,66333,47633,046
33,32933,46233,16733,24133,67332,945
33,54234,11434,24434, 57834,83634,942
35,64134,73634,67235,21435,162
55,39655,69556,00356,07556,43556,660
56,87557,03557,31657,44257,60857,753
57,88358,02158,12658,30958,50758,706
58,88458,91759,08759,32259,727
1.681.691.661.671.691.71
1.711.701.731.731.711.75
1.731.701.701.691.681.68
1.651.701.701.681.70
11,06811,03410,97911,18711,11911,066
11,19811,15411,40311,23411,38611,455
11,28311,54811,61911,47211,47511,662
11,70611,67011,95011,99111,657
13,08613,13513,12613,08313,10513,206
13,17613,25213,39913,47513,43713,581
13,49313,54213,57313, 59313,72613,780
13,83113,95214,12214,20214,245
]]
1.18L.19L.20L.17L.18L.19
L.18L.191.181.201.181.19
1.201.171.17L.18L.20L.18
1.181.201.181.181.22
18,99019,13919,32019,38919,58519,311
19,65819,67119,84419,83720,11220,253
20,38720,37420,35020,27620,20020,486
20,71920,66620,42620,71620,62221,548
26,33226,53526,67626,79326,96527,121
27,28627,33027,49327,74727,72927,938
28,00228,02528,06628,06128,06228,124
28,25928,14828,14728,37328,540
1.261.391.41
1.381.641.521.531.51
1.431.471.441.431.40
1.451.431.381.37
.39
.3838
.38
.40
.39
.39
.39
.40
.38
.3738
.38
.381.391.37
1.361.361.381.371.38
1 Excludes merchant wholesalers of farm products , r aw mater ia ls .2 Monthly average shown for year and total for month.3 Seasonally adjusted, end of period.4 Inventory/sales ratio. For annual periods, ratio of weighted average inventories to
average monthly sales; for monthly data, ratio of inventories at end of month to sales formonth.
5 Beginning January 1960, retail sales and inventories include data for Alaska andHawaii.
6 Beginning January 1961, wholesale sales and inventories include data for Alaska andHawaii.
7 Where December data not available, data for year calculated on basis of no changefrom November.
8 Preliminary.NOTE.—The inventory figures in this table do not agree with the estimates of change In
business inventories included in the gross national product since these figures cover onlymanufacturing and trade rather than all business, and show inventories in terms of currentbook value without adjustment for revaluation.
Source: Department of Commerce.
254
Digitized for FRASER http://fraser.stlouisfed.org/ Federal Reserve Bank of St. Louis
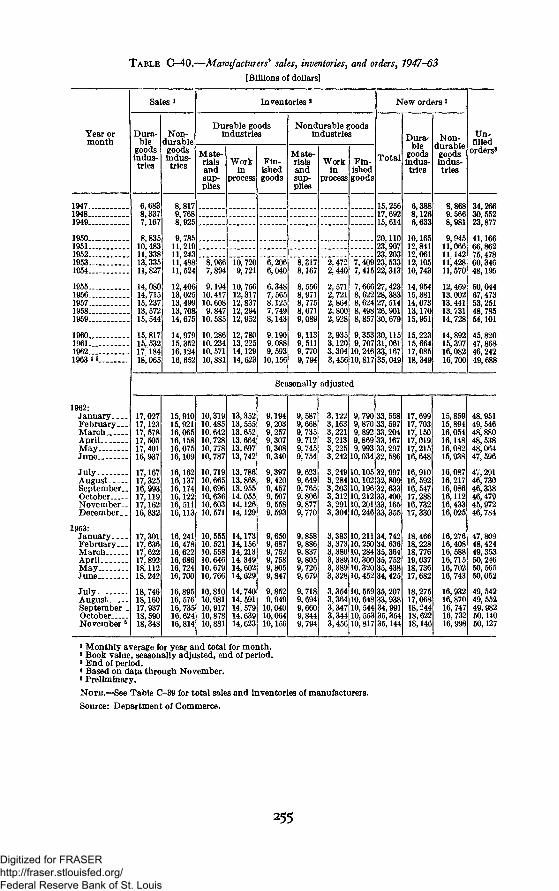
TABLE C—40.—Manufacturers sales, inventories, and orders, 7947-63
[Billions of dollars]
Year ormonth
1947..1948..1949..
1950-1951..1952..1953-1954..
1955-1956-1957-1958-1959..
1960..
1963 * «_.
1962:JanuaryFebruary. . .MarchAprilMayJune
JulyAugustSeptember..OctoberNovember. _December. _
1963:JanuaryFebruary. . .MarchAprilMayJune
JulyAugustSeptember .OctoberNovember 6
Sales *
Dura-ble
goodsindus-tries
6,6838,3377,167
8,83510,48311,33813,33511,827
14,08014,71515,23713,57215,544
15,81715,53217 18418,065
Non-durable
goodsindus-tries
17,02717,12317, 57817,50517,40116,937
17,16717,32516,99317,11917,16216,832
17,30117,63617,62217,89218,11218,242
18,74618,16017,93718,59018,348
8,8179,7688,925
9,78511,21911,24311,48811,524
12,40613,02513,49913,70814,675
14,97915,35216,12416,652
Inventoriesa
Durable goodsindustries
Mate-rialsandsup-plies
Workin
process
8,9667,894
9,19410,41710,6089,847
10, 585
10,28610,23410, 57110,881
10,7209,721
10, 75612,31712,83712,29412,952
12,78013,22514,12914,623
Fin-ishedgoods
6,2066,040
6,3487,5658,1257,7498,143
9,1909,0889,59310,156
Nondurable goodsindustries
Mate-rialsandsup-
8,3178,167
8,5568,9718,7758,671
9,1139,5119,7709, 794
Workin
process goods
2,4722,440
2,5712,7212,8642,8002,928
Fin-ished
Total
2,9353,1203,3043,456 10,817 35,049
New orders l
15,25617,69215,614
20,11023,90723,203
7,409 23,5337,415 22,313
7,666 27,4238,622 28,3838,624 27,5148,498 26,9018,857 30,679
9,353 30,1159,707 31,061
10,246 33,167
Dura'ble
goodsindus-tries
Non-durablegoods iindus-tries
6,3888,1266,633
10,16512,84112,06112,10510,743
14,95415,38114,07313,17015,951
15,22315,66417,08518,349
9,5668,981
9,04511,06611,14211,42811,570
12,46913,00213,44113, 73114,728
14,89215,39716,08216,700
Un-filled
orders8
34,26630,55223,877
41,16666,86275,47860,34648,195
60,04467,47353,25148,78554,101
45,82047, 86846,24249,688
Seasonally adjusted
15,91015,92116,06516,15816,07516,109
16,16216,13716,17416,12216, 51116,113
16,24116,47816,62216,68616,72416, 700
16,89516, 57616,73516,62416,814
10,31910, 48510,64210, 72810, 77810,787
10, 71910,66510,69610, 63610,60310, 571
10, 55510, 52110,55810, 64610, 67910, 766
10,81010,98110,91710,87810,881
13,35213, 55513,65213,66413,69713, 742
13,78613,86813,95514,05514,12614,129
14,17314,15614,21314.34914,60214,629
14, 74014, 59114,57914,63914,623
9,1949,2039,2579,3079,3089,340
9,3979,4209,4579,5079,5589,593
9,6509,6879,7529,7589,8059,847
9,8529,94910,04010,06410,156
9,5879,6689,7359,7129,7459,754
9,6239,6499,7659,8069,8779,770
9,8589,8869,8379,8059,7269,679
9,7189,6949,6609,8449,794
3,1223,1633,2213,2133,2253,242 10,034 32, 586
3,249 10,105 32,3,284 10,3,303 10,196 32i3,312 10,212 33,3.291
3,354
9, 790 33, 5589,870 33,5979,892 33,2049,869 33,1679,993 33,297
1,997102 32,809
1,6331,400
33,16510,201 ,3,304 10,246 33,355
3,383 10,211 34,3,3733.3803,389 10,300 35^ 7523,389 10, ""3,328
3,364 10,648 33,9383 3 0 3 9 13,347 10,544 34,9913,3443,456
320 35,43810, 452 34, 425
10, 559 35,207
10,553 35,35410,817 35,144
17,69917, 70317,15017,01917,21516,648
16,91016, 59216, 54717,28816,73217,330
18,46618,22818, 77619,03718, 73617,682
18,27517,06818,24418,62218,146
15,85915,89416,05416,14816,08215,938
16,08716,21716,08616,11216,43316,025
16,27616, 40816,58816, 71516,70216, 743
16,93216,87016,74716,73216,998
48, 95149, 54648, 88048, 53848,06447, 596
47,29146,73046,33846,47945,97246,784
47, 80948, 42449,35350, 24650, 56550,052
49, 54249, 55249,98250,14050,127
i Monthly average for year and total for month.»Book value, seasonally adjusted, end of period.• End of period.4 Based on data through November.»Preliminary.
NOTE.—See Table C-39 for total sales and inventories of manufacturers.
Source: Department of Commerce.
255
Digitized for FRASER http://fraser.stlouisfed.org/ Federal Reserve Bank of St. Louis
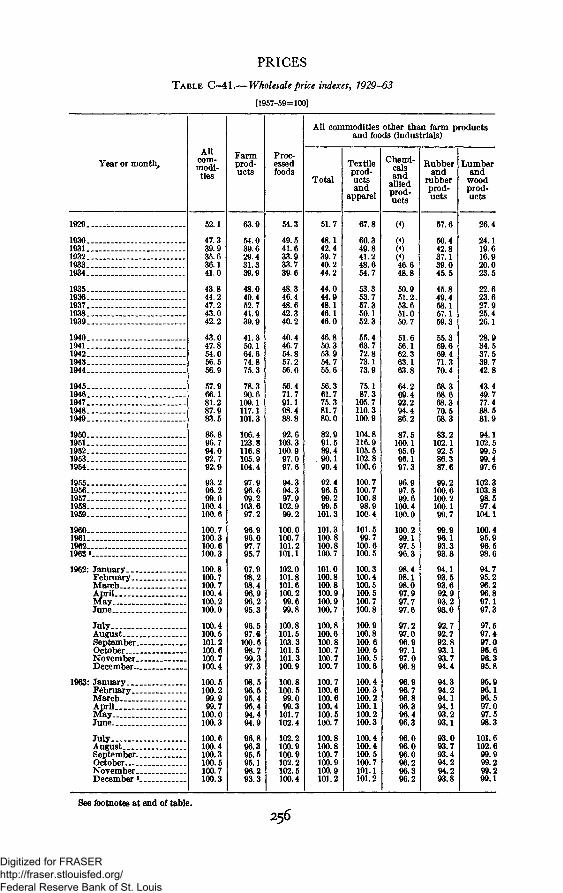
PRICES
TABLE C-41.—Wholesale price indexes, 7929-63
[1957-59=100]
Year or month.
1929
19301931 , _19321933 __1934
19351936193719381939
19401941194219481944 _
1945194619471948 „1949
195019511952 . .19531954 -
19551956 . .195719581959
1960 . _196119621963»
1962: JanuaryFebruaryMarch . «. .AprilMayJune
JulyAugust- .September _. . . _.OctoberNovemberDecember.. _ . .
1963: JanuaryFebruaryMarchAprilMay.June-
JulyAugustSeptember.OctoberNovemberDecember • _
Allcom-modi-
ties
52.1
47.339.935.636.141.0
43.844.247.243.042.2
43.047.854.056.556.9
57.966.181.287.983.5
86.896.794.092.792.9
93.296.299.0
100.4100.6
100.7100.3100.6100.3
100.8100.7100.7100.4100.2100.0
100.4100.5101.2100.6100.7100.4
100.5100.299.999.7
100.0100.3
100.6100.4100.3100.5100.7100.3
Farmprod-ucts
63.9
54.039.629.431.339.9
48.049.452.741.939.9
41.350.164.674.875.3
78.390.6
109.1117.1101.3
106.4123.8116.8105.9104.4
97.996.699.2
103.697.2
96.996.097.795.7
97.998.298.496.996.295.3
96.597.6
100.698.799.397.3
98.596.595.495.494.494.9
96.896.395.595 196 293.3
Proc-essedfoods
54.3
49.541.633.933.739.6
48.346.448.642.340.2
40.446.754.857.256.0
56.471.791.198.488.8
92.6103.3100.997.097.6
94.394.397.9
102.999.2
100.0100.7101.2101.1
102.0101.8101.6100.299.699.8
100.8101.5103.3101.5101.3100.9
100.8100.599.099.3
101.7102.4
102.2100.9100.9102.2102.5100.4
All commodities other than farm productsand foods (industrials)
Total
51.7
48.142.439.740.244.2
44.044.948.146.146.0
46.850.353.954.755.6
56.361.775.381.780.0
82.991.589.490.190.4
92.496.599.299.5
101.3
101.3100.8100.8100.7
101.0100.8100.8100.9100.9100.7
100.8100.6100.8100.7100.7100.7
100.7100.6100.6100.4100.5100.7
100.8100.8100.7100.9100.9101.2
Textileprod-uctsand
apparel
67.8
60.349.841.248.654.7
53.353.757.350.152.3
55.463.772.873.173.9
75.187.3
105.7110.3100.9
104.8116.9105.5102.8100.6
100.7100.7100.898.9
100^4
101.599.7
100.6100.5
100.3100.4100.5100.5100.7100.8
100.9100.8100.6100.5100.5100.6
100.4100.3100.2100.1100.2100.3
100.4100.4100.5100.7101.1101.2
Chemi-calsand
alliedprod-ucts
(<)
(«)(4)(«)46.648.8
50.951.2.53.651.050.7
51.656.162.363.163.8
64.269.492 294.486.2
87.5100.195.096.197.3
96.997.599.6
100.4100.0
100.299.197.596.3
98.498.198.097.997.797.6
97.297.096.997.197.096.8
96.996.796.896.396.496.3
96.096.096.096.296.396.2
Rubberand
rubberprod-ucts
57.6
50.442 837.139.045.5
45.849.458.157.159.3
55.359.669 471.370.4
68.368.668 370.568.3
83.2102.192.586.387.6
99.2100.6100.2100.199.7
99.996.193.393.8
94.193.593.692.993.293.0
92.792.792.893.193.794.4
94.394.294.194.193.293.1
93.093.793.494.294.293.8
Lumberand
woodprod-ucts
26.4
24.119 616.920.023.5
22.623.627.925.426.1
28.934.537.539.742.8
43.449.777.488.581.9
94.1102.599.599.497.6
102.3103.898.597.4
104.1
100.495.996.598.6
94.795.296.296.897.197.3
97.597.497.096.696.395.8
95.996.196.597.097.598.3
101.6102.699.999.299.299.1
See footnotes at end of table.
256
Digitized for FRASER http://fraser.stlouisfed.org/ Federal Reserve Bank of St. Louis
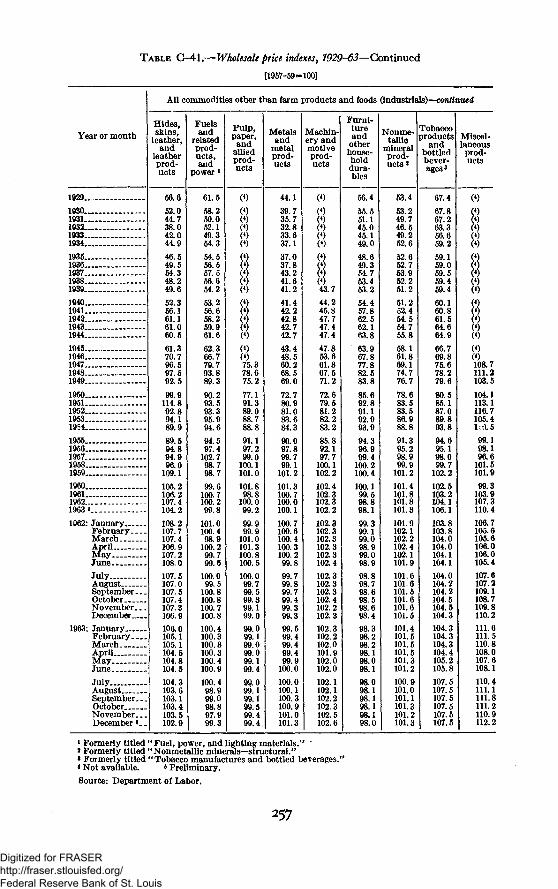
TABLE G-41.—Wholesale price indexes, 1929-63—Continued
[1957-59=100]
Year or month
1929.....
1930....1931....1032....1933....1934....
19351936193719381939
19401941194219431944
19451946194719481949
19501951195219531954
19551956195719581959
1960196119621963 81962: January
February. __MarchAprilMayJune--
JulyAugustSeptember-.OctoberNovember. _December
1963: JanuaryFebruary. _.MarchAprilM a y . . .June
JulyAugustSeptember..OctoberNovember..December «_
All commodities other than farm products and foods (industrials)—continued
Hides,skins,
leather,and
leatherprod-ucts
56.6
52.044.738.042.044.9
46.549.554.348.249.6
52.356.161.161.060.5
61.370.796.597.592.5
114.892.894.189.9
89.594.894.996.0
109.1
105.2106.2107.4104.2
108.2107.7107.4106.9107.2108.0
107.5107.0107.5107.4107.3106.9
106.0105.1105.1104.5104.8104.5
104.3103.6103.1103.4103.5102.9
Fuelsand
relatedprod-ucts,and
power *
61.558.250.052.149.354.3
54.556.557.556.654.2
53.256.658.259.961.6
62.366.779.793.8
90.293.593.395.994.6
94.597.4
102.798.798.7
99.6100.7100.2
101.0100.498.9
100.299.799.6
100.099.5
100.8100.8100.7100.8
100.4100.3100.8100.3100.4100.9
100.498.999.098.897.999.3
Pulp,paper,
andalliedprod-ucts
(*)
(*)( )
(*)(4)
<*)(*>(*)75.378.675.2
77.191.389.088.788.8
91.197.299.0
100.1101.0
101.898.8
100.099.2
99.999.9
101.0101.3100.8100.5
100.099.799.599.399.199.0
99.099.199.099.099.199.4
99.099.199.199.599.499.4
Metalsand
metalprod-ucts
44.1
39.735.732.833.637.1
37.037.843.241.641.2
41.442.242.842.742.7
43.448.5
69.0
72.780.981.083.684.3
90.097.899.799.1
101.2
101.3100.7100.0100.1
100.7100.6100.4100.3100.299.8
99.799.899.799.499.399.399.599.499.499.499.9
100.0
100.0100.1100.3100.9101.0101.3
Machin-ery andmotiveprod-ucts
Furni-tureand
otherhouse-holddura-bles
56.4
55.551.145.045.149.0
48.649.354.753.453.2
54.457.862.562.163.8
63.967.877.882.583.8
85.692.891.192.993.9
94.396.999.4
100.2100.4
100.199.598.898.1
99.399.199.098.999.098.9
98.898.798.698.598.698.4
98.298.298.198.098.1
98.098.198.198.198.198.0
Nonme-tallic
mineralprod-ucts2
Tobaccoproducts
andbottledbever-
53.4
53.249.746.549.252.6
52.652.753.952.251.2
51.252.454,554.755.8
58.161.869.174.776.7
78.683.583.586.988.8
91.395.298.999.9
101.2
101.4101.8101.8101.3
101.9102.1102.2102.4102.1101.9
101.6101.6101.5101.6101.6101.5
101.4101.5101.5101.5101.3101.2
100.9101.0101.1101.3101.2101.3
67.4
67.867.263.356.659.2
59.159.059.559.459.4
60.160.861.564.664.9
66.769.875.678.279.6
80.585.187.089.893.8
94.695.198.099.7
102.2
102.5103.2104.1106.1
103.8103.8104.0104.0104.1104.1
104.0104.2104.2104.5104.5104.3
104.3104.3104.3104.4105.2105.8
107.5107.5107.5107.5107.5107.5
Miscel-laneous
prod-ucts
*)(4)(4(4(*
(*)
111.2103.5
104.1113.1116.7105.41 0.5
99.198.196.6
101.5101.9
99.3103.9107.3110.4
106.7105.6105.6106.0106.0105.4
107.6107.2109.1108.7109.8110.2
111.6111.5110.8108.0107.6108.1
110.4111.1111.8111.2110.9112.2
1 Formerly titled "Fuel, power, and lighting materials." *' Formerly titled "Nonmetallic minerals—structural."« Formerly titled "Tobacco manufactures and bottled beverages."* Not available. »Preliminary.
Source: Department of Labor.
257
Digitized for FRASER http://fraser.stlouisfed.org/ Federal Reserve Bank of St. Louis
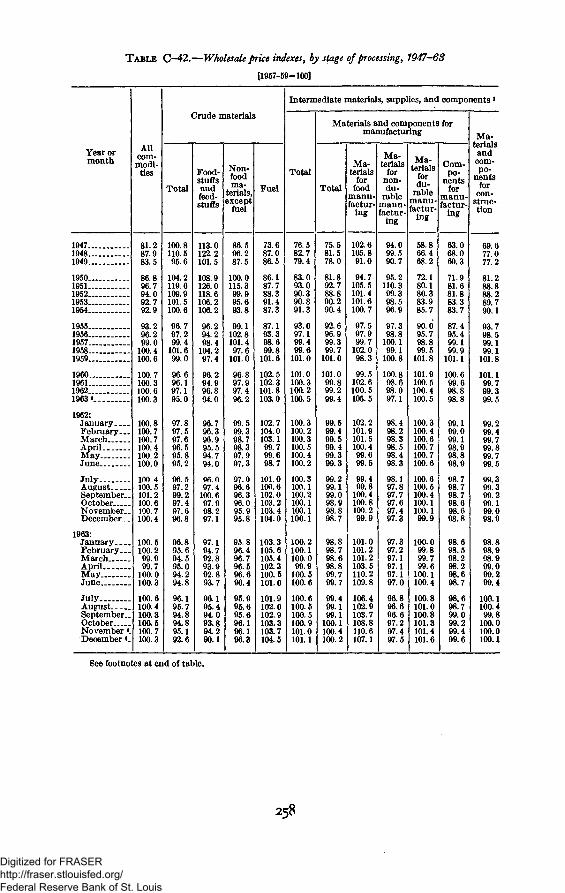
TABLE C-42.—Wholesale price indexes, by stage of processing, 1947-63
[1957-59=100]
Year ormonth
Allcom-modi-ties
Crude materials
Total
100.8110.595.6
104.2119.6109.9101.5100.6
96.797.299.4
101.699.0
96.696.197.195.0
97.897.597.696.595.895.2
96.597.299.297.497.696.8
96.895.694.595.094.294.8
96.195.794.894.895.192.6
Food-stuffsandfeed-stuffs
113.0122.2101.5
108.9126.0118.6106.2106.2
96.294.298.4
104.297.4
96.294.996.894.0
96.796.396.995.594.794.0
96.097.4
100.697.998.297.1
97.194.792.893.992.893.7
96.195.494.093.894.290.1
Non-foodma-
terials,except
fuel
86.596.287.5
100.0115.399.995.693.8
99.1102.8101.497.6
101.0
96.897.997.496.2
99.599.398.798.397.997.3
97.096.696.396.095.995.8
95,896.496.796.596.696.4
95.995.695.696.196.196.3
Fuel
Intermediate materials, supplies, and components *
Total
Materials and components formanufacturing
Total
Ma-terials
forfood
manu-factur-
ing
Ma-terials
fornon-du-
rablemanu-factur-
ing
Ma-terials
fordu-
rablemanu-factur-
ing
Com-po-
nentsfor
manu-factur-
ing
Ma-terialsandcom-po-
nentsfor
con-struc-tion
1947.19481949
19501951195219531954
195519561957.19581959
1960196119621963*
1962:JanuaryFebruary.._MarchAprilMayJune
JulyAugustSeptember.OctoberNovember.December..
1963:JanuaryFebruary. _.MarchAprilMayJune
JulyAugustSeptember..OctoberNovember •December *.
81.287.983.5
86.896.794.092.792.9
93.296.299.0
100.4100.6
100.7100.3100.6100.3
100.8100.7100.7100.4100.2100.0
100.4100.5101.2100.6100.7100.4
100.5100.299.999.7
100.0100.3
100.6100.4100.3100.5100.7100.3
73.687.086.5
86.187.788.391.487.3
87.193.398.699.8
101.6
102.5102.3101.8103.0
102.7104.0103.199.799.698.7
101.0100.6102.0103.2103.4104.0
103.3105.6105.4102.3100.5101.0
101.9102.0102.9103.3103.7104.5
76.582.779.4
83.093.090.390.891.3
93.097.199.499.6
101.0
101.0100.3100.2100.5
100.3100.2100.3100.5100.4100.2
100.3100.1100.2100.1100.1100.1
100.2100.1100.099.9
100.5100.6
100.6100.5100.5100.9101.0101.1
75.581.578.0
81.892.788.890.290.4
92.696.999.399.7
101.0
101.099.899.299.4
99.599.499.599.499.399.3
99.299.199.098.998.898.7
98.898.798.698.899.799.7
99.499.199.1
100.1100.4100.2
102.6105.891.0
94.7105.5101.4101.6100.7
97.597.999.7
102.098.3
99.5102.6100.5105.5
102.2101.9101.5100.499.699.5
99.499.8
100.4100.8100.2
101.0101.2101.2103.5110.2109.8
106.4102.9103.7108.8110.6107.1
94.099.590.7
95.2110.399.398.5
97.398.8
100.199.1
100.8
100.898.698.097.1
98.498.298.398.598.4
98.197.897.797.697.497.3
97.397.297.197.197.197.0
96.896.696.697.297.497.5
58.866.468.2
72.180.180.383.985.7
90.095.798.899.5
101.8
101.9100.5100.4100.5
100.3100.4100.6100.7100.7100.6
100.6100.5100.4100.1100.1
100.099.899.799.6
100.1100.4
100.8101.0100.8101.3101.4101.6
63.068.0
71.981.681.883.383.7
87.495.499.199.9
101.1
100.699.698.898.8
99.199.099.1
98.9
98.798.798.798.698.698.8
98.598.298.298.698.7
98.698.799.099.299.499.6
69.677.077.2
81.288.888.289.790.1
93.798.599.199.1
101.8
101.199.799.399.5
99.299.499.799.899.799.5
99.399.399.299.199.0
98.898.998.999.099.299.4
100.1100.499.8
100.0100.01004
See footnotes at end of table.
258
Digitized for FRASER http://fraser.stlouisfed.org/ Federal Reserve Bank of St. Louis
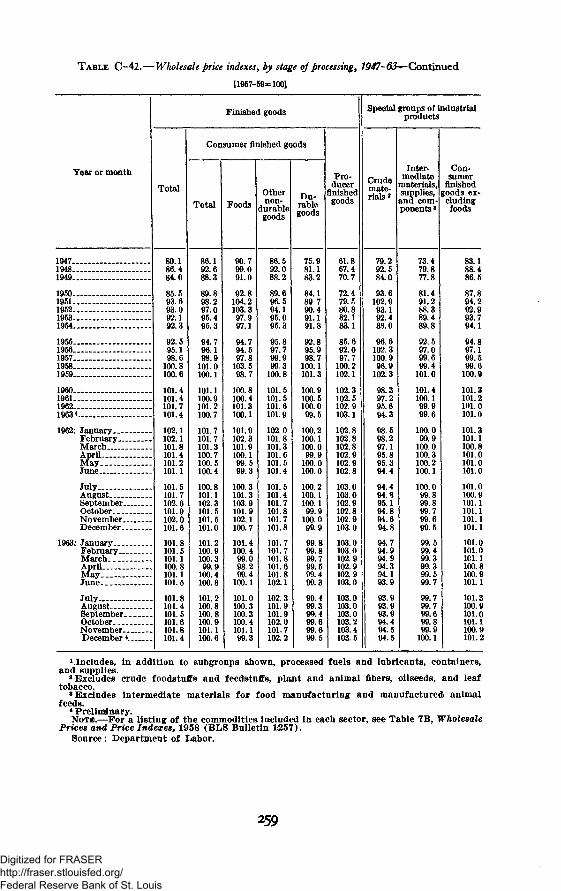
TABLE C-42.—Wholesale price indexes, by stage of processing, 1947- 63— Continued
[1957-59=100]
Year or month
Finished goods
Total
Consumer finished goods
Total Foods
Othernon-
durablegoods
Du-rablegoods
Pro-ducer
finishedgoods
Special groups of industrialproducts
Crudemate-rials a
Inter- !mediate
materials,supplies,and com-ponents 3
Con-sumer
finishedgoods ex-
cludingfoods
1947—1948—1949...
1950-1951-1952-1953-1954-
1955—1956—1957—1958—1959—
1960—1961...1962...1963 *..
1962: January...February-MarchAprilMayJune
July.._AugustSeptember..OctoberNovember-December..
1963: January-_.February-MarchAprilMayJune
JulyAugust- -_September _October...NovemberDecember4
80.186.484.0
85.593.693.092.192.3
92.595.198.6
100.8100.6
101.4101.4101. 7101.4
102.1102.1101.8101.4101.2101.1
101.5101.7102.6101.9102.0101.6
101.8101.5101.1100.8101.1101.5
101.8101.4101.5101.6101.8101.4
86.192.688.3
89.898.297.095.495.3
94.796.198.9
101.0100.1
101.1100.9101.2100.7
101.7101.7101.3100.7100.5100.4
100.8101.1102.3101.5101.5101.0
101.2100.9100.399.9
100.4100.8
101,2100.8100.8100.9101.1100.6
90.799.091.0
92.8104.2103.397.997.1
94.794.597.8
103.598.7
100.8100.4101.3100.1
101.9102.3101.9100.199.599.3
100.3101.3103.9101.9102.1100.7
101.4100.499.098.299.4
100.1
101.0100.3100.3100.4101.199.3
86.592.088.2
89.696.594.195.095.3
95.897.799.999.3
100.8
101.5101.5101.6101.9
102.0101.8101.3101.6101.5101.4
101.5101.4101.7101.8101.7101.8
101.7101.7101.8101.6101.8102.1
102.3101.9101.9102.0101.7102.2
75.981.183.2
84.189 790.491.191.8
92.895.998.7
100.1101.3
100.9100.5100.099.5
100.2100.1100.099.9
100.0100.0
100.2100.1100.199.9
100.0
99.899.799.599.499.3
99.499.399.4
61.867.470.7
72.479.580.882.183.1
85.692.097.7
100.2102.1
102.3102.5102.9103.1
102.8102.8102.8102.9102.9102.8
103.0103.0102.9102.8102.9103.0
103.0103.0102.9102.9102.9103.0
103.0103.0103.0103.2103.4103.5
79.292.584.0
102.993.192.488.0
96.6102.3100.996.9
102.3
98.397.295.694.3
98.598.297.195.895.394.4
94.494.895.194.894.694.8
94.794.994.994.394.193.9
93.993.993.994.494.594.5
73.479.877.8
81.491.288.389.489.8
92.597.099.699.4
101.0
101.4100.1
100.099.9
100.0100.3100.2100.1
100.0
99.5
99.599.499.399.399.599.7
99.799.799.699.899.9
100.1
83.188.486.5
87.894.292.993.794.1
94.897.199.599.6
100.9
101.3101.2101.0101.0
101.3101.1100.8101.0101.0101.0
101.0100.9101.1101.1101.1101.1
101.0101.0101.1100.8100.9101.1
101.3100.9101.0101.1100.9101.2
1 Includes, in addit ion to subgroups shown, processed fuels and lubricants , containers,and supplies.
2 Excludes crude foodstuffs and feedistuffs, plaint and animal fibers, oilseeds, and leaftobacco.
8 Excludes in termediate mater ia ls for food manufac tur ing and manufac tured animalfeeds.
* Prel iminary.N O T E . — F o r a l is t ing of the commodities included in each sector, see Table 7B, Wholesale
Prices and Price Indexes, 1958 (BLS Bullet in 1257) .Source : Depar tment of Laibor.
259
Digitized for FRASER http://fraser.stlouisfed.org/ Federal Reserve Bank of St. Louis
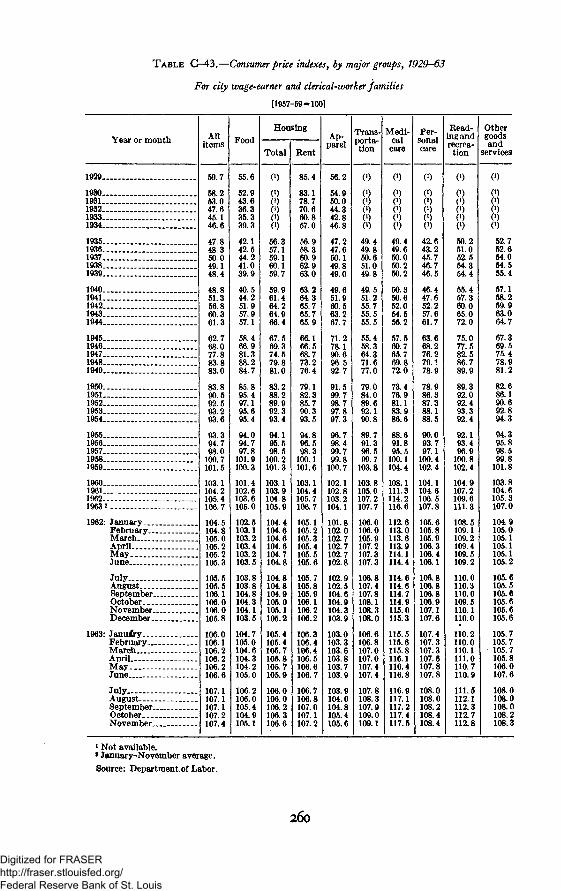
TABLE C—43.—Consumer price indexes, by major groups, 1929—63
For city wage-earner and clerical-worker families
[1957-59=100]
Year or month
1929
198019311932 _19331934
19351936193719381939
19401941194219431944
19451946194719481949
195019511952 .19531954 . . .
1955 .19561957 _19581959
1960196119621963 2
1962: January. _February... _ _March.AprilMay_June
JulyAugustSeptemberOctoberNovember . .December
1963: JanulryFebruaryMarchAprilMayJune. _ _ _ .
July .AugustSeptemberOctoberNovember .
Allitems
59.7
58.253.047.645.146.6
47 848 350.049.148.4
48 851.356 860.361.3
62.768.077 883.883.0
83.890.592.593.293.6
93.394 798.0
100.7101.5
103.1104.2105.4106.7
104.5104.8105.0105.2105.2105.3
105.5105.5106.1106.0106.0105.8
106.0106.1106.2106.2106.2106.6
107.1107.1107.1107 2107.4
Food
55.6
52.943.636.335.339.3
42.142.544.241.039.9
40.544.251.957.957.1
58.466.981.388.284.7
85.895.497.195.695.4
94.094.797.8
101.9100.3
101.4102.6103.6105.0
102.5103.1103.2103.4103.2103.5
103.8103.8104.8104.3104.1103.5
104.7105.0104.6104.3104.2105.0
106.2106.0105.4104.9105.1
Housing
Total
0)
0)(i)( i )
0)0)56.357.159.160.159.7
59.961.464 264.966.4
67.569.374.579.881.0
83.288.289.992.393.4
94.195.598.5
100.2101.3
103.1103.9104.8105.9
104.4104.6104.6104.6104.7104.8
104.8104.8104.9105.0105.1105.2
105.4105.4105.7105.8105.7105.9
106.0106.0106.2106.3106.6
Rent
85.4
83.178.770.660.857.0
56.958.360.962.963.0
63.264.365.765.765.9
66.166.568.773.276.4
79.182.385.790.393.5
94.896.598.3
100.1101.6
103.1104.4105. 7106.7
105.1105.2105.3105.4105.5105.6
105.7105.8105.9106.1106.2106.2
106.3106.4106.4106.5106.6106.7
106.7106.8107.0107.1107.2
Ap-parel
56.2
54.950.044.342.846.8
47 247.650.149.849.0
49.651.960 563.267.7
71.278.190.696.592.7
91.599.798.797.897.3
96.798.499.799.8
100.7
102.1102.8103.2104.1
101.8102.0102 7102.7102 7102.8
102.9102.5104.6104.9104.3103.9
103.0103.3103.6103.8103.7103.9
103.9104.0104.8105.4105.6
Trans-porta-tion
(0
0)(i)
to0)0)49.449.850.651.049.8
49.551.255.755.555.5
55.458.364.371.677.0
79.084.089.692.190.8
89.791.396.599.7
103.8
103.8105.0107.2107.7
106.0106.0105.9107.2107.3107.3
106.8107.4107.8108.1108.3108.0
106.6106.8107.0107.0107.4107.4
107.8108.3107.9109.0109.1
Medi-calcare
(0
(l)(i)(0
849.449.650.050.250.2
50.350.652.054.556.2
57.560.765.769.872.0
73.476.981.183.986.6
88.691.895.5
100.1104.4
108.1111.3114.2116.6
112.6113.0113.6113.9114.1114.4
114.6114.6114.7114.9115.0115.3
115.5115.6115.8116.1116.4116.8
116.9117.1117.2117.4117.5
Per-sonalcare
0)0)(i)
to(>)0)42.643.245.746.746.5
46.447.652.257.661.7
63.668.276.279.178.9
78.986.387.388.188.5
90.093.797.1
100.4102.4
104.1104.6106.5107.8
105.6105.8105.9106.3106.4106.1
106.8106.8106.8106.9107.1107.6
107.4107.3107.3107.6107.8107.8
108.0108.0108.2108.4108.4
Read-ing andrecrea-tion
0)
0)(i)0)0)0)50.251.052.554.354.4
55.457.360.065.072.0
75.077.582.586.789.9
89.392.092.493.392.4
92.193.496.9
100.8102.4
104.9107.2109.6111.3
108.5109.1109.2109.4109.5109.2
110.0110.3110.0109.5110.1110.0
110.2110.0110.1111.0110.7110.9
111.5112.1112.3112.7112.8
Othergoodsand
services
0)
0)0)C1)00)52.752.654.054.555.4
57.158.259.963.064.7
67.369.575.478.981.2
82.686.190.692.894.3
94.395.898.599.8
101.8
103.8104.6105.3107.0
104.9105.0105.1105.1105.1105.2
105.6105.5105.6105.6105.6105.6
105.7105.7105.7105.8106.0107.6
108.0108.0108.0108.2108.3
»Not available.»January-November average.Source: Department, of Labor.
260
Digitized for FRASER http://fraser.stlouisfed.org/ Federal Reserve Bank of St. Louis
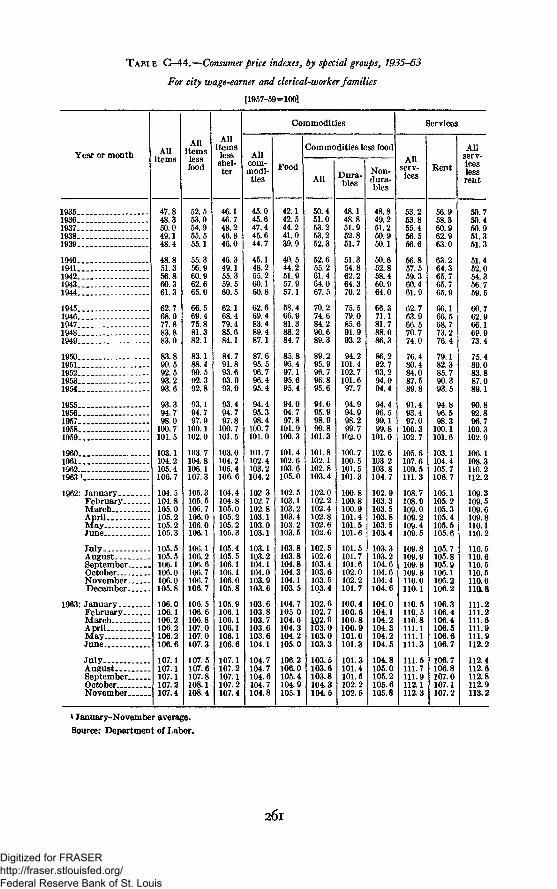
TABLE C—44.—Consumer price indexes, by special groups, 1935-63
For city wage-earner and clerical-worker families
[1957-59=100}
Year or month
19351936193719381939
19401941194219431944 .
19451946194719481949
19.501951195219531954
19551956195719581959
I960 .1961 ._19621963 i _
1962: JanuaryFebruaryMarchApril . .May _.June. .- _.
JulyAugust--SeptemberOctoberNovfimhfirDecember
1963: JanuaryFebruary _.MarchAprilMayJune _ .
July. .AugustSeptember ._OctoberNovember
Allitems
47 848.350.049.148.4
48.851.356.860.361.3
62.768 077.883.883.0
83.890.592.593.293.6
93.394.798.0
100.7101.5
103.1104.2105.4106.7
104.5104.8105.0105.2105.2105.3
105.5105.5106.1106.0106.0105.8
106.0106.1106.2106.2106.2106.6
107.1107.1107.1107.2107.4
Allitemslessfood
52 553.054.955.555.1
55.356.960.962.665.0
66.569.475.881.382.1
83.188.490.592.392.8
93.194.797.9
100.1102.0
103.7104.8106.1107.3
105.3105.5105.7106.0106.0106.1
106.1106.2106.6106.7106.7106.7
106.5106.6106.8107.0107.0107.3
107.5107.6107.8108.1108.4
Allitemslessshel-ter
46.146.748.246.846.0
46.349.155.359.560.5
62.168.479.485.684.1
84.791.893.693.993.9
93.494.797.8
100.7101.5
103.0104.2105.4106.6
104.4104.8105.0105.2105.2105.3
105.4105.5106.1106.1106.0105.8
105.9106.1106.1106.1106.1106.6
107.1107.2107.1107.2107.4
Commodities
Allcom-modi-ties
45.045.647.445.644.7
45.148.255.260.160.8
62.669.483.489.487.1
87.695.596.796.495.4
94.495.398.4
100.7101.0
101.7102.4103.2104.2
102.3102.7102.8103.1103.0103.1
103.1103.2104.1104.0103.9103.6
103.6103.8103.7103.6103.6104.1
104.7104.7104.6104.7104.8
Food
42.142.544.241.039.9
40.544.251.957.957.1
58.466.981.388.284.7
85.895.497.195.695.4
94.094.797.8
101.9100.3
101.4102.6103.6105.0
102.5103.1103.2103.4103.2103.5
103.8103.8104.8104.3104.1103.5
104.7105.0104.6104.3104.2105.0
106.2106.0105.4104.9105.1
Commodities less food
All
50.451.053.253.252.3
52.655.261.464.067.5
70.274.684.290.689.3
89.295.996.796.895.6
94.695.998.999.8
101.3
101.8102.1102.8103.4
102.0102.2102.4102.8102.6102.6
102.5102.6103.4103.6103.5103.4
102. 6102.7IQ2.9103.0103.0103.3
103.5103.6103.8104.3104.5
Dura-bles
48.148.851.952.851.7
51.354.862.264.370.2
75.579.085.691.993.2
94.2101.4102.7101.697.7
94.994.998.299.7
102.0
100.7100.5101.5101.3
100.8100.8100.9101.4101.5101.6
101.5101.7101.6102.0102.2101.7
100.4100.6100.8100.9101.0101.3
101.3101.4101.5102.2102.5
Non-dura-bles
48 849.251.250.950.1
50.652.858.460.964.0
66.371.181.788.086.3
86.292.793.294.094.4
94.496.599.199.8
101.0
102.6103.2103.8104.7
102.9103.3103.5103.8103.5103.4
103.3103.2104.6104.6104.4104.6
104.0104.1104.2104.3104.2104.5
104.8105.0105.2105.6105.8
i
Allserv-ices
53 253.855.456 556.6
56 857.559.360 461.9
62.763 966.570.774 0
76 480.484.087.589.8
91.493.497.0
100.3102.7
105.6107.6109 5111.3
108.7108.9109 0109.2109.4109.5
109.8109.9109.8109.8110.0110.1
110.5110.5110.8111.1111.1111.3
111.5111.7111.9112.1112.3
Services
Rent
56 958 360.962 963 0
63 264 365.765 765.9
66.166 568 773.276 4
79 182.385.790.393.5
94.896.598 3
100.1101.6
103.1104.4105 7106.7
105.1105.2105 3105.4105.5105.6
105.7105.8105.9106.1106.2106.2
106.3106.4106.4106.5106.6106.7
106.7106.81Q7.0107.1107.2
Allserv-iceslessrent
50 750 450 961 351 3
51 452 054.356 759.5
60 762 966 169 973 4
75 480 083.887 089.1
90.892.896 7
100.3102.9
106.1108 3110 2112 2
109 3109.5109 6109.8110.1110.2
110 5110.6110 5110.5110.611Q.8
111.2111.2111.6111.9111.9112.2
112.4112.6112.8112.9113.2
* January-November average.
Source: Department of Labor.
26l
Digitized for FRASER http://fraser.stlouisfed.org/ Federal Reserve Bank of St. Louis
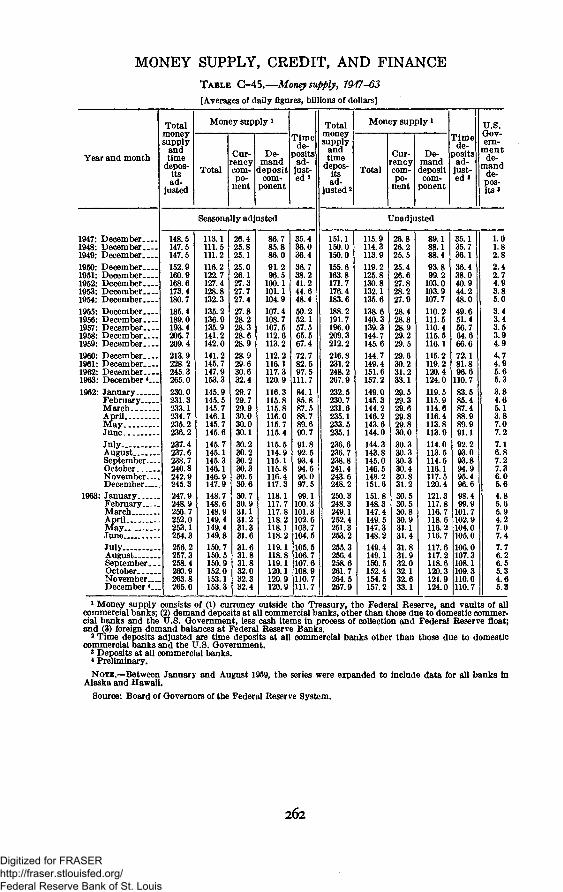
MONEY SUPPLY, CREDIT, AND FINANCETABLE C-45.—Money supply, 1947-63
[Averages of daily figures, billions of dollars]
Year and month
1947: December1948: December1949: December1950: December1951: December1952: December1953: December. . . .1954: December1955: December1956: December. . . .1957: December1958: December.1959: December1960: December1961: December1962: December1963: December*1962: January
FebruaryMarchApril -M a yJuneJuly . .AugustSeptember-_.OctoberNovember. . .December
1963: JanuaryFebruaryMarchApril _MayJuneJulyAugust.September. _OctoberNovember...December *__
Totalmoneysupply
andtime
depos-itsad-
justed
Money supply *
Total
Cur-rencycom-po-
nent
De-mand
depositcom-
ponent
Timede-
positsad-
just-ed a
Seasonally adjusted
148.5147.5147.5152.9160.9168.6173.4180.7185.4189.0193.4206.7209.4213.9228.2245.3265.0230.0231.3233.1234.7235.2236.2237.4237.6238.7240.8242.9245.3247.9248.9250.7252.0253.1254.3256.2257.3258.4260.9263.8265.0
113.1111.5111.2116.2122.7127.4128.8132.3135.2136.9135.9141.2142.0141.2145.7147.9153.3145.9145.5145.7146.1145.7145.6145.7145.1145.3146.1146.9147.9148.7148.6148.9149.4149.4149.8150.7150.5150.9152.0153.1153.3
26.425.825.125.026.127.327.727.427.828.228.328.628.928.929.630.632.429.729.729.930.030.030.130.230.230.230.330.530.630.730.931.131.231.331.631.631.831.832.032.332.4
86.785.886.091.296.5
100.1101.1104.9107.4108.7107.5112.6113.2112.2116.1117.3120.9116.3115.8115.8116.0115.7115.4115.5114.9115.1115.8116.4117.3118.1117.7117.8118.2118.1118.2119.1118.8119.1120.1120.9120.9
35.436.036.436.738.241.244.648.450.252.157.565.567.472.782.597.5
111.784.185.887.588.789.690.791.892.593.494.696.097.599.1
100.3101.8102.6103.7104.5105.5106.7107.6108.9110.7111.7
Total• H * /\Y*I ATTmoii6ysupply
andtime
depos-itsad-
justed 2
151.1150.0150.0155.6163.8171.7176.4183.6188.2191.7196.0209.3212.2216.8231.2248.2267.9232.5230.7231.6235.1233.5235.1236.6236.7238.8241.4243.6248.2250.3248.3249 1252.4251 3253.2255 3256.4258.6261.7264.5267.9
Money supply i
Total
1
115.9114.3113.9119.2125.8130.8132.1135.6138.6140.3139.3144.7145.6144.7149.4151.6157.2149.0145.3144.2146.2143.6144.0144.3143.8145.0146.5148.2151.6151.8148.3147 4149.5147.3148.2149 4149.1150.5152.4154.5157.2
Cur-rencycom-po-
nent
manddepositcom-
ponent
Unadjusted
26.826.225.525.426.627.828.227.928.428.828.929.229.529.630.231.233.129.529.329.629.829.830.030.330.330.330.430.831.230.530.530 830.931.131.431 831.932.032.132.633.1
89.188.188.493.899.2
103.0103.9107.7110.2111.5110.4115.5116.1115.2119.2120.4124.0119.5115.9114.6116.4113.8113.9114.0113.5114.6116.1117.5120.4121.3117.8116.7118.6116.2116.7117 6117.2118.6120.3121.9124.0
1
Timede-
positsad-
just-ed*
35.135.736.136.438.040.944.248.049.651.456.764.666.672.181.896.6
110.783.585.487.488.989.991.192.293.093.894.995.496.698.499.9
101.7102.9104.0105.0106 0107.3108.1109.3110.0110.7
U.S.Gov-ern-
mentde-
mandde-pos-i t s '
1.01.82.8
2.42.74.93.85.0
3.43.43.53.94.9
4; 74.95.65.33.84.65.13.87.07.2
7.16.87.27.36.05.6
4.85.65.94.27.07.4
7.76.26.55.34.65.3
1 Money supply consists of (1) currency outside the Treasury, the Federal Reserve, and vaults of allcommercial banks; (2) demand deposits at all commercial banks, other than those due to domestic commer-cial banks and the U.S. Government, less cash items in process of collection and Federal Reserve float;and (3) foreign demand balances at Federal Reserve Banks.
2 Time deposits adjusted are time deposits at all commercial banks other than those due to domesticcommercial banks and the U.S. Government.
* Deposits at all commercial banks.4 Preliminary.
NOTE.—Between January and August 1959, the series were expanded to include data for all banks inAlaska and Hawaii.
Source: Board of Governors of the Federal Reserve System.
262
Digitized for FRASER http://fraser.stlouisfed.org/ Federal Reserve Bank of St. Louis
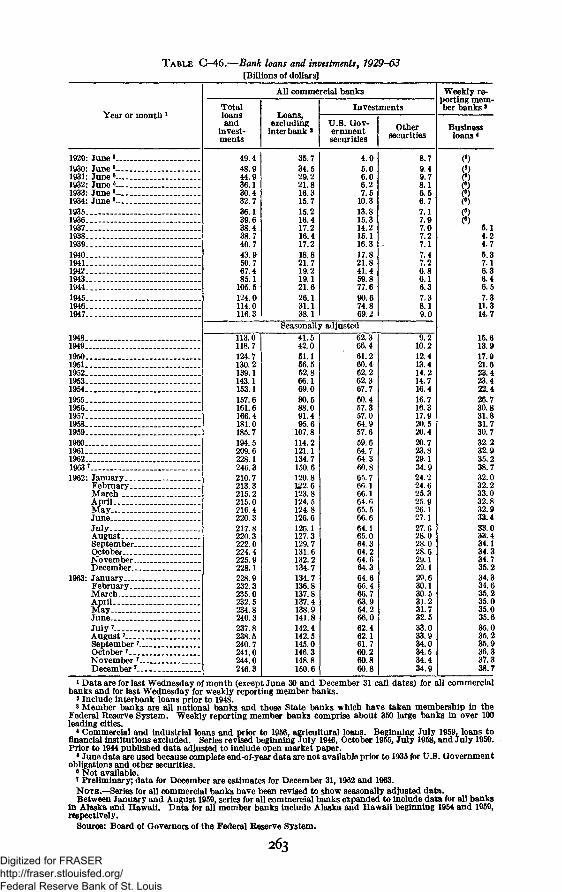
TABLE C-46.—Bank loans and investments, 7929-63[Billions of dollars]
Year or month 1
1929: June 8
1930* June8 -1931- June 8
1932: June 8
1933- June 8~ .1934: June 8
1935 . . .19361937193819391940194119421943 _19441945 . . . . .19461947
194819491950 .1951 . . .1952195319541955 .195619571958 _ .195919601961 . . _19621963 7
1962: January _ _FebruaryMarch-April _May .June . . _JulyAugustSeptemberOctoberNovemberDecember -_ . _
1963: JanuaryFebruaryMarchAprilM a y -JuneJuly 7
August7
September 7 . . .October 7
November7
December7
All commercial banks
Totalloansand
invest-ments
49.448.944.936.130.432.736.139.638.438.740.743.950.767.485.1
105.5124.0114.0116.3
Loans,excluding
interbank *
35.734.529.221.816.315.715.216.417.216.417.218.821.719.219.121.626.131.138.1
Investments
U.S. Gov-ernmentsecurities
4.95.06.06.27.5
10.313.815.314.215.116.317.821.841.459.877.690.674.869.2
Othersecurities
8.79.49.78.16.56.77.17.97.07.27.17.47.26.86.16.37.38.19.0
Seasonally adjusted
113.0118.7124.7130.2139.1143.1153.1157.6161.6166.4181.0185.7194.5209.6228.1246 3210.7213.3215.2215.0216.4220.3217 8220.3222.0224.4225 9228.1228 9232.3235.0232 5234.8240.3237.8238 5240.7241.0244 0246.3
41.542.051.156.562.866.169.080.588.091.495.6
107.8114.2121.1134.7150.6120.8122.6123.8124.5124.8126.6126 1127.3129.7131.6132.2134.7134.7136.8137.8137 4138.9141.8142.4142.5145.0146.3148.8150.6
62.366.461.260.462.262.367.760.457.357.064.957.659.664.764.360.865.766.166.164.665.566.664.165.064.364.264.664.364.665.466.763.964.266.062.462.161.760.260.860.8
9.210.212.413.414.214.716.416.716.317.920.520.420.723.829.134.924.224.625.325.926.127.127.628.028.028.629.129.129.630.130.531.231.732.533.033.934.034.534.434.9
Weekly re-porting mem-ber banks8
Businessloans *
(«}
33333
C
(6)
5.14.24.75.37.16.36.46.57.3
11.314.7
15.613.917.921.623.423.422.426.730.831.831.730.732.232.935.238.732.032.233.032.832.933.433.033.434.134.334.735.234.334.635.235.035.035.635.035.235.936.337.338.7
i Data are for last Wednesday of month (except June 30 and December 31 call dates) for all commercialbanks and for last Wednesday for weekly reporting member banks.
* Include interbank loans prior to 1948.s Member banks are all national banks and those State banks which have taken membership in the
Federal Reserve System. Weekly reporting member banks comprise about 350 large banks in over 100leading cities.
* Commercial and industrial loans and prior to 1956, agricultural loans. Beginning July 1959, loans tofinancial institutions excluded. Series revised beginning July 1946, October 1955, July 1958, and July 1959.Prior to 1944 published data adjusted to include open market paper.
* June data are used because complete end-of-year data are not available prior to 1935 for U.S. Governmentobligations and other securities.
9 Not available.' Preliminary; data for December are estimates for December 31,1962 and 1963.NOTE.—Series for all commercial banks have been revised to show seasonally adjusted data.Between January and August 1959, series for all commercial banks expanded to include data for all banks
in Alaska and Hawaii. Data for all member banks include Alaska and Hawaii beginning 1954 and 1959,respectively.
Source: Board of Governors of the Federal Reserve System.
263Digitized for FRASER http://fraser.stlouisfed.org/ Federal Reserve Bank of St. Louis
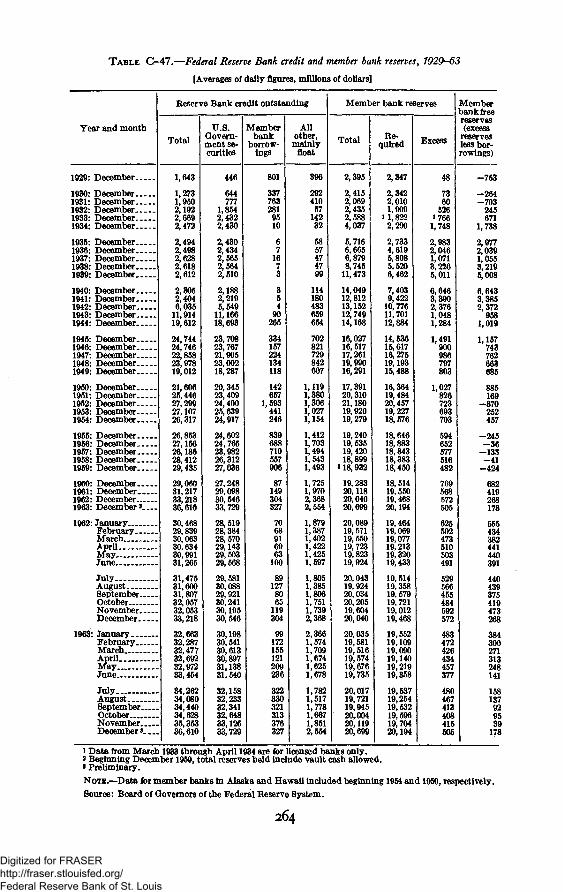
TABLE G-47.—Federal Reserve Bank credit and member bank reserves^ 1929^63
[Averages of daily figures, millions of dollars]
Year and month
Reserve Bank credit outstanding
TotalU.S.
Govern-ment se-curities
Memberbank
borrow-
Allother,
mainlyfloat
Member bank reserves
Total Re-quired Excess
Memberbank freereserves(excess
reservesless bor-rowings)
1929: December
1930: December1931: December1932: December1933: December1934: December
1935: December1936: December1937: December1938: December1939: December
1940: December1941: December1942: December1943: December1944: December
1945: December1946: December1947: December1948: December1949: December
1950: December1951: December1952: December1953: December1954: December. . . .
1955: December1956: December1957: December1958: December1959: December
1960: December1961: December1962: December1963: December « - -
1962: JanuaryFebruary.—March..ApApril-M a y -day-June-
JulyAugustSeptember-OctoberNovember—December..
: JanuaryFebruary.. .MarchAprilMayJune
JulyAugustSeptember-OctoberNovember-December K.
1,643
1,2731,9502,1922,6692,472
2,4942,4982,6282,6182,612
2,3052,4046,035
11,91419,612
24,74424,74622,85823,97819,012
21,60625,44627,29927,10726,317
26,85327,15626,18628,41229,435
29,06031,21733,21836,610
30,46829,83930,06330,63430,99131,265
31,47531,60031,80732,05732,05333,218
32,66332,28732,47732,69232,97233,454
34,26234,08034,44034,62835,35336,610
446
644777
1,8542,4322,430
2,4302,4342,6652,5642,510
2,1882,2195,54911,16618,693
23,70823,76721,90523,00218,287
20,34523,40924,40025,63924,917
24,60224,76523,98226,31227,036
27,24829,09830,54633,729
28,51928,38428, 57029,14329,50329,568
29,58130,08829,92130,24130,19530,546
30,19830,54130,61330,89731,13831,540
32,15832,23332,34132,64833,12633,729
801
3377632819510
67
167
54
90265
334157224134118
142657
1,593441246
839688710557906
87149304327
7068916963
100
1278065
119304
172155121209236
322330321313376327
396
29241057
14232
57474799
114180483659654
702821729842607
1,7251,9702,3682,554
1,8791,3871,4021,4221,4251,597
1,8051,3851,8061,7511,7392,368
2,3661,5741,7091,6741,6251,678
1,7821,5171,7781,6671,8512,554
2,395
2,4152,0692,4352,5884,037
5,7166,6656,8798,745
11,473
14,04912,81213,15212,74914,168
16,02716, 51717,26119,99016,291
1,1191,3801,3061,0271,154
1,4121,7031,4941,5431,493
17,39120,31021,18019,92019,279
19,24019, 53519,42018,899
»18,932
19,28320,11820,04020,699
20,08919,57119,55019,72319,82319,924
20,04319,92420,03420,20519,60420,040
20,03519,58119,51619,57419,67619,735
20,01719,72119,94520r00420,11920,699
2,347
2,3422,0101,909
i 1,8222,290
2,7334,6195,8085,5206,462
7,4039,42210,77611,70112,884
14,53615,61716,27519,19315,488
16,36419,48420,45719,22718,576
18,64618,88318,84318,38318,450
18,51419,55019,46820,194
19,46419,06919,07719,21319,32019,433
19,51419,35819,57919,72119,01219,468
19,55219,10919,09019,14019,21919,358
19,53719,25419,53219,59619,70420,194
48
7360
5261766
1,748
2,9832,0461,0713,2265,011
6,6463,3902,3761,0481,284
1,491900986797
1,027826723693703
594652577516482
568572505
625502473510503491
529566455484592572
483472426434457377
480467413408415505
-753
-264-703245671
1,738
2,9772,0391,0553,2195,008
6,6433,3852,372
9581,019
1,157743762
885169
-870252457
-245- 3 6
-133- 4 1
-424
419268178
555434382441440391
440439375419473268
300271313248141
158137929539
178
* Data from March 1933 through April 1934 are for licensed banks only.s Beginning December 1959, total reserves held include vault cash allowed.» Preliminary.
NOTE.—Data for member banks in Alaska and Hawaii included beginning 1954 and 1959, respectively.
Source: Board of Governors of the Federal Reserve System.
264
Digitized for FRASER http://fraser.stlouisfed.org/ Federal Reserve Bank of St. Louis
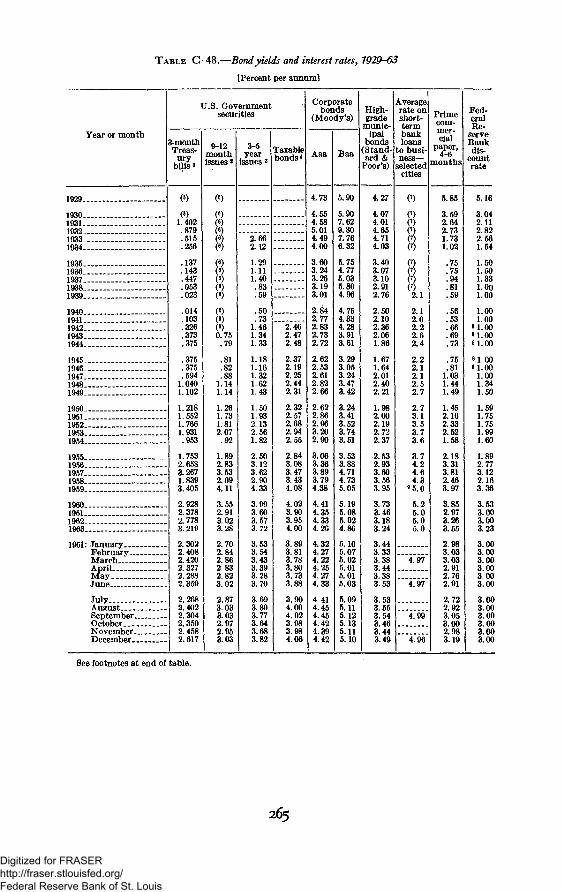
TABLE C-48.—Bond yields and interest rates, 1929-63
[Percent per annuml
Year or month
1929
19301931193219331934 - -
19351936193719381939
1940194119421943 _1944
19451946194719481949
1950 _1951195219531954
19551956 _195719581959 - -
1960196119621963
1961* JanuaryFebruaryMarchAprilMayJune
JulyAugust __SeptemberOctoberNovemberDecember
1
3-monthTreas-ury
bills i
(•)
(•)1.402
.879
.515
.256
.137
.143
.447
.053
.023
.014
.103
.326
.373
.375
.375
.375
.5941.0401.102
1.2181.5521.7661.931
.953
1.7532.6583.2671.8393.405
2.9282.3782.7783.219
2.3022.4082 4202.3272.2882.359
2.2682.4022.3042.3502.4582.617
U.S. Governmentsecurities
9-12monthissues3
<•)(8)
(8)(6)
(«)
( 6 )
(6)(6)
(«)(6)
(6)(8)0.75
.79
.81
.82
.881.141.14
1.261.731.812.07
.92
1.892.833.532.094.11
3.552.913.023.28
2.702.842 862.832.823.02
2.873.033.032.972.953.03
3-5year
issues 3
2.662.12
1.291.111.40
.83
.59
.50
.731.461.341.33
1.181.161.321.621.43
1.501.932.132.561.82
2.503.123.622.904.33
3.993.603.573.72
3.533.543.433.393.283.70
3.693.803.773.643.683.82
Taxable-bonds 4
2.462.472.48
2.372.192.252.442.31
2.322.572.682.942.55
2.843.083.473.434.08
4.023.903.954.00
3.893.813.783.803.733.88
3.904.004.023.983.984.06
Corporatebonds
(Moody's)
Aaa
4.73
4.554.585.014.494.00
3.603.243.263.193.01
2.842.772.832.732.72
2.622.532.612.822.66
2.622.862.963.202.90
3.063.363.893.794.38
4.414.354.334.26
4.324.274.224.254.274.33
4.414.454.454.424.394.42
Baa
5.90
5.907.629.307.766.32
5.754.775.035.804.96
4.754.334.283.913.61
3.293.053.243.473.42
3.243.413.523.743.51
3.533.884.714.735.05
5.195.085.024.86
5.105.075.025.015.015.03
5.095.115.125.135.115.10
High-grade
munic-ipal
bonds(Stand-ard &
Poor's)
4.27
4.074.014.654.714.03
3.403.073.102.912.76
2.502.102.362.061.86
1.671.642.012.402.21
1.982.002.192.722.37
2.532.933.603.563.95
3.733.463.183.24
3.443.333 383.443.383.53
3.533.653.543.463.443.49
Averagerate onshort-termbankloans
to busi-n e s s -
selectedcities
(7)
(7)(7)
n\
(7)(7)(7)(7)
2.1
2.12.02.22.62.4
2.22.12.12.52.7
2.73.13.53.73.6
3.74.24.64.3
9 5.0
5.25.05.05.0
4 97
4.97
4.99
4.96
Primecom-mer-cial
paper,4-6
months
5.85
3.592.642.731.731.02
.75
.75
.94
.81
.59
.56
.53
.66
.69
.73
.75
.811.031.441.49
1.452.162.332.521.58
2.183.313.812.463.97
3.852.973.263.55
2 983.033.032.912.762.91
2.722.923.053.002.983.19
Fed-eralRe-
serveBankdis-
countrate
5.16
3.042.112.822.561.54
1.501.501.331.001.00
1.001.00
8 1.00«1.008 1.00
8 1.008 1.00
1.00
1
1
34
,m,597575
.9960
1.892.773.122.163.36
3.633.003.003.23
3.003.003.003.003.003.00
3.003.003.003.003 003.00
See footnotes at end of table.
265
Digitized for FRASER http://fraser.stlouisfed.org/ Federal Reserve Bank of St. Louis
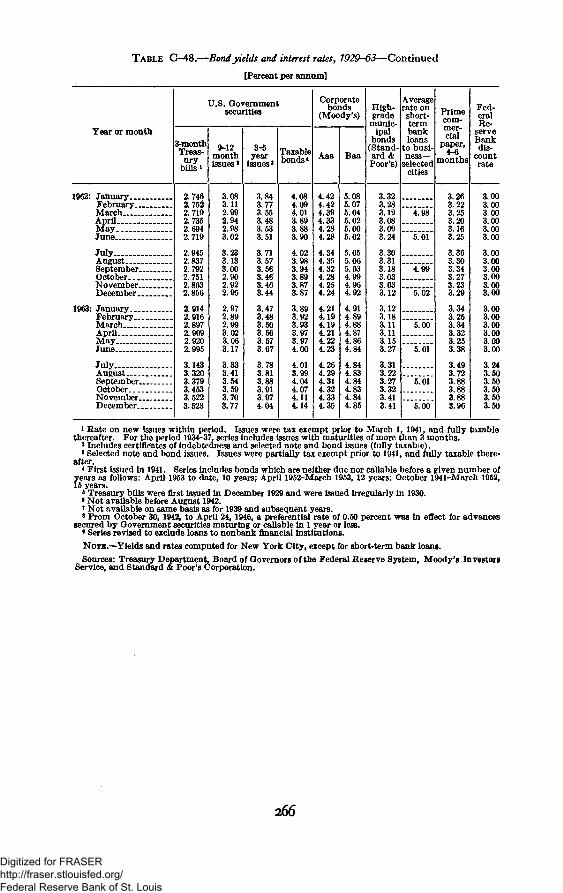
TABLE C-48.—Bondyields and interest rates, 7929-63— Continued
[Percent per annum]
Year or month
1962: JanuaryFebruaryMarchAprilMayJune - __
July. . . .AugustSeptemberOctoberNovemberDecember
1963: JanuaryFebruaryMarchAprilMay . . .June
JulyAugustSeptemberOctoberNovemberDecember
3-monthTreas-
urybills *
2.7462.7522.7192.7352.6942.719
2.9452.8372.7922.7512.8032.856
2.9142.9162.8972.9092.9202.995
3.1433.3203.3793.4533.5223.523
U.S. Governmentsecurities
£-12monthissues8
3.083.112.992.942.983.02
3.233.133.002.902.922.95
2.972.892.993.023.063.17
3.333.413.543.593.703.77
3-5year
issues'
3.843.773.553.483.533.51
3.713.573.563.463.463.44
3.473.483.503.563.573.67
3.783.813.883.913.974.04
Taxablebonds*
4.084.094.013.893.883.90
4.023.983.943.893.873.87
3.893.923.933.973.974.00
4.013.994.044.074.114.14
Corporatebonds
(Moody's)
Aaa
4.424.424.394.334.284.28
4.344.354.324.284.254.24
4.214.194.194.214.224.23
4.264.294.314.324.334.35
Baa
5.085.075.045.025.005.02
5.055.065.034.994.964.92
4.914.894.884.874.864.84
4.844.834.844.834.844.85
High-grade
munic-ipal
bonds(Stand-a r d *Poor's)
3.323.283.193.083.093.24
3.303.313.183.033.033.12
3.123.183.113.113.153.27
3.313.223.273.323.413.41
Averagerate onshort-termbankloans
to busi-n e s s -
selectedcities
4.98
5.01
4.99
5.02
5.00
5.01
5.01
5.00
Primecom-
cialpaper,
4-6months
3.263.223.253.203.163.25
3.363.303.343.273.233.29
3.343.253.343.323.253.38
3.493.723.883.883.883.96
Fed-eralRe-
serveBankdis-
countrate
3.003.003.003.003.003.00
3.003.003.003.003 003.00
3.003.003.003.003.003.00
3.243.503.503.503.503.50
1 Rate on new issues within period. Issues were tax exempt prior to March 1, 1941, and fully taxablethereafter. For the period 1934-37, series includes issues with maturities of more than 3 months.
2 Includes certificates of indebtedness and selected note and bond issues (fully taxable).* Selected note and bond issues. Issues were partially tax exempt prior to 1941, and fully taxable there-
after.* First issued in 1941. Series includes bonds which are neither due nor callable before a given number of
years as follows: April 1953 to date, 10 years; April 1952-March 1953, 12 years; October 1941-March 1952,15 years.
1 Treasury bills were first issued in December 1929 and were issued irregularly in 1930.* Not available before August 1942.* Not available on same basis as for 1939 and subsequent years.« From October 30, 1942, to April 24, 1946, a preferential rate of 0.50 percent was in effect for advances
secured by Government securities maturing or callable in 1 year or less.* Series revised to exclude loans to nonbank financial Institutions.
NOTE.—Yields and rates computed for New York City, except for short-term bank loans.
Sources: Treasury Department, Board of Governors of the Federal Reserve System, Moody's InvestorsService, and Standard & Poor's Corporation.
266
Digitized for FRASER http://fraser.stlouisfed.org/ Federal Reserve Bank of St. Louis
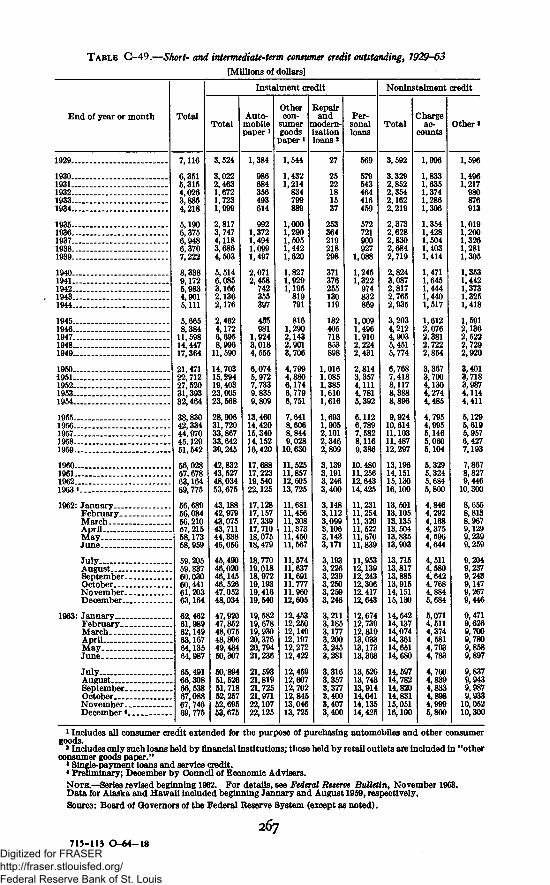
TABLE C-49.—Short- and intermediate-term consumer credit outstanding, 1929-63
[Millions of dollars]
End of year or month Total
Instalment credit
TotalAuto-mobilepaper»
Othercon-
sumergoods
paper *
Repairand
modern-izationLoans 2
Per-sonalloans
Noninstalment credit
Totalihargeac-
countsOther»
1929—
1930—.1931—1932—.
1934..
1935—1936—1937—1938—1939—
1940...1941..1942-.1943-.1944..
1945...1946...1947...1948—1949...
1950..1951-1952..1953-1954-
1955-1956..1957-1958-1959-
1960—1961—1962...1963 4.
1962: JanuaryFebruary.MarchApril.MayJune
JulyAugustSeptember..OctoberNovember..December...
1963: JanuaryFebruary__.MarchAprilMayJune
JulyAugustSeptember..OctoberNovember. _December *.
7,116
6,3515,3154,0263,8854,218
5,1906,3756,9486,3707,222
9,1725,9834,9015,111
5,6658,38411,59814,44717,364
21,47122,71227,52031,39332,464
42,33444,97045,12951, 542
56,02857,67863,16469,775
56,68956,08456,21057,21558,17358,959
59,20559,837
60,44161,20363,164
62,46261,98962,14963,16764,13564,987
65,49166,30866,53867,08867,74669,775
3,524
3,0222,4631,6721,7231,999
2,8173,7474,118
4,503
5,5146,0853,1662,1362,176
2,4624,1726,6958,99611,590
14,70315,29419,40323,00523,568
28,90631,72033,86733,64239,245
42,83243,62748,03453,675
43,18842,97943,07543,71144,33845,056
45,49046,02046,14546,52647,05248,034
47,92047,85248,07548,80649,48450,307
50,89451,52651,71852,25752,69553,675
1,384
684356493614
9921,3721,4941,0991,497
2,0712,458742355397
495981
1,9243,0184,555
6,0745,9727,7339,8359,809
13,46014,42015,34014,15216,420
17,68817,22319,54022,125
17,12817,15717,33917,71018,07518,479
18,77019,01818,97219,19319,41619,540
19,58219,67819,93020,37620,79421,236
21,59321,81921,72521,97122,10722,125
1,544
1,4321,214834799
1,0001,2901,5051,4421,620
1,8271,9291,195819791
8161,2902,1432,9013,706
4,7994,8806,1746,7796,751
7,6418,6068,8449,02810,630
11,52511,85712,60513,725
11,68111,45611,30811,37311,45011,567
11,57411,63711,69111,77711,96012,605
12,45312,25012,14912,19712,27212,422
12,45912,60712,70212,84513,04613,725
27
2522181537
253364219218298
371376255130119
182405718853
1,0161,0851,3851,6101,616
1,6931,9052,1012,3462,809
3,1393,1913,2463,400
3,1483,1123,0993,1063,1433,171
3,1933,2263,2393,2503,2593,246
3,2113,1853,1773,2003,2453,281
3,3163,3573,3773,4003,4073,400
569
579543464416459
572721900927
1,088
1,2451,322974832
1,0091,4961,9102,2242,431
2,8143,3574,1114,7816,392
6,1126,7897,5828,116
10, 48011,25612,64314,425
11,23111,25411,32911, 52211,67011,839
11,95312,13912,24312,30612, 41712,643
12,67412,73912,81913,03313,17313,368
13,52613,74313,91414,04114,13514,425
3,592
3,3292,8522,3542,1622,219
2,3732,6282,8302,6842,719
2,8243,0872,8172,7652,935
3,2034,2124,9035,4515,774
6,7687,4188,117
9,92410,61411,10311,48712,297
13,19614,15115,13016,100
13,50113,10513,13513,50413,83513,903
13,71513,81713,88513,91514,15115,130
14,54214,13714,07414,36114,65114,680
14,59714,78214,82014,83115,05116,100
1,996
1,8331,6351,3741,2861,306
1,3541,4281,5041,4031,414
1,4711,6451,4441,4401,517
1,6122,0762,3812,7222,854
3,3673,7004,1304,2744,485
4,7954,9956,1465,0605,104
5,3295,3245,6845,800
4,8464,2924,1684,375
4,644
4,5114,5804,6424,7684,8845,684
5,0714,5114,3744,5814,7934,783
4,760
4,8334,8984,9995,800
1,596
1,4961,217
980876913
1,0191,2001,3261,2811,305
1,3531,4421,3731,3251,418
1,5912,1362,5222,7292,920
3,4013,7183,9874,1144,411
5,1295,6195,9576,4277,193
7,8678,8279,446
10,300
8,6558,8138,9679,1299,2399,259
9,2049,2379,2439,1479,2679,446
9,4719,6269,7009,7809,8589,897
9,8379,9439,9879,93310,05210,300
1 Includes all consumer credit extended for the purpose of purchasing automobiles and other consumergoods.
* Includes only such loans held by financial institutions; those held by retail outlets are included in "otherconsumer goods paper."
' Single-payment loans and service credit.* Preliminary; December by Council of Economic Advisers.NOTE.—Series revised beginning 1962. For details, see Federal Reserve Bulletin, November 1963.Data for Alaska and Hawaii included beginning January and August 1959, respectively.Sourcs: Board of Governors of the Federal Reserve System (except as noted).
267715-113 O - 6 4 - 1 8
Digitized for FRASER http://fraser.stlouisfed.org/ Federal Reserve Bank of St. Louis
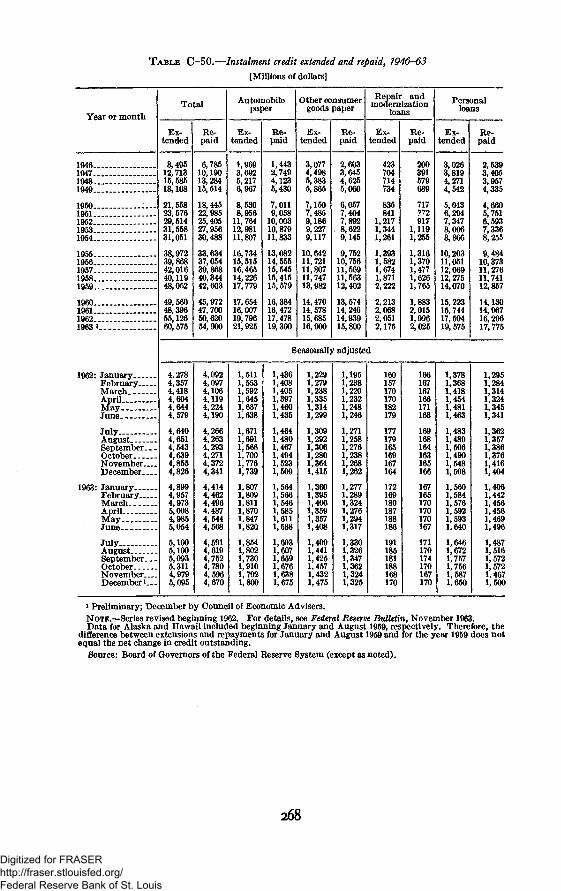
TABLE C-50.—Instalment credit extended and repaid, 1946-63
[Millions of dollars]
Year or monthTotal
Ex-tended
Re-paid
Automobilepaper
Ex-tended
Re-paid
Other consumergoods paper
Ex-tended
Re-paid
Repair andmodernization
loans
Ex-tended
Re-paid
Personal
Ex-tended
Re-paid
1946..1947..1948..1949-
1950..1951..1952..1953..1954..
1955..1956..1957.1958..1959.
1960..
1962...1963L
1962: JanuaryFebruaryMarch. _AprilMayJune
JulyAugustSeptember..OctoberNovember. _December. _
1963: JanuaryFebruaryMarchAprilMay.June
JulyAugustSeptember..OctoberNovember...December i_.
8,49512,71315,58518,108
21,55823,57629,51431,55831,051
38,97239,86842,01640,11948,052
49,56048,39655,12660,575
6,78510,19013,28415,514
18,44522,98525,40527,956
33,63437,05439,86840,34442,603
45,97247,70050,62054,900
5,2176,967
8,5308,95611,76412,98111,807
16,73415,51516,46514,22617,779
17,65416,00719,79621,925
1,4432,7494,1235,430
7,0119,05810,00310,87911,833
13,08214,55515,54515,41515,579
16.38416,47217,47819,300
3,0774,4985,3835,865
7,1507,4859,1869,2279,117
10,64211,72111,80711,74713,982
14,47014,57815,68516,900
2,6033,6454,6255,060
6,0577,4047,8928,6229,145
9,75210,75611,56911,56312,402
13,57414,24614,93915,800
423704714734
835841
1,2171,3441,261
1,3931,5821,6741,8712,222
2,2132,0682.0512,175
200391579
717772917,119,255
,316,370,477,6261,765
1,8832,0151,9962,025
3,0263,8194,2714,542
5,0436,2947,3478,0068,866
10,20311,05112,06912,27514,070
15,22315,74417,59419,575
Seasonally adjusted
4,2784,3574,4184,6044,6444,579
4,6404,6514,5434,6394,8554,826
4,8994,9574,9735,0084,9855,054
5,1005,1005,0935,3114,9795,095
2,5393,4053,9574,335
4,6605,751
7,3368,255
9,48410,37311,27611,74112,857
14,13014,96716,20617,775
4,0924,0974,1064,1194,2244,190
4,2664,2634,2934,2714,3724,341
4,4144,4624,4964,4874,5444,568
4,5914,6194,7524,7804,5964,670
1,5111,5531,5921,6451,6871,638
1,6711,6911,5661,7001,7761,739
1,8071,8091,8111,8701,8471,820
1,8541,8021,7301,9101,7921,800
1,4361,4081,4051,3971,4601,435
1,4641,4801,4671,4941,5231,509
1,5641,5661,5461,5851,6111,588
1,6031,6071,6591,6761,6381,675
1,2291,2791,2381,3351,3141,299
1,3091,2921,3061,2801,3641,415
1,3601,3951,4061,3591,3571,408
1,4091,4411,4251,4571,4321,475
1,1951,2381,2201,2321,2481,246
1,2711,2581,2761,2381,2681,262
1,2771,2891,3241,2761,2941,317
1,3301,3261,3471,3621,3241,325
160157170170182179
177179165169167164
172169180187188186
191185181188168170
166167167166171168
169168164163165166
167165170170170167
171170174170167170
1,3781,3681,4181,4541,4811,463
1,4831,4891,5061,4901,5481,508
1,5601,5841,5761,5921,5931,640
1,6461,6721,7571,7561,5871,650
1,2951,2841,3141,3241,3451,341
1,3621,3571,3861,3761,4161,404
1,4061,4421,4561,4561,4691,496
1,4871,5161,5721,5721,4671,500
i Preliminary; December by Council of Economic Advisers.NOTE.—Series revised beginning 1962. For details, see Federal Reserve Bulletin, November 1963.Data for Alaska and Hawaii included beginning January and August 1959, respectively. Therefore, the
difference between extensions and repayments for January and August 1959 and for the year 1959 does notequal the net change in credit outstanding.
Source: Board of Governors of the Federal Reserve System (except as noted).
268
Digitized for FRASER http://fraser.stlouisfed.org/ Federal Reserve Bank of St. Louis
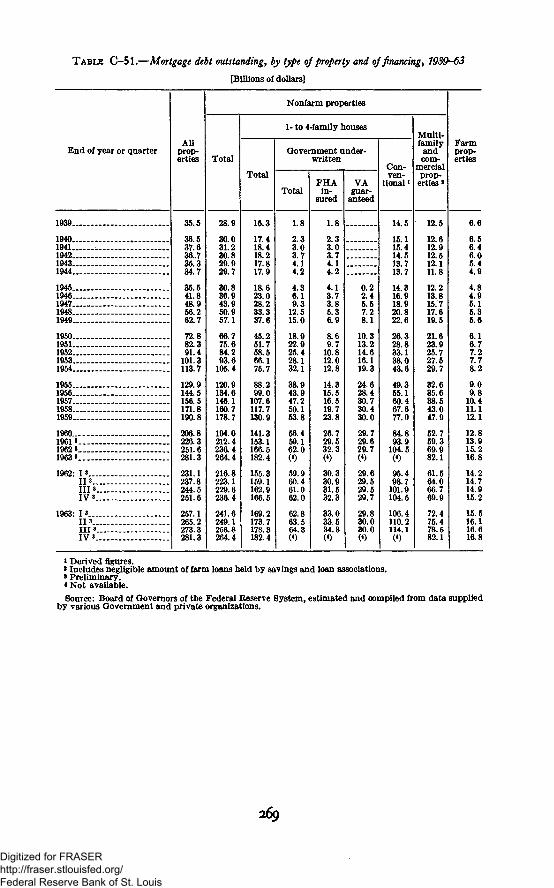
TABLE C-51.—Mortgage debt outstanding, by type of property and of financings 1939^63
[Billions of dollars]
End of year or quarter
1939 - -
19401941194219431944
19451946194719481949
195019511952 , _ . .19531954
19551956195719581959
I9601961»1962 »1963 3
1962: 13113I l l 3IV 3
1963: 13113 __H I 3IV 3
Allprop-erties
35.5
36.537.636.735.334.7
35.541.848.956.262.7
72.882.391.4
101.3113.7
129.9144.5156.5171.8190.8
206.8226.3251.6281.3
231.1237.8244.5251.6
257.1265.2273.3281.3
Nonfarm properties
Total
28.9
30.031.230.829.929.7
30.836.943.950.957.1
66.775.684.293.6
105.4
120.9134.6146.1160.7178.7
194.0212.4236.4264.4
216.8223.1229.6236.4
241.6249.1256.8264.4
1- to 4-family houses
Total
16.3
17.418.418.217.817.9
18.623.028.233.337.6
45.251.758.566.175.7
88.299.0
107.6117.7130.9
141.3153.1166.5182.4
155.3159.1162.9166.5
169.2173.7178.3182.4
Government under-written
Total
1.8
2.33.03.74.14.2
4.36.19.3
12.515.0
18.922.925.428.132.1
38.943.947.250.153.8
56.459.162.0(4)
59.960.461.062.0
62.863.564.3(4)
FHAin-
sured
1.8
2.33.03.74.14.2
4.13.73.85.36.9
8.69.7
10.812.012.8
14.315.516.619.723.8
26.729.532.3(*)
30.330.931.532.3
33.033.534.3(*)
VAguar-
anteed
0.22.45.57.28.1
10.313.214.616.119.3
24.628.430.730.430.0
29.729.629.7(«)
29.629.529.529.7
29.830.030.0(*)
Con-ven-
tional i
14.5
15.115.414.513.713.7
14.316.918.920.822.6
26.328.833.138.043.6
49.355.160.467.677.0
84.893.9
104.5(«)
95.498.7
101.9104.5
106.4110.2114.1(4)
Multi-family
andcom-
mercialprop-
erties *
12.5
12.612.912.512.111.8
12.213.815.717.619.5
21.623.925.727.529.7
32.635.638.543.047.9
52.769.369.982.1
61.564.066.769.9
72.475.478.582.1
Farmprop-erties
6.6
6.56.46.05.44.9
4.84.95.15.35.6
6.16.77.27.78.2
9.09.8
10.411.112.1
12.813.915.216.8
14.214.714.915.2
15.516.116.616.8
»Derived figures.«Includes negligible amount of farm loans held by savings and loan associations.* Preliminary.«Not available.
Source: Board of Governors of the Federal Reserve System, estimated and compiled from data suppliedby various Government and private organizations.
269
Digitized for FRASER http://fraser.stlouisfed.org/ Federal Reserve Bank of St. Louis
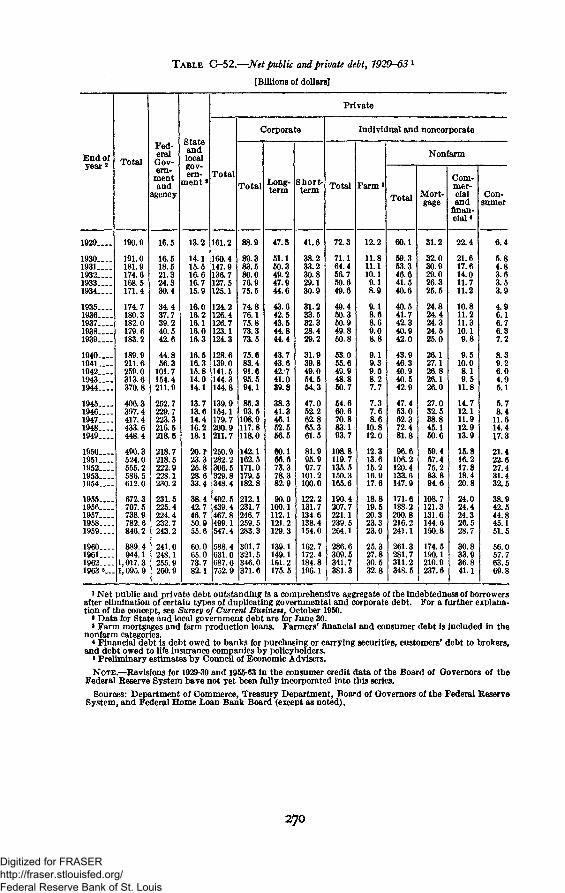
TABLE C-52.—JVet public and private debt, 1929-63 1
[Billions of dollars]
End ofyear3
1929....
1930—1931—1932....1933—1934—
1935—1936—1937—1938—1939....
1940—19411942....1943—1944—
1945....1946—1947—1948—1949....
1950—1951—1952....1953—1954
1955—1956—1957—1958....1959—
19601961—19621963 «...
Total
190.9
191.0181.9174.6168.5171.4
174.7180.3182.0179 6183.2
189.9211.6259.0313.6370.8
406.3397.4417.4433.6448.4
490.3524.0555.2586.5612.0
672.3707.5738.9782.6846.2
889.4944.1
1,017.31,095. 9
Fed-eralGov-ern-
mentand
agency
16.5
16.518.521.324.330.4
34.437.739.240.542.6
44.856.3
101.7154.4211.9
252.7229.7223.3216.5218.6
218.7218.5222.9228.1230.2
231.5225.4224.4232.7243.2
241.0248.1255.9260.9
Stateandlocalgov-ern-
ment 2
13.2
14.115.516.616.715.9
16.016.216.116.016.3
16.516.315.814.914.1
13.713.614.416.218.1
20.723.325.828.633.4
38.442.746.750.955.6
60.065.073.782.1
Private
Total
161.2
160.4147.9136.7127.5125.1
124.2126.4126.7123.1124.3
128.6139.0141.5144.3144.8
139.9154.1179.7200.9211.7
250.9282.2306.5329.8348.4
402.5439.4467.8499.1547.4
588.4631.0687.6752.9
Corporate
Total
88.9
89.383.580.076.975.5
74.876.175.873.373.5
75.683.491.695.594.1
85.393.5
108.9117.8118.0
142.1162.5171.0179.5182.8
212.1231.7246.7259.5283.3
301.7321.5346.0371.6
Long-term
47.5
51.150.349.247.944.6
43.642.543.544.844.4
43.743.642.741.039.8
38.341.346.152.556.5
60.166.673.378.382.9
90.0100.1112.1121.2129.3
139.1149.1161.2175.5
Short-term
41.6
38.233.230.829.130.9
31.233.532.328.429.2
31.939.849.054.554,3
47.052.262.865.361.5
81.995.997.7
101.2100.0
122.2131.7134.6138.4154.0
162.7172.4184.8196.1
Individual and noncorporate
Total
72.3
71.164.456.750.649.6
49.450.350.949.850.8
53.055.649.948.850.7
54.660.670.883.193.7
108.8119.7135.5150.3165.6
190.4207.7221.1239.5264.1
286.6309.5341.7381.3
Farm3
12.2
11.811.110.19.18.9
9.18.68.69.08.8
9.19.39.08.27.7
7.37.68.6
10.812.0
12.313.615.216.917.6
18.819.520.323.323.0
25.327.830.532.8
Nonfann
Total
60.1
69.363.346.641.540.6
40.541.742.340.942.0
43.946.340.940.542.9
47.463.062.372.481.8
96.6106.2120.4133.6147.9
171.6188.2200.8216.2241.1
261.3281.7311.2348.5
Mort-gage
31.2
32.030.929.026.325.5
24.824.424.324.525.0
26.127.126.826.126.0
27.032.538.845.150.6
59.467.475.283.894.6
108.7121.3131.6144.6160.8
174.5190.1210.9237.6
Com-mer-cialand
finan-cial*
22.4
21.617.614.011.711.2
10.811.211.310.19.8
9.510.08.19.5
11.814.712.111.912.913.9
15.816.217.818.420.8
24.024.424.326.528.7
30.833.936.841.1
Con-sumer
6.4
5.84.83.63.53.9
4.96.16.76.37.2
8.39.26.04.95.1
5.78.4
11.614.4*7.3
21.422.627.431.432.5
38.942.544.845.151.5
56.057.763.569.8
i Net public and private debt outstanding is a comprehensive aggregate of the indebtedness of borrowersafter elimination of certain types of duplicating governmental and corporate debt. For a further explana-tion of the concept, see Survey of Current Bu%int8», October 1950.
» Data for State and local government debt are for June 30.> Farm mortgages and farm production loans. Farmers' financial and consumer debt is included in the
nonfarm categories.« Financial debt is debt owed to banks for purchasing or carrying securities, customers' debt to brokers,
and debt owed to life insurance companies by policyholders.• Preliminary estimates by Council of Economic Advisers.
NOTE.—Revisions for 1929-39 and 1955-63 in the consumer credit data of the Board of Governors of theFederal Reserve System have not yet been fully incorporated into this series.
Sources: Department of Commerce, Treasury Department, Board of Governors of the Federal ReserveSystem, and Federal Home Loan Bank Board (except as noted).
270
Digitized for FRASER http://fraser.stlouisfed.org/ Federal Reserve Bank of St. Louis
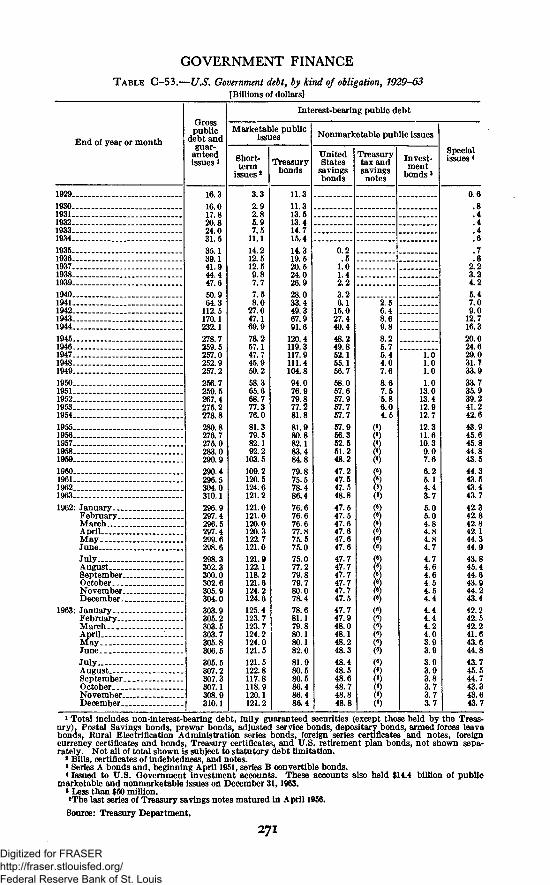
GOVERNMENT FINANCETABLE C-53.—US. Government debt, by kind of obligation, 1929-63
[Billions of dollars}
End of year or month
1929
19301931 _._1932 _19331934
19351936193719381939
1940194119421943 .1944
19451946194719481949
19501951195219531954 .
19551956195719581959
1960196119621963
1962: JanuaryFebruary-MarchAprilM a y . .JuneJulyAugustSeptemberOctober .NovemberDecember.»
1963: JanuaryFebruaryMarchAprilMay - - -JuneJulyAugustSeptember _ .OctoberNovemberDecember
Grosspublic
debt andguar-
anteedissues1
16.316 017.820.824 031.535.139 141.944.447.660.964 3
112.5170 1232.1278.7259.5257.0252.9257.2256.7259.5267 4275.2278.8280 8276.7275.0283 0290.9290 4296.5304.0310.1296.9297.4296.5297.4299.6298.6298.3302 3300.0302.6305.9304.0303.9305.2303.5303.7305 8306 5305.5307.2307 3307.1308.9310.1
Interest-bearing public debt
Marketable publicissues
Short-term
issues *
3.32.92.85.97.5
11.114.212.512.59.87.77.58.0
27.047.169.978.257.147.745.960.258.365.668.777.376.081.379.582.192.2
103.5109.2120.5124.6121.2121.0121.0120.0120.3122.7121.0121.9122.1118.2121.6124.2124.6125.4123.7123.7124.2124.0121.5121.5122.8117.8118.9120.1121.2
Treasurybonds
11.311.313.513.414.715,414.319.520.524.026.928.033.449.367 991.6
120.4119.3117.9111.4104.894.076.979.877.281.881.980.882.183.484.879 875.578.486.476.676.676.677.875.575.075.077.279.879.780.078.478.681.179.880.180.182.081.980.586.586.486.486.4
Nonmarketable public issues
UnitedStates
savingsbonds
0.2.5
1.01.42.23.26.1
15.027.440.448.249.852.155.156.758.057.657.957.757.757.956.352.551.248.247.247.547.548.847.547.547.647.647.647.647.747.747.747.747.747.547.747.948.048.148.248.348.448.548.648.748.848.8
Treasurytax andsavingsnotes
2.56.48 69.8
8.25.75.44.67.68.67.55.86.04.5
8(8)
(«)
8(•)m
m(')(6)(6)
(8)
(fl)
(8)
(6)
(6)(6)
Invest-ment
bonds3
1.01.01.01.0
13.013.412.912.712.311.610.39.07.66.25.14.43.75.05.04.84.84.84.74.74.64.64.54.54.4
4.44.44.24.03.93.9
3.93.93.83.73.73.7
Specialissues *
0.6.8. 4.4. 4.6.7.6
2.23.24.25.47.09.0
12.716.320.024.629.031.733.933.735.939.241.242.643.945.645.844.843.544.343.543.443.742.342.842.842.144.344.943.845.444.643.944.243.442.242.542.241.643.644.843.745.544.743.343.643.7
1 Total includes non-interest-bearing debt, fully guaranteed securities (except those held by the Treas-ury), Postal Savings bonds, prewar bonds, adjusted service bonds, depositary bonds, armed forces leavebonds, Rural Electrification Administration series bonds, foreign series certificates and notes, foreigncurrency certificates and bonds, Treasury certificates, and U.S. retirement plan bonds, not shown sepa-rately. Not all of total shown is subject to statutory debt limitation.2 Bills, certificates of indebtedness, and notes.8 Series A bonds and, beginning April 1951, series B convertible bonds.
* Issued to U.S. Government investment accounts. These accounts also held $14.4 billion of publicmarketable and nonmarketable issues on December 31,1963.
» Less than $50 million.«The last series of Treasury savings notes matured in April 1956.Source: Treasury Department.
271
Digitized for FRASER http://fraser.stlouisfed.org/ Federal Reserve Bank of St. Louis
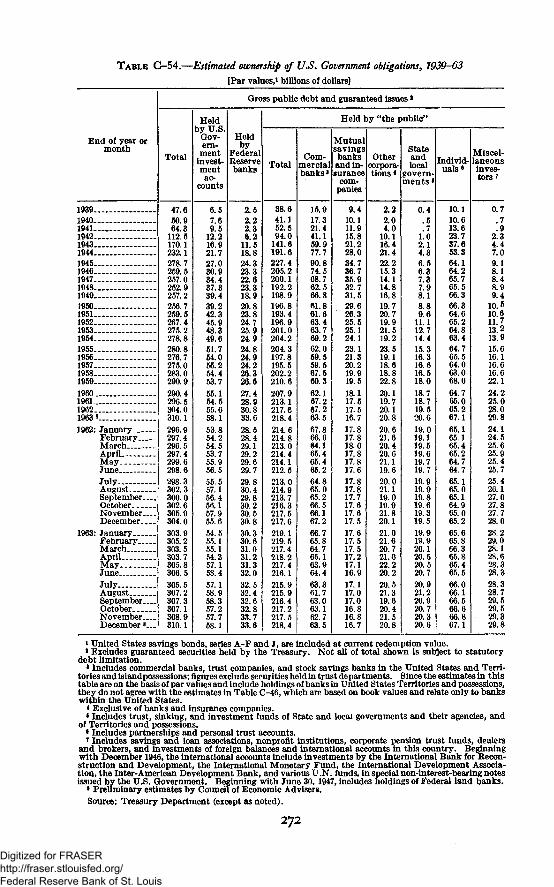
TABLE C-54.—Estimated ownership of US. Government obligations, 1939-63
[Par values,* billions of dollars]
End of year ormonth
Gross public debt and guaranteed issuesa
Total
Heldby U.S.
Gov-ern-
mentinvest-ment
ac-counts
Heldby
FederalReservebanks
Held by "the public"
TotalCom-
mercialbanks '
Mutualsavingsbanks
and in-surance
com-panies
Othercorpora-tions «
Stateandlocal
governments •
Individ-uals6
Miscel-laneousinves-tors »
1939194019411942194319441945194619471948194919501951 -19521953195419551956195719581959196019611962_1963 81962: January
February...MarchApril.-M a y . . .JuneJulyAugustSeptember..OctoberNovember..December..
1963: JanuaryFebruary...MarchAprilMayJuneJulyAugustSeptember. _OctoberNovember..December 8_
47.650.964.3
112.5170.1232.1278.7259.5257.0252.9257.2256.7259.5267.4275.2278.8280.8276.7275.0283.0290.9
290.4296.5304.0310.1296.9297.4296.5297.4299.6298.6298.3302.3300.0302.6305.9304.0303.9305.2303.5303.7305.8306.5305.5307.2307.3307.1308.9310.1
6.57.69.5
12.216.921.727.030.934.437.339.439.242.345.948.349.651.754.056.254.453.7
55.154.555.658.153.854.254.553.755.956.555.567.156.456.157.955.654.555.155.154.357.158.457.158.958.357.257.758.1
2.52.22.36.2
11.518.824.323.322.623.318.920.823.824.725.924.924.824.924.226.326.6
27.428.930.833.628.528.429.129.229.629.729.830.429.830.230.530.830.330.631.031.231.332.032.532.432.632.833.733.6
38.641.152.594.0
141.6191.6227.4205.2200.1192.2198.9196.8193.4196.9201.0204.2204.3197.8195.5202.2210.6207.9213.1217.6218.4214.6214.8213.0214.4214.1212.5213.0214.9213.7216.3217.5217.6219.1219.5217.4218.2217.4216.1215.9215.9216.4217.2217.5218.4
15.917.321.441.159.977.790.874.568.762.566.8«1.861.663.463.769.262.059.559.567.560.3
62.167.267.263.567.866.664.165.465.465.264.865.065.266.566.167.266.765.864.765.163.964.463.361.763.063.162.763.5
9.410.111.915.821.228.034.736.735.932.731.529.626.325.525.124.123.121.320.219.919.5
18.117.517.516.717.817.818.017.817.817.617.817.817.717.617.617.517.617.517.517.217.116.917.117.017.016.816.816.7
2.22.04.0
10.116.421.422.215.314.114.816.819.720.719.921.519.223.519.118.618.822.8
20.119.720.120.820.621.620.420.621.119.620.021.119.019.921.820.121.021.620.721.022.220.220.521.319.620.421.520.8
0.4.5.7
1.02.14.36.56.37.37.98.18.89.6
11.112.714.415.316.316.616.518.0
18.718.719.520.619.019.119.519.619.719.719.919.919.819.619.319.519.919.920.120.520.520.720.921.220.920.720.320.6
10.110.613.623.737.653.364.164.265.765.566.366.364.665.264.863.464.765.564.063.068.0
64.765.065.267.165.165.165.465.264.764.765.165.065.164.965.065.265.665.866.365.865.465.566.066.166.566.666.867.1
0.7.7.9
2.34.47.09.18.18.48.99.4
io.fi10.611.713.2J3.915.616.116.616.622.124.225.028.029.824.124.525.625.925.425.725.426.127.027.827.728.028.229.028.128.628.328.328.328.729.529.529.329.8
1 United States savings bonds, series A-F and J, are included at current redemption value.» Excludes guaranteed securities held by the Treasury. Not all of total shown is subject to statutory
debt limitation.3 Includes commercial banks, trust companies, and stock savings banks in the United States and Terri-
tories and islandpossessions; figures exclude securities held in trust departments. Since the estimates in thistable are on the basis of par values and include holdings of banks in United States Territories and possessions,they do not agree with the estimates in Table C-46, which are based on book values and relate only to bankswithin the United States.
* Exclusive of banks and insurance companies.* Includes trust, sinking, and investment funds of State and local governments and their agencies, and
of Territories and possessions.•Includes partnerships and personal trust accounts.7 Includes savings and loan associations, nonprofit institutions, corporate pension trust funds, dealers
and brokers, and investments of foreign balances and international accounts in this country. Beginningwith December 1946, the international accounts include investments by the International Bank for Recon-struction and Development, the International Monetary Fund, the International Development Associa-tion, the Inter-American Development Bank, and various U.N. funds, in special non-interest-bearing notesissued by the U.S. Government. Beginning with June 30, 1947, includes holdings of Federal land banks.
8 Preliminary estimates by Council of Economic Advisers.Source: Treasury Department (except as noted).
272
Digitized for FRASER http://fraser.stlouisfed.org/ Federal Reserve Bank of St. Louis
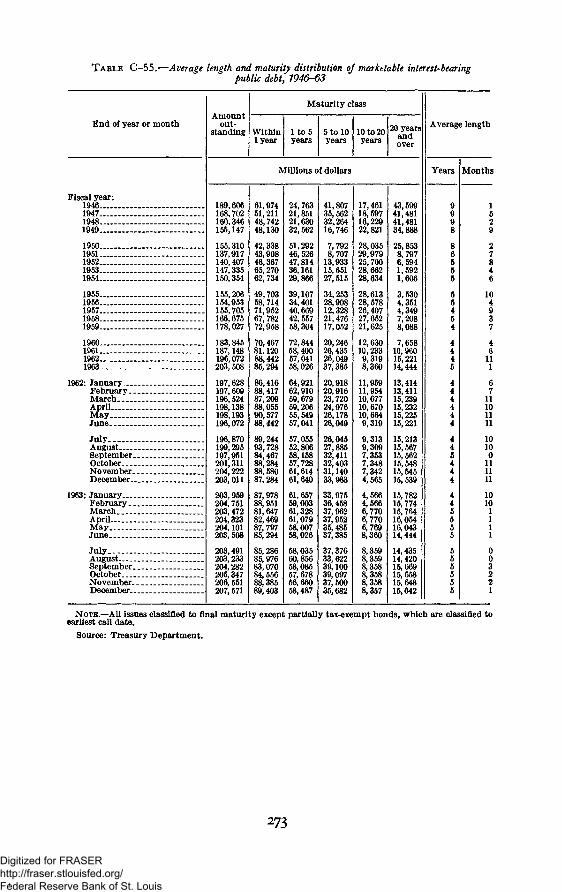
T A B L E C-55.—Average length and maturity distribution of marketable interest-bearingpublic debt, 7946-63
End of year or monthAmount
out-standing
Maturity class
Withinlyear
1 to 5years
5 to 10years
10 to 20years
20 yearsandover
Average length
Millions of dollars Years
Fiscal year:1946194719481949
1950195119521953.1954
19551956195719581959
1960196119621963
1962: January . .February.MarchAprilMayJune
JulyAugust....SeptemberOctober. __November.December.
1963: January...February.MarchAprilMayJune
JulyAugustSeptemberOctober. __November.December-
189,606168,702160,346155,147
155,310137,917140,407147,335150,354
155,206154,953155,705166,675178,027
183,845187,148196,072203,508
197,628197,609196,524198,138198,193196,072
196,870199,295197,951201,311204,222203,011
203,959204,751203,472204,323204,101203,508
203,491203,233204,282205,347206, 551207,571
61,97451,21148,74248,130
42,33843,90846,36765,27062,734
49,70358,71471,95267,78272,958
70,46781,12088,44285,294
86,41688,41787,20988,05590,57788,442
89,24493,72884,46788,28488,58087,284
87,97888,95181,64782,46987, 79785,294
85,28685, 97683,07084,55688,38589,403
24,76321,85121,63032,562
51,29246,52647,81436,16129,866
39,10734,40140,66942,55758,304
72,84458,40057,04158,026
64,92162,91059,67959,20655,54957,041
57,05552,80658,15857,72861,61461,640
61,65759,00361,32861,07958,00758,026
58,03560,85658,08557, 67856,66058,487
41,80735,56232^26416,746
7,7928,70713,93315,65127,515
34,25328,90812,32821,47617,052
20,24626,43526,04937,385
20,91820,91623,72024,97626,17826,049
26,04527,88532,41132,40331,14033,983
33,97536,45837,96237,95235,48537,385
37,37633,62239,10039,09737, 50035,682
17,46118,59716,22922,821
28,03529,97925,70028,66228,634
28,61328,57826,40727,65221,625
12,63010,2339,3198,360
11,95911,95410,67710,67010,6649,319
9,3139,3097,3537,3487,3424,565
4,5664,5666,7706,7706,7698,360
8,3598,3598,3588,3588,3588,357
43,59941,48141,48134,888
25,8538,7976,5941,5921,606
3,5304,3514,3497,2088,088
7,65810,96015,22114,444
13,41413,41115,23915,23215,22515,221
15,21315,56715,56215,54815,54515,539
15,78215,77415,76416,05416,04314,444
14,43514,420
15,65815,64815,642
Months
1049
111
711101111
10100
111111
10101111
003221
NOTE.—All issues classified to final maturity except partially tax-exempt bonds, which are classified toearliest call date.
Source: Treasury Department.
273
Digitized for FRASER http://fraser.stlouisfed.org/ Federal Reserve Bank of St. Louis
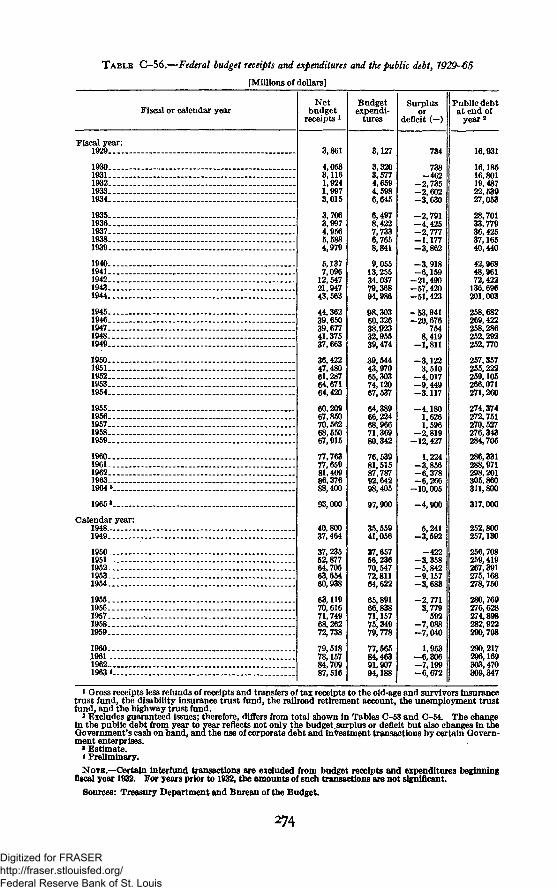
TABLE C-56.—Federal budget receipts and expenditures and the public debt, 1929-65
[Millions of dollars]
Fiscal or calendar year
Fiscal year:1929
19301931193219331934
19351936193719381939
19401941194219431944
1945194619471948.1949
19501951195219531954
19551956195719581959
1960196119621963.1964*
1965*
Calendar year:19481949
19501951.195219531954
19551956195719581959
196019611962-1963«
Netbudget
receipts 1
3,861
4,0583,1161,9241,9973,015
3,7063,9974,9566,5884,979
5,1377,096
12,54721,94743,563
44,36239,65039,67741,37537,663
36,42247,48061,28764,67164,420
60,20967,85070,56268,55067,915
77,76377,65981,40986,37688,400
93,000
40,80037,464
37,23552,87764,70563,654
63,11970,61671,74968,26272,738
79,51878,15784,70987,516
Budgetexpendi-
tures
3,127
3,3203,5774,6594,5986,645
6,4978,4227,7336,7658,841
9,05513,25534,03779,36894,986
98,30360,32638,92332,95539,474
39,54443,97065,30374,12067,537
64,38966,22468,96671,36980,342
76,53981,51587,78792,64298,405
97,900
35,55941,056
37,65756,23670,54772,81164,622
65,891
71,15775,34979,778
77,56584,46391,90794,188
Surplusor
deficit (-)
734
738-462
-2,735—2,602-3,630
-2,791-4,425-2,777-1,177-3,862
-3,918-6,159
-21,490-57,420-51,423
-53,941-20,676
7548,419
-1,811
-3,1223,510
—4,017-9,449-3.117
-4,1801,6261,596
—2,819-12,427
1,224-3,856-6,378-6,266
-10,005
-4,900
5,241-3,592
-422-3,358-5,842-9,157
-2,7713,779
592-7,088-7,040
1,953—6,306-7,199-6,672
Public debtat end of
year *
16,931
16,18516,80119,48722,53927,053
28,70133,77936,42537,16540,440
42,96848,96172,422
136,696201,003
258,682269,422258,286252,292252,770
257,357255,222259,105266,071271,260
274,374272,751270,527276,343284,706
286,331288,971298,201305,860311,800
317,000
252,800257,130
256,708259,419267,391275,168278,750
280,769276,628274,898282,922290,798
290,217296,169303,470309,347
* Gross receipts less refunds of receipts and transfers of tax receipts to the old-age and survivors insurancetrust fund, the disability insurance trust fund, the railroad retirement account, the unemployment trustfund, and the highway trust fund.
2 Excludes guaranteed issues; therefore, differs from total shown in Tables C-53 and C-54. The changein the public debt from year to year reflects not only the budget surplus or deficit but also changes in theGovernment's cash on hand, and the use of corporate debt and investment transactions by certain Govern-ment enterprises.
»Estimate.< Preliminary.
NOTE.—Certain interfund transactions are excluded from budget receipts and expenditures beginningfiscal year 1932. For years prior to 1932, the amounts of such transactions are not significant.
Sources: Treasury Department and Bureau of the Budget.
274
Digitized for FRASER http://fraser.stlouisfed.org/ Federal Reserve Bank of St. Louis
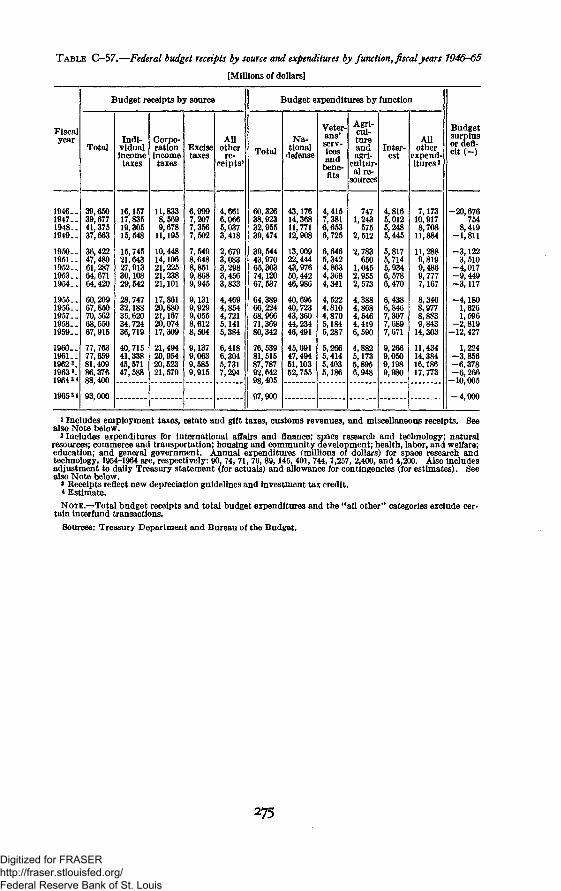
TABLE G-57.—Federal budget receipts by source and expenditures by function, fiscal years 7946-65
[Millions of dollars]
Fiscalyear
1946-.1947—1948.-1949._
1950--1951_>1952--1953- .1954. .
1955 . .1956->1957-_1958- .1959.-
1960- .1 9 6 1 . .1962 3.1963 3.1964 3 4
19653 4
Budget receipts by source
Total
39,65039,67741,37537,663
36,42247,48061,28764,67164.420
60,20967,85070,56268,55067,915
77,76377,65981,40986,37688,400
93,000
Indi-vidualincometaxes
16,15717,83519,30515,548
15,74521,64327,91330,10829,542
28,74732,18835,62034,72436,719
40,71541,33845,57147,588
Corpo-rationincometaxes
11,8338,5699,678
11,195
10,44814,10621,22521,23821,101
17,86120,88021,16720,07417,309
21,49420,95420,52321,579
Excisetaxes
6,9997,2077,3567,502
7,5498,6488,8519,8689,945
9,1319,9299,0558,6128,504
9,1379,0639,5859,915
Allother
re-ceipts1
4,6616,0665,0373,418
2,6793,0833,2983,4563,833
4,4694,8544,7215,1415,384
6,4186,3045,7317,294
Budget expenditures by function
Total
60,32638,92332,95539,474
39,54443,97065,30374,12067,537
64,38966,22468,96671,36980,342
76,53981,51587,78792,64298,405
97,900
Na-tional
defense
43,17614,36811,77112,908
13,00922,44443,97650,44246,986
40,69540,72343,36044,23446,491
45,69147,49451,10352,755
Veter-ans'serv-icesand
bene-fits
4,4157,3816,6536,725
6,6465,3424,8634,3684,341
4,5224.8104,8705,1845,287
5,2665,4145,4035,186
Agri-cul-tureandagri-
cultur-al re-
sources
7471,243
5752,512
2,783650
1,0452,9552,573
4,3884,8684,5464,4196,590
4,8825,1735,8956,948
Inter-est
4,8165,0125,2485,445
5,8175,7145,9346,5786,470
6,4386,8467,3077,6897,671
9,2669,0509,1989,980
Allother
expend-itures 2
7,17310,9178,708
11,884
11,2889,8199,4869,7777,167
8,3468,9778,8839,843
14,303
11,43414,38416,18617,773
Budgetsurplusor defi-cit (-)
-20,676754
8,419-1,811
-3,1223,510
-4,017-9,449-3,117
-4,1801,6261,596
-2,819-12,427
1,224-3,856-6,378-6,266
-10,005
—4,900
* Includes employment taxes, estate and gift taxes, customs revenues, and miscellaneous receipts. Seealso Note below.
* Includes expenditures for international affairs and finance; space research and technology; naturalresources; commerce and transportation; housing and community development; health, labor, and welfare;education; and general government. Annual expenditures (millions of dollars) for space research andtechnology, 1954-1964 are, respectively: 90, 74, 71, 76, 89,145, 401, 744,1,257, 2,400, and 4,200. Also includesadjustment to daily Treasury statement (for actuals) and allowance for contingencies (for estimates). Seealso Note below.
« Receipts reflect new depreciation guidelines and investment tax credit.< Estimate.NOTE.—Total budget receipts and total budget expenditures and the "all other" categories exclude cer-
tain interfund transactions.Sources: Treasury Department and Bureau of the Budget.
275
Digitized for FRASER http://fraser.stlouisfed.org/ Federal Reserve Bank of St. Louis
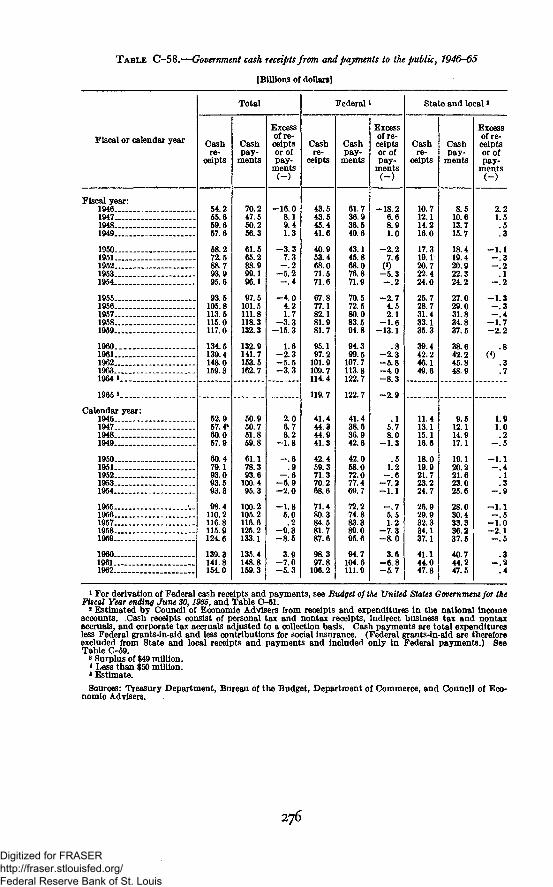
TABLE C-58.—Government cash receipts from and payments to the public, 7946-65
[Billions of dollars]
Fiscal or calendar year
Fiscal year:1946194719481949
19501951195219531954
19551956195719581959
19601961196219631964 *
1965 5
Calendar year:1946194719481949
19501951195219531954
1955 •._1956195719581959
I96019611962
Cashre-
ceipts
54.255.659.657.6
58.272.588.793.995.6
93.5105.8113.5115.0117.0
134.5139.4148.0159.3
52.957.4*60.057.9
60.479.193.093.593.3
98.4110.2116.8115.9124.6
139.3141 8154.0
Total
Cashpay-
ments
70.247.650.256.3
61.565.288.999.196.1
97.5101.5111.8118.3132.3
132.9141.7153.5162.7
50.950.751.859.8
61.178.393.6
100.495.3
100.2105.2116.6125.2133.1
135.4148.8159.3
Excessof re-ceiptsor ofpay-
ments
-16.08.19.41.3
- 3 . 37.3
- . 2- 5 . 2- . 4
- 4 . 04.21.7
- 3 . 3-15.3
1.6- 2 . 3- 5 . 5- 3 . 3
2.06.78.2
- 1 . 8
- . 6.9
- . 6- 6 . 9- 2 . 0
- 1 . 85.0.2
- 9 . 3- 8 . 5
3.9—7.0- 5 . 3
Cashre-
ceipts
43.543.545.441.6
40.953.468.071.571.6
67.877.182.181.981.7
95.197.2
101.9109.7114.4
119.7
41.444.344.941.3
42.459.371.370.268.6
71.480.384.581.787.6
98.397.8
106.2
Federal
Cashpay-
ments
61.736.936.540.6
43.145.868.076.871.9
70.572.580.083.594.8
94.399.5
107.7113.8122.7
122.7
41.438.636.942.6
42.058.072.077.469.7
72.274.883.389.095.6
94.7104.6111.9
Excessof re-ceiptsor ofpay-
ments
-18.26.68.91.0
—2.27.6
(*)—5.3- . 2
-2 .74.52.1
—1.6-13.1
.8- 2 . 3-5 .8- 4 . 0- 8 . 3
- 2 . 9
.15.78.0
- 1 . 3
.51.2
- . 6- 7 . 2—1.1
- . 75.51.2
—7 3- 8 . 0
3.6—6 8-5 .7
State and local >
Cashre-
ceipts
10.712.114.216.0
17.319.120.722.424.0
25.728.731.433.135.3
39.442.246.149.6
11.413.115.116.6
18.019.921.723.224.7
26.929.932.334 137.1
41.144 047.8
Cashpay-
ments
8.510.613.715.7
18.419.420.922.324.2
27.029.031.834.837.5
38.642.245.848.9
9.512.114.917.1
19.120 221.623.025.6
28.030.433.336 237.5
40.744.247.5
Excessof re-ceiptsor ofpay-
ments
2.21 5
. 53
—1.1
- . 2.1
- . 2
—1.3__ q- . 4
—1.7- 2 . 2
.8
g.7
1.91.0.2
- . 5
- 1 . 1—.4
.13
—.9
- 1 . 1- . 5
- 1 . 0—2 1- . 5
.3—.2
. 4
* For derivation of Federal cash receipts and payments, see Budget of the United States Government for theFiscal Year ending June SO, 1965, and Table C-61.
2 Estimated by Council of Economic Advisers from receipts and expenditures in the national incomeaccounts. Cash receipts consist of personal tax and nontax receipts, indirect business tax and nontaxaccruals, and corporate tax accruals adjusted to a collection basis. Cash payments are total expendituresless Federal grants-in-aid and less contributions for social insurance. (Federal grants-in-aid are thereforeexcluded from State and local receipts and payments and included only in Federal payments.) SeeTable C-59.
a Surplus of $49 million.* Less than $50 million.»Estimate.Sources: Treasury Department, Bureau of the Budget, Department of Commerce, and Council of Eco-
nomic Advisers.
276
Digitized for FRASER http://fraser.stlouisfed.org/ Federal Reserve Bank of St. Louis
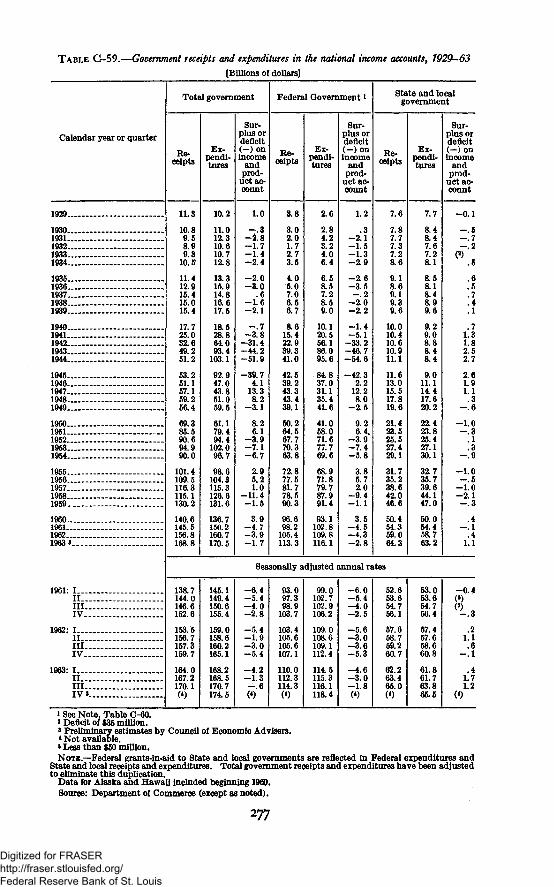
TABLE C-59.—Government receipts and expenditures in the national income accounts, 7929-63
[Billions of dollars]
Calendar year or quarter
1929
1930 ,1931193219331934
19351936193719381939
19401941194219431944
19451946 —194719481949
19501951195219531954
19551956195719581959
19601961 .19621963 3
1961- IIII l lIV
1962: IIII l lIV-.- -
1963: III . —III .IV >- -
Total government
Re-ceipts
11.3
10.89.58.99.3
10.5
11.412.915.415.015.4
17.725.032.649.251.2
53.251.157.159.256.4
69.385.590.694.990.0
101.4109.5116.3115.1130.2
140.6145.5156.8168.8
Ex-pendi-tures
10.2
11.012.310.610.712.8
13.315.914.816.617.5
18.528.864.093.4
103.1
92.947.043.851.059.5
61.179.494.4
102.096.7
98.6104.3115.3126.6131.6
136.7150.2160.7170.5
Sur-plus ordeficit(-)onincome
andprod-
uct ac-count
1.0
- . 3- 1 8—1.7- 1 . 4- 2 . 4
2.0-3 .0
.6-1 .6- 2 . 1
- . 7-3 .831.4
-44.2-51.9
-39.74.1
13.38.23.1
8.26.1
-3 .9- 7 . 1-6 .7
2.95.21.0
-11.4- 1 . 5
3.9—4.7-3 .9- 1 . 7
Federal Government *
Re-ceipts
3.8
3.02.01.72.73.5
4.05.07.06.56.7
8.615.422.939.341.0
42.539.243.343.439.1
50.264.567.770.363.8
72.877.581.778.590.3
96.698.2
105.4113.3
Ex-pendi-tures
2.6
2.84.23.24.06.4
6.58.57.28.59.0
10.120.556.186.095.6
84.837.031.135.441.6
41.058.071.677.769.6
68.971.879.787.991.4
93.1102.8109.8116.1
Sur-plus ordeficit(-)onincome
andprod-
uct ac-count
1.2
.3-2.1-1.5—1.3-2 .9
- 2 . 6- 3 . 5—.2
- 2 . 0—2.2
- 1 . 4- 5 . 1
-33.2-46.7—54.6
-42.32.2
12.28.0
- 2 . 5
9.26.4,
—3.9-7 .4—5.8
3.85.72.0
-9 .4- 1 . 1
3.5—4.5- 4 . 3- 2 . 8
State and localgovernment
Re-ceipts
7.6
7.87.77.37.28.6
9.18.69.19.39.6
10.010.410.610.911.1
11.613.015.517.819.6
21.423.525.527.429.1
31.735.238.642.046.6
50.454.359.064.3
Ex-pendi-tures
7.7
8.48.47.67.28.1
8.58.18.48.99.6
9.29.08.88.48.4
9.011.114.417.620.2
22.423.825.427.130.1
32.735.739.644.147.0
50.054.458.763.2
Sur-plus ordeficit(-)onincome
andprod-
uct ac-count
-0.1
—.6
—.2(8)
.5
.6
.5
.7
.4
.1
.71.31.82.52.7
2.61.91.1.3
—.6
- 1 . 0- . 3
.1
.3—.9
-1 .0- . 5
- 1 . 0—2.1- . 3
.4—. 1
.41.1
Seasonally adjusted annual rates
138.7144.0146.6152.6
153.5156.7157.3159.7
164.0167.2170.1(*)
145 1149.4150.6155.4
159.0158.6160.2165.1
168.2168.5170.7174.5
—6.4-5 .4- 4 . 0- 2 . 8
—5.4- 1 . 9—3.0-5 .4
-4 .2- 1 . 3- . 60)
93.097.398.9
103.7
103.4105.6105.6107.1
110.0112.3114.3(*)
99.0102.7102.9106.2
109.0108.6109.1112.4
114.5115.3116.1118.4
- 6 . 0-5 .4- 4 . 0- 2 . 5
—5.6—3.0—3.6
5.3
—4.6-3 .0-1 .80)
52.653.654.756.1
57.658.759.260.7
62.263.465.0(*)
53.053.654.756.4
57.457.658.660.8
61.861.763.865.5
- 0 . 4(8)(5)- . 3
.21.1.6
- . 1
.41.71.2
0)
i See Note, Table C-£0.a Deficit of $35 million.3 Preliminary estimates by Council of Economic Advisers.• Not available.* Less than $50 million.NOTE.—Federal grants-in-aid to State and local governments are reflected in Federal expenditures and
State and local receipts and expenditures. Total government receipts and expenditures have been adjustedto eliminate this duplication.
Data for Alaska and Hawaii included beginning 1960.Source: Department of Commerce (except as noted).
277
Digitized for FRASER http://fraser.stlouisfed.org/ Federal Reserve Bank of St. Louis
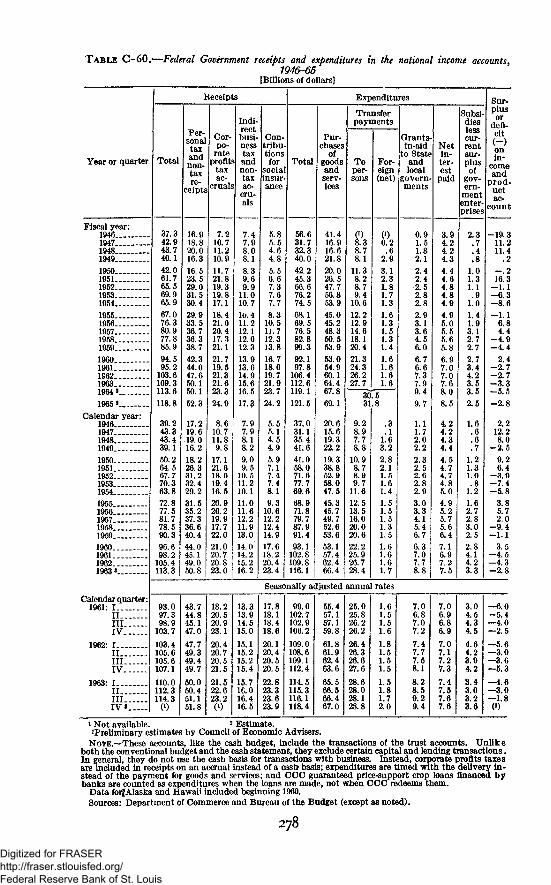
T A B L E C-60.—Federal Government receipts and expenditures in the national income accounts.194&-G5
[Billions of dollars]
Year or quarter
Fiscal year:1946194719481949
19501951195219531954
19551956195719581959
I9601961196219631964 a
1965 3
Calendar year:1946194719481949195019511952 _.19531954
19551956195719581959
1960196119621963 3
Calendar quarter:1961: I
IIIIIIV
1962: IIII l lIV
1963: IIIIIIIV»
Receipts
Total
37.342.943.740.142.061.765.569.965.967.076.380.977.885.994.595.2
103.6109.3113.6118.8
39.243.343.439.150.264.567.770.363.872.877.581.778.590.396.698.2
105.4113.3
Per-sonaltaxandnon-taxre-
ceipts
16.918.820.016.316.523.529.031.530.429.933.536.736.338.742.344.047.650.150.152.3
17.219.619.016.218.226.331.232.429.231.535.237.336.640.444.045.149.050.8
Cor-po-
rateprofit
taxac-
cruals
7.210.711.210.9
11.721.819.319.817.118.421.020.417.321.121.719.521.321.623.324.9
8.610.711.89.8
17.121.618.619.416.520.920.219.917.722.021.020.720.823.0
Indi-
busi-nesstaxandnon-taxac-
cru-als
7.47.98.08.18.39 69.9
11.010.7lu. 411.212.112.012.313.913.614.915.616.5
17.3
7.97.98.18.2
9.09.5
10.511.210.111.011.612.211.913.014.014.215.216.2
Con-tributionsfor
sociainsurance
5.85.54.64.85.56.67.37.67.78.3
10.511.712.313.816.718.019.721.923.724.2
5.55.14.54.9
5.97.17.47.48.1
9.310.612.212.414.917.618.220.423.4
Expenditures
Total
56.631.732.340.042.245.366.676.274.568.169.576.582.890.392.197.8
106.4112.6119.1121.5
37.031.135.441.641.058.071.677.769.668.971.879.787.991.493.1
102.8109.8116.1
Pur-chases
ofgoodsandserv-ices
41.416.916.621.820.026.547.756.853.945.045.248.350.553.953.054.960.164.467.869.1
20.615.619.322.219.338.852.958.047.545.345.749.752.653.653.157.462.466.4
Transferpayments
Toper-sons
ft8.78.1
11.38.28.79.4
10.612.212.914.618.120.421.324.326.227.7
3031
9.28.97.78.8
10.98.78.99.7
11.612.513.516.020.020.622.225.926.728.4
For-eign(net)
0)0.2.6
2.93.12.31.81.71.31.61.31.51.31.41.61.61.61.6
.5
.8
.3
.11.63.22.82.11.51.61.4
1.51.51.51.31.5
1.61.61.61.7
Grants-in-aid
to Stateandlocal
govern-ments
0.91.51.82.12.42 42.52.82.82.93.13.64.56.06.76.67.37.99.49.7
1.11.72.02.2
2.32.52.62.82.9
3.03.34.15.46.7
6.37.07.78.8
Netin-ter-est
paid
3.94.24.24.34.44 64.84.84 94.95.05 55.65.86.97.07.07.68.08.5
4.24.24.34.4
4.54.74.74.85.0
4.95.25.75.66.4
7.16.97.27.5
Subsi-dies
cur-rentsur-plusof
gov-ern-
mententer-prises
2.3.7.4.8
1.01.31.1.9
1.01.41.93.12.72.72.73.44.23.53.52.5
1.6.6.6.7
1.21.31.0
. 81.2
1.62.72.83.02.5
2.84.14.23.3
Sur-plusor
defi-cit(-)onin-
comeand
prod-uctac-
count
-19.311.211.4
.2- . 216.3
—1.1- 6 . 3- 8 . 6—1.1
6.84 4
- 4 . 9- 4 . 4
2.4- 2 . 7- 2 . 7- 3 . 3- 5 . 5-2.8
2.212.28.0
-2.59.26.4
- 3 . 9—7.4- 5 . 8
3.85.72.0
- 9 . 4— 1.1
3.5- 4 . 5—4.3- 2 . 8
Seasonally adjusted annual rates
93.097.398.9
103.7
103.4105.6105.6107.1
110.0112.3114.3
0)
43.744.845.147.0
47.749.349.449.7
50.050.451.151.8
18.220.520.923.1
20.420.720.521.5
21.522.623.20)
13.313.914.515.015.115.215.215.4
15.716.016.416.5
17.818.118.418.6
20.120.420.520.5
22.823.323.623.9
99.0102.7102.9106.2
109.0108.6109.1112.4
114.5115.3116.1118.4
55.457.157.159.8
61.861.962.463.6
65.566.566.467.0
25.025.826.226.2
26.426.326.627.6
28.628.028.128.8
1.61.51.51.6
1]
]
.8L.5L.5.5
,5.8
1.72.0
7.06.87.07.2
7.47.77.58.1
8.28.59.29.4
7.06.96.86.9
7.07.17.27.3
7.47.57.67.6
3.04.54.34.5
4.64.23.94.23.43.03.23.6
—6.0- 5 . 4--4.0—2.5
—5.6—3.0—3.6—5.3
—4.6—3.0—1.80)
i Not available. 2 Estimate.•Preliminary estimates by Council of Economic Advisers.
NOTE.—These accounts, like the cash budget, include the transactions of the trust accounts. Unlikeboth the conventional budget and the cash statement, they exclude certain capital and lending transactions.In general, they do not use the cash basis for transactions with business. Instead, corporate profits taxesare included in receipts on an accrual instead of a cash basis; expenditures are timed with the delivery in-stead of the payment for goods and services; and CCC guaranteed price-support crop loans financed bybanks are counted as expenditures when the loans are made, not when CCC redeems them.
Data forJAlaska and Hawaii included beginning 1960.Sources: Department of Commerce and Bureau of the Budget (except as noted).
Digitized for FRASER http://fraser.stlouisfed.org/ Federal Reserve Bank of St. Louis
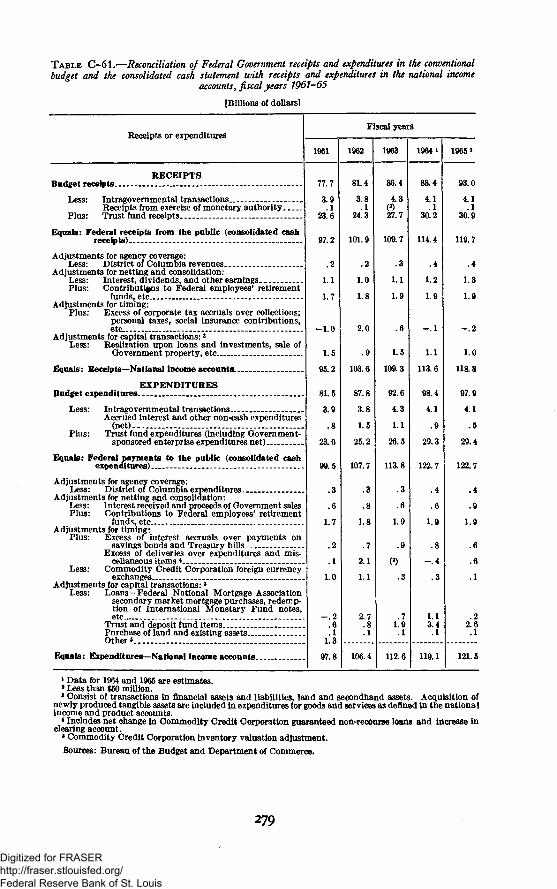
T A B L E G-61.—Reconciliation of Federal Government receipts and expenditures in the conventionalbudget and the consolidated cash statement with receipts and expenditures in the national income
accounts, fiscal years 1961-65
[Billions of dollarsl
Receipts or expendituresFiscal years
1961 1962 1963 1964 1 1965
Budget receipts..RECEIPTS
Less: Intragovernmental transactions . .Receipts from exercise of monetary authority
Plus: Trust fund receipts
Equals: Federal receipts from the public (consolidated cashreceipts) .- -
Adjustments for agency coverage:Less: District of Columbia revenues
Adjustments for netting and consolidation:Less: Interest, dividends, and other earningsPlus: Contributions to Federal employees' retirement
funds, etcAdjustments for timing:
Plus: Excess of corporate tax accruals over collections;personal taxes, social insurance contributions,etc
Adjustments for capital transactions: *Less: Realization upon loans and investments, sale of
Government property, etc
Equals: Receipts—National income accounts.
Budget expenditures.
Less:
EXPENDITURES
Intragovernmental transactions..Accrued interest and other non-cash expenditures
(net)Plus: Trust fund expenditures (including Government-
sponsored enterprise expenditures net)
Equals: Federal payments to the public (consolidated cashexpenditures)
Adjustments for agency coverage:Less: D istrict of Columbia expenditures
Adjustments for netting and consolidation:Less: Interest received and proceeds of Government sales.Plus: Contributions to Federal employees' retirement
funds, etc.—Adjustments for timing:
Plus: Excess of interest accruals over payments onsavings bonds and Treasury bills. _
Excess of deliveries over expenditures and mis-cellaneous items * _
Less: Commodity Credit Corporation foreign currencyexchanges
Adjustments for capital transactions:3
Less: Loans—Federal National Mortgage Associationsecondary market mortgage purchases, redemp-tion of International Monetary Fund notes,etc _
Trust and deposit fund itemsPurchase of land and existing assetsOther*
77.7
3.9.1
23.6
97.2
.2
1.1
1.7
- 1 . 0
1.5
95.2
81.5
23.0
99.5
.3
.6
1.7
.2
.1
1.0
- . 2.6.1
1.3
81.4
3.8.1
24.3
101.9
.2
1.0
1.8
2.0
.9
103.6
87.8
3.8
1.5
25.2
107.7
.3
.8
1.8
.7
2.1
1.1
2.7.8.1
86.4
4.3
8.T
109.7
.3
1.1
1.9
1.5
109.3
92.6
4.3
1.1
26.5
113.8
.3
.6
1.9
.9
(2)
.3
.71.9.1
88.4
4.1.1
30.2
114.4
.4
1.2
1.9
- . 1
1.1
113.6
98.4
4.1
.9
29.3
122.7
.4
.6
1.9
.8
- . 4
.3
1.13.4.1
Equals: Expenditures—National income accounts.. 97.8 106.4 112.6 119.1
93.0
4.1.1
30.9
119.7
.4
1.3
1.9
- . 2
1.0
118.8
97.9
4.1
.5
29.4
122.7
.4
.9
1.9
.22.6.1
121.5
» Data for 1964 and 1965 are estimates.8 Less than $50 million.8 Consist of transactions in financial assets and liabilities, land and secondhand assets. Acquisition of
newly produced tangible assets are included in expenditures for goods and services as defined in the nationalincome and product accounts.
* Includes net change in Commodity Credit Corporation guaranteed non-recourse loans and Increase inclearing account.
« Commodity Credit Corporation inventory valuation adjustment.
Sources: Bureau of the Budget and Department of Commerce.
279
Digitized for FRASER http://fraser.stlouisfed.org/ Federal Reserve Bank of St. Louis
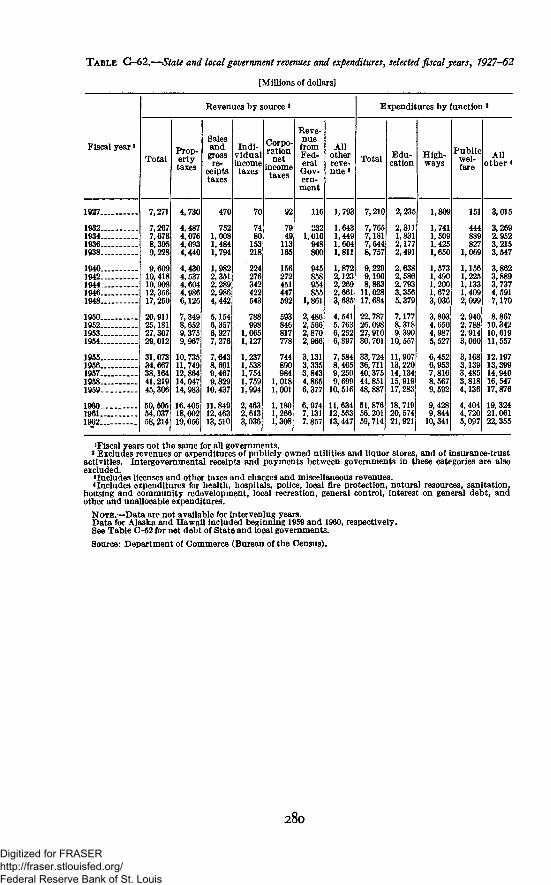
TABLE G-62.—State and local government revenues and expenditures, selected fiscal years, 7927-62
[Millions of dollars]
Fiscal year*
Revenues by source2
TotalProp-ertytaxes
Salesand
grossre-
ceiptstaxes
Indi-vidualincometaxes
Corpo-ration
netincometaxes
Reve-nuefromFed-eralGov-ern-
ment
Allotherreve-nue 3
Expenditures by function2
Total Edu-cation
High-ways
Publicwel-fare
Allother *
1927.
1932.1934.1936.1938.
1940.1942.19441946.1948.
1950.1952.1953.1954.
1955.1956.1957.1958.1959.
1960.1961.1962.
7,271
7,2677,6788,3959,228
10,41810,90812,35617,250
20,91125,18127,30729,012
31,07334,66738,16441,21945,306
50,50554,03758,214
4,730
4,4871, 076t, 093[,440
1,430t, 537[,604[,986
6,126
7,3498,6529,3759,967
10,73511,74912,86414,04714,983
16,40518,00219,056
470
7521,0081,4841,794
1,9822,3512,2892,9864,442
5,1546,3576,9277,276
7,6438,6919,467
10,437
11,84912,46313,510
70
7480153218
224276342422543
788998
1,0651,127
1,2371,5381,7541,7591,994
2,4632,613
92
7949113165
156272451447592
593846817778
744890984
1,0181,001
1,1801,2661T~~
116
2321,016948800
945858954855
1,861
2,4862,5662,8702,966
3,1313,3353,8434,8656,377
6,9747,1317.857
1,793
1,6431,4491,6041,811
1,8722,1232,2692,6613,685
4,5415,7636,2526,897
7,5848,4659,2509,699
10, 516
11, 63412,56313,447
7,210
7,7657,1817,6448,757
9,2299,1908,86311,02817,684
22,78726,09827,91030,701
33,72436, 71140,37544,85148,887
51, 87656,20159, 714
2,235
2,3111,8312,1772,491
2,6382,5862,7933,3565,379
7,1778,3189,39010,557
11,90713,22014,13415,91917,283
18, 71920,57421,921
1,8
1,7411,5091,4251,650
1,5731,4901,2001,6723,036
3,8034,6504,9875,527
6,4526,9537,8168,5679,592
9,4289,84410,341
151
444889827
1,069
1,1561,2251,1331,4092,099
2,9402,7882,9143,060
3,1683,1393,4853,8184,136
4,4044,7205,097
3,015
3,2692,9523,2153,547
3,8623,8893,7374,5917,170
8,86710,34210,61911,557
12,19713,39914,94016,54717,876
19,32421,06122,355
'Fiscal years not the same for all governments.* Excludes revenues or expenditures of publicly owned utilities and liquor stores, and of insurance-trust
activities. Intergovernmental receipts and payments between governments in these categories are alsoexcluded.
'Includes licenses and other taxes and charges and miscellaneous revenues.* Includes expenditures for health, hospitals, police, local fire protection, natural resources, sanitation,
housing and community redevelopment, local recreation, general control, interest on general debt, andother and unallocable expenditures.
NOTE.—Data are not available for intervening years.Data for Alaska and Hawaii included beginning 1959 and 1960, respectively.See Table C-52 for net debt of State and local governments.
Source: Department of Commerce (Bureau of the Census).
280
Digitized for FRASER http://fraser.stlouisfed.org/ Federal Reserve Bank of St. Louis
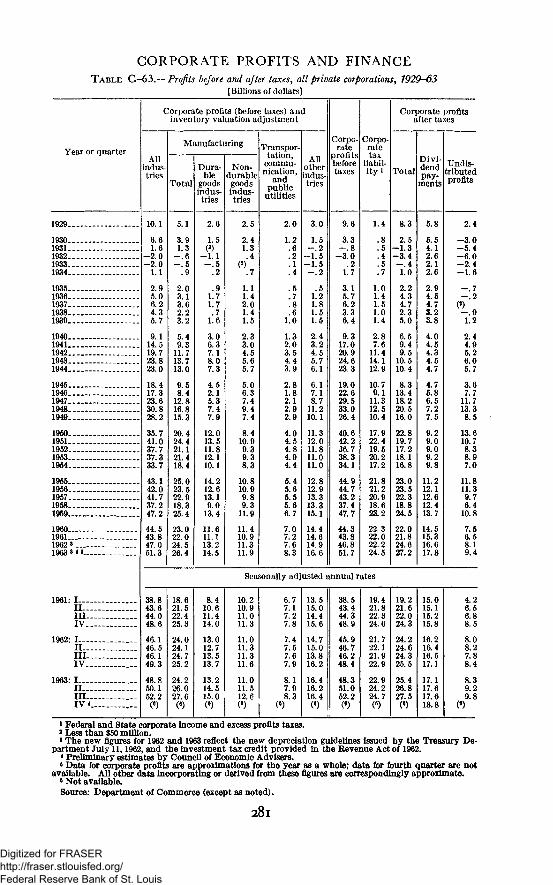
CORPORATE PROFITS AND FINANCETABLE C-63.—Profits before and after taxes, all private corporations, 1929-63
[Billions of dollars]
Year or quarter
1929
19301931193219331934
1935 - -1936193719381939
1940194119421943 _1944
19451946194719481949
1950195119521953 _1954
1955 -1956195719581959 _.
I960196119623
1 9 6 3 3 4 8
1961: IIIIIIIV
1962: IIIIIIIV ___
1963- III
IV«
Corporate profits (before taxes) andinventory valuation adjustment
Allindus-tries
10.1
6.61.6
-2.0-2.0
1.1
2.95.06.24.35.7
9.114.519.723.823.0
18.417.323.630.828.2
35.741.037.737.333.7
43.142.041.737.247.2
44.543.847.051.3
Manufacturing
Total
5.1
3.91.3
- . 6- . 5
.9
2.03.13.62.23.2
5.49.3
11.713.713.0
9.58.4
12.816.815.3
20.424.421.121.418.4
25.023.522.918.325.4
23.022.024.526.4
Dura-ble
goodsindus-tries
2.6
1.5
-1 .1
'.2
.91.71.7.7
1.6
3.06.37.18.07.3
4.52.15.37.47.9
12.013.511.812.110.1
14.212.613.19.0
13.4
11.611.113.214.5
Non-durablegoodsindus-tries
2.5
2.41.3.4
.7
1.11.42.01.41.5
2.33.04.55.65.7
5.06.37.49.47.4
8.410.99.39.38.3
10.810.99.89.3
11.9
11.410.911.311.9
Transpor-tation,
commu-nication,
andpublic
utilities
2.0
1.2.6.2.1.4
.5
.7
.8
.61.0
1.32.03.54.43.9
2.81.82.12.92.9
4.04.54.84.94.4
5.45.65.55.66.7
7.07.27.68.3
Allotherindus-tries
3.0
1.5- . 2
-1.5-1.5- . 2
.51.21.81.51.5
2.43.24.55.76.1
6.17.18.7
11.210.1
11.312.011.811.011.0
12.812.913.313.315.1
14.414.614.916.6
Corpo-rate
profitsbeforetaxes
9.6
3.3- . 8
-3.0.2
1.7
3.15.76.23.36.4
9.317.020.924.623.3
19.022.629.533.026.4
40.642.236.738.334.1
44.944.743.237.447.7
44.343.846.851.7
Corpo-ratetax
liabil-i ty!
1.4
.8
.5
.4
.5
.7
1.01.41.51.01.4
2.87.6
11.414.112.9
10.79.1
11.312.510.4
17.922.419.520.217.2
21.821.220.918.623.2
22.322.022.224.5
Corporate profitsafter taxes
Total
8.3
2.5-1 .3-3 .4- . 41.0
2.24.34.72.35.0
6.59.49.5
10.510.4
8.313.418.220.516.0
22.819.717.218.116.8
23.023.522.318.824.5
22.021.824.627.2
Divi-dendpay-
ments
5.8
5.54.12.62.12.6
2.94.54.73.23.8
4.04.54.34.54.7
4.75.86.57.27.5
9.29.09.09.29.8
11.212.112.612.413.7
14.515.316.617.8
Undis-tributedprofits
2.4
-3 .0-5.4-6 .0-2.4-1 .6
- . 7- . 2
Q
1.2
2.44.95.26.05.7
3.67.7
11.713.38.5
13.610.78.38.97.0
11.811.39.76.4
10.8
7.56.58.19.4
Seasonally adjusted annual rates
38.843.644.048.6
46.146.546.149.3
48.850.152.2
18.621.522.425.3
24.024.124.725.2
24.226.027.6
8.410.611.414.0
13.012.713.513.7
13.214.515.0
10.210.911.011.3
11.011.311.311.6
11.011.512.6
6.77.17.27.8
7.47.57.67.9
8.17.98.3
(*)
13.515.014.415.6
14.715.013.816.2
16.416.216.4
38.543.444.348.9
45.946.746.248.4
48.351.052.2
19.421.822.324.6
21.722.121.922.9
22.924.224.7
19.221.622.024.3
24.224.624.325.5
25.426.827.5
15.015.115.215.8
16.216.416.517.1
17.117.617.618.8
4.26.56.88.5
8.08.27.88.4
8.39.29.8
1 Federal and State corporate income and excess profits taxes.» Less than $50 million.a The new figures for 1962 and 1963 reflect the new depreciation guidelines issued by the Treasury De-
partment July 11,1962, and the investment tax credit provided in the Revenue Act of 1962.* Preliminary estimates by Council of Economic Advisers.5 Data for corporate profits are approximations for the year as a whole; data for fourth quarter are not
available. All other data incorporating or derived from these figures are correspondingly approximate.»Not available.Source: Department of Commerce (except as noted).
281
Digitized for FRASER http://fraser.stlouisfed.org/ Federal Reserve Bank of St. Louis
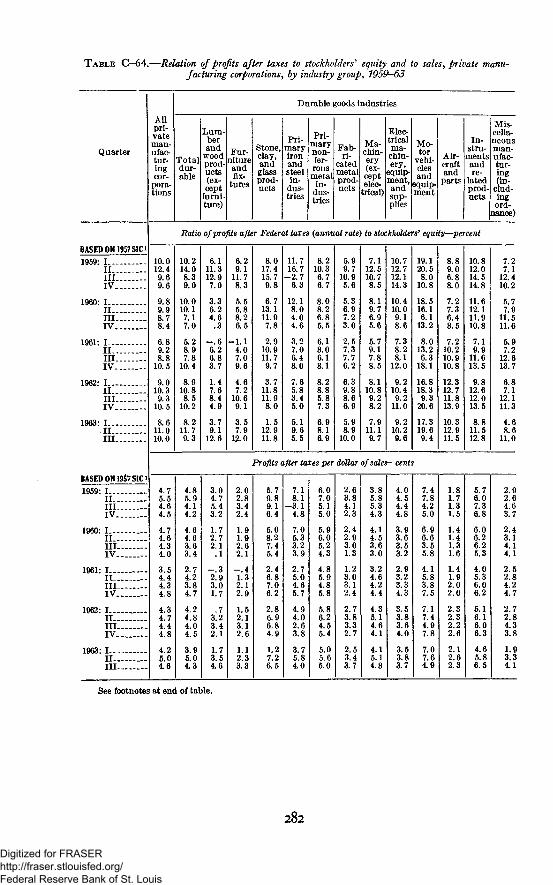
TABLE C-64.—Relation of profits after taxes to stockholders* equity and to sales, private manu-facturing corporations, by industry group, 1959—63
Quarter
Allpri-vateman-ufac-tur-ingcor-
pora-tions
Durable goods industries
Totaldur-able
Lum-berand
woodprod-ucts(ex-cept
furni-ture)
Fur-nitureandfix-
tures
Stone,clay,andglassprod-ucts
Pri-maryironandsteelin-
dus-tries
Pri-marynon-fer-rousmetal
in-dus-tries
Fab-ri-
catedmetalprod-ucts
Ma-chin-ery(ex-ceptelec-
trical)
Elec-tricalma-chin-ery,
equip-ment,andsup-plies
Mo-tor
vehi-clesand
equip-ment
Air-craftand
parts
In-stru-
mentsandre-
latedprod-ucts
Mis-cella-neousman-ufac-tur-ing(in-
clud-ingord-
nance)
BASED ON 1957 SIC
1959: IIIIIIIV
1960: IIIIIIIV
1961: I -II.- .IllIV -
1962: III -IIIIV
1963: IIIIII
BASED ON 19^7 SIC
1959: I — .II—III-IV..
1960:II—III-IV..
1961: I—.II—III-IV-.
1962: III.-—". -III -IV -
1963: I..,.II—III-
Batio of profits after Federal taxes {annual rate) to stockholders' equity—percent
10.012.49.69.6
9.89.98.78.4
6.89.28.8
10.5
9.010.39.3
10.5
8.611.010.0
10.214.08.39.0
10.010.17.17.0
5.28.97.8
10.4
8.910.88.5
10.2
8.211.79.3
6.111.312.97.0
3.36.24.6
. 3
- . 66.26.83.7
1.47.68.44.9
3.79.1
12.6
6.29.1
11.78.3
5.55.88.26.5
-1 .14.07.09.6
4.67.2
10.69.1
3.57.9
1 .0
8.017.415.79.8
6.713.111.97.8
2.910.911.79.7
3.711.811.98.0
1.512.911.8
11.716.7
-2.76.3
12.18.04.04.6
3.27.06.48.0
7.65.83.45.0
5.19.65.5
8.210.36.76.7
8.08.26.85.5
6.18.06.18.1
8.28.85.87.3
6.98.16.9
5.99.7
10.95.6
5.36.97.23.0
2.57.37.76.2
6.39.88.66.9
5.98.9
10.0
7.112.510.78.5
8.19.76.95.6
5.79.17.88.5
8.110.89.28.2
7.911.19.7
10.712.712.114.3
10.410.09.18.6
7.38.28.1
12.0
9.210.49.2
11.0
9.210.29.6
19.120.58.0
10.8
18.516.16.1
13.2
8.013.26.3
18.1
16.818.3
9.320.6
17.319.69.4
8.89.06.88.0
7.27.36.48.5
7.210.210.910.8
12.312.711.813.9
10.312.911.5
10.812.014.514.8
11.612.111.910.8
7.19.9
11.613.5
9.812.612.013.5
8.811.512.8
Profits after taxes per dollar of sales—cents
4.75.54.64.5
4.74.64.34.0
3.54.44.34.8
4.34.74.44.8
4.25.04.6
4.85.94.14.2
4.64.63.63.4
2.74.23.84.7
4.24 .84.04.5
3.95.04.3
3.04.75.43.2
1.72.72.1
. 1
- . 32 .93.01.7
.73.23.42.1
1.73.54.6
2.02.83.42.4
1.91.92.62.1
- . 41.32.12.9
1.52.13.12.6
1.12.33.3
5.79.89.16.4
5.08.27.45.4
2.46.87.06.2
2.86.96.84.9
1.27.26.5
7.18.1
-3 .14.8
7.05.33.23.9
2.75.04.65.7
4.94.02.63.8
3.75.84.0
6.07.05.15.0
5.96.05.24.3
4.85.94.85.8
5.86.24.55.4
5.05.65.0
2.63.84.12.3
2.42.93.01.3
1.23.03.12.4
2.73.83.32.7
2.53.43.7
3.85.85.34.3
4.14.53.63.0
3.24.64.24.4
4.35.14.64.1
4 .15.14.8
4.04.54.44.8
3.93.63.53.2
2.93.23.34.3
3.53.83.64.0
3.53.83.7
7.47.84.25.0
6.96.63.55.8
4.15.83.87.5
7.17.44.97.8
7.07.64.9
1.81.71.31.5
1.41.41.31.6
1.41.92.02.0
2.32.32.22.6
2 .12.62.3
5.76.07.36.8
6.06.26.25.3
4.05.36.06.2
5.16.16.06.3
4.65.86.5
7.27.1
12.410.2
5.77.9
11.511.6
5.97.2
12.613.7
6.87.1
12.111.3
4.68.6
11.0
2.92.64.63.7
2.43.14.14.1
2.52.84.24.7
2.72.84.33.8
1.93.34.1
See footnotes at end of table.
282
Digitized for FRASER http://fraser.stlouisfed.org/ Federal Reserve Bank of St. Louis
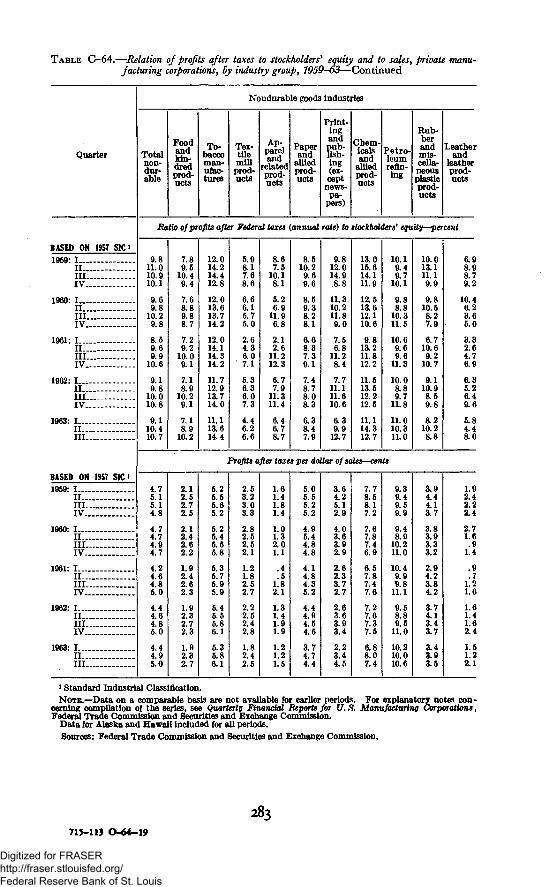
TABLE C-64.—Relation of profits after taxes to stockholders' equity and to sales, private manu-facturing corporations, By industry group, 1959-63—Continued
Quarter
BASED ON 1957 SIC 11959: I
IIIIIIV
I960: IIIIIIIV
1961: IIIIIIIV
1962: IIIIIIIV .
1963: IIIIII -
BASED ON 1957 SIC i1959: I
IIIl lIV
1960: IIII l lIV
1961: IIIIIIIV
1962: IIIIl lIV
1963: IIIIII
Nondurable goods industries
Totalnon-dur-able
Foodandkin-dredprod-ucts
To-baccoman-ufac-tures
Tex-tilemillprod-ucts
Ap-pareland
relatedprod-ucts
Paperand
alliedprod-ucts
Print-ingandpub-lish-ing(ex-cept
news-pa-
pers)
Chem-icalsand
alliedprod-ucts
Petro-leumrefin-ing
Rub-berandmis-cella-neousplasticprod-ucts
Leatherand
leatherprod-ucts
Ratio of profits after Federal taxes (annual rate) to stockholders' equity—percent
9.811.010.910.1
9.69.8
10.29.8
8.59.69.9
10.6
9.19.8
10.010.8
9.110.410.7
4.75.15.14.8
4.74.74.94.7
4.24.64.85.0
4.44.64.85.0
4.44.95.0
7.89.5
10.49.4
7.68.89.88.7
7.29.2
10.09.1
7.18.9
10.29.1
7.18.9
10.2
2.12.52.72.5
2.12.42.62.2
1.92.42.62.3
1.92.32.72.3
1.92.32.7
12.014.214.412.8
12.013.613.714.2
12.014.114.314.2
11.712.913.714.0
11.113.614.4
j
5.25.55.65.2
5.25.45.55.8
5.35.75.95.9
5.45.55.86.1
5.35.86.1
5.98.17.68.6
6.66.15.75.0
2.64.36.07.1
5.36.36.07.3
4.46.26.6
8.67.5
10.18.1
5.26.9
11.96.8
2.12.6
11.212.3
6.77.9
11.311.4
6.46.78.7
8.510.29.69.6
8.59.38.28.1
6.68.37.39.1
7.48.78.08.3
6.38.47.9
9.812.014.98.8
11.310.211.89.0
7.56.8
11.28.4
7.711.111.610.6
6.39.9
12.7
13.015.614.111.9
12.513.612.110.6
9.813.211.812.2
11.513.512.212.5
11.114.312.7
10.19.49.7
10.1
9.88.8
10.311.5
10.69.69.6
11.3
10.08.89.7
11.8
11.010.311.0
Profits after taxes per dollar of sales—cents
2.53.23.03.3
2.82.52.52.1
1.21.82.52.7
2.22.52.42.8
1.82.42.5
1.61.41.81.4
1.01.32.01.1
.4
.51.82.1
1.31.41.91.9
1.21.21.5
5.05.55.25.2
4.95.44.84.8
4.14.84.35.2
4.44.94.54.5
3.74.74.4
3.64.25.12.9
4.03.63.92.9
2.62.33.72.7
2.63.63.93.4
2.23.44.5
7.78.58.17.2
7.67.87.46.9
6.57.87.47.6
7.27.67.37.5
6.88.07.4
9.39.49.59.9
9.48.9
10.211.0
10.49.99.8
11.1
9.58.89.5
11.0
10.210.010.6
10.013.111.19.9
9.810.58.27.9
6.710.69.2
10.7
9.110.98.59.8
8.210.28.8
3.94.44.13.7
3.83.93.33.2
2.94.23.84.2
3.74.13.43.7
3.43.93.5
6.98.98.79.2
10.46.23.65.0
3.32.64.76.9
6.35.26.49.6
5.84.48.0
1.92.42.22.4
2.71.6.9
1.4
.9
.71.21.6
1.61.41.62.4
1.51.22.1
i Standard Industrial Classification.NOTE.—Data on a comparable basis are not available for earlier periods. For explanatory notes con-
cerning compilation of the series, see Quarterly Financial Reports for U. 8. Manufacturing Corporations,Federal Trade Commission and Securities and Exchange Commission.
Data for Alaska and Hawaii included for all periods.Sources: Federal Trade Commission and Securities and Exchange Commission.
283715-113
Digitized for FRASER http://fraser.stlouisfed.org/ Federal Reserve Bank of St. Louis
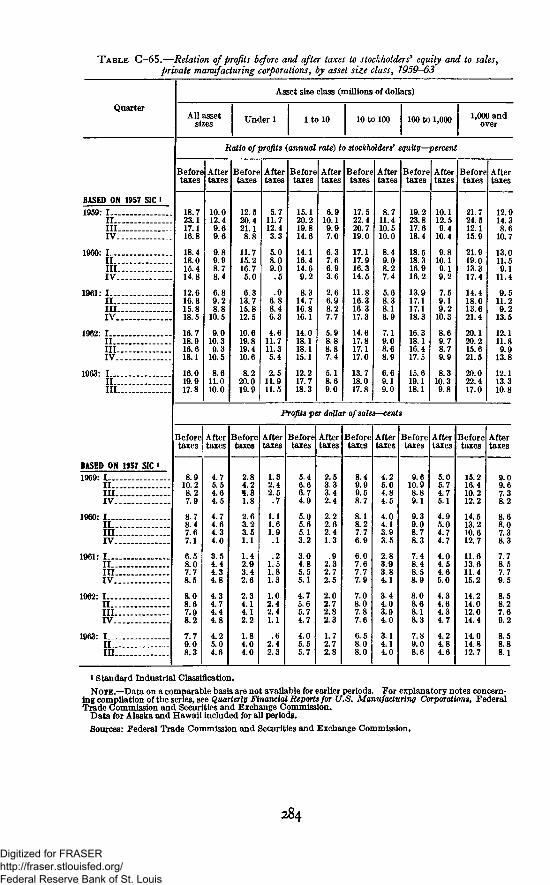
TABLE C-65.—Relation of profits before and after taxes to stockholders' equity and to sales,private manufacturing corporations, by asset size class, 1959-63
Quarter
BASED ON 1957 SIC t
1959: IIIIIIIV _
I960: II IIII . _ -IV
1961: I - ..III l lIV
1962- IIIIllIV
1963- IIIIII
BASED ON 1957 SIC '
1959: I .I I
IV
I960: III .IIIIV
1961: IIIIIIIV
1962: IIII l lIV
1963: III _III
Asset size class (millions of dollars)
All assetsizes
Beforetaxes
18.723.117.116.8
18.418.015.414.8
12.616.815.818.5
16.718.916.618.1
16.019.917.8
Under 1 l tc) 10 10 to 100
Ratio of profits (annual rate) to stockholders1
Aftertaxes
10.012.49.69.6
9.89.98.78.4
6.89.28.8
10.5
9.010.39.3
10.5
8.611.010.0
Beforetaxes
12.520.421.18.8
11.715.216.75.0
6.313.715.812.5
10.619.819.410.6
8.220.019.9
Aftertaxes
5.711.712.43.3
5.08.09.0
. 5
.96.88.46.3
4.611.711.35.4
2.511.911.5
Beforetaxes
15.120.219.814.6
14.116.414.69.2
8.314.716.816.1
14.018.118.115.1
12.217.718.3
Aftertaxes
6.910.19.97.0
6.37.66.93.6
2.66.98.27.7
5.98.88.87.4
5.18.69.0
Beforetaxes
17.522.420.719.0
17.117.916.314.5
11.816.316.317.3
14.617.817.117.0
13.718.017.8
Aftertaxes
8.711.410.510.0
8.49.08.27.4
5.68.38.18.9
7.19.08.68.9
6.69.19.0
100 to 1,000
equity—percent
Beforetaxes
19.223.817.618.4
18.518.316.916.2
13.917.117.118.3
16.318.116.417.5
15.619.118.1
Aftertaxes
10.112.59.4
10.4
9.810.19.19.2
7.59.19.2
10.3
8.69.78.79.9
8.310.39.8
1,000 andover
Beforetaxes
21.724.512.115.9
21.919.013.317.4
14.418.013.621.4
20.120.215.621.5
20.022.417.0
Aftertaxes
12.914.38.6
10.7
13.011.59.1
11.4
9.511.29.2
13.5
12.111.89.9
13.8
12.113.310.8
Profits per dollar of sales—cents
Beforetaxes
8.910.28.27.9
8.78.47.67.1
6.58.07.78.5
8.08.67.98.2
7.79.08.3
Aftertaxes
4.75.54.64.5
4.74.64.34.0
3.54.44.34.8
4.34.74.44.8
4.25.04.6
Beforetaxes
2.84.24 .31.8
2.63.23.51.1
1.42.93.42.6
2.34.14.12.2
1.84.04.0
Aftertaxes
1.32.42.5
. 7
1.11.61.9. 1
. 21.51.81.3
1.02.42.41.1
. 62.42.3
Beforetaxes
5.46.66.74.9
5.05.65.13.2
3.04.85.55.1
4.75.65.74.7
4.05.55.7
Aftertaxes
2.53.33.42.4
2.22.62.41.3
.92.32.72.5
2.02.72.82.3
1.72.72.8
Beforetaxes
8.49.99.58.7
8.18.27.76.9
6.07.67.77.9
7.08.07.87.6
6.58.08.0
Aftertaxes
4.25.04.84.5
4.04.13.93.5
2.83.93.84.1
3.44.03.94.0
3.14.14.0
Beforetaxes
9.610.98.89.1
9.39.08.78.3
7.48.48.58.9
8.08.68.18.3
7.89.08.6
Aftertaxes
5.05.74.75.1
4.95.04.74.7
4.04.54.65.0
4.34.64.34.7
4.24.84.6
Beforetaxes
15.216.410.212.2
14.513.210.612.7
11.613.611.415.2
14.214.012.014.4
14.014.812.7
Aftertaxes
9.09.67.38.2
8.68.07.38.3
7.78.57.79.5
8.58.27.69.2
8.58.88.1
i Standard Industrial Classification.
NOTE.—Data on a comparable basis are not available for earlier periods. For explanatory notes concern-ing compilation of the series, see Quarterly Financial Reports for U.S. Manufacturing Corporations, FederalTrade Commission and Securities and Exchange Commission.
Data for Alaska and Hawaii included for all periods.
Sources: Federal Trade Commission and Securities and Exchange Commission.
284
Digitized for FRASER http://fraser.stlouisfed.org/ Federal Reserve Bank of St. Louis
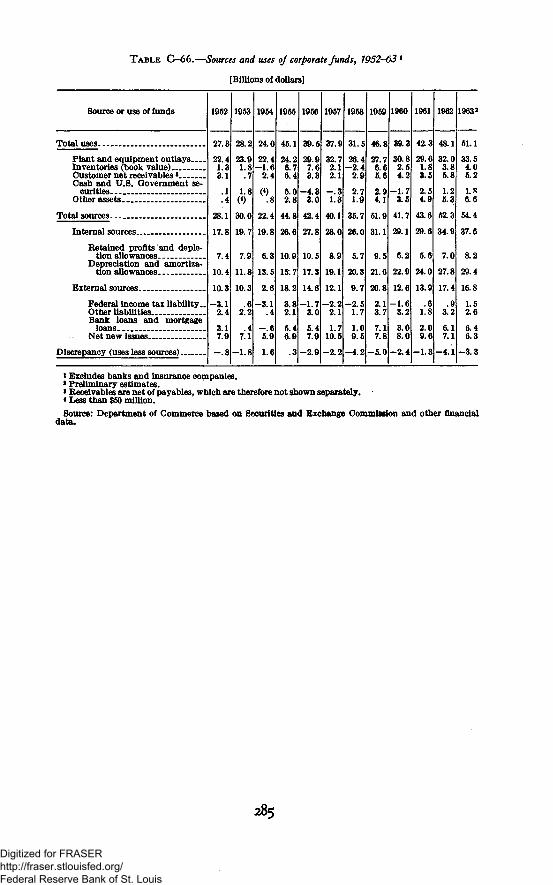
T A B L E C-66.—Sources and uses of corporate funds, 1952-63 *
[Billions of dollars]
Source or use of funds 1952
27.3
22.41.33.1
.1
.4
28.1
17.8
7.4
10.4
10.3
-3.12.4
3.17.9
-.8
1953
28.2
23.91.8.7
1.8W30.0
19.7
7.9
11.8
10.3
.62.2
.47.1
-1.8
1954
24.0
22.4-1.62.4
« .
22.4
19.8
6.3
13.5
2.6
-3.1.4
-.65.9
1.6
1955
45.1
24.26.76.4
5.02.8
44.8
26.6
10.9
15.7
18.2
3.82.1
5.46.9
.3
1956
39.5
29.97.63.3
-4.33.0
42.4
27.8
10.5
17.3
14.6
-1.73.0
5.47.9
-2.9
1957
37.9
32.72.12.1
-.31.3
40.1
28.0
8.9
19.1
12.1
-2.22.1
1.710.5
-2.2
1958
31.5
26.4-2.42.9
2.71.9
35.7
26.0
5.7
20.3
9.7
-2.51.7
1.09.5
-4.2
1959
46.8
27.76.65.6
2.94.1
51.9
31.1
9.5
21.6
20.8
2.13.7
7.17.8
-5.0
1960
39.3
30.82.54.2
1 73.5
41.7
29.1
6.2
22.9
12.6
-1.63.2
3.08.0
-2.4
1961
42.3
29.61.83.5
2.54.9
43.6
29.6
5.6
24.0
13.9
.61.8
2.09.6
-1.3
1962
48.1
32.03.85.8
1.25.3
52.3
34.9
7.0
27.8
17.4
.93.2
6.17.1
-4.1
19632
51.1
33.54.05.2
1.86.6
54.4
37.6
8.2
29.4
16.8
1.52.6
6.46.3
-3.3
Total uses.
Plant and equipment outlaysInventories (book value)Customer net receivables *Cash and U.S. Government se-
curitiesOther assets
Total sources .
Internal sources..
Retained profits and deple-tion allowances
Depreciation and amortiza-tion allowances
External sources
Federal income tax liability..Other liabilitiesBank loans and mortgage
loansNet new issues
Discrepancy (uses less sources)
i Excludes banks and insurance companies.* Preliminary estimates.> Receivables are net of payables, which are therefore not shown separately.< Less than $50 million.
Source: Department of Commerce based on Securities and Exchange Commission and other financialdata.
285
Digitized for FRASER http://fraser.stlouisfed.org/ Federal Reserve Bank of St. Louis
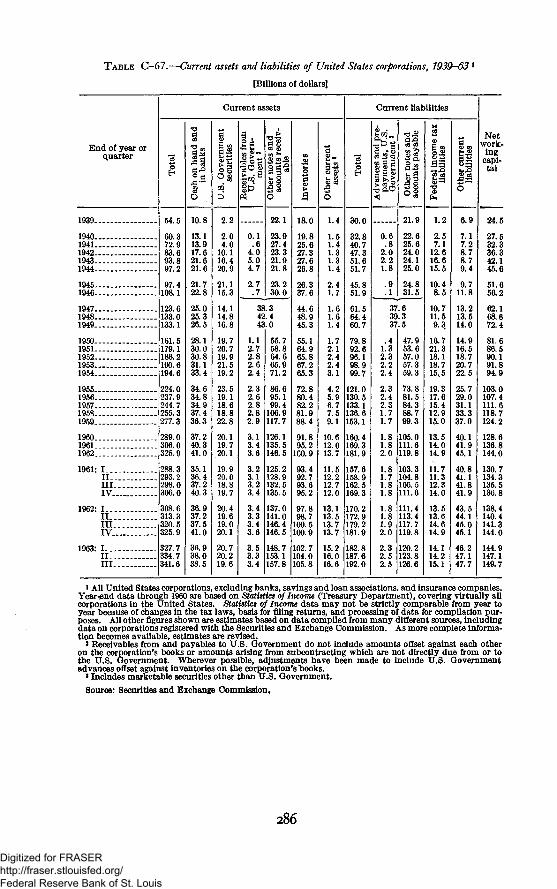
TABLE C-67.—Current assets and liabilities of United States corporations, 1939-63 l
[Billions of dollars]
End of year orquarter
Current assets
I! ha l lIS I ip
Current liabilities
m|!J
83P^5
Network-ing
capi-tal
19401941194219431944
19451946
194719481949
19501951195219531954
19551956195719581959
196019611962
1961: I_.II.I l lIV.
1962: I . .II.III.IV.
1963: I._II.III.
54.5
60.372.983.693.897.2
97.4108.1
123.6133.0133.1
161.5179.1186.2190.6194.6
224.0237.9244.7255.3277.3
289.0306.0325.9
293.2298.0306.0
313.3320.5325.9
327.7334.7341.6
10.8
13.113.917.621.621.6
21.722.8
25.025.326.5
28.130.030.831.133.4
34.634.834.937.436.3
37.240.341.0
35.136.437.240.3
36.937.237.541.0
38.038.5
2.2
2.04.0
10.116.420.9
21.115.3
14.114.816.8
19.720.719.921.519.2
23.519.118.618.822.8
20.119.720.1
19.920.018.819.7
20.419.619.020.1
20.720.219.6
0.1.6
4.05.04.7
2.7.7
22.1
23.927.423.321.921.8
23.230.0
38.342.443.0
1.12.72.82.62.4
2.32.62.82.82.9
3.13.43.6
3.23.13.23.4
3.43.33.43.6
3.53.33.4
55.758.864.665.971.2
86.695.199.4
106.9117.7
126.1135.5146.5
125.2128.9132.5135.5
137.0141.0146.4146.5
148.7153.1157.8
18.0
19.825.627.327.626.8
26.337.6
44.648.945.3
55.164.965.867.265.3
72.880.482.281.988.4
91.895.2
100.9
93.492.793.695.2
97.898.7
100.5100.9
102.7104.0105.8
1.4
1.51.41.31.31.4
2.41.7
1.61.61.4
1.72.12.42.43.1
4.25.96.77.59.1
10.612.013.7
11.512.212.712.0
13.113.513.713.7
15.216.016.6
30.0
32.840.747.351.651.7
45.851.9
61.564.460.7
79.892.696.198.999.7
121.0130.5133.1136.6153.1
160.4169.3181.9
157.6158.9162.5169.3
170.2172.9179.2181.9
182.8187.6192.0
0.6.8
2.02.21.8
21.9
22.625.624.024.125.0
24.831.5
37.639.337.5
.41.32.32.22.4
2.32.42.31.71.7
1.81.82.0
1.81.71.81.8
1.81.81.92.0
2.32.52.5
47.953.657.057.359.3
73.881.584.388.799.3
105.0111.6119.8
103.3104.8106.5111.6
111.4113.4117.7119.8
120.2123.8126.6
1.2
2.57.1
12.616.615.5
10.48.5
10.711.59.3
16.721.318.118.715,5
19.317.615.412.915.0
13.514.014.9
11.711.312.314.0
13.513.614.614.9
14.114.215.1
6.9
7.17.28.78.79.4
9.711.8
13.213.514.0
14.916.518.720.722.5
25.729.031.133.337.0
40.141.945.1
40.841.141.841.9
43.544.145.045.1
46.247.147.7
24.5
27.532.336.342.145.6
51.656.2
62.168.672.4
81.686.590.191.894.9
103.0107.4111.6118.7124.2
128.6136.8144.0
130.7134.3135.5136.8
138.4140.4141.3144.0
144.9147.1149.7
i All United States corporations, excluding banks, savings and loan associations, and insurance companies.Year end data through 1960 are based on Statistics of Income (Treasury Department), covering virtually allcorporations in the United States. Statistics of Income data may not be strictly comparable from year toyear because of changes in the tax laws, basis for filing returns, and processing of data for compilation pur-poses. All other figures shown are estimates based on data compiled from many different sources, includingdata on corporations registered with the Securities and Exchange Commission. As more complete informa-tion becomes available, estimates are revised.8 Receivables from and payables to U.S. Government do not include amounts offset against each otheron the corporation's books or amounts arising from subcontracting which are not directly due from or tothe U.S. Government. Wherever possible, adjustments have been made to include U.S. Governmentadvances offset against inventories on the corporation's "books.3 Includes marketable securities other than U.S. Government.
Source: Securities and Exchange Commission.
286
Digitized for FRASER http://fraser.stlouisfed.org/ Federal Reserve Bank of St. Louis
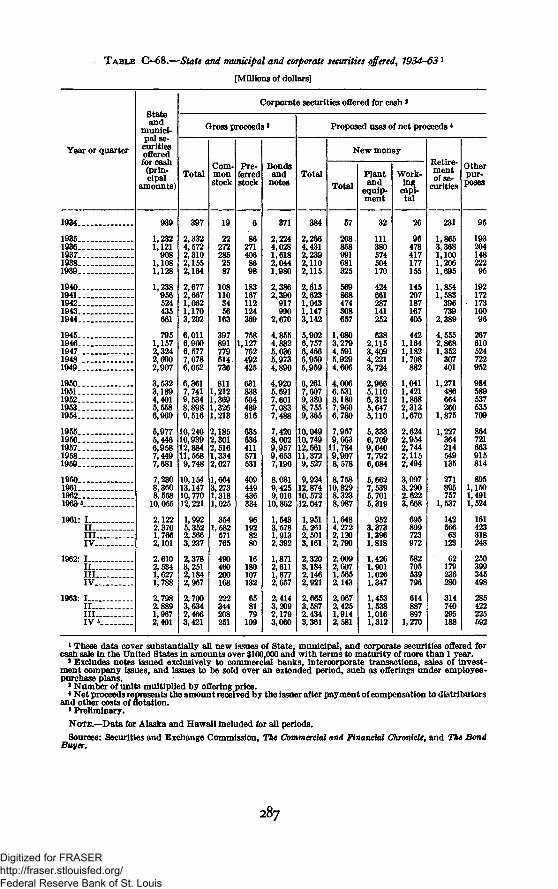
TABLE G-68.—State and municipal and corporate securities offered, 1934-63l
[Millions of dollars]
Year or quarter
1934
193519361937.19381939
19401941194219431944
1945194619471948.1949
1950.1951195219531954
19551956195719581959 ,...
19601961196219631
1961: I
III...IV.__
1962: IIIIII...IV.__
1963: IIIIII—
Stateand
munici-pal se-curitiesofferedfor cash(prin-cipal
amounts)
939
1,2321,121908
1,1081,128
1,238956524435661
7951,1572,3242,6902,907
3,5323,1894,4015,5586,969
5,9775,4466,9587,4497,681
7,2308,3608,55810,055
2,1222,3701,7662,101
2,6102,5341,6271,788
2,7982,8891,9672,401
Corporate securities offered for cash *
Qross proceeds *
Total
397
2,3324,5722,3102,1552,164
2,6772,6671,0621,1703,202
6,0116,9006,5777,0786,052
6,3617,7419,5348,8989,516
10,24010,93912,88411,5589,748
10,15413,14710,77012,221
1,9925,3522,5663,237
2,3783,2512,1842,957
2,7003,6342,4663,421
Com-monstock
19
222722852587
1081103456
163
397891779614736
8111,2121,3691,3261,213
2,1852,3012,5161,3342,027
1,6643,2731,3181,025
3541,582571765
490460200168
344208251
Pre-ferredstock
862714068698
183167112124
7581,127762492425
631838564489816
635636411571531
409449436334
1928280
16180107132
658179109
Bondsand
notes
371
2,2244,0281,6182,0441,980
2,3862,390
917990
2,670
4,8554,8825,0365,9734,890
4,9205,6917,6017,0837,488
7,4208,0029,9579,6537,190
8,0819,4259,016
10,862
1,5433,5781,9132,392
1,8712,6111,8772,657
2,4143,2092,1793,060
Proposed uses of net proceeds4
Total
384
2,2664,4312,2392,1102,115
2,6152,6231,0431,1473,142
5,9026,7576,4666,9595,959
6,2617,6079,3808,7559,365
10,04910,74912,66111,3729,527
9,92412,87410,57212,047
1,9515,2612,5013,161
2,3203,1842,1462,921
2,6653,5872,4343,361
New money
Total
57
208858991681325
474308657
1,0803,2794,5915,9294,606
4,0066,5318,1807,9606,780
7,9579,663
11,7849,9078,578
8,75810,8298,3238,987
1,6484,2722,1202,790
2,0092,6071,5652,143
2,0672,4251,9142,581
Plantand
equip-ment
111380574504170
424661287141252
6382,1153,4094,2213,724
2,9665,1106,3125,6475,110
5,3336,7099,0407,7926,084
5,6627,5395,7015,319
9523,3731,3961,818
,426,901,026,347
,453,538,016,312
Work-ing
capi-tal
96478417177155
145207187167405
4421,1641,1821,708
1,0411,4211,8682,3131,670
2,6242,9542,7442,1152,494
3,0973,2902,6223,668
723972
582705539796
614887897
1,270
Retire-mentof se-
curities
231
1,8653,368
,100,206
,854,583396739
2,389
4,5552,8681,352
307401
1,271486664260
1,875
1,227364214549135
271895757
1,537
14256663123
62179236280
314740295188
Otherpur-poses
9519320414822295
19217217310096
267610524722952
984589537535709
721663915814
8951,1501,4911,524
161423318248
250399345498
285422225592
1 These data cover substantially all new issues of State, municipal, and corporate securities offered forcash sale in the United States in amounts over $100,000 and with terms to maturity of more than 1 year.2 Excludes notes issued exclusively to commercial banks, intercorporate transactions, sales of invest*ment company issues, and issues to be sold over an extended period, such as offerings under employee -purchase plans.3 Number of units multiplied by offering price.
* Net proceeds represents the amount received by the issuer after payment of compensation to distributorsand other costs of flotation.
5 Preliminary.NOTE.—Data for Alaska and Hawaii ineluded for all periods.Sources: Securities and Exchange Commission, The Commercial and Financial Chronicle, and The Bond
Buyer.
287
Digitized for FRASER http://fraser.stlouisfed.org/ Federal Reserve Bank of St. Louis
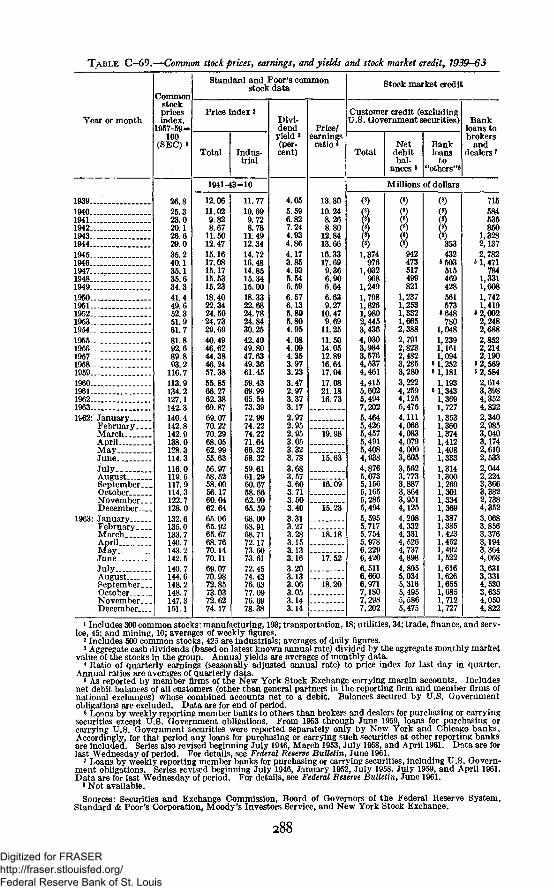
TABLE C-69.—Common stock prices, earnings, and yields and stock
Year or month
193919401941 . .1942...19431944194519461947..- .1948.. . ._1949 . .1950—19511952..195319541955—. . . . .195619571958—_19591960 . . . .1961.. _ . . .196219631962: January
FebruaryMarch..AprilM a yJune ___JulyAugustSeptember. __OctoberNovember. _.December
1963: JanuaryFebruaryMarchAprilMayJuneJulyAugustSeptemberOctoberNovemberDecember
Commonstockpricesindex,
1957-59=100
(SEC) i
26.825.323.020.126.629.035.240.135.135.634.341.449 652.351 961.781.892 689.893.2
116.7113.9134.2127.1142.3140 4142.8142.9138.0128.3114.3116 0119.5117.9114 3122.7128.0132.6135 0133.7140.7143.2142. 5140 7144.6148.2148 7147.3151.1
Standard and Poor's commonstock data
Price index 2
Total Indus-trial
1941-43=10
12.0611.029.828.67
11.5012.4715.1617.0815.1715.5315.2318.4022.3424.5024.7329.6940.4946.6244.3846.2457.3855.8566.2762.3869.8769.0770.2270.2968.0562.9955.6356.9758.5258.0056 1760.0462.6465.0665.9265.6768.7670.1470.1169.0770.9872.8573 0372.6274.17
11.7710.699.728.78
11.4912.3414.7216.4814.8515.3415.0018.3322.6824.7824.8430.2542.4049.8047.6349.3661.4559.4369.9965.5473.3972.9974.2274.2271.6466.3258.3259.6161.2960.6758 6662.9065.5968.0068.9168.7172.1773.6073.6172.4574.4376.6377 0976.6978.38
Divi-dendyield 3(per-cent)
4.055.596.827.244.934.864.173.854.935.546.596.576.135.805.804.954.084.094.353.973.233.472.973.373.172.972.952.953.053.323.783.683.573.603.713.503.403.313.273.283.153.133.163.203.133.063.053.143.14
Price/earningsratio *
13.8010.248.268.80
12.8413.6616.3317.699.366.906.646.639.27
10.479.69
11.2511.5014.0512.8916.6417.0417.0821.1816.73
19.98
15.63
16.09
15.23
18.18
17.52
18.20
market credit, 1939-63
Stock market credit
Customer credit (excludingU.S. Government securities)
TotalNet
debitbal-
ances 8
Bankloans
to"others'^
Bankloans tobrokers
anddealers7
Millions of dollars
(8)(8)(8)
ft1,374
9761,032
9681,2491,7981,8261,9802,4453,4364,0303,9843,5764,5374,4614,4155,6025,4947,2025,4645,4265,4575,4915,4084,9384,8765,0735,1565,1655,2855,4945,5955,7175,7545,9786,2296,4206,5116,6606,9717,1807,2987,202
mfta
942473517499821
1,2371,2531,3321,6652,3882,7912,8232,4823,2853,2803,2224,2594,1256,4754,1114,0664,0834,0794,0003,6053,5623,7733,8873,8643,9514,1254,2084,3324,3314,5264,7374,8984,8955,0345,3165,4955,5865,475
(8)(8)(8)(8)
353432
8 503515469428561573
8 648780
1,0481,2391,1611,094
81,2528 1,181
1,19381,343
1,3691,7271,3531,3601,3741,4121,4081,3331,3141,3001,2691,3011,3341,3691,3871,3851,4231,4521,4921,5221,6161,6261,6551,6851,7121,727
715584535850
1,3282,1372,782
81,471784
1,3311,6081,7421,419
8 2,0022,2482,6882,8522,2142,190
8 2,5695 2,584
2,6143,3984,3524,8222,3402,9853,0403,1742,6102,5332,0442,2243,3663,3822,7384,3523,0683,8563,3763,1943,3644,0683,6313,3314,5303,6354,0504,822
1 Includes 300 common stocks: manufacturing, 193; transportation, 18; utilities, 34; trade, finance, and serv-ice, 45; and mining, 10; averages of weekly figures.2 Includes 500 common stocks, 425 are industrials; averages of daily figures.
3 Aggregate cash dividends (based on latest known annual rate) divided by the aggregate monthly marketvalue of the stocks in the group. Annual yields are averages of monthly data.
* Ratio of quarterly earnings (seasonally adjusted annual rate) to price index for last day in quarter.Annual ratios are averages of quarterly data.
« As reported by member firms of the New York Stock Exchange carrying margin accounts. Includesnet debit balances of all customers (other than general partners in the reporting firm and member firms ofnational exchanges) whose combined accounts net to a debit. Balances secured by U.S. Governmentobligations are excluded. Data are for end of period.6 Loans by weekly reporting member banks to others than brokers and dealers for purchasing or carryingsecurities except U.S. Government obligations. From 1953 through June 1959, loans for purchasing orcarrying U.S. Government securities were reported separately only by New York and Chicago banks.Accordingly, for that period any loans for purchasing or carrying such securities at other reporting banksare included. Series also revised beginning July 1946, March 1953, July 1958, and April 1961. Data are forlast Wednesday of period. For details, see Federal Reserve Bulletin, June 1961.7 Loans by weekly reporting member banks for purchasing or carrying securities, including U.S. Govern-ment obligations. Series revised beginning July 1946, January 1952, July 1958, July 1959, and April 1961.Data are for last Wednesday of period. For details, see Federal Reserve Bulletin, June 1961.
8 Not available.Sources: Securities and Exchange Commission, Board of Governors of the Federal Reserve System,
Standard & Poor's Corporation, Moody's Investors Service, and New York Stock Exchange.
288
Digitized for FRASER http://fraser.stlouisfed.org/ Federal Reserve Bank of St. Louis
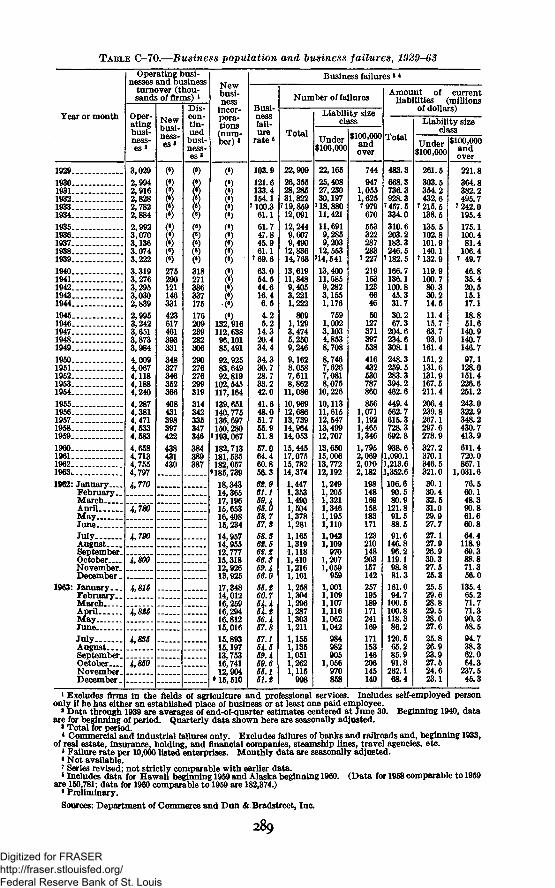
TABLE C-70.—Business population and business failures, 1929-63
Year or month
Operating busi-nesses and business
turnover (thou-sands of firms) *
Oper-atingbusi-ness-es a
Newbusi-ness-es*
Dis-con-tin-uedbusi-ness-e s '
Newbusi-ness
incor-pora-tions(num-ber ) '
Business failures > «
Busi-nessfail-ure
ra te 8
Number of failures
TotalUnder
$100,000
Liability sizeclass
$100,000andover
Amount of currentliabilities (millions
of dollars)
Total
Liability sizeclass
Under$100,000
$100,000andover
1929..1930.1931.1932.1933.1934..1935.1936.1937.1938.1939.1940.1941.1942.1943.1944.1945.1946.1947.1948..1949..1950.1951.1952..1953.1954..1955.1956.1957..1958..1959..I960..1961.1962..
3,0292,9942,9162,8282,7822,8842,9923,0703,1363,0743,2223,3193,2763,2953,0302,8392,9953,2423,6513,8733,9844,0094,0674,1184,1884,2404,2874,3814,4714,5334,5834,6584,7134,7554,797
<•)
1962: January....February..MarchADrilMayJune
4,770
4,780
JulyAugustSeptember.October.November.December.
1963: January._.February..MarchAprilMayJune _JulyAugustSeptember.October-November.December.
4,790
~4~,8M~
4,815
4,886
4~~850
275290121146331423617461393331
348327346352366408431398397422438431430
318271386337175176209239282306
290276276299319314342335347346384389387
132,916112,63896,10185,49192,92583,64992,819102,545117,164139,651140,775136,697150,2808193,067182,713181,535182,057•185,73918,34314,36517,19615,65316,40815,23414,95714,95512,77715,31812,92613,92517,34814,01216,25916,29416,81215,016
15,89315,19713,75316,74112,904• 15,510
103.9121.6133.4154.1
7 100.361.161.747.845.961.1
r69.663.054.544.616.46.54.25.2
14.320.434.434.330.728.733.242.041.648.051.755.951.857.064.460.856.362.961.169.465.068.767.868.862.662.266.859.456.055.260.764-464.266.467.867.164.569.459.666.151.2
22,90926,35528,28531,822
719,85912,09112,2449,6079,490
12,83614,76813,61911,8489,4053,2211,222809
1,1293,4745,2509,2469,1628,0587,6118,86211,08610,96912,68613,73914,96414,05315,44517,07515,78214,3741,4471,3531,4901,5041,3781,281
1,1651,3191,1181,4101,2161,101
1,2581,3041,2961,2871,3031,211
1,1551,1351,0511,2621,115998
22,16525,40827,23030,197718,88011,42111,6919,2859,20312,553714,54113,40011,6859,2823,1551,176759
1,0023,1034,8538,7088,7467,6267,0818,075
10,22610,11311,61512,54713,49912,707
13,65015,00613,77212,192
1,2491,2051,3211,3461,1951,110
1,0421,109970
1,2071,059959
1,0011,1091,1071,1161,0621,042
984982905
1,056970858
744
9471,0551,6257 979670
553322287283
7 2272191631236646
50127371397538416432530787860856
1,0711,1921,4651,3461,7952,0692, OK)2,182
198148169158183171
123210148203157142
257195189171241
171153146206145140
483.3668.3736.3928.3
7 457.5334.0310.6203.2183.3246.5
7182.5166.7136.1100.845.331.730.267.3
204.6234.6308.1248.3259.5283.3394.2462.6449.4562.7615.3728.3692.8938.6
1,090.11,213.6
106.690.580.9
121.891.588.591.6
146.896.2
119.198.881.3
161.094.7
100.5100.8118.386.2
120.565.285.991.8
262.168.4
261.5303.5354.2432.6
7 215.5138.5135.5102.8101.9140.1
7 132.9119.9100.780.330.214.511.415.763.793.9
161.4151.2131.6131.9167.5211.4206.4239.8267.1297.6278.9327.2370.1346.5321.030.130.432.531.029.927.727.127.926.930.327.525.325.529.628.829.528.027.625.826.923.927.524.623.1
221.8364.8382.2495.7
7 242.0195.4175.1100.481.4
106.47 49.7
46.835.420.515.117.118.851.6
140.9140.7146.797.1
128.0151.4226.6251.2243.0322.9348.2430.7413.9611.4720.0867.1
1,031.676.560.148.390.861.660.864.4
118.969.388.871.356.0
135.465.271.771.390.358.594.738.362.064.3
237.545.3
1 Excludes firms in the fields of agriculture and professional services. Includes self-employed persononly if he has either an established place of business or at least one paid employee.
8 Data through 1939 are averages of end-of-quarter estimates centered at June 30. Beginning 1940, dataare for beginning of period. Quarterly data shown here are seasonally adjusted.
* Total for period.* Commercial and industrial failures only. Excludes failures of banks and railroads and, beginning 1933,
of real estate, insurance, holding, and financial companies, steamship lines, travel agencies, etc.* Failure rate per 10,000 listed enterprises. Monthly data are seasonally adjusted.«Not available.7 Series revised; not strictly comparable with earlier data.8 Includes data for Hawaii beginning 1959 and Alaska beginning 1960. (Data for 1958 comparable to 1959
are 150,781; data for 1960 comparable to 1959 are 182,374.)9 Preliminary.Sources: Department of Commerce and Dun & Bradstreet, Inc.
289
Digitized for FRASER http://fraser.stlouisfed.org/ Federal Reserve Bank of St. Louis
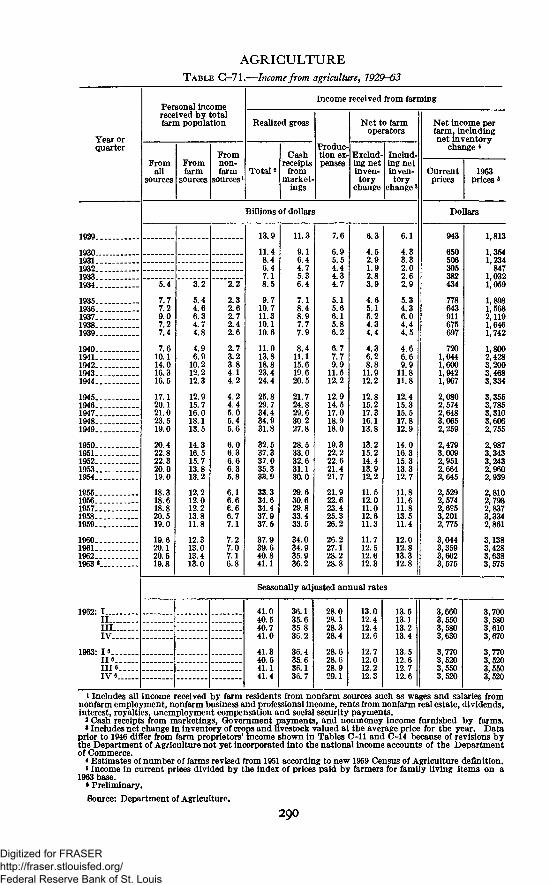
AGRICULTURETABLE C-71.—Income from agriculture, 1929-63
Year orquarter
1929
19301931193219331934
193519361937 .19381939
19401941.194219431944
19451946194719481949.
19501951195219531954
19551956195719581959
1960196119621963 «
1962: IIIIII ____IV
1963: 16II«III 6IV« . . . .
Personal incomereceived by totalfarm population
Fromall
sources
5.4
7.77.29.07.27.4
7.610.114.016.316.5
17.120.121.023.519.0
20.422.822.320 019.0
18.318.618.820.519.0
19.620.120.519.8
Fromfarm
sources
3.2
5.44.66.34.74.8
4.96.9
10.212.212.3
12.915.716.018.113.5
14.316.515.713 813.2
12.212.012.213.811.8
12.313.013.413.0
Fromnon-farm
sources1
2.2
2.32.62.72.42.6
2.73.23.84.14.2
4.24.45.05.45.6
6.06.36.66.35.8
6.16.66.66.77.1
7.27.07.16.8
Income received from farming
Realized gross
Total 2
Cashreceipts
frommarket-
ings
Billions of dollars
13.9
11.48.4
7.18.5
9.710.711.310.110.6
11.013.818.823.424.4
25.829.734.434.931.8
32.537.337.035.333.9
33.334.634.437.937.5
37.939.640.841.1
11.3
9.16.4
5.36.4
7.18.48.97.77.9
8.411.115.619.620.5
21.724.829.630.227.8
28.533.032.631.130.0
29.630.629.833.433.5
34.034.935.936.2
Produc-tion ex-penses
7.6
6.95.5
4.34.7
5.15.66.15.86.2
6.77.79.9
11.512.2
12.914.517.018.918.0
19.322.222.621.421.7
21.922.623.425.326.2
26.227.128.228.8
Net to farmoperators
Exclud-ing netinven-tory
change
6.3
4.52.9
2.83.9
4.65.15.24.34.4
4.36.28.8
11.912.2
12.815.217.316.113.8
13.215.214.413.912.2
11.512.011.012.611.3
11.712.512.612.3
Includ-ing netinven-tory
change3
6.1
4.33.32.02.62.9
5.34.36.04.44.5
4.66.69.9
11.811.8
12.415.315.517.812.9
14.016.315.313.312.7
11.811.611.813.511.4
12.012.813.312.8
Net income perfarm, includingnet inventory
change *
Currentprices
1963prices«
Dollars
943
650506305382434
778643911675697
7201,0441,6001,9421,967
2,0802,5742,6483,0652,259
2,4793,0092,9512,6642,645
2,5292,5742,6953,2012,775
3,0443,3593,6023,575
1,813
1,3541,234
8471,0321,059
1,8981,5682,1191,6461,742
1,8002,4283,2003,4683,334
3,3553,7853,3103,6062,755
2,9873,3433,2432,9602,939
2,8102,7982,8373,3342,861
3 1383,4283,6383,575
Seasonally adjusted annual rates
41.040.540.741.0
41.340.641.141.4
36.135.635.836.2
36.435.636.136.7
28.028.128.328.4
28.628.628.929.1
13.012.412.412.6
12.712.012.212.3
13.513.113.213.4
13.512.612.712.6
3,6603,5503,5803,630
3,7703,5203,5503,520
3,7003 5803,6103,670
3,7703 5203,5503,520
i Includes all income received by farm residents from nonfarm sources such as wages and salaries fromnonfarm employment, nonfarm business and professional income, rents from nonfarm real estate, dividends,interest, royalties, unemployment compensation and social security payments.
3 Cash receipts from marketings, Government payments, and nonmoney income furnished by farms.* Includes net change in inventory of crops and livestock valued at the average price for the year. Data
prior to 1946 differ from farm proprietors' income shown in Tables C-ll and C-14 because of revisions bythe Department of Agriculture not yet incorporated into the national income accounts of the Departmentof Commerce.
< Estimates of number of farms revised from 1951 according to new 1959 Census of Agriculture definition.* Income in current prices divided by the index of prices paid by farmers for family living items on a
1963 base.* Preliminary.
Source: Department of Agriculture.
290
Digitized for FRASER http://fraser.stlouisfed.org/ Federal Reserve Bank of St. Louis
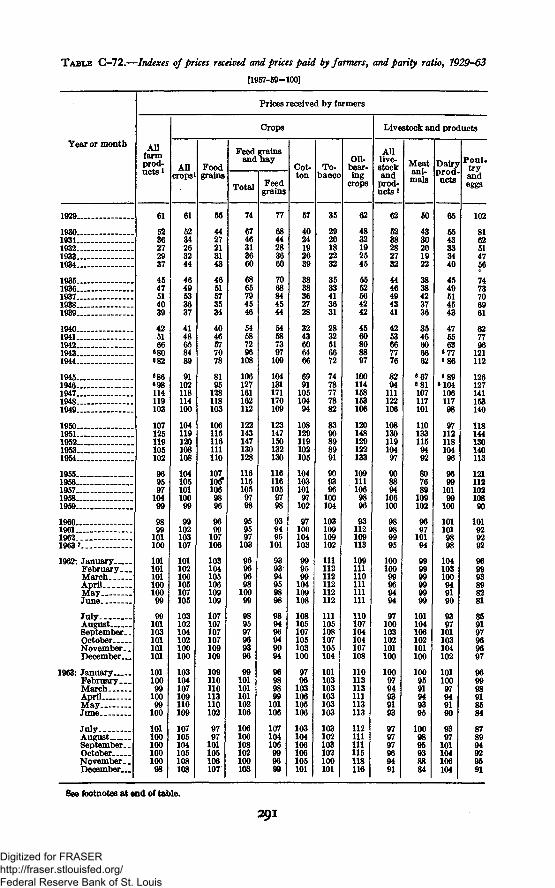
TABLE C-72.—Indexes of prices received and prices paid by farmers, and parity ratio, 7929-63
{1957-59=100]
Year or month
1929
19301931193219331934
19351936193719381939
194019411942 - , ._19431944
194519461947 — .19481949
19501951195219531954
19551956195719581959
I960196119621963 7
1962: January ..February...MarchAprilM a y ._June
JulyAugustSeptember. _OctoberNovember. .December
1963: JanuaryFebruary...MarchAprilM a yJune
JulyAugustSeptember. _OctoberNovember..December
Prices received by farmers
Allfarmprod-ucts 1
61
5236272937
4547514039
425166080• 82
6 86•98114119103
107125119105102
96959710499
9899101100
10110110110010099
99101103101101101
10110099
10099
100
10110010010010098
Crops
Allcrops
61
5234263244
4649533637
4148658489
91102118114100
104119120108108
10410510110099
99102103107
101102106105107105
103102104102100100
103104107109110109
107105104105108108
Foodgrains
55
4427213143
4651573534
4046577078
8195128118103
106115116111110
107106*1069896
9699107106
103104105106109109
107107107107109109
109110110113110102
9797101105106107
Feed grainsand hay
Total
74
6746313660
6865794546
54587296108
106127161162112
122143147130128
1161151059798
959597103
9696969810099
989597969396
99101101101102106
106106108102100103
Feedgrains
77
6844283660
7068844544
54587397109
104131171170109
123147150132130
1161161059798
939495101
939394959898
989496949094
96989899101106
107104106999699
Cot-ton
57
4024192639
3838362728
3243606466
699110510494
108129119102105
10410310197102
97100104103
999599104109108
108105107105103100
9796103106105106
103104106106105101
To-bacco
35
2920182232
3533413631
2832516672
7478777882
8390898991
909396100104
103109109102
111112112112112112
111105108107105104
101103103103103103
103102103102100101
Oil-bear-ingcrops
62
4832192545
5552564242
4560808897
100114158153106
120148129122133
1091111069896
93112109113
109111110111111111
110107104104107108
110113113111113113
112111111115118116
Livestock and products
Alllive-stockandprod-ucts 1
62
5238282732
4446494341
4253667776
8294111122106
10813011910497
908894106100
98989995
10010099969494
97100103102101100
1009794939193
979797969491
Meatani-mals
50
4330201922
3838423736
3546606662
«67• 81107117101
1101331159492
807689109102
969710194
999999999999
101104106102101100
1009591949395
1009895938884
Dairyproducts
65
5543333440
4549514543
475563677•86
•89•10410611798
9711211810496
969910199100
1011019898
104103100949190
9397101103104102
10110097949190
9397101104106104
Poul-tryandeggs
102
8162514756
7473706961
627796121112
126127141153140
118144130140113
12111210210890
101929292
969993898281
859197969697
969998918584
878994929591
See footnotes at end of table.
291
Digitized for FRASER http://fraser.stlouisfed.org/ Federal Reserve Bank of St. Louis
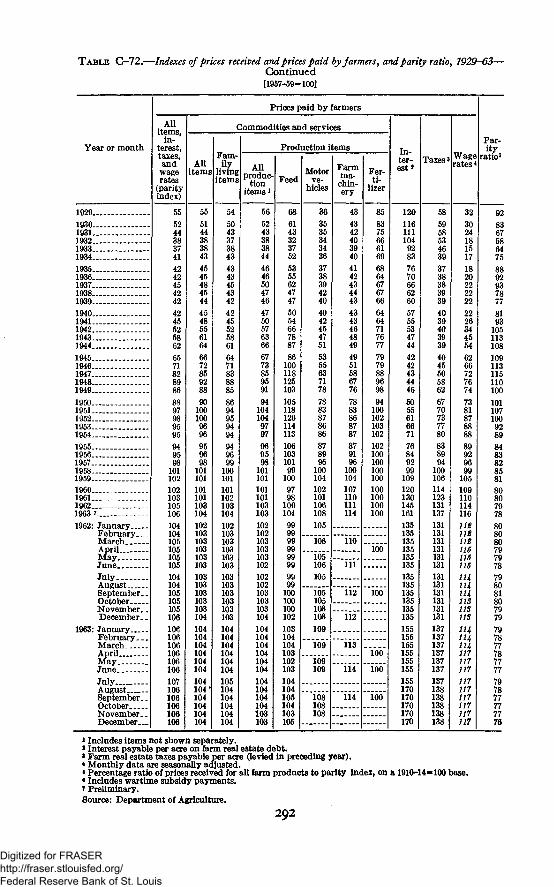
TABLE C-72.—Indexes of prices received and prices paid by farmers, and parity ratio, 7929-63—Continued[1957-59=100]
Year or month
1929
19301931193219331934
19351936193719381939
194019411942 . .19431944
19451946 . .1947....19481949 .. . .
1950195119521953 . .1954...
19551956... .1957195819591960196119621963 7
1962: JanuaryFebruaryMarchAprilMayJune
JulyAuffustSeptember..OctoberNovember..December. _
1963: JanuaryFebruaryMarch.AprilMayJune
JulyAugustSeptember..OctoberNovember..December
Prices paid by farmers
Allitemsin-
terest,taxes,andwagerates(parityindex)
55
5244383741
4242454242
42455258626571828986
8897989595
949598101102102103105106
104104105105105105104104105105105106
106106106106106106
107infiSS2S
Commodities and services
Allitems
55
51443838434545484544
4548556164
6672859288
901001009696
959698101101101101103104
102103103103103103103103103103103104
104104104104104104
104104*104104104104
Fam-ily
livingitems
54
5043373843
4343454342
42455258616471838885
8694959494
949699100101101102103104
102103103103103103103103103103103103
104104104104104104
105104104104104104
Production items
Allproduc-tion
items1
56
5243383844
4646604746
4750576366
6773859591
941041049797
969598101101101101103103
102102103103103102102102103103103104
104104104104104104
104104104104103103
Feed
68
6143323752
5355624747
5054667887
86100118125103
1051181261141131061031019910097981001049999999999999999100100100102
103104104103102103104104105104103105
Motorve-
hicles
363535343436
37383942404042454751
5355637178
7883878686
878996100104102101106108
105
106
105106105
105105108108
109
109
109109
108108108
Farmma-chin-ery
43434240394041424344434343464849
4951586776
7883868787879196100104107110111114
110
111
112
112
113
114
114
Fer-ti-
lizer
85
8375666169
686467676664647176777979889698
94100102103102
102100100100100100100100100
100
100
~ Too100
100
In-ter-est*
120
1161111049283
76706662605755534744
4242434446
5055616671
76849299109120130145161
135135135135135135
135135135135135135
155155155155155155
155170170170170170
Taxes 3
58
5958534639
3738383939
4039403939
4045505862
6770737780838994100106114123131137131131131131131131131131131131131131
137137137137137137137138138138138138
Wagerates *
32
3024181517
1820222222
2226344554
6266727674
7381878888
89929699105109110114116USUS112115115115
114114114USUSUS
114114114117117117117117117117117117
Par-ity
ratio*
92
8367586475
8892937877
8193105113108109113115110100
1011071009289848382858180807978
808080797978798081807979
797877787777
797877777776
* Includes items not shown separately.* Interest payable per acre on farm real estate debt.» Farm real estate taxes payable per acre flevied in preceding year).* Monthly data are seasonally adjusted.* Percentage ratio of prices received for all farm products to parity index, on a 1910-14=100 base.* Includes wartime subsidy payments.* Preliminary.Source: Department of Agriculture.
292
Digitized for FRASER http://fraser.stlouisfed.org/ Federal Reserve Bank of St. Louis
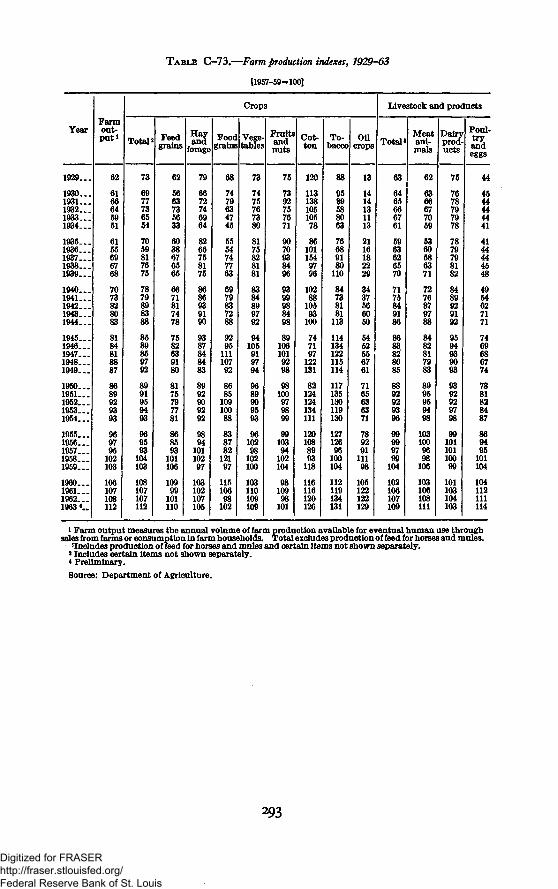
TABLE C-73.--Farm production indexes, 1929-63
[1957-59=100]
Year
1929...
1930...1931...1932...1933...1934...
1935...1936...1937...1938...1939...
1940...1941...1942...1943...1944...
1945...1946...1947...1948...1949...
1950...1951...1952...1953...1954...
1955...1956...1957...1958...1959...
1960...1961...1962...1963*..
Farmout-put*
62
6166645951
6155696768
7073828083
8184818887
8689929393
969795102103
106107108112
Crops
Total 2
73
6977736554
7059817675
7879898388
8589859792
8991959493
969593104103
108107107112
Feedgrains
62
5663735633
6038676565
6671817478
7582639180
8175797781
868593101106
10999101110
Hayandforage
79
6672746964
8266758175
8686939190
9387848483
8992909292
989410110297
103102107105
Foodgrains
68
7479634745
5554747763
6979837288
929511110792
868510910088
83878212197
11510698102
Vege-tables
73
7475767380
8175828181
8384899792
94105919794
9689909593
9610298102100
103110109109
Fruitsandnuts
75
7392757671
9070938496
9399988498
891061019298
98100979899
9910394102104
9810998101
Cot-ton
120
11313810510578
861011549796
1028810593100
747197122131
82124124134111
1201088993118
116116120126
To-bacco
88
9589588063
76689180110
84738181.113
114134122115114
117135130119130
12712696100104
112119134131
Oilcrops
13
1414131113
2116182229
3437566050
5452556761
7165636371
78929111198
105122122129
Livestock and products
Total'
63
6465666761
5963626570
7175849186
8683828085
8892929396
99999799104
102106107109
Meatani-mals
62
6366677059
5360586371
7276879788
8482817983
8995959498
1031009698106
103106108111
Dairyprod-ucts
75
7678797978
7879798182
8489929192
9594939093
9392929798
9910110110099
101103104103
Poul-
andeggs
44
4544444441
4144444548
4954627171
7469686774
7881828487
869495101104
104112111114
i Farm output measures the annual volume of farm production available for eventual human use throughsales from farms or consumption in farm households. Total excludes production of feed for horses and mules.
'Includes production of feed for horses and mules and certain items not shown separately.> Includes certain items not shown separately.* Preliminary.
Source: Department of Agriculture.
293
Digitized for FRASER http://fraser.stlouisfed.org/ Federal Reserve Bank of St. Louis
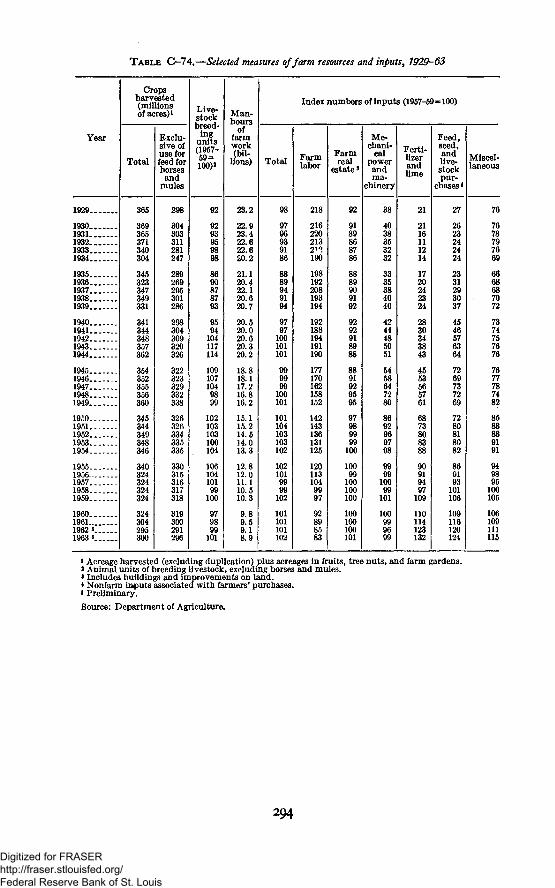
TABLE C—74.—Selected measures of farm resources and inputs, 1929—63
Year
1929
19301931193219331934
193519361937 _19381939
194019411942 __1943 _.1944
19451946194719481949
19501951195219531954
19551956195719581959 -
19601961-1962 »1963 8
Cropsharvested(millionsof acres)1
Total
365
369365371340304
345323347349331
341344348357362
354352355356360
345344349348346
340324324324324
324304295300
Exclu-sive ofuse forfeed forhorsesand
mules
298
304303311281247
289269295301286
298304309320326
322323329332338
326326334335335
330315316317318
319300291296
Live-stockbreed-ingunits(1957-59=100)2
92
9293959898
8690878793
9594104117114
1091071049899
102103103100104
10610410199100
979899101
Man-hoursof
farmwork(bil-Uons)
23.2
22.923.422.622.620.2
21.120.422.120.620.7
20.520.020.620.320.2
18.818.117.216.816.2
15.115.214.514.013.3
12.812.011.110.510.3
9.89.59.18.9
Index numbers of inputs (1957-59=100)
Total
98
9796939186
8889949194
9797100101101
999999100101
101104103103102
1021019999102
101101101102
Farmlabor
218
216220213
190
198192208193194
192188194191190
177170162158152
142143136131125
1201131049997
92898583
Farmreal
estate'
92
9189868786
8889909192
9292918988
8891929595
97989999100
10099100100100
100100100101
Me-chani-cal
powerandma-
chinery
38
4038353232
3335384040
4244485051
5458647280
8692969798
999910099101
100999699
Ferti-UzerandUme
21
2116111214
1720242324
2830343843
4553565761
6873808388
90919497109
110114123132
Feed,seed,andlive-stockpur-
chases 4
27
2623242424
2331293037
4546576364
7269737269
7280818082
869193101106
109116120124
Miscel-laneous
76
7678797669
6668687072
7374757676
7677787482
8588889191
949895100105
106109111115
1 Acreage harvested (excluding duplication) plus acreages in fruits, tree nuts, and farm gardens.2 Animal units of breeding livestock, excluding horses and mules.3 Includes buildings and improvements on land.* Nonfarm inputs associated with farmers' purchases.* Preliminary.Source: Department of Agriculture.
294
Digitized for FRASER http://fraser.stlouisfed.org/ Federal Reserve Bank of St. Louis
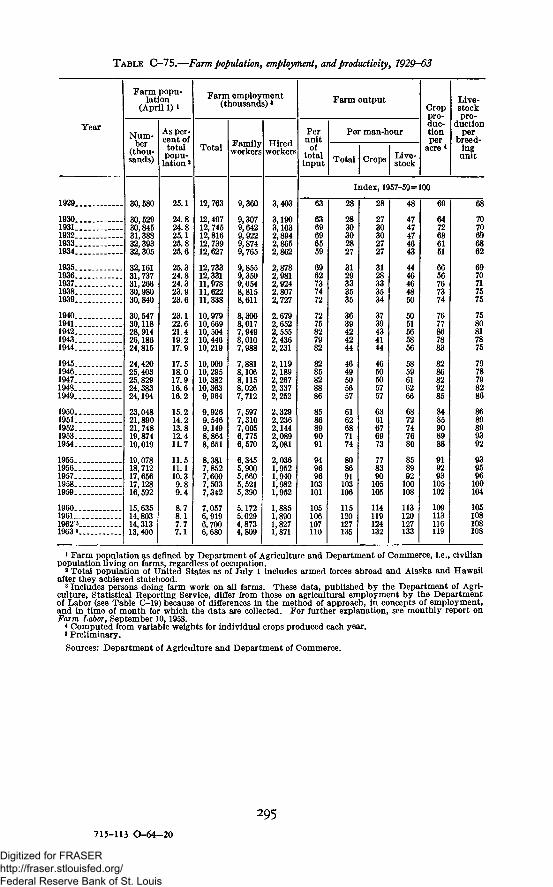
TABLE G-75.—Farm population, employment, and productivity, 1929-63
Year
Farm popu-lation
(April 1) 1
Num-ber
(thou-sands)
As per-cent oftotalpopu-lation 3
Farm employment(thousands)»
TotalFamilyworkers
Hiredworkers
Farm output
Perunitof
totalinput
Per man-hour
Total Crops Live-stock
Croppro-duc-tionper
acre 4
Live-stockpro-
ductionper
breed-ingunit
Index, 1957-59=100
1929.
1930.1931.1932.1933.1934.
1935.1936..1937..1938.1939.
1940..1941..1942..1943..1944..
1945..1946..1947..1948..1949..
1950..1951..1952..1953..1954..
1955...1956...1957...1958...1959...
I960..196L-.1962 5.1963 «_.
30,580
30,52930,84531,38832,39332,305
32,16131,73731,26630,98030,840
30,54730,11828,91426,18624,815
24,42025,40325,82924,38324,194
23,04821,89021,74819,87419,019
19,07818,71217,65617,12816,592
15,63514,80314,31313,400
25.1
24.824.825.125.825.6
25.324.824.323.923.6
23.122.621.419.217.9
17.518.017.916.616.2
15.214.213.812.411.7
11.511.110.39.89.4
8.78.17.77.1
12,763
12,49712,74512,81612,73912,627
12,73312,33111.97811,62211,338
10.97910,66910,50410,44610,219
10,00010,29510,38210,363
9,9269,5469,1498,8648,651
8,3817,8527,6007,5037,342
7,0576,9196.700
9,360
9,3079,6429,9229,8749,765
9,8559,3509,0548,8158,611
8,3008,0177,9498,0107,988
7,8818,1068,1158,0267,712
7,5977,3107,0056,7756,570
6,3455,9005,6605,5215,390
5,1725,0294,8734,809
3,403
3,1903,1032,8942,8652.. 862
2,8782,9812,9242,8072,727
2,6792,6522,5552,4362,231
2,1192,1892,2672,3372,252
2,3292,2362,1442,0892,081
2,0361,9521,9401,9821,952
1,8851,8901,8271,871
63
6369696559
6962737472
7275827982
8285828886
8586899091
949696103101
105106107110
28
2830302827
3129333535
3639424244
4649505657
6162687174
808691103106
115120127135
28
2730302727
3128333534
3739434144
4650505757
6361676973
778390105105
114119124132
48
4747474643
4446464850
5051565856
5859616266
6872747680
858992100108
113120127133
69
6472686151
6656767374
7677867883
8286829285
8485908988
919293105102
109113116119
68
7070
62
70717575
7580817875
79787982
92
939596
100104
105108108108
1 Farm population as defined by Department of Agriculture and Department of Commerce, i.e., civilianpopulation living on farms, regardless of occupation.
3 Total population of United States as of July 1 includes armed forces abroad and Alaska and Hawaiiafter they achieved statehood.
3 Includes persons doing farm work on all farms. These data, published by the Department of Agri-culture, Statistical Reporting Service, differ from those on agricultural employment by the Departmentof Labor (see Table C-19) because of differences in the method of approach, in concepts of employment,and in time of month for which the data are collected. For further explanation, see monthly report onFarm Labor, September 10, 1958.
* Computed from variable weights for individual crops produced each year.»Preliminary.
Sources: Department of Agriculture and Department of Commerce.
295715-113 O-64-20
Digitized for FRASER http://fraser.stlouisfed.org/ Federal Reserve Bank of St. Louis
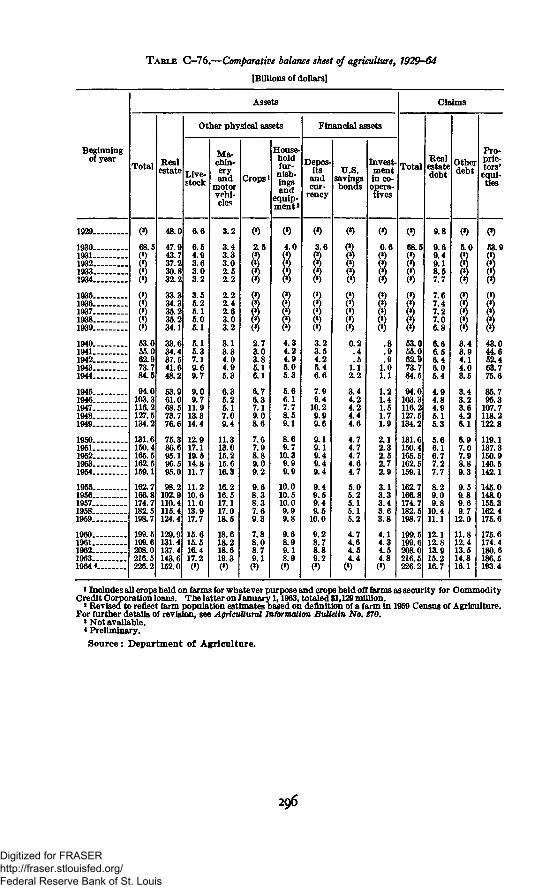
TABLE C-76.—Comparative balance sheet of agriculture, 1929-64
[Billions of dollars]
Beginningof year
Assets
Total Realestate
Other physical assets
Live-stock
Ma-chin-eryand
motorvehi-cles
Crops
House-holdfur-
nish-ingsand
equip-ment *
Financial assets
Depos-its
andcur-
rency
U.S.savingsbonds
Invest-mentin co-opera-tives
Claims
TotalRealestatedebt
Otherdebt
Pro-prie-tors'
equi-ties
1929..
1930..1931..1932..1933..1934..
1935..1936..1937..1938..1939..
1940..1941..1942..1943..1944..
1945..1946..1947..1948..1949..
1950..1951..1952..1953..1954..
1955..1956..1957..1958..1959..
I960..1961..1962..1963-1964*.
CO68.5
53.055.062.973.784.5
94.0103.3116.2127.5134.2
131.6150.4165.5162.5159.1
162.7166.8174.7182.5198.7
199.5199.6208.0216.5226.2
48.0
47.943.737.230.832.2
33.334.335.235.234.1
33.634.437.541.648.2
53.961.068.573.776.6
75.386.695.196.595.0
98.2102.9110.4115.4124.4
129.9131.4137.4143.6152.0
6.6
6.54.93.63.03.2
3.55.25.15.05.1
5.15.37.19.69.7
9.09.7
11.913.314.4
12.917.119.514.811.7
11.210.611.013.917.7
15.615.516.417.2
3.2
3.43.33.02.52.2
2.22.42.63.03.2
3.13.34.04.95.3
6.35.25.17.09.4
11.313.015.215.616.3
16.216.517.117.018.5
18.618.218.619.3(»)
0.6 68.5
94.0103.3116.2127.5134.2
131.6150.4165.5162.5159.1
162.7166.8174.7182.5198.7
199.5199.6208.0216.5226.2
9.8
9.69.49.18.57.7
7.67.47.27.06.8
6.66.56.46.05.4
4.94.84.95.15.3
5.66.16.77.27.7
8.29.09.8
10.411.1
12.112.813.915.216.7
3.4
i Includes all crops held on farms for whatever purpose and crops held off forms as security for CommodityCredit Corporation loans. The latter on January 1,1963, totaled $1,129 million.
* Revised to reflect farm population estimates based on definition of a farm in 1959 Census of Agriculture.For further details of revision, see Agricultural Information Bulletin No. 270.
3 Not available.* Preliminary.
Source : Department of Agriculture.
296
Digitized for FRASER http://fraser.stlouisfed.org/ Federal Reserve Bank of St. Louis
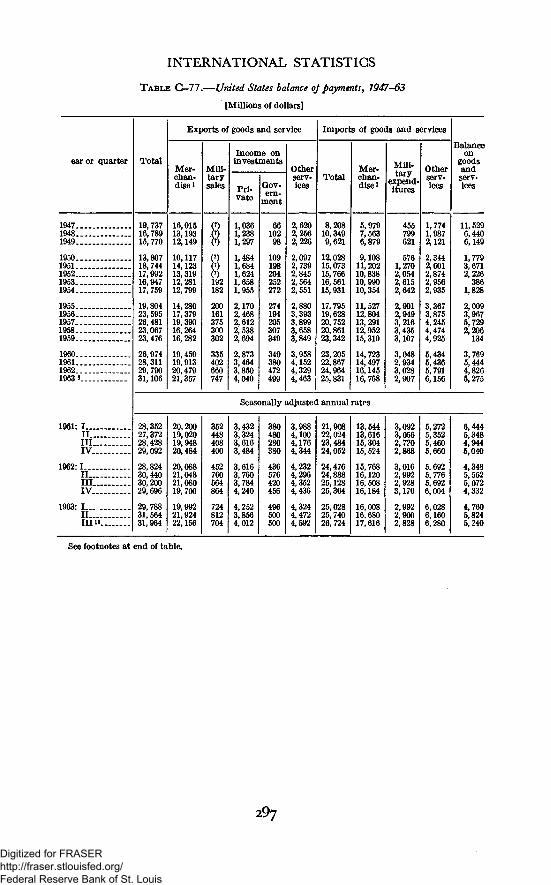
INTERNATIONAL STATISTICS
TABLE C-77.—United States balance of payments, 1947-63
[Millions of dollars]
ear or quarter Total
19,73716,78915,770
13,80718,74417,99216,94717,759
19,80423,59526,48123,06723,476
26,97428,31129,79031,106
Exports of goods and service
Mer-chan-dise i
16,01513,19312,149
10,11714,12313,31912,28112,799
14,28017,37919,39016, 26416,282
19,45919,91320,47921,357
Mili-tarysales
S(7)(7)8192182
200161375300302
335402660747
Income oninvestments
Pri-vate
1,0361,2381,297
1,4841,6841,6241,6581,955
2,1702,4682,6122,5382,694
2,8733,4643,8504,040
Gov-ern-
ment
6610298
109198204252272
274194205307349
349380472499
Otherserv-ices
2,6202,2562,226
2,0972,7392,8452,5642,551
2,8803,3933,8993,6583,849
3,9584,1524,3294,463
Imports of goods and services
Total
8,20810,3499,621
12.02815,07315,76616,56115,931
17,79519,62820,75220,86123,342
23,20522,86724,96425,831
Mer-chan-dise i
5,9797,5636,879
9,10811,20210,83810,99010,354
11,52712,80413,29112,95215,310
14,72314,49716,14516,768
TV/TiH.iMiii-tary
expend-itures
455799621
5761,2702,0542,6152,642
2,9012,9493,2163,4353,107
3,0482,9343,0282,907
Otherserv-ices
1,7741,9872,121
2,3442,6012,8742,9562,935
3,3673,8754,2454,4744,925
5,4345,4365,7916,156
Balanceon
goodsandserv-ices
1947..1948..1949..
1950..1951..1952..1953..1954..
1955..1956..1957..1958..1959..
I960..1961..1962..1963«.
1961: II I - . .III . . .IV. . .
1962:1I I . . . .III . . .IV. . .
1963: I . . . .I I . . . .I l l io.
See footnotes at end of table.
Seasonally adjusted annual ratPS
28,35227,37228,42829,092
28,82430,44030,20029,696
29,78831,56431,964
20,20019,02019,94820,484
20,08821,04821,08019,700
19,99221,92422,156
352448408400
452760564864
724812704
3,4323,3243,6163,484
3,6163,7603,7844,240
4,2523,8564,012
380480280380
436576420456
496500500
3,9884,1004,1764,344
4,2324,2964,3524,436
4,3244,4724,592
21,90822,02423,48424,052
24,47624,88825,12825,364
25,02825,74026,724
13,54413,61615,30415,524
15,76816,12016,50816,184
16,00816,68017,616
3,0923,0562,7202,868
3,0162,9922,9283,176
2,9922,9002,828
5,2725,3525,4605,660
5,6926,7765,6926,004
6,0286,1606,280
11,5296,4406,149
1,7793,6712,226
3861,828
2,0093,9675,7292,206
134
3,7695,4444,8265,275
6,4445,3484,9445,040
4,3485,5525,0724,332
4,7605,8245,240
297
Digitized for FRASER http://fraser.stlouisfed.org/ Federal Reserve Bank of St. Louis
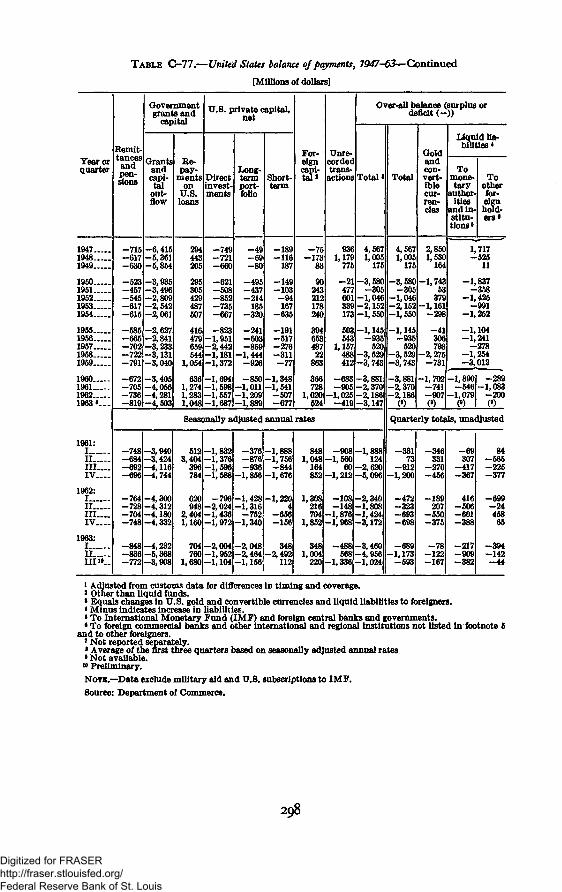
TABLE C-77.—United States balance of payments, 7947-63^Continucd
[Millions of dollars]
Year orquarter
194719481949
19501951195219531954
19551956195719581959
1960196119621963 8. . .
1961:
IIIIII V . . -
1962:
IIIIIIV. . . .
1963:
IIiri«.I
Remit-tancesandpen-sions
-715-617-630
-523-457-545-617-615
-585-665-702-722-791
-672-705-736-819
Governmentgrants and
capital
Grantsandcapi-tal
out-flow
-6,415-5,361-5,854
-3,935-3,496-2,809-2,542-2,061
-2,627-2,841-3,233-3,131-3,040
-3,405-4,056-4,281-4,503
Re-pay-
mentson
U.S.loans
294443205
295305429487507
416479659544
1,054
6361,2741,2831,048
U.S. private capital,net
Directinvest-ments
-749-721-660
-621-508-852-735-667
-823-1,951-2,442-1,181-1,372
-1,694-1,598-1,557-1,687
Long-termport-folio
-49-69-80
-495-437-214
185-320
-241-603-859
-1,444-926
-850-1,011-1,209-1,889
Short-term
-189-116
187
-149-103-94167
-635
-191-517-276-311-77
-1,348-1,541
-507-677
For-eigncapi-ta ] '
-75-173
83
90243212178240
39465348722
863
366728
1,020524
Unre-cordedtrans-
actions
9361,179
775
-21477601339173
503543
1,157488412
-683-905
-1,025-419
Over-all balance (surplus ordeficit ( - ) )
Total*
4,5671,005
175
-3,580-305
-1,046-2,152-1,550
-1,145-935
520-3,529-3,743
-3,881-2,370-2,186-3,147
Seasonally adjusted annual rates
-748-684-692-696
-764-728-704-748
-848-836-772
-3,940-3,424-4,116-4,744
-4,300-4,312-4,180-4,332
-4,232-5,368-3,908
5123,404
396784
620948
2,4041,160
704760
1,680
-1,832-1,376-1,596-1,588
-796-2,024-1,436-1,972
-2,004-1,952-1,104
-376-876-936
-1,856
-1,428-1,316
-752-1,340
-2,048-2,464-1,156
-1,888-1,756
-844-1,676
-1,2204
-656-156
348-2,492
112
8481,048
164852
1,308216704
1,852
3481,004
220
-908-1,560
60-1,212
-108-148
-1,876-1,968
-488568
-1,336
-1,888124
-2,620-5,096
-2,340-1,808-1,424-3,172
-3,460-4,956-1,024
Total
4,5671,005
175
-3,580-305
-1,046-2,152-1,550
-1,145-935
520-3,529-3,743
-3,881-2,370-2,186
CO
Goldandcon-vert-iblecur-ren-cies
2,8501,530
164
-1,74353
379-1,161
-298
-41306798
-2,275-731
-1,702-741-907(9)
Liquidlia-bilities*
Tomone-tary
author-ities
and in-stitu-tions'
1,
Tootherfor-eignhold-ers*
717-525
- 1 ,—
11
837358
-1,425-991
-1,252
- 1 , 104-1,241
-278- 1 . 254- 3 ; 012
-1,890-546
-1,07909
-289-1,083
-20000
Quarterly totals, unadjusted
-33173
-912-1,200
-472-323-693-698
-689-1,173
-593
-346331
-270-456
-189207
-550-375
-78-122-167
-69307
-417-367
416-506-601-388
-217-909-382
84-565-225-377
-699-2445865
-394-142-44
1 Adjusted from customs data for differences in timing and coverage.3 Other than liquid funds.* Equals changes in U.S. gold and convertible currencies and liquid liabilities to foreigners.* Minus indicates increase in liabilities.« To International Monetary Fund (IMF) and foreign central banks and governments.• To foreign commercial banks and other international and regional institutions not listed in footnote 6
and to other foreigners.7 Not reported separately.8 Average of the first three quarters based on seasonally adjusted annual rates.• Not available.
10 Preliminary.
NOTE.—Data exclude military aid and U.S. subscriptions to IMF.
Source: Department of Commerce.
Digitized for FRASER http://fraser.stlouisfed.org/ Federal Reserve Bank of St. Louis
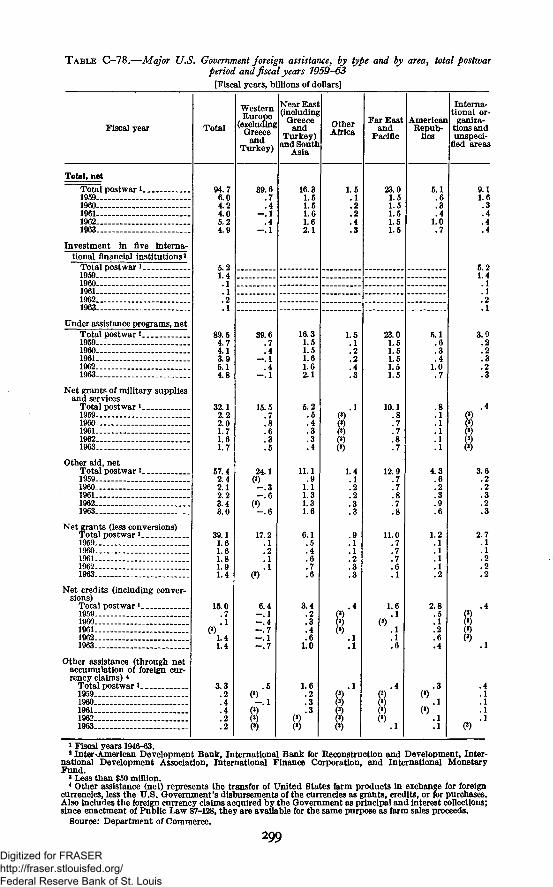
TABLE G-78. Major U.S. Government foreign assistance, by type and by area, total postwarperiod and fiscal years 7959-63
[Fiscal years, billions of dollars]
Fiscal year
Total, net
Total postwar *1959I960196119621963
Investment in five interna-tional financial institutions *
Total postwar 1
1959I960196119621963
Under assistance programs, netTotal postwar *1959I960196119621963
Net grants of military suppliesand services
Total postwar * _ _19591960196119621963
Other aid, netTotal postwar *1959I960196119621963
Net grants (less conversions)Total postwar *1959196019611962...1963 _ _
Net credits (including conver-sions)
Total postwar *1959...19601961.19621963
Other assistance (through netaccumulation of foreign cur-rency claims) *
Total postwar * - _.19591960196119621963
Total
94.76.04.24.05.24.9
5.21.4.1.1.2.1
89.54.74.13.95.14.8
32.12 22.01.71 61.7
57.42.42.12.23.43.0
39.11.61.61 81.91.4
15.0.7.1
1.41.4
3.3.2.4.4.2.2
WesternEurope
(excludingGreece
andTurkey)
39.6.7.4
- . 1.4
- . 1
39.6.7.4
- . 1.4
_ •%
15.57
.8
.63
.5
24.1
—!6
17.2.1.21
(3)
6.4—.1— 4—.7—.1- . 7
.5
—.1
1
Near East(including
Greeceand
Turkey)and South
Asia
16.31.51.51.61.62.1
16.31.51.51.61.62.1
5.2.5.4.3.3.4
11.1.9
1.11.31.31.6
6.1.5.4.6.7.6
3.4.2.3.4.6
1.0
1.6.2.3.3
OtherAfrica
1.5.1.2.2.4.3
1.5.1.2.2.4.3
.1
1.4.1.2.2.3.3
.9
.1
.12
.3
.3
.4
(3)
.1
.1
.1
(3)3)(3)(3)(3)
Far Eastand
Pacific
23.01.51.51.51.51.5
23.01.51.51.51.51.5
10.1g.7
.7
.8
.7
12.9.7.7.8.7.8
11.0.7.7.7.6.1
1.6.1
.1
.1
.6
.43)
.1
AmericanRepub-
lics
5.1.6.3.4
1.0.7
S.I.6.3.4
1.0.7
.8
.1
.1
.1
.1
.1
4.3.6.2.3.9.6
1.2.1.1.1.1.2
2.8.5.1.2.6.4
.3
.1
.1
.1
Interna-tional or-
ganiza-tions andunspeci-
fied areas
9.11.6.3.4.4.4
5.21.4.1.1.2.1
3.9.2.2.3.2.3
.4(3)
(3)
(3)(3)
3.6.2.2.3.2.3
2.7.1.1.2.2.2
.4
(3)(3)(3)
.1
.4
.1
.1
.1
.1
1 Fiscal years 1946-63.2 Inter-American Development Bank, International Bank for Reconstruction and Development, Inter-
national Development Association, International Finance Corporation, and International MonetaryFund.
* Less than $50 million.* Other assistance (net) represents the transfer of United States farm products in exchange for foreign
currencies, less the U.S. Government's disbursements of the currencies as grants, credits, or for purchases.Also includes the foreign currency claims acquired by the Government as principal and interest collections;since enactment of Public Law 87-128, they are available for the same purpose as farm sales proceeds.
Source: Department of Commerce.
299
Digitized for FRASER http://fraser.stlouisfed.org/ Federal Reserve Bank of St. Louis
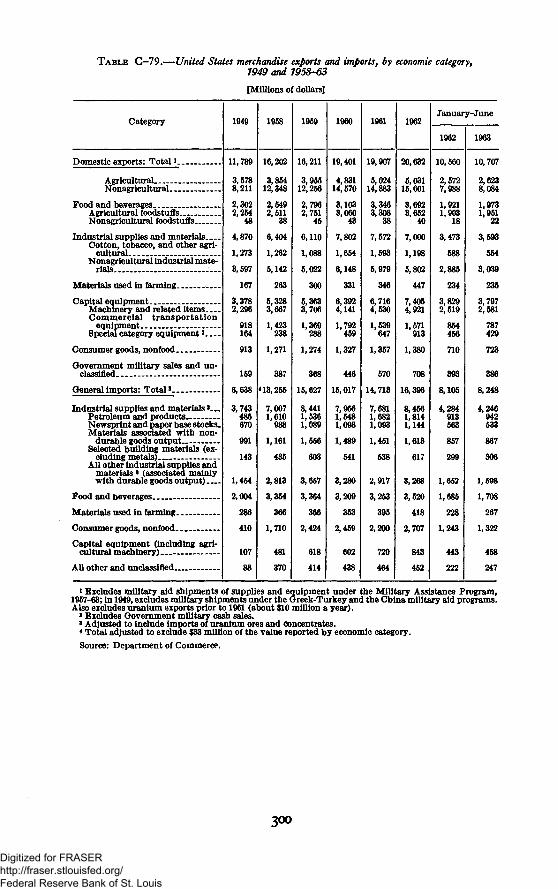
TABLE C-79.—United States merchandise exports and imports, by economic category,1949 and 1958-63
[Millions of dollars]
Category 1949 1958 1959 1960 1961 1962January-June
1962 1963
Domestic exports: Total».
AgriculturalNonagriculturaL
Food and beveragesAgricultural foodstuffsNonagricultural foodstuffs..
Industrial supplies and materialsCotton, tobacco, and other agri-
culturalNonagricultural industrial mate-
rials . . . .
Materials used in fanning.
Capital equipmentMachinery and related itemsCommercial transportation
equipmentSpecial category equipment9
Consumer goods, nonfood
Government military sales and un-classified
General imports: Total *.
Industrial supplies and materials»Petroleum and productsNewsprint and paper base stocks.Materials associated with non-
durable goods outputSelected building materials (ex-
cluding metals)All other industrial supplies and
materials • (associated mainlywith durable goods output)
Food and beverages
Materials used in farming.
Consumer goods, nonfood.
Capital equipment (including agri-cultural machinery)
All other and unclassified..
11,789
3,5788,211
2,3022,254
48
4,870
1,273
3,597
167
3,3782,296
918164
913
6,638
3,743485670
991
143
1,454
2,004
286
410
107
88
16,202
3,85412,348
2,5492,511
6,404
1,262
5,142
263
5,3283,667
1,423238
1,271
387
13,255
7,0071,610
988
1,161
435
2,813
3,354
366
1,710
481
370
16,211
3,95512,256
2,7962,751
45
6,110
1,088
5,022
300
3,706
1,369288
1,274
368
15,627
8,4411,5361,089
1,556
603
3,657
3,364
366
2,424
618
414
19,401
4,83114,570
3,1033,060
43
7,802
1,654
6,148
331
6,3924,141
1,792459
1,327
446
15,017
7,9561,5481,098
1,489
541
3,280
3,209
353
2,459
602
438
19,907
5,02414,883
3,3463,308
7,572
1,593
5,979
346
6,7164,530
1,539647
1,357
570
14,713
7,6811,6821,093
1,451
2,917
3,253
395
2,200
720
464
20,632
5,03115,601
3,6923,652
40
7,000
1,198
5,802
447
7,4054,921
1,571913
1,380
708
16,396
8,4561,8141,144
1,613
617
3,268
3,520
418
2,707
843
452
10,560
2,5727,988
1,9211,903
18
3,473
588
2,885
2343,8292,519
854456
710
8,105
4,284913563
857
299
1,652
1,685
228
1,243
443
222
10,707
8,084
1,9731,951
22
554
3,039
235
3,7972,581
787429
723
8,248
4,246942533
867
1,598
1,708
267
1,322
458
247
i Excludes military aid shipments of supplies and equipment under the Military Assistance Program,1957-63; hi 1949, excludes military shipments under the Greek-Turkey and the China military aid programs.Also excludes uranium exports prior to 1961 (about $10 million a year).
3 Excludes Government military cash sales.3 Adjusted to include imports of uranium ores and concentrates.« Total adjusted to exclude $33 million of the value reported by economic category.
Source: Department of Commerce.
3OO
Digitized for FRASER http://fraser.stlouisfed.org/ Federal Reserve Bank of St. Louis
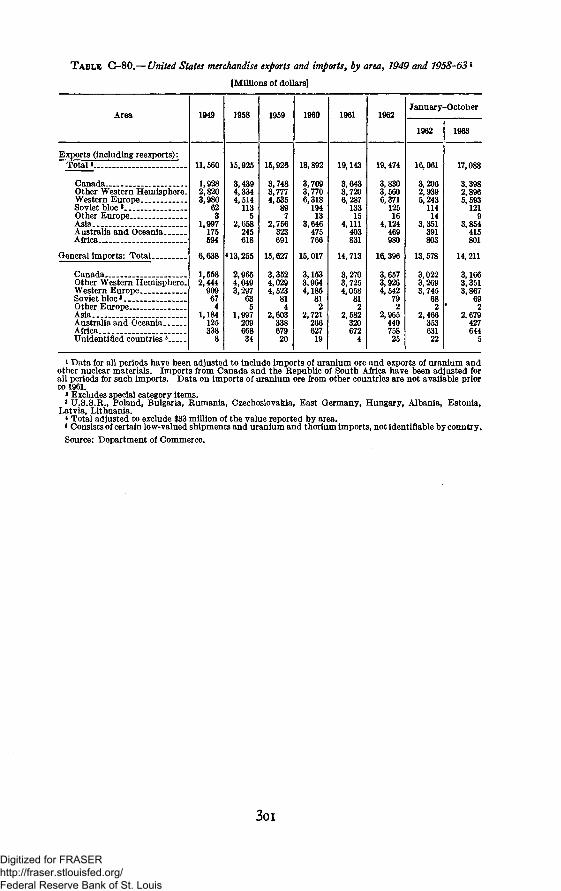
TABLE C-80.—United States merchandise exports and imports, by area, 1949 and 1958-63l
[Millions of dollars]
Area 1949 1958 1959 1960 1961 1962January-October
1962 1963
Exports (including reexports):Total K
CanadaOther Western Hemisphere-Western EuropeSoviet bloc *Other EuropeAsia _._Australia and OceaniaAfrica
General imports: Total
Canada _Other Western Hemisphere-Western EuropeSoviet bloc'Other EuropeAsiaAustralia and OceaniaAfricaUnidentified countries 5
11,560
1,9282,8203,980
623
1,997175594
6,638
1,5582,444
909674
1,184125338
15,925
3,4394,3344,514
1135
2,658245618
* 13,255
2,9654,0493,297
635
1,99720966834
15,925
3,7483,7774,535
897
2,756323
15,627
3,3524,0294,523
814
2,60333867920
18,892
3,7093,7706,318
19413
3,646475766
15,017
3,1533,9644,185
812
2,72126662719
19,143
3,6433,7206,287
13315
4,111403831
14,713
3,2703,7254,058
812
2,582320672
4
19,474
3,8303,5606,371
12516
4,124
16,396
3,6573,9264,542
792
2,96544075825
16,061
3,2062,9395,243
11414
3,351391
13,578
3,0223,2693,745
682
2,46635363122
17,088
3,3982,8965,593
1219
3,854415801
14,211
3,1663,3513,867
692
2,679427644
5
1 Data for all periods have been adjusted to include imports of uranium ore and exports of uranium andother nuclear materials. Imports from Canada and the Republic of South Africa have been adjusted forall periods for such imports. Data on imports of uranium ore from other countries are not available priorto 1961.
2 Excludes special category items.3 U.S.S.R., Poland, Bulgaria, Rumania, Czechoslovakia, East Germany, Hungary, Albania, Estonia,
Latvia, Lithuania.4 Total adjusted to exclude $33 million of the value reported by area.6 Consists of certain low-valued shipments and uranium and thorium imports, not identifiable by country.
Source: Department of Commerce.
3oi
Digitized for FRASER http://fraser.stlouisfed.org/ Federal Reserve Bank of St. Louis
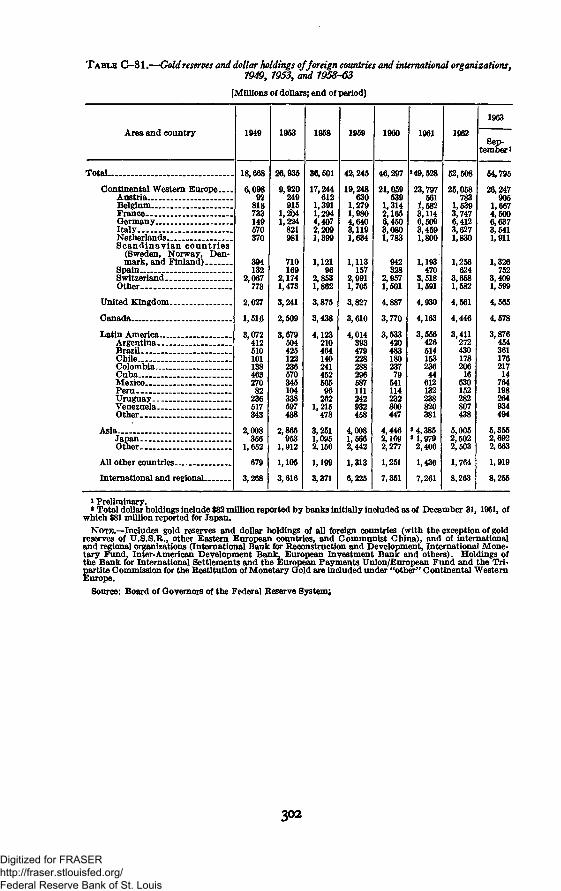
TABLE C-81.—Gold reserves and dollar holdings of foreign countries and international organizations.1949, 1953, and 1958-63
[Millions of dollars; end of period]
Area and country 1949 1953 1958 1959 1960 1961 1962
1963
Total..
Continental Western EuropeAustriaBelgiumFranceGermanyItalyNetherlandsScandinavian countries
(Sweden, Norway, Den-mark, and Finland)
SpainSwitzerlandOther
United Kingdom-
Canada
Latin America-Argentina-.BrazilChileColombia-CubaMexicoPeruUruguay.. -Venezuela..Other
Asia..Japan.Other-
All other countries
International and regional..
6,09892
818733149570370
394132
2,067
773
2,027
1,5163,072
41251010113846327082
236517343
2,008356
1,652
679
3,268
26,935
9,920249915
1,2041,224
821981
710169
2,174
1,473
3,241
2,5093,679
504425122236570345104333597438
2,865953
1,912
1,105
3,616
36,601
17,244612
1,3911,2944,4072,2091,399
1,12196
2,8531,862
3,875
3,438
4,12321046414024145256596262
1,215478
3,2511,0952,156
1,199
3,371
42,245
19,248630
1,2791,9804,6403,1191,634
1,113157
2,991
1,705
3,827
3,6104,014393479228288296587111242932458
4,0081,5662,442
1,313
6,225
46,297
21,059539
X,3142,1656,4503,0801,783
942328
2,9571,501
4,887
3,770
3,53342048318023779541114232800447
4,4462,1692,277
1,251
7,351
249,528
23,797561
1,5823,1146,5093,4591,800
1,193470
3,518
1,591
4,930
4,1633,55642651415323644612132238820381
* 4,3853 1,979
2,406
1,436
7,261
52,508
25,058783
1,5393,7476,4123,6271,830
1,256624
3,658
1,582
4,561
4,4463,41127243017820616
630152282807438
5,0052,5022,503
1,764
8,263
54,795
26,247905
1,6674,5006,6373,5411,911
1,326752
3,409
1,599
4,565
4,5783,87645436117621714764198264934494
5,3552,6922,663
1,919
8,255
1 Preliminary.* Total dollar holdings include $82 million reported by banks initially included as of December 31, 1961, of
which $81 million reported for Japan.
NOTE.—Includes gold reserves and dollar holdings of all foreign countries (with the exception of goldreserves of U.S.S.R., other Eastern European countries, and Communist China), and of internationaland regional organizations (International Bank for Reconstruction and Development, International Mone-tary Fund, Inter-American Development Bank, European Investment Bank and others). Holdings ofthe Bank for International Settlements and the European Payments Union/European Fund and the Tri-partite Commission for the Restitution of Monetary Gold are included under "other" Continental WesternEurope.
Source: Board of Governors of the Federal Reserve System;
302
Digitized for FRASER http://fraser.stlouisfed.org/ Federal Reserve Bank of St. Louis
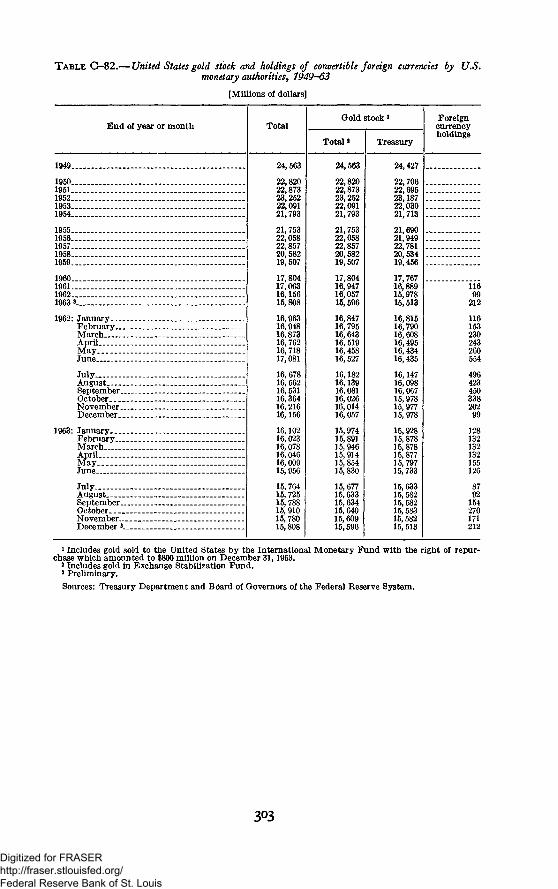
TABLE G—82.— United States gold stock and holdings of convertible foreign currencies by U.S.monetary authorities, 1949-63
[Millions of dollars]
End of year or month TotalGold stock i
Total 2 Treasury
Foreigncurrencyholdings
1949
195019511952._. _._.1953 _.1954
19551956195719581959
1960 _...19611962 ___.1963 3
1962: JanuaryFebruary...MarchApril..MayJune
JulyAugustSeptember.OctoberNovember..December..
1963: JanuaryFebruary. __MarchAprilMayJune _.
JulyAugustSeptember.OctoberNovember-December 3.
24,563
22,82022,87323,25222,09121,793
21,75322,05822,85720,58219,507
17,80417,06316,15615,808
16,96316,94816,87316,76216,71817,081
16,67816,56216, 53116,36416,21616,156
16,10216, 02316,07816,04616,00915,956
15,76415, 72515, 78815,91015, 78015,808
24,563
22,82022,87323,25222,09121,793
21,75322,05822,85720,58219,507
17,80416,94716,05715,596
16,84716,79516,64316,51916,45816,527
16,18216,13916,08116,02616,01416,057
15,97415,89115,94615,91415, 85415,830
15, 67715.63315.63415,64015,60915,596
24,427
22,70622,69523,18722,03021,713
21,69021,94922,78120,53419,456
17,76716,88915,97815,513
16,81516,79016,60816,49516,43416,435
16,14716,09816, 06715,97815.97715.978
15,92815,87815,87815,87715, 79715,733
15,63315, 58215, 58215, 58315, 58215, 513
11699212
116153230243260554
49642345033820299
128132132132155126
8792154270171212
1 Includes gold sold to the United States by the International Monetary Fund with the right of repur-chase which amounted to $800 million on December 31,1963.
2 Includes gold in Exchange Stabilization Fund.3 Preliminary.
Sources: Treasury Department and Board of Governors of the Federal Reserve System.
303
Digitized for FRASER http://fraser.stlouisfed.org/ Federal Reserve Bank of St. Louis
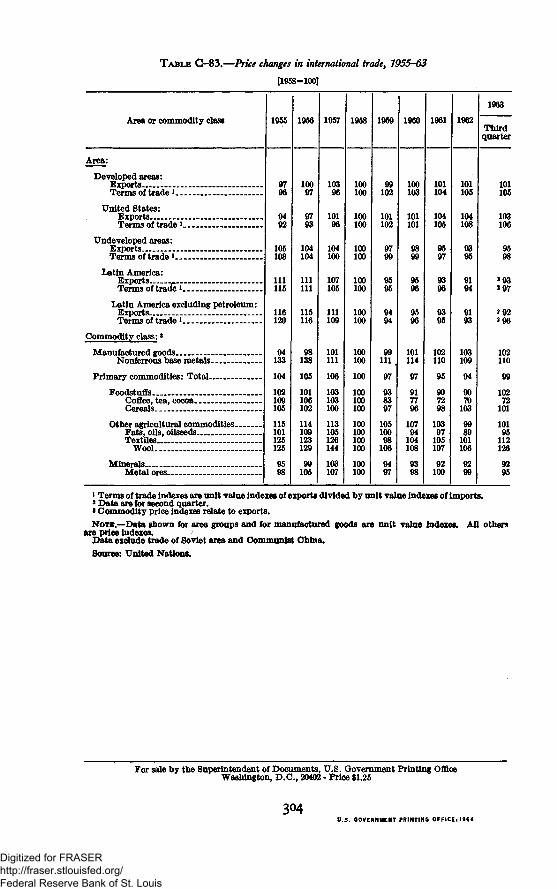
TABLE C-83.—Price changes in international trade, 1955-63
[1958=100]
Area or commodity class 1955 1956 1957 1958 1959 1960 1961 1962
1963
Thirdquarter
Area:
Developed areas:ExportsTerms of trade *..
United States:ExportsTerms of trade *
Undeveloped areas:ExportsTerms of trade i . .
Latin America:ExportsTerms of trade»
Latin America excluding petroleum:ExportsTerms of trade »
Commodity class:»
Manufactured goodsNonferrous base metals.
Primary commodities: Total
FoodstuffsCoffee, tea, cocoa-Cereals
Other agricultural commodities.Fats, oils, oilseedsTextiles
Wool
MineralsMetal ores..
105108
111115
116120
94133
104
102109105
115101125125
95
10097
97
104104
111111
115116
138
105
101106102
114109123129
99105
10396
10196
104100
107105
111109
101111
106
103103100
113105126144
103107
100100
100100
100100
100100
100100
100100
100
100100100
100100100100
100100
102
101102
97
111
97
97
10510098
106
9497
100103
101101
98
95
101114
97
917796
10794
104108
93
101104
104105
93
95
102110
95
10397
105107
92100
101105
104108
95
91
103109
94
9070
103
101106
101105
103106
9598
2 93*97
2 922 96
102110
99
10272
101
10195
112126
9295
1 Terms of trade indexes are unit value indexes of exports divided by unit value indexes of imports.2 Data are for second quarter.1 Commodity price indexes relate to exports.Nora.—-Data shown for area groups and for manufactured goods are unit value indexes. All others
are price indexes. /Data exclude trade of Soviet area and Communist China.
Source: United Nations.
For sale by the Superintendent of Documents, U.S. Government Printing OfficeWashington, D.C., 20402 - Price $1.25
304U.S. GOVERNMENT PRINTING OFFICE: 1964
Digitized for FRASER http://fraser.stlouisfed.org/ Federal Reserve Bank of St. Louis

Digitized for FRASER http://fraser.stlouisfed.org/ Federal Reserve Bank of St. Louis

Digitized for FRASER http://fraser.stlouisfed.org/ Federal Reserve Bank of St. Louis

Digitized for FRASER http://fraser.stlouisfed.org/ Federal Reserve Bank of St. Louis

Digitized for FRASER http://fraser.stlouisfed.org/ Federal Reserve Bank of St. Louis


![[11] Seepage [Rev2]](https://img.pdfslide.net/doc/110x75/55cf9210550346f57b932a1e/11-seepage-rev2.jpg)