Embed Size (px)
Citation preview

Economic ReportEnabling work, adaptation, security & prosperity
2017 edition

The World Employment Confederation is the voice of the employment industry at the global level, uniting labour market enablers from 50 countries and 8 of the largest international workforce solutions companies.
The World Employment Confederation brings unique access to and engagement with international policymakers (ILO, OECD, World Bank, IMF, IOM, EU) and key stakeholders (IOE, trade unions, academic world, think tanks, NGOs).
The World Employment Confederation strives for recognition of the economic and social role played by the employment industry in enabling work, adaptation, security and prosperity in our societies. Its members provide access to the labour market and meaningful work to 50 million people around the world and serve around 5 million organisations on a yearly basis.
The World Employment Confederation is organised under 6 regions: Europe, North America, Latin America, APAC Southern, North East Asia and Africa.
All rights reserved © WEC 2017
This report is a shorter extract of the full WEC Economic Report. For more extensive information check the report online.
www.wecglobal.org/economicreport2017
ABOUT THE WORLD EMPLOYMENT CONFEDERATION

Foreword 4
Key indicators 8
1- Enabling work 17Create more work opportunities 18
Provide a stepping stone 19
Deliver quality & meaningful work 21
Improve access to & transparency of labour market 25
2- Enabling adaption 27Deliver diversified workforce solutions 28
Improve employability by upskilling 29
Facilitate work transitions & mobility 32
Adapt workforce to production needs 35
3- Enabling security 37Act as career agent 38
Deliver portable rights 40
Secure access to talents 41
Increase business competitiveness 42
4- Enabling prosperity 45Reduce undeclared work & unemployment 46
Increase inclusiveness and diversity 47
Increase work incomes & purchasing power 50
Enrich GDP by sales revenues 51
Annexes 53Glossary of terms 53
Members 54
Enabling Work 17
Enabling Adaptation 27
Enabling Security 37
Enabling Prosperity 45
CONTENTS Create more work opportunities
Provide a stepping stone
Deliver quality & meaningful work
Improve access to & transparency of labour market
Deliver diversified workforce solutions
Improve employability by upskilling
Facilitate work transitions & mobility
Adapt workforce to production needs
Act as career agent
Deliver portable rights
Secure access to talents
Increase business competitiveness
Reduce undeclared work & unemployment
Increase inclusiveness and diversity
Increase work incomes & purchasing power
Enrich GDP by sales revenues
Denis Pennel World Employment Confederation Managing Director

Dear reader,
As labour maket enablers, the members of the World Employment Confederation contribute to a better functioning job market. Thanks to the combined 169,000 employment agencies and 1.5 million HR specialists it regroups around the world, the industry enables work, adaptation, security and prosperity.
The 2017 edition of the World Employment Confederation’s Economic Report documents these four enabling functions, by compiling robust facts and figures about the employment industry. The number of workers who were able to access the labour market after intermediation by a recruitment and employment agency reached 50 million people in 2015, including a majority of youngsters! The turnover of the industry across the globe totaled €417 billion, providing sustainable workforce solutions to 5 million organisations. There is much more information to be found in the report. I invite you to browse through it and find out for yourself.
In addition to the hardcopy of this report, a complementary online version is available with additional data. For a full overview of the report, please visit www.wecglobal.org/economicreport2017. This will make it easier for you to browse through the report and share or repost its content more easily.
If you have any questions after reading the report, please feel free to get in touch with the World Employment Confederation's Head Office at [email protected].
Denis Pennel Managing Director
The employment industry enables work adaptation, security and prosperity, contributing to a better society”
Foreword
DENIS PENNELWorld Employment Confederation Managing Director
4 WEC Economic Report 2017

The employment industry has been leading in a changing world of work for decades. It does so by acting as enabler in the labour market, offering a full range of HR services, including agency work, direct recruitment, career management, recruitment process outsourcing (RPO) and managed services provision (MSP).
At a global level, the employment industry:
KEY FINDINGS
Enables work Each year, around 50 million people access the labour market thanks to an employment agency (43 million of whom via agency work). On average, 17% of them are students working while studying (31% of agency workers are younger than 25 years old) and 44% are women. 81% of agency workers are satisfied with their work (with 34% being very satisfied). In terms of penetration rate, agency work accounts for 1.7% of the global working population. With a global turnover amounting to €417 billion and 1.5 million HR consultants, the industry generates an important economic added value to society.
Enables security On average, before entering into agency work 33% of workers were unemployed, while afterwards only 21% went back to unemployment. Similarly, 43% of people starting agency work were employed before, while 71% remain in employment afterwards. From the business side, 50% of UK companies recognise that agency work is important to secure short term access to key strategic skills. Companies using innovative workforce solutions such as RPO or MSP are able to reduce hiring costs by 38%.
Enables adaptation In a changing world of work, the employment industry supports over 5 million companies each year to adapt to an increasingly volatile environment. On the workers’ side, 62% of agency workers in the USA agree that they developed new skills or improved their skills while temping. In France, 90% of agency workers say temping is useful to acquire professional experience and 78% to get trained.
Enables prosperityBy reducing frictional unemployment, the industry contributes to public budgets, saving governments the cost of unemployment benefits. In addition, the provision of flexible workforce solutions leads to a reduction of undeclared work, increasing social charges and corporate tax being paid. Finally, the industry drives inclusiveness and participation to the labour market: 34% of agency workers are younger than 25 years old and 44% are women.
WEC Economic Report 2017 5

LABOUR MARKET
ENABLERS
SOCIAL INTEGRATORS
TRUSTED LABOUR MARKET ADVISORS
GR
OW
TH
DR
IVER
S AGILIT
Y C
REA
TOR
S
ENABLING WORK
Create more work
opportunities
Provide quality &
meaningful work
Improve access to &
transparency of labour market
Facilitate work transitions and social mobility
Improve employability by
upskilling
Adapt workforce to production
needs
Provide work-life balance
Deliver portable
rightsAct as career agent
Secure access to
talent
Increase inclusion &
diversity
Enrich GDP by sales revenues
Increase work income &
purchasing power
Reduce undeclared
work & unemployment
Increase business
competitiveness
Provide stepping stone
ENABLING SECURITY
EN
AB
LIN
G
PR
OS
PE
RIT
Y EN
AB
LING
A
DA
PT
AT
ION
The employment industry enables work, adaptation, security & prosperity.
By doing so, the industry:gives hopedevelops confidence builds trust delivers pride
As a result, employment and recruitment agencies act as social integrators, agility creators, trusted labour market advisors and growth drivers.
Labour market enablers
THE EMPLOYMENT INDUSTRY
6 WEC Economic Report 2017

The range of services delivered by the members of the World Employment Confederation
Training
Outplacement
Welfare-to-Work
Career Transitions
Coaching
Leadership Development
Compensation & Benefits
Performance Assessment
Sourcing candidates
Employee referrals
Testing
Skills assessment
On boarding
Off boarding
Supply & demand of work
Regulatory environment
Labour market surveys
Skills mapping
Thought leadership
HR Consulting
Workforce Analytics
Job Search councelling
Strategic Workshop Planning
Capacity building
Process excellence
Agency Work
Direct (perm & temporary)
Self-employed
Apprenticeship
Contract for servicing
RPO
MSP
Human Cloud
BPO
Payrolling
LABOUR MARKET INTELLIGENCE
PLACEMENT
MANAGED SERVICES
TALENT ACQUISITION
ADVISORY SERVICES
CAREER MANAGEMENT
WEC Economic Report 2017 7

Key indicators
THE EMPLOYMENT INDUSTRY IN 2015
In 2015, the employment industry succeeded to support 50 million people entering and progressing in the labour market at the global level. Thanks to the wide range of HR services it offers (including agency work, direct recruitment, career management, recruitment process outsourcing and managed services provision), the industry contributes to a better functioning labour market and achieved a €417 billion global turnover.
Acting as social integrators, agility creators, trusted labour market advisors and growth drivers, the 169,000 employment agencies the World Employment Confederation gathers – supported by the 1.5 million staff working as HR consultants, branch managers and administrative assistants – simplify the increasing complexity of the world of work.
By enabling work, adaptation, security and prosperity, the employment industry gives hope, develops confidence, builds trust and delivers pride to both individuals and companies.
Global market size of
€ 417 billion(sales revenues)
Global market size (sales revenues)
Agency Work€ 279 bn
RPO € 3.3 bn
MSP € 95 bn
Direct Recruitment € 36.8 bn
Career management € 3 bn
Within the employment industry, the Agency Work market (without MSP activities) accounts for 67% of the overall global sales revenues of the employment industry, followed by the MSP market (22%) and the Direct Recruitment market (9%).
NB: Exchange rate to the € is based on 2015 annual average
8 WEC Economic Report 2017

Africa 1%
Africa 2%
Europe 19%
Europe 40%
South America
18%
South America
20%
North America
10%
North America
13%
Asia Pacific 52%
Asia Pacific 25%
169,000 employment & recruitment agencies and
1.5 million internal staff to help people navigate the labour market
Number of agencies
Number of internal staff
WEC Economic Report 2017 9

The
Employment
industry in
2015 helped
around
50 million people
access the
labour market
at global level
NB: number of individuals only covers activities from the members of the World Employment Confederation
Agentina 50,664
Australia 550,000Austria 226,000Belgium 608,591Brazil 507,564Bulgaria 10,000Canada 450,000Chile 148,118China 8,680,000Colombia 513,069Croatia 16,000Czech Republic 250,000Denmark 20,647Estonia 5,000Finland 100,000France 2,000,000Germany 949,227Greece 10,316Hungary 124,576India 2,100,000Ireland 120,000Italy 640,000Japan 2,630,325Luxemburg 24,164Mexico 1,765,101Morocco 62,000Netherlands 770,136New Zealand 105,000Norway 95,000Poland 799,727Portugal 118,000Romania 67,067Russia 75,767South Africa 900,000Spain 562,345Sweden 153,000Switzerland 314,000United Kingdom 1,198,000USA 15,600,000
Career Management3,000,000 individuals
RPO & MSP 2,500,000 individuals
Agency Work Headcounts 43,319,404 individuals
Direct Recruitment 2,118,306 individuals
10 WEC Economic Report 2017

Top 15 countries ranked by sales revenues (2015)
1 USA 116.3
2 UK 43.4
3 Japan 37.7
4 China 29.9
5 Germany 29.8
6 France 17.7
7 Australia 12.2
8 Netherlands 12.1
9 Canada 11.0
10 Italy 8.0
11 Switzerland 6.6
12 Belgium 4.9
13 India 4.1
14 South Africa 3.7
15 Spain 3.3
Billions €
Agency Work
sales revenues
€374 billion
in 2015
The Agency Work market amounted to €374 billion in 2015 (MSP activities included), with the USA being the leading country in terms of market shares (31%) followed by the UK (11%) and Japan (10%).
In terms of regional split, North America is the largest region (36%), followed by Europe (accounts for 35%) and Asia/Pacific (22%).
THE AGENCY WORK MARKET
WEC Economic Report 2017 11

3,8%
1,8%
1,2%
0,5%
3,0%
1,5%
0,6%
2,1%
0,9%
0,2%
3,5%
1,6%
2,2%
1,0%
0,2%
2,7%
1,2%
0,5%
2,0%
0,8%
3,7%
0,6%
2,2%
0,3%
2,8%
1,3%
0,6%
2,0%
0,8%
0,1%
USA
2.2%
Japan
2.0%
Europe
1.9%Global
1.7%
Penetration rate by country (2015)
THE AGENCY WORK MARKET
Agency Work represents a limited part of the global working population (1.7%), with a higher penetration rate in the USA (2.2%), Japan (2%) and Europe (1.9%)
UK AU NZ NL LU HU DE BE US FR JP PO AU CH SE ZA PL FI IT NO CZ MX BR DK CA CO EE ES LV CL HR RO LT MA GR
2,4%
1,1%0,7% 0,6%
1,8%
12 WEC Economic Report 2017

Top 15 countries ranked by sales revenues (2015, in million €)
THE DIRECT RECRUITMENT MARKET
1 USA 18,938
2 UK 4,121
3 Australia 4,059
4 Canada 3,000
5 Japan 2,682
6 Germany 2,004
7 France 1,000
8 Switzerland 621
9 Ireland 600
10 New Zealand 423
11 Belgium 161
12 Brazil 141
13 Austria 114
14 Russia 102
15 Poland 83
The global Direct Recruitment market amounted to €36.8 billion in 2015, with the USA dominating in terms of country shares (50%) followed by the UK (11%) and Australia (11%)
WEC Economic Report 2017 13

Business drivers for providing outplacement
THE CAREER MANAGEMENT MARKET
Global market size of
€2.95 billion(sales revenues)
Source: Right Management – Why organisations rely on outplacement – 2016
€2.95 billionCovers career transition and talent management activities at global level
Under what circumstances might a company decide to use outplacement services?
Global Americas Europe Asia Pacific
Restructuring
Mergers & Acquisistions
Leadership change
Division/plant closings
Poor company performance
Poor individual performance
68%
53%
43%
40%
33%
35%
69%
59%
50%
45%
36%
35%
71%
48%
36%
37%
32%
34%
60%
43%
31%
30%
25%
39%
14 WEC Economic Report 2017

2015 RPO market size – Global & Regions (€ billions)
THE RPO MARKET
Global market size of
€3.3 billion(sales revenues)
Global market size of
€2.95 billion(sales revenues)
The global market size for Recruitment Process Outsourcing (RPO) is estimated at €3.3 billion for 2015. North America dominates the market (44% of market share), followed by the EMEA region (31%) and Asia Pacific (22%).
Source: Staffing Industry Analysts - Annual 2015 average exchange rate used between $ and € = 0.9017
EMEA 31%
LATAM 3%
North America 44%
APAC 22%
WEC Economic Report 2017 15

85 bn
95 bnGlobal
THE MSP MARKET
MSP market size – Global & Regions (€ billions)
Global market size of
€95 billion(sales revenues)
The global market size for Managed Services Provision (MSP) is estimated at €95 billion for 2015 and grew by 13% compared to 2014. North America continues to dominate the market (59% of market share), followed by Europe (34%).
Source: Staffing Industry Analysts - Annual 2015 average exchange rate used between $ and € = 0.9017
2014
2015
52 bn
54 bn North America
26 bn
32 bnEurope
7 bn
9 bnRest of the world
16 WEC Economic Report 2017

1- Enabling Work
Each year, around 50 million people access the labour market thanks to an employment agency (43 million of whom via agency work). On average, 17% of them are students working while studying and 81% of agency workers are satisfied with their work (with 34% being very satisfied). In terms of penetration rate, agency work accounts for 1.7% of the global working population. With a global turnover amounting to €417 billion and 1.5 million HR consultants, the industry generates an important economic added value to society.
50 million people access the labour market thanks to an employment
agency each year
with €417 bn global turnover,
the industry generates an important economic added value to society
81% of agency workers
are satisfied with their work (with
34% being very satisfied)
EN
AB
LING
W
OR
K
WEC Economic Report 2017 17

Source: ISF Report 2016, Turning available work into jobs Work, outsourcing, overtime, reskilling, transfers, etc.
Not adopting flexi staffing does not necessarily create new permanent jobsCREATE MORE WORK OPPORTUNITIESIn India, agency work creates jobs that would not otherwise exist : 92% of companies would not hire permanent jobs if agency work was not available. 83% of companies would opt for external/internal flexibility solutions rather than recruiting directly.
External flexbility solution50%
Internal flexibility solution33%
Be selective in undertaking projects9%
Hire permanent workers8%
would not hire permanent jobs if agency work was not available
92%
18 WEC Economic Report 2017

Situation before and after working as an agency worker PROVIDE A STEPPING STONEWhile 50% of agency workers were unemployed or inactive before temping, only 25% of them get back to unemployment 12 months later
Unemployed
Agency Work
Fixed term
Open ended
Average unemployed: 38%
Average: 25%
Unemployed
Inactive
AFT
ER
(1
2 m
on
ths
late
r)
BE
FOR
E
AU AT BR CZ FR DE GR NL NZ NO SE CH US
25% 40%35% 1% 40%16% 34% 37%12% 8%
25% 20%30% 12% —23% 25% 5%30% 8%
2%
12%
0%
20%
65%
80%
59%
63%
25%
40%
23%
23%
5%
33%
16%
23%
20%
25%
24%
52%
39%
49%
30%
39%
14%
41%
47%
10%
40%
na
15%
25%
4%
6%
25%
2%
21%
12%
25%
17%
30%
2%
15%
5%
51%
17%
21%
20%
22%
7%
5%
19%
Average inactive: 12%
Together: 50%
52% 38% 41%
only of agency workers get back to unemployment after temping
25%
}
WEC Economic Report 2017 19
EN
AB
LING
W
OR
K

It’s a way to get a permanent job49%
Was unable to find a permanent job40%
Between permanent jobs20%
To improve skills24%
To obtain training12%
Choice of assignments to select from10%
To obtain work experience28%
Supplement household income16%
Flexible hours / schedule22%
Family or personal obligations11%
Recently moved to town10%
PROVIDE A STEPPING STONEOpportunity to get a permanent contract is main reason to work through agency work (USA)
Note: multiple responses allowed. Reasons with <10% excluded from graph.
Source: American Staffing Association, 2014 Staffing Employee Survey
Reasons for choosing agency work
49%Find it’s a way to get a permanent job
20 WEC Economic Report 201720 WEC Economic Report 2017

Satisfied
Very satisfied
DELIVER QUALITY AND MEANINGFUL WORKOn average, 81% of agency workers are satisfied with their work (with 34% being very satisfied)
Note: USA: categories are: “somewhat satisfied (18%) + very satisfied (33%)” and “extremely satisfied”
Source: the World Employment Confederation national federation members
Satisfaction of agency workers with their work
81%are satisfied with their work
Belgium (2014)
Colombia (2013)
Denmark (2015)
Finland (2012)
France (2015)
Norway (2015)
Sweden (2015)
USA (2014)
52%
17%
48%
46%
36%
43%
49%
18%
57%
31%
45%
33%
43%
39%
51%
41%
WEC Economic Report 2017 21
EN
AB
LING
W
OR
K
WEC Economic Report 2017 21

Satisfaction of agency workers with their working conditions (Norway)
Source: NHO - 2016
DELIVER QUALITY AND MEANINGFUL WORKIn Norway, agency workers are satisfied with most of their working conditions
Note: n=2137
The job conforms to my expectations.
The client gave me an adequate induction into the work.
My work tasks match my professional background.
My work tasks offer me sufficient challenges.
The work tasks spur me on to do my best.
I believe I am paid at least the same as the client’s own employees who have
the same experience and training.
35%
45%
11%6%
2%
2%
1% 3% 4%
6% 12% 7%
17%
38%
41%
10%8%
35%
40%
15%
6%
30%
38%
15%
9%
26%
33%
19%
10%
17%
27%
16%
16%
Very applicable Fairly applicable Neither applicable nor not applicable
Not very applicable Not applicable Don’t know
68%are satisfied with their working conditions
22 WEC Economic Report 2017

Agency workers would recommend agency work to friends and relatives DELIVER QUALITY AND MEANINGFUL WORKOn average, 75% of agency workers would recommend agency work to friends and relatives
Yes
No
Don't know
Denmark (2015)
France (2016)
Norway (2015)
Sweden (2015)
75%would recommend agency work
79%
6%
15%
88%
11%
1%
63%
17%
20%
68%
18%
14%
WEC Economic Report 2017 23
EN
AB
LING
W
OR
K

Average length of assignmentDELIVER QUALITY AND MEANINGFUL WORK
Source: National federations of World Employment Confederation
On average, 53% of assignments are longer than 3 months
53%
LU ES JP CZ BR AU AT MX ZA RO USA RU UK NZ HU DE EE GR CO CN
Short-term (< 1month)
Medium-term (1-3 months)
Long-term (>3 months
2%
1%9
7%
19%
8%
73
%
47
%12
%4
1%
60
%2
5%
15%
25
%3
5%
40
%
43
%3
4%
23
%
12%
36
%5
2%
24
%4
7%
29
%
33
%5
0%
17%
33
%5
1%16
%
24
%5
7%
19%
30
%5
9%
11%
30
%6
1%9
%
40
%6
0%
20
%6
5%
15%
15%
74%
11%
15%
80
%5
%
100
%
16%
81%
3%
100
%
24 WEC Economic Report 2017

Source: NHO - 2016
IMPROVE ACCESS TO & TRANSPARENCY OF LABOUR MARKET
How fast did you get an assignment through the employment agency? (Norway)
In Norway, 46% of agency workers got a job within 1 week
46%
The same day I got in touch9%
Within three days 16%
Within a week21%
Don’t know
After more than two months
Within a month
Within two weeks15%
18%
8%
6%Within two months 6%
WEC Economic Report 2017 25
EN
AB
LING
W
OR
K

As a jobseeker, who would you trust best to find a job? (France)IMPROVE ACCESS TO & TRANSPARENCY OF LABOUR MARKETEmployment agencies are second best channel to find work for job seekers (France), ahead of public employment services
trust best employment agencies to find a job
16%
Others12%
On-line job vacancies6%
Public employment services10%
Friends or relatives
Private employment agencies
Job boards11%
16%
44%
26 WEC Economic Report 2017

2- Enabling Adaptation
In a changing world of work, the employment industry supports over 5 million companies each year to adapt to an increasingly volatile environment. On the workers’ side, 62% of agency workers in the USA agree that they developed new skills or improved their skills while temping. In France, 90% of agency workers say temping is useful to acquire professional experience and 78% to get trained.
78% of agency workers say temping is useful to
get trained
FR
90% of agency workers say temping is useful to acquire
professional experience
FR
62% of agency workers developed new skills or
improved their skills while temping
US
EN
AB
LING
A
DA
PTA
TIO
N
WEC Economic Report 2017 27

Services provided by the members of the World Employment Confederation
Source: National federations of World Employment Confederation
DELIVER DIVERSIFIED WORKFORCE SOLUTIONSMembers of the World Employment Confederation represent a large range of HR services, allowing to provide for taylor-made solutions to people and companies
Agency work
Direct recruitment
Career management
RPO
MSP
VMS
Payrolling
Project sourcing
HR consultancy
Training
Outsourcing
Self-employment
Online work platforms
Personal services
Welfare-to-work
Other
100%
73%
35%
31%
23%
23%
35%
23%
38%
31%
35%
12%
8%
19%
19%
19%
Over 16different HR services are provided by the World Employment Confederation members
28 WEC Economic Report 2017

What were the main benefits of using agency work? (USA)
Source: American Staffing Association, 2014 Staffing Employee Survey
IMPROVE EMPLOYABILITY BY UPSKILLING62% of US agency workers say agency work made them more employable
Note: multiple responses allowed
of US agency workers say agency work made them more employable
62%
I developed new or improved work skills62%
It helped strengthen my resume59%
I received on-the-job experience59%
It helped me get my foot in the door for a permanent job49%
I gained self-confidence38%
I developed better work habits35%
Other 5%
I don’t feel it made me more employable 11%
WEC Economic Report 2017 29
EN
AB
LING
A
DA
PTA
TIO
N

Why agency workers say temping is useful (France)
Very useful
Fairly useful
Not very useful
Not at all useful
Don’t know
Get a permanent
or fixed-term contract Fund studies
Learn different skills Get trained
Acquire professional experience
2%
34%42% 43%
57%
37%
36%
36%
35%
33%25% 12%
14% 14%
6%10%
13%
5% 5%2%
26%
5% 3% 3% 2%
to acquire professional experience
to get trained90% 78%
IMPROVE EMPLOYABILITY BY UPSKILLING90% of agency workers say temping is useful to acquire professional experience and 78% to get trained (France)
30 WEC Economic Report 2017

Source: National federations of World Employment Confederation
Budget spent on training agency workers via bipartite funds - 2015
Austria Austria
Luxembourg
Belgium
Netherlands
France
Italy
7,5167,516
2,210
8,652€ 30 mio
€ 30 mio
1 mio €
€ 2,5 mio
€ 1,3 mio
Number of workers trained via AW bipartite training fund
Budget of bipartite training funds (€ million)
225,000
224,000
€ 220 mio
100,118
€ 340 mio
600.000agency workers trained via bipartite funds in 6 European countries in 2015
€604+ million invested by the employment industry on training agency workers in 2015
IMPROVE EMPLOYABILITY BY UPSKILLINGNote: these figures do not comprise number of agency workers directly trained by companies
WEC Economic Report 2017 31
EN
AB
LING
A
DA
PTA
TIO
N
Source: National federations of World Employment Confederation & Offices for National Statistics
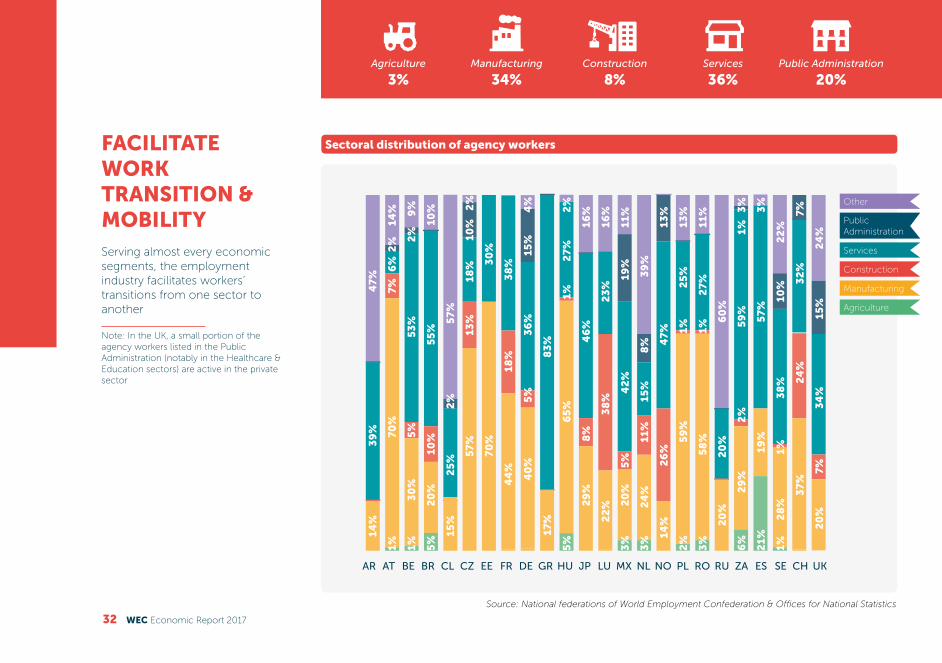
Sectoral distribution of agency workersFACILITATE WORK TRANSITION & MOBILITYServing almost every economic segments, the employment industry facilitates workers’ transitions from one sector to another
Note: In the UK, a small portion of the agency workers listed in the Public Administration (notably in the Healthcare & Education sectors) are active in the private sector
Agriculture
Construction
Public Administration
Manufacturing
Services
Other
AR AT BE BR CL CZ EE FR DE GR HU JP LU MX NL NO PL RO RU ZA ES SE CH UK
14%
39
%4
7%
1%7
0%
7%
6%
14%
2%
1%3
0%
5%
53
%9
%2
%
5%
20
%10
%5
5%
10%
15%
25
%5
7%
2%
57
%13
%18
%2
%10
%
70
%3
0%
44
%18
%3
8%
40
%5
%3
6%
4%
15%
17%
83
%
5%
65
%1%
27
%2
%
29
%8
%4
6%
16%
22
%3
8%
23
%16
%
3%
20
%5
%4
2%
11%
19%
3%
24
%11
%15
%3
9%
8%
6%
29
%2
%5
9%
3%
1%
14%
26
%4
7%
13%
21%
19%
57
%3
%
3%
58
%1%
27
%11
%
37
%2
4%
32
%7
%
2%
59
%1%
25
%13
%
1%2
8%
1%3
8%
22
%10
%
20
%2
0%
60
%
20
%7
%3
4%
24
%15
%
Agriculture
3%Manufacturing
34%Construction
8%Services
36%Public Administration
20%
32 WEC Economic Report 2017
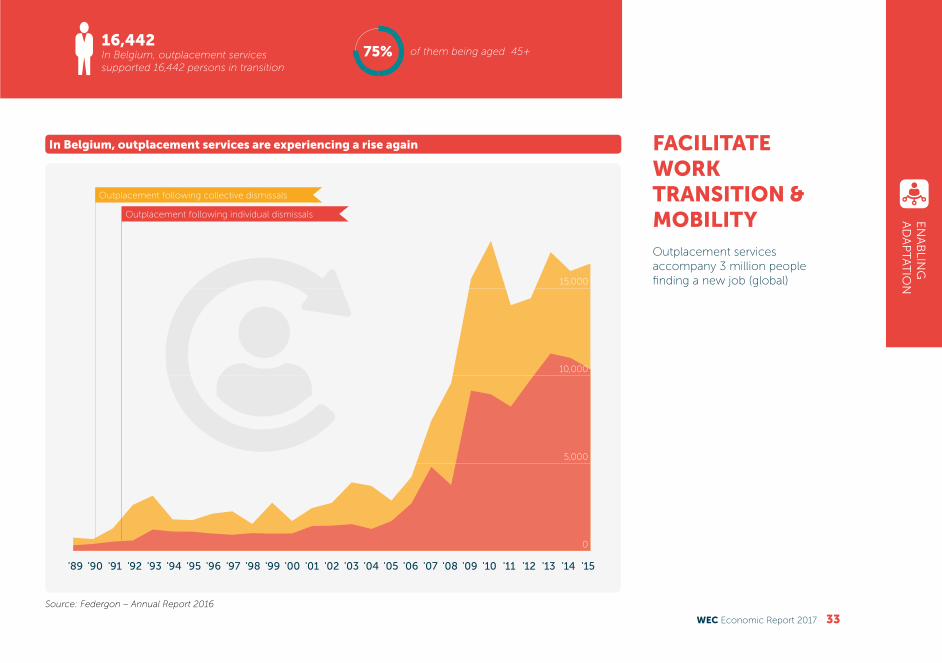
In Belgium, outplacement services are experiencing a rise again
Source: Federgon – Annual Report 2016
FACILITATE WORK TRANSITION & MOBILITYOutplacement services accompany 3 million people finding a new job (global)
Outplacement following individual dismissals
Outplacement following collective dismissals
'89 '90 '91 '92 '93 '94 '95 '96 '97 '98 '99 '00 '01 '02 '03 '04 '05 '06 '07 '08 '09 '10 '11 '12 '13 '14 '15
16,442In Belgium, outplacement services supported 16,442 persons in transition
of them being aged 45+75%
15,000
10,000
5,000
0
WEC Economic Report 2017 33
EN
AB
LING
A
DA
PTA
TIO
N

Source: National federations of World Employment Confederation
Skills required by job executedFACILITATE WORK TRANSITION & MOBILITYThe employment industry is able to source and match very different levels of skills, depending on the needs expressed by companies.
CH DE AU NZ IN IE LT CZ EE NO ZA RO SE AR GR ES BR UK CN HU RU
Low
Medium
High
High27% Low24%Medium48%Average level of skills
2%
67
%3
1%
12%
81%
7%
20
%6
0%
20
%
30
%5
0%
20
%
40
%4
0%
20
%
10%
50
%4
0%
16%
12%
72
%
20
%6
5%
15%
34
%5
9%
7%
49
%2
4%
27
%
9%
38
%5
3%
12%
81%
7%
20
%6
0%
20
%
32
%6
2%
6%
43
%2
3%
34
%
10%
60
%3
0%
20
%6
0%
20
%
24
%4
6%
30
%
39
%3
4%
27
%
60
%2
0%
20
%
69
%16
%15
%
34 WEC Economic Report 2017
Source: National federations of World Employment Confederation
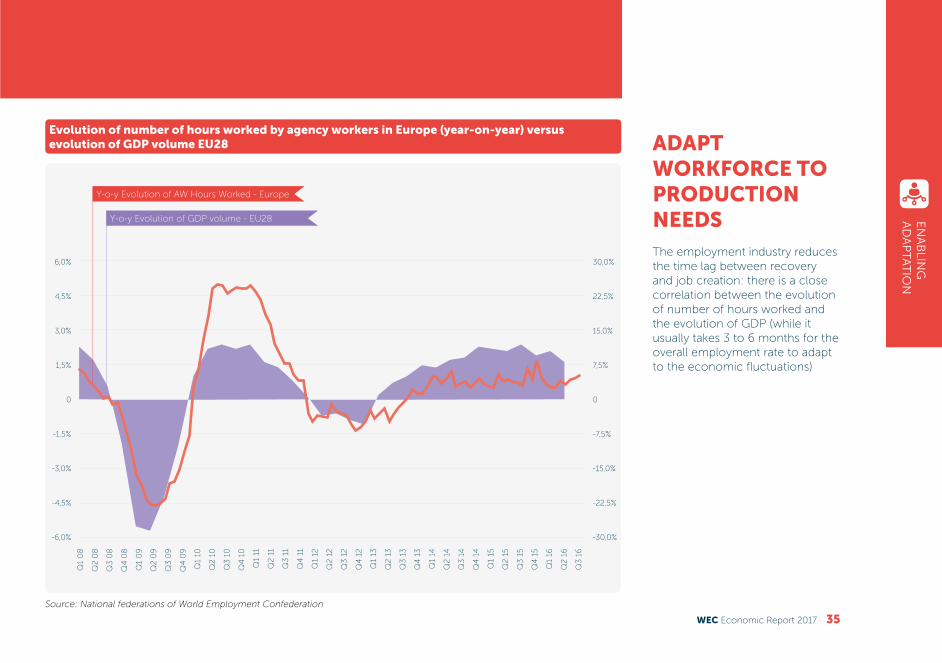
Evolution of number of hours worked by agency workers in Europe (year-on-year) versus evolution of GDP volume EU28 ADAPT
WORKFORCE TO PRODUCTION NEEDSThe employment industry reduces the time lag between recovery and job creation: there is a close correlation between the evolution of number of hours worked and the evolution of GDP (while it usually takes 3 to 6 months for the overall employment rate to adapt to the economic fluctuations)
Q1
08
Q2
08
Q3
08
Q4
08
Q1
09
Q2
09
Q3
09
Q4
09
Q1
10
Q2
10
Q3
10
Q4
10
Q1
11
Q2
11
Q3
11
Q4
11
Q1
12
Q2
12
Q3
12
Q4
12
Q1
13
Q2
13
Q3
13
Q4
13
Q1
14
Q2
14
Q3
14
Q4
14
Q1
15
Q2
15
Q3
15
Q4
15
Q1
16
Q2
16
Q3
16
6,0%
4,5%
3,0%
1,5%
0
-1,5%
-3,0%
-4,5%
-6,0%
30,0%
22,5%
15,0%
7,5%
0
-7,5%
-15,0%
-22,5%
-30,0%
Y-o-y Evolution of AW Hours Worked - Europe
Y-o-y Evolution of GDP volume - EU28
WEC Economic Report 2017 35
EN
AB
LING
A
DA
PTA
TIO
N

Reasons that are “Important to very important” for companies to hire agency workers
Source: Zeitarbeit in Deutschland –Treiber für Flexibilität und Wachstum, IW Consult GmbH, 2011Source: based on the responses of senior HR officials of select Rg 5 billion plus companies from 15 different sectors
ADAPT WORKFORCE TO PRODUCTION NEEDS1 Flexi staffing allows a business to manage
transient manpower demand / supply fluctuations due to business cyclicality, and/or temporary absence of regular employees
2 Costs associated with payroll processing and administration, payment of benefits, etc. can be transferred to the flexi staffing agency
3 Employers can test flexi workers on the job for their skills and temperament, and top performers can later be absorbed into the regular payroll
4 Utilisation of flexi staff reduces search and recruitment time as well as cost
5 In an environment of economic uncertainty coupled with rigid labour laws, businesses are reluctant to expand regular payroll before being certain about business growth
6 Enables businesses to focus on their core activities, while outsourcing support services
7 Easy availability of un-skilled flexi workers has encouraged many businesses to follow just-in-time flexi hiring
of German companies hire agency workers to adapt production capacity at short notice
of Indian companies use agency work for greater flexibility in workforce planning
84% 63%
Germany
India
Compliance efficiency 2
Uninterrupted hiring 4
Enable focus on core business 6
Try out potential hires 3
Complex layout laws 5
Just in time availability 7
84%
73%
43%
34%
21%
63%
49%
41%
39%
34%
20%
17%
Flexibility; short notice adaptation of capacity
Availability of workers
Labour costs of hiring
Trying out workers
Bureaucracy involved in hiring staff
Flexibility in manpower planning 1
36 WEC Economic Report 2017

3- Enabling Security
On average, before entering into agency work, 33% of workers were unemployed, while afterwards only 21% went back to unemployment. Similarly, 43% of people starting agency work were employed before, while 71% remain in employment afterwards. From the business side, 50% of UK companies recognise that agency work is important to secure short term access to key strategic skills. Companies using innovative workforce solutions such as RPO or MSP are able to reduce hiring costs by 38%.
Using innovative workforce solutions such as RPO or MSP
reduces hiring costs by 38%
43% of people starting agency work were employed before,
while 71% remain in
employment.
33% of workers were unemployed before agency work, while
only 21% went back to
unemployment
EN
AB
LING
SE
CU
RIT
Y
WEC Economic Report 2017 37
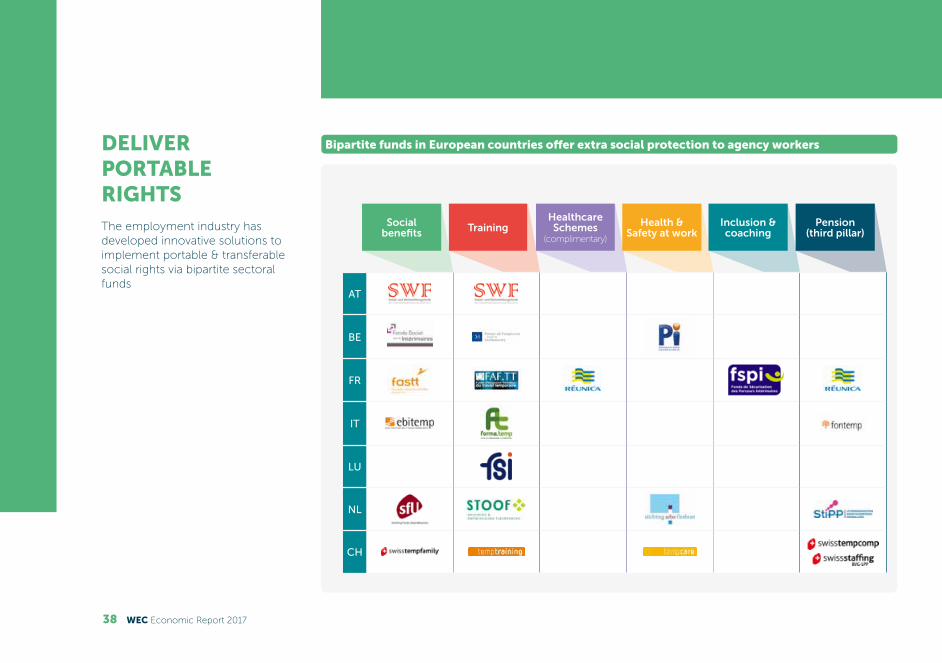
Bipartite funds in European countries offer extra social protection to agency workersDELIVER PORTABLE RIGHTSThe employment industry has developed innovative solutions to implement portable & transferable social rights via bipartite sectoral funds
AT
BE
FR
IT
LU
NL
CH
Social benefits
Pension (third pillar)
Healthcare Schemes
(complimentary)
Health & Safety at workTraining Inclusion &
coaching
38 WEC Economic Report 2017

Range of services delivered by Fastt (French social bipartite fund) DELIVER PORTABLE RIGHTSThe French social fund for the agency work sector (Fastt) delivered 70,000 services in favour of agency workers in 2015 by designing innovative solutions
Access to housing Transportation Child care
Social assistance
Credit
Holidays Health insurance
Temporary accomodation
268,000information requests managed
70,000services delivered
€22 millioninvested for agency workers
WEC Economic Report 2017 39
EN
AB
LING
SE
CU
RIT
Y

How would you say that agency workers are for your organisation in terms of the following?
Source: REC Jobs Outlook report – a2016
SECURE ACCESS TO TALENTSFor 50% of UK companies, agency work is important to providing short term access to key strategic skills. This rose to 57% amongst the largest companies (250+ employees).
All who recruite agency workers (n=136)
Peaks in demand
Responding to growth
Fast-changing organisational requirements
Covering leaves or absences
Reducing costs
Managing uncertainty
Providing short term
access to key strategic skills
67%
47%51%
63%49%
35%
50%
Responses stating the factor is quite or very important
40 WEC Economic Report 2017
Source: National federations of World Employment Confederation
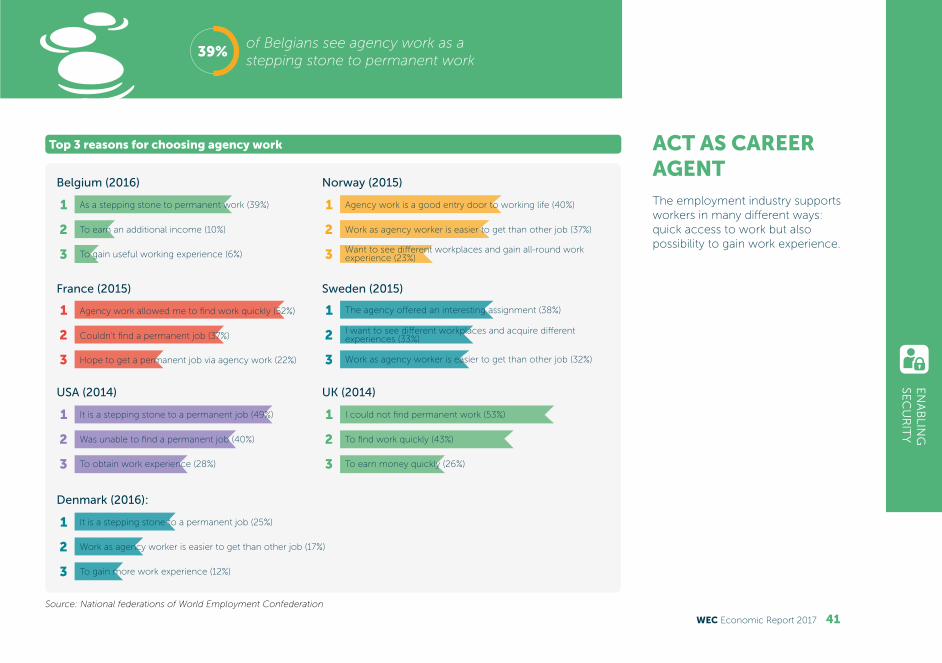
Top 3 reasons for choosing agency work ACT AS CAREER AGENTThe employment industry supports workers in many different ways: quick access to work but also possibility to gain work experience.
1
2
3
1
2
3
1
2
3
1
2
3
1
2
3
1
2
3
1
2
3
Belgium (2016) Norway (2015)
France (2015) Sweden (2015)
USA (2014) UK (2014)
Denmark (2016):
As a stepping stone to permanent work (39%) Agency work is a good entry door to working life (40%)
Agency work allowed me to find work quickly (52%) The agency offered an interesting assignment (38%)
It is a stepping stone to a permanent job (49%) I could not find permanent work (53%)
It is a stepping stone to a permanent job (25%)
To earn an additional income (10%) Work as agency worker is easier to get than other job (37%)
Couldn’t find a permanent job (37%)I want to see different workplaces and acquire different experiences (33%)
Was unable to find a permanent job (40%) To find work quickly (43%)
Work as agency worker is easier to get than other job (17%)
To gain useful working experience (6%) Want to see different workplaces and gain all-round work experience (23%)
Hope to get a permanent job via agency work (22%) Work as agency worker is easier to get than other job (32%)
To obtain work experience (28%) To earn money quickly (26%)
To gain more work experience (12%)
of Belgians see agency work as a stepping stone to permanent work
39%
WEC Economic Report 2017 41
EN
AB
LING
SE
CU
RIT
Y

Source: Aberdeen Group
How do the best-in-class see agency and temporary workers?INCREASE BUSINESS COMPETITIVENESSMost efficient organisations rely to a greater extend on agency and temporary workers to conduct their business
n=192
Vital component of our business: we rely heavily on contingent workers or a
moderately significant component of our business
Slightly significant component of our business or do not utlise contingent
labor on a significant scale
73%
10%
23%
Best-in-class Best-in-class
All others All others
90%
42 WEC Economic Report 2017

Source: Aberdeen Group, April 2016
Solutions to manage temporary and agency workers INCREASE BUSINESS COMPETITIVENESSMost efficient organisations are 71% more likely to use a Managed Services Provider (36% vs 21%) to support the management of agency and temporary workers
Vendor Managed System (VMS)
Managed Services Provider (MSP)
Spend analysis solutions
42%36%
32%
21%
21%
23%
Best-in-class
All others
Most efficient organisations are more likely to use a Managed Services Provider71%
WEC Economic Report 2017 43
EN
AB
LING
SE
CU
RIT
Y

Year-over-year improvement (reduction)
Source: Aberdeen Group, May 2016
INCREASE BUSINESS COMPETITIVENESSRPO usage has a big impact on HR KPIs. Companies that invest in an RPO provider are able to reduce hiring costs by 38%
Companies that use RPO
Companies that use RPO
All others
All others
Cost per hire Time to hire
3.3%
2.4%1.8%
-0.4%
costs reductions by using a RPO provider38%
44 WEC Economic Report 2017

4- Enabling Prosperity
By reducing frictional unemployment, the industry contributes to public budgets, saving governments the cost of unemployment benefits. In addition, the provision of flexible workforce solutions leads to a reduction of undeclared work, increasing social charges and corporate tax being paid. Finally, the industry drives inclusiveness and participation to the labour market: 34% of agency workers are younger than 25 years old and 44% are women.
44% of agency workers
are women34% of agency workers
are younger than 25 years old
the provision of flexible workforce solutions leads to
of undeclared work,
social charges and corporate tax being paid
EN
AB
LING
P
RO
SPE
RIT
Y
WEC Economic Report 2017 45

Evolution of number of hours worked by agency workers in Europe (year-on-year) versus average EU 28 Unemployment change (year-on-year)REDUCE
UNDECLARED WORK & UNEMPLOYMENTAgency work contributes to reduce frictional unemployment by ensuring a better and faster match between supply and demand of work
Y-O-Y Change in unemployment (EU 28)
35%
5%-
25%
35%
5%
-25%
Evolution of AW hours worked - Europe
Q1
12
Q2
12
Q3
12
Q4
12
Q1
13
Q2
13
Q3
13
Q4
13
Q1
14
Q2
14
Q3
14
Q4
14
Q1
15
Q2
15
Q3
15
Q4
15
Q1
16
Q2
16
Q3
16
Q4
16
Q1
17
Q2
17
Q3
17
Q4
17
Q1
18
Q2
18
Q3
18
Q4
18
Q1
19
Q2
19
Q3
19
Q4
19
Q1
20
Q2
20
Q3
20
Andhra Pradesh
46 WEC Economic Report 2017

Source: Nielsen estimates using N550 and Ministry of Labour data
Statewise agency work penetration (% of workforce) REDUCING UNDECLARED WORK & UNEMPLOYMENT India : Low average unemployment rate of 2.59% in states with agency work penetration higher than national average of 0.51%
1 Refers to undivided Andhra Pradesh
2.59%
0.89%
4.74%
0.35%
Average flexi workforce penetration rate
Average flexi workforce penetration rate
Average unemployment Rate
Average unemployment Rate
2.79%
0.38%
1.67%
0.36%
0.94%
0.36%
0.87%
0.35%
0.58%
0.30%
0.58%
States with higher agency work penetration than national average of 0.51% in 2015
States with lower agency work penetration than national average of 0.51% in 2015
Delhi
Haryana
Karnataka
Maharashtra
Gujarat
Tamil Nadu
Andhra Pradesh RajasthanUtar Pradesh
West Bengal
Madhya Pradesh
WEC Economic Report 2017 47
EN
AB
LING
P
RO
SPE
RIT
Y

Source: American Staffing Association Workforce Monitor TM, an online survey conducted Dec. 22-28, 2015, among 1,008 U.S. adult job seekers, by Harris Poll
Type of work sought (US)INCREASE INCLUSIVENESS AND DIVERSITYPeople are looking for different types of jobs and individualized working conditions, reflecting the end of the one-size-fits-all approach.
The employment industry provides a full range of arrangements to meet this diversity of expectations.
Full-time75%
Part-time53%
Temporary or Contract36%
Seasonal31%Freelance or Independent Contractor 31%
48 WEC Economic Report 2017

INCREASE INCLUSIVENESS AND DIVERSITYThe employment industry offers work solutions to a range of people and increases inclusiveness, especially for young people and women.
At global level, 44% of agency workers are women and 31% are under the age of 25.
Age of agency workers
15%
28%
26%
19%
12%
World
13%
20%
26%
27%
14%
Europe
35%
32%
16%
13%
4%
USA
> 45 years old
31 - 45 years old
26 - 30 years old
21 - 25 years old
< 21 years old
Male FemaleAverage gender split
56% 44%
WEC Economic Report 2017 49
EN
AB
LING
P
RO
SPE
RIT
Y

New Zealand40%
% of agency workers as studentsINCREASE WORK INCOMESMany students use agency work to fund their studies
Sweden17%
Finland27%
Czech Republic18%
Greece16%
France15%
Russia15%
Belgium14%
Romania12%
Denmark7%
Australia3%
Switzerland14%
Mexico20%
Austria19%
Norway19%
Global percentage of agency workers as students
17%
50 WEC Economic Report 2017

$78 $79
$91
$102
$111
$116$112
$81
$100
$114
$126
$132
$139 $147
Source: American Staffing, Staffing Industry Analysts Inc., U.S. Department of Commerce
ENRICH GDP BY SALES REVENUESIn the USA, sales revenues of the employment industry has never been so high, reaching $147 billion in 2015, contributing to reducing unemployment and creating work opportunities that would not exist otherwise
Sales (Billions of U.S. Dollars) - Annual Totals for Staffing and Recruiting Industry
Romania
Denmark
Australia
88
%
90
%
89
% 88
%
86
%
85
%
86
%
90
%
90
%
90
%
88
%
87
% 87
% 86
%
12%
10%
11%
12% 14
% 15%
14%
10%
10%
10%
12% 13
% 13% 14
%
2002 2003 2004 2005 2006 2007 2008 2009 2010 2011 2012 2013 2014 2015
Temporary and
Contract
Search and
Placement
$147 billionsales revenues of the employment industry (2015)
WEC Economic Report 2017 51
EN
AB
LING
P
RO
SPE
RIT
Y

Contributions of the employment industry to the public budget (France & the UK)ENRICH GDP BY TAXES AND SOCIAL CHARGESBy employing millions of workers, the employment industry contributes significantly to public budgets by paying social charges and corporate taxes. By reducing levels of unemployment, the industry contributes to reduce public spendings on unemployment allowances
France
€ 260 million of local taxes (contribution économique territoriale)
€ 170 million of corporate tax
€ 4,7 billion of social security contributions (companies)
€ 3 billion of social security contributions (employees)
UK
76% of value added to the UK economy by the industry was derived from temporary
employment activities.
Employment industry contributes more to the UK economy than
advertising, arts and recreation, and the food and beverage industry
Economic added-value of £35 billion in 2015/2016
52 WEC Economic Report 2017

Annexes
GLOSSARY OF USED TERMS AND ACRONYMSAgency workAgency Work is a triangular employment relationship, defined in ILO Convention 181 as: "Services consisting of employing workers with a view to making them available to a third party, who may be a natural or legal person ("user enterprise") which assigns their tasks and supervises the execution of these tasks“. It can be named as Dispatched Labour in Asia, Labor Hire in Africa or Temporary Staffing in the USA.
Career managementMain service segments are individual outplacement services, executive outplacement services, group outplacement services and other employment transition services. In these segments, outplacement services companies provide a range of employment and career services. These include resume writing, interview skills, job search strategies, coaching and career guidance. Employers generally pay all of the costs associated with these services.
Daily average number of agency workers (FTE)Total number of hours worked by all agency workers in a country over a period of one year divided by the average number of hours worked over a period of one year by a worker with a full-time job with an open-ended contract.
Direct Recruitment Services for matching offers of and applications for employment, without the private employment agency becoming a party to the employment relationships which may arise therefrom (Source: ILO Convention 181), including executive search & selection.
Managed Services Provision (MSP)MSP is a service whereby a company takes on primary responsibility for managing an organization’s contingent workforce program. Typical responsibilities of an MSP include overall program management, reporting and tracking, supplier selection and management, order distribution and often consolidated billing. The vast majority of MSPs also provide their clients with a vendor management system (VMS) and may have a physical presence on the client’s site. An MSP may or may not be independent of a staffing supplier.
Penetration rateDaily average number of agency workers [in full-time equivalents] divided by the working population [as defined by the ILO as follows: “The employed comprise all persons of working age who during a specified brief period, such as one week or one day, were in the following
categories: a) paid employment (whether at work or with a job but not at work); or b) self-employment (whether at work or with an enterprise but not at work).“
Private employment services / Employment industryAgency work is usually one of several other HR services provided by recruitment and employment agencies, along with direct recruitment, career management, RPO & MSP. The broad range of these services are called private employment services. The employment agency provides a professional service to a user company by taking over (a part of) the recruitment and HR process. In this sense, private employment services are comparable to other professional and business services such as auditing & accounting, communications & marketing, facilities management etc.
Recruitment Process Outsourcing (RPO)A service by a third-party specialist provider, to assume the role of the client’s recruiting department by owning and managing part or all of its recruitment process and related recruitment supply chain partner relationships, provide the necessary skills, activities, tools, technologies, and process methodologies.
WEC Economic Report 2017 53

MEMBERS OF THE WORLD EMPLOYMENT CONFEDERATION (NATIONAL FEDERATIONS)
MEMBERS OF THE WORLD EMPLOYMENT CONFEDERATION (CORPORATE MEMBERS)
North America
Canada (CA)
Mexico (MX)
USA (USA)
Latin America
Argentina (AR)
Brazil (BR)
Chile (CL)
Colombia (CO)
Peru (PE)
Africa
Morocco (MA)
South Africa (ZA)
North East Asia
China (CN)
Japan (JP)
South Korea (KR)
APAC Southern
Australia (AU)
India (IN)
Indonesia (ID)
New Zealand (NZ)
Philippines (PH)
Singapore (SG)
Vietnam (VN)
Europe
Austria (AT)
Belgium (BE)
Bulgaria (BG)
Croatia (HR)
Czech Republic (CZ)
Denmark (DK)
Estonia (EE)
Finland (FI)
France (FR)
Germany (DE)
Greece (GR)
Hungary (HU)
Ireland (IE)
Italy (IT)
Latvia (LV)
Lithuania (LT)
Luxembourg (LU)
Netherlands (NL)
Norway (NO)
Poland (PL)
Portugal (PT)
Romania (RO)
Russia (RU)
Slovakia (SK)
Slovenia (SI)
Spain (ES)
Sweden (SE)
Switzerland (CH)
Turkey (TR)
UK (UK)
54 WEC Economic Report 2017

Disclaimer
This Economic Report is owned by the World Employment Confederation, whose registered office is at Tours & Taxis Building, Avenue du Port 86c – Box 302 - 1000 Brussels.
Care and precaution were taken to ensure that the information published in this report is accurate but the World Employment Confederation publishes this
content as supplied and is not responsible for its accuracy or timeliness. You must take appropriate steps to verify this information before acting upon it.
Any use of this report or its content, including copying or storing it in whole or in part, other than for personal, media-related purposes or non-commercial use, is
prohibited without the prior permission of the World Employment Confederation. In any case, the source of the information to be published should be mentioned
as ©World Employment Confederation – Economic Report 2017.
Design inextremis.be - mp5478

www.wecglobal.org
@WECglobal
World Employment Confederation
New Reality of Work