Embed Size (px)
Citation preview
November 2017
Economic Research Working Paper No. 37
A missing link in the analysis of global value chains:cross-border flows of intangible assets, taxation andrelated measurement implications
Thomas S. NeubigSacha Wunsch-Vincent

A missing link in the analysis of global value chains: cross-border flows of intangible assets, taxation and related measurement implications Mr. Thomas Neubig* Mr. Sacha Wunsch-Vincent** Abstract The phenomenon of global fragmented production and associated trade in intermediate products, including intangible assets, has changed how economists study globalization and how new public policies are shaped. Understanding cross-border flows of disembodied knowledge, often associated with intellectual property (IP), is essential to analyzing how modern economies operate. Available data to document these international IP-related knowledge flows – namely cross-border payments for IP - are distorted by various factors. Tax planning by multinational enterprises has seriously distorted the measurement of cross-border IP flows, affected national measurement of imports, exports, GDP and productivity. The tax-induced mismeasurement could be more than 35% of global Charges for Use of Intellectual Property (CUIP), and greater for individual countries particularly high-tax-rate countries. International initiatives to address tax base erosion and profit shifting and other statistical initiatives on global value chains will improve future measurements of cross-border IP flows, improving the understanding of both the creation and uses of IP. Keywords: Global value chain, intellectual property, intangible assets, tax, base erosion, profit shifting, cross-border flows, charges for the use of intellectual property JEL classification: D23, E01, E22, F21, F23, H25, H26, L11, O3 Disclaimer The views expressed in this article are those of the authors and do not necessarily reflect the views of the World Intellectual Property Organization or its member states.
* Founding Member, Tax Sage Network, Washington D.C. and former OECD Deputy Head, Tax Policy and Statistics, [email protected] ** Senior Economist, Economics and Statistics Division, WIPO.

2 Acknowledgements The authors would like to thank the following for helpful comments and suggestions: Robert Cline, Tony Clayton, Carsten Fink, Raymond Mataloni Jr., and Dylan Rassier. A first draft of this study has been presented at a WIPO Workshop for the preparation of the ”World Intellectual Property Report 2017” in Geneva – March 16 and 17, 2017 and received valuable feedback from workshop participants.

3 Introduction The phenomenon of global fragmented production and associated trade in intermediate products, including intangible assets, has changed how economists study globalization and how new public policies are shaped. In this light, understanding cross-border flows of disembodied knowledge, often associated with intellectual property (IP), is essential to analyzing how modern economies operate. Sadly, available data to document these international IP-related knowledge flows – namely cross-border payments for IP - are distorted by various factors. Indeed, IP-related tax avoidance strategies have biased measures of trade, GDP and productivity. Economic work on the role of intangibles in GDP has for the last decade focused on the impact of intangible assets formation. Data sources and methods for translating metrics of activity on R&D, software, design, creative work, human capital formation and, to a less extent, business organization, are now understood and published in a consistent format for most major world economies.1 However, progress on developing similarly rigorous approaches for trade in intangible assets or in the payments for use of IP is much less well advanced. This is particularly true for international IP payments, which are affected by multinational enterprise tax planning. In order for national statistics to provide a realistic picture of the ‘knowledge economy’, they need to measure better both asset formation and their uses, including cross-border intangible flows. While these distortions have been known for some time, for a lack of alternative, the statistics on cross-border use or licensing of IP have been used frequently to study the cross-border trade in ideas. Yet, in more recent years the shifting of IP-related payments as a critical component of tax avoidance and other strategies of multinational firms have been discussed more prominently. The recent G20/OECD Base Erosion and Profit Shifting Project and the European Commission’s State Aid legal case against Apple Corporation in Ireland are testament to this renewed policy and regulatory interest. Against this background, the following questions are discussed in this paper: 1) the extent to which cross-border IP payment data refer to (i) the origin of IP creation and/versus (ii) the destination of IP commercialization; 2) how IP-related transfer pricing and other strategies impact trade data, including cross-border IP payments, and GDP data; 3) the mechanisms introducing distortions to cross-border IP payment data; 4) the general magnitude of the measurement problem, its growth over time, and effects on specific bilateral flows; and 5) measures that could be taken to restore the validity of these statistics. Bottom-line: Tax planning by multinational enterprises has seriously distorted the measurement of cross-border IP flows, affected national measurement of imports, exports, GDP and productivity. The tax-induced mismeasurement could be more than 35% of global Charges for Use of Intellectual Property (CUIP), and more for individual countries particularly high-tax-rate countries. International initiatives to address base erosion and profit shifting and other statistical initiatives on global value chains will improve future measurements. The paper is structured as follows. In section 1, the trend of increased cross-border trade in ideas is described; a related taxonomy is presented. The main data sources assessing these flows are portrayed in section 2. In section 3, the main distortions to these flows are assessed. Then, in more detail, in sections 4 and 5, the tax effects on cross border IP measures are described and the sources, magnitudes and trends in the tax distortions are presented. Finally, in section 6, the paper discusses some initial possible approaches to reducing mismeasurement distortions. These improvements then need to be integrated with work done on intangible asset formation to produce a version of national accounts, which accurately reflects value added and economic activity.
1 For an up-to-date summary, see “Capitalism without Capital” by Jonathan Haskell and Stian Westlake (2017).

4 The r i s e o f c r os s - bor de r t r a de i n I P Technology, business innovations, and falling trade costs have transformed the organization of global production. The unbundling of the production process and the geographical dispersion of different stages of production are the key elements of this transformation. Increasingly, multinational enterprises (MNEs) source input and technology from suppliers worldwide. This reflects a fragmentation of the production process in the manufacturing and services industries, with increases in task-based manufacturing, intermediate trade and the outsourcing of services. As a result, a greater number of countries participate in global production and innovation networks.2 Manufacturers exposed to these networks experience technological and organizational learning, possibly leading to industrial upgrading. The analytical and statistical efforts to better assess and understand “Global Value Chains” (GVCs) are growing rapidly. Excellent efforts are under way to assess the value-added of individual countries in the production of goods and services worldwide. Some of these new approaches are trade-related, such as the joint OECD/WTO Trade in Value-Added. Other well-known approaches use decomposition techniques with world input-output databases to trace the value-added in the production of final goods.3 It is now a common assumption that intangible assets in the form of technological knowledge, software, and other know-how are key in the analysis of increasingly fragmented production. Similar to the increased trade in intermediate products, a greater international exchange of knowledge – and thus disembodied rather than embodied technology flows - takes place. The causes and consequences of this cross-border trade in ideas are manifold: • As firms focus on their core competitive advantage, they purchase essential
technologies from third parties rather than developing themselves, also propelling the vertical disintegration of knowledge-based industries.4
• The increasing existence of “technology markets”, backed by (i) new business models such as IP-licensing, (ii) information technologies, (iii) more legal and practical experience with technology transactions, and (iv) increased IP protection worldwide allow for such technology transactions to increasingly take place.
• The operations of MNEs have led to more intra-company transfers of technology, also because of increased foreign direct investment.
• Factory-less production is on the rise in which firms outsource their manufacturing activities but control the underlying IP (including the brand name) and hence control the production and value chain outcome.
• The mix of productive assets in business has shifted decisively since 1990 to the point where a majority of capital investment in developed economies is in technology, software, design, creative works, brands, human capital and business organization. About half of these intangible investments are ‘owned’ via formal IP rights.5
In sum, these factors have spurred an increase in both inter-company and intra-company trade in disembodied know-how. Such knowledge is frequently subject to registered IP, such as patents and industrial designs, and unregistered IP, such as copyright and trade secrets.
2 WIPO (2011a). 3 Timmer et al (2014) 4 See Arora et al (2001) and WIPO (2011b) chapter 2. The licensing-in of key technologies occurs both within and across firms in high-income economies, but they are also playing a key role in explaining the growth of firms in fast-growing, low-income countries. 5 Estimates of business intangible investment for the United Kingdom and the role of IP rights are estimates in work commissioned by the UK IPO from Imperial College. https://www.gov.uk/government/publication/uk-intangible-investment-and-growth

5 Ensuring the accurate measurement of exports and imports of the trade in IP is essential.6 Yet, the measurement of GVCs, the one that is particularly relevant to the 2017 edition of the World IP Report, is subject to significant valuation and distortion issues. The types of market-based transactions of IP are manifold: the outright sale of originals, the temporary licensing of copies/technology, but also more complex arrangements such as cross-licensing deals, patent pools and joint R&D ventures or cost-sharing arrangements. Importantly for measurement purposes, these exchanges can take various formalized market-based transactions of which some entail explicit pecuniary transactions – including notional payments for intra-corporate IP transfers among headquarters and company affiliates - and others involve the sharing of technology without explicit payment from buyer to the seller (see table 1 for a taxonomy) . In all likelihood, some of the below transaction types involve self-declared estimates or are unrecorded in existing statistics, hence biasing estimates of trade in IP, mostly downward. First, the easiest to trace are formalized IP-based transactions, such as the licensing or purchase of IP between two parties, either across or within companies. Even transactions within MNEs, and thus between affiliates, or technology sharing agreements – such as cross-licensing arrangements - are supposed to leave a statistical trace. As explained in section 2, MNEs assign and report values associated to their internal IP flows, although the accuracy and consistency across countries of these values are at stake. The same holds true for mutual sharing agreements. It is known that a large share of the value of intangibles comes from cross-licensing of patent portfolios. The cross-licensing agreement involves no direct exchange of payment, if the value of each party’s relevant IP is considered to be the same.7 Still, while these transactions are non-pecuniary, they are supposedly declared with a notional value of the exchange.
6 OECD (2014). 7 Grindley et al (1997) describe these agreements as important in industries like electronics, semiconductors, aircraft, and automobiles. In these industries firms typically cross-license their entire related set of patents to each other.

6 Table 1: Taxonomy of formalized and informal technology transactions Formalized IP-based transactions or sharing agreements
Pecuniary and recorded
Market-based transactions with one buyer paying seller Transactions among headquarters and affiliates involving notional estimates of the transaction
Commercial licensing of a specific technology with contract and payment / Sale or purchase of a patented industrial process Intra-company transfers
Nonpecuniary but recorded
Mutual sharing of technology
Cross-licensing, patent pools
Informal technology sharing
Nonpecuniary and unrecorded
Non - Market-based use of third party technology with no associated payment IP infringement
Implicit, unwritten cross-licensing arrangements or covenants not to sue Consent decrees Unrecorded intra-company transfers Patent infringement or piracy
Finally, and coming to informal (non-pecuniary and unrecorded) IP transactions, it is well-known that a fair share of technology transfer is implicit and not formalized, leaving no specific contractual or financial trace. Specifically, technology firms are known to use each other’s patented technologies as part of more tacit and unwritten sharing agreements and without suing each other. Consent decrees, frequent in high-tech or copyright industries and emanating from the intersection of antitrust and IP law, also play a role in this respect; effectively forced technology-sharing agreements. 8 These implicit and unwritten cross-licensing agreements might have significant importance in sectors such as high-tech and information technology industry. They leave no statistical trace which could be used to infer the transfer of value or intangible assets between firms.9 This also results in an underestimation of actual flows. Obviously, this is also the case for unauthorized uses of intangible assets and proprietary rights. Practically speaking, the non-authorized use of registered IP, and thus the violation of IP rights (e.g. the infringement of patent rights, but also counterfeiting and piracy) are arguably a sizeable characteristic of the modern-day global economy. While unauthorised and unrecorded, this phenomenon might well play an important role in influencing GVCs’ behaviours. In sum, for the analysis of GVCs, it is important to recognize that only (i) pecuniary, market-based, authorized transactions, or (ii) self-declared, notionally valued IP transactions, are captured by official statistics. Even in these two cases, the proper valuation of licensing transactions is complex, leaving room for arbitrariness or misreporting reflecting tax or other considerations. The next section describes the available data to capture cross-border IP-based transactions which are formally agreed, and which leave an actual or notional financial trace.
8 A consent decree is an agreement or a settlement that resolve a dispute between two parties without admission of guilt. 9 Hören et al (2015) traces the history of this phenomenon in the semiconductor industry.

7 Av a i l a b l e da t a o n c r os s - bor de r I P - r e l a t e d f l ow s As set out in table 2, two official sources exist to trace cross-border IP flows, namely (i) international trade data that set out cross-border receipts and payments for the purchase or use of IP, and (ii) tax data. As regards the former, these international trades in services data are now commonly available through the balance of payment (BoP) statistics at the level of countries. They are reported at the global level by the BoP statistics collected by the International Monetary Fund (IMF) and available in the World Development Indicators (WDI) database, and at the level of the OECD – and a few non-OECD economies – as technology balance of payment data. In addition, a limited number of specific countries publish these data in a more fine-grained fashion – also capturing intra-company transfers - based on specific quarterly, annual or other surveys. The United States (US), in particular, has been publishing detailed intra- and inter-firm data on IP flows for some time (see section 2.1.3). Only a few national data sources allow for such a breakdown, namely Canada, Finland, Israel, Italy, Japan, Netherlands, Poland, Sweden and the US. Yet, even for these few high-income economies, not all of these data are detailed enough for the analysis of intra-corporate IP flows. Table 2: Two official sources to trace the cross-border payments for IP
Data type Data Source Periodicity Availability International
trade data Charges for the
use of IP, receipts10
IMF, BoP Annual
1962-2015
More than 140 countries
Technology balance of payments
OECD Main Science and Technology
Indicators
Annual
1985-2015
selection of OECD countries plus Argentina,
Romania, Russia, Singapore, South Africa
National data for charges on IP
US Bureau of Economic Analysis,
Survey of U.S. Multinational Enterprises 11
Quarterly, Annual and
Each five years
United States, and other select OECD economies
Contracts related to intellectual
property
Central Bank and the National
Industrial Property Institute (INPI)
Annual Brazil
Tax data Royalty data Tax administrations Various U.S., potentially other countries
Without doubt, the measurement of such IP transactions is an important component of improved measurement of intangibles in GVCs. Improving statistical collection of these direct, market based measures provide a means of estimating the stock of intangibles as well as tracing their flow between industries.12 Regularly these data are also used to estimate the so-called international technology transfer between countries, associated technology diffusion and absorption, and to grasp the relative technological prowess of nations.13 In this view, net exporters of IP assets display a surplus in their technology balance of payments whereas net importers of IP assets display a deficit.14 According to the OECD Handbook on Economic Globalisation Indicators, these data also measure the internationalisation of technology (OECD, 2005).
10 Prior to 2005 labeled as “payments and receipts for royalties and licensing fees”. Data on royalty and license fees have been collected for a long time, although pre-1996 many countries recorded these receipts and payments on the capital account of their BoP. 11 U.S. International Services Database, Detailed Statistics for Cross-Border Trade. 12 Robbins (2006 and 2009). 13 Kumar (1998). 14 FAPESP (2010).

8 2.1 International trade data and balance of payments
The most widely reported metric on disembodied technology trade relates to the international receipts and payments for the “authorized use of intangible assets and proprietary rights”.15 One advantage of these data is that they are published by most countries in a timely and regular (yearly or quarterly) manner.
2.1.1 IMF Balance of payments, charges for IP As part of their national BoP statistics compilation systems, countries report IP-related receipts and payments with other countries under the title “Royalties and license fees” (RLF), or in more advanced reporting systems as “Charges for the use of intellectual property” (see Box 1). Box 1: The item “Charges for the use of intellectual property n.i.e.” is defined as follows:
• Charges for the use of proprietary rights, such as patents, trademarks, copyrights, industrial processes and designs, trade secrets and franchises, where rights arise from research and development, as well as from marketing
• Charges for licenses to reproduce and/or distribute intellectual property embodied in produced originals or prototypes, such as copyrights on books and manuscripts, computer software, cinematographic works and sound recordings, and related rights, such as for the recording of live performances and for television, cable or satellite broadcast.16 Some main trends The associated data show that the rise of GVCs has coincided with increasing cross-border trade in ideas and IP across countries since the 1990s.17 Figure 1 depicts the growth of cross-border licensing trade in the world economy and also shows the acceleration of this trade since the 1990s in high-income countries and then as of the 2000s in upper-middle income countries mostly through Asian economies and in particular China. The growth occurs in both absolute and relative terms to overall trade. That said, the participating countries in this trade also increased significantly. In 1990, 62 countries reported making licensing payments but by 2015, this number had increased to more than 120 countries. In nominal terms, international RLF receipts increased from USD 3.5 billion in 1970 to approximately USD 700 billion in 2015. Over the period 1990-2015, RLF receipts and payments in the world economy grew at a fast rate – 10 percent per annum.18
15 The IMF defines RLF as including “international payments and receipts for the authorized use of intangible, non-produced, non-financial assets and proprietary rights ... and with the use, through licensing agreements, of produced originals or prototypes ...”. 16 IMF (2009) and UN et al (2011). 17 See Athreye et al (2010), WIPO (2011a), and IMF (2011). 18 Some of this increase may be driven by under-reporting in the pre-1990 period.
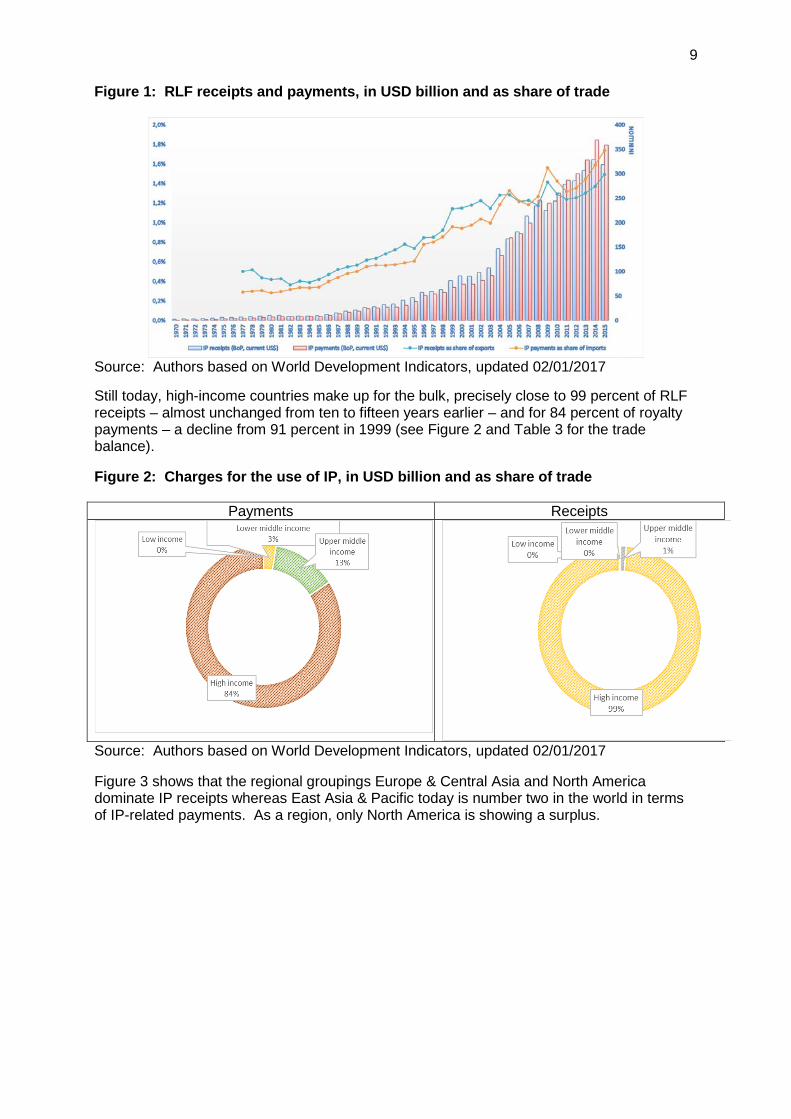
9 Figure 1: RLF receipts and payments, in USD billion and as share of trade
Source: Authors based on World Development Indicators, updated 02/01/2017 Still today, high-income countries make up for the bulk, precisely close to 99 percent of RLF receipts – almost unchanged from ten to fifteen years earlier – and for 84 percent of royalty payments – a decline from 91 percent in 1999 (see Figure 2 and Table 3 for the trade balance). Figure 2: Charges for the use of IP, in USD billion and as share of trade
Payments Receipts
Source: Authors based on World Development Indicators, updated 02/01/2017 Figure 3 shows that the regional groupings Europe & Central Asia and North America dominate IP receipts whereas East Asia & Pacific today is number two in the world in terms of IP-related payments. As a region, only North America is showing a surplus.

10 Figure 3: Charges for the use of IP, in USD billion
Source: Authors based on World Development Indicators, and www.mapsofworld.com (right). Table 3 shows royalty and license fee receipts and payments for the top countries in 2015. The U.S. has the largest amount of receipts (exports) followed by the Netherlands and Japan. Ireland has the largest amount of payments (imports) followed by the Netherlands and the U.S. The U.S. and Japan are the largest net exporters of IP services while Ireland and China are the largest net importers. Of particular note is the discrepancy between the US$358 billion of total payments and $318 billion of total receipts. A number of tax havens do not report RLF receipts, but there are other reasons for this discrepancy discussed below. Table 3: Royalty and license fee receipts and payments, 2015, in USD million
Largest countries by receipts or payments, sorted by receipts Receipts Payments Receipts
less payments
United States 124,665 39,495 85,170 Netherlands 39,081 47,096 -8,015
Japan 36,631 16,990 19,642 United Kingdom 17,541 12,427 5,115
Switzerland 16,178 12,932 3,246 France 14,974 13,962 1,012
Germany 14,585 8,917 5,668 Sweden 8,828 4,173 4,655
Ireland 7,457 75,114 -67,657
Korea, Rep. 6,199 9,831 -3,633 Canada 4,126 9,384 -5,258
Singapore 3,302 17,285 -13,983 China 1,085 22,022 -20,938
World 318,712 358,807 -40,095
Source: IMF Balance of Payments, World Development Indicators database

11 The improvement of underlying standards and methodologies In recent years, significant progress has been achieved to deliver more reliable data on cross-border technology payments (IMF 2009, UN et al, 2011). Steps have been taken to improve international accounting standards of national accounts and BoP to better record transactions of firms participating in global production (de Haan et al, 2014, and UN ECE, 2015). First, these steps include strengthening the harmonization of the System of National Accounts 2008 (SNA) (UN et al, 2008). As of then, the SNA recognizes five categories of IP assets: 1. R&D, 2. Mineral exploration and evaluation, 3. Computer software and databases, 4. Entertainment, literary and artistic originals, and 5. Other IP products (IPP).19 Second, the IMF Balance of Payments and International Investment Position Manual, in its fifth edition (BPM5) has helped harmonize some of the related norms since 1996. Prior to this harmonisation, there were different conventions on where this data were recorded, with some countries recording this data only in the capital account of the BoP. The BPM5 also provided a finer classification of trade in services in which IP transactions fall. Following publication of BPM5, the United Nations Interagency Task Force on Statistics of International Trade in Services recommended an extended breakdown of charges for the use of IP through the Manual on Statistics of International Trade in Services (MSITS) – see also Box 1.11 in WIPO (2013) for more detail.20 Third, in the sixth edition of the IMF’s Balance of Payments and International Investments Position Manual (BPM6), the item “Charges for the use of IP not included elsewhere” was introduced – replacing the notion of “RLF payments and receipts.” BPM6 has clearer definitions and the possibility to break out different IP-related transactions such as the licensing of software, franchising or the purchase of patented technology. See table 4.21 These data include more than just patents and technology-related payments. Rather, as evidenced by the RLF data, international trademark licensing and franchising, the purchase and sale of software; entertainment, literary and artistic originals such as musical and film recordings; and industrial processes and designs (including trade secrets), are included.
19 Each of the five categories of IPP can be broken down into the following IPP types: (i) The original IPP - whether produced on own account or sold (customized), (ii) Licences to reproduce the IPP, and (iii) Copies of the original which owners may use for more than a year. 20 These data are part of international trade in commercial services statistics, and usually derived from enterprise-based surveys in accordance with MSITS and the Extended Balance of Payments Services (EBOPS) classification. Following these recommendations, RLF, or the new charges for the use of IP should include license fees paid for the use of produced originals or outcomes of R&D and trademarks and franchises. Also, the methodology makes a difference between temporary right to use, outright sales, and full transfers of IP rights. Similarly, in previous recommendations, a sale of the IP asset was supposed to be under the capital account, i.e. as non-produced non-financial assets. In the new recommendations, the sale of other IP-based products should be included under the appropriate service that produces them, i.e. software originals should be shown separately under computer services; audio-visual (films, music) originals should be shown under audio-visual services. The only exception here is trademarks; their sale is not currently considered on a par with the sale of other IP rights, which are treated as produced assets. The sale of trademarks, therefore, is still treated under the capital account as a non-produced non-financial asset. 21 BPM6, table 10.4, “Treatment of Intellectual Properties,” p. 176.

12 Table 4: Switchover from BPM5 to BPM6
Source: UN et al (2011). The BPM6 change also separates stock/asset from flow/income concepts. The sales of the outcomes of R&D (patents and copyrights) are classified for SNA purposes as “Research and development services.” Transactions in the rights to use, distribute or reproduce outcomes of R&D (royalties and licenses) are classified as “Charge for the use of IP.” Some countries have not yet adopted and implemented this change in the BPM6. Under the old standard, “intangible assets” were classified under the capital account, but now as outright sales and purchases are treated as trade in R&D services, which enables the recommended measurement of R&D as domestic investment.22 Also, under the old standards, the item “intangible assets” (which was classed under the capital account) included – with no possibility of distinction between the items – both sales of patents and licences and other transactions (whose amounts were increasing over time) that were not strictly classifiable. In the new BPM6, sales of patents and licences deriving from R&D are kept distinct from other trade in “intangible assets” and are no longer entered in the capital account but under services, in the item “Research and development services”.
2.1.2 OECD’s technology balance of payments The OECD’s Technology Balance of Payments (TBP) follows the same methods as for the IMF BoP manuals; while often more recent and offering a wider range of details on the type of international technology and know-how transfers, it is mostly available only for OECD economies, and with varying degrees of granularity.23 Main trends In terms of receipts the US, Ireland and Germany rank first (Figure 4). In terms of relative importance, the main technology exporters as a percent of gross domestic product (GDP) are small economies such as Ireland, Luxembourg, the Netherlands, Sweden, and Switzerland. The magnitude of Ireland's surplus in technology receipts stands out. In the case of Ireland, it is known that the strong presence of foreign affiliates (particularly US and UK firms in the area of IT) and related intra-firm transactions play a role, potentially also affected by transfer pricing. In response to increasing efforts to reduce tax avoidance, some MNEs have chosen to relocate their intangible assets to countries with both favourable taxes for IP and actual R&D activity. Interestingly, during patent on-shoring, payments for IP (imports) increase significantly, whereas later royalty receipts ensue (IMF, 2016).
22 Fetzer, James J. et al, “BEA’s Initiative to Expand and Reconcile Trade in Services Statistics: New Detail for Improved Analysis,” mimeo, April 11, 2017 https://www.gtap.agecon.purdue.edu/resources/download/8436.pdf 23 OECD (1990).
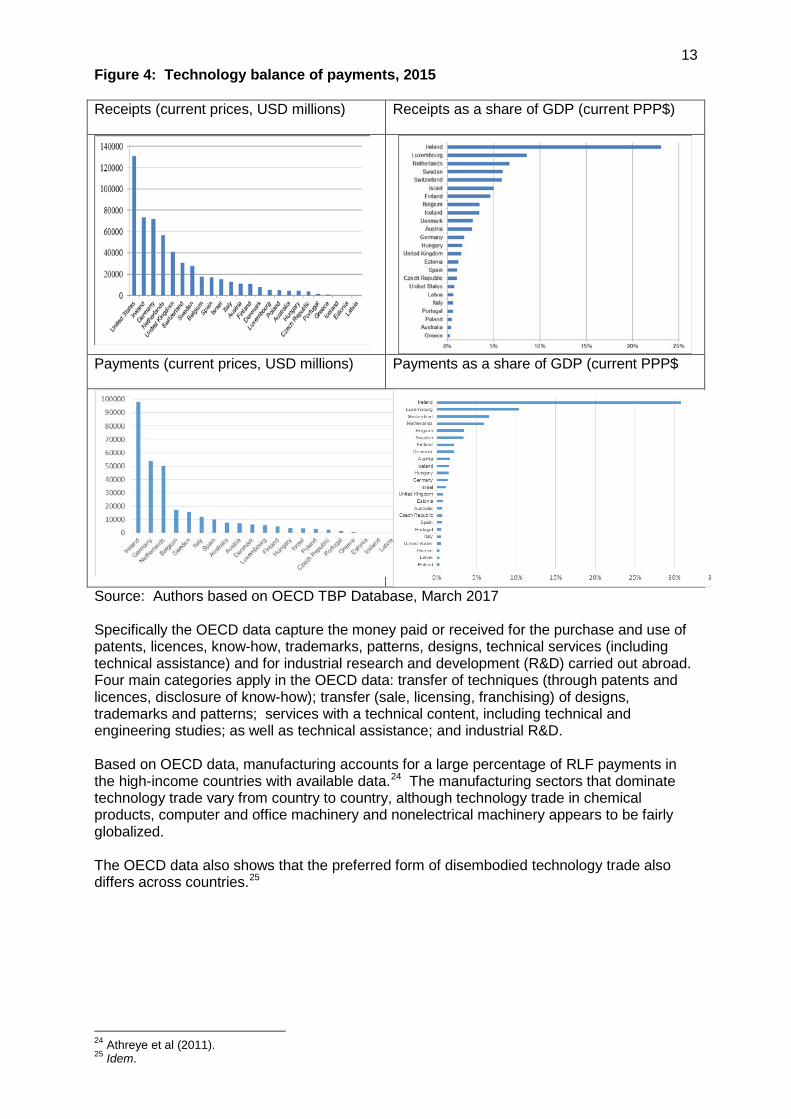
13 Figure 4: Technology balance of payments, 2015 Receipts (current prices, USD millions)
Receipts as a share of GDP (current PPP$)
Payments (current prices, USD millions)
Payments as a share of GDP (current PPP$
Source: Authors based on OECD TBP Database, March 2017 Specifically the OECD data capture the money paid or received for the purchase and use of patents, licences, know-how, trademarks, patterns, designs, technical services (including technical assistance) and for industrial research and development (R&D) carried out abroad. Four main categories apply in the OECD data: transfer of techniques (through patents and licences, disclosure of know-how); transfer (sale, licensing, franchising) of designs, trademarks and patterns; services with a technical content, including technical and engineering studies; as well as technical assistance; and industrial R&D. Based on OECD data, manufacturing accounts for a large percentage of RLF payments in the high-income countries with available data.24 The manufacturing sectors that dominate technology trade vary from country to country, although technology trade in chemical products, computer and office machinery and nonelectrical machinery appears to be fairly globalized. The OECD data also shows that the preferred form of disembodied technology trade also differs across countries.25
24 Athreye et al (2011). 25 Idem.

14 2.1.3 National enterprise-surveys: Example of US BEA data
The US Bureau of Economic Analysis (BEA) also follows the IMF guidelines but it is more detailed in its reporting structure. Importantly, its data is unique as it breaks out intra-company IP receipts and payments.26 Surveys of MNEs help identify these intra-firm transactions.27 Main trends The US receipts for IP have grown consistently over the last years and more recent quarters (see Figure 5), standing at about 5-6 percent of the total trade in services. Industrial processes, audio-visual services and computer software account for the vast majority of receipts. Figure 5: Charges for US receipts relating to IP, in USD million and in percent of services exports
Source: U.S. BEA Importantly for this study, the data for the US shows that the majority of IP payments and thus imports– slightly more than 70% of all recorded payments in 2015 - consist of intra-firm payments, down from 75 % in 2000. In terms of IP receipts, and thus exports, this is about 62% in 2015, about stable as compared to 2000. The percentage of affiliated trade in IP (imports) is highest for software and trademarks (81%), followed by industrial processes (77%), audio-visual products about 43%, and no data for franchising (Figure 6). The percentage of affiliated trade in IP (imports) is highest for industrial processes and trademarks at 72%, franchise fees at 71%, followed by software with 56%, Audio-visual and related products at about 45% (with books and movies at about 45% whereas the levels are much more modest in Broadcasting and recording of live events, with a mere 12% (latest available).
26 In 2010, the BEA redesigned its surveys of trade in services to collection transactions between affiliate and non-affiliated companies to have the same level of detail. 27 Lanz et al (2011).
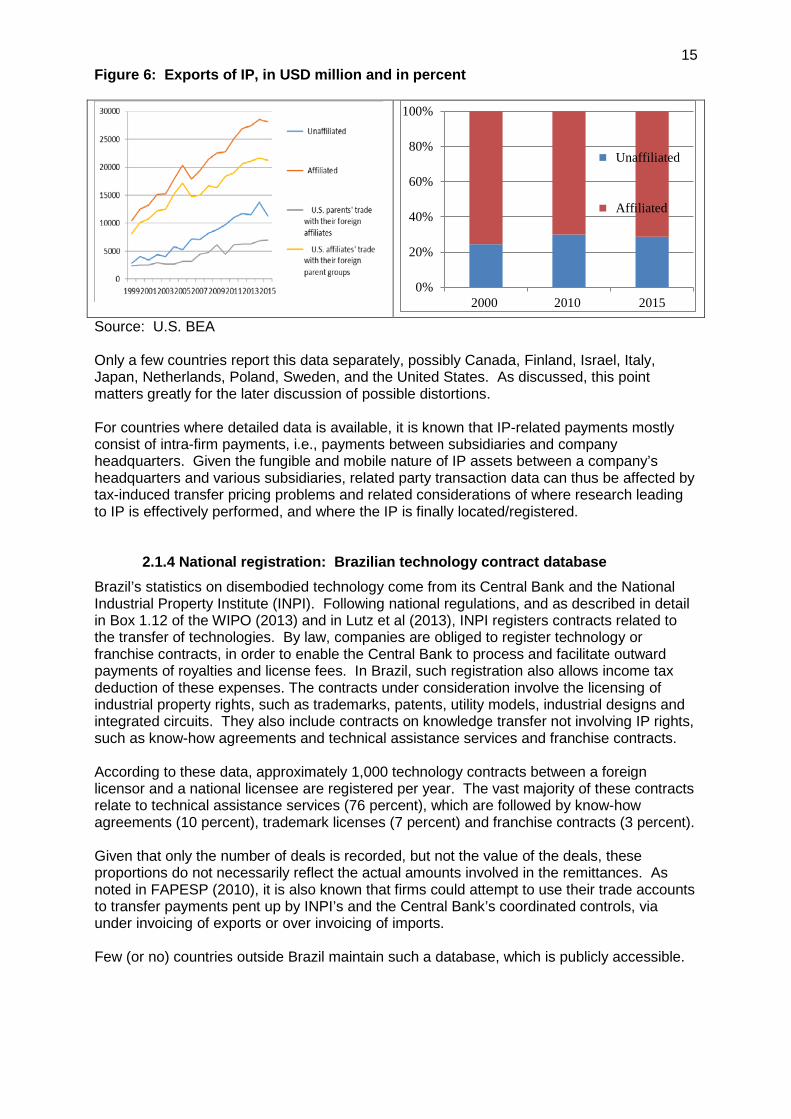
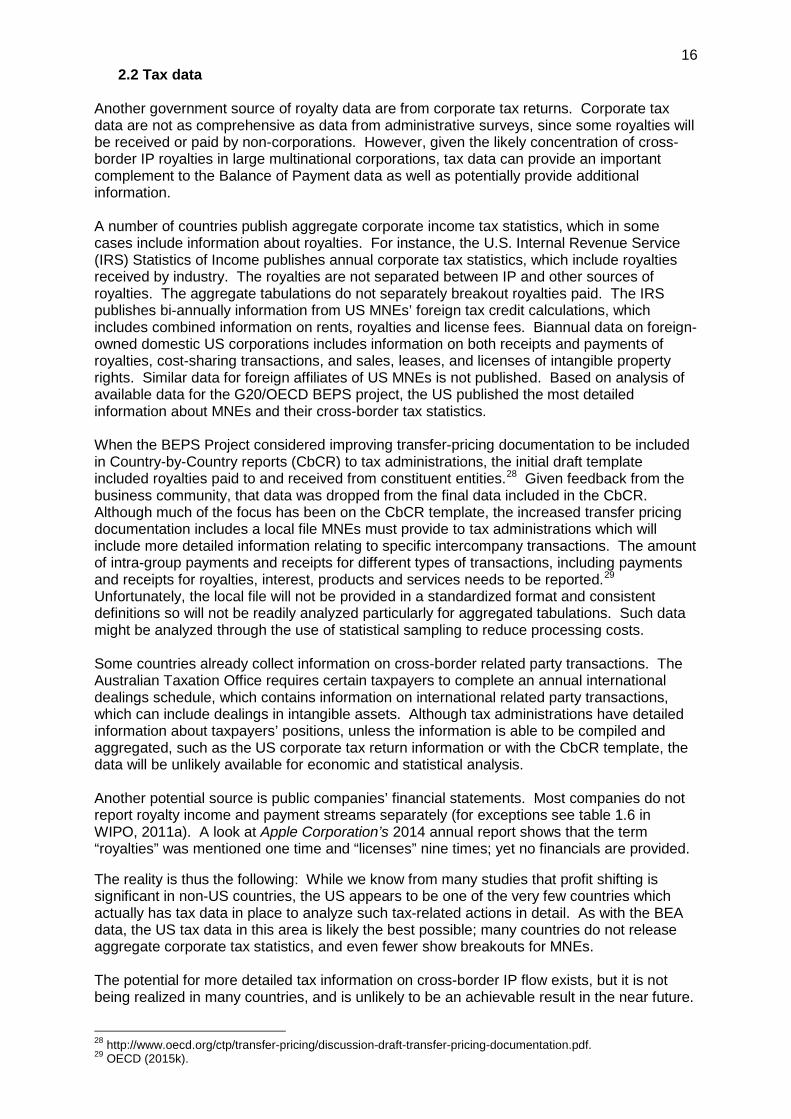
15 Figure 6: Exports of IP, in USD million and in percent
Source: U.S. BEA Only a few countries report this data separately, possibly Canada, Finland, Israel, Italy, Japan, Netherlands, Poland, Sweden, and the United States. As discussed, this point matters greatly for the later discussion of possible distortions. For countries where detailed data is available, it is known that IP-related payments mostly consist of intra-firm payments, i.e., payments between subsidiaries and company headquarters. Given the fungible and mobile nature of IP assets between a company’s headquarters and various subsidiaries, related party transaction data can thus be affected by tax-induced transfer pricing problems and related considerations of where research leading to IP is effectively performed, and where the IP is finally located/registered.
2.1.4 National registration: Brazilian technology contract database Brazil’s statistics on disembodied technology come from its Central Bank and the National Industrial Property Institute (INPI). Following national regulations, and as described in detail in Box 1.12 of the WIPO (2013) and in Lutz et al (2013), INPI registers contracts related to the transfer of technologies. By law, companies are obliged to register technology or franchise contracts, in order to enable the Central Bank to process and facilitate outward payments of royalties and license fees. In Brazil, such registration also allows income tax deduction of these expenses. The contracts under consideration involve the licensing of industrial property rights, such as trademarks, patents, utility models, industrial designs and integrated circuits. They also include contracts on knowledge transfer not involving IP rights, such as know-how agreements and technical assistance services and franchise contracts. According to these data, approximately 1,000 technology contracts between a foreign licensor and a national licensee are registered per year. The vast majority of these contracts relate to technical assistance services (76 percent), which are followed by know-how agreements (10 percent), trademark licenses (7 percent) and franchise contracts (3 percent). Given that only the number of deals is recorded, but not the value of the deals, these proportions do not necessarily reflect the actual amounts involved in the remittances. As noted in FAPESP (2010), it is also known that firms could attempt to use their trade accounts to transfer payments pent up by INPI’s and the Central Bank’s coordinated controls, via under invoicing of exports or over invoicing of imports. Few (or no) countries outside Brazil maintain such a database, which is publicly accessible.
0%
20%
40%
60%
80%
100%
2000 2010 2015
Unaffiliated
Affiliated
16 2.2 Tax data
Another government source of royalty data are from corporate tax returns. Corporate tax data are not as comprehensive as data from administrative surveys, since some royalties will be received or paid by non-corporations. However, given the likely concentration of cross-border IP royalties in large multinational corporations, tax data can provide an important complement to the Balance of Payment data as well as potentially provide additional information. A number of countries publish aggregate corporate income tax statistics, which in some cases include information about royalties. For instance, the U.S. Internal Revenue Service (IRS) Statistics of Income publishes annual corporate tax statistics, which include royalties received by industry. The royalties are not separated between IP and other sources of royalties. The aggregate tabulations do not separately breakout royalties paid. The IRS publishes bi-annually information from US MNEs’ foreign tax credit calculations, which includes combined information on rents, royalties and license fees. Biannual data on foreign-owned domestic US corporations includes information on both receipts and payments of royalties, cost-sharing transactions, and sales, leases, and licenses of intangible property rights. Similar data for foreign affiliates of US MNEs is not published. Based on analysis of available data for the G20/OECD BEPS project, the US published the most detailed information about MNEs and their cross-border tax statistics. When the BEPS Project considered improving transfer-pricing documentation to be included in Country-by-Country reports (CbCR) to tax administrations, the initial draft template included royalties paid to and received from constituent entities.28 Given feedback from the business community, that data was dropped from the final data included in the CbCR. Although much of the focus has been on the CbCR template, the increased transfer pricing documentation includes a local file MNEs must provide to tax administrations which will include more detailed information relating to specific intercompany transactions. The amount of intra-group payments and receipts for different types of transactions, including payments and receipts for royalties, interest, products and services needs to be reported.29 Unfortunately, the local file will not be provided in a standardized format and consistent definitions so will not be readily analyzed particularly for aggregated tabulations. Such data might be analyzed through the use of statistical sampling to reduce processing costs. Some countries already collect information on cross-border related party transactions. The Australian Taxation Office requires certain taxpayers to complete an annual international dealings schedule, which contains information on international related party transactions, which can include dealings in intangible assets. Although tax administrations have detailed information about taxpayers’ positions, unless the information is able to be compiled and aggregated, such as the US corporate tax return information or with the CbCR template, the data will be unlikely available for economic and statistical analysis. Another potential source is public companies’ financial statements. Most companies do not report royalty income and payment streams separately (for exceptions see table 1.6 in WIPO, 2011a). A look at Apple Corporation’s 2014 annual report shows that the term “royalties” was mentioned one time and “licenses” nine times; yet no financials are provided. The reality is thus the following: While we know from many studies that profit shifting is significant in non-US countries, the US appears to be one of the very few countries which actually has tax data in place to analyze such tax-related actions in detail. As with the BEA data, the US tax data in this area is likely the best possible; many countries do not release aggregate corporate tax statistics, and even fewer show breakouts for MNEs. The potential for more detailed tax information on cross-border IP flow exists, but it is not being realized in many countries, and is unlikely to be an achievable result in the near future.
28 http://www.oecd.org/ctp/transfer-pricing/discussion-draft-transfer-pricing-documentation.pdf. 29 OECD (2015k).

17 Ke y d i s t o r t i ons With the increasing importance of IP to global economic growth and development, the statistical measures of cross-border IP flows is more important than ever. Policymakers need the best measures of national economic activity (GDP), trade (exports and imports), and productivity. Particularly as they relate to nations’ development and commercialization of IP, the statistical measures are unfortunately distorted by a number of factors.30 In many cases, measures of cross-border IP flows are understated, appearing smaller than they actually are. In other cases, the IP flows are overstated in some countries while understated in others. This section identifies some of the key distortions, which merit further attention in the development of improved national statistics.
3.1 Incomplete reporting Global flows of IP, measured in the Balance of Payments as charges for the use of intellectual property (CUIP), not included elsewhere, total US$319 billion receipts and US$359 billion payments in 2015 (see table 3). The USD 40 billion discrepancy between total receipts and payments indicates a statistical problem. Many countries do not report CUIP receipts and/or payments, thus contributing to an undercount. Countries, such as the Bahamas, Bermuda and the Cayman Islands, which are home to many MNE affiliates with IP holding structures, have not reported royalty receipts. Some of the other under-reporting distortions include: - Incomplete surveying: Frequently, only firms with R&D activities are surveyed for their
royalty receipts and payments, whereas other companies might also license in technology, hence leading to an underestimation (OECD, 2005).31
- Difficulty of separating disembodied from embodied technology flows: As described in OECD (2005), intangible IP flows often take place in conjunction or in addition with high-technology exports or imports or direct investments. While they ought to be reported as technology payments or receipts, in principal, in reality they are often difficult to identify separately from a firm’s other transactions.
- Payment for intangibles via channels other than technology payments: If payment is made through channels other than technology payments, e.g. payments in the form of profits, dividends or overcharging for capital goods, then the payments for intangibles are not recorded appropriately (OECD, 2005).
- Disaggregation: International transfer of IP ‘bundles” which generate know economic value can often be assessed as individual rights which on their own have lesser total value. The individual rights can be reassembled at their destination.
- Tacit and non-pecuniary IP flows, and, of course, straight-out infringements of IP rights of third parties, which are unauthorized, result in under counting of cross-border IP flows.
30 Some of the most important distortions were initially reported in Madeuf (1984) and OECD (1995). 31 In some countries, surveys concerning the TBP are combined with R&D surveys (same sample). So the collected data could be underestimated, especially as far as payments are concerned, since firms without any R&D of their own which import technology from abroad are not taken into account.

18 3.2 Non-valuation measurement issues
Individual countries’ national statistics could reflect IP activity that could exaggerate the amount of real economic activity occurring in some countries, while understating it in other countries. Three types of issues are described below. First, Special Purpose Entities (SPE) that are often used for IP or financial holding companies can increase measured inflows and outflows, as a result of serving as an intermediary or flow-through.32 In the case of IP holding companies, total imports and exports of IP could be large relative to little or no economic activity in the country. Efforts to measure the net as well as gross flows are underway in the case of SPEs. Second, characterization of cross-border IP flows can affect measured CUIP. While imports and exports of CUIP should net, if there is transformation in the character of the payments, such as from royalties to dividends, on one side of the transaction, then the relative IP position of countries would be distorted. This is likely to happen in the case of SPEs. Many countries have “territorial” tax systems where dividends from affiliates in other countries are not taxed, while royalty payments are taxed. In some countries withholding tax rates are different for dividend and royalty payments. These tax differences can result in tax planning that affect the classification of payments as royalties.33 Third, profits from IP associated with contract manufacturing undertaken in other countries can increase the exports from the country of the contractor. An increase in the number of US MNEs moving their headquarters and IP to Ireland resulted in a significant increase in measured Irish GDP since the value added from the IP is treated as from Ireland while most of the economic activity was done through contract manufacturing outside of Ireland.34 The origin and source of profits and ease with which firms can relocate these according to their organizational capability – e.g. how they manage their global supply chains and the market structure – matters greatly in this respect. Fourth, combining the provision of services (annual flows) with the acquisition of capital investments (stocks) can provide a misleading picture of a country’s IP capabilities. Annual flows result from the accumulation of investment capital, which is different than increments of the outstanding stock of IP capital. As a result of the BEPS Project, some companies are moving their IP from tax havens to countries such as Ireland where actual research and development is occurring. As in the case of Ireland (IMF, 2016), the strategic transfer of IP portfolios from headquarters and between subsidiaries can show as large IP-related payments/imports from the recipient country. Acquisitions of IP by an Irish subsidiary from a tax haven subsidiary, setting transfer mispricing aside, increases CUIP payments from Ireland. The inflow of purchased IP capital into Ireland explains part of the large net deficit in CUIP in Ireland, as shown in table 3.35 The U.S. has not yet implemented the BPM6 changes separating transactions in the sale versus the rights to use or distribute the outcomes of R&D, so CUIP receipts and payments commingle stocks and flows.36 Distinguishing between types of IP flows (capital vs. provision of services, intra-firm vs. extra-firm trade) would provide additional insights in the IP capabilities of countries. Most countries do not report the same level of disaggregation in the BoP data, neither the forms of IP flows, nor the form of intra-firm versus extra-firm trade. The four categories of transactions involved in technology transfers are not defined in the same way in all countries.
32 Rassier (2015). 33 Another important issue of characterization is what is measured in CUIP not included elsewhere. Significant IP is allocated to other categories of trade in services, such as R&D services. 34 Irish Central Statistical Office (2017). 35 CUIP is affected by purchases/sales of IP between related affiliates. Relocations of entire balance sheets including intellectual property are added to a country’s balance sheet, without affecting imports and investment metrics. Ibid. 36 Fetzer et al (2017).

19 Unfortunately, the level of detail that is, at present, typically collected on international transactions in IPPs is less than ideal for the purposes described in the relevant manuals (UN ECE, 2015; OECD, 2010). If properly implemented by countries, the new MSITS (2010), and corresponding EBOPS, will improve the situation.
3.3 Valuation and other tax issues One of the important IP measurement issues results from multinational enterprises’ tax planning and organizational structures. IP often plays a critical role in this planning. Favourable government policies, including lower tax rates for certain tax IP income, so-called “patent boxes”, increase the likelihood of tax-induced investment and potential profit shifting. The amount and valuation of cross-border IP flows is affected by countries’ tax rules. Illegally evading taxes often results in undercounting of the related economic activity. Differential tax treatment of royalties and dividend payments may result in changing the character of payments to reduce taxes. More important are the distortions from the mispricing of transactions between related parties to reduce a MNE’s global tax liability. Due to reliance on contractual and legal concepts rather than economic substance, many MNEs were able to legally use transfer prices to shift profits from entities in high-tax-rate countries to related entities in low-tax-rate countries. The total pre-tax profit of the consolidated entity was the same, but its global tax liability was reduced. The corporate profits of low-tax-rate countries were increased while the corporate profits of high-tax-rate countries were reduced. Similarly export prices were increased and import prices were reduced for low-tax-rate countries, and vice versa for high-tax-rate countries. Likewise, GDP was artificially higher, relative to the actual economic activity, in low-tax-rate countries while GDP was artificially reduced in high-tax-rate countries. These tax distortions in both valuation and quantity are described more fully in the next two sections, and summarized in Box 2.

20
21 Ta x e f f e c t s on c r os s - b or de r I P m e a s ur e s National statistics on cross-border IP measures are affected by countries’ tax policies. Lower effective tax rates on IP investments can attract additional real investment in research and development. Low tax rates can encourage more registrations of patents in countries. Low marginal tax rates can encourage multinational enterprises to shift taxable income and reported financial profit from higher-tax-rate countries to lower-tax-rate countries. These tax effects, particularly base erosion and profit shifting effects, can distort the measurement of cross-border intellectual property receipts, payments and assets.
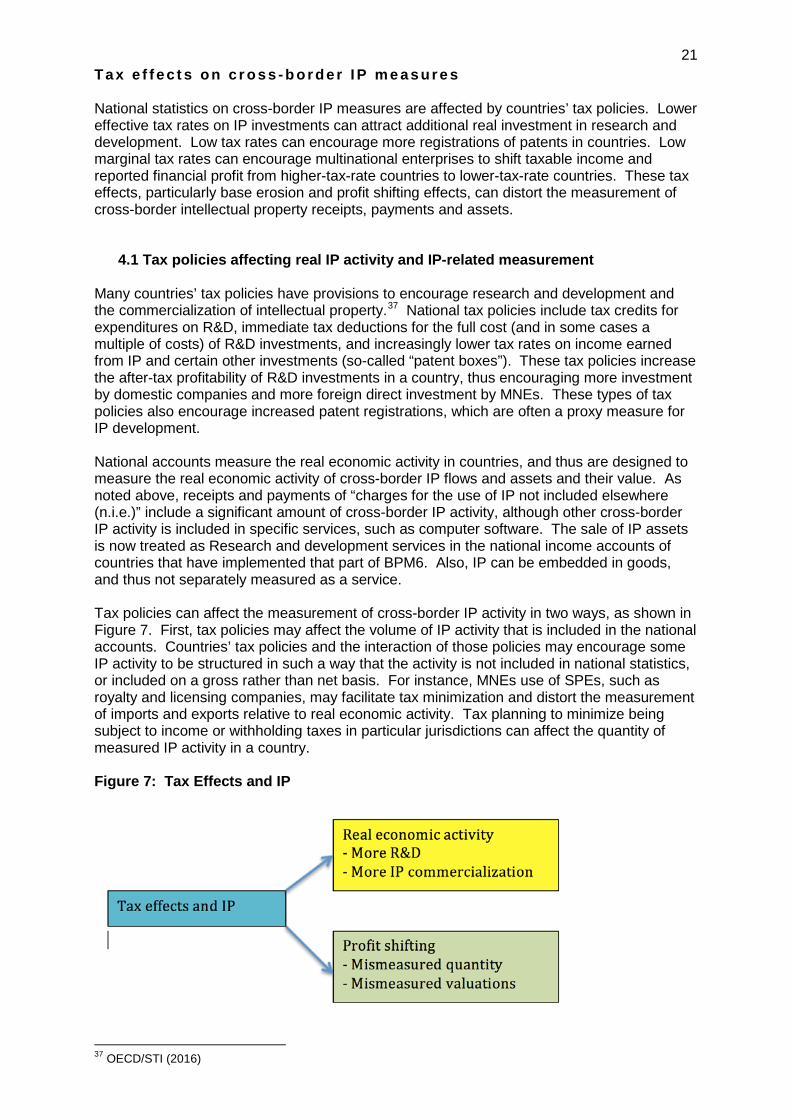
4.1 Tax policies affecting real IP activity and IP-related measurement Many countries’ tax policies have provisions to encourage research and development and the commercialization of intellectual property.37 National tax policies include tax credits for expenditures on R&D, immediate tax deductions for the full cost (and in some cases a multiple of costs) of R&D investments, and increasingly lower tax rates on income earned from IP and certain other investments (so-called “patent boxes”). These tax policies increase the after-tax profitability of R&D investments in a country, thus encouraging more investment by domestic companies and more foreign direct investment by MNEs. These types of tax policies also encourage increased patent registrations, which are often a proxy measure for IP development. National accounts measure the real economic activity in countries, and thus are designed to measure the real economic activity of cross-border IP flows and assets and their value. As noted above, receipts and payments of “charges for the use of IP not included elsewhere (n.i.e.)” include a significant amount of cross-border IP activity, although other cross-border IP activity is included in specific services, such as computer software. The sale of IP assets is now treated as Research and development services in the national income accounts of countries that have implemented that part of BPM6. Also, IP can be embedded in goods, and thus not separately measured as a service. Tax policies can affect the measurement of cross-border IP activity in two ways, as shown in Figure 7. First, tax policies may affect the volume of IP activity that is included in the national accounts. Countries’ tax policies and the interaction of those policies may encourage some IP activity to be structured in such a way that the activity is not included in national statistics, or included on a gross rather than net basis. For instance, MNEs use of SPEs, such as royalty and licensing companies, may facilitate tax minimization and distort the measurement of imports and exports relative to real economic activity. Tax planning to minimize being subject to income or withholding taxes in particular jurisdictions can affect the quantity of measured IP activity in a country. Figure 7: Tax Effects and IP
37 OECD/STI (2016)

22 Second, tax planning results in cross-border activity being inappropriately valued to minimize MNEs’ overall tax liability. Related party transactions are to be valued at market prices for both national statistics and tax accounting, but since the price of transactions between related parties under common control are not arms’-length, the “transfer prices” must be imputed or estimated. Given significant differences in marginal tax rates between countries, MNEs can minimize their total tax liability if net reported income is shifted from high tax rate countries to low tax rate countries by transfer mis-pricing between cross-border affiliated companies. Aligning transfer-pricing outcomes with the location of actual value creation is very complex with the potential for manipulation as well as conceptual and measurement disagreements between MNEs and tax administrations, and between tax administrations in different countries. Fortunately, some progress is made as part of the G20/OECD Base Erosion and Profit Shifting (BEPS) initiative to better align the location of reported income and the location of actual value creation, as described in more detail below.
4.2 General tax factors that distort the measurement of cross-border IP activity This section describes tax factors that can distort the measurement of cross-border IP activity. Before describing specific tax factors, it may be helpful to describe at a high-level the relationship between national statistics, financial accounting statistics and tax statistics. National statistics for cross-border IP flows are generally derived from surveys of businesses and other administrative records. The value of IP flows and assets are based on the reported values by the businesses. The BoP statistics manual generally discourages imputations or deviations from the reported values, but notes that in the case of MNEs creating “notional units” and assigning values may be necessary to measure economic activity for national accounts. Thus, although national statistics are generally based on the reported financial values for businesses, measurement of cross-border activity by MNEs may be a necessary deviation, although raising concerns about accuracy and consistency across countries.38 Few, if any, national statistical offices make such imputations for MNE transfer mispricing. Corporate taxable income measures generally start from companies’ financial statements, based on national generally accepted accounting principles (GAAP), although there can be significant “book-tax” differences for certain items, such as accelerated tax depreciation and the tax treatment of stock options.39 In the case of cross-border flows, both financial accounting and tax accounting look to an arms’-length standard for measuring prices between related companies under common control.40 Intercompany pricing within a group is eliminated as part of a consolidated group financial statement, but is necessary for unconsolidated company financial statements, which are often necessary for national regulatory and tax purposes. The arms’-length standard requires companies to value a related party transaction similar to the value of a comparable transaction with an unrelated third-party company. The value assigned to cross-border transactions of related parties is referred to as a “transfer price”; it is not an observed market price, but rather has to be determined based on comparable transactions or based on a valuation methodology. The cross-border transfer price between related parties can have significant tax consequences, if the two jurisdictions’ marginal tax rates differ. These tax differences can often be much greater than non-tax operational issues affecting the transfer pricing between related entities. Thus, transfer prices determined for tax purposes are generally used for financial statements.41 If tax transfer prices are not used for financial statements, then there would be a strong presumption that the tax transfer price was inappropriate. Therefore, tax transfer pricing is
38 United Nations Economic Commission for Europe (UNECE), 2015. 39 Spengel et al (2012), Hanlon et al (2010). 40 Halligan (2015). 41 Klassen et al (2017) find 16% of a small sample of US MNEs “decouple” their tax transfer prices from internal prices used to assess financial performance. Decoupling is highly predictive of MNEs that choose to minimize cash taxes paid in their transfer pricing strategies rather than avoiding disputes with tax administrations.
23 likely to be included in macroeconomic statistics. In the case of the sale of goods between related parties, customs valuations are used which also rely on transfer pricing. Although customs valuations are typically based on market values, customs valuations can differ from income tax transfer prices.42 Tax structuring of business operations and legal entities often affect MNEs’ financial accounts. If a MNE does not have a sufficient tax presence in a country (i.e. “permanent establishment”), then the MNE is unlikely to have a pro forma financial statement for a hypothetical entity operating in the country. If a MNE sets up a SPE that is often a tax intermediary in a country, there may be significant financial activity without economic activity. In the national accounting of cross-border activity, the difference between economic ownership and legal ownership has become more important. Economic ownership better measures the economic activity of MNEs in different countries. In the past, many MNEs used legal contractual language for ownership for international transfer pricing purposes. After the G20/OECD BEPS Project, economic substance is now more important rather than legal contracts. Legal contracts may be a useful starting point in an analysis of income allocation, but the underlying economic contributions of assets, functions and risks are the determinants of where income is created, and for appropriate transfer pricing. Contractually assuming a risk is not sufficient if the enterprise does not exercise control over that risk nor has the financial capacity to assume the risk. Similarly, actual control of performance of outsourced functions, such as the development, enhancement, maintenance, protection and exploitation of the intangible, is necessary.43 Income for tax purposes has generally been assigned to countries based on the source of the income, where the value is created and the production occurs. However, some economists have argued that income should be taxed where the consumer is located since it is less likely to be manipulated or to cause economic distortions in the location of production. Proposals for a destination-based cash-flow tax, formulary apportionment based on sales, or assignment of business income to the residence of the owners have been suggested as replacements for the current corporate income taxes.44 These proposals would often eliminate the need for transfer pricing for tax purposes within MNEs, but could make measurement of MNEs’ activity in countries more difficult, requiring separate national account notional units and imputations of income, which currently are needed for tax liability determinations.
4.3 Specific tax factors affecting IP measurement Several specific tax factors can distort national statistics from IP. The most well-known, and possibly the most important, factor is transfer mis-pricing. Transfer mis-pricing is where non-arms’-length valuations are used for related party transactions. This can distort national statistics toward higher valuations in low tax rate countries and lower valuations in high tax rate countries. Several other potential distortions can result from the quantity of activity being mismeasured, even if the prices used are market prices. Structuring of business operations, entities and transactions may result in less measured economic activities in certain countries. In some cases, the structuring may facilitate transfer mis-pricing, but may result from tax minimizing strategies to avoid income tax in a jurisdiction, minimize withholding taxes, or simply take advantage of lower tax rates. There has been less focus on the extent of mismeasurement due to quantity issues.45
42 Blouin et al (2016). 43 OECD, BEPS Actions 8-10: 2015 Final Reports, p. 63-4. 44 Auerbach et al (2016), Viard et al (2015), Avi-Yonah et al (2013). 45 Rassier et al (2015).

24 4.3.1 Non-arms’ length pricing between related companies
As noted earlier, transfer prices between related entities in a MNE under common control are necessary to measure the amount of economic activity in a country as well as the income from that economic activity in a country. National income statistics generally rely on self-reported financial accounts, which are in most instances based on transfer prices determined for tax purposes. Although financial accounts for unconsolidated entities of a MNE require transfer prices, it is unlikely that the transfer prices for financial accounts would differ significantly from those used for tax or customs purposes. If companies use two different transfer prices, they would likely be subject to greater scrutiny by the tax authorities. Countries use the arms’ length principle as the basis for their transfer pricing rules. The arms’ length principle is incorporated in bi-lateral and multilateral treaties and is part of the OECD and UN Model Tax Conventions. Most countries follow the interpretation published in the OECD’s Transfer Pricing Guidelines for Multinational Enterprises and Tax Administrations. A report was first published in 1979, revised and published as Guidelines in 1995, and updated in 2010. The BEPS Project amended the guidelines for countries that formally subscribe to the guidelines based on an agreement of the 44 countries participating in the project and representing 90 percent of the world’s economies.46 The arms’-length principle requires that transactions between related entities be priced as if the entities were independent, operating at arms’ length and engaging in comparable transactions under similar conditions and economic circumstances. Where the chosen transactions with third-party information (“comparables”) are not sufficiently similar, adjustments are appropriate for tax purposes. The arms’ length principle, while less than perfect in practice, has been a practical approach for both tax administrations and taxpayers to measure taxable income and minimize double taxation. However, the application of the existing guidance with its prior perceived emphasis on contractual allocations of functions, assets and risks, has been subject to manipulation to lower MNEs’ tax liabilities. Application of the guidance based on contractual terms was leading to outcomes not corresponding to the value created through the economic activity of the various entities of a MNE group. Figure 8: Example of IP development and use with tax intermediary
Figure 8 shows how the insertion of a related entity in a low-tax-rate country with minimal functions and tax transfer pricing based on legal ownership could shift profits from both the source jurisdiction of the IP and the use jurisdiction of the IP in higher tax rate countries. If the purchase price or royalties for the IP are understated, then profit can be shifted from Company A to related Company B in the low-tax-rate country. If the transfer pricing for the use of the IP is overstated, then profit can be shifted from Company C to related Company B in the low-tax-rate country.47
46 OECD BEPS Action 8-10 report (2015), OECD BEPS Explanatory Statement (2015). 47 This is the type of situation cited in the European Commission’s State Aid investigation of Ireland and Apple Corporation. At http://europa.eu/rapid/press-release_IP-16-2923_en.htm.

25 Some additional illustrations of MNE tax structuring involving IP to potentially lower total taxes are shown in Annex 1, based on European Commission State Aid investigations. It is important to note that while the three examples are based on U.S. MNE’s, the EC is investigating a number of non-US MNEs. In addition, empirical studies described in Section 5 find significant profit shifting using IP and other techniques by non-US MNEs and affecting all countries, including low-income countries. The focus of the revised OECD transfer pricing guidance specifically addresses transactions involving intangible assets including IP, the appropriate allocation of risk, and the appropriate levels of returns to funding intangible developments. The future rules will better align the location of taxable profits with the location of economic activities that generate them, but will depend on their implementation by national governments, the effect on multinational operations, and the procedures to resolve transfer-pricing disputes between taxpayers and governments. Thus, the distortions in the national accounts from transfer mis-pricing should be reduced in the future, but the extent of the reduction will be dependent upon specific outcomes and unintended consequences. Meanwhile, transfer mis-pricing distorted national accounts in the past, and most likely to varying degrees by country and across time. One example of transfer mis-pricing is the case of so-called “cash boxes,“ as illustrated in box 3. This is where a capital-rich MNE group member gets assigned a return for funding the economic activity undertaken by another group member. Thus, extremely large profits have been assigned to subsidiaries with a minimal number of employees with minimal skills because contractually they earned a high return for owning the IP and funding the R&D activity of another related entity. In the case of “cash-box” entities, the parents often made equity contributions that were used to fund the R&D; in some cases, the subsidiary funding was for R&D performed by the parent. Reliance on legal constructs rather than the economic substance of assets, functions and risk, and the application of inappropriate methodologies, can result in significant misalignment of profits and mismeasurement of where the value is created, as shown in the example below. Similar to the cash-box example, some MNEs have selected comparables for various functions of their related entities, leaving a large residual for the legal owner of the intangible, even if the legal owner provided little contribution to the economic activity. Such an approach is not allowed under the revised OECD transfer pricing guidelines. Intangibles often involve cost contribution arrangements (CCAs) between related parties that share the contributions and risks of joint development, production or obtaining of intangibles. If the contributions to and benefits of the CCA are not valued appropriately, profits can be shifted away from the location where the value was created and actual economic activities performed. The contractual terms of a CCA do not necessarily reflect economic reality. For example, contributions to a CCA should not be measured at cost if it is an unreasonable basis for determining the relative contributions of the participants. An inappropriately low basis reduces the earnings of the contributor of existing intangibles, typically an entity in a high-tax-rate jurisdiction, leading to a non-arms’ length result.

26 Box 3: Cash-box” transfer mis-pricing example A multinational group decides to develop an intangible anticipated to be highly profitable based on Subsidiary B’s existing intangibles, its experienced R&D staff and its track record. Under the development agreement, Subsidiary A funds development costs of $100 million annually for the first five years and becomes the legal owner of the intangible, while Subsidiary B performs and controls all activities related to the development, enhancement, maintenance, protection and exploitation of the intangible. The intangible is anticipated to earn $550 million in profit for the next ten years (years 6 to 15). Subsidiary B licenses the intangible from Subsidiary A and makes contingents payments annually to Subsidiary A for the right to use the intangible, based on returns of purportedly comparable licenses, leaving Subsidiary B with an anticipated return of $200 million annually from selling products based on the intangible. Thus, under the prior transfer pricing approach, Subsidiary A earned $350 million annually, while Subsidiary B earned $200 million annually, as shown in table 5. Table 5 Income allocation involving “cash-box”: transfer mispricing and appropriate arms’ length (ALS) methodology
Under the new transfer pricing guidance, the assets, risks and functions of Subsidiary A would be examined, and due to its role limited to pure funding, its anticipated remuneration would only be a risk-adjusted rate of return on its funding commitment. If based on comparables, this risk-adjusted return might realistically be 11 percent, and then Subsidiary A’s return would be $110 million annually, while Subsidiary B’s return would be $440 million annually. Based on a detailed functional analysis and application of the correct method, the returns to Subsidiary A, likely located in a low tax rate country, would be reduced by more than two-thirds while the returns of Subsidiary B, likely in a higher tax rate country would be more than doubled.
Transfers of intangibles between related parties can shift future income to low tax jurisdictions if the transfer price is not set correctly. In Google’s Double Dutch Irish Sandwich transaction48, the R&D was performed in the U.S., and then was transferred to a Bermuda subsidiary without triggering much, if any, taxable gain in the U.S. since the valuation of the IP was low at an early stage in development. The subsequent developments proved that the IP was highly profitable. With unique hard-to-value intangibles, information asymmetries between taxpayers and tax administrations make it difficult to administer appropriate valuations. With detailed knowledge of an intangible’s development and commercial possibilities, taxpayers can better foresee future potential value of the IP exploitation than tax administrations at the time of the transfer; yet not incorporate fully their internal forecasts in the transfer price. The revised OECD guidelines provide that ex post results can provide presumptive evidence of uncertainties at the time of the transaction, but the question is whether the information used ex ante took into account reasonably foreseeable developments and events and the reliability of the ex ante information.49 The source of the distortions from transfer mis-pricing is due not to the concept of arms’ length pricing, but to its application in practice. Prior reliance on legal contracts was often
48 See description and graphic in the next section. 49 BEPS Action 8-10 report, p. 109-112.
Transfer Appropriate mis-pricing ALS methodology
Subsidiary A: Low tax rate country, cash-box funder $350 $110 Subsidiary B: High tax rate country, R&D & commercialization $200 $440 Source: OECD/G20 BEPS Action Report 8-10, Example 6, p. 119-120.
27 not a realistic portrayal of the economic contributions of the related parties to the contract. Taxpayers had incentives to use the Transfer Pricing Guidelines in legal, but narrow, ways that could shift profits from high tax rate countries to low tax rate countries. The “facts and circumstances” nature of a detailed functional analysis of individual complicated transactions between related parties means that reasonable economists and tax professionals can disagree on the underlying assumptions, comparable third-party transactions chosen, and/or the valuation methodologies used. Transfer pricing is cited as the most difficult issue for MNE tax departments, as well as tax administrations.50 The amount of transfer mis-pricing distortions depends on a number of factors described in Section 5, including tax rate differentials across countries, the transfer pricing laws and Guidelines, and governments’ transfer pricing enforcement rules.
4.3.2 Tax intermediation of IP services IP holding companies are often set up as SPEs for tax and non-tax reasons, which raise the possibility of “merchanting of services” within a MNE group.51 Supplementary presentations in national accounts showing both gross and net service flows have been proposed in BPM6 and MSITS 2010. An example of Ireland’s supplementary report indicates how merchanting can affect balance of payments.52 SPEs often are established as part of tax planning strategies designed to reduce corporate income tax and withholding taxes. SPEs can have large financial flows but few employees or tangible assets. Barclays Corporation reported on its initial public EU country-by-country tax report that its Luxembourg subsidiary earned EUR 1.4 billion in profits in 2013 with only 14 employees. Around the same time, the new chief executive office of the bank reported that it would be closing its Structured Capital Markets group, based in Luxembourg that was involved in tax minimization strategies. Two years later, the Luxembourg subsidiary had turnover and profit of only one-third its earlier level with three times as many employees.53 An example of some SPEs used in a tax minimization strategy is the well-publicized Double Dutch Irish Sandwich used by Google, as illustrated in Figure 9. An IMF report graphic54 (below) shows the structuring and flows of the IP developed in the U.S., the sales to customers in the UK, and the intermediaries in Ireland and Netherlands to get the income to Bermuda at an overall 2.4 percent tax rate.55 The intermediaries in Ireland and the Netherlands help avoid withholding taxes on non-portfolio payments between EU countries.
50 EY (2014). 51 UNECE (2015). 52 UNECE (2015), p. 148. 53 https://www.home.barclays/citizenship/reports-and-publications/country-snapshot.html. 54 IMF (2013). 55 https://www.bloomberg.com/news/2010-10-21/google-2-4-rate-shows-how-60-billion-u-s-revenue-lost-to-tax-loopholes.html/

28 Figure 9: Graphic of structuring of Double Irish Dutch Sandwich
Source: IMF (2013), “Taxing Times,” Fiscal Monitor, October. UNCTAD in its World Investment Report 2015 estimates significant profit shifting and revenue losses in low-income countries due to offshore investment hubs, many of which are done through SPEs. The analysis finds that the rate of return on FDI is 1-1.5 percentage points lower for each 10 percent share of inward investment originating from offshore investment hubs and tax havens. Shifted profits were estimated to be around 50 percent of the reported profits of MNEs, and lost revenue to low-income countries was estimated to range from USD 66 to 120 billion annually.
4.3.3 Economic presence without permanent establishment International tax treaties define the terms on which a country can subject a company to its corporate income tax. The concept of permanent establishment (PE), jurisdiction to tax, includes not only a substantial physical presence in the country but also situations where a non-resident carries on business in the country via a dependent agent. The 2013 BEPS Report stated that “In an era where non-resident taxpayers can derive substantial profits from transactions with customers located in another country, questions are raised as to whether the current rules ensure a fair allocation of taxing rights on business profits, especially where the profits from such transactions go untaxed anywhere.”56 To the extent that national statistics are based on metrics based on self-reported business surveys, likely relying on tax records to some extent, weaknesses in the tax PE rules could result in distortions to the national statistics. For example, some MNEs replaced
56 BEPS Action Report 7.

29 arrangements under which a local subsidiary traditionally acted as a distributor subject to PE with “commissionaire arrangements” not subject to PE. The interpretation of the PE rules resulted in a shift of profits out of the country where the sales take place without a substantive change in the functions performed in the country. In addition, MNEs could fragment their operations among multiple group entities to qualify for exceptions to the PE status for preparatory and ancillary activities. Thus, economic activity and the associated business profits in some countries could be understated due to the non-identification of MNEs operating in their country. PE status is a significant issue for MNEs not only in terms of income tax liability but also compliance and other regulatory measures, so having thresholds for PE status where income tax liability is minimal could enhance economic efficiency and tax administration. Where significant economic activity is involved, triggering tax liability could result in more reported economic activity in some countries, and less in other countries. For economic activity without PE, national accounts would have to set up notional units and impute income based on some formula, per BMSD4. For economic activity with PE, MNEs would have the equivalent of a branch in the country and there would be a tax income statement. Such an income statement would require appropriate transfer prices. Particularly in the case of digital activity, which lends itself to activity without physical presence in the country of the consumers, IP likely has a significant involvement in the economic activity. This section has described three types of distortions of national income accounting related to the measurement of IP resulting from MNEs’ tax minimization. Transfer mis-pricing can affect the valuation of IP service flows as a result of inappropriate valuations different from arms’ length prices. The volume of activity in a country can be distorted as a result of “merchanting” of services through IP holding companies or non-identification of companies doing business in a country because they have avoided tax status. The next section describes empirical studies that provide some quantification along certain dimensions of these distortions. Sour c e s , m a g n i t u de s a n d t r e nd s i n t a x d i s t o r t i ons o f c r os s - bor de r f l ow s i n na t i ona l s t a t i s t i c s This section describes a number of empirical studies and quantitative measures of the tax distortions of measures of cross-border IP flows in national statistics. Specific examples of individual company’s tax strategies that assign income to countries other than the location of the creation of the IP or the use and commercialization of the IP illustrate the issues involved. The measurement distortion issues affect both the quantity and the valuation of the IP financial flows. Government hearings on tax avoidance focused the attention of policymakers on the separation of where profits were taxed from where the economic activities took place and value was created, resulting in the G20/OECD BEPS Project. Estimates of the aggregate magnitude of the distortions globally and for individual countries, however, have only been rough orders of magnitude or ranges given the complexity of the transactions involved, the lack of reliable and comprehensive data, and the need to estimate the separate effects of profit shifting from the real effects of differences in countries’ tax rates. Empirical work to date has shown that profit shifting of IP flows has been significant and increasing during the past two decades. Understanding the sources of the tax distortions is an initial step, which helps in understanding the findings and limitations of the empirical studies that have attempted to separate profit shifting from changes in real cross-border economic activity. Changes in the sources of the tax distortions also provide an indication of how the magnitude of the distortions has changed over time in the past and the potential changes in the future.

30
5.1 Sources of the tax distortions to cross-border IP flows Countries set their tax and fiscal policies to benefit their citizens, and thus it is not surprising that countries have a heterogeneous mix of tax policies. Countries have different levels of tax and spending ratios as a percent of GDP. Countries have different mixes of income, consumption, payroll and property taxes. Countries have different statutory tax rates on the various tax bases. Countries also have different tax incentives, and the design of those incentives, for economic development, R&D, employment, and other social purposes. Countries compete for capital investment, employment and revenues of multinational enterprises through their tax systems with tax rates, tax bases, tax incentives and tax administrative practices. MNE foreign direct investment in a country is incentivized by lower tax burdens as well as by productivity-enhancing government infrastructure and public education. However, attempts to encourage investment, employment and revenue can create tax differences between countries that encourage shifting of taxable income with only minimal, or possibly no, change in real economic activity. Since 1998, the OECD has focused on stopping “harmful tax competition”. The most recent efforts have focused on the lack of transparency in connection with government tax rulings and preferential tax regimes that risk being used for artificial profit shifting due to a lack of substantial economic activity.57 The IMF highlighted tax spillovers where one country’s tax policies can reduce the tax collections of other countries and also encourage other countries to lower their corporate tax rates.58 The BEPS project focused on the numerous ways in which MNEs were legally taking advantage of gaps in the international tax rules to shift taxable profits from high-tax-rate countries to low-tax-rate countries to reduce their global tax liabilities. Much of the focus on tax profit shifting has been on corporate tax rates, which have been declining in most countries over the past three decades. Differentials in corporate tax rates are a major source of the tax distortions in cross-border IP flows, and have been the most measured. However, tax competition in the design of tax bases has also been occurring. Tax competition through favourable tax administrative rulings, which have generally not been transparent, has occurred. Other taxes, including withholding taxes and value-added taxes, can affect the flow of cross-border IP.
5.1.1 Corporate income tax differentials Global foreign direct investment has grown by over 6 times, at an average annual rate of 7.8%, over the past twenty-five years59 as more economies opened to foreign investment and global supply chains became dominant business models. Corporate income taxes matter in MNEs’ decisions whether to invest in a particular country, the amount of that investment and the types of investments. There are a multitude of corporate tax rates cited in news articles, government reports and academic studies. Box 4 describes three corporate tax rates that are most relevant for analyzing MNE cross-border tax behaviours. While other tax rates are important for analyzing the effects on real foreign direct investment, statutory marginal tax rates (SMTR) are the most relevant tax rates for analyzing profit shifting.
57 BEPS Action 5 Report (2015). 58 IMF (2014). 59 http://data.worldbank.org/indicator/BM.KLT.DINV.CD.WD.

31 Box 4: Which tax rate matters?
A dozen or more different tax rates are used in various analyses and presentations. The top statutory corporate tax rate is often referred to as the “headline” rate. Financial statements present effective tax rates that are the accrued income tax liability as a percentage of pre-tax financial profits. National statistics are used to calculate average tax rates of corporate income tax collections as a percentage of national pre-tax corporate profits. Economists calculate a marginal effective tax rate (METR) on hypothetical investments earning zero economic profits, incorporating tax depreciation rates and interest deductibility to measure tax systems’ effects on the level of domestic investments. Tax policy economists also calculate average effective tax rates (AETR) on hypothetical investments earning economic rents or “excess profits”, which can affect MNEs’ choice of location of investments.
DeMooij et al (2008) examine the various measures of corporations’ responsiveness of investment to a change in a tax rate, “elasticity,” with a meta-analysis of the many empirical academic studies. They concluded that the appropriate tax rate depends on what is being measured, as shown in table 6. When MNEs are making decisions about in which country to invest (a discrete location choice), they look at the expected future total tax burden on their expected corporate profits, an AETR. They find that a synthesis of the empirical studies finds that a ten-percentage point reduction in the average effective tax rate, relative to other countries’, increases in-bound FDI by 12 percentage points. Within a given country, the METR on investment matters with respect to the level of domestic investment. They find that a 4-percentage point increase in domestic investment results from a ten-percentage point reduction in the METR. With respect to profit shifting across countries, including IP cross-border flows, the SMTR, relative to other countries’, is what matters. They report that the empirical studies as of 2008 found that profit shifting increased by 20 percentage points for each 10-percentage point reduction in the SMTR. They did not distinguish between IP and other profit shifting. Table 6: Magnitude of the responsiveness to corporate tax rates Type of activity Relevant tax rate Estimated responsiveness Profit shifting Statutory marginal tax rate (SMTR) -2.0 FDI discrete location Average effective tax rate (AETR) -1.2 Marginal FDI Marginal effective tax rate (METR) -0.4 Source: De Mooij et al (2008). SMTRs apply to incremental changes in taxable income. So if a MNE can shift taxable income from a country with a 40 percent SMTR to a country with a 15 percent SMTR, the amount of tax paid on the shifted income will decline by 25 percentage points, or 63 percent. The amount of after-tax profits would increase from 60 percent of pre-tax profits to 85 percent of pre-tax profits. Similarly, if a MNE can shift taxable income from the country with the 15 percent SMTR to a tax haven with a zero corporate SMTR, the amount of tax paid on the shifted income would decline by 15 percentage points, or 100 percent, while the amount of after-tax profits would increase 18 percent. Reductions in SMTRs also reduce the METR, which affects the level of investment in a country, and the AETR, which affects the choice of country in which FDI is made. SMTRs affect not only profit shifting but also real investment decisions. Thus, when analyzing the effect of SMTRs on profit shifting, it is necessary for analysts to separate profit shifting from changes in real economic activity.

32 With the reduction in the UK and US corporate statutory tax rates in the mid-1980’s, most other countries followed by reducing their corporate tax rates, a trend that has continued albeit at a slower pace since the financial crisis. Figure 10 shows the decline in the statutory corporate tax rates of OECD countries from 1981 to 2016. Based on the decline in average corporate tax rate rates, one might expect that the incentive to shift profits to minimize tax liability would be reduced. However, profit shifting occurs because of differences in the SMTRs between countries, rather than the absolute level of the tax rate. The tax differential between a country and a tax haven with a zero corporate statutory marginal tax rate is the country’s own SMTR, but the vast majority of cross-border IP flows are between non-tax haven countries. And MNEs would still find it advantageous to shift profits to a tax haven from a country with a 5 or 10 percent SMTR. Figure 10: Average Top Statutory Marginal Tax Rate of OECD countries, 1981-2016
Source: Business Roundtable (2015) While average OECD statutory corporate tax rates have been declining, the tax differentials between countries have been widening, as measured by the variation (standard deviation) of tax rates. Although the variation in OECD corporate tax rates did not change much between 2000 and 2017 on an unweighted basis, a significant increase in the variation has occurred when measured on a GDP-weighted, R&D-weighted, services trade weighted and CUIP-weighted basis, as shown in table 7. The standard deviation of the top statutory marginal tax rate on general corporate income (the headline rate) increased from 5.5 percentage points in 2000 to 9.0 percentage points in 2017 when weighted by CUIP. Unweighted OECD tax rates treat the U.S. and Estonia equally. Most countries have tax incentives to encourage R&D, typically tax credits for R&D expenditures and/or accelerated tax depreciation. Some countries have started providing lower corporate tax rates on certain types of income from IP or intangibles, so-called “patent boxes.” Tax credits and accelerated depreciation subsidize the up-front investments in R&D, whether ultimately profitable or not. Patent boxes subsidize R&D by lowering tax rates on future income of profitable R&D investments. The standard deviation of the CIT rate on patent income increased from 5.5 percentage points in 2000 to 13.5 percentage points in 2017 when weighted by CUIP, the most relevant weight for patent income.

33 Table 7: Average and variation in statutory corporate income tax rates of OECD countries, 2000, 2010 and 2017
Unweighted GDP weighted
R&D weighted
Services trade
weighted
CUIP weighted
Average statutory headline CIT rates 2000 32.5 38.7 39.2 37.3 37.9 2010 25.5 33.4 34.8 30.2 30.9 2017a 24.1 31.5 31.9 28.1 27.7
Average CIT rates on patent income 2000 31.8 38.6 39.3 37.3 37.9 2010 21.8 31.0 32.8 25.3 25.7 2017a 19.3 28.1 29.1 21.9 21.7
Variation in statutory headline CIT rates 2000 7.1 5.5 5.1 6.8 5.5 2010 6.3 6.3 5.8 6.9 8.7 2017a 6.2 6.2 6.6 7.6 9.0
Variation in CIT rates on patent income 2000 8.9 5.9 7.1 6.8 5.5 2010 9.0 9.5 8.1 11.5 14.5 2017a 8.5 10.9 10.1 11.7 13.5
Source: Authors' calculations, OECD tax database, World Development Indicators a/ 2017 rates but 2015 data for GDP, services trade and CUIP, 2013 data for R&D
Figure 11 shows the increasing variation in national corporate tax rates despite declining average CIT rates. It also shows the increasing disparity between general CIT rates and rates on patent income. The tax differentials between countries, which motivate profit shifting, have widened greatly when comparing the tax rates on patent incomes. Figure 11: Average corporate tax rates and the variation in tax rate differentials within OECD countries, 2000-2017 (OECD weighted averages by GDP)
Source: Authors’ calculations based on OECD corporate tax rate statistics

34 Low STMRs on highly mobile IP income raised concerns about increased profit shifting, given the ease at which IP assets and income could be transferred between countries. Several empirical studies found evidence of profit shifting into countries with patent boxes, and greater profit shifting where there were no requirements for the R&D to be performed in the country.60 The BEPS project, as part of its focus on harmful tax competition, requires patent boxes to have a “nexus” requirement so lower tax rates apply only to income from R&D conducted in that country.61 Box 5 shows the favourable tax treatment of patent income in OECD and selected other countries as of 2014. Box 5: “Patent box” regimes – low tax rates on certain IP income flows A number of countries have enacted “patent box” regimes with lower corporate tax rates on certain types of income from intellectual property. Table 8 shows the countries with lower corporate tax rates, as of 2014, on certain types of qualifying intellectual property, and the year of the patent box introduction. Table 8: Tax treatment of IP in selected OECD and G20 countries, 2014
Source: G20/OECD BEPS Action 11 report.
Since 2014, several other countries, Ireland, Israel and Italy, have enacted new patent box regimes others have modified their rules to require the “nexus” requirement of the BEPS Project, and several other countries are considering enacting new patent box regimes. Empirical studies of profit shifting generally use countries’ headline SMTRs in separating the effect of profit shifting from changes in real investment. With the increasing use of patent box regimes, empirical studies will need to be more granular in their analyses with different tax rates applying to different types of income. The financial statement data of unconsolidated MNE entities, however, does not currently provide such detailed information.
60 Evers et al (2013), European Commission (2015). 61 BEPS Action 5 report (2015).

35
5.1.2 Other tax distortion factors While SMTR differentials are the principal source of profit shifting, their effect can be heightened or diminished by other tax-system features. In some cases, profit shifting can still occur between countries even if their SMTRs are the same. Thus, empirical studies only using SMTR differentials are likely to underestimate the amount of profit shifting. The SMTR is not always the tax rate that applies at the margin for business investment decisions. Several countries provided MNEs with special tax rulings that significantly reduced the tax rate on income shifted into the country. Some of these tax rulings have been made public based on disclosures due to Parliamentary or Congressional inquiries, the EC’s State Aid rulings, and the Luxembourg Leaks.62 Although Luxembourg had a 28 percent SMTR, many MNEs were subject to much lower tax rates on certain types of income, including IP income. If one of a MNE’s subsidiaries is in a tax loss situation or has unused net operating loss carry forwards, then income shifted from a profitable subsidiary in a country with a positive SMTR to an unprofitable subsidiary in a country with the same SMTR would result in tax savings. State-owned enterprises (SOE) have an incentive to shift profits out of other countries even if their SMTRs are the same or lower. Since the government is the owner of a SOE, its return can take the form of tax revenue or after-tax profits. If the SOE is in Country A with a 25 percent SMTR and one of its subsidiaries is in Country B with a 25 percent SMTR, if the SOE can shift $1000 out of Country B its total tax liability is unchanged but total income (tax revenue and after-tax profits) of the government owner of the SOE increases by $250. If Country B has a STMR of 15 percent, profit shifting back to the SOE’s home country would still be attractive since while total taxes would increase by $100, Country A’s total income would increase by $150. Anti-avoidance rules can reduce the amount of profit shifting. Several academic studies have found that tighter transfer pricing requirements, including increased documentation requirements, reduce the amount of profit shifting.63 The BEPS Project’s country-by-country reporting, a minimum standard accepted by the over 95 countries participating in the BEPS Inclusive Framework, will enable tax administrations to more effectively focus their limited resources on higher-risk transfer mispricing issues. Although empirical studies have not examined the effect of additional tax administration resources, one would expect that many low-income countries would be more likely to be reduce profit shifting as a result of increased resource capacity, including technical training on issues such as transfer pricing. A joint initiative by the OECD and the United Nations Development Program, Tax Inspectors without Borders, deploys tax experts to countries requesting assistance in audits of MNEs. As of 2016, eight pilot programs resulted in more than $260 million of additional tax collections.64 The recent focus on profit shifting and harmful tax practices has resulted in revised transfer pricing rules to better ensure profits are taxed where economic activities take place and value is created; increased transparency of government rulings and the largest MNEs’ transfer pricing operations; increased multi-lateral cooperation in closing gaps in the international tax rules; and increased tax administration capacity building among low-income countries. A number of MNEs have announced changes in their business operations, partially due to the increased focus on profit shifting that will more closely align reported profits and the underlying economic activities.65
62 Australia (2014), European Commission (2014), https://www.icij.org/project/luxembourg-leaks. 63 Lohse and Riedel (2013). BEPS Action 11 report (2015). 64 http://www.oecd.org/tax/tax-inspectors-without-borders-making-significant-progress.htm. 65 Harpez (2015).

36
5.2 Empirical studies of profit shifting of cross-border IP flows66 An increasing number of empirical studies have found strong evidence of profit shifting due to tax rate differentials, while attempting to hold real economic activity constant.67 Most of the empirical studies have focused on three principal sources of profit shifting: transfer mis-pricing of imports and exports, including services; the strategic location of intangibles; and the strategic location of both internal and external debt. Most analyses that have attempted to estimate the separate channels of profit shifting assign most of the profit shifting to transfer mis-pricing and the strategic location of intangibles.68 These two strategies of tax minimization are relevant for the allocation of cross-border income of IP since they affect countries’ operating surplus, GDP, exports and imports.69 A number of studies have found high levels of responsiveness of profit shifting, particularly with respect to R&D intensive companies. Unfortunately, the breadth and scope of these studies is limited to a few specific countries where detailed government micro-level data is available or to databases of financial statements that are incomplete and limited in their tax information. US Treasury economist Harry Grubert (2003) analyzed data from US MNEs’ tax returns and found US MNE subsidiaries located in countries with relatively low and relatively high statutory CIT rates engage in significantly greater volumes of inter-affiliate transactions. This is consistent with BEPS related activity. The analysis finds that R&D intensive companies engage in greater volumes of such intra-company trade. Grubert et al (2003) analyzed US MNEs’ tax return data and found the US “check-the-box” regulation encouraged the relocation of intangible assets abroad. They provided evidence of a substantial migration of intangible assets abroad, in particular to low-tax-rate countries through hybrid entities and cost-sharing agreements. Moreover, descriptive statistics showed that royalty payments among foreign affiliates increased sharply in the period considered, from entities in high-tax-rate countries to entities in low-tax-rate countries. Karkinsky et al (2009) analyzed the effect of statutory tax rates and other tax-related variables, such as withholding tax on royalties, on the number of European MNEs’ patent applications. They found that low tax rates increase the probability that a firm applies for a patent in low-tax rate locations. For a one-percentage point decrease in the rate of corporate tax, they found a 3.5 to 3.8 percent increase in patent applications in that country. Griffith et al (2011) estimated, based on data from the EPO on patents located in 14 European countries, that a one percentage point decrease in the corporate tax rate increased patent applications in the country 0.5 to 3.9 percent. They also simulated the impact of the enactment of a new IP box on tax revenue and found that lower tax rates result in losses in government revenues because they do not attract enough IP income to offset the revenue loss from the preferential tax rate applicable to current IP income. Beer et al (2013) found profit-shifting responsiveness is higher for subsidiaries with higher ratios of intangible to total assets. Dischinger and Riedel also found that an affiliate’s pre-tax income response is more sensitive to tax rate differentials for groups with high ratios of intangibles to sales. Guvenen et al (2017) compare reported profits of foreign subsidiaries of US MNEs with estimated values based on labor compensation and unrelated-party sales in a country, and find significant differences related to countries’ corporate tax rates. The report finds greater disparities due to tax transfer mispricing in industries with high levels of R&D. An OECD analysis found the tax sensitivity of profit shifting is almost twice as high among MNE groups with patents as for non-patenting MNE groups, controlling for a number of
66 Parts of this subsection draw heavily on the BEPS Action 11 report which Tom Neubig played a principal author role. 67 See BEPS Action 11 report (2015), Riedel (2015), Dharmapala (2014) 68 Heckemeyer and Overesch (2013), based on a meta-analysis of 25 studies, estimate that the strategic location of debt accounts for about 30% of total profit shifting. 69 The location of debt and related interest payments do not affect countries’ operating surplus or GDP.
37 factors affecting firms’ profitability. A separate analysis found that preferential tax treatment of patents increases both patents invented in other countries as well as R&D activities.70 A European Commission study found that lower tax rates on certain intangible income encouraged greater connection between the residence of inventors and the location of registration of patents if the rules require such connection. Otherwise the lower tax rate encourages shifting of patent registrations and taxable income without a significant shift in real economic activity.71 The issue of profit shifting is important to many low-income countries, including those with extensive natural resources.72 Several studies estimate the portion of corporate revenue lost is higher in low-income countries since they tend to rely more heavily on corporate income taxes as a share of total revenue, many have relatively high corporate tax rates, and many are constrained in their resource capacity for preventing tax avoidance.73 Although much of the profit shifting from low-income countries is due to strategic allocation of debt and transfer mis-pricing of commodities and interest payments, the global supply chains of what are considered commodities can also often have significant IP flows, such as for marketing, distribution and trading that are susceptible to transfer mispricing.74 Changes to the international standards for reporting Balance of Payments statistics will expand available information on countries’ trade in services related to intangible property. The new standards call for the capitalization of R&D expenditures. This will provide a basis for reporting the value of transfers of the ownership of intangibles produced by R&D expenditures as a component of trade in R&D services. However, many intangible asset values are significantly greater than the capitalised value of their inputs, so to estimate the potential shifted income may require adjusting upward the reported trade value. In countries that have not yet adopted this change, the transfer of ownership rights in intangible property is unlikely to be included in the trade in services category. Empirical studies show high responsiveness of MNEs to shifting mobile income, while the responsiveness of shifting real economic activity is significantly smaller. A meta-analysis of empirical studies by DeMooij et al (2008) found an elasticity of the extensive FDI investment margin of -0.65, considerably smaller than the elasticities estimated for patent registrations75, smaller than the responsiveness of research and development expenditures76, and smaller than the responsiveness of profit shifting. Some empirical studies have found that the responsiveness to tax rates is higher for entities with significant intangible assets, because mispricing hard-to-value intangibles is easier and/or in magnitude greater than mispricing physical goods.77 Empirical analyses have also found larger mispricing among more highly differentiated physical goods, which may include embedded intangibles.78 The growth in importance of intellectual property within manufacturing and the production of products is making the distinction between goods and services in international trade increasingly unclear. For example, the price of exports of goods may reflect a price for the good itself plus an embedded, but not separately stated, charge for the use of intangible property, a service component. In this case, the transfer price of the good may include mispricing of the use of the intangible property that was produced in another country in earlier steps in the production chain.
70 BEPS Action 11 (2015). 71 European Commission (2015). 72 Fuest et al (2011) and Fuest et al (2012). 73 IMF (2014), UNCTAD (2015), Crivelli et al (2016). 74 Platform for Collaboration on Tax (2017). 75 DeMooij et al (2008). 76 European Commission (2015). 77 See table 3.A2.2 in BEPS Action 11 report for a summary of elasticity estimates of the responsiveness of intra-firm exports and imports to corporate income tax differentials. 78 Bernard et al (2006).
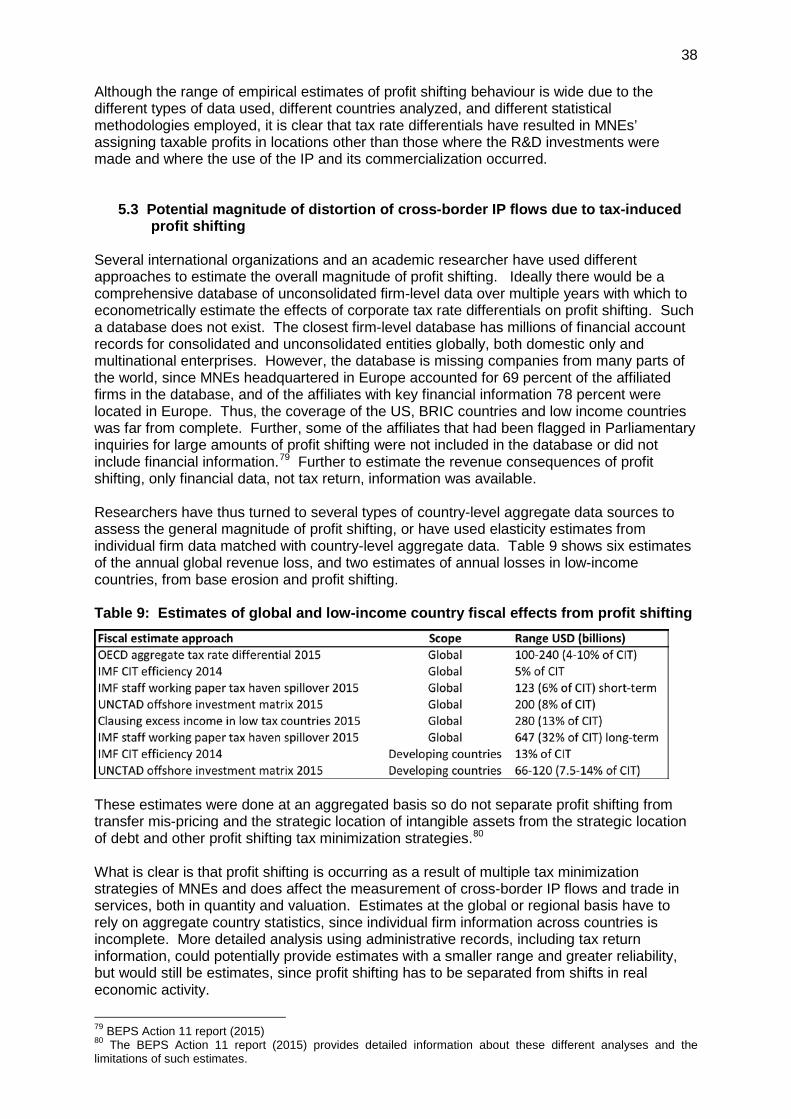
38 Although the range of empirical estimates of profit shifting behaviour is wide due to the different types of data used, different countries analyzed, and different statistical methodologies employed, it is clear that tax rate differentials have resulted in MNEs’ assigning taxable profits in locations other than those where the R&D investments were made and where the use of the IP and its commercialization occurred.
5.3 Potential magnitude of distortion of cross-border IP flows due to tax-induced profit shifting
Several international organizations and an academic researcher have used different approaches to estimate the overall magnitude of profit shifting. Ideally there would be a comprehensive database of unconsolidated firm-level data over multiple years with which to econometrically estimate the effects of corporate tax rate differentials on profit shifting. Such a database does not exist. The closest firm-level database has millions of financial account records for consolidated and unconsolidated entities globally, both domestic only and multinational enterprises. However, the database is missing companies from many parts of the world, since MNEs headquartered in Europe accounted for 69 percent of the affiliated firms in the database, and of the affiliates with key financial information 78 percent were located in Europe. Thus, the coverage of the US, BRIC countries and low income countries was far from complete. Further, some of the affiliates that had been flagged in Parliamentary inquiries for large amounts of profit shifting were not included in the database or did not include financial information.79 Further to estimate the revenue consequences of profit shifting, only financial data, not tax return, information was available. Researchers have thus turned to several types of country-level aggregate data sources to assess the general magnitude of profit shifting, or have used elasticity estimates from individual firm data matched with country-level aggregate data. Table 9 shows six estimates of the annual global revenue loss, and two estimates of annual losses in low-income countries, from base erosion and profit shifting. Table 9: Estimates of global and low-income country fiscal effects from profit shifting
These estimates were done at an aggregated basis so do not separate profit shifting from transfer mis-pricing and the strategic location of intangible assets from the strategic location of debt and other profit shifting tax minimization strategies.80 What is clear is that profit shifting is occurring as a result of multiple tax minimization strategies of MNEs and does affect the measurement of cross-border IP flows and trade in services, both in quantity and valuation. Estimates at the global or regional basis have to rely on aggregate country statistics, since individual firm information across countries is incomplete. More detailed analysis using administrative records, including tax return information, could potentially provide estimates with a smaller range and greater reliability, but would still be estimates, since profit shifting has to be separated from shifts in real economic activity.
79 BEPS Action 11 report (2015) 80 The BEPS Action 11 report (2015) provides detailed information about these different analyses and the limitations of such estimates.
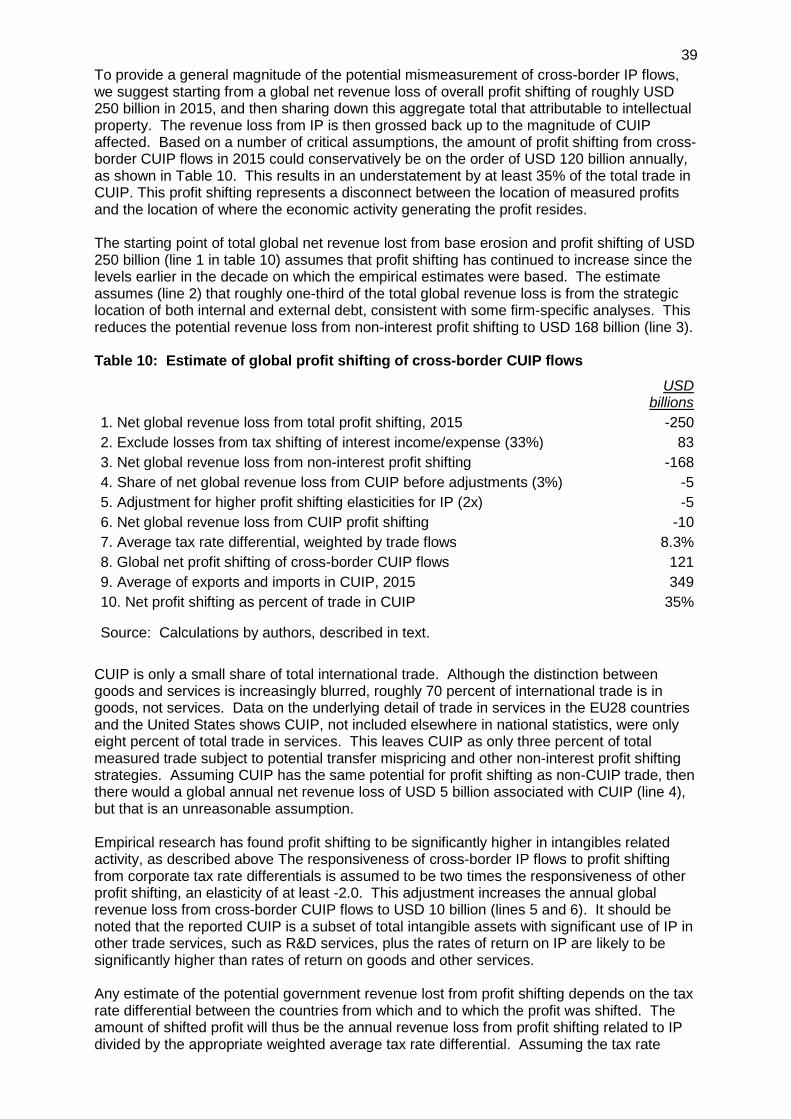
39 To provide a general magnitude of the potential mismeasurement of cross-border IP flows, we suggest starting from a global net revenue loss of overall profit shifting of roughly USD 250 billion in 2015, and then sharing down this aggregate total that attributable to intellectual property. The revenue loss from IP is then grossed back up to the magnitude of CUIP affected. Based on a number of critical assumptions, the amount of profit shifting from cross-border CUIP flows in 2015 could conservatively be on the order of USD 120 billion annually, as shown in Table 10. This results in an understatement by at least 35% of the total trade in CUIP. This profit shifting represents a disconnect between the location of measured profits and the location of where the economic activity generating the profit resides. The starting point of total global net revenue lost from base erosion and profit shifting of USD 250 billion (line 1 in table 10) assumes that profit shifting has continued to increase since the levels earlier in the decade on which the empirical estimates were based. The estimate assumes (line 2) that roughly one-third of the total global revenue loss is from the strategic location of both internal and external debt, consistent with some firm-specific analyses. This reduces the potential revenue loss from non-interest profit shifting to USD 168 billion (line 3). Table 10: Estimate of global profit shifting of cross-border CUIP flows
USD billions
1. Net global revenue loss from total profit shifting, 2015 -250 2. Exclude losses from tax shifting of interest income/expense (33%) 83 3. Net global revenue loss from non-interest profit shifting -168 4. Share of net global revenue loss from CUIP before adjustments (3%) -5 5. Adjustment for higher profit shifting elasticities for IP (2x) -5 6. Net global revenue loss from CUIP profit shifting -10 7. Average tax rate differential, weighted by trade flows 8.3% 8. Global net profit shifting of cross-border CUIP flows 121 9. Average of exports and imports in CUIP, 2015 349 10. Net profit shifting as percent of trade in CUIP 35%
Source: Calculations by authors, described in text.
CUIP is only a small share of total international trade. Although the distinction between goods and services is increasingly blurred, roughly 70 percent of international trade is in goods, not services. Data on the underlying detail of trade in services in the EU28 countries and the United States shows CUIP, not included elsewhere in national statistics, were only eight percent of total trade in services. This leaves CUIP as only three percent of total measured trade subject to potential transfer mispricing and other non-interest profit shifting strategies. Assuming CUIP has the same potential for profit shifting as non-CUIP trade, then there would a global annual net revenue loss of USD 5 billion associated with CUIP (line 4), but that is an unreasonable assumption. Empirical research has found profit shifting to be significantly higher in intangibles related activity, as described above The responsiveness of cross-border IP flows to profit shifting from corporate tax rate differentials is assumed to be two times the responsiveness of other profit shifting, an elasticity of at least -2.0. This adjustment increases the annual global revenue loss from cross-border CUIP flows to USD 10 billion (lines 5 and 6). It should be noted that the reported CUIP is a subset of total intangible assets with significant use of IP in other trade services, such as R&D services, plus the rates of return on IP are likely to be significantly higher than rates of return on goods and other services. Any estimate of the potential government revenue lost from profit shifting depends on the tax rate differential between the countries from which and to which the profit was shifted. The amount of shifted profit will thus be the annual revenue loss from profit shifting related to IP divided by the appropriate weighted average tax rate differential. Assuming the tax rate

40 differential on IP flows is 8.3 percentage points81 (line 7) results in an estimate, based on many assumptions, at around USD 120 billion annually (line 8) or about 35 percent of total trade in CUIP, at 2015 levels (lines 9 and 10). Modifications to any of these assumptions would change the estimate, either higher or lower, but we believe as described above that this is a conservative estimate of the understatement of global CUIP. It should be noted that while profit shifting is zero-sum globally, the mismeasurement of global CUIP is unlikely to be zero-sum, and highly likely to be understated. Fetzer et al note CUIP is a major area of asymmetry in trade in services statistics from national statistical agencies,82 which is apparent in the large discrepancy between total global receipts and payments of CUIP in table 3. Tax minimization by MNEs in related-party transactions results in overcharges for imported services to high-tax-rate countries (payments) and undercharges for exported services (receipts), and the reverse for low-tax-rate countries. Table 3 shows that the two countries with the largest net exported CUIP services are the United States and Japan, which have some of the highest corporate income tax rates. While Ireland and Singapore with low corporate tax rates are two of the largest net imports of services. More importantly, a number of tax havens do not report CUIP receipts. In addition, the labelling of royalty payments as dividends, or the conversion of royalty payments to dividends through SPEs, to avoid withholding taxes or take advantage of dividend participation exemptions, reduces measured CUIP. Tax-induced profit shifting affects the measurement of individual countries’ trade balances (imports and exports), GDP and productivity. In addition, shifting taxable profits results in a significant global revenue loss with more losses from high-tax-rate countries than revenue gains from lower-tax-rate countries due to differences in countries’ corporate tax rates.
1.4 CUIP mismeasurement for individual countries Given the current data limitations of measuring tax-induced profit shifting83, attempting to measure the CUIP measurement for individual countries would not be reliable. However, the direction of the biases is clear with understatement of net exports by high-tax rate countries and overstatement of net imports by low-tax rate countries. A few estimates for individual countries have been made of profit shifting by US MNE with business survey and tax return data, consistent with this pattern. Using US BEA annual surveys of U.S. based multinational firms and their affiliated firms abroad, Clausing (2016) estimated econometrically profit shifting from the U.S. to other countries. She found that 82 percent of the “excess” income is booked in seven low-tax rate (“tax haven”) countries: the Bermuda, Caymans, Ireland, Luxembourg, Netherlands, Singapore and Switzerland. Extending her analysis to the global profits of Global 2000 firms, she estimated that higher-tax-rate headquarter countries booked $1.1 trillion of profits in low-tax-rate countries in 2012. This profit shifting includes more than just from cross-border IP flows. Dowd et al (2017) report significant profit shifting into tax haven countries by U.S. multinationals based on tax return data. They estimate that profit shifting between foreign affiliates is highly non-linear with respect to corporate tax rates with very high elasticities in shifting to tax havens. Guvenen et al (2017) estimate, based US MNE data, that profit shifting reduces earnings on direct investment abroad of US multinationals by 65% or USD 280 billion, with most coming from tax havens and from R&D-intensive industries. Positive profit reattributions to other countries are concentrated in other high-tax rate countries, such 81 BEPS Action 11 report (2015), p. 206. The tax rate differential between G20/OECD countries did not include some important zero-rate tax havens, so the tax differential would be greater. Based on 2012 US tax return data of foreign affiliates of US-headquartered MNEs, 17 percent of their total earnings and profits were earned in non-OECD “tax havens” (Bermuda, British Virgin Islands, Cayman Islands and Singapore). Adjusting for these tax havens, the weighted average tax rate differential is estimated to be 8.3 percentage points. 82 Fetzer et al (2017), p. 13. 83 OECD BEPS Action 11 report (2015).

41 as Japan, France and Italy. The effect on individual countries’ national account statistics would depend on a number of country-specific factors, including:
• The country’s relevant statutory marginal tax rate compared to the relevant statutory marginal tax rate in the country’s IP trading partners. The higher the absolute value of the tax rate differential, the larger the distortion.
• The country’s anti-avoidance tax rules, such as transfer pricing, controlled foreign corporation, and permanent establishment rules, and their enforcement. The stricter the actual enforced anti-avoidance rules, the lower the level of distortion.
• The country’s treatment of intellectual property rights. Weaker IP rights would reduce the amount of IP flow into the country and also the responsiveness of IP flows to the relative corporate tax rate differential.
It should be noted that some countries act as if they willingly give up lost tax revenue to increase employment of their citizens. In some cases, countries provide specific tax incentives, such as R&D tax credits, or government grants to attract high-paying jobs. Weak anti-avoidance rules and/or weak or facilitating enforcement can effectively reduce a country’s tax rate on IP activity, thus encouraging some additional economic activity in the country. A country with a high statutory marginal tax rate may effectively reduce its effective tax rate on mobile capital to keep jobs in the country. Thus, a country may accept lower measured GDP, exports, corporate income and corporate tax revenue for more jobs and employment compensation. Prior estimates of tax-induced profit shifting have used aggregate statistics or a combination of elasticities from firm-level data combined with national statistics. None of the estimates have been done with CUIP national statistics. A potential approach to measuring the distortion in CUIP national statistics could analyse the effect of corporate tax rates, holding other factors constant, on the ratio of CUIP receipts as a percentage of R&D expenditures, similar to the OECD indicator described below. Estimates of the “excess” royalty payments or CUIP relative to the actual R&D activity in the country could illustrate the potential distortions.84
5.5 Main trends in cross-border IP orofit shifting Estimates of profit shifting are quite uncertain with a large range among the estimates that have been made. Estimates of the tax losses from profit shifting have not been made across time; although there are some indications that profit shifting has been increasing over time. Grubert (2003) examined tax return and other data for US MNEs and found higher levels of profit shifting over time. Guvenen et al (2017) also find a significant increase in profit shifting by US MNEs since 2000. The BEPS project presented a number of indicators of BEPS that looked at trends in profit shifting. One of the indicators measured the relationship between royalty payments received relative to R&D expenditures in the country. The indicator, shown in Figure 12, shows a sharp increase in the ratio over time for a small group of countries.
84 Most OECD, and all EU, countries now have intangible asset estimates available for the ‘stock’ of R&D expenditures as part of their national accounts systems. Most also have stocks of Software investment. These could help provide a benchmark for the CUIP payments and receipts in different countries.

42 Figure 12: Concentration of royalty receipts to R&D expenditures
Source: OECD BEPS Action 11 report (2015), p. 62. A high value of the indicator suggests that the income streams from IP received in the high-ratio countries is significantly higher, relative to other countries, than would be expected given the actual R&D expenditures in those countries, thus indicating the likelihood of profit shifting through royalty payments. In 2012, the high ratio countries, those with ratios in excess of 50% to the average ratio of the remaining countries, earned 1.04 of royalties per 1 of R&D spending. This compared to only 0.18 of royalties per 1 of R&D spending in the other countries. The ratio has a number of limitations and caveats, including that IP could be the result of R&D expenditures in prior years, and royalties are paid for more activities than just those derived from R&D expenditures, such as trademarks and copyrights.85 Clausing (2016) estimated the trend in the revenue loss due to income shifting from the United States, showing a rapid raise after 2001, under USD 20 billion, and continued sharply after the 2008 recession through 2012 to over USD 110 billion. Her estimated trend assumes a constant elasticity of profit shifting to corporate tax differentials, so the trend reflects the doubling of income of foreign affiliates between 2004 and 2012 plus a continuing decline in average foreign effective tax rates, which are the incentive to shift profits out of the U.S. As noted earlier, the variation in corporate tax rates among OECD countries has increased significantly between 2000 and 2017. An important question is whether significant changes in the international tax environment and national governments’ tax policies and administration will reverse what appears to be the recent trend toward more profit shifting, particularly affecting cross-border IP flows. Tax authorities are focusing on these issues much more closely, as are more academic researchers, which will assist national account statisticians in improving their measurements.
85 Estimates of the stock of all intangible assets (R&D, software, design, brands and copyright works) are available from the work of Carol Corrado, Jonathan Haskell and others in most major economies.
0.0
0.2
0.4
0.6
0.8
1.0
1.2
2005 2006 2007 2008 2009 2010 2011 2012
Roya
lty re
ceips
to R
&D ra
tio
High-ratio countries Remaining countries
3 times higher
6 times higher
43 Pos s i b l e a p pr oa c he s t o i m p r o v e m e a s ur e s o f c r o s s - bor de r I P f l ow s National statistics generally rely on self-reported metrics from business surveys, while minimizing imputations or notional units. However, in the case of internal reporting of MNEs’ activities across countries, it has been suggested that imputations may be necessary to reduce distortions in the measurement of real production activity. The exception is due to potential tax-induced distortions in self-reported cross-border transactions between related affiliates within MNEs. Some measures have begun to be taken to improve the validity of cross-border IP flow statistics. These efforts of the national statistical community should continue and be supported where needed with additional resources. Additional initiatives in this area are needed as IP’s importance grows economically and fiscally. Improved measurement is necessary for better policy decisions. Some of the distortions in the measurement of cross-border royalty payments and receipts were significant in the past due to tax-induced profit shifting. Reported IP income, above what was earned on real resources invested in the creation and commercialization of IP, was shifted from higher-tax-rate countries to lower-tax-rate countries due to differences in marginal tax rates. Recent global and national initiatives in the areas of tax policy and tax administration are expected to reduce the amount of tax-induced profit shifting, and thus will reduce future distortions in the measures of cross-border IP flows. However, additional steps by various stakeholders could further improve national statistics of cross-border IP flows. Below are some suggested steps for some of the stakeholders.
6.1 Potential actions of national statisticians 1) Ensure implementation of improvements in data on better classification and new IP flow
disaggregation 2) Further extension of the work on SPEs as part of the OECD’s Benchmark Definition of
Foreign Direct Investment, 4th edition, IMF’s BPM6, and improvements in the measurement of intangible investments, including capitalization of investments
3) Closer cooperation with tax authorities, and qualified academic researchers, on economic activities of MNEs, including potential agreements to secure better information from tax return data, as is currently done in some countries
4) Where possible, linking tax return data at the firm level with business financial account data would provide important insights. For example, linked data could be used to better evaluate the effects of tax patent box claims on the effectiveness on R&D and revenue impacts.
5) More focus on MNE activity, both inbound and outbound, including consideration of cost-beneficial imputations in satellite accounts. Additional work on identifying appropriate imputation methodologies is needed.
6) Linking national satellite accounts on the stock of intangible assets with trade data would be provide better understanding of the location of creation and uses of IP.
6.2 Potential actions of national tax administrations 1) Closer cooperation with national statisticians and qualified academic researchers,
including potential agreements to share tax return information on MNEs, as appropriate 2) Analysis and aggregated publication of future country-by-country reporting data of MNEs 3) Analysis and publication of aggregate tax return information from MNEs and domestic
only firms, and details on income and expenses from intellectual property.
44 6.3 Potential actions of national and international policymakers and analysts
1) Recognize the importance of empirical data on cross-border IP flows and support
adequate resources for the collection and analysis of such data 2) Increase transparency of tax incentives, particularly for the use of IP transactions by firms,
such as declaration of the number of patents for which incentives are claimed. 3) Increase transparency of IP ownership, which could improve markets for trading of IP and
more consistent valuations. 86 4) Reduce incentives (both tax and non-tax) for profit shifting through changes to national
rules and as part of international agreements 5) Adhere to the BEPS Inclusive Framework minimum standards on harmful tax practices,
disclosures, and revised transfer pricing guidelines 6) Support increased revenue mobilization in low-income countries through training and
collaborative tax administration initiatives 7) Support improved dispute resolution mechanisms to resolve potential double tax
situations arising out of multiple countries claiming taxing rights to the same cross-border income.
6.4 Academics 1) Increase focus on profit shifting in low-income countries, including IP cross-border flows 2) Increase analysis of governmental incentives for IP and their potential for distortions of
reported cross-border IP flows, including improved measures of embedded IP 3) Increase analysis of factors contributing to affiliate profitability. If imputations are needed,
what are appropriate estimation methodologies of affiliate profitability?
6.5 Summary As described in this report, cross-border IP payment data does not accurately reflect the origin of IP creation or the destination of IP commercialization. IP-related transfer mispricing and other tax minimization strategies distort current trade data, including cross-border IP payments, total imports and exports, GDP, and productivity of individual countries. The general magnitude of the measurement distortions between countries, due to tax-induced profit shifting, is conservatively estimated at 35 percent of total Charges for the Use of Intellectual Property. A number of other distortions could result in a substantial understatement of total global CUIP with significant distortions for individual countries’ trade, GDP and productivity measures. These distortions have been increasing over time. Recent international and national tax initiatives to reduce tax-induced profit shifting have started, which should result in reduction of profit shifting in the future. The distortion problem is not limited to just a few countries, since empirical studies find profit shifting occurring in many countries. Profit shifting, however, is likely to be greater in higher-tax-rate countries and lower-tax-rate countries, including tax havens. Unfortunately, the data and analytical methodologies to estimate the distortions on a country-by-country basis are not adequate at the current time. New future data from international initiatives will provide additional insights, but reliable estimates of profit shifting at the individual country level require significant improvements in both data and estimation techniques. Given the incomplete data and imprecise estimation of profit shifting to date, it would be unrealistic to attempt to make adjustments to historical data series for the tax-induced distortions. The significance of the statistical distortions and their commensurate effect on countries’ fiscal resources has focused the attention of key stakeholders on these issues. The focus should be directed at improvements in self-reported business statistics through
86 See voluntary effort in more transparent IP patent data: https://oropo.net.

45 improved international tax agreements, national tax policy changes, greater tax administration resources to ensure compliance with arms’-length transfer pricing rules, and increased data collection and analysis. Increased collaboration between national statistical offices, national tax administrations, businesses and academic researchers is needed to continue improvements of these national statistics measures of cross-border IP flows.

46 Re f e r e nc e s Athreye, S., & Yang, Y. (2011). Disembodied knowledge flows in the world economy. Background Report to the WIPO 2011 World Intellectual Property Report. Published as WIPO Economic Research Working Papers, No. 3, Geneva: WIPO Australia (2014), Parliament of Australia: Inquiry into tax disputes, www.aph.gov.au/Parliamentary_Business/Committees/House/Tax_and_Revenue/Inquiry_into_Tax_Disputes (accessed 19 December 2014) Bank of Italy (2016), The technology balance of payments and the changeover to the 6th edition of the IMF Balance of Payments Manual, https://www.bancaditalia.it/statistiche/tematiche/rapporti-estero/scambi-tecnologia/The_technology_balance_of_payments_and_the_changeover_to_the_6th_edition_of_the_IMF_Manual.pdf?language_id=1 BEA (2016), U.S. International Services Trade in Services in 2015 and Services Supplied Through Affiliates in 2014, U.S. International Services. December Becker, J. and N. Riedel (2012), “Cross-border tax effects on affiliate investment — Evidence from European multinationals”, European Economic Review, Vol. 56, pp. 436–450 Beer, S. and J. Loeprick (2013), Profit shifting: Drivers and potential countermeasures, WU International Taxation Research Paper Series, No. 2013-03, http://dx.doi.org/10.2139/ssrn.2271539 Beer, S. and J. Loeprick (2014), “Profit shifting: drivers of transfer (mis)pricing and the potential of countermeasures”, International Tax and Public Finance, No. 1 Bernard, Andrew B., J. Bradford Jensen and Pete K. Schott (2006), “Transfer pricing by U.S.-based multinational firms”, NBER Working Paper, No. 12493 Blouin, Jennifer L. and Leslie A. Robinson, and Jeri K. Seidman (2016), Conflicting Transfer Pricing Incentives and the Role of Coordination, Tuck School of Business Working Paper No. 2010-74. Available at SSRN: https://ssrn.com/abstract=1609697 Boehm, T., T. Karkinsky and N. Riedel (2012), “The Impact of Corporate Taxes on R&D and Patent Holdings”, Paper Presented at the NBER TAPES Conference, University of Oxford, 2012 Clausing, K. A. (2003), “Tax-motivated transfer pricing and US intrafirm trade”, Journal of Public Economics, 87(9-10), 2207-2223 Clausing, K. A. (2011), “The revenue effects of multinational form income shifting”, Tax Notes, Tax Analysts, Available at SSRN: http://ssrn.com/abstract=2488860 Clausing, K. A. (2016), “The effect of profit shifting on the corporate tax based in the United States and beyond,” National Tax Journal, 69(4), 905-934 Clausing, K.A. (2009), “Multinational firm tax avoidance and tax policy”, National Tax Journal, Vol. 62, No 4 Cristea, Anca D. and Daniel X. Nguyen (2014), “Transfer pricing by multinational firms: New evidence from foreign firm ownerships”, University of Copenhagen Davies, Ronald B., Julien Martin, Mathieu Parenti and Farid Toubal (2014), “Knocking on tax haven’s door: Multinational firms and transfer pricing”, CEPII Working Paper, No. 2014-21
47 De Haan, M., Connolly, M., Peltola, R., and T. Dimova (2014), Measuring Global Production in the National Accounts and the Balance of Payments, Paper Prepared for the IARIW 33rd General Conference, Rotterdam, the Netherlands, August 24-30, 2014 De Mooij, R. A. and S. Ederveen (2008), “Corporate tax elasticities: a reader’s guide to empirical findings”, Working Paper 8/22, Oxford University Centre for Business Taxation Dharmapala, D. (2014), “What do we know about base erosion and profit shifting? A review of the empirical literature”, Fiscal Studies, Vol. 35, pp. 421–448 Dischinger, Matthias and Nadine Riedel (2011), “Corporate taxes and the location of intangible assets within multinational firms”, Journal of Public Economics 95, pp. 691-707 Dowd, Tim, Paul Landefeld, and Anne Moore, (2017) “Profit shifting of U.S. multinationals,” Journal of Public Economics, 148, 1-13 European Commission (2014), State aid: Commission extends information enquiry on tax rulings practice to all member states, http://europa.eu/rapid/press-release_IP-14-2742_en.htm (accessed 8 January 2014) European Commission (2015), “Patent boxes design, patents location and local R&D”, IPTS Working Papers on Corporate R&D and Innovation, No. 6/2015 European Commission (2016), Decision on State Aid implemented by Ireland to Apple (http://ec.europa.eu/competition/state_aid/cases/253200/253200_1851004_666_2.pdf European Union (2016), State Aid Apple/Ireland press release, http://europa.eu/rapid/press-release_IP-16-2923_en.htm Evers, L., H. Miller, C. Spengel (2013), “Intellectual property box regimes: Effective tax rates and tax policy considerations”, ZEW Discussion Papers, No. 13-070 EY (2014), Bridging the Divide: Highlights of the 2014 Tax Risk and Controversy Survey FAPESP, 2010 Brazil Chapter 6 Technology balance of payments: a renewed perspective 6 – 10 science, technology & innovation indicators in the state of são paulo/brazil – 2010 Feld, L. and J. Heckemeyer (2011), “FDI and Taxation: A Meta-Study”, Journal of Economic Surveys (2011) Vol. 25, No. 2 Fetzer, James J., Raymond J. Mataloni Jr., and Sarahelen Thompson (2017), “BEA’s Initiative to Expand and Reconcile Trade in Services Statistics: New Detail for Improved Analysis,” mimeo, April 11 https://www.gtap.agecon.purdue.edu/resources/download/8436.pdf Fuest, C. and N. Riedel (2010), “Tax Evasion and Tax Avoidance in Developing Countries: The Role of International Profit Shifting”, Oxford University Centre for Business Taxation Working Papers, 10/12 Fuest, C. and N. Riedel (2012), “Tax Evasion and Tax Avoidance: The Role of International Profit Shifting”, in Draining Development? editor P. Reuter, the World Bank Fuest, C., S. Hebous and N. Riedel (2011), “International debt shifting and multinational firms in developing economies”, Economics Letters, pp. 135-138 Gereffi, G., J. Humphrey and T. Sturgeon (2005) The governance of global value chains, Review of International Political Economy vol. 12(1)
Godin. B. (2004). Measurement and Statistics on Science and Technology: 1920 to the Present. (Routledge Studies in the History of Science, Technology, and Medicine.) xx + 360 pp., apps., index. London/New York: Routledge

48 Griffith, R., H. Miller and M. O’Connell (2011), “Corporate taxes and the location of intellectual property”, CEPR Discussion Papers 8424 Griffith, R., H. Miller and M. O’Connell (2014), “Ownership of intellectual property and corporate taxation”, Journal of Public Economics 112 Grindley, P.C and D.J. Teece (1997). “Managing Intellectual Capital: Licensing and Cross-Licensing in Semiconductors and Electronics,” California Management Review 39(2): 1-34 Grubert, H. and J. Mutti (1991), “Taxes, Tariffs and Transfer Pricing in Multinational Corporate Decision Making”, The Review of Economics and Statistics, Vol. 73, No. 2, pp. 285-293 Grubert, Harry (1998), “Taxes and the division of foreign operating income among royalties, interest, dividends and retained earnings”, Journal of Public Economics 68, pp. 269-290 Grubert, Harry (2003), “Intangible income, intercompany transactions, income shifting, and the choice of location”, National Tax Journal 56, pp. 221-242 Guvenen, Fatih, Raymond J. Mataloni, Jr., Dylan G. Rassier, and Kim J. Ruhl (2017), “Offshore Profit Shifting and Domestic Productivity Measurement,” National Bureau of Economic Research Working Paper 23324 Halligan, Stephen P. (2015), “The Impact of the Standard of Value on Transfer Pricing and Financial Accounting in the United States” http://www.willamette.com/insights_journal/15/winter_2015_4.pdf Hanlon, M. and S. Heitzman (2010), “A Review of Tax Research,” Journal of Accounting and Economics 50 (2-3), 127-178 Harpez, Joe (2015), “BEPS rears its head in Amazon European tax policy shift,” Forbes (May 29). https://www.forbes.com/sites/joeharpaz/2015/05/29/beps-rears-its-head-in-amazon-european-tax-policy-shift/#75ed48fe3e94 Haskell, Jonathan and Stian Westlake (2017), Capitalism without Capital, Princeton University Press. Heckemeyer, J. H. and M. Overesch (2013), “Multinationals’ profit response to tax differentials: Effect size and shifting channels”, ZEW Discussion Paper No. 13-045 Hoeren, Thomas, Guadagno, Francesca and Wunsch-Vincent, Sacha, (2015), Breakthrough technologies – Semiconductor, innovation and intellectual property, No 27, WIPO Economic Research Working Papers, World Intellectual Property Organization - Economics and Statistics Division. House of Lords Select Committee on Economic Affairs (2013), Tackling corporate tax avoidance in a global economy: is a new approach needed?, First Report of Session 2013–14, www.publications.parliament.uk/pa/ld201314/ldselect/ldeconaf/48/48.pdf (accessed 14 October 2014) IMF (2009). Balance of Payments and International Investment Position Manual, Sixth Edition (BPM6). Washington D.C.: International Monetary Fund. IMF (2012). Changing Patterns of Global Trade (Strategy, Policy, and Review Department Paper). www.imf.org/external/pubs/ft/dp/2012/dp1201.pdf IMF (2013), “Taxing Times,” Fiscal Monitor, October

49 IMF (2016), Ireland Country Report No. 16/256, Article IV Consultation and Fifth Post program Monitoring—Press Release; And Staff Report, June 2016, https://www.imf.org/external/pubs/ft/scr/2016/cr16256.pdf International Monetary Fund (2014, “Spillovers in International Corporate Taxation”, IMF Policy paper. Ireland National Central Statistics Office (2017), Information Notice: National Accounts and Balance of Payments, FAQ (9 March) Karkinsky, T. and N. Riedel (2012), “Corporate Taxation and the Location of Patents within Multinational Firms”, 2012, Journal of International Economics, 88(1), pp. 176185. Klassen, Kenneth J., Petro Lisowsky, and Devan Mescall (2017), “Transfer Pricing: Strategies, Practices, and Tax Minimization,” Contemporary Accounting Research, Vol. 34, No. 1 Kleinbard, Edward D., Through a Latte, Darkly: Starbucks's Stateless Income Planning (July 15, 2013). Tax Notes, June 24, 2013, pp. 1515-1535; USC CLEO Research Paper No. C13-9; USC Law Legal Studies Paper No. 13-10. Available at SSRN: https://ssrn.com/abstract=2264384 Koncz-Bruner, J. & Flatness, A. (2010). U.S. International Services Cross- Border Trade in 2009 and Services Supplied Through Affiliates in 2008. Washington, D.C.: US Bureau of Economic Analysis Kumar, N. (1998). ed., Globalization, Foreign Direct Investment and Technology Transfers (London and New York: Routledge) Lanz, R. and S. Miroudot (2011), Intra-firm trade: Patterns, determinants and policy implications, OECD Trade Policy Papers, No. 114 Lipsey, R. E. (2010), “Measuring the location of production in a world of intangible productive assets, FDI and intrafirm trade”, Review of Income and Wealth, Series 56, Special Issue No. 1 Lohse, T. and N. Riedel (2012), “The impact of transfer pricing regulations on profit shifting within European multinationals”, FZID Discussion Papers, No. 61 Lohse, T. and N. Riedel (2013), “Do transfer pricing laws limit international income shifting? Evidence from European multinationals”, Oxford University Centre for Business Taxation Working Paper, No. 13/07 Lohse, T., N. Riedel and C. Spengel (2012), “The Increasing Importance of Transfer Pricing Regulations – a Worldwide Overview”, Oxford University Centre for Business Taxation Working Paper, No. 12 Lutz, M. C. V. , Orind, V., Carvalho, S. M. P., Filgueiras Jorge, M., & Pinheiro, V. (2013). “Is the licensing in of foreign brands and franchises increasing? Evidence from Brazil”, Unpublished background research for the 2013 World Intellectual Property Report. Coordenação Geral de Contratos de Tecnologia (CGTEC) da Diretoria de Contratos, Indicações Geográficas e Registros (DICIG) e Assessoria para Assuntos Econômicos (AECON), Instituto Nacional da Propriedade Industrial (INPI). Rio de Janeiro Madeuf, B. (1984) International technology transfers and international technology payments: Definitions, measurement and firms' behaviour, Research Policy, Volume 13, Issue 3, 1984, Pages 125-140 Magdeleine, Joscelyn, and Andreas Maurer (2016), “Understanding trade in digitized ideas – What are the statistical challenges,” World Trade Organization Working Paper ERSD-2016-11, June

50 McDonald, M. (2008), “Income shifting from transfer pricing: Further evidence from tax return data”, U.S. Department of the Treasury, Office of Tax Analysis, OTA Technical Working Paper 2 McDonald’s EC press release European Commission press release, 2015, “State Aid: Commission opens formal investigation into Luxembourg’s tax treatment of McDonald’s http://europa.eu/rapid/press-release_IP-15-6221_en.htm OECD (1990). Proposed Standard Method of Compiling and Interpreting the Technology Balance of Payments Data (TBP Manual) OECD, 2010. Handbook on Deriving Capital Measures of Intellectual Property Products, OECD Publishing, Paris OECD (2013), Action Plan on Base Erosion and Profit Shifting, OECD Publishing, Paris, http://dx.doi.org/10.1787/9789264202719-en OECD (2014) Handbook on Deriving Capital Measures of Intellectual Property Products, OECD Publishing, Paris OECD (2015), Measuring and Monitoring BEPS, Action 11 - 2015 Final Report, OECD/G20 Base Erosion and Profit Shifting Project, OECD Publishing, Paris. http://dx.doi.org/10.1787/9789264241343-en OECD (2015a), Aligning Transfer Pricing Outcomes with Value Creation, Actions 8-10 - 2015 Final Reports, OECD/G20 Base Erosion and Profit Shifting Project, OECD Publishing, Paris, http://dx.doi.org/10.1787/9789264241244-en OECD (2015b), Limiting Base Erosion Involving Interest Deductions and Other Financial Payments, Action 4 - 2015 Final Report, OECD/G20 Base Erosion and Profit Shifting Project, OECD Publishing, Paris, http://dx.doi.org/10.1787/9789264241176-en OECD (2015c), Addressing the Tax Challenges of the Digital Economy, Action 1 - 2015 Final Report, OECD/G20 Base Erosion and Profit Shifting Project, OECD Publishing, Paris, http://dx.doi.org/10.1787/9789264241046-en OECD (2015d), Neutralising the Effects of Hybrid Mismatch Arrangements, Action 2 - 2015 Final Report, OECD/G20 Base Erosion and Profit Shifting Project, OECD Publishing, Paris, http://dx.doi.org/10.1787/9789264241138-en OECD (2015e), Designing Effective Controlled Foreign Company Rules, Action 3 - 2015 Final Report, OECD/G20 Base Erosion and Profit Shifting Project, OECD Publishing, Paris, http://dx.doi.org/10.1787/9789264241152-en OECD (2015f), Countering Harmful Tax Practices More Effectively, Taking into Account Transparency and Substance, Action 5 - 2015 Final Report, OECD/G20 Base Erosion and Profit Shifting Project, OECD Publishing, Paris, http://dx.doi.org/10.1787/9789264241190-en OECD (2015g), Preventing the Granting of Treaty Benefits in Inappropriate Circumstances, Action 6 - 2015 Final Report, OECD/G20 Base Erosion and Profit Shifting Project, OECD Publishing, Paris, http://dx.doi.org/10.1787/9789264241695-en
OECD (2015h), Preventing the Artificial Avoidance of Permanent Establishment Status, Action 7 - 2015 Final Report, OECD/G20 Base Erosion and Profit Shifting Project, OECD Publishing, Paris, http://dx.doi.org/10.1787/9789264241220-en
OECD (2015i), Measuring and Monitoring BEPS, Action 11 - 2015 Final Report, OECD/G20 Base Erosion and Profit Shifting Project, OECD Publishing, Paris, http://dx.doi.org/10.1787/9789264241343-en

51 OECD (2015j), Mandatory Disclosure Rules, Action 12 - 2015 Final Report, OECD/G20 Base Erosion and Profit Shifting Project, OECD Publishing, Paris, http://dx.doi.org/10.1787/9789264241442-en OECD (2015k), Transfer Pricing Documentation and Country-by-Country Reporting, Action 13 - 2015 Final Report, OECD/G20 Base Erosion and Profit Shifting Project, OECD Publishing, Paris, http://dx.doi.org/10.1787/9789264241480-en OECD (2015l), Making Dispute Resolution Mechanisms More Effective, Action 14 - 2015 Final Report, OECD/G20 Base Erosion and Profit Shifting Project, OECD Publishing, Paris, http://dx.doi.org/10.1787/9789264241633-en OECD (2015m), Developing a Multilateral Instrument to Modify Bilateral Tax Treaties, Action 15 -2015 Final Report, OECD/G20 Base Erosion and Profit Shifting Project, OECD Publishing, Paris, http://dx.doi.org/10.1787/9789264241688-en OECD 2005 Measuring Globalisation: OECD Handbook on Economic Globalisation Indicators 2005. Front Cover. OECD. OECD Publishing, June 1, 2005 OECD and WTO (2012), Trade in value-added: Concepts, methodologies, and challenges (Joint OECD-WTO Note), www.oecd.org/sti/ind/49894138.pdf OECD, (2016), OECD Quarterly International Trade Statistics, Volume 2016 Issue 3 Overesch, Michael (2006), “Transfer pricing of intrafirm sales as a profit shifting channel: Evidence from German firm data”, ZEW Discussion Papers, No. 06-84 PwC (2011), “Tax Accounting Services: The impact of transfer pricing in financial reports,” https://www.pwc.com/us/en/tax-accounting-services/newsletters/tax-accounting/assets/pwc-tp-financial-reporting.pdf Raisser, Dylan G. (2015), “Characteristics of Special Purpose Entities in Measures of U.S. Direct Investment Abroad,” https://www.bea.gov/papers/pdf/characteristics-of-special-purpose-entities-in-measures-of-us-direct-investment-abroad.pdf Rassier, Dylan G., and Jennifer Koncz-Bruner (2015) "A Formulary Approach for Attributing Measured Production to Foreign Affiliates of U.S. Parents." In Measuring Globalization: Better Trade Statistics for Better Policy - Volume 2. Factoryless Manufacturing, Global Supply Chains, and Trade in Intangibles and Data, Susan N. Houseman and Michael Mandel, eds. Kalamazoo, MI: W.E. Upjohn Institute for Employment Research, pp. 229-262. http://dx.doi.org/10.17848/9780880994903.vol2ch8 Riedel, N. (2015), “Quantifying international tax avoidance: A review of academic literature”, European Tax Policy Forum Policy Paper No. 2, www.etpf.org/papers/PP002QuantAvoid.pdf Riker, D (2014), Intellectual Property Rights and International Receipts of Royalties, Office of Economics Working Paper U.S. International Trade Commission, U.S. International Trade Commission August 2014 Robbins, C.A. (2006). Measuring Payments for the Supply and Use of Intellectual Property Prepared for NBER-CRIW International Service Flows Conference April 29, 2006, 7th OECD International Trade Statistics Expert Meeting. Robbins, C.A. (2009). Measuring Payments for the Supply and Use of Intellectual Property. in M. Reinsdorf & M.J. Slaughter (Eds.), International Trade in Services and Intangibles in the Era of Globalization. Chicago: University of Chicago Press
Schindler, Dirk, and Guttorm Schjelderup (2013), “Transfer Pricing and Debt Shifting in Multinationals”, CESifo Working Paper Series, No. 4381

52 Spengel, Christoph and York Zollkau (2012), Common Corporate tax Base (CC(C)TB) and Determination of Taxable Income: An International Comparison, Springer-Verlag Berlin Heidelberg Starbucks decision European Commission Decision on State Aid implemented by the Netherlands to Starbucks (2015) http://ec.europa.eu/competition/state_aid/cases/253201/253201_1762441_575_2.pdf Sullivan, M. A. (2010), Transfer Pricing Issues in a Global Economy, Testimony before the US House of Representatives Ways and Means Committee, July 22, 2010 The Globe and Mail (2011), Daimler pays $1.5-billion to end tax fight, The Globe and Mail, 2/28/2011 The New York Times (2011), Astra Zeneca to Settle Tax Issues for $1.1 Billion, The New York Times, 3/28/2011 The Platform for Collaboration on Tax (2017), Discussion Draft:A Toolkit for Addressing Difficulties in Accessing Comparable Data for Transfer Pricing Analyses Timmer, Marcel P, Abdul Azeez Erumban, Bart Los, Robert Stehrer and Gaaitzen J. de Vries (2014) "Slicing Up Global Value Chains." Journal of Economic Perspectives, 28(2): 99-118 United Nations Economic Commission for Europe (UNECE) (2015) Guide to Measuring Global Production, Geneva: United Nations Economic Commission for Europe (in particular, Chapter 7 on International transactions in intellectual property products), http://www.unece.org/fileadmin/DAM/stats/publications/2015/Guide_to_Measuring_Global_Production__2015_.pdf UN, IMF, OECD, Eurostat, and World Bank. (2008) System of National Accounts 2008, New York, 2009 UN, IMF, OECD, Eurostat, UNCTAD, UNWTO, & WTO. (2011). Manual on Statistics of International Trade in Services 2010 (MSITS 2010). Geneva, Luxembourg, Madrid, New York, Paris and Washington D.C.: United Nations, IMF, OECD, Statistical Office of the European Union, United Nations Conference on Trade and Development, World Tourism Organization and WTO UNCTAD (2015a), “FDI, tax and development”, UNCTAD Investment and Enterprise Division Working Paper UNCTAD (2015b), World Investment Report 2015: Reforming international investment governance, UN Reference: UNCTAD/WIR/2015 United Kingdom (2015), Parliament: Commons Select Committee on Tax avoidance and evasion, www.parliament.uk/business/committees/committees-a-z/commons-select/public-accounts-committee/inquiries/parliament-2010/tax-avoidance-evasion-hsbc/ (accessed 19 December 2014) United States Homeland Security & Governmental Affairs (2013), US Senate Subcommittee on permanent investigations, www.hsgac.senate.gov/subcommittees/investigations/hearings/offshore-profit-shifting-and-the-us-tax-code_-part-2 (accessed 2 February 2015) US Today (2006), Glaxo to Pay $3.4B to Settle Biggest Tax Dispute in History, 11 Sept. Vicard, Vincent (2015), “Profit shifting through transfer pricing: Evidence from French firm level trade data”, Banque de France Working Paper No. 555. DOI: http://dx.doi.org/10.2139/ssrn.2614864

53 WIPO (2011a) The Changing Nature of Innovation and Intellectual Property, Chapter 1 (pp. 23-72), in World IP Report 2011, Geneva: WIPO WIPO (2011b) The Economics of Intellectual Property – old Insights and new Evidence, Chapter 2 (pp. 75-107), in World IP Report 2011, Geneva: WIPO WIPO (2013) Chapter 1: Branding in the Global Economy, Chapter 1 (pp. 21-79), in: World IP Report 2013, Brands – Reputation and Image in the Global Marketplace, Geneva: WIPO Zinn, B. and C. Spengel (2012), “Book/tax Conformity: Empirical Evidence from Germany”, ZEW Discussion Paper, No. 12-051

54 L i s t o f Ac r o n ym s AETR Average effective tax rate BEA Bureau of Economic Analysis (U.S.) BEPS Base erosion and profit shifting BPM6 Balance of Payments and International Investment Position Manual,
6th edition, IMF BRIC Brazil, Russia, India and China CbCR Country-by-country reports CIT Corporate income tax CUIP Charges for the use of intellectual property EBOPS Extended Balance of Payments Services classification FDI Foreign direct investment GAAP Generally accepted accounting priniciples G20 Group of Twenty countries INPI National Industrial Property Institute IPP Intellectual property products METR Marginal effective tax rate MNE Multinational enterprises MSITS Manual on Statistics of International Trade in Services OECD Organization for Economic Cooperation and Development PE Permanent establishment RLF Royalties and license fees SMTR Statutory marginal tax rate SOE State-owned enterprises SPE Special purpose entities TBP Technology Balance of Payments (OECD) UNCTAD United Nations Conference on Trade and Development UNECE United Nations Economic Commission for Europe .

55 Ann e x 1 : I n f ogr a ph i c s o f Thr e e Re c e n t Eur ope a n C o m m i s s i on S t a t e Ai d Ca s e s w i t h r e s pe c t t o t a x p l a nn i n g i n vo l v i n g i n t a ng i b l e s a nd r o ya l t i e s Example 1: Apple/Ireland case involving attribution of profits to Irish company from European sales, with small percentage of profits attributed to Irish branch, and some royalties paid to headquarters
http://ec.europa.eu/competition/publications/infographics/2016_07_en.pdf
Example 2: McDonald’s/Luxembourg case involving royalties paid from European franchisees to headquarter company in Luxembourg with royalties then paid to Swiss and US branches
http://ec.europa.eu/competition/publications/infographics/2015_09_en.pdf
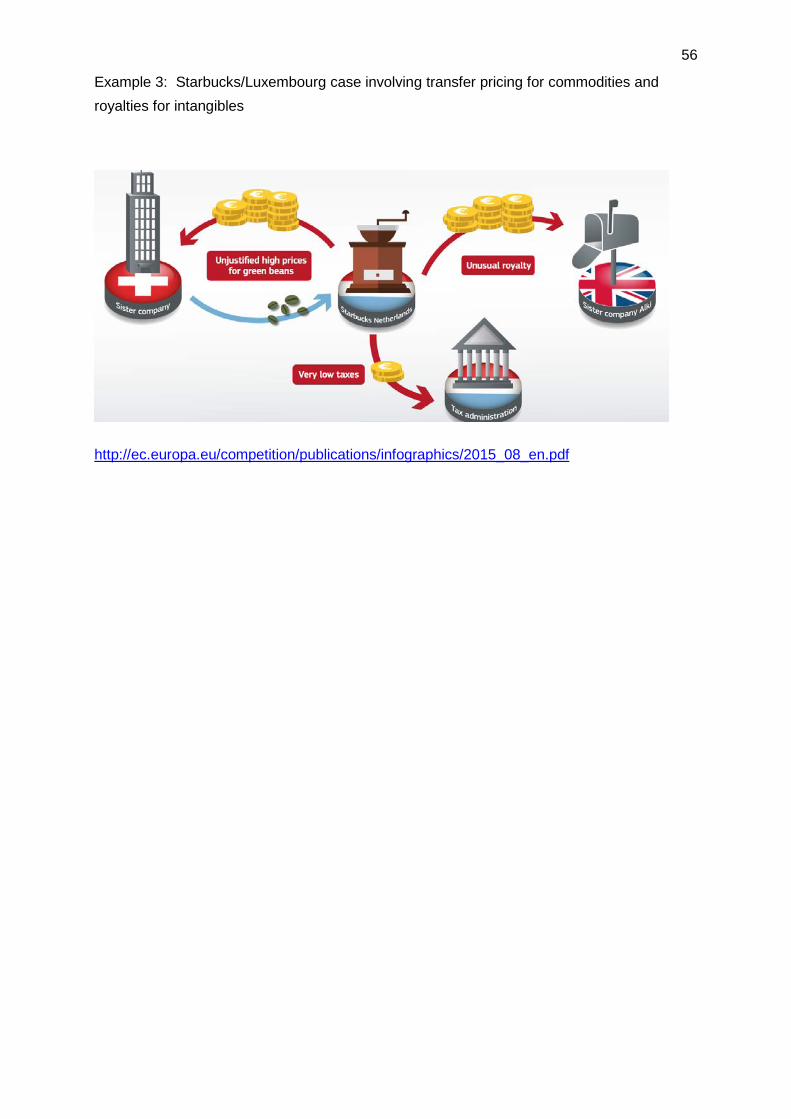
56
Example 3: Starbucks/Luxembourg case involving transfer pricing for commodities and royalties for intangibles
http://ec.europa.eu/competition/publications/infographics/2015_08_en.pdf
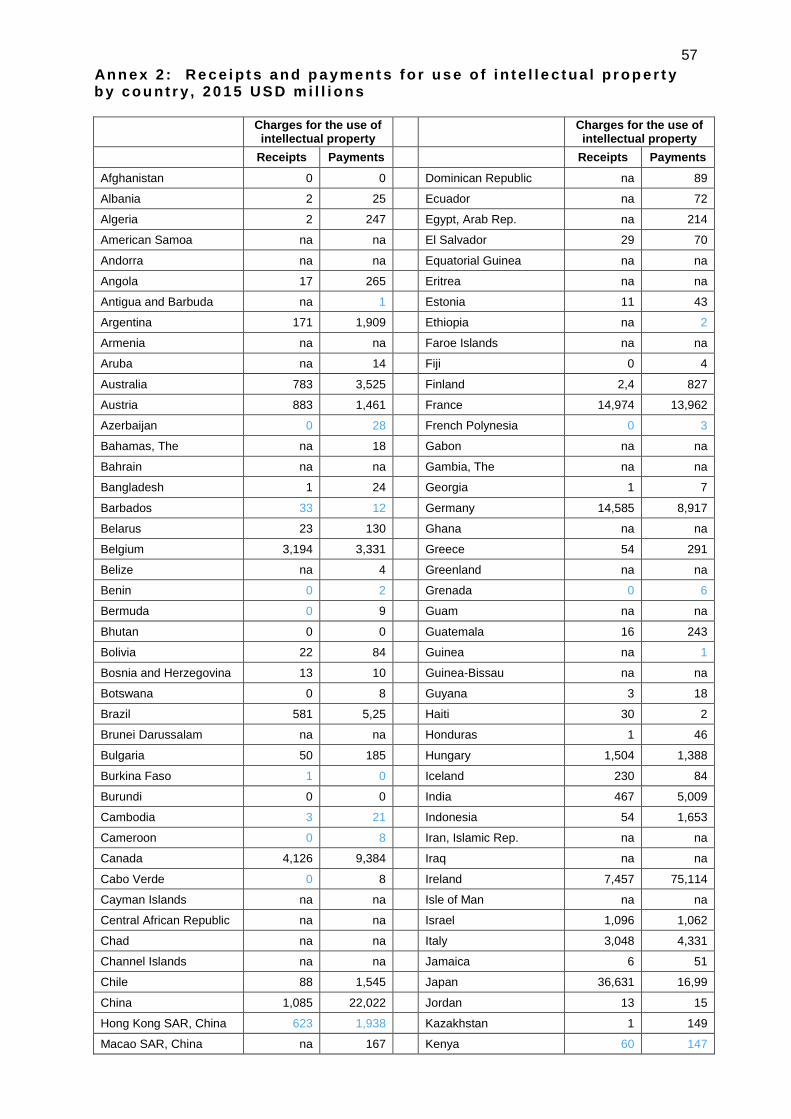
57 Ann e x 2 : Re c e i p t s a nd p a ym e nt s f o r us e o f i n t e l l e c t ua l p r op e r t y b y c ou nt r y , 2 0 1 5 US D m i l l i o ns
Charges for the use of intellectual property
Charges for the use of intellectual property
Receipts Payments
Receipts Payments
Afghanistan 0 0 Dominican Republic na 89
Albania 2 25 Ecuador na 72
Algeria 2 247 Egypt, Arab Rep. na 214
American Samoa na na El Salvador 29 70
Andorra na na Equatorial Guinea na na
Angola 17 265 Eritrea na na
Antigua and Barbuda na 1 Estonia 11 43
Argentina 171 1,909 Ethiopia na 2
Armenia na na Faroe Islands na na
Aruba na 14 Fiji 0 4
Australia 783 3,525 Finland 2,4 827
Austria 883 1,461 France 14,974 13,962
Azerbaijan 0 28 French Polynesia 0 3
Bahamas, The na 18 Gabon na na
Bahrain na na Gambia, The na na
Bangladesh 1 24 Georgia 1 7
Barbados 33 12 Germany 14,585 8,917
Belarus 23 130 Ghana na na
Belgium 3,194 3,331 Greece 54 291
Belize na 4 Greenland na na
Benin 0 2 Grenada 0 6
Bermuda 0 9 Guam na na
Bhutan 0 0 Guatemala 16 243
Bolivia 22 84 Guinea na 1
Bosnia and Herzegovina 13 10 Guinea-Bissau na na
Botswana 0 8 Guyana 3 18
Brazil 581 5,25 Haiti 30 2
Brunei Darussalam na na Honduras 1 46
Bulgaria 50 185 Hungary 1,504 1,388
Burkina Faso 1 0 Iceland 230 84
Burundi 0 0 India 467 5,009
Cambodia 3 21 Indonesia 54 1,653
Cameroon 0 8 Iran, Islamic Rep. na na
Canada 4,126 9,384 Iraq na na
Cabo Verde 0 8 Ireland 7,457 75,114
Cayman Islands na na Isle of Man na na
Central African Republic na na Israel 1,096 1,062
Chad na na Italy 3,048 4,331
Channel Islands na na Jamaica 6 51
Chile 88 1,545 Japan 36,631 16,99
China 1,085 22,022 Jordan 13 15
Hong Kong SAR, China 623 1,938 Kazakhstan 1 149
Macao SAR, China na 167 Kenya 60 147

58
Charges for the use of intellectual property Charges for the use of
intellectual property Receipts Payments Receipts Payments
Colombia 52 467 Kiribati na na
Comoros na na Korea, Dem. People's Rep. na na
Congo, Dem. Rep. na 11 Korea, Rep. 6,199 9,831
Congo, Rep. na na Kosovo 0 2
Costa Rica 0 517 Kuwait na na
Cote d'Ivoire 1 4 Kyrgyz Republic 1 6
Croatia 46 268 Lao PDR na na
Cuba na na Latvia 7 34
Curacao 10 26 Lebanon 24 34
Cyprus na na Lesotho 0 3
Czech Republic 466 1,203 Liberia 59 na
Denmark 2,069 1,227 Libya na na
Djibouti na na Liechtenstein na na
Dominica na 1
Lithuania 23 48
Charges for the use of intellectual property
Charges for the use of intellectual property
Receipts Payments
Receipts Payments
Luxembourg 1,611 3,129 Solomon Islands 1 5
Macedonia, FYR 9 56 Somalia na na
Madagascar 16 19 South Africa 103 1,708
Malawi na 4 South Sudan na 0
Malaysia 92 1,257 Spain 1,613 4,519
Maldives na 5 Sri Lanka na na
Mali 0 na St. Kitts and Nevis 0 2
Malta 282 429 St. Lucia na 4
Marshall Islands na na St. Martin (French) na na
Mauritania na 11 St. Vincent/Grenadines na 3
Mauritius 1 18 Sudan 0 0
Mexico 308 873 Suriname 0 20
Micronesia, Fed. Sts. na na Swaziland 0 14
Moldova 4 18 Sweden 8,828 4,173
Monaco na na Switzerland 16,178 12,932
Mongolia 2 16 Syrian Arab Republic na na
Montenegro 1 3 Tajikistan na na
Morocco 3 96 Tanzania 0 2
Mozambique 0 20 Thailand 85 4,121
Myanmar 22 272 Timor-Leste na 0
Namibia 0 10 Togo na 0
Nepal na na Tonga na na
Netherlands 39,081 47,096 Trinidad and Tobago na na
New Caledonia 1 4 Tunisia 22 21
New Zealand 305 848 Turkey na 682
Nicaragua na 1 Turkmenistan na na
Niger na na Turks and Caicos Islands na na

59
Charges for the use of intellectual property Charges for the use of
intellectual property Receipts Payments Receipts Payments
Nigeria na 258 Tuvalu 0 na
Northern Mariana Islands na na Uganda 4 14
Norway 510 570 Ukraine 85 358
Oman na na United Arab Emirates na na
Pakistan 15 180 United Kingdom 17,541 12,427
Palau na na United States 124,665 39,495
Panama 6 57 Uruguay 0 42
Papua New Guinea na na Uzbekistan na na
Paraguay na 19 Vanuatu 0 0
Peru 22 292 Venezuela, RB na 382
Philippines 11 613 Vietnam na na
Poland 415 2,431 Virgin Islands (U.S.) na na
Portugal 89 698 West Bank and Gaza 0 1
Puerto Rico na na Yemen, Rep. na 5
Qatar na na Zambia na 2
Romania 89 809 Zimbabwe 2 20
Russian Federation 726 5,634 Rwanda na 1 World 318,712 358,807
Samoa 0 2 East Asia & Pacific 48,572 78,608
San Marino na na Europe & Central Asia 137,949 209,501
Sao Tome and Principe na 0 Latin America & Caribbean 1,345 12,113
Saudi Arabia na na Middle East & North Africa 1,442 2,122
Senegal 4 6 North America 128,791 48,888
Serbia 45 180 South Asia 483 5,219
Seychelles 1 2 Sub-Saharan Africa 130 2,356
Sierra Leone 4 1 Low income 36 61
Singapore 3,302 17,285 Lower middle income 759 9,222
Sint Maarten (Dutch part) 0 2 Upper middle income 3,531 47,607
Slovak Republic 26 522 High income 314,386 301,917
Slovenia 58 221
Blue statistics show the Most Recent Value (MRV) if data for the specified year or full period are not available; or growth rate is calculated for less than the full period.


![Patent Working Requirements: Historical and Comparative ... · Trimble_First to Printer (Do Not Delete) 5/21/2017 11:37 AM 2016] PATENT WORKING REQUIREMENTS 485 has fluctuated over](https://img.pdfslide.net/doc/110x75/5e1cb8ef8f7b032b2d05ab44/patent-working-requirements-historical-and-comparative-trimblefirst-to-printer.jpg)