Embed Size (px)
Citation preview

ECONOMIC SCIENCE FOR RURAL
DEVELOPMENT
Rural Development and Entrepreneurship
№ 39 Jelgava
2015

2
ISSN 1691-3078 ISSN 2255-9930 on line
ISBN 978-9984-48-189-0 on line
Abstracted / Indexed: ISI Web of Science, AGRIS, CAB Abstracts and
EBSCOHost Academic Search Complete databases http://www.esaf.llu.lv/journals-and-proceedings
www.fao.org/agris/
http://search.ebscohost.com/login.aspx?authtype=ip,uid&profile=ehost&defaultdb=lbh
http://search.ebscohost.com/login.aspx?direct=true&db=a9h&jid=25AP&site=ehost-live

3
The Conference Committee
Professor Baiba Rivza
Professor Andra Zvirbule-Berzina
Professor Irina Pilvere
Professor Barbara Freytag-Leyer
Professor Bo Öhlmer
Professor Bartosz Mickiewicz
Professor Maria Parlinska
Professor Alina Danilowska
Professor Janina Sawicka
Professor Joanna Szwacka-Mokrzycka
Professor Arild Sæther
Professor Vilija Alekneviciene
Professor Csaba Forgacs
Senior Researcher Magnar Forbord
Professor Ingrida Jakusonoka
Professor Aina Dobele
Professor Modrite Pelse
Associate professor Gunita Mazure
Associate professor Aija Eglite
Associate professor Janis Kusis
Associate professor Gunars Brazma
Associate professor Signe Dobelniece
Associate professor Anita Auzina
Latvia University of Agriculture /Latvia/
Latvia University of Agriculture /Latvia/
Latvia University of Agriculture /Latvia/
Fulda University of Applied Sciences /Germany/
Swedish University of Agricultural Sciences
/Sweden/
West Pomeranian University of Technology
/Poland/
Warsaw University of Life Sciences /Poland/
Warsaw University of Life Sciences /Poland/
Warsaw University of Life Sciences /Poland/
Warsaw University of Life Sciences /Poland/
University of Agder /Norway/
Aleksandras Stulginskis University /Lithuania/
Budapest Corvinus University /Hungary/
Centre for Rural Research /Norway/
Latvia University of Agriculture /Latvia/
Latvia University of Agriculture /Latvia/
Latvia University of Agriculture /Latvia/
Latvia University of Agriculture /Latvia/
Latvia University of Agriculture /Latvia/
Latvia University of Agriculture /Latvia/
Latvia University of Agriculture /Latvia/
Latvia University of Agriculture /Latvia/
Latvia University of Agriculture /Latvia/

4
Time schedule of the conference
Preparation of the proceedings and organization: October 2014 – April 2015
Conference: 23-24 April 2015
Researchers from the following higher education institutions, research institutions, and
professional organizations presented their scientific papers at the conference:
Mendel University in Brno
Silesian University in Opava
Estonian University of Life Sciences
Natural Resources Institute
Fulda University of Applied Sciences
Czech Republic
Czech Republic
Estonia
Finland
Germany
Latvian State Institute of Agrarian Economics Latvia
University of Latvia Latvia
Latvia University of Agriculture Latvia
Riga Technical University
Riga Stradins University
Latvia
Latvia
Vidzeme University of Applied Sciences
Latvenergo AS
State Priekuli Plant Breeding Institute
Rezekne Higher Education Institution
Ventspils University College
Riga International School of Economics and Bussiness
Administration
University College of Economics and Culture
Baltic International Academy
Baltic Psychology and Management University College
BA School of Business and Finance
Latvia
Latvia
Latvia
Latvia
Latvia
Latvia
Latvia
Latvia
Latvia
Latvia
Aleksandras Stulginskis University Lithuania
Kaunas University of Technology
Lithuanian Institute of Agrarian Economics
Lithuania
Lithuania
Vilnius Gediminas Technical University
Vytautas Magnus University
Erasmus University of Rotterdam
Lithuania
Lithuania
Netherlands
University of Warmia and Mazury in Olsztyn Poland
Warsaw University of Life Sciences Poland
West Pomeranian University of Technology in Szczecin Poland
Agricultural University in Krakow
University of Social Sciences and Humanities in Warsaw
Pope John Paul II State School of Higher Education in Biała
Podlaska
Poland
Poland
Poland
Bauman Moscow State Technical University Russia
Pennsylvania State University USA
University of Georgia USA

5
Editorial Board
The Editorial Board of the edition of the International Scientific Conference Proceedings:
Professor Ingrida Jakusonoka Latvia
Professor Irina Pilvere Latvia
Associate professor Gunita Mazure Latvia
Professor Barbara Freytag-Leyer Germany
Professor Jacques Viaene Belgium
Professor Bo Öhlmer Sweden
Professor Antoni Mickiewicz Poland
Professor Vilija Alekneviciene Lithuania
Associate professor Bruna Maria Zolin Italy
Professor Arild Sæther Norway
Assistant professor Inguna Leibus Latvia
Editor-in-chief: Associate professor Janis Kusis
Layout designer: Associate professor Gunars Brazma
The authors are responsible for the content and language of their papers.
Reviewers
Ludmila Aleksejeva
Valentina Andrejeva
Dzintra Atstaja
Dr.oec., assist.prof (Daugavpils University, Latvia)
Dr.oec. (JSC Olainfarm Chairperson of the Board, Latvia)
Dr.oec., prof. (BA School of Business and Finance, Latvia)
Anita Auzina Dr.oec., assoc.prof. (Latvia University of Agriculture)
Voldemars Bariss
Veronika Bikse
Dr.phil., assoc.prof. (Latvia University of Agriculture)
Dr.oec., prof. emeritus (Liepaja University, University of Latvia)
Dina Bite
Edgars Brekis
Dr.sc.soc., assist.prof. (Latvia University of Agriculture)
Dr.oec., assoc.prof. (University of Latvia)
Larisa Brokāne
Veronika Bugina
Zane Bulderberga
Vladimir Chalupsky
Mindaugas Dapkus
Agnieszka Dawidowicz
Dr.psych, assoc.prof. (Latvia University of Agriculture)
Dr.oec., assoc.prof (Latvia University of Agriculture)
Dr.oec., assist.prof. (Latvia University of Agriculture)
Dr.ing., assist.prof. (Brno University of Technology, Czech Republic)
PhD, assoc.prof. (Vytautas Magnus University, Lithuania)
PhD, assist.prof. (University of Warmia and Mazury in Olsztyn, Poland)
Konstantins Didenko
Dzineta Dimante
Dr.oec., prof. (Riga Technical University)
Dr.eoc., assist.prof. (University of Latvia)
Aina Dobele Dr.oec., prof. (Latvia University of Agriculture)
Lasma Dobele
Signe Dobelniece
Rolandas Drejeris
Nina Drejerska
Dr.oec., assist.prof. (Latvia University of Agriculture)
Dr.phil.soc.d., assoc.prof. (Latvia University of Agriculture)
Assoc.prof. (Aleksandras Stulginskis University, Lithuania)
PhD, assist.prof. (Warsaw University of Life Sciences, Poland)

6
Aija Eglite
Aleksandrs Fedotovs
Hertje Funke
Egle Gaule
Audrius Gargasas
Dr.oec., assoc.prof. (Latvia University of Agriculture)
Dr.oec., prof. (Riga International School of Economics and Business
Administration, Latvia)
Dr., prof. (Fachhochschule Münster, Germany)
Dr., assoc. prof. (Kaunas University of Tecnology, Lithuania)
Dr., prof. (Aleksandras Stulginskis University, Lithuania)
Gunta Grinberga-Zalite Dr.oec., assist. prof. (Latvia University of Agriculture)
Anda Grinfelde Dr.oec., assist. prof. (Latvia University of Agriculture)
Wojciech Gotkiewicz
Jurate Guscinskiene
Mara Gulbe
Jayson Harper
Janis Ievins
PhD, prof. (University of Warmia and Mazury in Olsztyn, Poland)
PhD, assoc.prof. (The General Jonas Zemaitis Military Academy of
Lithuania)
Dr.oec., prof. (University of Latvia)
Dr.oec., prof (Pennsylvania State University, USA)
Dr.oec., prof. (Riga Technical University, Latvia)
Ingrida Jakusonoka Dr.oec., prof. (Latvia University of Agriculture)
Inara Jurgena
Veronika Kajurova
Dace Kaufmane
Janis Kaulins
Dr.oec., assoc. prof. (Latvia University of Agriculture)
Ing. (Masaryk University, Czech Republic)
Dr.oec., assist.prof. (Latvia University of Agriculture)
MSc.env. (University of Latvia)
Kitija Kirila Dr.oec., assist.prof. (Latvia University of Agriculture)
Viola Korpa Dr.sc.soc., assist.prof. (Latvia University of Agriculture)
Ginta Kronberga
Juri Krusealle
Zenija Kruzmetra
Dace Klava
Dr.sc.soc., assist.prof. (Latvia University of Agriculture)
PhD (Estonian University of Life Sciences)
Dr.geogr., assist.prof. (Latvia University of Agriculture)
Dr.sc.ing. (Latvia University of Agriculture)
Bogdan Klepacki Grzegorz Koszela
Dr hab., prof. (Warsaw University of Life Sciences, Poland) PhD, assoc.prof. (Warsaw University of Life Sciences, Poland)
Krystyna Kryzanowska Dr., prof. (Warsaw University of Life Sciences, Poland)
Jüri Krusealle
Krystyna Krzyzanowska Gediminas Kuliesis
PhD, assoc. prof. (Estonian University of Life Sciences)
Dr.hab., prof. (Warsaw University of Life Sciences, Poland) Dr., senior researcher (Institute of Agrarian Economics, Lithuania)
Janis Kusis Dr.hist., assoc.prof. (Latvia University of Agriculture)
Inguna Leibus
Nina Linde
Heikki Makinen
Dr.oec., assoc.prof. (Latvia University of Agriculture)
Dr.paed. (Institute of Economics, Latvia)
Research scientist (Natural Resources institute, Finland)
Gunita Mazure Dr.oec., assoc.prof. (Latvia University of Agriculture)
Linda Medne Dr.oec., assist.prof. (Latvia University of Agriculture)
Bartosz Mickiewicz
Antoni Mickiewicz
Pawel Mickiewicz
Ingrida Millere
Jolanta Millere
Phd, prof. (West Pomeranian University of Technology in Szczecin,
Poland)
PhD, prof. (West Pomeranian University of Technology in Szczecin,
Poland)
Dr.hab, prof. (Welfare Projects Academy of Sciences in Lodz, Poland)
Dr.oec., assist.prof. (Latvia University of Agriculture)
Dr.sc.soc., assist.prof. (Latvia University of Agriculture)
Tatjana Muravska Dr.oec., prof. (University of Latvia)
Aina Muska Dr.oec., assoc. prof. (Latvia University of Agriculture)
Kaspars Naglis-Liepa
Viktors Nespors
Czeslaw Nowak
Inta Ostrovska
Juris Paiders
Liga Paula
Dr.oec., assist.prof. (Latvia University of Agriculture)
Dr.oec., prof. (Riga Technical University, Latvia)
Dr.hab., prof. (University of Agriculture in Krakow, Poland)
Dr.paed., assist.prof. (Daugavpils University, Latvia)
Dr.geogr., assist.prof. (University of Latvia)
Mg.sc.soc., lecturer (Latvia University of Agriculture)
Modrite Pelse Dr.oec., prof. (Latvia University of Agriculture)
Irina Pilvere
Andrzej Pjotr
Anne Poder
Dr.oec., prof. (Latvia University of Agriculture)
Dr.hab., prof. (University of Warsaw, Poland)
M.sc., researcher (Estonian University of Life Sciences)
7
V. Polezhaev Dr.paed., leading researcher (Institute of Information of Education,
Russia)
Dina Popluga
Arturs Praulins
Dr.eoc., assist.prof. (Latvia University of Agriculture)
Dr.oec., researcher (Latvian State Institute of Agrarian Economics)
Liga Proskina
Karlis Purmalis
Liga Rasnaca
Dr.oec., assist.prof. (Latvia University of Agriculture)
Dr.oec., assist.prof. (University of Latvia)
Dr.sc.soc., assist.prof. (University of Latvia)
Baiba Rivza Dr.hab.oec., prof. (Latvia University of Agriculture)
Valerijs Roldugins
Ritma Rungule
Juris Saulitis
Isabella Sikorska-Wolak
Dr.oec., prof. (Baltic International Academy, Latvia)
Dr.sc.soc., assoc.prof. (Riga Stradins University, Latvia)
Dr.oec., prof. (Riga Technical University, Latvia)
Dr.hab., prof. (Warsaw University of Life Sciences, Poland)
Linda Silina
Irina Solovjova
Dr.oec., assist.prof. (Latvia University of Agriculture)
Dr.oec., assist.prof. (University of Latvia)
Voldemars Strikis
Erika Sumilo
Aivars Tabuns
Tatjana Tambovceva
Dr.hab.oec., prof. (Latvia University of Agriculture)
Dr.oec., prof. (University of Latvia)
Dr.sc.soc., prof. (University of Latvia)
Assoc.prof. (Riga Technical University, Latvia)
Ilze Upite Dr.oec., assist. prof. (Latvia University of Agriculture)
Romualdas Valkauskas
Visvaldis Valtenbergs
Gintare Vaznoniene
Ants-Hannes Viira
Dr., assoc.prof. (Vilnius University, Lithuania)
Dr.sc.pol., assist.prof (Vidzeme University of Applied Sciences)
Dr., assoc.prof. (Aleksandras Stulginskis University, Lithuania)
PhD., researcher (Estonian University of Life Sciences)
Anastasija Vilcina
Inga Vilka
Dr.oec., prof. (Latvia University of Agriculture)
Dr.oec., assoc.prof. (University of Latvia)
Irija Vitola
Tatjana Volkova
Sergejs Volvenkins
Arnost Wahla
Dr.oec., prof. (Latvia University of Agriculture)
Dr.oec., prof. (BA School of Business and Finances, Latvia)
Dr.oec., prof. (Turiba University, Latvia)
Prof., RNDr. (Karel Englis College, Czech Republic)
Bogdan Wawrzyniak
Radoslaw Wisniewski
Dr.hab., prof. (Technical Environmental Univ. In Bydgoszcz, Poland)
Assoc. prof. (University of Warmia and Mazury in Olsztyn, Poland)
Ludwik Wicki
Toms Zalitis
Dr.hab., assist. prof. (Warsaw University of Life Sciences, Poland)
PhD, researcher (Latvian State Forestry Research Institute Silava)
Sandija Zeverte-Rivza Dr.oec., assist.prof. (Latvia University of Agriculture)
Aija Zobena
Leonas Zitkus
Dr.sc.soc., prof. (University of Latvia)
Dr., prof. (Kaunas University of Technology)
Anda Zvaigzne Dr.oec., assist. prof. (Latvia University of Agriculture)
Andra Zvirbule-Berzina Dr.oec., prof. (Latvia University of Agriculture)

8
Publication Ethics and Malpractice Statement for the International
Scientific Conference “Economic Science for Rural Development”
The Editorial Board is responsible for, among other, preventing publication malpractice.
Unethical behaviour is unacceptable and the authors who submit articles to the Conference
Proceedings affirm that the content of a manuscript is original. Furthermore, the authors’
submission also implies that the material of the article was not published in any other
publication; it is not and will not be presented for publication to any other publication; it does
not contain statements which do not correspond to reality, or material which may infringe
upon the intellectual property rights of another person or legal entity, and upon the conditions
and requirements of sponsors or providers of financial support; all references used in the
article are indicated and, to the extent the article incorporates text passages, figures, data or
other material from the works of others, the undersigned has obtained any necessary permits
as well as the authors undertake to indemnify and hold harmless the publisher of the
proceedings and third parties from any damage or expense that may arise in the event of a
breach of any of the guarantees.
Editors, authors, and reviewers, within the International Scientific Conference “Economic
Science for Rural Development” are to be fully committed to good publication practice and
accept the responsibility for fulfilling the following duties and responsibilities, as set by the
COPE Code of Conduct and Best Practice Guidelines for Journal Editors of the Committee on
Publication Ethics (COPE).
It is necessary to agree upon standards of expected ethical behaviour for all parties involved in
the act of publishing: the author, the editor, the peer reviewer, and the publisher.
DUTIES OF EDITORS
Publication decisions
The Editorial Board is responsible for deciding which of the articles submitted to the
Conference Proceedings should be published. The Editorial Board may be guided by the policies
of ethics and constrained by such legal requirements as shall then be in force regarding libel,
copyright infringement and plagiarism. The editor may confer with other editors or reviewers in
making this decision.
Fair play
An editor at any time evaluate manuscripts for their intellectual content without regard to the
nature of the authors or the host institution including race, gender, sexual orientation,
religious belief, ethnic origin, citizenship, or political philosophy of the authors.
Confidentiality
The editor and any editorial staff must not disclose any information about a submitted
manuscript to anyone other than the corresponding author, reviewers, potential reviewers,
other editorial advisers, and the publisher, as appropriate.
Disclosure and conflicts of interest
Unpublished materials disclosed in a submitted manuscript must not be used in an editor’s own
research without the express written consent of the author.
DUTIES OF REVIEWERS
Every submitted manuscript has been reviewed by one reviewer from the author’s native
country or university, while the other reviewer came from another country or university. The
third reviewer was chosen in the case of conflicting reviews. All reviewers were anonymous for

9
the authors of the articles, and the reviewers presented blind reviews. Every author received
the reviewers’ objections or recommendations. After receiving the improved (final) version of
the manuscript and the author’s comments, the Editorial Board of the conference evaluated
each article.
Contribution to editorial decisions
Peer review assists the editor in making editorial decisions and through the editorial
communications with the author may also assist the author in improving the paper.
Promptness
Any selected referee who feels unqualified to review the research reported in a manuscript or
knows that its prompt review will be impossible should notify the editor and excuse himself
from the review process.
Confidentiality
Any manuscripts received for review must be treated as confidential documents. They must
not be shown to or discussed with others except as authorised by the editor.
Standards of objectivity
Reviews should be conducted objectively. Personal criticism of the author is inappropriate.
Referees should express their views clearly with supporting arguments.
Acknowledgement of sources
Reviewers should identify relevant published work that has not been cited by the authors. Any
statement that an observation, derivation, or argument had been previously reported should
be accompanied by the relevant citation. A reviewer should also call to the editor's attention
any substantial similarity or overlap between the manuscript under consideration and any
other published paper of which they have personal knowledge.
Disclosure and conflict of interest
Privileged information or ideas obtained through peer review must be kept confidential and not
used for personal advantage. Reviewers should not consider manuscripts in which they have
conflicts of interest resulting from competitive, collaborative, or other relationships or
connections with any of the authors, companies, or institutions connected to the papers.
DUTIES OF AUTHORS
Reporting standards
The authors of reports of original research should present an accurate account of the work
performed as well as an objective discussion of its significance. Underlying data should be
represented accurately in the paper. A paper should contain sufficient detail and references to
permit others to replicate the work. Fraudulent or knowingly inaccurate statements constitute
unethical behaviour and are unacceptable.
Data access and retention
The authors are asked to provide the raw data in connection with a paper for editorial review,
and should be prepared to provide public access to such data (consistent with the ALPSP-STM
Statement on Data and Databases), if practicable, and should in any event be prepared to
retain such data for a reasonable time after publication.
Originality and plagiarism
The authors should ensure that they have written entirely original works, and if the authors
have used the work and/or words of others that this has been appropriately cited or quoted.
Multiple, redundant or concurrent publication
An author should not in general publish manuscripts describing essentially the same research
in more than one journal or primary publication. Submitting the same manuscript to more than
one journal concurrently constitutes unethical publishing behaviour and is unacceptable.

10
Acknowledgement of sources
Proper acknowledgment of the work of others must always be given. The authors should cite
publications that have been influential in determining the nature of the reported work.
Authorship of the paper
Authorship should be limited to those who have made a significant contribution to the
conception, design, execution, or interpretation of the reported study. All those who have
made significant contributions should be listed as co-authors. Where there are others who
have participated in certain substantive aspects of the research project, they should be
acknowledged or listed as contributors.
The corresponding author should ensure that all appropriate co-authors and no inappropriate
co-authors are included on the paper, and that all co-authors have seen and approved the final
version of the paper and have agreed to its submission for publication.
Hazards and human or animal subjects
If the work involves chemicals, procedures or equipment that have any unusual hazards
inherent in their use, the author must clearly identify these in the manuscript.
Disclosure and conflicts of interest
All authors should disclose in their manuscript any financial or other substantive conflict of
interest that might be construed to influence the results or interpretation of their manuscript.
All sources of financial support for the project should be disclosed.
Fundamental errors in published works
When an author discovers a significant error or inaccuracy in his/her own published work, it is
the author’s obligation to promptly notify the editor or publisher and cooperate with the editor
to retract or correct the paper.
Editorial Board

11
Foreword
The international scientific conference “Economic Science for Rural Development” is
organized annually by the Faculty of Economics and Social Development of Latvia University of
Agriculture. The proceedings of the conference are published since 2000.
The scientific papers presented in the conference held on 23-24 April 2015 are
published in 4 thematic volumes:
No 37 Production and Cooperation in Agriculture
Bioeconomy
Finance and Taxes
No 38 Integrated and Sustainable Regional Development
No 39 Rural Development and Entrepreneurship
No 40 Marketing and Sustainable Consumption
New Dimensions in the Development of Society
The proceedings contain scientific papers representing not only the science of
economics in the diversity of its sub-branches, but also other social sciences (sociology,
political science), thus confirming inter-disciplinary development of the contemporary social
science.
This year for the first time the conference includes the section on a new emerging kind
of economy - bioeconomy. The aim of bioeconomy is to use renewable biological resources in a
more sustainable manner. Bioeconomy can also sustain a wide range of public goods, including
biodiversity. It can increase competitiveness, enhance Europe's self-reliance and provide jobs
and business opportunities.
The Conference Committee and Editorial Board are open to comments and
recommendations concerning the preparation of future conference proceedings and
organisation of the conference.
Acknowledgements
We would like to thank all the authors, reviewers, members of the Conference Committee and
the Editorial Board as well as supporting staff for their contribution organising the conference
and preparing the proceedings. In particular we wish to thank associate professor Signe
Dobelniece, assistant professor Zenija Kruzmetra, lecturer Baiba Miltovica, lecturer Lana
Janmere, and assistant professor Juris Vuguls.
On behalf of the Editorial Board
Gunars Brazma
Associate professor of Faculty of Economics and Social Development
Latvia University of Agriculture

12
Contents RURAL DEVELOPMENT AND ENTREPRENEURSHIP
Katarzyna Kocur-Bera, Małgorzata Dudzińska
ECONOMIC AND SPATIAL ASPECTS OF OCCURRENCE OF EXTREME EVENTS
IN RURAL AREAS...................................................................................15 Piotr Borawski, James W. Dunn, Theodore R. Alter MILK MARKET DEVELOPMENT IN THE UNITED STATES ..............................24
Magdalena Zwolińska-Ligaj THE INFLUENCE OF NATURAL VALUABLE AREAS ON THE DEVELOPMENT OF ENTREPRENEURSHIP (BASED ON THE EXAMPLE OF LUBLIN VOIVODESHIP)…34
Izabela Wielewska
ECOLOGICAL INVESTMENTS AS A NECESSARY CONDITION FOR SUSTAINABLE
DEVELOPMENT IN AGRIBUSINESS COMPANIES…………….…………………………………47
Liva Grinevica, Baiba Rivza
YOUTH LONG-TERM UNEMPLOYMENT REDUCTION OPPORTUNITIES.……………58
Bartosz Mickiewicz, Robert Jurczak
CHARACTERISTICS OF THE MULTIANNUAL FINANCIAL FRAMEWORK WITHIN THE CONTEXT OF THE COMMON AGRICULTURAL POLICY...............………………68
Anzelika Berke-Berga, Inna Dovladbekova, Erika Sumilo, Ilona Baumane-Vitolina
DEVELOPMENT OF EMPLOYEE INTEGRATION: SHARE OWNERSHIP PERSPECTIVE ...............………..........................................................………79
Jadvyga Ciburiene
AGRICULTURE IN THE CONTEXT OF ECONOMIC TRANSFORMATIONS:
LITHUANIAN CASE.........………..........................................................………89 Elzbieta Jadwiga Szymanska PROFITABILITY OF PIG FARMS IN POLAND AFTER INTEGRATION TO THE
EU.......................................................................................................97 Wioletta Bienkowska-Golasa ENTREPRENEURSHIP AND TRENDS IN DEVELOPMENT OF RURAL COMMUNES
IN POLAND ........................................................................................108 Viktorija Grigaliūnaitė, Lina Pilelienė, Arvydas Petras Bakanauskas ASSESSMENT OF THE IMPORTANCE OF BENEFITS PROVIDED BY RURAL
TOURISM HOMESTEADS IN LITHUANIA ..................................................116 Iveta Puķīte, Ineta Geipele BUSINESS INCUBATORS AS A FINANCIAL INSTRUMENT FOR NEW BUSINESS DEVELOPMENT....................................................................................124

13
Jadvyga Ciburiene FARMER`S COOPERATIVE IN THE CONTEXT OF ECONOMICS
TRANSFORMATIONS IN LITHUANIA .......................................................134
Zinta Zalite, Anda Zvaigzne, Inese Saulaja, Dzesija Zeiferte MANAGEMENT OF PRIVATE FORESTS AND ALTERNATIVES FOR ITS
IMPROVEMENT IN LATVIA.....................................................................142 Biruta Sloka, Inara Kantane, Elita Jermolajeva, Valdis Avotins PERFORMANCE EXPECTATIONS AND EVALUATIONS IN BUSINESS START....153
Agnese Krievina, Ieva Leimane, Ligita Melece ANALYSIS OF ECONOMIC ASPECTS OF LEADER PROJECTS IN LATVIA.........164 Anatolijs Prohorovs, Ingrida Jakusonoka, Ilona Beizitere IS VENTURE CAPITAL THE SOURCE OF FINANCING FOR MICRO-
ENERPRISES?.....................................................................................176 Aina Muška, Anita Auziņa FACTORS AFFECTING THE PERFORMANCE OF ACCOMODATION ENTERPRISES
IN LATVIA..........................................................................................186 Bartosz Mickiewicz, Antoni Mickiewicz REGIONAL DIFFERENTATION OF MILK PRODUCTION QUOTA IN POLAND AND ITS INFLUENCE ON THE MILK MARKET...................................................198
Bartosz Mickiewicz, Antoni Mickiewicz ANALYSIS OF ACTIVITIES IMPLEMENTED WITHIN THE AXIS III „THE QUALITY OF LIFE IN RURAL AREAS AND DIVERSIFICATION OF YHE RURAL ECONOMY“
RURAL DEVELOPMENT PROGRAMME 2007-2013.......................................208
Laura Jeroscenkova, Maiga Kruzmetra, Baiba Rivza, Vilija Alekneviciene, Agniezska
Parlińska INSTRUMENTAL VALUE OF CULTURAL HERITAGE AS A PROMOTER OF SME
IN RURAL TERRITORIES.......................................................................218 Małgorzata Zajdel, Małgorzata Michalcewicz-Kaniowska SOCIAL COOPERATIVES AS SOCIAL ECONOMY ACTORS IN THE DEVELOPMENT
OF ENTREPRENEURSHIP-BASED ON THE EXAMPLE OF THE KUJAWSKO-POMORSKIE VOIVODESHIP...................................................................227
Agnese Vaivade, Edgars Brēķis WOMEN EMPLOYMENT IN LATVIA: THE EFFECT OF FLEXICURITY PRINCIPLES INTEGRATED IN ECONOMIC POLICY……………………………………………………………….235
Dagmara K. Zuzek THE IMPORTANCE OF SMALL AND MEDIUM-SIZED ENTERPRISES IN THE DEVELOPMENT OF THE REGION ON THE EXAMPLE OF THE MALOPOLSKA
PROVINCE……………………………………………………………………………………………………….246

14
Vladimir Jefremov, Aleksandrs Rubanovskis
ELECTRIC POWER SECTOR DEVELOPMENT POTENTIAL…………………………………253

15
Proceedings of the 2015 International Conference „ECONOMIC SCINCE FOR RURAL DEVELOPMENT” No39
Jelgava, LLU ESAF, 23-24 April 2015, pp.15-23
ECONOMIC AND SPATIAL ASPECTS OF OCCURRENCE OF EXTREME
EVENTS IN RURAL AREAS
Katarzyna Kocur-Bera1*, Ph.D., Małgorzata Dudzińska2, Ph.D. 1,2 University of Warmia and Mazury in Olsztyn
Faculty of Geodesy, Geospatial and Civil Engineering (GGCE)
Department of Cadastre and Spatial Management
Abstract. Both rural and urban areas are exposed to the influence of the natural powers.
Extraordinary phenomena are difficult to predict as concerns the time and place disturbing
operation of the economy, transport, communication and they may also pose a risk to human
life. Rural areas, according to the general belief, are the areas characterised by the fact that
agricultural production is conducted there. This approach to those areas focuses the attention
mainly on the products produced in those areas and their high sensitivity to climate disorders.
Global climate changes may lead to the higher risk of sudden floods, more frequent coastal
floods, increased erosion of sea coast (more frequent storms and water level increase),
extinction of species in mountain areas, melting of glaciers, higher temperature (southern
Europe), drought as well as waves of heat and fires. The humanity has no influence on such
phenomena although we are able to introduce adaptive actions. The concept of limiting
disasters contains the fundamental assumption that the influence of the disaster may be
limited if we expect such a situation during planning of investments, development of space and
real property. The main aim of the research is an economic-spatial analysis of the losses
caused by extraordinary weather phenomena within rural areas of Warminsko-Mazurskie
voivodeship and correlation analysis. Studies have shown that attention should be focused on
the area in a direct neighborhood of the Great Masurian Lakes because there is the most
sensitive area and the losses on the examined territory are correlated with the area (looses
and agricultural lands), soil quality and with the occurrence of the negative consequences of
plant wintering. The information on the magnitude of the studied phenomenon complemented
with the spatial data on the distribution of the phenomenon represents an excellent tool for
taming management decisions in relation to the rural space.
Key words: rural space management, climate change, geoinformation
JEL code: R140
Introduction
Natural disasters, climate changes, anthropogenic threats to the space and natural
environment influence the space and the inhabitants’ lives as well as the social-economic
*Corresponding author. Tel.: +48 (89 523 45 80); fax: +48 (89 523 45 58).
E-mail adress: [email protected]

16
activities. Phenomena such as: floods, droughts, landslides, tornadoes, fires, frosts or illegal
landfill sites may lead to crop failure, lack of safety, loss of life and property, people’s
migration, pollution of the natural environment and economic losses (O’Brien et al., 2008).
Currently, climate change phenomena and the occurrence of extreme weather phenomena
result from a number of factors among which one may count: melting of the ice cap at the
poles, glacier melting at the high mountains of Austria, Switzerland, Africa, increase in the
level of the seas (Feluch, 2011) as well as deforestration and desertification, urabnisation,
changes in the land use, greenhouse effect, increase in ozone depletion (Kocur-Bera,
Dudzińska, 2014a) and many other reasons. Moreover, the increasing number of
anthropogenic threats to the space, such as hazadrous landfill sites (Kocur-Bera, Dudzińska,
2014b), or the growing number of transport vehicles emitting noxious substances to the
natural environment (Kocur-Bera, 2014, Kocur-Bera et al., 2014), causes an increasing threat
to the space. Concentration of the effects is increasing also in farming and forestry (Kurowska
et al., 2014). Europe is one of the world’s largest and most productive suppliers of food and
fibre (Olsen, Bindi, 2002). Rural areas and agriculture (among other economy sectors) are
most dependent on weather conditions. Climate change is expected to affect agriculture very
differently in different parts of the world (Parry et al., 1999). There is a large variation across
the European continent in climatic conditions, soils, land use, infrastructure, political and
economic conditions (Bouma et al., 1998, Rabbinge and van Diepen, 2000, Olsen, Bindi,
2002). The resulting effects depend on current climatic and soil conditions, the direction of
change and the availability of resources and infrastructure to cope with change. Impacts from
natural disasters and climate change on agriculture, rangeland and forestry can be positive or
negative (Sivacumar et al., 2005). Climate change principally affects agricultural crop
production in six ways: (1) directly though effects on increasing CO2 concentration on crop
productivity and resource use efficiencies, (2) directly through effects of temperature, rainfall,
radiation, humidity etc. on crop development and growth, (3) indirectly through shifts in
suitability of different crops, primarily a northward expansion of warm-season crops, (4)
directly through damages caused by extreme events such as extreme heat waves, hail and
flooding, (5) indirectly through changes in crop nutrition and occurrence of weeds, pests and
diseases, and (6) indirectly through environmental pollution (e.g. nitrate leaching) or
degradation of the resource base (e.g. soil erosion) (Olsen et al., 2011). Positive impacts
include increased rainfall to inland areas from tropical cyclones along coastal areas, the fixing
of atmospheric nitrogen by thunderstorms, the germination of many native plant species as a
result of bushfires and the maintenance of fertility of flood-plain soils due to flooding
(Sivacumar et al., 2005) as well as the possibility of tillage in the areas where it was not
possible so far (Olejnik, 2009). Also the influx of funds into disaster-relief activities after the
occurrence of natural disasters can sometimes be positive to local communities (Sivacumar et
al., 2005).

17
Climate model for Europe, prepared by the European Commission, forecasts gradual increase
of precipitation amount during winter period and its decrease during summer period. It is
estimated that climate warming will cause a major augmentation of the need of irrigation
water consumption. Currently crop production in Poland is based mainly on meteoric waters
and water retention capacity of soils (aquifers), while irrigation is limited. In the future,
limitation of the access to water may pose an obstacle to farming development in Poland.
Currently, farming in Poland is the source of 74% of the total emission of nitrous oxide and of
23% of the total emission of methane. Intensive farming is the cause of considerable
emissions resulting mainly from fertilisation, soil tillage and intensive livestock production.
Such a significant contribution to the emission of greenhouse gasses indicates that there is a
need of changes in agricultural engineering and in livestock raising methods. Within the last
two decades a 32% - reduction of greenhouse gasses from Polish farming took place. The total
emission of methane from farming sources decreased by 10%, while the emission of nitrous
oxide increased by 5%. There occurred an increase in the amount of humus, connected with
the increase of the level of fertilisation and of the amount of crop residues. A generally
beneficial balance of the influence of Polish farming on climate changes sustains thanks to
rational land economy in agricultural production processes (Halasiewicz, 2011).
There is a need for better information to support adaptation planning over the next few
decades since this is an appropriate time horizon for considering and implementing practical
and policy options to deal with climate change (Falloon, Bets, 2010). Over the recent years,
new technologies have brought about an accelerated increase in our knowledge of the climate
system. Satellites for monitoring aspects of the oceans and sparsely populated parts of the
Globe, ocean buoys and expendable bathythermographs for monitoring the physical and
chemical properties of the oceans, hundreds of specialty equipped commercial aircraft, and
manned and automatic feather stations on land, are all expanding the volume of data and
contributing to knowledge base (Sivakumar et al., 2005).
Availability of such information in advance significantly helps to take effective measures of
preventing and mitigating loss of life and property as well as of mitigating human suffering.
The main aim of the research is to present the analysis of the losses caused by extraordinary
weather phenomena in rural areas of Warminsko-Mazurskie voivodship alongside with spatial
conditions of the phenomena (location and indicators describing space) and correlation
between the amount of the losses and chosen indicators describing rural space. The analysis
allows to extend the methodical and information range about extreme events, especially on
areas where food is produced as well as to direct spatial design on vulnerable areas.
The study covered the Region of Warmia and Mazury, Poland. Its population density of 60.06
persons per km² is one of the lowest in the country (the national average is 123.24 persons
per km²), and its rural population density is estimated at only 25 persons per km². Forests
occupy nearly 30% of the region's territory. Farmland spans the area of 1.3 million ha and
covers 55% of the region's territory (the national average is 61%). The remaining land-use

18
types in Warmia and Mazury include land covered by trees and shrubs (32%), water bodies
(6%), developed land (3.5%) and other land types (3.5%). Rural areas occupy 2,359,600
hectares, i.e. 97.5% of the region's territory, and have the highest share in the country.
Warmia and Mazury comprises 21 counties which are divided into 116 municipalities, including
16 urban municipalities, 33 urban and rural municipalities and 67 rural municipalities. The
region is divided into three subregions (NTS 3) of Elblag (31% of the region's territory and
37% of the region's population), Olsztyn (43% of the region's territory and 43% of the region's
population) and Ełk (26% of the region's territory and 20% of the region's population). In
Poland and Europe, Warmia and Mazury is renowned for its rich nature and diverse natural
features such as varying land relief, lakes, forests and clean air. Nature conservation areas,
including areas that are part of pan-European programs (Natura 2000, CORINE), account for
half of the region's territory.
The study analyzed losses sustained by rural areas in the Region of Warmia and Mazury in
2012 in consequence of extreme weather events as well as information regarding the use and
conditions of agricultural production. Losses totalling nearly 10 million EUR were recorded in
37 municipalities. Data were supplied by the Regional Agricultural Advisory Center in Olsztyn,
the Central Statistical Office and the Geographical Information System. The data also come
from tables regarding the agricultural evaluation of production space on the analysed area.
Data processed in the Statistica v.10 application. The analyzed features of rural space are
listed in Table 1. The assessed parameters were selected based on a review of literature, data
availability and the researcher's decisions.
Table 1
List of diagnostic features considered during the local study
NAME OF
INDICATOR
DESCRIPTION OF INDICATOR
X1 VALUE OF GLOBAL LOSSESS [PLN]
X2 AREA LOSSES IN THE STUDIED COMMUNE [ha]
X3 EXISTING FROST
X4 EXISTING TORRENTIAL RAIN
X5 EXISTING HAIL
X6 EXISTING HURRICANES
X7 EXISTING LIGHTNING STRIKES
X8 EXISTING FLOODS OR FLOODING
X9 SURFACE WATER FLOWING AND STANDING IN THE COMMUNITY [HA]
X10 AREA OF MARSHY AND SWAMPY [HA]
X11 THE AREA OF COMMUNE [HA]
X12 THE AREAS USED FOR AGRICULTURE [HA]
X13 THE AREA OF MEADOWS / PASTURES [HA]
X14 THE AREA OF WOODED AREAS, OVERGROWN WITH BUSHES AND
FORESTS [HA]
X15 INDICATOR OF SOIL QUALITY BASED ON BONITATION COMPLEXES OF
AGRICULTURAL LAND AND AGRICULTURAL SUITABILITY OF SOILS,
ESTABLISHED FOR THE PURPOSE OF ADJUSTMENT OF AGRICULTURAL
PRODUCTION AREA IN POLAND (SOURCE: Witek et al., 1981) [SCALE
100-POINTS]
X16 CLIMATE INDEX, BASED ON CLIMATE INDEX TAKES INTO ACCOUNT
19
THE REQUIREMENTS OF THE PLANT AND THE LOCAL CLIMATIC
CONDITIONS, ESTABLISHED FOR THE PURPOSE OF ADJUSTMENT OF
AGRICULTURAL PRODUCTION AREA IN POLAND(SOURCE: Witek et al.,
1981) [SCALE 16-POINTS]
X17 INDICATOR RELIEF DEPENDS ON THE VARIETY AND GROWING
CONDITIONS, ESTABLISHED FOR THE PURPOSE OF ADJUSTMENT OF
AGRICULTURAL PRODUCTION AREA IN POLAND (SOURCE: Witek et al.,
1981) [SCALE 5-POINTS]
X18 INDICATOR OF HYDRATION DEPENDS ON SOIL MOISTURE,
ESTABLISHED FOR THE PURPOSE OF ADJUSTMENT OF AGRICULTURAL
PRODUCTION AREA IN POLAND (SOURCE: Witek et al., 1981) [SCALE
5-POINTS] Source: author’s calculation
The gathered information which regarded specific locations (geoinformation) were to indicate
whether local environmental, geographic and climatic conditions influence the aggravation of
the effects of extreme events on rural areas. The research was conducted using quantitative
and spatial analysis of the losses resulting from extreme events, as well as using Pearson’s r
correlation which enables the indication of the strength of relationship between two variable.
In order to evaluate the strength of relationship J. Guilford’s classification was used.
Research results and discussion
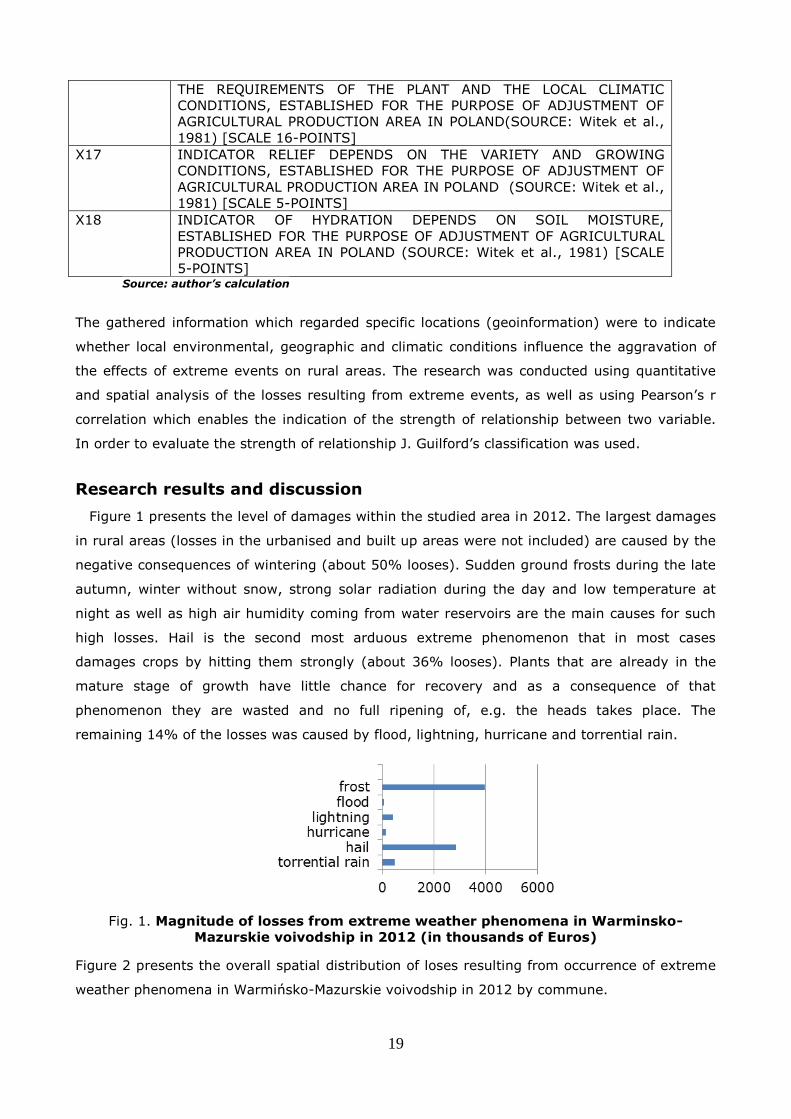
Figure 1 presents the level of damages within the studied area in 2012. The largest damages
in rural areas (losses in the urbanised and built up areas were not included) are caused by the
negative consequences of wintering (about 50% looses). Sudden ground frosts during the late
autumn, winter without snow, strong solar radiation during the day and low temperature at
night as well as high air humidity coming from water reservoirs are the main causes for such
high losses. Hail is the second most arduous extreme phenomenon that in most cases
damages crops by hitting them strongly (about 36% looses). Plants that are already in the
mature stage of growth have little chance for recovery and as a consequence of that
phenomenon they are wasted and no full ripening of, e.g. the heads takes place. The
remaining 14% of the losses was caused by flood, lightning, hurricane and torrential rain.
Fig. 1. Magnitude of losses from extreme weather phenomena in Warminsko-
Mazurskie voivodship in 2012 (in thousands of Euros)
Figure 2 presents the overall spatial distribution of loses resulting from occurrence of extreme
weather phenomena in Warmińsko-Mazurskie voivodship in 2012 by commune.

20
Fig. 2. Summary spatial distribution of losses in Warminsko-Mazurskie voivodship in
2012
The tendency for occurrence of the highest losses caused by extreme phenomena in the
central-eastern part of the covered area is clearly visible. That area covers the communes of
Budry, Reszel, Wegorzewo, Ketrzyn, Sepopol, Biskupiec Pomorski, Mragowo, Braniewo,
Bartoszyce, Korsze and Bisztynek. It is a region neighbouring with the Great Masurian Lakes.
It is characterised by a lot of lakes connected by cannals, a high rate of forest cover and varied
land relief. Figure 3 presents losses per 1 ha of agricultural land. The greatest losses were
recorded in communes: Bisztynek – 105.05 EURO/ha, Korsze – 58.43 EURO/ha, Biskupiec –
34.20 EURO/ha, Mragowo (23.55 EURO/ha), Braniewo – 27.59 EURO/ha. The remaining
communes suffered the losses of less than 20 EUR per 1 ha of agricultural land.
Fig. 3. Losses per the area of agricultural lands (Euro/ha)
The next step was to analyse the Pearson’s r correlation between the amount of the losses and
chosen indicators describing rural space. The F test for 17 independent variables and for 19
(N-m-1) cases equals F=62.40 (Fkryt. = 2.86) and consequently the hypothesis on the
insignificancy of the coefficients shall be rejected and an alternative hypothesis be adopted.
The level of significance was set at α=0.05. The calculated correlation coefficients are
presented in Figure 4.
To 20 000 Euro
20-100 000 Euro
100-200 000 Euro
above 200 000 Euro

21
Fig.4. Correlation matrix
Relationships between the amount of the losses (X1) and the indicators chosen for the
research had both positive and negative correlation. The range of correlation varied between
negligible correlation (r=0.014) and almost strong correlation (r=0.983). The relationships of
18 variables, 1 dependent variable and 17 independent variables were examined. The analysis
proved that the amount of the losses (X1) is correlated in a statistically significant way with:
the area of the losses (X2), the occurrence of the events caused by the negative consequences
of winter cereals overwintering (X3), the area of agricultural lands (X12) and the indicator of
the quality of the soils (X15). The remaining independent variables were of weak or negligible
correlation and were statistically insignificant. The created correlation matrix included the
losses in agricultural production on rural areas and the gathered data concerned crop
production (crops: barley, corn, legume mixtures, wheat, rye, sugar beet, tobacco, potatoes,
etc), vegetable and fruit production, and livestock production. The matrix showed an almost
strong correlation with the area of the cultivated lands and thus one may conclude that most
of the losses concerned crop production. The amount of the losses has a moderate positive
correlation with the X3 feature connected with the occurrence of the events causing negative
consequences of wintering such as: frosts once vegetation has begun, long snow cover
duration and plant putrefaction underneath and dry, snowless winters damaging winter crops.
The amount of the losses is also correlated in a moderate positive way with the area of the
agricultural lands on the given territory (X12) and the indicator of the quality of soils (X15).
This means that the better the soils and the greater the area of the agricultural lands with
agricultural production in the commune, the bigger the financial losses. The amount of the
financial losses connected with the occurrence of extraordinary weather events has a very low
correlation with existing torrential rain (X4), hail (X5), hurricanes (X6), lighting strikes (X7),
floods or flooding (X8) and such spatial attributes as the size of surface waters (X9), marshy
and swampy (X10), area of commune (X11), meadows, pastures (X13) and forests in the
commune (X14) as well as with the features connected with farming conditions (agroclimate –
X16, the rate of land relief – X17, soil hydration – X18,). Considering the analysed events at a
local scale, one may observe that the losses tend to occur on an area with large water bodies,
swamps and depressions, and be caused by lingering layers of cold air. Hopfer and Urban
(1986) presented recommendations for avoiding such locations regarding orchards and other

22
multi-annual crops. Correlations between the independent variables (intragroup) are low and
intermediate - level or absent. The average correlation between the independent variables
most commonly refers to a statistically insignificant variables.
Conclusion
The main aim of the research was the spatial-economic analysis of the losses connected with
the occurrence of extreme weather events on rural areas as well as the analysis of the
correlation between the indicators describing rural space and the occurring losses. The
research showed that within the analysed area there occur such events as: frosts, lightning
strikes, hurricanes, hail, flooding, torrential rains. Accumulation of these phenomena takes
place in the central part of the voivodship, in a direct neighborhood of the Great Masurian
Lakes. From the analysis of the correlation it results that the losses on the examined territory
are correlated with the area of the looses, soil quality and the area of agricultural lands in the
commune as well as with the occurrence of the negative consequences of plant wintering that
affect crops on the examined area most often and in a most severe way. It is recommended
that adaptation activities, which may effectively reduce losses resulting from these events, are
introduced on these territories. These activities involve, among others, the introduction of the
varieties of the plants which are better adapted to climate changes, shifting the sowing date,
introducing buffer strips and keeping balks, etc.
Bibliography
1. Bouma, J., Varallyay, G., Batjes, N.H. (1998). Principal Land Use Changes Anticipated in
Europe. Agric. Ecosyst. Environ, Volume 67, pp. 103–119.
2. Falloon P., Betts R. (2010). Climate Impacts on European Agriculture and Water
Management in the Context of Adaptation and Mitigation— The Importance of an Integrated
approach. Science of the Total Environment, Volume 408, pp. 5667–5687.
3. Feluch W.W. (2011). Cykliczne Przyczyny Zagrozen Gwałtownymi Zmianami Klimatu. (Cyclic
Reasons of Abrupt Climate Change Hazard). Zeszyty Naukowe SGSP, Number 41, pp. 55-79.
4. Halasiewicz A. (2011). Rozwoj Obszarów Wiejskich w Kontekscie Zroznicowan
Przestrzennych w Polsce i Budowania Spojnosci Terytorialnej Kraju. (Rural Development in the
Context of Spatial Differences in Poland and Building National Territorial Cohesion).
Ministerstwo Rozwoju Regionalnego, Warszawa.
5. Hopfer A., Urban M. (1984). Geodezyjne Urzadzanie Terenow Rolnych. (Surveying the
Development Of Agricultural Land). Wydawnictwo Naukowe PWN, Warszawa.
6. Kocur-Bera K., Dudzinska M. (2014a). Zagrozenia Srodowiska Naturalnego Warmii i Mazur -
studium przypadku. (Threats to the Natural Environment of Warmia and Mazury – case study).
Warmia i Mazury - nasze wspolne dobro. ISBN: 978-83-939380-0-1 Olsztyn.
7. Kocur-Bera K., Dudzinska M. (2014b). Spatial Conditions of Environmental Risk Posed by
Obsolete Pesticides – case study Of The “Green Lungs Of Poland” Area. Polish Journal of
Environmental Studies, Pol. J. Environ. Stud. Vol. 23 (3), pp. 763-772.
8. Kocur-Bera K. (2014). Scale-Free Network Theory in Studying the Structure of the Road
Network in Poland. PROMET - Traffic & Transportation, Vol. 26, No. 3, pp. 235-242.

23
9. Kocur-Bera K., Dudzinska M., Kowalczyk C., Kil J. (2014). Hierarchy Areas in the
Communication Network in Poland. International Conference for Traffic and Transport
Engineering - ICTTE Belgrade 2014.
10. Kurowska K., Kryszk H., Marks-Bielska R., Kietlinska E. (2014). Spatial Analysis of
Afforestation in Poland under Rural Development Programme 2007-2013. Research for Rurale
Development 2014, Vol. 2.
11. O’Brien, K. , Sygna L., Leichenko R., Adger W. Neil, Barnett J., Mitchell T., Schipper L.,
Tanner Th., Vogel C., Mortreux C. (2008). Disaster Risk Reduction, Climate Change Adaptation
and Human Security. Report prepared for the Royal Norwegian Ministry of Foreign Affairs by
the Global Environmental Change and Human Security (GECHS) Project, GECHS Report
2008:3.
12. Olesen J.E., Bindi M. (2002). Consequences of Climate Change for European Agricultural
Productivity, Land Use and Policy. European Journal of Agronomy, Volume 16 pp. 239–262.
13. Olesen J.E., Trnka M., Kersebaum K.C., Skjelvag A.O., Seguin B., Peltonen-Sainio P.,
Rossi F., Kozyra J., Micale F. (2011). Impacts and Adaptation of European Crop Production
Systems to Climate Change. Europ. J. Agronomy, Volume 34 pp. 96–112.
14. Olejnik J. (2009). Zmiany Klimatyczne i ich Wpływ na Rolnictwo w Polsce. (Climate Change
and its Impact on Agriculture in Poland). Monografia p.t.: Monografia p.t. Odnawialne zrola
energii i działania adaptacyjne do zmian klimatu w rolnictwie i na wsi – przykłady doswiadczen
UE. Wyd. Scholar, Warszawa.
15. Parry, M.L., Rosenzweig, C., Iglesias, A., Fischer, G., Livermore, M. (1999). Climate
Change and World Food Security: a New Assessment. Global Environ. Change Volume 9, pp.
51–67.
16. Parry M.L., Rosenzweig C., Iglesias A., Livermore M., Fischer G. (2004). Effects of Climate
Change on Global Food Production under SRES Emissions and Socio-Economic Scenarios.
Global Environmental Change Volume 14, pp. 53–67.
17. Rabbinge, R., van Diepen, C.A. (2000). Changes in Agriculture and Land Use in Europe.
Eur. J. Agron. Volume 13, pp. 85–100.
18. Sivakumar M.V.K., Motha R.P., Das H.P. (eds.) (2005). Natural Disasters and Extreme
Events in Agriculture. Impacts and Mitigation. Springer, p.367.
19. Witek T., Gorski T., Kern h., Bartoszewski z., Biesiacki A., Budzynska K., Demidowicz G.,
Deputat T., Flaczyk Z., Galecki Z., Ganowicz M., Gondek W., Huczynski B., Ochalska L.,
Jarubas M., Jastrzebski M., Kuczaj W., Kwiecien L., Mrozowski J., Olejniczak E., Ostrowski K.,
Partyka A., Sotniczuk M., Zbyslaw B., Langhmer L. (1981). Waloryzacja Rolniczej Przestrzeni
Produkcyjnej Polski według Gmin. (Valorisation of Polish Agricultural Production Space by
Municipalities). IUNiG Pulawy.

24
Proceedings of the 2015 International Conference „ECONOMIC SCINCE FOR RURAL DEVELOPMENT” No39 Jelgava, LLU ESAF, 23-24 April 2015, pp.24-33
MILK MARKET DEVELOPMENT IN THE UNITED STATES
Piotr Borawski* dr habil.1; James W. Dunn prof., Theodore R. Alter prof2
1 University of Warmia and Mazury in Olsztyn, Poland
2 Pennsylvania State University, University Park, Pennsylvania, USA
Abstract. The objective of the paper was to recognize development of milk market in the
United States. The production of milk is an important branch of agricultural production. The
authors presented spatial differentiation of milk production in United States and they
recognized that the leading states for milk output is California, Wisconsin and Idaho. The
consumption of whole milk decreased from 66 pound per capita in 2000 to 44.9 pounds per
capita in 2012. The authors used descriptive, graphical and trend methods to analyze the
changes in milk production in United States. The authors also calculated ADF test, ARMA model
and finally elaborated milk market prognosis for U.S. The authors estimated prognosis of the
development of milk production, milk per cow and milk consumption until 2020 in the USA.
Key words: milk market, milk production, milk yield.
JEL code: Q11, Q14
Introduction
Dairy production and milk processing is an essential part of the agribusiness sector around
the world. Raw milk is a product often manufactured to produce consumer dairy products. Milk
production creates jobs in linked branches and new opportunities in and outside agriculture
(Borawski P., Dunn J. W., 2014). The trade of milk and small price fluctuations have an impact
on competitiveness development in the market (Pietrzak M. et al., 2010). Milk is the source for
activity of dairy enterprises, which creates competition on markets (Zietara W. et al., 2013).
According to Smigla M. (2014) milk production is determined by factors such as resource,
prices, costs, and investments activities. The location of farms and regions, the economic size
of dairy farms, and milk production efficiency impact the activity of dairy farms. The conditions
for the development of dairy farms are changing. Most dairy farms increase their scale of
production because of increasing labour costs and faster growth of production means in
* Corresponding author. Tel.: + 48 89 523 33 13; fax: + 48 89 523 37 75 . E-mail address: [email protected]

25
comparison to prices of agricultural products (Adamski M., 2014).The dairy market is managed
by global supply and demand for milk and its products (Koloszyc E., 2013).
Factors determining the development of dairy farms are investment and sustainability.
Competitiveness requires net investment to improve the fixed assets and productivity and
sustain good environmental conditions. Such investment has occurred in many European Union
countries and was linked with the integration and its requirements (Borawski P., Pawlewicz A.,
2006; Sass R., 2009).
American agriculture is the leader in large-scale farming. Since 1940 the number of farms in
the United States has declined by about 66 percent, while over the same period average farm
size increased by about 161 percent (Stokes J. R., 2006). The U.S. dairy industry creates
economic well-being in Rural America. Every USD 1 million of United States milk creates more
than 900,000 jobs in the global economy and the industry output is estimated at USD140
billion. The United States is the second largest milk producer in the world (89.0 million tonnes
in 2011) after India (121.2 million tonnes in the same year) (The U.S. Dairy Industry, 2014).
Since 1985 the production of milk in India increased three times but the increasing production
is serving unfilled domestic demand (Parzonko A., 2009).
The average herd size of milk cows in United States is 115 and 85 percent of milk is produced
by farms with more than 100 cows. On the other hand 75 percent of dairy farms have fewer
than 100 cows. However, quite small farms also exist. Small dairy farms have to adopt
management strategies to become more competitive. Some small dairy have transitioned to
organic dairy production (Mayen C. D. et al., 2009).
This paper presents milk production and its differentiation in United States. The statistical
methods to present and elaborate milk market development prognosis in the United States
were used. The results were presented in tables and figures. To develop the problem of milk
production in the United States the authors wanted to answer following questions:
1. How did the number of cows and milk field change in the years 1999-2011?
2. How high is the milk production per person in the United States?
3. How the production of milk is diversified in particular states?
4. How did the consumption of milk change in the United States?
Moreover, the authors used descriptive statistics and measured the skewedness, which
quantifies the direction and asymmetry force and in systematic distribution is 0. The
skewedness of a random variable X is denoted skew (X). It is defined as:
E[(X- )3]
skew (X) = (1)
3
where is the mean and is standard deviation of X. As one might expect, the formula takes
on a positive value if X is positively skewed and a negative value if X is negatively skewed.
Kurtosis is the degree of peakedness of a distribution. The kurtosis of random variable X is
denoted kurt (X). It is defined as:

26
E[(X- )4]
kurt (X)= (2)
4
where is the mean and is standard deviation of X
The collected empirical material enabled to test the null hypothesis H0 that the variable is
integrated in level 1 (the root is equal one). When the null hypothesis is rejected then the
alternative hypothesis H1 that the rank is stationary should be accepted. The most appropriate
possibility to calculate the level of integration is the DF test (unit-root test). This test is based
on estimation of the equation (Charemza W., Deadman D., 1997):
Δyt=δyt-1+Et …………………………………………………………………………… (3)
If the δ is minus then p is smaller than one. The DF test enables one to verify the detrimental
δ in regression by using the smallest squared method. The null hypothesis rejection δ=0 for
the alternative hypothesis: δ<0 implies that p<1 and yt is integrated in zero degree. If the
value of the t-statistic is smaller than the lower critical value, the hypothesis is rejected, on
behalf of alternative hypothesis about stationarity. The Dockey Fullrer test has one drawback
that it does not contain the possibility of autocorrelation general process appearance E. When
the component Et indicates autocorrelation it is necessary to use the ADF test (Augmented
Dickey-Fuller test), which is the most effective tool in practice.
k
Δyt=δyt-1+ δΔ yt-1+Et (4)
I=1
The stationarity rank was described by ARMA model (Kufel T., 2004). The model verified the
seasonal integration. All calculations were done in GRETL programme.
Yt=B1Yt-1+B2Yt-2+…+BpYt-p+Et+θ1Et-1+θ2Et-2+…+θqEt-q (5)
where:
B – is the delay operator
Y – analyzed variable
E – varied component
θ– auto regression parameters
Research results and discussion
Milk is a frequently purchased product for many households. Different milk product categories,
differs mainly by fat and other ingredient content (Bonanno A. et al., 2013). American society
increased per capita consumption of cheese from 11.4 to 25.0 pounds in the years 1970-1991.
On the other hand consumption of fluid milk, butter, nonfat dried milk, and other dairy

27
products decreased (Yavuz F., Zulauf C., Schmitkey G., Miranda M., 1996). Since 2000,
consumption of whole milk decreased from 66 to 44.9 (32%) pounds per capita. At the same
time, the consumption of dairy products overall increased. The American consumers are
consuming more processed milk products. These results demonstrate that United States must
look for new purchasers of milk since it has overproduction. The analysis of Parzonko (2009)
proved that United States is self-sufficient in milk production. But the concentration of dairy
industry is low. The market is managed by private enterprises, dairy cooperatives and
international breeding concerns. The four main producers of milk in USA have 39.4% in all
production on the market (Dean Foods, Dairy Farmers of America, Kraft Foods, Inc., and Land
O’Lakes, Inc.). Nearly 80 percent of milk is marketed by dairy cooperatives such as: Dairy
Farmers of America, California Dairies, Land O’Lakes, Foremost Farms, Associated Milk
Producers Inc. and Northwest Dairy Association (Rynek nabialu w USA 2011). Each year over
20 billion gallons of milk is produced by dairy industry. This milk is transformed into cheese,
butter, cream and ice cream for consumers in different part of the world (Dairy, 2012).
The milk price was governed by the milk price support programme, which played an
important role in U.S. regulations of price and output. The programme was particularly
important in the mid-1960s to the early 1980s “(Adelaja A. O., 1991). Local programmes are
particularly required to have the potential effect of federal intervention in the dairy industry,
such as price programmes. Short-term programme are less important in controlling the milk
output (Howard W. H., Shumway C. R., 1988).
The milk production has changed in the United States in the years 1999-2011 (Figure 1).
The milk production has risen from 162,589 million pounds to 201,218 million pounds in 2013
(23.8%). In the same period, the milk yield per cow increased from 17,763 pounds per cow to
21,822 pounds (22.9%). The number of milk cows has not changed much from 9,153,000 in
1999 to 9,221,000 thousand in 2013 (0.7%). Milk cows were estimated at 9.267 million head,
up 67,000 head on July 2014 (Dairy herd, 2015). The US is the biggest milk processing
country, ahead of Germany, China and France.

28
Source: USDA data (1999-2014)
Fig. 1. Index of the number of cows, milk production and milk yield in the United
States for 1999-2013 (1999=1)
The milk production is dispersed regionally in the United States. The production in the South
and West has grown during the past 25 years (Nakane M., Tauer L. W., 2009). The top states
with the highest milk production in United States are: California (3,624 million pounds),
Wisconsin (2,305 million pounds), NewYork (1,135 million pounds).
The Southern United States has an annual net deficit of 40 billion pounds of milk (Figure 2).
These regions have to import milk and the net deficit is increasing each year (Hoards
Dairyman, 2014). There are many reasons for the differentiation of milk production in the
world. Milk price volatility has an impact on milk production profitability and the decrease of
milk price for example in 2009 was meaningful for dairy production increases, but the costs of
production, are mainly stable and changeable, but high (Koloszyc E. 2013).
Source: authors’ construction based on data from the Statista 2014
Fig. 2. Spatial differentiation of milk production per person in United States in 2011
(in pounds per person)
The production of milk in the United States is moving west and north. Nearly 21 percent of the
U.S. milk production is located in California but not all of California is producing milk. The
growth of milk has been found in the Central Valley and in Southern region of California. Milk
production is negligible in large and growing population center (Hoards Dairyman, 2014). To

29
remain competitive, the U.S. dairy have to interact to changing supply and demand trends.
The milk industry is becoming a new source of competitive advantage for the U.S. dairy
industry. Many multinational firms invest in the U.S. dairy industry because of its sheer size
and stable market. Moreover, American foreign investment policies are considered to be more
liberal than those in other developed markets (IUF Dairy Division, 2012).
Milk production is diversified regionally in the United States (Table 1). California is the leading
state in milk production and cow numbers. There are many reasons for high milk production
per cow. The most important is breeding advances to get more milk per cow. Also significant
are better fodders and feeding conditions. But, on the other hand, high production cows can
easily lose fertility, have illnesses of cow udders, legs problems and accidents (Zietara W. et
al. 2013). Over the period 2002-2013, the average milk production was 8 909 litres. Over
time, the dairy industry has relocated from the traditional dairy states of the Northeast and
Great Lakes states to the West and Southwest. Geylani C. and Stefanou S. E.’ observed a
cross-sectional dispersion in plant-level productivity growth in the milk industry. Their results
show a scale-effect contribution to TFP growth. These plants extract scale efficiencies over
technological progress to fuel TFP growth. The youngest plants start with the lowest
productivity growth at the initial time period, but they catch up to older plants productivity,
which present the highest average growth rate through years (Geylani C. and Stefanou S. E.,
2011).
Table 1
Top 10 States in milk production in United States in 2013
States Milk Production
mil. lit Milk/Cow litres Cows 1000
CALIFORNIA 1,815,264 10.198 1780
WISCONSIN 1,213,168 9.545 1271
NEW YORK 592,636 9.715 610
IDAHO 590,964 10.314 573
PENNSYLVANIA 464,860 8.722 533
TEXAS 422,840 9.673 437
MICHIGAN 403,216 10.611 380
MINNESOTA 402,160 8.667 464
NEW MEXICO 354,508 10.975 323
WASHINGTON 278,784 10.481 266
Source: US Department of Agriculture 2014
Milk production in the United States is mainly to satisfy the domestic market. After decades
of being a net importer of dairy products, the US is now a net exporter. Nearly 12% of milk
produced in the world comes from United States. The imports of dairy products to USA covers
only 1.3% of national demand. The USA imported dairy products in the years 2005-2010
mainly from: New Zealand (23.7%), Italy (13.6%), France (7.9%), Canada (6.6%), Ireland

30
(5.2%) and Australia (4.1%). The dairy products which are imported by the United States are
used in food processing. The implications of the U.S. tariff structure are that the United States
can be either a net importer or net exporter of dairy products. (Tellioglu I. et al., 2009).
On the other hand, the USA dairy product exports increased in the years 2005-2014, with
the leading markets, by value in 2014, are to: Mexico (22.1%), Southeast Asia (18.9%),
Middle East, North Africa (10.3%), China (10.0%), Canada (7.9%) and South Korea (5.7%).
(US Dairy Export Council, 2014).
A descriptive statistical analysis was conducted to vary the parameters used to calculate milk
production in Table 2. The conducted analysis shows that the cows number, milk production
and milk per cow were positively skewed. The average milk consumption over the past thirteen
years was 55,080 pounds per capita. The information helped reduce long-run swings and thus
reduces risk for both buyers and sellers in agriculture markets. The paper proved that such
information is particularly valuable for all market chain members.
Table 2
Descriptive statistics of milk production in the United States in 1999-2013
Specification
Specification
Milk
consumption
(pounds per
capita)
Cows
number
(1.000’s)
Milk
production Milk per cow
Mean 55.080 9.156 181.39 19.805
Median 55.500 9.153 181.78 19.895
Minimum 44.600 0.010 162.59 17.763
Maximum 66.000 9.315 201.22 21.822
Standard deviation 7.906 0.078 13.216 1.354
Coefficient of variation 0.144 0.008 0.073 0.068
Skewedness -0.010 0.021 0.095 0.034
Kurtosis -1.505 -0.214 -1.415 -1.321
Source: authors’ construction based on USDA data
The authors wanted to determine if there is a correlation between variables. The authors
have found big correlation between analyzed variables. The cow numbers variable is correlated
with milk production. The milk per cow is correlated with milk production and cow numbers.
But, on the other hand milk consumption is negatively correlated with milk production (-
0.9881) and milk per cow (-0.8918) and cow numbers (-0.4720). Although these results
suggest that the development of milk production has had a negative impact on milk

31
consumption, in fact the change in milk consumption is more a reflection of more competing
beverages, smaller families, and changes in population composition, especially a dramatic
growth in the population of East Asian origin.
Next the hypothesis was verified. The empirical results show that the hypothesis H0 is hardly
rejected. The milk consumption, cows number, milk production and milk per cow can be
classified as stationary because the stat value is smaller than the lower critical value (2.37-
2.68 from ADF table test). When the null hypothesis is rejected there is no need to verify the
alternative hypothesis H1.
The ARMA model was accepted to next analysis which was based on seasonality estimation.
In the first step after the ADF test estimation, the stationary process is differentiated. The
results are presented in Table 4. The variables of AR (1) and AR (2) are the parameters of
autocorrelation for the first and the second rank time. The data show, that all milk
consumption is stationary essential (p value <0.0000.1). It means that the milk consumption
in one year is dependent on milk consumption from the previous year.
The prognosis achieved by ARMA model were not fully the same (Table 3). The cows number
prognosis errors were lower than the percent that suggests that this model can be accepted. In
milk per cow prognosis the errors were higher, but in milk consumption and milk production
prognosis the errors were the highest. The model of ARMA because of its low errors can be
used to estimate cow numbers and milk per cow prognosis in a long time. But, in milk
consumption and milk production this model does not guarantee a good result because of high
errors of prognosis.
Table 3
Prognosis and errors of milk production in United States
Observa
tions
Milk consumption
(pounds per
capita)
Cows number
(1,000’s)
Milk production Milk per cow
Prognosis Error Prognosis Error Prognosis Error Prognosis Error
2014 44.9 0.65 9.178 0.0604 204.385 1.9628 22.213 0.1236
2015 45.7 0.90 9.151 0.0720 207.425 2.1145 22.532 0.1238
2016 46.9 1.06 9.144 0.0728 210.368 2.1323 22.829 0.1241
2017 48.6 1.15 9.147 0.0730 213.274 2.1343 23.129 0.1241
2018 50.5 1.20 9.152 0.0734 216.168 2.1346 23.431 0.1241
2019 52.7 1.22 9.155 0.0735 219.057 2.1346 23.733 0.1241
2020 55.0 1.22 9.156 0.0735 221.945 2.1346 24.035 0.1241
Source: authors’ construction based on USDA data
32
Conclusions
The production of milk is diversified regionally in the United States. The most milk
production is located in California, Wisconsin, and Idaho. These states are the main deliverers
of raw milk in the USA.
This paper has explored the issue of milk production in United States. Based on the analysis
it can be concluded that the market is developing. Total milk production and production per
cow are increasing. The number of cows stays almost the same. Only the consumption of
whole milk in the United States is decreasing. Demanding consumers require more processed
milk products.
The factors that create the production of milk in the USA is the increasing competitiveness,
the end of dairy supports programs and export possibilities to: Mexico, South Asia, Middle
East, North Africa, China, Canada and South Korea. These countries are not self-sufficient in
milk production and the demand for milk will increase with the increasing wealth of societies.
Interestingly, the period of most milk market development was in the last ten years. It
means that the United States demand for milk processed product is increasing and the needs
for exports are higher. US has exported more than 3 million tonnes in 2007 and it is
increasing.
Based on the empirical results of this paper, the prognosis confirms good conditions for milk
market development in United States. All analyzed variables will be developing in the future.
Bibliography
1. Adamski M. (2014). Ocena mozliwosci rozwoju gospodarstw mlecznych w Polsce z
uwzglednieniem wielkosci ekonomicznej (The Evaluation of Development Opportunities of Dairy
Farms in Poland, Taking into Account the Economic Size). Roczniki Naukowe Ekonomii
Rolnictwa i Rozwoju Obszarów Wiejskich T. 101, z. 2, 80-90.
2. Adelaja A., O. (1991). Price Changes, Supply Elasticities, Industry Organization, and
Dairy Output Distribution. American Journal of Agricultural Economics, Vol. 73, No. 1 (Feb.,
1991), pp. 89-102.
3. Bonanno A., Chenarides L., Volpe III R. (2013). The Size vs. Health Trade-off in Lower-
Income Households’ Food Choices: The Case of Fluid Milk. Agricultural & Applied Economics
Association’s 2013 AAEA & CAES Joint Annual Meeting, Washington, DC, August 4-6.
4. Borawski P., Dunn J. W. (2014). Conditioning of milk market development In Poland
with particular regard paid to price volatility. In: Economic science for rural development 35,
Jelgava, Latvia, pp. 88-96.
5. Borawski P., Pawlewicz A. (2006). Efektywnosc ekonomiczna indywidualnych
gospodarstw rolnych w aspekcie zrownowazonego rozwoju na przykladzie wojewodztwa
warminsko-mazurskiego (Economic Efficiency of Individual Farms In The Sustainable
Development Aspect Based on the Example of Warmia and Mazury Province). Zeszyty
Naukowe Akademii Rolniczej we Wrocławiu 540, Rolnictwo LXXXVII, s. 91-97.
6. Charemza W., Deadman D. (1997). Nowa ekonometria (New Econometric). PWE,
Warszawa.
7. Dairy (2012). Sustainable table serving up healthy food choices. Available at:
www.sustainabletable.org.

33
8. Dairy herd (2015). U.S dairy cow numbers up, but replacement heifer numbers lower.
Available at: http://www.dairyherd.com/dairy-news/US-dairy-cow-numbers-up-but-
replacement-heifer-numbers-lower-269135871.html
9. Geylani C., Stefanou S. E. (2011). Productivity growth patterns in US dairy products
manufacturing plants. Applied Economics Volume 43, Issue 24, pp. 3415-3432.
10. Howard W. H., Shumway C. R. (1988). Dynamic Adjustmentin the U.S. Dairy Industry.
American Journal of Agricultural Economics, Vol. 70, No. 4 (Nov., 1988), pp. 837-847.
11. IUF Dairy Division (2012). United States of America Dairy Industry. Available at:
http://www.iuf.org/sites/cms.iuf.org/files/USA%20Dairy%20Industry.pdf.
12. Koloszyc E. (2013). Dochodowosc typowych gospodarstw mlecznych na swiecie w
latach 2006-2011 (Profitability of Typical Dairy Farms in the World in the Period 2006-2011).
Roczniki Naukowe Ekonomii Rolnictwa i Rozwoju Obszarów Wiejskich T. 100, z. 1, 119-129.
13. Kufel T. 2004. Ekonometria. Rozwiazywanie problemow z wykorzystaniem programu
GRETL (Econometry. Problems Solving with Using GRETL Programme). PWN, Warszawa.
14. Mayen C. D., Balagtas J. V., Alexander C. E. (2009). Vertical Economies of Scope in
Dairy Farming. Journal of Agricultural & Food Industrial Organization, Vol. 7, Issue 7, pp. 1-15.
15. Nakane M., Tauer L., W. (2009). Empirical dairy profits under fluctuating proces.
Applied Economics 41, pp. 5-15.
16. Parzonko A. (2009). Stan i kierunki zmian w produkcji mleka na swiecie (The State and
the Tendencies of Changes in Production of Milk in the World). Roczniki Nauk Rolniczych, Seria
G, T. 96, z. 1, 16-26.
17. Pietrzak M., Baran J., Maciejczak M. (2010). Zakres i rola logistyki w przedsiebiorstwach
mleczarskich (The Scope and Role of Logistic in Dairy Enterprises). Wieœ Jutra 1(138),
Warszawa, 1-5.
18. Rynek Nabialu w USA 2011. (Dairy Products in USA). Wydzial promocji handlu i
inwestycji konsulatu generalnego RP w Nowym Yorku.
19. Sass R. (2009). Polskie gospodarstwa mleczne na tle panstw członkowskich UE-15
(Polish Milk Farms Against a Background of Member States UE-15). Roczniki Nauk Rolniczych,
Seria G – Ekonomika Rolnictwa, Tom 96, Zeszyt. 3, pp. 209-224.
20. Smigła M. (2014). Determinanty produkcji mleka w regionach Unii Europejskiej o
bardzo duzych gospodarstwach mlecznych po 2004 roku (Determinants of Milk Production in
Euro-Regions with Very Big Milk Farms after 2004). Journal of Agribusiness and Rural
Development 1(31), 143-150.
21. Steady milk production growth continues. Hoard’s Dairyman, March 10, W.D.
Hoard&Sons Company, Wisconsin 2012.
22. Stokes J. R. (2006). Entry, Exit, and Structural Change in Pennsylvania’s Dairy Sector.
Agricultural and Resource Economics Review 35, 2, pp. 357-373.
23. Tellioglu I., Bailey K., Blandford D. (2009). Implicit Tariffs on Imported Dairy Product
Components in the United States. The Estey Centre Journal of International Law and Trade
Policy Volume 8, Number 1, pp. 83-101.
24. The U. S. Dairy Industry. A vital Center to Economic Development 2014).
25. US Dairy Export Council, Global Dairy Market Outlook 2014.
26. Yavuz F., Zulauf C., Schmitkey G., Miranda M. (1996). A Spatial Equilibrum Analysis of
Regional Structural Change in the U. S. Dairy Indystry. Review of Agricultural Economics 18,
pp. 693-703.
27. Zietara W., Adamski W., Mirkowska Z. (2013). Rzeczywisty a optymalny okres
uzytkowania krow mlecznych (Actual vs. Optimal Period of the Utility of Dairy Cows). Roczniki
Naukowe Ekonomii Rolnictwa i Rozwoju Obszarów Wiejskich T. 100, z. 3, 90-100.

34
Proceedings of the 2015 International Conference „ECONOMIC SCINCE FOR RURAL DEVELOPMENT” No39 Jelgava, LLU ESAF, 23-24 April 2015, pp.34-46
THE INFLUENCE OF NATURAL VALUABLE AREAS ON THE DEVELOPMENT OF ENTRPERENEURSHIP (BASED ON THE EXAMPLE OF LUBLIN
VOIVODESHIP)
Magdalena Zwolińska-Ligaj*, PhD
Pope John Paul II State School of Higher Education in Biała Podlaska
Abstract. The aim of the study is to determine the entrepreneurs’ perceptions of the impact
of valuable natural areas on local entrepreneurship with an indication of the opportunities and
constraints arising from such a location. The paper presents results of research on a sample of
150 companies located in 30 municipalities with the highest environmental valuables in the
Lublin voivodeship (Poland). The study shows that in the case of enterprises basing on
resources and environmental qualities of the communes within natural valuable areas is a
natural direction of their development, resulting from favourable, strongly affecting the activity
natural conditions. In order to increase the utilization of the existing opportunities for
businesses that are created within natural valuable areas, it is important to disseminate among
entrepreneurs knowledge on the environmental determinants of economic activity, including
the impact of the areas on the possibilities and limitations of business development. The
dissemination of this knowledge can be translated into an increased acceptance of the
limitations resulting from the need to protect the natural environment of ecologically valuable
areas and the identification of a wider range of the specific opportunities for business
development. The results were processed using SPSS statistical package. They describe the
selected elements of descriptive statistics and the different significance results of the non-
parametric Mann-Whitney test. The paper was prepared within the research project
No.2011/01/D/HS4/03927 entitled "Environmental conditions and factors of development of
the economic functions of valuable natural areas of Lublin Voivodeship" funded by the National
Science Centre.
Key words: legally protected area, entrepreneurship
JEL code: Q56
Introduction
The notion of a valuable natural area is variously interpreted in the literature. In Poland,
generally, in narrow terms, the term refers to the areas of documented natural values
protected under the Nature Conservation Act (Journal of Laws of 2004 No. 92, item 880)
(Cieszewska A., 2009), and the elements of the environment, fauna and flora, present on its
*Corresponding author. Tel.: +48 83 344 99 05; fax: + 48 83 344 99 50.
E-mail address: [email protected].

35
territory, are an essential contribution to sustainable development and biodiversity
conservation (Luszczyk M., 2011). In terms of the Nature Conservation Act of 16 April 2004,
protected areas* are characterized by particular natural, scientific, social, cultural and
educational values (national park - Art. 8 of the Act ...), are protected due to the natural,
historical and cultural and landscape values in order to preserve and popularize these values in
terms of sustainable development (landscape park, Art. 16 of the Act ...), include areas
protected because of distinguishing landscape characterized by varied ecosystems, valuable
because of the possibility of meeting the needs of tourism and recreation and function as
ecological corridors (protected landscape area, Art. 23 of the Act ...). The above features of
protected areas condition their many functions associated with a number of benefits, including:
the possibility of their touristic and recreational use, watershed protection, providing a range of
environmental services, maintenance of biodiversity, opportunities for education and research,
providing a plurality of consumer products and non-consumer benefits: (Dixton J.A., Sherman
P.B., 1991).
New approaches to protected areas, as compared to traditional concepts, focus mainly on
maintenance and often try to limit human activities trying to preserving coherent integration
and development functions. In line with this aspiration, protected areas should become "living
landscapes" in economic and social terms (Mose I., 2007). Today, the tendency to include
protected areas into economic areas and gradually eliminate restrictions on local
entrepreneurship is growing. The new features of protected natural resources that were
previously in a non-economic sphere are re-integrated into an economic sphere, becoming the
drivers of the development of regions and local communities (Boltromiuk A., 2003).
The existence of protected areas can in various ways affect the development of rural areas.
Firstly, it can be concluded that protected areas are an opportunity for the sustainable
development of communes and may affect incentives for local people, and indirectly the
natural environment. Creating protected areas may cause, on the other hand, the appearance
of the limiting factors associated with the occurrence of various forms of surface protection
(Mastalska-Cetera B., 2007). In particular, limitations can be revealed with regard to:
traditional forms of management, investment, use of techniques and measures changes in the
components of the natural environment, gaining economic and non-economic land
environment, land use planning, the use of the natural environment for recreation, or the need
for new security solutions. The leverage effect of valuable natural areas can be linked to the
greening of traditional forms of management and operating sectors, the development of
different forms of tourism, development of organic farming and production of healthy food, the
increase in value of the existing residential properties, acquisition of land to non-economic
positive consequences of the implementation of local sustainable development strategy, the
* Art. 6 of the Nature Conservation Act of 16 April 2004 lists the following forms of nature: on the surface, which
include: national parks, nature reserves, landscape parks and protected landscape areas and Natura 2000 sites.

36
possibility of conducting research and development of environmental education, employment
in the protection of nature sites and new protective solutions for improving the quality of life of
residents and tourists (Czaja S., Becla A., 2007).
Including a protected area in a group of factors that support or inhibit development is largely
dependent on the attitude of the local community towards the fact of establishing an area
nature conservation form and the ability to integrate protected areas into the strategy for
socio-economic development of the region (Kulczyk-Dynowska A., 2013). This is possible due
to the fact that protected areas can provide important impulses for the development of the
region, e.g. in tourism, marketing regional products and, in general, in regional development
of innovative products and services (Hammer T., 2007). The challenge is therefore to identify
opportunities that do not restrict the usability of the site by people, and at the same time
minimize the negative consequences for protected areas. It is postulated that land
management adopted the "win-win" strategy, is satisfactory from the point of view of human
needs and the needs of maintaining the ecological functions of the area. This happens, for
example, when nature conservation brings economic benefits (DeFries R., Hansen, A., Turner
BL, Reid R., Liu, J., 2007). One of these directions is entrepreneurship dependent on
biodiversity - based on the exploitation of natural resources, which should be developed in
accordance with the criterion of sustainable development, contributing in this way to
strengthening the social functions of nature sites.
The aim of the study is to determine the perceptions of entrepreneurs of the impact of
valuable natural areas on local entrepreneurship with an indication of the opportunities and
constraints arising from such a location. The study verified the hypothesis that in the case of
enterprises dependent on biodiversity location in a protected area and access to valuable
resources and values of the natural environment positively determine their current operation
and create opportunities for further development. Within environmentally valuable areas,
however, there is a need to implement measures to provide information in order to more fully
exploit the possibilities of entrepreneurship development based on the use of resources and
natural assets of communes.
The study area consisted of 30 municipalities with the highest environmental valuables in the
Lublin voivodeship, designated under the synthetic index developed by D. Guzal-Dec (2013) in
the study of ecologically valuable rural and semi-urban areas of the Lublin voivodeship. In
each of the communes, on the basis of the REGON number, 5 companies located in rural areas
were selected for testing, as directed of the sample reflection of the sectoral structure of
business entities in the commune and selecting test subjects with the highest level of
employment. Diagnostic survey was applied using a questionnaire interview. Interviews with
owners (or managers) of enterprises were realised in the period November-December of 2013.
The research material consisted of 150 questionnaire interviews. In the study group of 150
companies 85 entities dependent on biodiversity were selected – basing their activities on the

37
use of natural resources. The newly selected group included entities in the case of which
natural conditions determined the possibilities of doing business and offering certain types of
products / services.
The results were processed using SPSS statistical package. They describe the selected
elements of descriptive statistics and the different significance results of the non-parametric
Mann-Whitney test used to compare two independent groups in the situation of the ordinal
nature of the variables. The report was prepared as part of the research project No.
2011/01/D/HS4/03927 entitled: "Environmental conditions and factors of development of the
economic functions of valuable natural areas of Lublin Voivodeship" funded by the National
Science Centre.
Research results and discussion
Assessment of the impact of resources and values of the natural environment of the commune
on local entrepreneurship. Enterprises basing on the natural resources within environmentally
valuable areas represented mainly manufacturing (30.6%), activities related to
accommodation and catering services (27.1%) as well as agriculture, forestry, hunting and
fishing (23.5%). Companies included in the group of other operated mainly in such sectors as
trade and repair (30.8%), manufacturing (13.8%) and other services. The study group was
dominated by micro-entities. A more fragmented structure by number of employees was
characteristic of enterprises using natural resources (Table 1).
Table 1
The structure of enterprises using natural and other resources by the number of
employees
Type of enterprises
The range of employment
0-9 10-49 50-249
Use of natural resources 82.4 9.4 8.2
Others 69.9 22.2 7.9
Source: autor’s calculations based on empirical research
Enterprises that use natural resources more often than others were characterized by local
range of supported markets (40.0% compared to 34.0% for the other). Furthermore, they
were characterized by a slightly longer length of their presence on the market - to 2000 44.8%
of those entities were established and in the case of other - 41.6%. In addition, companies
using natural resources were often family businesses - 51.8% compared to 40.3% for the
group of others. Within the group of 150 entities 37.7% declared functioning within the area
covered by one of the forms of nature protection.

38
Resources and values of the natural environment were an important element of the business
environment affecting, in the opinion of their representatives, their activity and the activity of
other traders from the commune. The impact of the natural factor on local entrepreneurship
was primarily declared by entrepreneurs representing industries dependent on biodiversity.
About half of the representatives of these entities declared large and very large impact of the
natural environment of the company - on its current activities and future development. These
entrepreneurs also perceived greater environmental impact on the other aspects of local
entrepreneurship - the activities of other companies in the community, the possibility of
establishing new companies by inhabitants and attracting investors from outside the
municipality, compared with entrepreneurs representing other branches (Figure 1).
The different significance results of the non-parametric Mann-Whitney test showed that the
observed differences in the strength of the influence of the natural environment of the
commune on local entrepreneurship between the two groups of companies were statistically
significant (variable: the on-going activities of the company: p = 0.000, the future
development of the company: p = 0.000, other companies from the commune: p = 0.009,
establishment of new companies by residents: p = 0.012, attracting investors from outside the
municipality: p = 0.003).
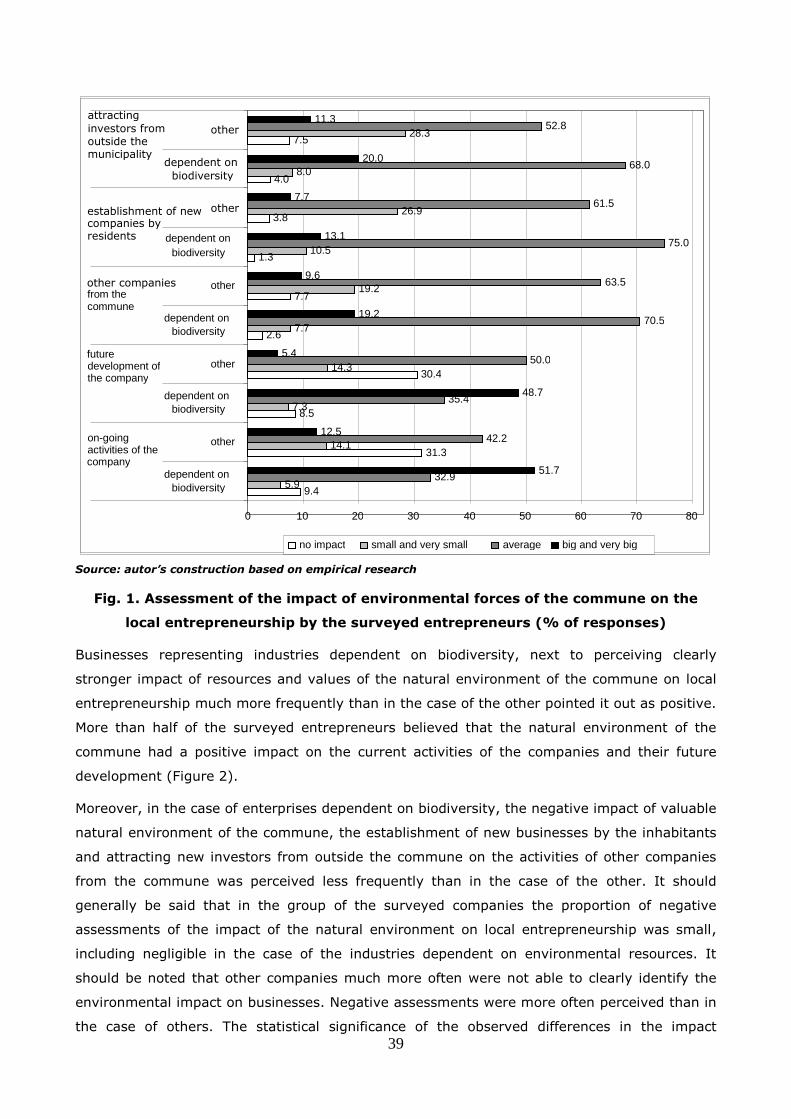
39
Source: autor’s construction based on empirical research
Fig. 1. Assessment of the impact of environmental forces of the commune on the
local entrepreneurship by the surveyed entrepreneurs (% of responses)
Businesses representing industries dependent on biodiversity, next to perceiving clearly
stronger impact of resources and values of the natural environment of the commune on local
entrepreneurship much more frequently than in the case of the other pointed it out as positive.
More than half of the surveyed entrepreneurs believed that the natural environment of the
commune had a positive impact on the current activities of the companies and their future
development (Figure 2).
Moreover, in the case of enterprises dependent on biodiversity, the negative impact of valuable
natural environment of the commune, the establishment of new businesses by the inhabitants
and attracting new investors from outside the commune on the activities of other companies
from the commune was perceived less frequently than in the case of the other. It should
generally be said that in the group of the surveyed companies the proportion of negative
assessments of the impact of the natural environment on local entrepreneurship was small,
including negligible in the case of the industries dependent on environmental resources. It
should be noted that other companies much more often were not able to clearly identify the
environmental impact on businesses. Negative assessments were more often perceived than in
the case of others. The statistical significance of the observed differences in the impact
9.4
31.3
8.5
30.4
2.6
7.7
1.3
3.8
4.0
7.5
5.9
14.1
7.3
14.3
7.7
19.2
10.5
26.9
8.0
28.3
32.9
42.2
35.4
50.0
70.5
63.5
75.0
61.5
68.0
52.8
51.7
12.5
48.7
5.4
19.2
9.6
13.1
7.7
20.0
11.3
0 10 20 30 40 50 60 70 80
dependent on biodiversity
other
dependent on biodiversity
other
dependent on biodiversity
other
dependent on biodiversity
other
dependent on biodiversity
other
on-going activities of the company
future development of the company
other companies from the commune
companies by residents
attracting investors from outside the municipality
no impact small and very small average big and very big
establishment of new

40
assessment of the natural environment on local entrepreneurship determined on the basis of
the Mann-Whitney test within the communes concerned only the situation of entities
represented by the surveyed entrepreneurs (variable: the on-going activities of the company:
p = 0.000, the future development of the company: p = 0.000). For all other variables the
differences proved to be statistically insignificant. (variables: other companies from the
community: p = 0.381, establishment of new companies by residents: p = 0.578, attracting
investors from outside the commune: p = 0.542).
Source: autor’s construction based on empirical research
Fig. 2. Assessment of the environmental impact of municipalities
on local entrepreneurship according to the surveyed companies (% of responses)
At this point the convergence of the results with other studies carried out in the areas covered
by the Natura 2000 network (Dokument zamykajacy ... 2012) should be noted, indicating that
entrepreneurs basing their business on the natural values of the region, tend to have a positive
opinion about the conditions of doing business. Negative opinions on doing business in the
areas of natural beauty appeared among entrepreneurs from other sectors whose activities are
based on the use of the advantages of the landscape. They mainly pointed out limitations in
the development of companies regarding extensions or preventing investment processes. Lack
of knowledge about the opportunities and the lack of own funds were often hampering factors.
1.2
0.0
1.2
2.0
5.2
7.8
6.7
7.8
4.1
7.8
34.5
63.8
37.0
63.2
54.5
56.9
56.0
56.9
56.8
52.4
64.3
35.7
61.8
34.7
40.3
35.3
37.3
35.3
39,2
39.3
0 10 20 30 40 50 60 70
dependent on biodiversity
other
dependent on biodiversity
other
dependent on biodiversity
other
dependent on biodiversity
other
dependent on biodiversity
other
on-going activities of the company
other activities from the commune future development of the company
establishment of new companies by residents
attracting investors from outside the municipality
negative hard to say positive

41
The possibilities of using resources and values of the natural environment in the development
of the local commune entrepreneurship. The entrepreneurs surveyed were aware of the special
qualities of the natural environment of the communes where their companies were located. In
particular, among these values entrepreneurs representing industries dependent on
biodiversity pointed out diverse and valuable natural environment under legal protection,
aesthetic landscaping, clean air. Other entities paid more attention to: the aesthetic features of
landscape, the area of protected areas and favourable location in relation to hubs and urban
centres (Figure 3).
Source: autor’s construction based on empirical research
Fig. 3. Specific advantages of the geographical environment of the commune
according to the assessment of the surveyed entrepreneurs (% of responses)
Perceiving by the entrepreneurs the advantages of local environment and its positive impact
on entrepreneurship was accompanied by their opinion on incomplete use of the area of the
commune in their business operations. Enterprises dependent on biodiversity, due to the
nature of activities, often recognized that the geographical values of the environment of the
commune were fully utilized by local companies (36.5% compared to 21.6% for other entities)
(Figure 4).
Source: autor’s construction based on empirical research
Fig. 4. The use by local companies of the geographical environment values of the
commune in the assessment of the surveyed entrepreneurs (% of responses)
28.1
20.1
14.3
10.3
9.8
6.7
3.6
3.1
2.2
1.8
19.1
22.0
13.9
8.7 15.6
5.8 4.6
7.5
2.3
0.6
0
5 10 15 20 25 30 large legally protected areas
esthetic landscape features
clean air
flora location with reference to communication hubs and city centers
investment, recreation and resident areas
water soil
fauna mineral resources
dependent on biodiversity other
9.4
28.2 25.9
22.4
14.1 13.8
23.1
41.5
18.5
3.1 0 5
10 15 20 25 30 35 40 45
definitely no rather no hard to say rather yes definitely yes dependent on biodiversity other

42
Entrepreneurs perceived the potential of local resources and values of the natural
environment possible for use in the development of various economic activities. In particular,
the following areas which have shown development opportunities were pointed out by the
surveyed: ecological tourism, recreational and sports facilities as well as organic farming and
production of healthy food. Representatives of the entities dependent on biodiversity also
perceived opportunities in the development of traditional products and services based on local
resources, and in the case of other entities – these included processing and wholesale and
retail sale of food. Few entrepreneurs indicated the possibility of developing or acquiring
natural medicine or energy from renewable sources which required the existence of adequate
infrastructure and considerable resources (Figure 5).
Source: autor’s construction based on empirical research
Fig. 5. The areas of entrepreneurship with development opportunities in the
commune, according to the assessment of the surveyed companies (% of responses)
With respect to enterprises operating in areas under legal protection, both opportunities and
constraints arising from the development of such a location were indicated. Most possibilities
were indicated by the respondents in relation to the less restrictive forms of nature, such as
landscape parks or Natura 2000 sites. In the case of all forms, the basic perceived opportunity
resulted from tourism development. Within landscape parks and the areas covered by the
Natura 2000 network the importance of the location for large interest in the companies’
products pointed out: access to local resources, opportunities for development of light industry
and agricultural activity (Table 2).
28.9
20.4
12.3
11.1
8.5
6.0
5.1
3.0
2.6
2.1
0.0
22.4
18.8
10.6
8.2
12.9
4.7
7.1
4.7
6.5
1.8
2.4
0.0 5.0 10.0 15.0 20.0 25.0 30.0 35.0
Ecological green, recreation and leisure and sports services
Green agriculture and healthy food production
Traditional products and services based on local resources
Acquisition of wood and forest products
processing and wholesale and retail sale of food
Green education, scientific research
production and sales of products from natural resources
Energy acquiring from renewable resources
construction
Natural medicine and health resorts
transport
div ot
her dependent on biodiversity other

43
Table 2
Opportunities and threats indicated by the surveyed companies arising from the
location in the area legally protected by forms of protected areas
Area Chances Restrictions
Natura
2000
development of tourism, the
influx of tourists, the
possibility of the use of
grants, subsidies,
great interest in the
company's products
development activities based
on the available natural
resources,
opportunities for small
industry
development, development of
farms
insufficient level of infrastructure development
the need for numerous, complex, restrictive
environmental legislation
lack of adequate investment rules
restrictive provisions hindering or preventing
the investment process
prohibition of certain investments, cutting of
trees
Landscape
Park
large stock of raw materials,
virgin nature, natural values
development of tourism,
increase in the number of
tourists
lack of subsidies for activities’ development
the need for complex, restrictive laws
administrative restrictions,
limitations and difficulties of investments
legal requirements in the natural valuable areas
National
Park
tourism development
the need for complex, restrictive laws
environmental protection rules
investment restrictions
legal requirements in the natural valuable areas
Source: autor’s summary based on empirical research
Compared to the perceived chances, entrepreneurs reported significantly more constraints
associated with the operation of the area covered by legal protection. The restrictions include:
insufficient level of infrastructure development, the need for numerous, complex and
restrictive environmental legislation and the need to comply with regulations limiting or
impeding investment processes.
Other surveys carried out among the entrepreneurs within the Natura 2000 sites show that
they have little knowledge about the network and the benefits and risks arising from the

44
location of firms in its area. In addition, the views of entrepreneurs on the network are in
conflict and are often based on unreasonable and stereotypical opinions (Boltromiuk,
Klodzinski 2011). Other surveys of entrepreneurs operating in the Natura 2000 areas, in turn,
revealed the important role of information and promotional support, grants and subsidies, the
advice of the business environment institutions, the use of exemptions and tax benefits in the
development of economic activity. In particular, entrepreneurs reported a need for assistance
and advice on fundraising for business development, advice and assistance in adjusting the
profile of the requirements arising from the location within the Natura 2000 areas or near it
(Analiza uwarunkowan…, 2012).
Conclusions
The discussion presented in the paper allows for formulating the following conclusions:
1. The hypothesis formulated in the study was verified. Entrepreneurship based on natural
resources and environmental qualities of the commune in the natural valuable areas are
the natural direction of their development, resulting from favourable, strongly affecting
the activity natural conditions. In addition, the field of entrepreneurship can be
specified as the desired factor in the natural valuable economies allowing for the
development of environmentally valuable range of economic and social functions of
these areas and improving their socio-economic situation.
2. The environmentally valuable areas covered by different forms of protection should
seek individual directions and forms of entrepreneurship, using a specific system of
conditions for development. An important role in this process should be played by local
government authorities aimed at economic revival of the communes on the basis of
their sustainable use of their natural potential.
3. Skilful incorporation of business in the environment in the commune of valuable
resources and natural beauty protected by law requires specialized knowledge of the
environmental determinants of economic activities, including the impact on the
possibilities and limitations of entrepreneurship in those areas. This requires the
initiation of cooperation between municipal authorities and the local business sector,
representatives of the local community and environment experts involved in the
development of valuable natural areas. Dissemination of knowledge of this type among
businesses can result in increased acceptance of the limitations resulting from the need
to protect the natural environment ecologically valuable areas and the identification of a
wider range of specific opportunities for business development.
4. Future deepening studies needs to identify the most important factors stimulating the
development of entities dependent on biodiversity, including those related to knowledge
about the conditions, development opportunities and constraints arising from their
location within environmentally valuable areas.

45
Bibliography
1. Analiza uwarunkowan prowadzenia działalnosci gospodarczej na obszarach Natura 2000 w
wojewodztwie warminsko-mazurskim, Dokument opracowany w ramach projektu
„BUSINESS TO NATURE – Interregional Approach to SMEs and Entrepreneurship in Natural
Areas” (Analysis of the Conditions of Conducting Business in Natura 2000 Areas in the
Warmia and Mazury Region, Document prepared under the „BUSINESS TO NATURE –
Interregional Approach to SMEs and Entrepreneurship in Natural Areas” project) (2012).
Warszawa: Warminsko-Mazurska Agencja Rozwoju Regionalnego S.A. w Olsztynie. p. 83.
Retrieved:
http://www.business2nature.eu/files/Analiza_uwarunkowan_Natura_2000_woj_warminsko-
mazurskie.pdf. Access: 18.09.2014
2. Boltromiuk, A. (2003). Ekonomiczne aspekty funkcjonowania obszarow
chronionych(Economic Aspects of the Functioning of Protected Areas). Bialystok: Wyd.
Uniwersytetu w Bialymstoku. pp. 88-91.
3. Boltromiuk, B., Kłodzinski M. (2011). Podsumowanie i wnioski z badan (Summary and
Conclusions of the Study) in: Boltromiuk A. (ed.), Uwarunkowania zrownowazonego
rozwoju gmin objętych siecia Natura 2000 w swietle badan empirycznych (Determinants of
Sustainable Development of Municipalities Covered by the Natura 2000 Network in the
Light of Empirical Research). Warszawa: IRWiR PAN. pp. 366-367.
4. Cieszewska, A. (2009). Strategia rozwoju turystyki na terenach cennych przyrodniczo (The
Strategy of Tourism Development in Environmentally Valuable Areas). Studia i Materialy
Centrum Edukacji Przyrodniczo-Lesnej (Studies and Research Centre for Nature and Forest
Education), Volume 11, Issue 23, p. 43.
5. Czaja S., Becla A. (2007). Ekologiczne podstawy procesow gospodarowania (Ecological
Basis of Economic Processes). Wroclaw: Wyd. AE im. O. Langego we Wrocławiu. pp. 374-
375.
6. DeFries, R., Hansen, A., Turner, B. L., Reid, R., Liu, J. (2007). Land Use Change Around
Protected Areas: Management to Balance Human Needs and Ecological Function, Ecological
Applications, Volume 17. Issue 4, p. 1031.
7. Dixton, J. A., Sherman P., B. (1991). Economics of Protected Areas. Environmental
Economics, Volume 20, Issue 2, p. 70.
8. Dokument zamykajacy projekt „BUSINESS TO NATURE – nowe podejscie do rozwoju
przedsiebiorczosci na obszarach cennych przyrodniczo” (Closing Document for the Project:
„BUSINESS TO NATURE” – a New Approach to the Development of Entrepreneurship in
Natural Valuable Areas” (2012). INTERREG IVC, European Regional Development Fund.
9. Guzal-Dec D. (2013). Operacjonalizacja modelu Presja-Stan-Reakcja w badaniu cennosci
ekologicznej gmin wiejskich na przykładzie wojewodztwa lubelskiego (Operationalization of
the Pressure-State-Response Model in the Study of Ecological Valuables of Rural
Communities, as Exemplified by the Lublin Voivodeship). Rocznik Ochrony Srodowiska
(Annual Set the Environment Protection), Volume 15, Issue 3, pp. 2925-2941.
10. Hammer T. (2007). Protected Areas and Regional Development: Conflicts and
Opportunities in: Mose I. (ed.), Protected Areas and Regional Development in Europe:
Towards a New Model for the 21st Century. Aldershot: Ashgate. p. 28.
11. Kulczyk-Dynowska A. (2013). Rozwoj regionalny na obszarach chronionych (Regional
Development in Protected Areas). Wrocław: Uniwersytet Przyrodniczy we Wrocławiu. p.
122.
12. Luszczyk, M. (2011). Kierunki rozwoju społeczno-gospodarczego obszarow przyrodniczo
cennych. Zrownowazony rozwoj obszarow przyrodniczo cennych (Directions of Socio-
Economic Development of Valuable Natural Areas. Sustainable Development of Valuable
Natural Areas) in: Poskrobko T. (ed.), Planistyczne i implementacyjne aspekty rozwoju
obszarow przyrodniczo cennych (Planning and Implementation Aspects of the Development
Valuable Natural Areas), Volume 1, Białystok: Wyd. WSE w Białymstoku. p. 263.

46
13. Mastalska-Cetera B. (2007). Obszary chronione. Szansa i zagrozenie dla rozwoju obszarow
wiejskich, Przyrodnicze uwarunkowania rozwoju obszarow wiejskich (Protected areas.
Opportunity and a threat to rural development. Natural conditions for rural areas
development) in: Grykien S., Hasinski W. (ed.), Studia Obszarow Wiejskich (Studies of
Rural Ateas), Volume 12, Warszawa. pp. 95-96.
14. Mose, I. (2007). Foreword in: Mose I. (ed.), Protected Areas and Regional Development in
Europe: Towards a New Model for the 21st Century. Aldershot: Ashgate.
15. Nature Conservation Act of 16 April 2004, 2004 Nr 92 item 880.
47
Proceedings of the 2015 International Conference “ECONOMIC SCIENCE FOR RURAL DEVELOPMENT” No39
Jelgava, LLU ESAF, 23-24 April 2015, pp. 47-56
ECOLOGICAL INVESTMENTS AS A NECESSARY CONDITION FOR
SUSTAINABLE DEVELOPMENT OF AGRIBUSINESS COMPANIES
Izabela Wielewska, PhD*
UTP University of Science and Technology in Bydgoszcz, Department of Economics and
Advising in Agribusiness, Poland
Abstract. The concept of sustainable development aims at preventing negative processes in
relation to the environment and requires social acceptance of industrial activity. The idea of
sustainable development will be fulfilled when the environment is protected at full economic
development of a company and when resources are renewed in the long term. The emission by
the company of harmful elements into the atmosphere, water and soil, which causes the
environment to deteriorate, forces the introduction of some environmental investments.
The aim of the research was to determine to what extent the agribusinesses companies
introduced environmental investments as a necessary condition of sustainable development.
Research was conducted using a diagnostic survey, among 172 agribusinesses.
The research showed that many agribusiness companies have implemented the eco
investments whose purpose was to collect, reduce, neutralize, monitor, prevent or eliminate
pollution or environmental loss resulting from business activity.
Key words: environmental investments, environmental protection, agribusiness companies,
sustainable development
JEL code: Q01, Q56
Introduction
The realisation by the agribusiness company of environmental protection requirements
results from the concept of sustainable development. D. Kielczewski (2010) argues that the
development is sustainable when it is based on "maximizing the net profit from economic
growth, while protecting and ensuring the renewal of the usability and quality of natural
resources in the long term. The economic growth must then mean not only an increase in per
capita income but also an improvement in other domains of social welfare. It must also include
certain necessary structural changes in both the economy and the whole society". In a similar
manner wrote D. Zuzek (Zuzek D., 2010; Zuzek D., 2013).
* Corresponding author. Tel.: +48 600 822 486
E-mail address: [email protected]

48
The ecological investments contribute to the prevention of increasing degradation of the
environment and any activity deemed harmful. These investments may be corrective or
preventive (Wielewska I., 2013).
The aim of the research was to determine to what extent the agribusinesses companies
introduced environmental investments as a necessary condition of sustainable development.
The research was conducted using a diagnostic survey, among 172 agribusinesses.
A research analysis has been conducted, based on the results of research from October
2014 using a diagnostic survey. The aim of that research was to determine to what extent the
agribusiness companies introduced environmental investments as a necessary condition of
sustainable development.
Research results and discussion
According to the Polish laws concerning environmental protection, agribusiness companies,
like all other businesses, are obliged to:
- observe the conditions of the protection of natural resources;
- observe the conditions and hold a permission to emit substances or energy into the
environment;
- share information about the environment and its protection;
- bear fees for using the environment, i.e.: gas and dust emission into the air, sewage
draining into waters or soil, water consumption, refuse collection and removal;
- bear administrative fines in case of breaching or infringing any of the conditions in the
permission or other decision of the administrative authority;
- provide recovery, especially recycling of package and post-consumed waste;
- bear administrative responsibility for any negative impact upon the environment in the
form of a limit for the negative impact upon the environment, restoration of the original
condition of the environment or paying a fixed amount compensating any damage
caused, or in the form of an administrative decision which would halt a given
installation (Zbaraszewski W., 2008).
Suppression of the progressing degradation of the environment as well as restoration of its
damaged components, requires its users to apply various methods of protection. Proper pro-
ecological investments are of great importance in this aspect. In order for an investment to be
recognized as pro-ecological, its main purpose ought to be environmental protection
(Broniewicz E., Poskrobko B. 2003).
As regards the issue of pro-ecological investments as a necessary condition for sustainable
development of agribusiness companies, it must be noted that the investment process includes
a complex of actions necessary for the realisation of a given investment. Actions related to
pro-ecological investments can be divided into phases and stages. All actions grouped in a
phase are subordinate to the realisation of the common purpose for this phase. Actions within
the phases are subordinate to the realisation of other purposes, characteristic for these

49
phases. Particular phases follow one another, and the realisation of partial goals within them
amounts to the realisation of higher purposes, at which the stages of an investment process
aim. In turn, the stage of the investment realization includes the construction, equipment,
quality check and approval of the facility (Burzynska D., 2012).
Ecological investments also require appropriate expenses. Generally, investment
expenditure for the environmental protection is described as the sum of expenses for pollution-
preventing investments (integrated) and pollution-neutralizing investments (so-called "end-of-
pipe" investments) (Kasztelan A., Bujanowicz-Haras B., 2005). A necessary condition for an
investment to be recognized as pro-ecological is its management towards the environmental
protection.
Table 1 presents expenditure for ecological investments in Poland in 2013.
Table 1
Expenditure for ecological investments in Poland in 2013
Province Total
Investor Group
businesses boroughs budget units
in thousands of PLN
Dolnoslaskie 631187.9 427938.4 185891.1 17358.4
Kujawsko-pomorskie 462823.9 267929.6 141602.8 53291.5
Lubelskie 536871.7 292170.6 208613 36088.1
Lubuskie 206418.6 76687.4 57908.4 71822.8
Lodzkie 1191721.3 294623.8 234996.4 662101.1
Malopolskie 702248.6 339038.3 306069.7 57140.6
Mazowieckie 984968.5 532751.4 414628.3 37588.8
Opolskie 337731.8 248026.2 76053.3 13652.3
Podkarpackie 470911.3 242889.3 120935.2 107086.8
Podlaskie 309594.1 195614.2 95048.9 18931
Pomorskie 526925.4 300695.7 206684.1 19545.6
Slaskie 1463250.8 934694 422825.9 105730.9
Swietokrzyskie 689353.5 537461.8 145117.9 6773.8
Warminsko-mazurskie 421931.5 267146.2 149466.9 5318.4
Wielkopolskie 804203.6 412577.3 347905.8 43720.5
Zachodniopomorskie 387663.3 262838.1 112894.2 11931
Poland 10127805.8 5633082.3 3226641.9 1268081.6
Source: Environmental Protection 2013. GUS, Warsaw, page 414
In 2012, the total amount of expenditure for ecological investments in Poland was PLN
10,127,805.80 thousand. The largest part of that amount were the investments borne by
companies – these amounted to PLN 5,633,082.30 thousand, which is 55.6% of the total. The
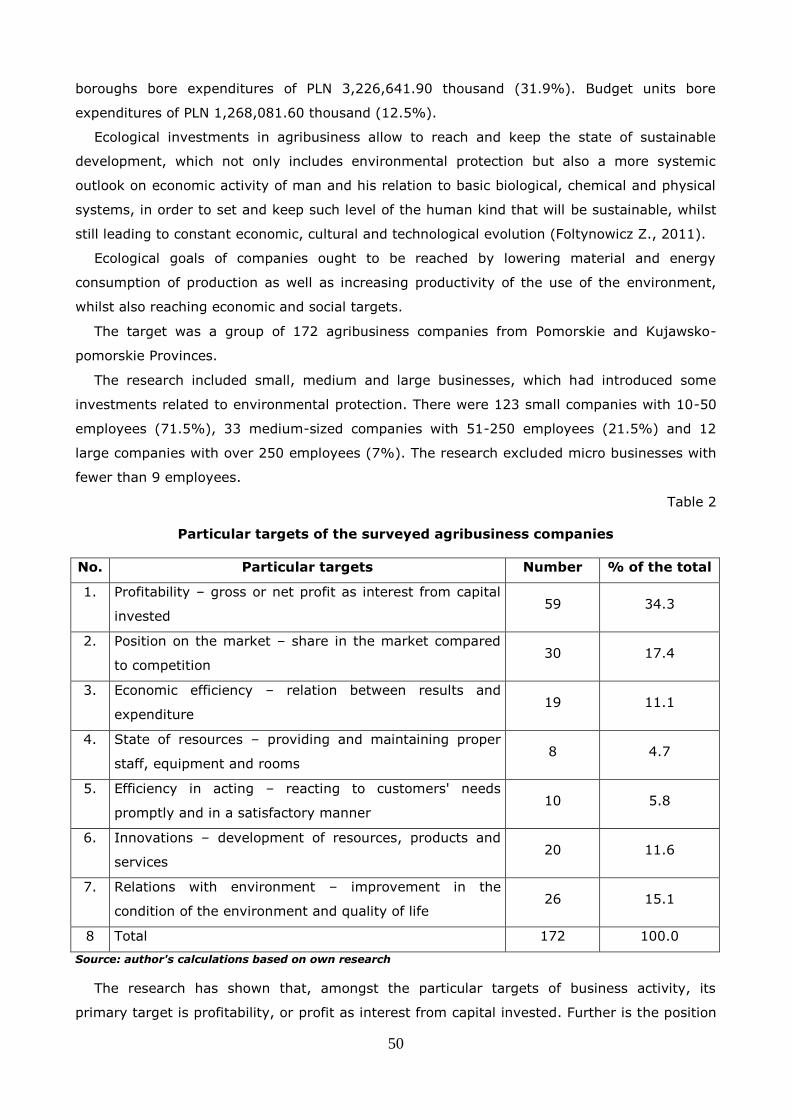
50
boroughs bore expenditures of PLN 3,226,641.90 thousand (31.9%). Budget units bore
expenditures of PLN 1,268,081.60 thousand (12.5%).
Ecological investments in agribusiness allow to reach and keep the state of sustainable
development, which not only includes environmental protection but also a more systemic
outlook on economic activity of man and his relation to basic biological, chemical and physical
systems, in order to set and keep such level of the human kind that will be sustainable, whilst
still leading to constant economic, cultural and technological evolution (Foltynowicz Z., 2011).
Ecological goals of companies ought to be reached by lowering material and energy
consumption of production as well as increasing productivity of the use of the environment,
whilst also reaching economic and social targets.
The target was a group of 172 agribusiness companies from Pomorskie and Kujawsko-
pomorskie Provinces.
The research included small, medium and large businesses, which had introduced some
investments related to environmental protection. There were 123 small companies with 10-50
employees (71.5%), 33 medium-sized companies with 51-250 employees (21.5%) and 12
large companies with over 250 employees (7%). The research excluded micro businesses with
fewer than 9 employees.
Table 2
Particular targets of the surveyed agribusiness companies
No. Particular targets Number % of the total
1. Profitability – gross or net profit as interest from capital
invested 59 34.3
2. Position on the market – share in the market compared
to competition 30 17.4
3. Economic efficiency – relation between results and
expenditure 19 11.1
4. State of resources – providing and maintaining proper
staff, equipment and rooms 8 4.7
5. Efficiency in acting – reacting to customers' needs
promptly and in a satisfactory manner 10 5.8
6. Innovations – development of resources, products and
services 20 11.6
7. Relations with environment – improvement in the
condition of the environment and quality of life 26 15.1
8 Total 172 100.0
Source: author's calculations based on own research
The research has shown that, amongst the particular targets of business activity, its
primary target is profitability, or profit as interest from capital invested. Further is the position

51
of the company on the market – or its share in the market, compared to other, competitive
companies and relations with the environment – or an improvement in the state of the
environment and quality of life.
Practice shows that until recently, ecological targets came last in the target system of most
companies. It must be noted that implementing ecological targets into businesses in highly
developed countries is clearly seen, although it plays a smaller role in small and medium-sized
companies and a much greater one in large corporations. Apart from that, the field of
business, territory of activity, competition and ecological awareness of the society are all
important when implementing ecological targets. In practice, there are many examples which
show that certain ecological targets are complementary with economic targets such as
advantage or competitive capability. Businesses, while promoting their products as
environment-friendly, or at least less harmful than those of their competition, do obtain more
benefits – both in the share in the market and profitability. The economic and ecological
criteria are often interconnected and constitute a coupled combination. Only the perspective
may vary. A number of ecological enterprises show some profitability in the long term
(Adamczyk J., Nitkiewicz T., 2007).
Within businesses, areas or fields of activity are determined by various aspects of
sustainable development. What is meant here is the integration and balancing different angles,
such as:
natural and environmental angle (showing in environmental protection);
technological angle (showing in new technologies, economizing resources);
economic angle (showing in taxes, subsidies and other economic instruments);
social angle (it is vital in Poland that the problem of unemployment be solved);
political angle (showing in the formulation of a strategy for sustainable development, its
implementation and control) (Pawlowski A., 2011).
The surveyed were asked about the leading aspect of sustainable development of
agribusiness companies (Table 3).

52
Table 3
The leading aspect of sustainable development of agribusiness companies
No. Leading aspect of sustainable development Number % of the total
1. Modernization of processing lines 12 7.0
2. Modernization of media infrastructure 18 10.5
3. Construction of a sewage processing plant (or sub-plant) 18 10.5
4. Detailed waste segregation 20 11.6
5. Ecological production 42 24.4
6. Limiting emission of toxic gases 40 23.2
7. Limiting emission of harmful dusts 22 12.8
8. Total 172 100.0
Source: author's calculations based on own research
Each of the surveyed agribusiness companies determined the leading aspect of sustainable
development being realised in the company. Most of the surveyed companies implement
ecological production (24.4%) and try to limit the emission of harmful gases (23.2%). A little
less important aspects (from the point of view of sustainable development), implemented by
the surveyed companies are: limiting the emission of harmful dusts (12.8%), detailed
segregation of waste (11.6%), construction of sewage processing plants (or sub-plants) and
modernization of processing lines.
The conditions of using the environment, which cause the most problems in the
surveyed companies, are described in Table 4.
Table 4
The conditions of using the environment, which cause the most problems in the
surveyed agribusiness companies
No. Conditions of using the environment Number % of the total
1. Sewage management 60 34.9
2. Waste management 48 27.9
3.
Regulations concerning air pollution
- gas pollution
- dust pollution)
28
14
16.3
8.1
4. Regulations concerning drinking water 22 12.8
5. Total 172 100.0
Source: author's calculations based on own research
The most problematic conditions of using the environment in the surveyed agribusiness
companies are sewage (34.9%) and waste management.
No actions of a company must lead to excessive intensification of the use of production
resources. This would cause ecological complications. It must also be noted that Poland has
not always enforced the environmental protection laws and regulations. In order to exact this

53
responsibility, the issue was institutionalized through: legal acts, norms and standards,
organizational procedures, environmental programmes and policies, environmental committees
and the right to inform about environmental protection (Gajdzik B.,2006). At present, the
companies are charged with administrative fees for using the environment, in order to cause
them to observe the environmental laws and regulations. Should the businesses not comply
with the requirements, they are also charged with additional, enormous fines. This is an
important aspect of the implementation of sustainable development, as the consequences of
long-term neglect in innovation and investments would manifest themselves in tremendous
degradation of soils, waters and air.
Sustainable development in agribusiness companies uses many different methods,
mechanisms and instruments in order to decrease the exploitation of the environment and to
reasonably use the natural resources in a business unit (Janiszewski J. M., Siemieniuk K.,
2011). These are typically ecological investments.
Table 5
Sewage management-related investments in the surveyed agribusiness companies
No. Type of investment Number % of the total
1. Devices modifying technological processes, which aim at
the prevention of pollution 32 18.6
2. Sewage networks 24 13.9
3. Sewage processing and purifying installations 34 19.9
4. Cooling water purification 28 16.3
5. Monitoring installations 8 4.6
6. Other actions (research, training) 38 22.1
7. No action 8 4.6
8. Total 172 100.0
Source: author's calculations based on own research
Sewage management-related investments (Table 5) are primarily actions towards research
and training in the matter, implementation of investments in sewage processing installations
as well as purchase and installation of pollution-reducing devices, which modify the
technological process.
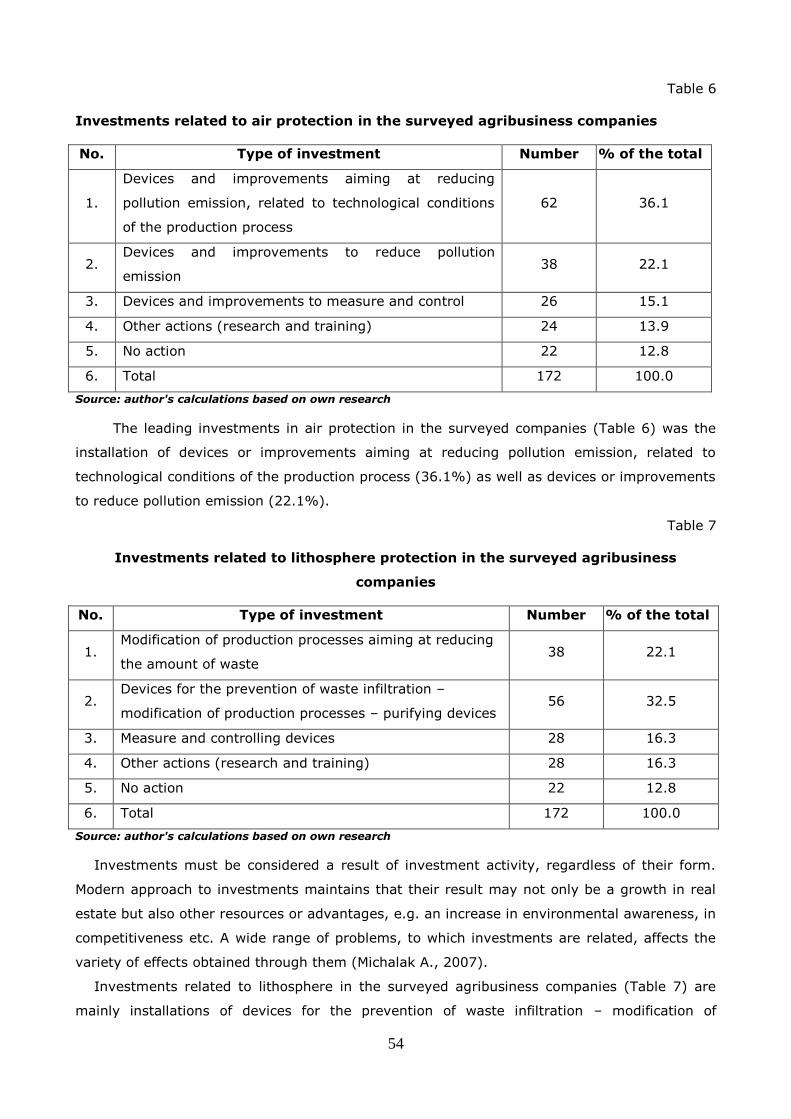
54
Table 6
Investments related to air protection in the surveyed agribusiness companies
No. Type of investment Number % of the total
1.
Devices and improvements aiming at reducing
pollution emission, related to technological conditions
of the production process
62 36.1
2. Devices and improvements to reduce pollution
emission 38 22.1
3. Devices and improvements to measure and control 26 15.1
4. Other actions (research and training) 24 13.9
5. No action 22 12.8
6. Total 172 100.0
Source: author's calculations based on own research
The leading investments in air protection in the surveyed companies (Table 6) was the
installation of devices or improvements aiming at reducing pollution emission, related to
technological conditions of the production process (36.1%) as well as devices or improvements
to reduce pollution emission (22.1%).
Table 7
Investments related to lithosphere protection in the surveyed agribusiness
companies
No. Type of investment Number % of the total
1. Modification of production processes aiming at reducing
the amount of waste 38 22.1
2. Devices for the prevention of waste infiltration –
modification of production processes – purifying devices 56 32.5
3. Measure and controlling devices 28 16.3
4. Other actions (research and training) 28 16.3
5. No action 22 12.8
6. Total 172 100.0
Source: author's calculations based on own research
Investments must be considered a result of investment activity, regardless of their form.
Modern approach to investments maintains that their result may not only be a growth in real
estate but also other resources or advantages, e.g. an increase in environmental awareness, in
competitiveness etc. A wide range of problems, to which investments are related, affects the
variety of effects obtained through them (Michalak A., 2007).
Investments related to lithosphere in the surveyed agribusiness companies (Table 7) are
mainly installations of devices for the prevention of waste infiltration – modification of
55
production processes – purifying devices (32.5%) as well as modification of production
processes aiming at reducing the amount of waste (22.1%).
Conclusions, proposals, recommendations
People's business activity is in progress in the environment, where structures of the
ecosystems are changed, natural flows of energy, matter and biodiversity are disturbed (as
executors of these processes occurring in the ecosystem). Consideration for the idea of
sustainable development on the level of the agribusiness company should mainly mean
protection of the atmosphere, lithosphere and correct waste management. This leads to
effective use of natural resources and better environment protection.
The research conducted allows to formulate the following conclusions:
1. Environment protection activities in companies show mainly in ecological investments
realized on the level of the company. These occur after considering by the company the
principles of its profitability.
2. The leading aspects of sustainable development in the surveyed companies included the
introduction of ecological production and limitation of harmful gas emission to the
atmosphere.
3. Sewage and waste management in companies constitutes the most problems
concerning the conditions of using the environment. Many companies organize research
and training related to that issue; they also introduce sewage processing investments
and install devices modifying the technological process towards the prevention of
pollution. Ecological investments prevent or eliminate negative effects of different
factors upon the environment, causing it to be polluted or physically changed.
Bibliography
1. Adamczyk J., Nitkiewicz T. (2007). Programowanie zrownowazonego rozwoju
przedsiebiorstw (Programming of Sustainable Development in Companies), Warsaw:
PWE, pp. 53-54.
2. Broniewicz E., Poskrobko B. (2003). Naklady na ochrone srodowiska. Metodyka i
wyniki badan (Environmental Protection Expenditure. Methodology and Research
Results), Bialystok: Wydawnictwo Ekonomia i Srodowisko (Bialystok: Economics and
Environment Publishing), pp. 14-15.
3. Burzynska D. (2012). Rola inwestycji ekologicznych w zrownowazonym rozwoju gmin
(The Role of Ecological Investments in Sustainable Development of Boroughs). Lodz:
Wydawnictwo Uniwersytetu Lodzkiego (Lodz: Lodz University Press), p. 46.
4. Foltynowicz Z. (2011). Ekologia przemyslowa we wdrazaniu zrownowazonego rozwoju
(Industrial Ecology in the Introduction of Sustainable Development). Poznan: Zeszyty
Naukowe Uniwersytetu Ekonomicznego, nr 199 (Poznan: Scientific Papers, University
of Economics, issue #199), pp. 91-98.
5. Gajdzik B. (2006). Zarzadzanie przedsiebiorstwem a ochrona srodowiska (Company
Management and Environmental Protection), Ekonomika i Organizacja
Przedsiebiorstwa, nr 10 (Economics and Business Organization, issue #10), pp. 49-
55.

56
6. Janiszewski J. M., Siemieniuk K. (2011). Mozliwosci wdrozenia ekoinnowacji w
przedsiebiorstwie branzy maszynowej (Possibilites of the Introduction of Eco-
innovations in a Machinery Company) [in:] B. Czerniachowicz, B. Kryk, (ed.),
Gospodarowanie, finansowanie, zarzadzanie w XXI wieku (Management, Financing,
Controlling in the 21st Century), Szczecin: Uniwersytet Szczecinski (Szczecin:
University of Szczecin), pp. 25-36.
7. Kasztelan A., Bujanowicz-Haras B. (2005). Naklady inwestycyjne przedsiebiorstw na
ochrone srodowiska w Polsce, ze szczegolnym uwzglednieniem wojewodztwa
lubelskiego (Investment Expenditure of Companies for Environmental Protection in
Poland, Particularly in Lubelskie Province) [in:] Integracja problemow srodowiskowych
i teorii zrownowazonego rozwoju w systemie zarzadzania przedsiebiorstwem
(Integration of Environmental Issues and the Theory of Sustainable Development in
the System of Company management), Bialystok: Materialy II Miedzynarodowej
Konferencji Naukowej, Politechnika Bialostocka (Bialystok: Materials for the 2nd
International Scientific Conference, Technical University of Bialystok), pp. 131-137.
8. Kielczewski D. (2010). Zrownowazony rozwoj – istota, interpretacje, zwiazek ze
spoleczenstwem wiedzy (Sustainable Development – essence, interpretations,
relation to the information society) [in:] B. Poskrobko (ed.), Ekonomia
zrownowazonego rozwoju. Materialy do studiowania (Economics of Sustainable
Development. Study Materials) Bialystok: Wyzsza Szkola Ekonomiczna (Bialystok:
University of Economics), pp. 21-22.
9. Michalak A. (2007). Finansowanie inwestycji w teorii i praktyce (Investment
Financing in Theory and Practice), Warsaw: PWN, p. 14.
10. Ochrona srodowiska 2013. (Environmental Protection 2013) Warszawa: GUS,
Warsaw: GUS, p. 414.
11. Pawlowski A. (2011). Turystyka dla zrownowazonego rozwoju - przyklad Roztocza
(Tourism for Sustainable Development – an example of Roztocze). Retrieved:
http://www.kul.pl. Access: 05.11.2014
12. Wielewska I. (2013). Ecological investment projects in the scope of activity of
agribusiness enterprises selected issues [in:] Roczniki Naukowe SERiA, tom XV,
zeszyt 3 (Scientific Yearbooks SERiA, Volume 15, paper 3), Warszawa – Poznan –
Rzeszow, p. 373.
13. Zbaraszewski W. (2008). Finansowanie ochrony srodowiska przez przedsiebiorstwa
w Polsce (Financing Environmental Protection by Companies in Poland). Ekonomika i
Organizacja Gospodarki Zywnosciowej, nr 66 (Economics and Organization of Food
Economics, issue #66), pp. 127-135.
14. Zuzek D. (2013). Business activity of small and medium enterprises in Poland in light
of the concept of sustainable development, Integrated and Sustainable Regional
Development, Jelgava, no. 31, pp. 67-72.
15. Zuzek D. (2010). Theoretical aspects of sustainable development of farms [in:] W.
Gotkiewicz (ed.) Local development – chosen factors of sustainable development of
Poland, Szczecin: Zachodniopomorski Uniwersytet Technologiczny w Szczecinie (Szczecin: West Pomeranian University of Technology in Szczecin), s. 35 – 48.

57
Proceedings of the 2015 International Conference “ECONOMIC SCIENCE FOR RURAL DEVELOPMENT” No39 Jelgava, LLU ESAF, 23-24 April 2015, pp. 57-67
YOUTH LONG-TERM UNEMPLOYMENT REDUCTION OPPORTUNITIES
Liva Grinevica, PhD*
Baiba Rivza, Dr. habil. oec.2
Latvia University of Agriculture1, 2
Abstract. Youth long-term unemployment is one of the key problems that must be
addressed not only in Latvia but also at the European Union level. In 2030, according to a
research under the ESPON 2013 Programme, Latvia is positioned as a “depressive” region with
an insufficient population of young people. Consequently, Latvia as a country with a friendly
environment for business development will not be competitive in relation to other European
countries and the flow of investment will be at risk as well as passed on other regions which
are more competitive and more developed.
The research aims to establish the view of employers on young people’s integration into the
labour market. This research is based on scientific discussion of different author opinions and
research results of expert interviews as well as on views on the future vision by industry
experts. The results of analysis show that it is difficult to find a job in rural districts. The young
people without any experience in the relevant field and without higher or professional
education and motivation to study and acquire the necessary skills are negatively evaluated.
Key words: youth long-term unemployment reduction, labour market, youth integration in
the labour market
JEL code: J64, J23
Introduction
The youth unemployment problem is one of the main tasks to deal with in European Union
planning documents. Also that kind of adjustment needs to be at Latvia’s government level
because in our country, there are demographic problems and more young people are leaving
our country with the desire to find a well-paid job or to start studies in another country for
providing a better future. Demographic, economic, political and social problems substantially
affect youth future possibilities because the authors consider that it is important to analyse the
real situation in Latvia’s labour market.
The hypothesis of the research: The youth long-term unemployment reduction opportunities
will promote regional and national economic development.
* Corresponding author. Tel.: + 371 28244527
E-mail address: [email protected]

58
The aim of the research is to establish the view of employers on young people’s integration
into the labour market.
To achieve the aim, there are set the following tasks:
1) To evaluate the theoretical aspects of the youth long-term unemployment from
different authors;
2) To make expert interviews with employers to establish their opinion of young
people’s possibilities to align with the labour market.
The following materials and methods are used to achieve the aim and fulfil the tasks:
Theoretical framework of the research: the research is based on scientific
discussion of different author conclusions of youth long-term unemployment and
possibilities to reduce it;
Research methodology: qualitative research methods, the methods of expert
interviews, discussion of the results and findings are used to reach the aim.
The authors made the expert interviews to gather information on employers’ opinion of
young people employment in their institution and difficulties with what they are ready to face.
There were made interviews with employers from the public and private sectors, for a wider
vision of the labour market. The expert interviews were conducted from September 2014 till
December 2014.
The novelty of the paper: This type of question block for expert interviews is not made yet.
The studies of the State Employment Agency involved another type of question block; the
questions were designed for a different purpose.
Research results and discussion
1. Explanation of youth long-term unemployment necessity of reduction
According to the Results of the Labour Force Survey conducted by the Central Statistical
Bureau, in the first quarter of 2014 there were 118.7 thousand unemployed persons aged 15-
74 in Latvia; of which 15.5 thousand or 13% were young people aged 15 – 24 (The share of…,
2014).
According to the OECD, giving young people the skills and tools to find a job is not only
good for their own prospects and self-esteem, it is also good for economic growth, social
cohesion and widespread well-being. That is why investing in youth must be a policy priority
the world over (OECD work on..., 2012).
Youth unemployment has been a central focus of transitions research since the 1980s,
with a significant number of studies focusing on cross-national differences in
unemployment levels as well as on the impact of active labour market policies designed
to facilitate employment access (Blanchflower et al., 2000).
Youth long-term unemployment has been investigated by different researchers such as
Audas (2005), Berde (2005), Berghman (1995, 1997), Blanchflower (2000), Doliton (2005),
Room (1995), Dietrich (2012) and others.

59
The researcher Junankar defines long-term unemployment as a 12 months period or longer
when a person is unemployed, the unemployed not only lose their skills, they lose motivation,
they fall ill. In crude economic terms, human capital is being depreciated (Junankar, 2011).
A rise in youth unemployment during a recession is to be expected. Youth unemployment is
typically higher than adult unemployment regardless of economic conditions as young people
face higher rates of labour market turnover, and spend time moving between jobs before
settling on a stable career path. In a recession this gap is amplified because, first of all, the
young people are more likely to lose their jobs, and, secondly, young entrants to the labour
market face tougher competition for jobs (Lee, et al., 2012).
According to Audas, Berde, Doliton (2005), there is a growing literature examining
many aspects of economic reform and its effect on unemployment and the labour markets
of European countries. Despite this, very little attention has been paid to the individuals
who will be most affected by these reforms: young people.
Author Dietrich considers that there are many reasons for youth unemployment: besides
the general situation on the labour market, one might mention education and training systems,
labour market and employment policies, but also the stratification and distribution of
opportunities in society. Dietrich analysed the background of the phenomenon of youth
unemployment in all its economic, social and political aspects (Dietrich, 2012).
Other authors present evidence that unemployment or non-employment in early working
life indeed has a scarring effect on individuals’ subsequent employment chances. Arulampalam
(2001) distinguishes between three scarring mechanisms: precluding accumulation of work
experience and deterioration of general skills; negative signalling effects on future earnings
and impeded future work transitions; and social network losses.
Authors, Mroz and Savage (2006), examined the long-term effects of youth unemployment
on later labour market outcomes. Involuntary unemployment may yield suboptimal
investments in human capital in the short run.
Many authors, writing about youth unemployment, mention connection between
unemployment and education, experience, future possibilities and social exclusion from the
society and labour market.
Young people undergoing such a trajectory accumulate little experience of job search and
do not develop a clear picture of what kind of job and/or what income they should be aiming
for. Furthermore, young people tend to have fewer resources than older workers and in some
countries a strong financial attachment to the family, which means that they are less mobile
(Martin, 2009).
Kieselbach and other authors theoretically distinguish six dimensions of social exclusion
(labour market exclusion, economic exclusion, institutional exclusion, exclusion through social
isolation, cultural exclusion and spatial exclusion). Kieselbach and others conclude their main
project findings as follows: the fact that a young person is unemployed seems in itself not to

60
be a sufficient predictor of the risk of social exclusion – long-term unemployment cannot even
necessarily be equated with exclusion from the labour market (Kieselbach et al., 2001).
Author Room (1995) mentioned civic integration and political participation, social protection,
integration in the welfare state and interpersonal integration in family and community
systems, besides integration in the labour market as core components of social exclusion.
Paugam (1995, 1996) and Walker (1995) shifted the focus from a static observation of the
situation to a dynamic perspective with regard to the occurrence and maintenance of poverty
from an individual or household perspective. Integrating both streams of research, Berghman
(1995, 1997) enlarged the concept of social exclusion, expressing both a theoretical shift from
the perspective of financial deprivation, resulting especially from long-term unemployment,
towards non-financial aspects of life, such as social isolation from a multi-dimensional
perspective and a shift from the static viewpoint associated with poverty to the process-
oriented framework characteristic of social exclusion.
Explaining differences in youths’ transition into employment needs to take into account,
first, demographic developments and economic growth, and second, the interplay between
these dynamics and long-standing institutional patterns, in particular regulatory provisions
influencing the supply of flexible or permanent jobs as well as education and training policies
(Biavaschi, et. al., 2013).
According to the World Development Report 2013, there are determined the main
recommendations for youth successful inclusion into the labour market. As the first
recommendation, the possibility to bring academic education closer to the private sector is
mentioned. In countries with high shares of university graduates with major difficulties in
finding adequate jobs a major option is to make academic training more labour market-
oriented, incorporating internships with employers into academic curricula so that some
experience with current work practices in the private sector can be acquired. Governments
responsible for funding academic education can require public universities to modify academic
curricula accordingly (Biavaschi, et. al., 2013). Also, that kind of recommendation will be
useful to realise in Latvia, because then intellectual capital for Latvia’s entrepreneur interests
will be built, and it will develop the employability and productivity of young people.
The second recommendation suggests to stimulate the creation of formal and sustainable
jobs. In countries where high shares of informal employment form a major barrier to upward
mobility and economic progress, policies should be designed to create more enterprises in the
formal sector which offer formal jobs. This can be addressed by economic policy reforms such
as the abolition of bureaucratic business registration procedures, tax reforms, stimulating
investment in the private sector and creation of formal companies start-up support (Biavaschi,
et al., 2013).
The authors combine findings from different authors who research youth long-term
unemployment with that the youth long-term unemployment are affected by social factors
such as social inclusion and exclusion, financial situation, level of education and career

61
possibilities. The authors consider that youth long-term unemployment is directly relevant with
successful inclusion into society and labour market trends.
2. Expert opinions of youth’s opportunities for integration into Latvia’s labour
market
To understand the situation of youth employability from the entrepreneurs and executives
of state institutions, the authors made interviews with 10 experts from different sectors. There
were formulated 7 questions for each of expert. Table 1 demonstrates the information
provided by the respondents. In the paper, entrepreneurs and representatives of institutions
are mentioned as experts. They were selected in a random way, focusing on enterprises and
institutions which positioned themselves in rural areas or had a direct link with activity in rural
areas.
Table 1
Information of the experts from Latvia’s cities and rural areas (n=10)
No. Enterprise/
Institution
Sector Number of
Employees
City/ Rural
area
1. SIA Market and social
researches
8 Riga
2. The municipal authority
- kindergarten
Pre-school
education
26 Jumprava,
Lielvarde
municipality
3. SIA Auto parts retail 2 Lielvarde
4. SIA Retail business 4 Lielvarde
5. SIA Construction
industry
85 Jelgava
6. The municipal authority-
tourism centre
Tourism 12 Jelgava
7. Country Council Social sector and
education
105 Jelgava
8. Fashion Shop Sewing services 2 Jelgava
9. Repository of local
history
Research 30 Jelgava
municipality
10. High School Education 35 Skaistkalne,
Vecumnieki
municipality
Source: authors’ interview results
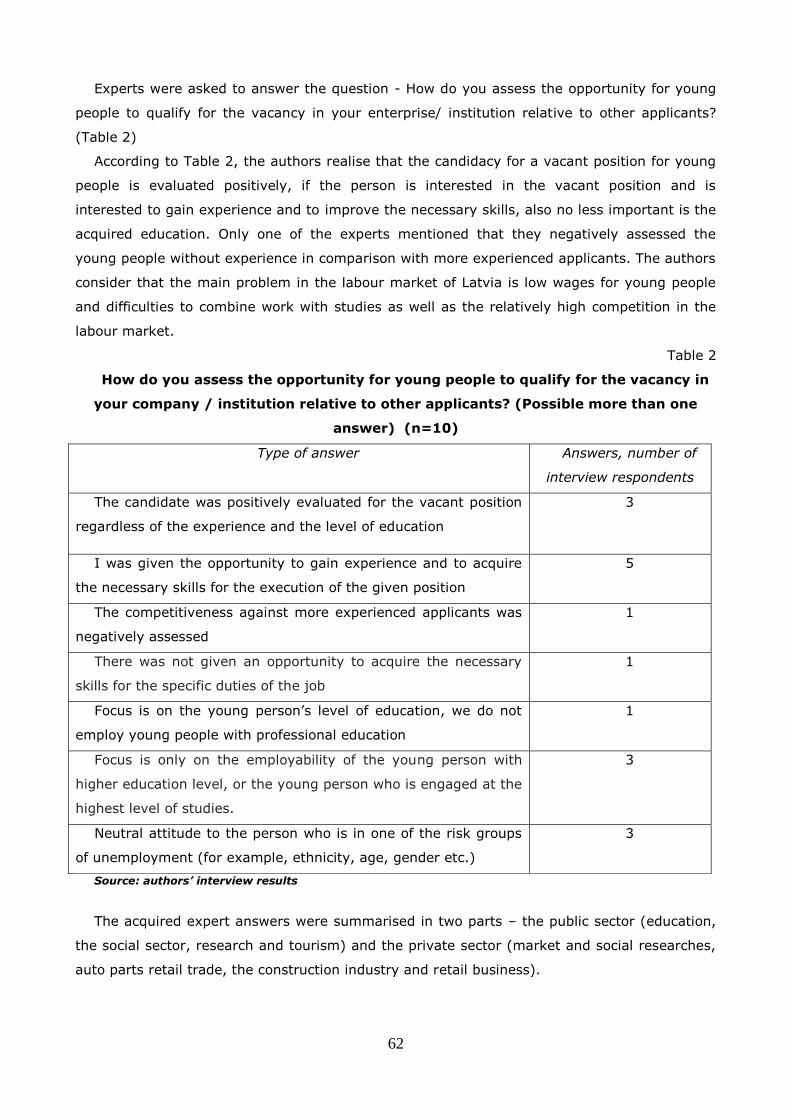
62
Experts were asked to answer the question - How do you assess the opportunity for young
people to qualify for the vacancy in your enterprise/ institution relative to other applicants?
(Table 2)
According to Table 2, the authors realise that the candidacy for a vacant position for young
people is evaluated positively, if the person is interested in the vacant position and is
interested to gain experience and to improve the necessary skills, also no less important is the
acquired education. Only one of the experts mentioned that they negatively assessed the
young people without experience in comparison with more experienced applicants. The authors
consider that the main problem in the labour market of Latvia is low wages for young people
and difficulties to combine work with studies as well as the relatively high competition in the
labour market.
Table 2
How do you assess the opportunity for young people to qualify for the vacancy in
your company / institution relative to other applicants? (Possible more than one
answer) (n=10)
Type of answer Answers, number of
interview respondents
The candidate was positively evaluated for the vacant position
regardless of the experience and the level of education
3
I was given the opportunity to gain experience and to acquire
the necessary skills for the execution of the given position
5
The competitiveness against more experienced applicants was
negatively assessed
1
There was not given an opportunity to acquire the necessary
skills for the specific duties of the job
1
Focus is on the young person’s level of education, we do not
employ young people with professional education
1
Focus is only on the employability of the young person with
higher education level, or the young person who is engaged at the
highest level of studies.
3
Neutral attitude to the person who is in one of the risk groups
of unemployment (for example, ethnicity, age, gender etc.)
3
Source: authors’ interview results
The acquired expert answers were summarised in two parts – the public sector (education,
the social sector, research and tourism) and the private sector (market and social researches,
auto parts retail trade, the construction industry and retail business).

63
The experts from the public sector to the question “What is your attitude to the fact
that the young people build and accumulate their experience as well as develop a career in
your company / institution?” answered:
Positive, because we lack creativity, there is need for young people with
knowledge of technologies.
Positive, because the institution has very minimal staff turnover because it is
difficult to find work in our small rural district. Any young person who really wants to
work is trying to show themselves of the right side because once a year, for the
technical staff among employees, a work quality evaluation is conducted.
The training would be certainly supported, such as graduate studies. The young
people need to stay in Latvia, work in Latvia, we need to pay attention to find out how
to attract them.
Repeatedly, the answer to the above-mentioned question of the representatives of the
national authorities voiced a short - positive value. Entrepreneur answers to the above-
mentioned question were as follows:
Attitude is positive; the young persons should have an opportunity to prove
themselves.
I support it, because of need for new change.
All of the experts were asked to mention the most important criteria by which the
enterprise/ institution is considering the young person's adequacy to the vacancy:
How much the young person knows about the enterprise where he/she wants to work:
willingness to work, initiative; appropriate education; communicativeness, inclusion into the
team; the desire to acquire new knowledge; creativity; technological knowledge; openness for
creative ideas; tolerance against the colleagues; quality of work (competence, delivery times);
discipline; loyalty; diligence.
Replies to this question from the representatives from both national authorities and the
private sector were equivalent.
Broader discussions rise a question: “What is your attitude towards the employment of a
young person with education lower than professional?”
The experts from the public sector consider that:
If it is possible to make a choice – we will give preference to young people with
education in tourism because without education it only can be auxiliary work for a
short-term;
We do not accept and do not have a suitable vacancy for young people without
education;
If higher education is not required in the job description and young people are
diligent, conscientious, positive and willing to work, the attitude is positive.
The experts from the private sector think that:

64
The young person should learn, because in the future without education it will
not be possible to find well paid work;
In our professions, everything is possible to learn in practice, because the
company has a strong experienced staff composition;
It will be difficult to offer something if a person has not chosen the field of
education yet; it depends on the personality.
The answers from some experts were equivalent to other expert answers and therefore only
the key answers were identified.
Answers from both sectors to the question: “What is your attitude towards the employment
of a young person who is studying at the highest level of studies currently and has not yet
acquired higher education?” are as follows:
If the young individual has skills and wants to study, then there is no objection;
If the young individual has no skills and talent, this candidate does not fit for us;
Currently, two young women are working in our institution, who continue to
study for higher education; they are supported – if it is necessary to take a vacation for
their studies;
Positive, one can start to work;
We engaged young people if they are studying in the relevant field;
All of the experts answered positively to the question if there would be possibility for young
persons if they could prove themselves as motivated to success, to be promoted, to the
gradual rise in wages, to the development of individual abilities and skills in the relevant
sectors within the framework of their profession.
In order to identify the views of experts on youth labour market opportunities, the experts
were asked to mention the most important measures for state institutions to stabilise the
youth labour market situation. The experts mentioned the following opportunities:
Alignment of the education system;
Tax preferences for employers;
Tax preferences for young people who are studying or having social instability;
Various support measures for those who employ young people;
A special grant programme for jobs;
Additional bonuses for employers;
Mentor programme;
Grants for entrepreneurs who employ vocational high school students;
For vocational students who are studying at government-financed study places,
a certain period to work in this country needs to be set;
Placements for practical training;
Student entrepreneurship with possibilities to learn practices;
Country’s growth.

65
The authors wanted to particularly accent and totally agreed to two experts’ answers to the
above-mentioned question because it showed the main Latvian labour market trend in all the
regions of Latvia. An entrepreneur from Riga, who worked on market and social studies,
considered that there is no single measure particularly for the youth labour market; if there
are common problems in the labour market, it also refers to the young people.
An expert from the tourism sphere thought that there was a huge amount of work in her
institution, there should be more people. If tax preferences were imposed for the young
people, they would employ more young people.
In general, the expert opinion confirms author Dietrich’s view on youth unemployment as a
problem regulated by employment policies, for example, tax incentives for employers who
employ young people.
Conclusions
The youth long term unemployment is affected by the economic and demographic
growth, and the interaction between them. Also, it is significant to get education and
experience that are the crucial elements to link youths’ competences with employers’
needs. Bringing studies in professional schools and universities closer to the needs of
labour market can help young people to get a more sustainable job.
In general, according to the expert answers to the questions, there are positive
attitudes for employing the young people if these persons are accurate, operative,
interested in the industry of the enterprise, want to study in that field and get
experience from their colleagues.
One of the most important measures for increasing the demand for young people in the
labour market is to reduce taxes for entrepreneurs when they are employing young
people, especially those who are studying.
According to the interview results, most of the entrepreneurs are positively disposed
that young people are studying at the highest level of studies, especially in the same
field as the institution or enterprise.
An employer focuses on the young people attitude to do job responsibilities and
opportunity to combine work with studies.
An overall evaluation reveals that the youth long-term unemployment is substantially
affected by the national economic situation in rural areas, the low demand in the labour
market and the demographic characteristics of population, which in general significantly
affects the whole community of employers.
Acknowledgements
The preparation of the paper was supported by the National Research Program 5.2. Economic
Transformation, Smart Growth, Governance and Legal Framework for the State and Society for
66
Sustainable Development-a New Approach to the Creation of a Sustainable Learning
Community, Project EKOSOC_LV.
Bibliography
1. Arulampalam, W. (2001) Is Unemployment Really Scarring? Effects of Unemployment
Experiences on Wages. The Economic Journal No.111, pp. 585–606.
2. Audas, R., Berde, E., Doliton, P. (2005) Youth Unemployment and labour market
transitions in Hungary, UK: London, Routledge, Education Economics, No. 13., Vol.1.,
pp. 1-25.
3. Berghman, J. (1995) Social Exclusion in Europe: Policy Context and Analytical
Framework. The Measurement and Analysis of Social Exclusion, Bristol: Policy Press, pp.
10–28.
4. Berghman, J. (1997) The Resurgence of Poverty and the Struggle against Exclusion: A
New Challenge for Social Security in Europe? International Social Security Review
50(1), pp. 3–21.
5. Biavaschi, C., Eichhorst, W., Ginlietti, C., et al. (2013) Youth Unemployment and
Vocational Training. World development Report 2013, Retrieved:
http://siteresources.worldbank.org/EXTNWDR2013/Resources/8258024-
1320950747192/8260293-1320956712276/8261091-
1348683883703/WDR2013_bp_Youth_Unemployment.pdf. Access: 19.12.2014.
6. Blanchflower, D. G., Freeman, R. B. (2000) Youth Employment and Joblessness in
Advanced Countries. Chicago: University of Chicago Press.
7. Dietrich H. (2012) Youth unemployment in Europe. Theoretical Considerations and
Empirical Findings, Retrieved: http://library.fes.de/pdf-files/id/ipa/09227.pdf. Access:
19.12.2014.
8. Kieselbach, T., Beelmann, G., Stritzl, A., Traiser, U. (2001) Comparative Analysis of the
Risk of Social Exclusion. pp. 27-74.
9. Lee, N., Sissons, P., Balarm, B., Jones, K., Cominetti, N. (2012) Short-term Crisis Long-
term Problem? Adressing the Youth Employment Challenge, Retrieved:
http://www.theworkfoundation.com/DownloadPublication/Report/314_short-
term%20crisis_long_term_problem.pdf. Access: 19.12.2014.
10. Gary, M. (2009) A Portrait of the Youth Labor Market in 13 Countries, 1980–2007,
Monthly Labor Review, July, pp. 3–21.
11. Junankar, P .N. (2011) The Global Economic Crisis: Long-term Unemployment in OECD.
Institute for the study of Labour, Germany, No.6057, pp.3-50.
12. Mroz, T. A., Savage, T. H. (2006) The Long-Term Effects of Youth Unemployment.
Human Resources 41(2), pp. 259–293.
13. OECD work on Youth (2012) Retrieved: http://www.oecd.org/youth.htm. Access:
19.01.2015.
14. Paugam, S. (1995) The Spiral of Precariousness: A Multidimensional Approach to the
Process of Social Disqualification, The Measurement and Analysis of Social Exclusion,
Bristol: Policy Press, pp.49–79.
15. Paugam, S. (1996) Poverty and Social Disqualification: A Comparative Analysis of
Cumulative Social Disadvantage in Europe, Journal of European Social Policy 6(4), pp.
287–303.
16. Room, G. (1995) Poverty and Social Exclusion: The New European Agenda for Policy
and Research. The Measurement and Analysis of Social Exclusion, Bristol: Policy Press,
pp. 1–9.

67
17. Territorial Dynamics in Europe. Trends in Population Development (2008) Territorial
Observation No. 1., The ESPON 2013 Programme, European Union, European Regional
Development Fund, Belgium, pp. 1-15.
18. The Share of Unemployed Persons aged 15 - 24 is lower than a year ago (2014),
Retrieved: http://www.csb.gov.lv/en/notikumi/share-unemployed-persons-aged-15-24-
lower-year-ago-41182.html. Access: 19.01.2015.
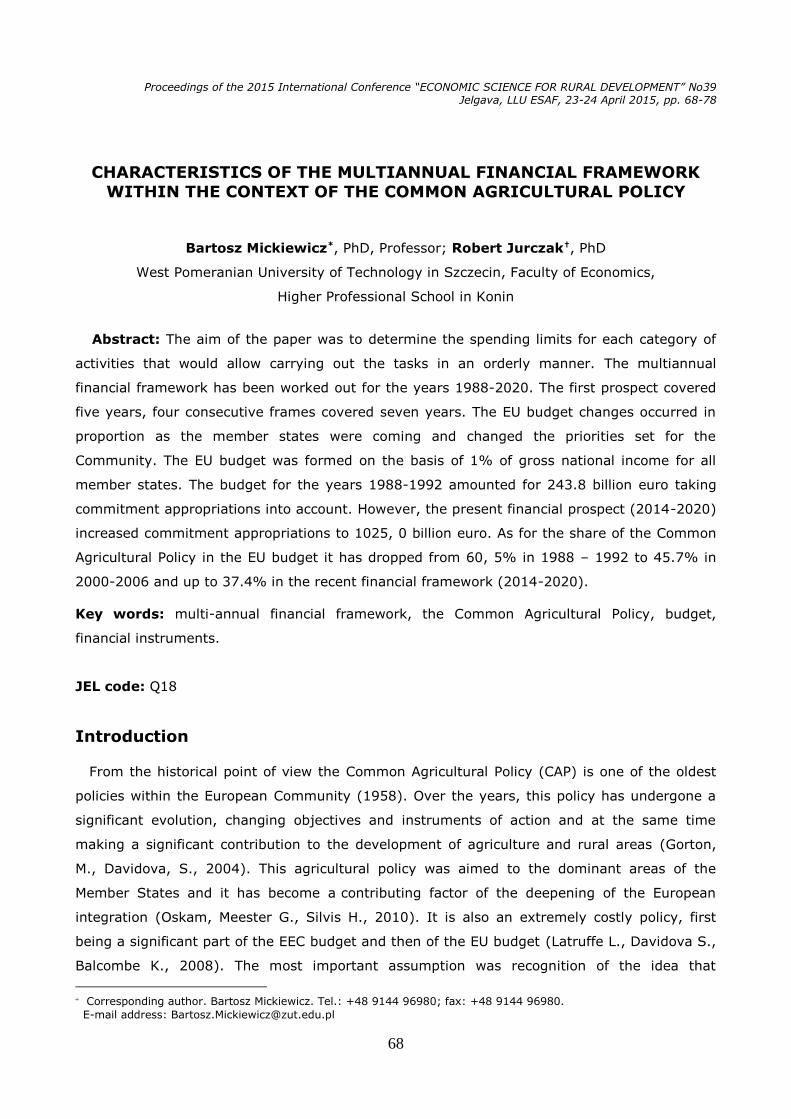
68
Proceedings of the 2015 International Conference “ECONOMIC SCIENCE FOR RURAL DEVELOPMENT” No39 Jelgava, LLU ESAF, 23-24 April 2015, pp. 68-78
CHARACTERISTICS OF THE MULTIANNUAL FINANCIAL FRAMEWORK
WITHIN THE CONTEXT OF THE COMMON AGRICULTURAL POLICY
Bartosz Mickiewicz*, PhD, Professor; Robert Jurczak†, PhD
West Pomeranian University of Technology in Szczecin, Faculty of Economics,
Higher Professional School in Konin
Abstract: The aim of the paper was to determine the spending limits for each category of
activities that would allow carrying out the tasks in an orderly manner. The multiannual
financial framework has been worked out for the years 1988-2020. The first prospect covered
five years, four consecutive frames covered seven years. The EU budget changes occurred in
proportion as the member states were coming and changed the priorities set for the
Community. The EU budget was formed on the basis of 1% of gross national income for all
member states. The budget for the years 1988-1992 amounted for 243.8 billion euro taking
commitment appropriations into account. However, the present financial prospect (2014-2020)
increased commitment appropriations to 1025, 0 billion euro. As for the share of the Common
Agricultural Policy in the EU budget it has dropped from 60, 5% in 1988 – 1992 to 45.7% in
2000-2006 and up to 37.4% in the recent financial framework (2014-2020).
Key words: multi-annual financial framework, the Common Agricultural Policy, budget,
financial instruments.
JEL code: Q18
Introduction
From the historical point of view the Common Agricultural Policy (CAP) is one of the oldest
policies within the European Community (1958). Over the years, this policy has undergone a
significant evolution, changing objectives and instruments of action and at the same time
making a significant contribution to the development of agriculture and rural areas (Gorton,
M., Davidova, S., 2004). This agricultural policy was aimed to the dominant areas of the
Member States and it has become a contributing factor of the deepening of the European
integration (Oskam, Meester G., Silvis H., 2010). It is also an extremely costly policy, first
being a significant part of the EEC budget and then of the EU budget (Latruffe L., Davidova S.,
Balcombe K., 2008). The most important assumption was recognition of the idea that
Corresponding author. Bartosz Mickiewicz. Tel.: +48 9144 96980; fax: +48 9144 96980.
E-mail address: [email protected]
69
agriculture is a special sphere, both economically and socially, primarily because of the diverse
natural conditions and different production structures (Sarris A.H., Doucha T., Mathijs E.,
1999). The CAP objectives formulated from the beginning assumed increasing of the
agricultural productivity, while ensuring the safety of the food supply (Swinnen J.F.M., 2001).
Secondly, it was expected that the food will be delivered to consumers at affordable prices,
which will stabilize the market, and on the other hand, will provide an appropriate standard of
living for the rural population. The implementation of these objectives was based on the three
guiding principles, namely: 1. market uniformity, 2. Community preferences 3. financial
solidarity (Roljecić S., Gruić B., Saric R. 2012). After the initial period of support of the
agricultural productivity growth, there appeared surpluses, which had to be removed from the
market and used. Through successive reforms a European model of agriculture was developed,
the essence of which was to reconcile the multifunctionality of agriculture with the process of
reinforcement its competitiveness (The Single Payment, 2010).
The material, purpose and scope of the research
The Multiannual Financial Framework (MFF) was introduced first on the basis of the Treaty
establishing the EEC (1958), then on the Treaty on functioning of the European Union (1993),
and now on the Treaty of Lisbon (2007). Under the Treaty of Lisbon, the multiannual financial
framework changed from the inter-institutional agreement to the binding legal instrument.
According to the decisions taken on the MFF, the Community funding was firstly fixed for a
period of at least five years, after that for a period of 7 years. The Multiannual Financial
Framework was defined in the regulations adopted by the Council and the Commission, which
were later authorized by the European Parliament. For financial prospects the long-term and
annual amounts (ceilings) on EU expenditures on the whole and for the main categories of
expenses (headings) were fixed (Mickiewicz B, Prus P., 2014).
The aim of the paper was to determine the spending limits for each category of activities
that would allow carrying out the tasks in an orderly manner and present five financial
frameworks of the European Union CAP from historical and future points of view. In addition,
the MFF had to provide a predictable flow of funds for the implementation of long-term
priorities set by the Community as well as the liquidity of the annual budgetary procedure.
Appropriations for payment were determined by the amount of spending in a particular
financial year, incurred to meet the budgetary commitments. The difference between
commitment and payment appropriations arose from the fact that the commitments to long-
term programmes and projects were generally recorded in the year in which it was decided to
grant them but they were later paid as a programme or project had been implemented. The
aim of the study was to present the evolution in the creation of the European Union's financial
framework, with particular emphasis on spending for activities related to the Common
Agricultural Policy. When analyzing the framework it should be noted that in every period a
different term was used to specify the Common Agricultural Policy, as, for example, the

70
agricultural guidance, the natural resource management and conservation, and recently the
sustained growth, or natural resources. These changes resulted from approaches to
programming concepts developed in the Community and putting other accents on a given
activity.
The main research method was analyses of financial and statistical materials from the
European Union (EU general budget internal materials and presentation for selected years).
The study covers a period of 1988-2020, which contains a single 5-year outlook and four 7-
year outlooks. The study is based mainly on the European legislation, which presents the
accurate data on the category of activities, the amount of the annual ceilings for commitment
and payment appropriations for each financial outlook.
The first EU financial prospect for 1988-1992
The first financial prospect covered the five-year programming period, from 1988 to 1992.
The first long-term financial framework including regulations on cooperation and budgetary
discipline was adopted in 1988. The primary objective of the framework was to increase
expenses, which were linked to the projected growth of income within the EC financial system
reform as well as to changes in their structures. A further aim was to increase the social and
economic cohesion of the EC. In the context of the given prospect it was also assumed to
increase the budgetary discipline, to maintain control over expenditure growth, in particular
over the Common Agricultural Policy (CAP) as well as linking the amount of the Member
States' contributions to the budget of the EC with the level of their wealth. In the analyzed
period of 1988-1992 12 countries belonged to the Community. The below mentioned countries
joined the six founding members of the Community, accordingly: three countries (Denmark,
Ireland and Great Britain) in 1973, one country (Greece) in 1981 and two countries (Spain and
Portugal) in 1986. It is considered that during this period the EEC budget ranged annually from
43.8 billion to 50.1 billion euro. According to the Delors package I with the necessary changes
in the own resources ceiling were also adopted. In the period of the first financial prospect it
was assumed that in order to achieve the objectives the Community would require a gradual
increase in the EU budget from 1.15% of GDP in 1988 to 1.20% of GDP in 1992. In this budget
a particular role in formation of the CAP was played by the then active European Agriculture
Guidance and Guarantee Fund, to which 142.2 billion euro or 60.5% of the total expenditure
was allocated.

71
Table 1.
The multiannual financial framework for 1988-1992 (in millions of euro)
Specification 1988 1989 1990 1991 1992 Total Per cent
European Agriculture Guidance and Guarantee Fund
27500 27700 28400 29000 29600 142200 60.5
Structural operations 7790 9200 10600 12100 13450 53140 22.6
Actions with the multi-annual allocations
1210 1650 1900 2150 2400 9310 3.9
Other actions 2103 2385 2500 2700 2800 12488 5.3
Repayments and administration
5700 4950 4500 4000 3550 22700 9.5
Monetary reserve 1000 1000 1000 1000 1000 5000 0.1
Commitment appropriations 45303 45885 48900 50950 52800 243838 101.9
Total payments 43779 45300 46900 48900 50100 234979 100.0 Source: General budget of the EEC for 1988-1992
Prior to the adoption of the multiannual financial framework, there appeared adverse
phenomena which impeded the continuation of the existing rules of the Common Agricultural
Policy. In the 1970s and 1980s countries of the Community became self-sufficient in terms of
food supply and the agrarian structure and farmers' incomes improved significantly. However,
the cost of this increase was serious, because it generated an excessive increase of expenses
for the CAP. There was a surplus of food, a substantial increase in prices of agricultural
products for consumers as well as environmental degradation linked with the intensification of
agricultural production.
Therefore, it was necessary to reform the CAP by partially limiting the intensity of
agricultural production. The regulations for the CAP set the upper limit of expenditure on the
organization of agricultural markets, introduced the principle of automatic price reduction after
exceeding the ceiling as well as the programme for elimination of agricultural land from
production. These targeted changes in the CAP led also to a reduction of the budget costs of
the CAP and to its acceptance on the international scene in the context of the agricultural
negotiations in the Uruguay Round of GATT in 1986. However, these difficulties caused
persistent disparities in farmers’ incomes that in the 1980s were already half lower than the
incomes received in non-agricultural sectors of the economy.
The second EU financial framework for 1993-1999
The framework for 1993-1999 launched 7-year programming periods in the European
Community, which are up to date. In considering this prospect it should be taken into account
that in 1992 the Maastricht Treaty establishing the European Union was signed. The so-called
fourth EU enlargement took place in 1995 when Austria, Finland and Sweden joined the
Community. By this the number of the new EU Member Countries increased from 12 to 15 in
1995. The concepts, on which the new financial frameworks were based, were set out in the
next reform package, referred to as the Delors’s II package. As in the case of the first financial
prospect, also in this case it was considered necessary to further increase spending on
economic and social cohesion of the Community (Russell, 2012). Within this package, the

72
Commission presented proposals including the need for further changes in the EU budget.
Among the new trends the inter-institutional agreement should be mentioned, which included
a new procedure for cooperation between the Commission, the Council and the European
Parliament in the budgetary process. The so-called ‘trialogue” should be included to the
important measures. It meant that before making a decision regarding the general budget
priorities as well before the presentation of the budget by the Commission, the common
position should be worked out. It was assumed that the EU budget cannot exceed 1.24% of
the Gross National Income (GNI) of the Member States, which in fact fluctuated around 1%.
Such a percentage each Member State paid to the general budget of the EU.
Table 2.
Multiannual Financial Framework for 1993-1999 (in millions of euro)
Specification 1993 1994 1995 1996 1997 1998 1999 Total Per
cent
Agricultural guidance 35230 35095 35722 36364 37023 37697 38389 255520 50.5
Structural measures 21277 21885 23480 24990 26526 28240 30000 176398 34.8
Internal policy 3940 4084 4323 4520 4710 4910 5100 31587 6.2
External policy 3950 4000 4280 4560 4830 5180 5600 32400 6.4
Administrative expenses 3280 3380 3580 3690 3800 3850 3900 25480 5.0
Reserves 1500 1500 1100 1100 1100 1100 1100 8500 1.7
Commitment
appropriations 69177 69944 72485 75224 77989 80977 84089 529885 104.6
Required payment appropriations
65908 67944 69150 71290 74491 77249 80114 506146 100.0
Source: EU general budget for 1993-1999
From this prospect the budget for the Common Agricultural Policy was still high and
amounted to 255.5 billion euro (50.5%), so corrective measures defined as the MacSharry
reform of the CAP were introduced. The MacSharry reform was to change the guidance of the
agricultural policy, which resulted in increase of surplus production, stagnation of incomes of
agricultural holdings despite increasing expenditures and reducing the number of people
employed in agriculture as well as an increase in the cost of the budget allocated to
agriculture. Another aspect of the reform was the shift from market price support to direct
income support. In this way, since 1993, the process of introducing the principles of direct
payments started. Among the basic actions of the reform cuts in price subsidies, we may
mention about the introduction of area payments linked with the setting aside and the level of
production in the past. Therefore, the proposed reorienting of the Common Agricultural Policy,
also sought to take into account the social and environmental aspects, so as to enable
sustainable development of rural areas and preserve the environment. In addition, the
Community support was directed to the development of agro-tourism and creating new jobs in
rural areas. Thanks to these reforms, the market balance improved and the state inventories
decreased. Moreover, the level of employment in agriculture also decreased. The CAP reform

73
contributed to the increase in transparency of the aid to farmers, and thus to better control of
the expenditure for this purpose.
The third EU financial framework for 2000-2006
The size and structure of financial expenditure for 2000-2006 was formed with a view to the
adoption of the new Member States and the need for changes in the functioning of the CAP
resulted from the negotiations under the WTO (Agreement, 1999). Initially it was planned that
the six new Member States would join the EU as early as 2002. However, after long
negotiations the accession covered 10 countries, and the Accession Treaty was signed in
Athens in 2003 but the actual membership took place on 1 May 2004. The enlargement
process since May and not from the beginning of the year was dictated by the EU budget
shortages, as the full financial year began in 2005. The basis for the adoption of the next
financial prospect was a document called "Agenda 2000". The proposals included in it
concerned the reform of the Common Agricultural Policy, the changes in financing the regional
development as well as the principles of financing the enlargement process of the new Member
States. The separation of pre-accession aid expenditures and reserving expenses for the new
Member States were new elements in the prospect. Expenditures on pre-accession assistance
were set at 23, 6 billion euro while for the extension of the Common Agricultural Policy
(agriculture) it was provided 29, 6 billion euro (EP and the Council Decision, 2003).
Table 3.
Multiannual Financial Framework for 2000-2006 (in millions of euro)
Specification 2000 2001 2002 2003 2004 2005 2006 Total Percent
Agriculture 41738 44530 46587 47378 49305 51439 52618 333595 45.7
Including: direct payments
37352 40035 41992 42680 42769 44598 45502 294928 40.4
Accompanying measures
4385 4495 4595 4698 6536 6841 7116 38666 5.3
Structural measures
32678 32720 33638 33968 41035 42441 44617 261097 34.7
Internal policy 6031 6272 6558 6796 8722 9012 9385 52776 7.3
External policy 4627 4735 4873 4972 5082 5119 5269 34677 4.9
Pre-accession aid 3174 3240 3328 3386 3455 3472 3566 23621 3.3
Administration 4638 4776 5012 5211 5983 6185 6528 38333 5.1
Reserves 906 916 676 434 442 446 458 4278 0.7
Compensation 0 0 0 0 1410 1305 1074 3789 0.6
Commitment appropriations
93792 97189 100672 102145 115434 119419 123515 752166 100.0
Payment appropriations
91322 94730 100078 102767 111380 114060 119112 733449 102.3
Source: EU general budget for 2000-2006
From the point of view of the Common Agricultural Policy "Agenda 2000" contained some
important findings. For the Common Agricultural Policy listed in the framework as "agriculture"
it was provided a total of 333, 6 billion euro or 45.7% of the general commitments, including
40.4% on direct payments. The reform programme called "Agenda 2000" foresaw the

74
introduction of quite significant changes to the Common Agricultural Policy, namely enhancing
the competitiveness of agriculture, including the transformation of the organization of
agricultural markets; determination of the ceilings’ size for direct payments, ensuring the
multifunctional nature of agriculture, accelerating the development of rural areas, increasing
the safety and quality of food. The Commission concluded that agriculture affected by multiple
crises (BSE) had to be thoroughly reformed was in order to prepare for the following
enlargement of the Union. During the period of the prospect a very important EU Regulation of
2003 was worked out. Within this reform a new system of direct support for farmers called
also the single payment scheme was introduced. The single payment scheme replaced the
already existing agricultural systems related to specific sectors. The main objective was to
provide a basic income support to farmers at an appropriately high level. It gave farmers the
freedom of production corresponding to the market demand, while respecting the principles of
food safety. The new single payment scheme came into force in 2005.
Fourth financial prospect for 2007-2013
The financial prospect for 2007-2013 compared with the previous one had another system of
the major expenditures, and it was not a technical difference but the difference of a
fundamental nature, marking a change of priorities in the financing of the Union. The changes
sought to ensure the sustainable economic growth by increasing the competitiveness of the
economy, ensuring the internal consistency, proper management and protection of natural
resources. A fundamental change in comparison with all the previous financial prospects
involved placing first expenses related to the financing of actions aimed at increasing the
international competitiveness of the EU economy and its regional cohesion, that is, the
reduction of differences in the level of economic development, both among the Member States
and among regions in these countries. At the same time the agriculture related expenses,
which were dominant in the previous prospects, were included in the group expenditure under
the heading "Management of Natural Resources and Their Protection", which meant a new look
at agriculture and the problem of its funding from the Community.

75
Table 4.
The multiannual financial framework for 2007-2013 (in millions of euro)
Specification 2007 2008 2009 2010 2011 2012 2013 Total Per cent
Sustainable growth 53979 57653 61696 63555 63638 66628 69621 436770 47.2
Management of
natural resources and their protection
55143 59193 56333 59955 60338 60810 61289 413061 44.6
including: market related expenditure and direct payments
45759 46217 46679 47146 47617 48093 48574 330085 35.6
Citizenship, freedom, security and justice
1273 1362 1518 1693 1889 2105 2376 12216 1.3
The EU as a global partner
6578 7002 7440 7893 8430 8997 9595 55935 6.0
Administration 7039 7380 7525 7882 8334 8670 9095 55925 6.0
Compensations 445 207 210 0 0 0 0 862 0.1
Commitment
appropriations 124457 132797 134722 140978 142629 147210 151976 974769 105.2
Appropriations for payments
122190 129681 120445 134289 134263 141273 143153 925294 100.0
Source: EU general budget for 2007-2013
From the point of view of the Common Agricultural Policy and access to financial instruments
it should be noted that two more states (Bulgaria and Romania), which were the countries with
highly fragmented agricultural and structural problems, joined the EU in 2007. In support of
the CAP it was provided 413, 1 billion euro or 44, 6% of the total expenditure budget,
including 35.6% on expenses related to the market and area payments. In 2007 functioning of
the Common Agricultural Policy (Health Check), was also reviewed, which resulted from the
provisions made in the reform of the Common Agricultural Policy of 2003. As part of this
package, the European Commission was required to assess the functioning of the reformed
agricultural policy of the EU as well as its simplification. As part of these commitments, in 2007
the Commission prepared a report on the cross-compliance. As a result, the separation of
payments from production (decoupling) and a new model for the implementation of the direct
payment system came into use. As for the functioning of the financial instruments of the CAP,
there was a change in the agricultural funds. Until 2006 the CAP was supported by the
European Agricultural Guidance and Guarantee Fund, and since 2007 the Common Agricultural
Policy has been financed from the two funds: the European Agricultural Guarantee Fund and
the European Agricultural Fund for Rural Development.
Fifth financial prospect for 2014-2020
The multiannual financial framework for 2014-2020 includes a range of new programmes,
which contain the European policy priorities for the next seven years, such as research and
innovation (Horizon 2020), joint transport links, energy and IT infrastructure in all Member
States (CEF), education (Erasmus +), possibility of getting jobs for young people (youth
employment initiative), the competitiveness of European enterprises (COSME) and a renewed

76
Common Agricultural Policy. The new financial framework was developed by the Council
Regulation of 2011 defining the framework for the discussed years. In these guidelines some
principles, including the principle of flexibility, unity and accuracy, the principle of universality,
balance and other were introduced (Ordinance, 2011). The new MFF was divided into five
categories of expenditure ("headings") for the different spheres of the EU activities, namely: 1.
Smart and inclusive growth, 2. Sustainable growth and natural resources, 3. Security and
citizenship, 4.Global Europe, 5. Administration. A new prospect involves already 28 Member
States, through the adoption of a new country-Croatia. In 2014-2020 the ceiling for
commitment appropriations amounts to 1,025 billion euro and the ceiling for payment
appropriations amounts to 972 billion euro. In terms of the Common Agricultural Policy it is
envisaged to spend 382.8 billion euro (37.4%) by the EU budget, including direct payments of
281.8 billion euro (27.5%).
Table 5.
The multiannual financial framework for 2014-2020 (in millions of euro)
Specification 2014 2015 2016 2017 2018 2019 2020 Total Per cent
Smart and Inclusive Growth
64696 66580 68133 69956 71596 73768 76179 490908 47.9
Sustainable growth 57386 56527 55702 54861 53837 52829 51784 382926 37.4
including: natural
resources and
direct payments
42244 41623 41029 40420 39618 38831 38060 281825 27.5
Safety and citizens 2532 2571 2609 2648 2687 2726 2763 18536 1.8
Global Europe 9400 9645 9845 9960 10150 10380 10620 70000 6.8
Administration 8542 8679 8796 8943 9073 9225 9371 62629 6.1
Commitment appropriations
142556 144002 145085 146368 147344 148928 150718 1025001 100.0
Appropriations for
payments 133851 141278 135516 138396 142247 142916 137994 972198 98.7
Source: EU general budget for 2014-2020
Adoption of guidelines relating to the Common Agricultural Policy was preceded by
multilateral, multi-year and multi-national discussions (panels), which had a consensus
associated with this field of agriculture and rural areas. Adopted positions are stored in the EP
and Council regulations of 2013, which aim to improve the competitiveness of European
agriculture and food security, together with the simultaneous promotion of high quality
products, protection of the environment and rural development (Ordinance, 2013). According
to this proposal the basis of the CAP are to remain direct payments per hectare but the
Commission proposes a number of changes in the system of granting them as well as gradually
aligning their level in all countries of the European Union. Farmers who will meet the so-called
three "green" environmental conditions will be specially rewarded. It goes about diversity of
cultures, securing land for grazing and providing 7% of the crop on the ecological
infrastructure. Then farmers can receive payments due in full. Farmers who fail to meet these
terms and conditions will only receive 70% of the payments due to them. The Commission
announced equating payments throughout the Union but despite the efforts of the new EU

77
countries, it did not propose the same basic rate of subsidies in all countries. Reducing the gap
is to be gradually implemented until 2018 but even then the subsidies in the EU will not be yet
equal. The EC document casually assumes that equal payments should be a political objective
in the next budget after 2020. (Ordinance, 2013).
Concluding remarks
The research results demonstrate the multiannual financial framework from the historical
point of view what was the main purpose of the authors. It must be underlined the multiannual
financial framework represents a new approach to the budgetary planning prospect. The
general budget expenditures are normally 1% of gross national income of all the EU member
states. But in each framework there occur certain differences between commitment and
payment appropriations. Appropriations for commitments determine the overall cost of
undertaken commitments for releasing funds from the EU budget during a financial year but in
a period longer than one year. The payment appropriations in their turn determine the amount
of expenditures in a particular financial year to cover the liabilities incurred from the current
and previous financial years. The difference between commitment and payment appropriations
is due to the fact that the commitments to long-term programme and projects are usually
recorded in the year in which it was decided to grant them but they are paid later, as the
programme or the project is being implemented. In the analyzed period the number of
member states changed from 12 to 28 Member States at the moment. Simultaneously with
this process the level of support generated from the EU budget changed. The heading
commitment appropriations accounted to 243.8 billion euro in the years 1988-1992. In the
current financial framework (2014-2020) commitment appropriations will be increased to
1025, 0 billion euro. Research of multiannual financial framework in relation to the Common
Agricultural Policy indicates the occurrence of permanent and systematic decline in the share
of the CAP in the EU budget with 60, 5% for the years 1988 - 1992, 45.7% in 2000-2006 and
a drop to 37, 4% in the recent financial prospect (2014-2020).
In authors’ opinion in nearest future among the multilateral factors causing this decline it
may be mentioned the fact that agriculture does not need apply intensive production methods
any longer. The nutritional needs of the Community have been satisfied, there are surpluses
which can be directed outward, there was observe increase of the farmers’ income and
improvement of the general situation in the rural areas. Currently, the focus is on improving
the environment, there is a need for structural changes in agriculture, support for
multifunctional rural development and taking care of the climate and agricultural landscape.
Bibliography
1. Agreement of 6 May 1999 among the European Parliament, the Council and the
Commission on budgetary discipline and improvement of the budgetary procedure.
78
2. Council Regulation (EC) No 1698/2005 of 20 September 2005 on support for rural
development by the European Agricultural Fund for Rural Development (EAFRD).
3. Council Regulation (EC) No 1782/2003 of 29 September 2003 establishing common rules
for direct support schemes under the Common Agricultural Policy.
4. European Parliament and Council Regulation (EU) No 1305/2013 of 17 December 2013 on
support for rural development by the European Agricultural Fund for Rural Development
(EAFRD) and repealing Council Regulation (EC) No 1698/2005.
5. Gorton, M., Davidova, S. (2004). Farm productivity and efficiency in the CEE applicant
countries: a synthesis of results, Agricultural Economics 30.
6. Latruffe, L., Davidova, S., Balcombe, K. (2008). Productivity change in Polish agriculture:
an illustration of a bootstrapping procedure applied to Malmquist indices (in:) Post-
Communist Economies, Vol. 20, No. 4.
7. Lerman, Z., Csaki, C., Feder, G. (2002). Land Policies and Evolving Farm structures
in Transition Countries. Policy Research Working Paper 2794. The World Bank
Development.
8. Mickiewicz, B., Prus, P. (2014). Analiza porownawcza instrumentow wsparcia WPR w
Ramach Wieloletniej Perspektywy Finansowej 2014-2020 w stosunku do WPR 2007-2013
(Comparative analysis of support instruments of CAP in frames of Long-Term Financial
Perspective 2014-2020 in the relationship CAP 2007-2014). Journal of Agribusiness and
Rural Development, no. 4 (34)/2014, Poznan.
9. Oskam, A., Meester, G., Silvis, H. (2010). EU policy for agriculture, food and rural areas,
Wageningen.
10. Regulation of the EP and the COUNCIL REGULATION (EU) No 1307/2013 of 17 December
2013 laying down rules for direct payments to farmers under support schemes within the
Common Agricultural Policy.
11. Roljecic, S., Gruic, B., Saric, R. (2012). Organic agriculture in terms of sustainable
development and rural areas’ development. Rural development policies from the EU
enlargement perspective, IERiGZ-PIB, Warszawa.
12. Russell P., 2012, The evolution of the multiannual financial framework of the European
Union, BAS Studies, No. 3.
13. Sarris, A., Doucha, T., Mathijs, E. (1999). Agricultural restructuring in central and eastern
Europe: implications for competitiveness and rural development. European Review of
Agricultural economics 26 (3).
14. Swinnen, J. (2001). Implications of EU enlargement for Agri-food Markets and Policy,
Materials for the conference Outlook for Agriculture, Agribusiness and the Food Industry in
Central and Eastern Europe at Budapest 18th of May 2001, Hungary.
15. The EP and Council Decision of 19 May 2003 on the adaptation of the financial framework
for enlargement.
16. The EU Council Regulation of 29 June 2011 laying down the multiannual financial
framework 2014-2020.
17. The Single Payment Scheme After 2013: New Approach - New Targets, DG AGRI, Brussels
2010.

79
DEVELOPMENT OF EMPLOYEE INTEGRATION: SHARE OWNERSHIP
PERSPECTIVE
Anzelika Berke-Berga1, Dr.oec.; Inna Dovladbekova1, Dr.oec., Prof.; Erika Sumilo2,
Dr.oec., Prof.; and Ilona Baumane-Vitolina2, Dr.man.
1 Riga Stradins University, Faculty of European Studies
2 University of Latvia, Faculty of Economics and Management
Abstract. The article examines the relationship between employee share ownership and
employee integration. The authors argue that employee share ownership promotes employee
integration. The goals and benefits of both phenomena match significantly. The authors have
found that distribution of employee share ownership in a country depends on legal basis and
taxation. The authors’ qualitative and quantitative surveys in Latvian enterprises reveal that
employee share ownership may improve employee integration.
Key words: employee ownership, employee participation, labour management relations,
ownership structure, corporate culture
JEL code: J540, J530, J580, G32, M140
Introduction
In this article the authors discuss the impact of employee share ownership (ESO) on their
integration into the work environment. The authors’ hypothesis is that employers may improve
employee integration into the company and work environment when they introduce employee
share ownership schemes. The aim of research is to find out what impact ESO can give on
employee integration. Research tasks are to analyse literature about the issues mentioned
above as well as test the hypothesis on empirical basis.
The term employee integration is explained as “the process of assimilation of a person into
the work environment, the adaption to the work demands and to the collective behaviour in
which he or she will work the accommodation and the suitability of his or her personality to the
group” (Florea N., 2014). The positive results of employee successful integration can be: work
satisfaction, clarity of employee’s role in an enterprise, high motivation, understanding the
Corresponding author. Tel.: + 371 2940 8802; fax: + 371 6740 9185.
E-mail address: [email protected]
Proceedings of the 2015 International Conference “ECONOMIC SCIENCE FOR RURAL DEVELOPMENT” No39
Jelgava, LLU ESAF, 23-24 April 2015, pp. 79-88

80
organizational culture, high implication and high performances as well as internalized values of
organization (Florea N., 2014).
The authors deem that employee integration is very much related to their sense of
belonging to an enterprise. Thereby it is possible interconnect employee integration with
psychological ownership. Psychological ownership is interpreted as “possessive feelings that
attach the individual to objects (material or immaterial in nature), manifesting itself in such
expressions as “my” and “mine”” (Pierce J., 2011). The very recent, emergent and deeper
form of psychological ownership is collective psychological ownership as a group-level
phenomenon. It is explained as a collectively held sense (or feeling) that a target of ownership
is collectively “ours” (Pierce J., 2011). The sense of ownership is seen as necessary for good
work performance.
Psychological ownership theory is much about sense of ownership which is the same for
employee share ownership – it is used to “produce” feelings of co-owners in employees and
acting them like the owners or at least link goals of both parties. Employee share ownership is
explained as “participation of employees in redistribution of financial results of their employer’s
company with getting the company's shares or their derivatives, in order to increase employee
motivation and productivity” (Berke-Berga A., 2013). Landau explains ESO as “a form of
employee financial participation that confers on employees the right to share wealth of the
company and, in theory, the right to exercise some degree of control over company affairs”
(Landau I., 2007).
The above mentioned linkage of goals and aligning interests of both employees and owners
of companies is much discussed in principal – agent theory (or agency theory). According to
the principal - agent theory, one of the main tasks of management and employees is to
organize the work of the company respecting shareholders' interests. The possible solution to
the problem of interest respect might be tying employees’ and shareholders’ benefit, so that
both sides have a common goal. This can be achieved through the ESO - providing employee
shares, stock options or a combination of these as components of employee compensation. It
can help the enterprise break down the “them” and “us” mentality.
Benefits of employee share ownership and employee integration
There are other benefits from the ESO discussed in literature. the ESO can be used in a
company to achieve several objectives - motivating employees, increasing productivity,
improving the stability of work environment, continuity in the company, compliance of owners’
interests etc. Therefore, employee motivation, productivity and stability improvements,
increase the company's competitiveness both domestically and internationally. the ESO can be
used as an element of corporate financing. the ESO can improve the company's level of
financial performance. In exceptional cases, it may even be a solution for corporate
restructuring case.

81
Motivation of employees with ESO models is a long-term remuneration method. ESO models
can motivate employees to focus on the long-term strategic goals. Long-term remuneration
methods establish and maintain long-term incentives, because the employees get the right to
use the shares at the end of the ESO period. One of the often reasons why business owners
agree to introduce a ESO scheme, is possible improvement of productivity level of employees.
It might result as performance of production quantity or quality, service, changes in staff
attitude towards the employer (company) and its customers and partners as well as greater
effectiveness of professional development activities etc. Although, one has to avoid thinking it
is a miraculous tool. Employee attitude change in ESO model depends on how the company is
structured and how it is controlled. Attitude of the staff after introduction of ESO model may
change if prerequisites are fulfilled:
1) the amount of stocks granted to employees is sufficient for employees (McHugh P.,
2005);
2) the company’s internal culture helps employees fell like co-owners (Pendleton A.,
1995);
3) a common understanding of the business and shared objectives and availability of
the information needed (Rosen C., 2005);
4) level of employee influence in decision (operational, not strategic level) making
(Klein K., 1987);
The attitude of employees after implementation of the ESO model most probably will
not change at once, immediately. Many companies plan promotional activities in order to
develop this attitude. The attitude change depends on the total value of shares granted. It also
depends on employee education level that helps them understand the nature of participation
and ownership.
There may be situations when giving shares to employees may not be enough incentive
to work harder if the employee believes that profits are more dependent on other factors (e.g.
management decisions). Thereby employees may take risks over which they have no control
options. In this situation, it is important whether the employee shares are with or without
voting rights. All the model effectiveness and meaning may depend of this factor. The
possibility that the ESO model will contribute to higher levels of productivity, depends on its
types and conditions.
The economic benefit from ESO to the company also depends of cost savings to the
company at the expense of excessive staff turnover. In other words, the more loyal employees
of the company are the less money and time is spent on the attraction and training of new
employees. Use of ESO models may encourage employees to stay longer in the company and
attract new employees.
In countries where ESO models are very common, tax incentives are a contributing
factor in prevalence of these models. Watching the national statistics on the number of
enterprises that introduced ESO models, the sharp increase is usually observed after

82
significant changes to legislation in favour of ESO. However, the tax bonus should be seen as
an additional benefit and it should not be the main reason for the introduction of ESO. the ESO
model can be successful also if the country does not have any tax benefits for it. Thus the
main determinants of the effectiveness of the ESO model is the amount and the value of
shares granted, company's internal culture and employee awareness of the company's
business and financial results.
An important factor in the implementation of ESO is educating employees about it. For
ensuring effective communication with employees they have to get a clear understanding of
the company's target, processes in the ESO model, time limits and duties to be performed. The
way how employees perceive and appreciate the ESO model depends on communication
(Berke-Berga A., 2013).
In Table 1 the authors have matched the benefits of ESO and employee integration. it is
seen that the ESO contribution to these goals is rather significant.
Table 1
Benefit comparison of employee integration and ESO
Employee integration Employee share ownership
Employees’
benefits
- High motivation - Improvement of motivation
- Work satisfaction
- Internalized values of
organization
- High implication
- Social and emotional benefits:
security of job stability
decision-making rights
owner’s status
- Clarity of employee’s role
in the enterprise
- Interest in the
organizational culture
- Psychological ownership
- Financial benefit
Employers’
benefits
- High performance level - Employee motivation
- Productivity improvement
- Work environment stabilization
- Continuity of the company
- Respecting owner’s interests
- Improvement of competitiveness
- Reduction of tax burden (if tax benefits are
provided) Source: Authors’ interpretation
Employee share ownership in Latvia
Current ESO experience in Latvia is associated with the privatization period, when the
shares of state property (real estate and companies) were mass-transferred to the people
through the privatization vouchers. Some features of ESO developed during the privatization
process. But it was largely ineffective because the companies did not care about the so-called
ownership culture (or as the authors say here – psychological ownership) - employees were
not considered to be the owners and definitely were not promoted to feel that way. So, it can
be said that managers of these enterprises did not care about employee integration. In many
places of business ownership transition from staff to management, the value of shares was

83
reduced for several reasons - inflation, failure to pay dividends, in some cases, the so-called
share value "dilution" by increasing the number of shares in additional issue (Lowitzch J.,
2006). Consequently, the management of the companies was particularly advantageous to buy
shares at a low price from the employees, who were in financial difficulties. Thus in companies
whose shares were granted to employees, the management has often used their position
selfishly. The regulation (after implementation of restrictions in 1994) has not changed much.
The authors will reveal the consequences and existing ESO (if it can be called so) in Latvia.
Privatization of state-owned enterprises is expected to create a shift in their objectives from
those determined by political and social criteria to those aimed at shareholder welfare and
profit maximization. The relationship between privatization and the enterprise’s work
environment and employee attitudes and behaviour has received less attention that the impact
of privatization on enterprise performance (McCarthy D., 2010).
ESO is not widespread in Latvia today. There is lack of legal framework of the different
forms of employee financial participation, and the existing tax provisions discourage
entrepreneurs to use ESO. There is special regulation only for employee shares. In tax laws
personnel securities are not distinguished or included in the wage, so that they are applicable
to these taxes: personal income, corporate income, income from capital gains tax and social
insurance contributions. It is not possible to apply the equivalent tax advantages for ESO
compared to the ones existing for life insurance savings or private pension funds.
Consequently, the entrepreneurs use ESO very rarely, they prefer the other above mentioned
bonuses because they are easier to be administered and they are tax-advantageous. But these
bonuses do not give employees ownership and voting rights. For the development of ESO in
Latvia there have been discussions between the government of Latvia and the social partners
(employers’ representatives, trade unions) but the matter was postponed for an indefinite
period*.
Research methods
To determine the influence of ESO on employee behaviour and sense of ownership at work
the authors use data from two studies of employees and employers of joint stock companies in
Latvia. The data are used to discover whether employers may improve employee integration
into the company and work environment when they introduce ESO schemes.
The data from qualitative study are used to find out what kind of ESO exists in Latvian
companies and what are the consequences of privatization. The study included nine experts
representing different sectors from large (n=5) and medium (n=4) enterprises. The
participants were leading HR managers. The research method was semi-structured interviews.
The data from quantitative study are used to determine the link between ESO and employee
integration. The general set of this study consists of employees of large and medium-sized
joint-stock companies, because the shape and size of the business is directly related to the
* See more in: Berke-Berga, A. (2013)

84
share purchase opportunities to these employees. The size of study general set is 61 095
employees. The sample size of the study is 610 employees from 19 large and 42 medium-sized
joint-stock companies. The survey was conducted using electronic means and capabilities as
well as paper questionnaires. The total number of completed questionnaires was 614, 140 of
them in paper and 474 in electronic form. The research data were collected during the period
from 1 August 2012 to 31 October 2012. The study data were processed by the following
programs: SPSS 16.0 and Microsoft Excel 2010.
Research results and discussion
It should be noted that the reason of mass privatization was ownership change, rather than
the employee share ownership or facilitating and increasing the impact of their involvement, or
improvement of the labour effectiveness (Karnite R., 2007). Privatization was a deal between
the state and the holders of privatization certificates rather than employee compensation for
the results achieved. Consequently, the process of privatization, giving shares of enterprises to
their staff cannot be regarded as an employee share ownership for the following reasons:
1) urgent need and necessity for the government to move from a centralized, planned
economy to a decentralized market economy by transferring state-owned enterprises in whole
or in part, in the hands of private owners;
2) the market value of the companies was mostly not to be determined due to rapid
inflation and the lack of assessment methods. ESO did not work as it normally does when
company shares are granted to employees, and they strive to increase their value;
3) many of the public enterprises under privatization were insolvent. The authors cannot
consider serious employee share ownership in business from what they were not paid wages
and taxes;
4) the main objective of the state regarding privatization of companies was attracting
strategic investors who would be able to restore companies, restructure them and invest for
further development of these companies (Berke-Berga A., 2013).
In the qualitative survey the authors analysed the work environment and shareholders with
an emphasis on employee shareholdings and/or companies’ opinion on ESO issues. Starting
with the hierarchy in companies involved in survey, the authors found that in almost all large
enterprises it is vertical, in medium companies – horizontal. Internal communication methods
in companies are quite different. In some places they use traditional forms of communication -
meeting with management, meetings, reports etc. There are companies that mostly use
electronic communication like e-mail, intranet, blogs etc. The interviewees reported two main
problems regarding employees - the aging of personnel and attracting qualified specialists
problem. Some experts noted that they would like to improve their employee incentive system
accommodating them more to the needs of individual employees, by diversifying bonuses.
There are such financial bonuses as health insurance and premium awards mostly available
in the enterprises. Production companies have separate bonuses for employees who are
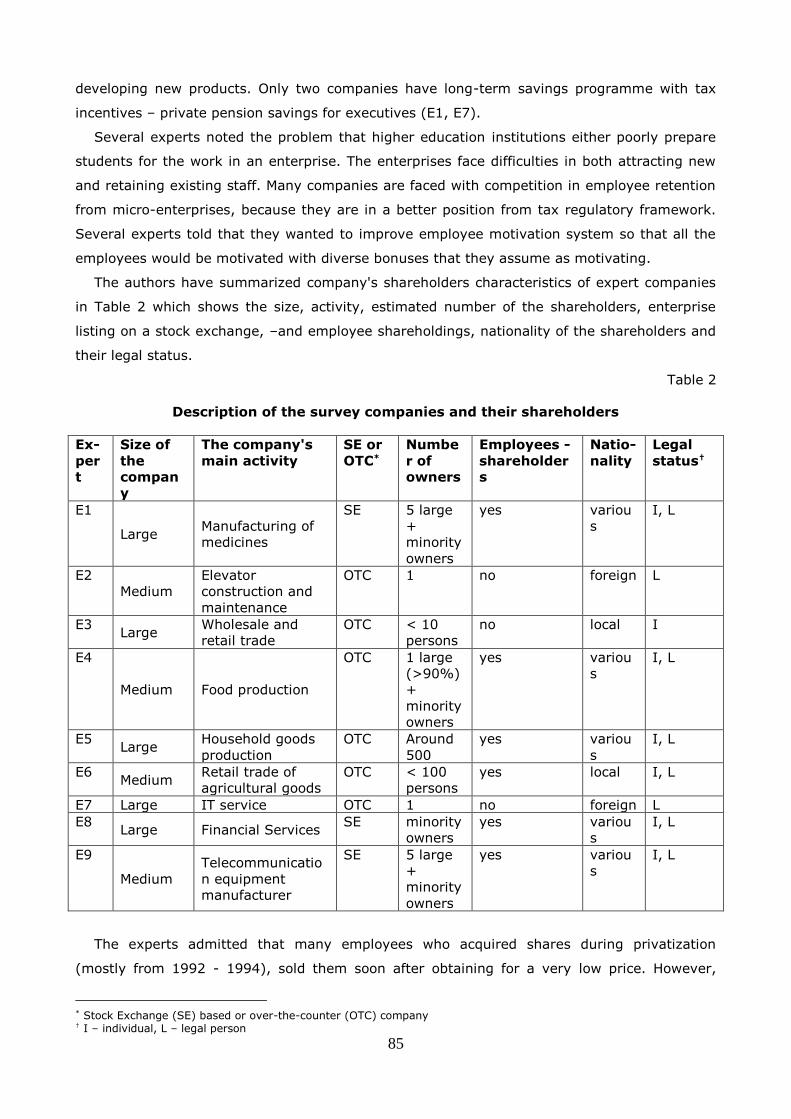
85
developing new products. Only two companies have long-term savings programme with tax
incentives – private pension savings for executives (E1, E7).
Several experts noted the problem that higher education institutions either poorly prepare
students for the work in an enterprise. The enterprises face difficulties in both attracting new
and retaining existing staff. Many companies are faced with competition in employee retention
from micro-enterprises, because they are in a better position from tax regulatory framework.
Several experts told that they wanted to improve employee motivation system so that all the
employees would be motivated with diverse bonuses that they assume as motivating.
The authors have summarized company's shareholders characteristics of expert companies
in Table 2 which shows the size, activity, estimated number of the shareholders, enterprise
listing on a stock exchange, –and employee shareholdings, nationality of the shareholders and
their legal status.
Table 2
Description of the survey companies and their shareholders
Ex-
per
t
Size of
the
compan
y
The company's
main activity
SE or
OTC*
Numbe
r of
owners
Employees -
shareholder
s
Natio-
nality
Legal
status†
E1
Large Manufacturing of
medicines
SE 5 large
+
minority
owners
yes variou
s
I, L
E2
Medium
Elevator
construction and
maintenance
OTC 1 no foreign L
E3 Large
Wholesale and
retail trade
OTC < 10
persons
no local I
E4
Medium Food production
OTC 1 large
(>90%)
+
minority
owners
yes variou
s
I, L
E5 Large
Household goods
production
OTC Around
500
yes variou
s
I, L
E6 Medium
Retail trade of
agricultural goods
OTC < 100
persons
yes local I, L
E7 Large IT service OTC 1 no foreign L
E8 Large Financial Services
SE minority
owners
yes variou
s
I, L
E9
Medium
Telecommunicatio
n equipment
manufacturer
SE 5 large
+
minority
owners
yes variou
s
I, L
The experts admitted that many employees who acquired shares during privatization
(mostly from 1992 - 1994), sold them soon after obtaining for a very low price. However,
* Stock Exchange (SE) based or over-the-counter (OTC) company † I – individual, L – legal person

86
there were also those who understood the nature of ownership of shares, and saw their
potential for the future. Many of these employees have already retired and continue to hold
the shares (E1, E5). Others sold them or transferred by inheritance. There are also employees,
who continue to hold the shares or sell them if they receive an attractive offer. Employees
from companies listed on the stock exchange use to buy shares either on their own initiative or
encouraged by the employer.
In two thirds of survey enterprises employees own shares. Three of the companies are
listed on the stock exchange, where everyone, including the staff, is free to buy shares. Only
one company where employees had shares the ownership is not a motivating factor, rather the
contrary. This is due to a decrease in value of shares (E4).
In some companies owners are senior management members, for example, E8 and E9. One
of the companies (E5) is owned by the majority of employees and the management. The
employees of the existing model are highly satisfied. In addition, the company's major
shareholders have the position that the shares are not traded to foreign or outside investors.
Only those that are directly associated with the company may purchase shares.
In the quantitative survey the authors tried to find out whether there is linkage between
share ownership (or potential share ownership) and employee integration in sense of
psychological ownership. Therefore, the authors asked the respondents about their work
satisfaction, motivating factors, attitude towards share ownership, purchase of shares and, of
course, sense of ownership as existing or possible shareholders.
Looking at the frequency chart that displays work satisfaction (Table 3), one can conclude
that most of employees are satisfied with their work. Although, more than one third see space
for improvement.
Table 3
Level of work satisfaction
N = 614 Frequency Percent Valid
Percent
Cumulative
Percent
Highly satisfied 168 27.4 27.4 27.4
Satisfied 154 25.1 25.1 52.4
Mostly satisfied (space for
improvement
228 37.1 37.1 89.6
Not satisfied 43 7.0 7.0 96.6
Dissatisfied, want to quit 21 3.4 3.4 100.0
Total 614 100.0 100.0
Correlations between work satisfaction and share ownership were not significant. The
authors tested the link between share ownership and sense of ownership using Pearson’s Chi-
square test. H0 was that there is no statistically significant difference between employee share
ownership and sense of ownership. As the Χ2 value was 31.906 (Sig. 0.010), the authors reject
the null hypothesis. The cross table (Table 4) reveals the linkage between the two measures.
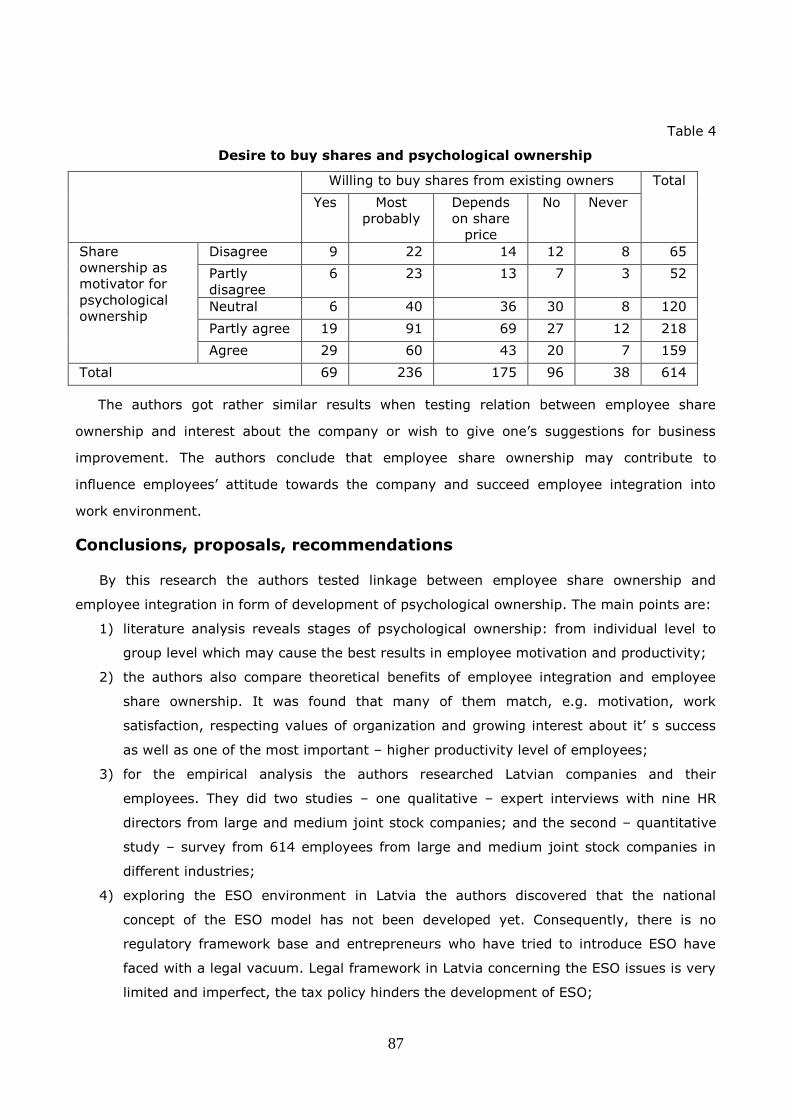
87
Table 4
Desire to buy shares and psychological ownership
Willing to buy shares from existing owners Total
Yes Most
probably
Depends
on share
price
No Never
Share
ownership as
motivator for
psychological
ownership
Disagree 9 22 14 12 8 65
Partly
disagree
6 23 13 7 3 52
Neutral 6 40 36 30 8 120
Partly agree 19 91 69 27 12 218
Agree 29 60 43 20 7 159
Total 69 236 175 96 38 614
The authors got rather similar results when testing relation between employee share
ownership and interest about the company or wish to give one’s suggestions for business
improvement. The authors conclude that employee share ownership may contribute to
influence employees’ attitude towards the company and succeed employee integration into
work environment.
Conclusions, proposals, recommendations
By this research the authors tested linkage between employee share ownership and
employee integration in form of development of psychological ownership. The main points are:
1) literature analysis reveals stages of psychological ownership: from individual level to
group level which may cause the best results in employee motivation and productivity;
2) the authors also compare theoretical benefits of employee integration and employee
share ownership. It was found that many of them match, e.g. motivation, work
satisfaction, respecting values of organization and growing interest about it’ s success
as well as one of the most important – higher productivity level of employees;
3) for the empirical analysis the authors researched Latvian companies and their
employees. They did two studies – one qualitative – expert interviews with nine HR
directors from large and medium joint stock companies; and the second – quantitative
study – survey from 614 employees from large and medium joint stock companies in
different industries;
4) exploring the ESO environment in Latvia the authors discovered that the national
concept of the ESO model has not been developed yet. Consequently, there is no
regulatory framework base and entrepreneurs who have tried to introduce ESO have
faced with a legal vacuum. Legal framework in Latvia concerning the ESO issues is very
limited and imperfect, the tax policy hinders the development of ESO;

88
5) the qualitative survey reveals that there exist various backgrounds of ownership rights
that employees have – some hold stocks since privatization, others have sold them
(mostly to foreign investors) and there are also companies (most often branches of
international companies) that implement ESO in group level, including Latvia;
6) the most common problems of Latvian companies are: aging of personnel and
attracting qualified specialists. The enterprises are facing difficulties in both attracting
new and retaining existing staff;
7) the quantitative study shows that employee share ownership may positively influence
employees’ attitude towards the company and succeed employee integration into work
environment.
Bibliography
1. Berke-Berga, A. (2013). Development of Employee Share Ownership in Latvia.
Summary of Doctoral Dissertation. Riga Technical University, p.47
2. Florea, N.V. (2014). Good Practices of Integration for new Employees in Roman
Organizations Buletin Stiintific, Volume 37, Issue 1, pp. 13-23
3. Karnite, R. (2007). Employee Financial participation in the New Member States. Latvia.
Retrieved: http://www.eurofound.europa.eu/eiro/studies/tn0701018s/lv0701019q.htm.
Access: 03.07.2012
4. Klein, K. (1987). Employee Stock Ownership and Employee Attitudes: A Test of Three
Models Journal of Applied Psychology Issue 72, p.319
5. Landau, I., Mitchell, R., O’Connell, A., Ramsay, I. (2007). Employee Share Ownership:
A Review of the Literature. Research Report of Employee Share Ownership Project, p.26
6. Lowitzsch, J., et.al. (2006). The PEPPER III Report: Promotion of Employee Participation
in Profits and Enterprise Results in the New Member and Candidate Countries of the
European Union. Rome and Berlin, 2006, p.351
7. McCarthy, D., Reeves, E., Turner, T. (2010). The impact of privatization and employee
share ownership on employee commitment and citizen behaviour Economic and
Industrial Democracy, Volume 31, Issue 3, pp. 307-326
8. McHugh, P., Cutcher-Gershenfeld, J., Bridge, D. (2005). Examining Structure and
Process in ESOP Firms Personnel Review Volume 34, pp.277-278
9. Pendleton, A., et.al. (1995). The Impact of Employee Share Ownership Plans on
Employee Participation and Industrial Democracy Human Resource Management
Journal, Volume 5, pp.44-45
10. Pierce, J. L., Jussila, I. (2011). Psychological Ownership and the Organizational
Context: Theory, Research Evidence and Application. Edward Elgar Publishing Ltd.,
p.336
11. Rosen, C., Case, J., Staubus, M. (2005). Equity: Why Employee Ownership is Good for
Business. Boston: Harvard Business School Press, p.214
Acknowledgements. The preparation of the paper was supported by the National Research
Program 5.2. Economic Transformation, Smart Growth, Governance and Legal Framework for
the State and Society for Sustainable Development-a New Approach to the Creation of a
Sustainable Learning Community, Project EKOSOC_LV.

89
AGRICULTURE IN THE CONTEXT OF ECONOMIC TRANSFORMATIONS:
LITHUANIAN CASE
Jadvyga Ciburiene1, PhD/ professor
Kaunas University of Technology, Lithuania
Abstract. Agriculture is one of the most important strategic areas of Lithuanian economic
development. This is due because the sector's production satisfies not only the individual and
all of the country's consumer food demand but it serves as raw materials for other activities of
economy. The growing export of the agricultural sector implements sustainable development of
the idea of open economy to ensure sustainable development on a global level.
The object of this study: agriculture and the transformation of Lithuanian economy.
The aim of the study: to analyze the economic transformations and the role of agriculture in
Lithuania.
Objectives of the study: to characterize economic transformations; to discuss the changes
of agriculture development as a smart, sustainable and inclusive growth; to show the influence
of agriculture to economic development; to characterize the ways of modernization of
agriculture and the changes of the yield of agricultural products.
The analysis shows that the economic transformation in Lithuania is related to the
modernization of agriculture and productivity growth of agricultural products. The comparison
of main economic sectors of activities in the European Union Member States (EU-28), the
European Union euro area and the United States of America (USA) shows that the level of
modernization in Lithuania is a way for further agriculture sustainable development for
Lithuania.
Key words: economic development, sustainable development, R&D in agriculture, agriculture
and international trade.
JEL code: O13, Q01, Q16, Q17.
Introduction
In the conditions of European integration and globalization, Lithuania, as all the 28
European Union Member States (EU-28), set following main development challenges for
Corresponding author. Tel.: + (370613 43624); fax: + (370 208757).
E-mail address: [email protected]
Proceedings of the 2015 International Conference “ECONOMIC SCIENCE FOR RURAL DEVELOPMENT” No39
Jelgava, LLU ESAF, 23-24 April 2015, pp. 89-96
90
agriculture and rural development in the years 2014-2020: agricultural competitiveness;
conserve management of natural resources; and sustainable territorial development.
Agriculture is one of the most important strategic areas of a country's economic
development. This is due because the sector's production satisfies not only the individual and
all of the country's consumer demand but it serves raw materials and other activities of
economy both inside and outside the country. Moreover, this sector is linked to the rural areas
of the country, where about one third of the Lithuanian population live. All this leads to the
importance of agriculture on the economic, social, ethno-cultural and environmental point of
view. Agricultural and food sector generates nearly 8% of the country's gross domestic product
(GDP), provides food to the residents of the state, creates jobs for every ninth employee and
creates close to one-fifth of total Lithuanian export.
The importance of agriculture and rural development was noted in the Strategy of European
Commission ”A Strategy for Smart, Sustainable and Inclusive Growth”. The three priorities of
the strategy are directly linked with the main challenges for agriculture and rural development.
Firstly, smart development must be based on knowledge and innovation. This would ensure
the efficient use of resources, would help to uphold health, the development of more organic
agriculture and by the year 2020 to develop green economy; to promote wider use of the
Internet; increase in digital literacy and the use of e-government. Secondly, sustainable
development, which includes saving on resources based on measures aimed at improving
global food security. It means the use of ongoing agriculture and rural development policy for
the fight against climate change. Thirdly, inclusive growth, which is based on the promotion of
high-employment economy, is causing social and territorial cohesion. The agricultural activity
in the structure of economic sectors is attributed to the primary sector and it has lower labour
productivity than the industrial or service sectors. Lithuania's economy is small and open, so
its development, including agriculture, significantly depends not only on the country's
economic transformation but also on the global economy, political trends. The scientific
research trends show the significance of agriculture and rural development in order to increase
competitiveness (including the export of agricultural products) of the country. Modernization of
economy, including agriculture sector, can be oriented to affect the problems caused by
globalization, such as global warming, pollution etc.
The object of this study: agriculture and the transformation of Lithuanian economy.
The aim of the study: to analyze the economic transformations and the role of agriculture in
Lithuania.
Objectives of the study: to characterize economic transformations; to discuss the changes
of agriculture development as a smart, sustainable and inclusive growth; to show the influence
of agriculture to economic development; to characterize the ways of the modernization of
agriculture and the changes of the yield of agricultural products. The methods of research:
analysis of scientific literature, statistical classification and comparison, logical comparative
analysis and synthesis.

91
Research results and discussion
The question of the changes of agriculture development trends is important for the
examination of the role of separate economic sectors (agriculture, industry and services) in the
country's economic transformation. A lot of attention is given to the transformations taking
place in the economy in the scientific literature. Nobel prize winner S. Kuznets (1971) names
the structural transformations of economy, especially its circle, as one of the main factors of
economic growth. In this way he analysed the pass from agriculture to non-agriculture activity.
Other scientists (Ray D., 2010) explain the transformations or structural change of the
economy using concept of uneven growth, when not all sectors develop together.
D. W. Te Velde (2014) states that economic transformations include the movement of
labour force from low productivity to higher productivity activity inside the same sector, and
among sectors. He argues that social and territorial cohesion and poverty reduction can be
achieved only due to economic transformations.
Transformations are understood as the relocation of economic activity across broad
economic sectors (agriculture manufacture and services), which causes economic growth
(Herrendorf B., Rogerson R., Valentinyi A., 2013). Some authors (Greenwood J., Seshadri A.,
2005) give a broader meaning for the concept of economic transformation than structural
transformation and introduce the changes of qualitative factors. In this aspect, they analyse
economic transformations, affecting agriculture, for example, the use of fertility for raising
productivity or investigate the movement of women as housewife to the labour market.
The researchers (Te Velde D.W., 2013) analysing productivity changes often focussed on
some factors: agriculture, innovation and finance. In this case it is important: firstly, to show
the essence of relationship between the growth process and structural transformation (it
means to analyse, e.g. relations among economic sectors); secondly, to characterize the
reasons of productivity change and main factors of changes of effectiveness.
In the scientific literature, Lithuanian economic transformation (since the Lithuanian
Independence day on the 11th of March 1990) phases are characterized by R. Kuodis (2008)
as:
1) 1990-1993: inflation and economic collapse;
2) 1994-1998: monetary reform and economic stabilization;
3) 1998-1999: Russian financial crisis;
4) 2000-2003: stabilization and growth stage, public finance crisis;
5) 2004-2007: Lithuanian economic boom;
6) 2008-2009: the period of new challenges, related with the parliamentary elections.
The economic transformation stage of the years 2008-2009 is characterized by a global
financial crisis, the Lithuanian real estate bubble burst, the global rise of prices of food and in
the energetic system because Lithuania was not prepared for the closure of Ignalina Nuclear
Station; the growth of gas prices; organic resources appreciation trend (inside the country and

92
on the global level); ongoing weak housing renovation programme (which would reduce the
need for gas imports); weak development of renewable energy sources in the country’s energy
balance programme. In addition, before the parliamentary elections in the year 2008 the
political business cycle recurred, when politicians in order to maximize the probability of re-
election borrowed money for pensions and social benefits and salaries to the public sector
employees seeking to sway voters before the elections.
The analysis of statistical data, according to Table 1, shows that real GDP was contracted
mostly in the year 2009 in Lithuania (about -14.7%), in the EU and the USA (-4.3%) and in
the EU euro area (-4.4%).
Table 1
The main indicators of economy and economic activity in Lithuania in the
2005-2011
Indicator/Year 2005 2006 2007 2008 2009 2010 2011 2012
1.Real GDP growth rate (EG), %
-Lithuania 7.8 7.8 9.8 2.9 -14.7 1.3 6.0 3.7
-EU 2.1 3.3 3.2 0.3 -4.3 2.1 1.8 -0.4
-EU euro area 1.7 3.3 3.0 0.4 -4.4 2.1 1.7 -0.7
-USA 3.0 3.0 4.0 -1.0 -4.3 2.5 1.6 2.0
2.Agriculture value added, % of GDP
-Lithuania 4.8 4.3 3.9 3.7 3.4 3.5 3.8 4.0
---growth rate, % 100.0 89.6 81.2 77.1 70.8 72.9 79.2 83.3
-EU 1.7 1.6 1.6 1.6 1.4 1.6 1.6 1.6
-EU euro area 1.8 1.7 1.7 1.7 1.5 1.6 1.7 1.7
-USA 1.2 1.0 1.0 1.0 1.0 1.2 1.4 1.0
3. Industry value added, % of GDP
-Lithuania 32.9 32.9 32.6 31.6 26.9 28.2 31.2 31.1
---growth rate, % 100.0 100.0 99.1 96.0 81.8 85.7 94.8 94.5
-EU 26.3 26.6 26.6 26.1 24.3 25.6 24.8 24.5
-EU euro area 26.6 26.8 27.0 26.5 24.5 26.3 25.0 24.8
-USA 22.0 22.0 22.0 21.0 20.2 20.4 20.8 21.0
4. Value added in services, % of GDP
-Lithuania 62.3 62.8 63.5 64.7 69.7 68.3 65.0 65.0
---growth rate, % 100.0 100.8 101.9 103.8 111.9 109.6 104.3 104.3
-EU 71.9 71.7 71.7 72.2 74.2 72.8 73.6 73.9
-EU euro area 71.5 71.4 71.2 71.8 73.9 72.0 73.3 73.5
-USA 77.0 77.0 77.0 78.0 79.0 79.0 78.0 78.0
Source: author’s calculations based on The World Bank Group Data; Lithuanian Statistics Data
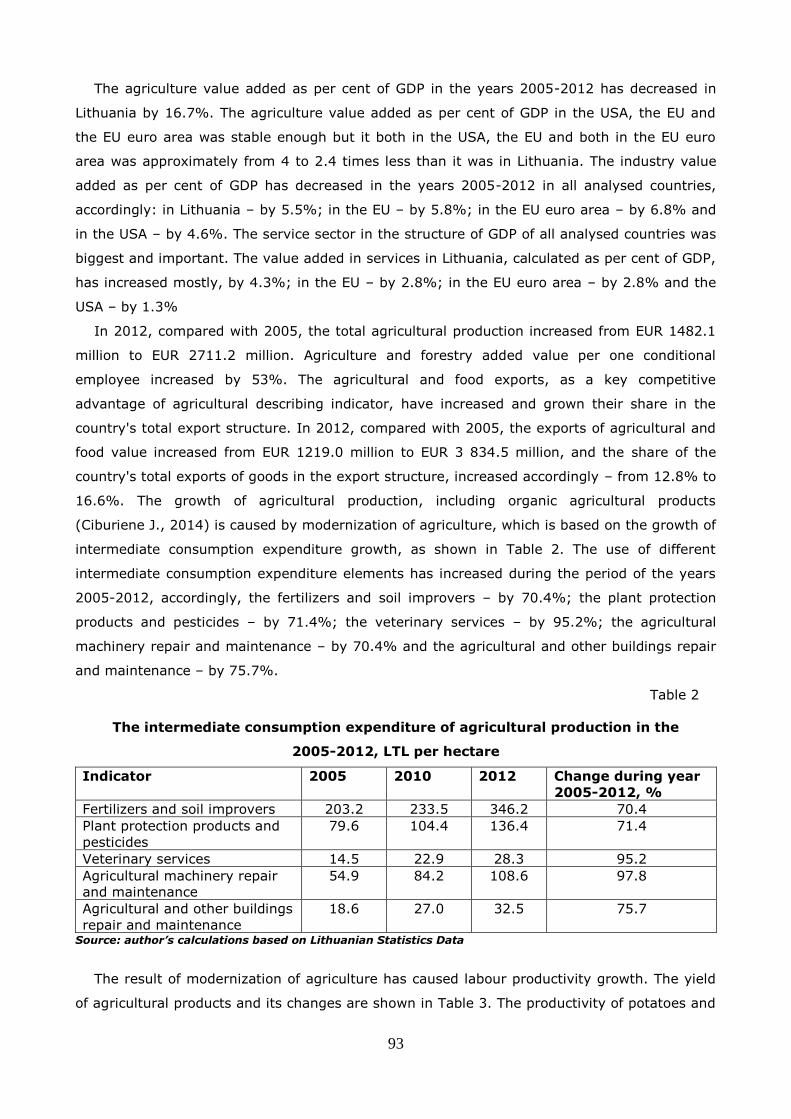
93
The agriculture value added as per cent of GDP in the years 2005-2012 has decreased in
Lithuania by 16.7%. The agriculture value added as per cent of GDP in the USA, the EU and
the EU euro area was stable enough but it both in the USA, the EU and both in the EU euro
area was approximately from 4 to 2.4 times less than it was in Lithuania. The industry value
added as per cent of GDP has decreased in the years 2005-2012 in all analysed countries,
accordingly: in Lithuania – by 5.5%; in the EU – by 5.8%; in the EU euro area – by 6.8% and
in the USA – by 4.6%. The service sector in the structure of GDP of all analysed countries was
biggest and important. The value added in services in Lithuania, calculated as per cent of GDP,
has increased mostly, by 4.3%; in the EU – by 2.8%; in the EU euro area – by 2.8% and the
USA – by 1.3%
In 2012, compared with 2005, the total agricultural production increased from EUR 1482.1
million to EUR 2711.2 million. Agriculture and forestry added value per one conditional
employee increased by 53%. The agricultural and food exports, as a key competitive
advantage of agricultural describing indicator, have increased and grown their share in the
country's total export structure. In 2012, compared with 2005, the exports of agricultural and
food value increased from EUR 1219.0 million to EUR 3 834.5 million, and the share of the
country's total exports of goods in the export structure, increased accordingly – from 12.8% to
16.6%. The growth of agricultural production, including organic agricultural products
(Ciburiene J., 2014) is caused by modernization of agriculture, which is based on the growth of
intermediate consumption expenditure growth, as shown in Table 2. The use of different
intermediate consumption expenditure elements has increased during the period of the years
2005-2012, accordingly, the fertilizers and soil improvers – by 70.4%; the plant protection
products and pesticides – by 71.4%; the veterinary services – by 95.2%; the agricultural
machinery repair and maintenance – by 70.4% and the agricultural and other buildings repair
and maintenance – by 75.7%.
Table 2
The intermediate consumption expenditure of agricultural production in the
2005-2012, LTL per hectare
Indicator 2005 2010 2012 Change during year
2005-2012, %
Fertilizers and soil improvers 203.2 233.5 346.2 70.4
Plant protection products and
pesticides
79.6 104.4 136.4 71.4
Veterinary services 14.5 22.9 28.3 95.2
Agricultural machinery repair
and maintenance
54.9 84.2 108.6 97.8
Agricultural and other buildings
repair and maintenance
18.6 27.0 32.5 75.7
Source: author’s calculations based on Lithuanian Statistics Data
The result of modernization of agriculture has caused labour productivity growth. The yield
of agricultural products and its changes are shown in Table 3. The productivity of potatoes and

94
field vegetables has increased more than 41%; grain, sugar beet (for industry) – more than
36%; the average annual milk yield per cow – more than 21%. The biggest decreased was of
the yield of orchards and berries - by 14.1% and small decrease of the average number of
eggs per hen per year - 2.7%.
Table 3
Yield of agricultural products, 100 kg per hectare
Indicator 2005 2009 2010 2011 2012 Change during
year 2005-2012, %
Grain 28.9 33.8 27.0 29.8 39.4 36.3
--cereal grain 29.4 34.5 27.6 30.3 40.2 36.7
Sugar beet (for industry) 381 451 463 498 523 37.3
Potatoes 121 142 130 156 171 41.3
Field vegetables 161 207 120 204 228 41.6
Average annual milk
yield per cow, kg
4312 4811 4901 5026 5227 21.2
Orchards and berry 37.6 31.3 18.7 25.2 32.3 -14.1
Average number of eggs
per hen per year
256 272 260 259 249 -2.7
Source: author’s calculations based on Lithuanian Statistics Data
The tendencies for further agricultural development of Lithuania; Europe, including Western
Europe; the USA and world (on average) are given in Table 4.
Table 4
Yield of agricultural products, 100 kg per hectare
Indicator Lithuania Europe Western
Europe
USA World
1.Value added share in the years 2008-2011, %
- agriculture 3.5 1.7 1.2 1.2 2.9
- industry 28.2 24.7 23.9 20.0 25.3
- services 68.3 73.6 74.9 78.8 71.8
2.Employment share in agriculture in the years 2005-2010, %
-of total 9 1.6
-share of female 6.8 0.8
-share of male 11.5 2.3
3.Fertilizer consumption per ha arable land and permanent crops in the year 2009, kg/ha
-nitrogen 24.0 44.1 111.3 65.9 69.3
-phosphate 22.6 11.4 19.5 20.4 25.8
-potash 4.7 11.7 23.9 21.4 14.8
4.Agricultural gross capital stock the year 2007, %
-land development 17.5 29.6 13.9 28.6 31.2
-machinery &equipment 69.1 39.4 51.5 43.3 23.8
-livestock fixed assets 8.9 16.6 18.5 14.7 27.4
5.Agricultural R&D spending for per capita of rural population, in 2005 PPP, USD
-in the year 2000 13.85 27.70 61.93 72.63 7.98
-in the year 2008 26.53 33.64 79.36 87.98 9.80 Source: author’s calculations based on Lithuanian Statistics Data
These tendencies are described comparing the value added shares in the years 2008-2011
(in %); the employment share in agriculture in the years 2005-2010 (in %); the fertilizer

95
consumption per ha arable land and permanent crops (in kg/ha); the agricultural gross capital
stock in year 2007 (in %) and the agricultural R&D spending for per capita of rural population
(in 2005 PPP, USD).
The analysis of the value added shares, the fertilizer consumption per ha arable land and
permanent crops in Europe, Western Europe, the USA and on average in the world shows a
possible way for Lithuanian economy structural transformation (among economic sectors) and
a way for the productivity growth in Lithuanian agriculture. The changes of agricultural R&D
spending for per capita of rural population during the years 2000-2008 in Lithuania
characterises positive changes but in 2008 it was less than in the Europe by 26.8%, twice than
Western Europe and 2.3 time less than in the USA. In the development of agriculture it is
important to exploit the strengths of the sector (economic, environmental and socio-economic)
and to deal with existing weaknesses. These processes will help in Lithuanian agriculture
modernisation. The increase of agricultural R&D spending, the fertilizer consumption and other
instruments, for example, the innovations of labour organization in agriculture, are one of the
most important factors encouraging smart, sustainable and inclusive growth of Lithuanian
agriculture.
Conclusions
1. The process of economy transformation is based, firstly, on the quantitative factor – the
change of economic activity across broad economic sectors (agriculture manufacture and
services), and secondly, on the changes of qualitative factors. In this aspect of economic
transformations affecting agriculture the use of fertility for raising productivity or the
agricultural R&D spending for per capita of rural population is analysed.
2. The growing yield and export characterizes Lithuanian agriculture sector as smart,
because it involves more agricultural R&D spending for per capita of rural population (in the
years 2000-2008 R&D spending for per capita of rural population has increased by 91.6%); as
sustainable, because the share of export from 12.8% in the year 2005 has increased to 16.6%
in the year 2012; and inclusive growth, because the total agricultural production in the year
2012, comparing with the year 2005 has increased by 82.9% (from EUR 1482.1 million to EUR
2711.2 million).
3. The growing export of Lithuanian agricultural and food products indicates that the
agricultural sector and food production export are competitive on the global market.
4. The main ways for the modernization of Lithuanian agriculture and the changes of the
yield of the agricultural products are, firstly, as the practice of the USA, Europe, including
Western Europe, and the world average indicators show, the increase of fertilizer consumption
per ha arable land and permanent crops (in kg/ha). Secondly, the practice of the USA, Europe,
including Western Europe, indicate that the agricultural R&D spending for per capita of rural
population during the years 2000-2008 in Lithuania characterises positive changes but in 2008
it was less than in Europe by 26.8%, twice than Western Europe and 2.3 time lessthan in the

96
USA. These two aspects – inadequate use of fertilizers and poor level of R&D spending for per
capita of rural population – are important ways for the expansion and improvement of the
agriculture sector and will help to deal with existing weaknesses in Lithuanian agriculture
sector. This way agriculture development can generate not only higher quality and quantity of
agricultural products, but also increase the level of employment in rural areas of Lithuania.
Moreover, these processes can cause smart, sustainable and inclusive growth both in
agriculture and in all economy of Lithuania.
Bibliography
1. Ciburiene, J. (2014). Organic Agriculture for Sustainable Rural Development: Lithuanian
Case. Economic Science for Rural Development, No. 36, pp. 51-57.
2. Greenwood, J., Seshadri, A. (2005). Technological Progress and Economic Transformation.
In Handbook of Economic Growth, Eds.: Philippe Aghion and Steven Durlauf. Vol. 1B,
Amsterdam and New York: North Holland, 2005, chapter 19, pp. 1225–1273.
3. Herrendorf, B., Rogerson, R., Valentinyi, A. (2013). Growth and Structural Transformation.
Handbook of Economic Growth. IMF. p.114.Retrieved: www.imf.org. Access: 15.12.2014.
4. Kuodis, R. Transformation of the Lithuanian Economy in 1990–2008: Stages and Main
Mistakes of Economic Policy. Monetary Studies, No.2, pp.97-105.
5. Kuznets, S. (1971). Modern Economic Growth: Findings and Reflections. Nobel Prize
Lecture. Retrieved: Http://www.nobelprize.org/nobel_prizes/economic -sciences / winners /
1971 / Kuznets-lecture.html). Access: 15.12.2014.
6. Ray, D. (2010). Uneven Growth: A Framework for Research in Development Economics,
Journal of Economic Perspectives, Volume 24, Number 3, pp.45–60. Retrieved:
http://www.econ.nyu.edu/user/debraj/Papers/Uneven.pdf. Access: 20.12.2014.
7. Te Velde, D. W. (2014). Economic Transformation: where are We Heading, post-2015? ODI
Shaping Policy for Development.Retrieved:http://www.odi.org/comment/8084-economic-
transformation-heading-post-2015. Access: 15.12.2014.
8. Te Velde D. W. (2013). Innovation and Productivity Change in Low-income Countries. A
Brief Overview of Policy and Academic Debates and Potential Links to Current Research
Projects in the DFID-ESRC Growth Research Programme. ODI Growth Research Programme 23
July 2013. Retrieved: www.degrp.sqsp.com. Access: 15.12.2014.

97
PROFITABILITY OF PIG FARMS IN POLAND AFTER INTEGRATION TO
THE EU
Elzbieta Jadwiga Szymanska*, PhD, professor
Faculty of Economics Sciences, Warsaw University of Life Sciences (SGGW)
Abstract. The research study aimed at determining force and directions of impact of the
selected factors on the return on equity of pig farms in Poland between 2005 and 2010. Nine
hundred and fifty one farms, specialised in the production of pigs for slaughter, which had
gathered data within Polish FADN, were subjected to a detailed analysis. The research showed
that the pig market is characterised by price volatility determining profitability of pig
production and influencing a generated level of income and profitability of pig farms. The
decomposition of return on equity with the use of Du Pont pyramid showed that within the first
years following Poland's accession to the EU, the changes in ROE were the most influenced by
return on sales, and in 2010, it was the asset turnover ratio. The direction of the return on
sales ratio's influence on ROE was positive, and that of asset turnover ratio was changing
within the subsequent years. The capital structure ratio had the lowest influence on changes of
return on equity.
Key words: return on equity, pig farms, Du Pont analysis.
JEL code: Q12, D24
Introduction
Enterprise efficiency is one of the most significant categories in the market economy and it
determines development of enterprises. It means a relative volume of financial result which
shows efficiency of committed capital and property as well as consumed resources in a
business activity. Profitability is measured by means of profitability indices in a form of profit
to different economic values ratio. These constitute a synthetic measure of evaluation of
efficiency and effectiveness of the whole enterprise's functioning in the context of achievement
of its basic objectives including profit and growth. These are also used to evaluate profit
generating capacity of enterprise management in connection to committed resources.
* Corresponding author. Tel.: + 48 22 593 4227; fax: + 48 22 593 4256.
E-mail address: [email protected].
Proceedings of the 2014 International Conference “ECONOMIC SCIENCE FOR RURAL DEVELOPMENT” No39
Jelgava, LLU EF, 24.-25. April 2015, pp. 97-107
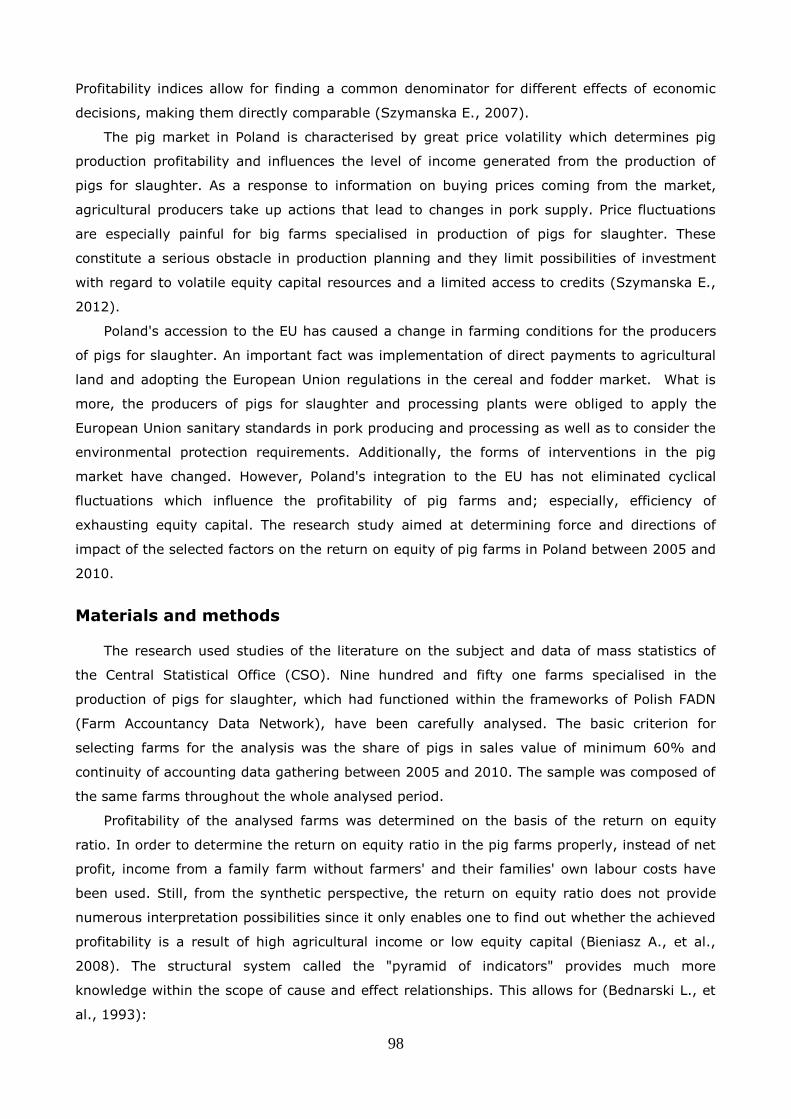
98
Profitability indices allow for finding a common denominator for different effects of economic
decisions, making them directly comparable (Szymanska E., 2007).
The pig market in Poland is characterised by great price volatility which determines pig
production profitability and influences the level of income generated from the production of
pigs for slaughter. As a response to information on buying prices coming from the market,
agricultural producers take up actions that lead to changes in pork supply. Price fluctuations
are especially painful for big farms specialised in production of pigs for slaughter. These
constitute a serious obstacle in production planning and they limit possibilities of investment
with regard to volatile equity capital resources and a limited access to credits (Szymanska E.,
2012).
Poland's accession to the EU has caused a change in farming conditions for the producers
of pigs for slaughter. An important fact was implementation of direct payments to agricultural
land and adopting the European Union regulations in the cereal and fodder market. What is
more, the producers of pigs for slaughter and processing plants were obliged to apply the
European Union sanitary standards in pork producing and processing as well as to consider the
environmental protection requirements. Additionally, the forms of interventions in the pig
market have changed. However, Poland's integration to the EU has not eliminated cyclical
fluctuations which influence the profitability of pig farms and; especially, efficiency of
exhausting equity capital. The research study aimed at determining force and directions of
impact of the selected factors on the return on equity of pig farms in Poland between 2005 and
2010.
Materials and methods
The research used studies of the literature on the subject and data of mass statistics of
the Central Statistical Office (CSO). Nine hundred and fifty one farms specialised in the
production of pigs for slaughter, which had functioned within the frameworks of Polish FADN
(Farm Accountancy Data Network), have been carefully analysed. The basic criterion for
selecting farms for the analysis was the share of pigs in sales value of minimum 60% and
continuity of accounting data gathering between 2005 and 2010. The sample was composed of
the same farms throughout the whole analysed period.
Profitability of the analysed farms was determined on the basis of the return on equity
ratio. In order to determine the return on equity ratio in the pig farms properly, instead of net
profit, income from a family farm without farmers' and their families' own labour costs have
been used. Still, from the synthetic perspective, the return on equity ratio does not provide
numerous interpretation possibilities since it only enables one to find out whether the achieved
profitability is a result of high agricultural income or low equity capital (Bieniasz A., et al.,
2008). The structural system called the "pyramid of indicators" provides much more
knowledge within the scope of cause and effect relationships. This allows for (Bednarski L., et
al., 1993):

99
- explaining directions and possibilities of reaching a goal defined in the system by a proper
synthetic indicator;
- showing positions of the particular indicators in the system, hence, indirectly, also in the
economic reality.
Using the models of relationships (including pyramids) by management of enterprises
facilitates the both monitoring the changes in the analysed profitability and their reasons. This
provides a sufficient foundation for identification of threats and weak points in a business
activity of an enterprise. These models are indispensable tools of the all-embracing evaluation
of enterprise functioning.
The research study took the structure and interrelationships between profitability indices
into consideration on the basis of the cause and effect relationships pyramid, known as Du
Pont analysis (Golas Z., 2009). In connection to the above-mentioned fact, the following
financial ratios were defined (Sokolowska E., 2012; Serpinska M., Jachna T., 2006):
return on equity ratio (ROE), which determines a rate of return on the capital employed in a
farm by its owner. This ratio may show a significant outside capital support (risky strategy)
or a considerable share of equity capital in a farm (more conservative strategy);
return on assets ratio (ROA) shows the rate of return on assets and; in some cases, the fact
of using a financial leverage supporting a financial activity of a farm. Therefore, this
relationship is especially useful in comparing farms.
return on sales ratio (ROS) defines operational effectiveness and it is calculated as
agricultural income to revenue on sales ratio. It determines the amount of profit units
generated by each sales unit. The lower this indicator, the higher sales value has to be
obtained to achieve a specific amount of agricultural income;
total asset turnover (TAT) means sales revenue to assets ratio. It determines efficiency of
using enterprise's assets in generating revenue;
equity multiplier (EMT) is a measurement of an enterprise's financial leverage. It constitutes
assets to equity capital ratio. It determines the structure of committed equity capital and
gives information on the level of financing the assets with borrowed capital.
To calculate the impact of the particular ratios (return on sales, total asset turnover and
equity multiplier) on increase or decrease in on the return on equity ratio, the partial
differences method has been used. This method consists in simultaneous distinguishing
individual partial deviations and partial deviations expressing the joint impact of factors as
well as in treating them as separate elements of analytical analysis (Bednarski L., et al.,
1996).
According to the partial differences method, the impact of the analysed factors on the
return on equity was determined in the several following stages:
1. Determining absolute deviations of the analysed ratios.
2. Determining the impact of a change of ratio level on the level of deviation of the return on
equity ratio.

100
3. Determining the joint impact of the combination of the two subsequent factors on ROE
changes.
4. Calculating the joint impact of the all three factors on ROE deviations.
5. Comparing the sum of partial deviations and the absolute deviation of ROE.
6. Determining the force and direction of the impact of partial changes on ROE.
Research results and discussion
Most authors agree that enterprise performance can be the best described by profitability
ratios. In empirical research are used such profitability ratios as ROA, ROE and ROS.
Circiumaruet et al., (2010) have analysed the 2008 data from seventy three manufacturing
companies, and dealt with the impact of three factors – return on sales, asset activity ratio,
and financial leverage – on ROE, using univariate regression analysis. A correlation was found
between ROS and ROE, however, the impact of ROS on ROE was not identified. A linear
relationship was not found between asset activity ratio, financial leverage and ROE.
Kabajeh et al., (2012) have looked at a small sample of companies (twenty eight
enterprises) in the period of 2002 - 2007. The results revealed a positive relationship between
return on assets, ROE, return on investment and market price of shares. Kasilingam and
Jayabal (2012), using the example of one company (time period 1996 - 2009), have analysed
profitability and solvency. They have discovered that there is a positive relationship between
ROE and assets – to - equity ratio, as well as the assets activity ratio.
Stocker (2005), by analysing ROE of companies in different countries, have concluded that
return on equity is directly related with economic freedom. A recommendation was put forward
that in order to receive a higher return on investment one must choose countries, where an
increase in economic freedom is expected. As pointed out by Liesz (2002), the DuPont model is
significant in order to illustrate the relationship of balance sheet and profit or loss account
items, as a result of which it is possible to work out strategies for improvement of ROE.
The issue of profitability is also important in agriculture. In this study the return on equity
in the pig farms was subjected to a detailed analysis. This issue is particularly important
because of the difficult situation of live pig producers in Poland. The pig market is very
unstable; mainly due to fluctuations in pigs for slaughter prices, as well as, agricultural inputs
prices, which are difficult to predict. A significant issue is also great fragmentation of pig farms
and the resulting too small production scale hindering the achievement of satisfying economic
effects and capital accumulation. The cyclical fluctuations in the pigs for slaughter market are
quite well presented by the profitability ratio. It is reflected by; among others, pigs for
slaughter buying prices to the rye price ratio (Figure 1).
After Poland's accession to the EU, the profitability of the production of pigs for slaughter
improved considerably since pig buying prices rose and cereal prices dropped. In 2005, an
increase in pig population was recorded together with a considerable decrease in porker buying
prices. However, thanks to a decrease in cereal prices, the profitability of pig production was

101
relatively decent. In the next year, low buying prices caused considerable deterioration of
profitability of pig production in Polish market. Additionally, cereal price behaviour was
unfavourable which resulted from low supply. Weak pig market's situation became even worse
in 2007 and it stayed that way till the mid 2008. As a result of the unfavourable economic
situation, there was a deep reduction of pig population. In November 2008, there were 14.3
million pigs handled in Poland. In the subsequent year the downward trend in pig population
was not stopped. Only the record buying prices in the first three quarters of 2009 and high
profitability of pig production led to a temporary increase in pig population in the country
which amounted to 10.9 million in 2010 and was higher than in the previous year by 3.6%.
However, in 2010, the market conditions worsened. Fodder prices were similar while pig
buying prices dropped considerably. As a result, producers started resigning from pig breeding.
From the beginning of 2011, there was an increase in pig and fodder prices. Still, fodder price
development was higher and; ultimately, fodder prices increased by almost 23.0% in
comparison to the previous year. The increase in pigs for slaughter prices by almost 17.5% did
not make up for breeders' loss in relation to higher fodder prices. As a result, in 2012, the pig
population dropped to 11.6 million and, in 2013, to 11.1 million.
0
2
4
6
8
10
12
14
16
18
20
0
2
4
6
8
10
12
14
I 2005 V IX
I 2006 V IX
2007I V IX
2008I V IX
I 2009 V IX
I 2010 V IX
I 2011 V IX
I 2012 V IX
I 2013 V IX
I 2014 V IX
millio
ns of pig
s
pro
fita
bility
ratio
prof itability pig population
Source: author’s construction based on CSO data
Fig. 1. Buying prices for pigs for slaughter to rye prices ratio and changes in the pig
population in Poland between 2005 and 2010
The research was conducted in the relatively big farms both in relation to the area and
livestock. The average utilised agricultural area (UAA) in the analysed units was 30.75 ha in
2005 (Table 1). By 2010 that area increased up to 33.05 ha. However, pig population
increased in the analysed period from 59.5 to 68.5 livestock units (LU). Those were the farms
specialised in the production of pigs for slaughter. The share of pigs in the production value

102
was high and it constituted from 65.2 to 75.4%. The average level of agricultural income was
the lowest in 2006 and 2008 when it was; respectively, PLN 67.2 and 69.5 thousand per farm.
The highest level of income was reached by the farms between 2009 and 2010 - approximately
PLN 90.0 thousand per farm. Despite cyclical fluctuations in the pig market, the farmers
invested a part of their financial resources in the further development of farms. The highest
amount was invested in 2006; approximately PLN 28.7 thousand per farm, and the lowest
amount was spent in 2008; it was only PLN 1.5 thousand.
Table 1
Selected features of the analysed pig farms
Years
Utilised
agricultural
area
The number
of livestock
units of pigs
The share of
pigs in the
production
value
Agricultural
Income in
thou. PLN
Net
Investment in
a thou. PLN
2005 30.27 59.5 74.0 67.2 11.0
2006 30.43 66.5 71.5 74.4 28.7
2007 31.26 66.1 65.2 70.0 12.9
2008 31.71 65.3 72.5 69.5 1.5
2009 32.41 69.0 75.4 89.9 17.0
2010 33.05 68.5 67.2 90.0 14.3
Source: author’s construction based on FADN data
In order to evaluate the economic situation of the analysed farms, the return on equity
ratio has been used. Return on equity is one of the most important measurements of economic
advantages for owners of any kind of enterprises operating within the market economy. The
ability of capital accumulation through generation of profits is a decisive factor in connection to
development or cessation of a business; regardless of a branch, in the long run.
In the analysed period, the return on equity of the farms changed according to the trends
in production profitability. Within first two years after the EU accession, this ratio was, on
average, 16.22 and 16.87% (Table 2). Subsequently, as a result of economic downturn in the
pig market, this ratio was reduced to 15.43% in 2008. In the next two years it was over
17.1%. The return on assets ratio showed similar trends; still, it was lower by approximately 3
percentage points (pp). Its lowest value was recorded between 2007 and 2008 and the highest
between 2009 and 2010.

103
Table 2
Profitability indices in the analysed farms
Years The size of ratios Absolute deviations
ROE ROA ROS ATO EMT ROE ROA ROS ATO EMT
2005 16.22 13.75 36.44 0.38 1.18 x x x x x
2006 16.87 14.10 39.62 0.36 1.20 0.65 0.36 3.19 -0.02 0.02
2007 15.43 12.81 35.28 0.36 1.20 -1.45 -1.30 -4.34 0.01 0.01
2008 14.47 12.11 31.50 0.38 1.19 -0.95 -0.70 -3.77 0.02 -0.01
2009 17.74 14.92 35.65 0.42 1.19 3.27 2.81 4.15 0.03 -0.01
2010 17.13 14.50 36.63 0.40 1.18 -0.61 -0.42 0.98 -0.02 -0.01
Source: author’s construction based on FADN data
The return on sales ratio fell within the range from 39.62% in 2006 to 31.5% in 2008. In
the next two years the return on sales was increasing and in 2010 it reached a similar level to
the one from 2005 - 36.63%. Unlike other ratios, the return on sales ratio increased in 2010.
The total asset turnover maintained similar value throughout the whole analysed period and it
was from 0.36 to 0.42. Only in 2006 and 2010, its decline has been recorded. Even less
considerable fluctuations concerned the equity multiplier between 2005 and 2010. It fell within
the range of 1.18 - 1.20, and since 2007 this ratio did not decrease.
In order to determine the decisive factors in connection to the value of the return on
equity ratio, it was decomposed with the use of the Du Pont model (Figure 2). According to the
model, return on equity is dependent on return on sales, total asset turnover and a capital
leverage which mechanism consists in the fact that an increase in debt is, on the one hand,
reflected in a decrease in the share of equity capital, on the other hand, in an increase in profit
related to equity capital (Wedzki D., 2006).
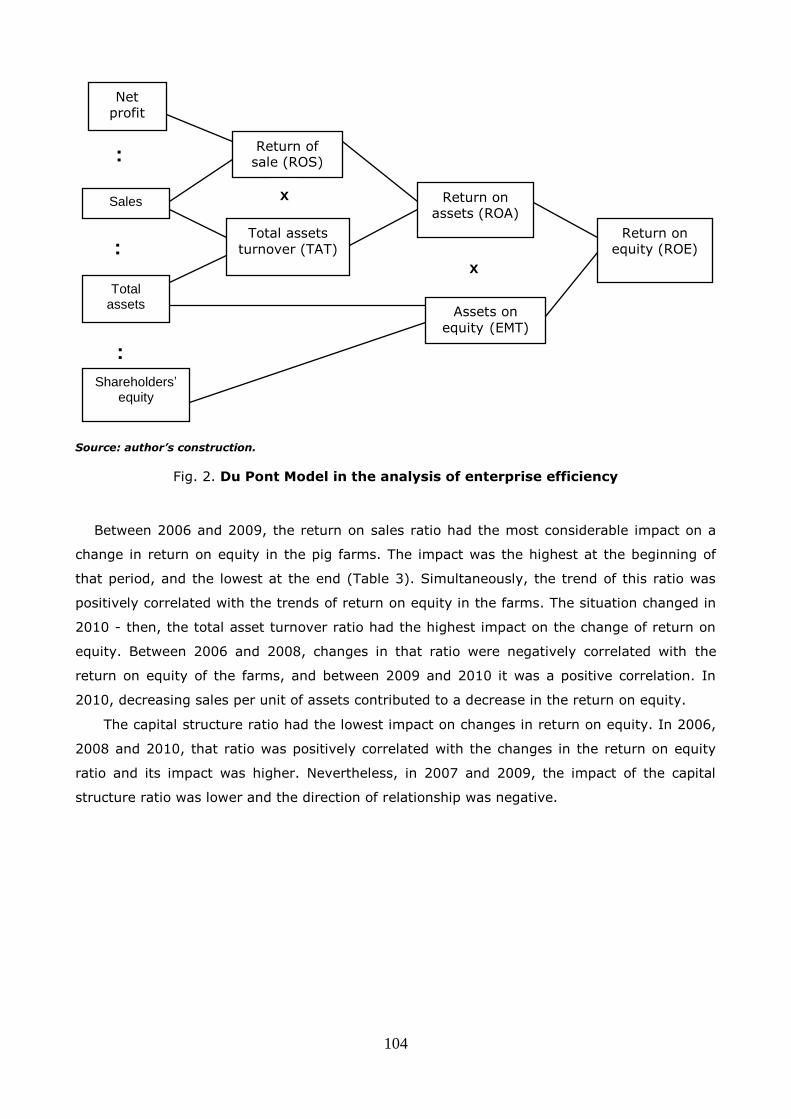
104
:
:
:
Source: author’s construction.
Fig. 2. Du Pont Model in the analysis of enterprise efficiency
Between 2006 and 2009, the return on sales ratio had the most considerable impact on a
change in return on equity in the pig farms. The impact was the highest at the beginning of
that period, and the lowest at the end (Table 3). Simultaneously, the trend of this ratio was
positively correlated with the trends of return on equity in the farms. The situation changed in
2010 - then, the total asset turnover ratio had the highest impact on the change of return on
equity. Between 2006 and 2008, changes in that ratio were negatively correlated with the
return on equity of the farms, and between 2009 and 2010 it was a positive correlation. In
2010, decreasing sales per unit of assets contributed to a decrease in the return on equity.
The capital structure ratio had the lowest impact on changes in return on equity. In 2006,
2008 and 2010, that ratio was positively correlated with the changes in the return on equity
ratio and its impact was higher. Nevertheless, in 2007 and 2009, the impact of the capital
structure ratio was lower and the direction of relationship was negative.
Net profit
Return of sale (ROS)
Sales
Total assets
Return on assets (ROA)
Total assets
turnover (TAT)
Shareholders’ equity
Assets on
equity (EMT)
Return on equity (ROE)
x
x

105
Table 3
The impact of return on sales, total asset turnover and capital structure on the return
on equity of the analysed farms
Years
Impact of changes of factors on size
of deviation ROE Strength of impact
ROS ATO EMT ROS ATO EMT
2006 1.42 -1.00 0.23 217.66 -153.38 35.71
2007 -1.85 0.30 0.10 127.81 -20.58 -7.23
2008 -1.65 0.81 -0.12 172.88 -85.11 12.23
2009 1.90 1.45 -0.08 58.19 44.38 -2.57
2010 0.49 -0.98 -0.11 -79.84 161.19 18.65
Source: author’s construction based on FADN data
The calculations showed that the highest decrease in return on equity in the analysed
farms in comparison to the previous years was recorded in 2007 (by 1.44 pp). The following
changes had an influence on the above-mentioned situation:
- decrease in return on sales caused a decrease in ROE by 1.85 pp;
- increase in total asset turnover contributed to an increase in ROE by 0.30 pp;
- change in the capital structure had an impact on the improvement of ROE by 0.10 pp.
-0.2
-0.1
0.0
0.1
0.2
0.3
0.4
-0.3
-0.2
-0.1
0.0
0.1
0.2
0.3
0.4
2006 2007 2008 2009 2010
EMT
ATO
ROS
ROE
Source: author’s construction based on FADN data
Fig. 3. Decomposition of ROE between 2005 and 2010
A different situation took place in 2009. Then, the return on equity ratio in comparison to
the previous year increased by 3.27 pp. This resulted from the following changes:
- increase in return on sales caused an increase in ROE by 1.90 pp,
- increase in total asset turnover contributed to an increase in ROE by 1.45 pp,

106
- change in the capital structure had an impact on the reduction of ROE by 0.08 pp.
Conclusions, proposals, recommendations
1. After Poland's accession to the EU, the conditions of pig production have changed as a result
of the free flow of goods and adopting legal as well as veterinary and sanitary regulations
binding in the Member States. However, the integration has not eliminated cyclical
fluctuations in the pig market. As a result of changes in pig production profitability and an
increase in livestock import from other EU states, the economic situation of some producers
of pigs for slaughter in Poland has deteriorated. In turn, this resulted in the reduction of pig
livestock. Between 2006 and 2013, pig population in Poland decreased by 41.3%.
2. The changes in production profitability in the market of pigs for slaughter determined
profitability of pig farms which is evaluated by means of different indices. Still, from the
synthetic perspective, they do not provide numerous interpretation possibilities. The
structural system of profitability indices in a form of Du Pont pyramid provides much more
knowledge within the scope of cause and effect relationships.
3. The research study concerning the pig farms gathering accounting data in Polish FADN
showed that return on sales had the highest impact on changes of ROE; especially, in the
first years following the EU accession. The situation changed in 2010 where the total asset
turnover ratio had the highest influence in return on equity. The direction of the return on
sales ratio's influence on ROE was positive, and that of asset turnover ratio was changing
within the subsequent years. The capital structure ratio had the lowest influence on changes
of return on equity.
4. With regard to the considerable influence of the return on sales ratio on the return on
equity, the managers of pig farms should pay special attention to this ratio, analyse
production structure and volume of output as well as sales price. Conducting such analyses
will enable them to make rational decisions in running pig farms.
Acknowledgements
The project was funded by the National Science Centre on the basis of decision DEC-
2013/09/B/HS4/03606.
Bibliography
1. Bednarski, L., Borowiecki, R., Duraj J., Kurtys, E., Wasniewski, T., Wersty B. (1993).
Analiza ekonomiczna przedsiebiorstwa (Economic Analysis of the Company). Wydawnictwo
Akademii Ekonomicznej we Wroclawiu (Publishing House of Wroclaw University of
Economics), Wroclaw.
2. Bieniasz, A., Czerwinska-Kayzer, D., Gołas, Z. (2008). Analiza rentownosci
przedsiebiorstwa z wykorzystaniem metody roznicowania (Analysis of the Company
Profitability Using the Differentiation Method). Journal of Agribusiness of Rural
Development, No 3(9), pp. 23-32.

107
3. Circiumaru, D., Siminica, M., Marcu, N. (2010). A Study on the Return on Equity for the
Romanian Industrial Companies, Annals of University of Craiova – Economic Science
Series, 2(38).
4. Gołas, Z. (2009). Czynniki determinujace rentownosc kapitalu wlasnego w rolnictwie.
(Factors Determining the Return on Equity in Agriculture). Journal of Agribusiness of Rural
Development, No 1(11), pp. 75-91.
5. Kabajeh, M.A.M., Al Nu’aimat, S.M.A., Dahmash, F.N. (2012). The Relationship between
the ROA, ROE and ROI Ratios with Jordanian Insurance Public Companies Market Share
Prices, International Journal of Humanities and Social Science, 2(11), pp. 115-120.
6. Kasilingam, R. & Jayabal, G. (2012). Profitability and Solvency Analysis of A Manufacturing
Company Using DuPont and Altman Model, BVIMR Management Edge, 5(2), pp. 53-64.
7. Liesz, T. (2002). Really Modified DuPont Analysis: Five Ways to Improve Return on Equity,
Proceedings of the SBIDA Conference.
8. Sierpinska M., Jachna T. (2006). Ocena przedsiebiorstw według standardow swiatowych
(Evaluation of Enterprises According to World Standards).
Wydawnictwo Naukowe PWN (State Scientific Publishing House), Warsaw.
9. Sokolowska, E. (2012). Rentownosc kapitalu własnego przedsiebiorstw niefinansowych
przy wykorzystaniu piramidy Du Ponta (Return on equity of non-financial enterprises using
Du Pont pyramid). Kwartalnik Nauk o Przedsiebiorstwie (Quarterly of Enterprise Sciences),
No 4, pp. 46-59.
10. Stocker, M.L. (2005). Equity Returns and Economic Freedom, CATO Journal, 25(3), pp.
583-594.
11. Szymanska, E. (2007). Analiza przedsiebiorstw agrobiznesu (techniczno-ekonomiczna,
finansowa i strategiczna) (Analysis of Agribusiness Enterprises (Technica, Economic,
Financial and Strategic)). Publishing House „Village of Tomorrow". Warsaw.
12. Szymanska, E. (2012). Zmiennosc koniunktury na rynku trzody chlewnej w Polsce
(Economic Fluctuations in Pig Market in Poland). Roczniki Naukowe SERiA (Annals of the
Polish Association of Agricultural and Agribusiness Economists), T. 14, z. 1, pp. 524-528.
13. Wedzki, D. (2006). Analiza wskaznikowa sprawozdania finansowego (Ratio Analysis of
Financial Statements), Oficyna Ekonomiczna (Oficyna Economics), Krakow.

108
ENTREPRENEURSHIP AND TRENDS IN DEVELOPMENT OF RURAL
COMMUNES IN POLAND
Wioletta Bienkowska-Golasa*, PhD+
1Warsaw University of Life Sciences (SGGW)
Abstract. The article presents a more in-depth look at the concept and nature of
entrepreneurship in rural areas in Poland. Empirical studies have been conducted in 2011 in
229 rural communes in the Mazowieckie region and their objective was to present the opinions
of the local authorities on the directions for development of individual communes. This was
accomplished using a diagnostic survey method executed by means of a survey following a
standardised questionnaire. It has been found that the main objectives to be implemented by
the surveyed communes’ local authorities were: improving social and technical infrastructure,
attracting outside investors as well as initiating and supporting local entrepreneurship. Local
authorities perceived development of small and medium-sized enterprises as the primary
direction for development of their communes.
Key words: entrepreneurship, local government, local development, Mazowieckie, Poland.
Jel code: R11
Introduction
Today, the issue of entrepreneurship is approached from a very wide perspective as it
includes economic, technological, psychological and many others aspects, bringing new
behaviours, attitudes and values. This applies to both business operations and other forms of
human activity, which require creativity and initiative, in other words entrepreneurship. It
becomes a “way of life” for all participants of a market economy, both households and
enterprises. Indeed, it is the market that imposes such a situation, becoming a natural driving
force behind entrepreneurial behaviour in a market economy.
The issue of entrepreneurship development at a local level is an essential element of a
broader issue - the development of the local economy, which is reflected in, inter alia, an
increase in GDP per capita, job growth and changes in the economic structure of a particular
area. The aforementioned development should result in: new businesses and jobs, increased
Corresponding author. Tel.: +48 225934161 fax: + 48 225934161
E-mail address: [email protected]
Proceedings of the 2015 International Conference “ECONOMIC SCIENCE FOR RURAL DEVELOPMENT” No39
Jelgava, LLU ESAF, 23-24 April 2015, pp. 108-115
109
number and quality of services, resources in the form of attractive locations (developed land,
real estate, etc.), intellectual resources (skills, knowledge, qualifications of local community
members) (Struzycki M., 2006).
The Mazowieckie voivodeship was selected for the empirical study because it is the
most economically diversified voivodeship in Poland. It has the area of 35.6 thousand km2,
which amounts to 11.4% of Poland’s territory, and the population of 5.08 m people, which, in
turn, corresponds to the 13.5% share in the whole country’s population. The majority of the
people settled in towns (64%), where the Warsaw conurbation is the main centre. At the same
time, the Mazowieckie region has the largest population of rural people. The settlement
network consists of 85 towns, including the capital of Poland, which may be considered as a
metropolitan centre at the European level, and 4 towns with poviat rights, which are: Plock,
Radom, Siedlce and Ostroleka. As regards local service centres, there are 37 towns – poviat
headquarters and 314 districts, including 35 municipal ones, 50 municipal-rural ones, and 229
rural ones, which account for 73% of all the districts in the voivodeship (The Development
Strategy for the Mazowieckie voivodeship till 2020, as amended, 2006).
Empirical studies in this article consisted of the collection and analysis of information
obtained from studies conducted using the diagnostic survey method performed by means of a
survey prepared using a standardised questionnaire. All the rural districts of the Mazowieckie
voivodeship (229), which account for ¾ of all this voivodeship districts, were the object of the
study. The questionnaire was addressed to the representatives of self-government authorities
(village heads, secretaries, or treasurers). The replies came from 137 districts, which
accounted for almost 60% of the examined districts. The questionnaire was conducted in 2011
and it covered, among other things, questions concerning the development paths of particular
districts.
The research mainly aimed to present the self-government authorities’ opinions on the
development paths of particular districts. Moreover, the article determined two research tasks:
- what factors have the most significant influence on the development of a given district
according to the district self-government authorities;
- which objectives articulated in the development strategy are considered by self-
government authorities as the most important ones.
The nature and concept of entrepreneurship from a theoretical
perspective
When consulting literature on entrepreneurship, one can notice that it has existed for as
long as humanity itself. Considerations regarding the issue of entrepreneurship include both
the development of entrepreneurship and the role of the entrepreneur. These concepts are
linked because there can be no entrepreneurship without the entrepreneur and vice versa. The
existence of the entrepreneur and the actions taken by him or her implies the existence of

110
entrepreneurship, provided preferable conditions are established by the general principles of
functioning of a particular society and economy.
From a methodological perspective, considering entrepreneurship and entrepreneurs as
combined entities seems justified. Arguments confirming this approach are provided by
theories and concepts of entrepreneurship that have arisen in different sciences. In some
concepts a greater emphasis has been placed on a subjective approach (focusing on the
functions, characteristics, personality of the entrepreneur), while in others the procedural
approach prevails (with an emphasis on entrepreneurship as a complex process, on the
dynamics of the phenomenon).
An analysis of entrepreneurship theories formulated over many decades makes it
possible to present a multi-dimensional concept of the development of this issue, which has
arisen at different times, within different disciplines, indicating its interdisciplinarity. In
literature on entrepreneurship it is possible to separate concepts that were created on the
basis of economics, management sciences, psychology and culture. However, the most
extensive collection consists of concepts developed within various branches of economic
theory, in particular those in the field of company theory.
In literature on this subject one can find many interpretations of the concept of
entrepreneurship, as it is a multi-faceted category combining many sciences, which means that
there is no single, coherent definition. It is an issue discussed by economists, representatives
of management-related sciences, psychologists and sociologists. Due to the diversity of
interests and expertise of the individual sciences, they stress economic, social, psychological or
educational aspects.
In many research approaches, especially those related to economics, entrepreneurship
is linked to economic activity and is also often identified with the establishment and running of
a business, analysed based on benefits of an economic nature that can be achieved by taking
entrepreneurial actions within businesses, local communities, regions as well as the country's
economy (Golasa P., 2013). Psychologists link the concept of entrepreneurship to a set of an
individual's traits and analyse the internal mechanisms, called personality mechanisms, which
shape the aforementioned traits and direct entrepreneurial behaviour. Meanwhile, sociologists
analyse mechanisms that contribute to the diffusion of any innovation in a given society, the
role played by local leaders in this process as well as the effects entrepreneurial activities have
on the local community.
P.F. Drucker, recognised as an international expert in the field of entrepreneurship,
defines it as: “the interdependence of entrepreneurial and innovative activities that make it
possible to achieve the intended purpose - to succeed in a particular market segment or
conducted business operations” (Drucker P.F., 1992). From an economic standpoint
entrepreneurship is “the ability to see the possibilities inherent in the environment and taking
advantage of them to commence business in the form of an organised enterprise, resulting
from internal (subjective) predisposition of a person, i.e. entrepreneur” (Nogalski B., 2003).

111
Development of entrepreneurship, understood as encouraging initiative and creating conditions
for establishing and conducting economic operations, contributes to increased economic
development, particularly in less developed regions. Entrepreneurs, who in such areas usually
operate in market niches, participate in changing the industrial structure, initiate the creation
and development of new products and services, make a significant contribution to overcoming
economic crises, make it possible to obtain satisfactory results of economic development
(Piecuch T., 2010).
In summarising the discussion related to the concept and nature of entrepreneurship, it
can be concluded that it is a quite complex, multi-faceted issue combining many elements
from various disciplines.
Research results and discussion
In Poland, entrepreneurship had been recognised at the time the foundations of a
market economy were being formed, when the principles of a welfare state ceased to exist.
Then, people who had such qualities as creativity, resourcefulness, ingenuity, who were and
are open to innovation, began to run their own businesses in various areas of life.
Entrepreneurship within an economy, at all levels - national, regional or global - is an
extremely important part of socio-economic progress and a complex process, whose nature is
defined by organised activity, based on the cooperation of many people and implementation of
actions undertaken by them (Bienkowska W., 2013).
The development of regional businesses is also affected by the actions of all participants
of socio-economic life of a particular commune. Measures taken should result from a process of
cooperation between the actors in local life and focus on an understood and generally accepted
development programme. This is the task for the local government authorities representing the
particular local community. Local authorities have in their powers competencies and
capabilities to create a suitable programme, one determining the directions for development
and the means for its execution as well as the implementation method of investment projects
(Bienkowska-Golasa W., 2013).
The powers of the local authorities include the preparation of a development strategy
aimed at improving the quality of life in the commune as well as making it easier to adapt to a
constantly changing environment. The main tasks of the commune's development strategy
should be to provide a basis for:
the delineation of strategic directions for commune development;
the efficient, rational and effective management of the commune by its authorities;
the creation of optimum features of the location from the usability perspectives for
investors;
the optimal use of their own limited financial resources;
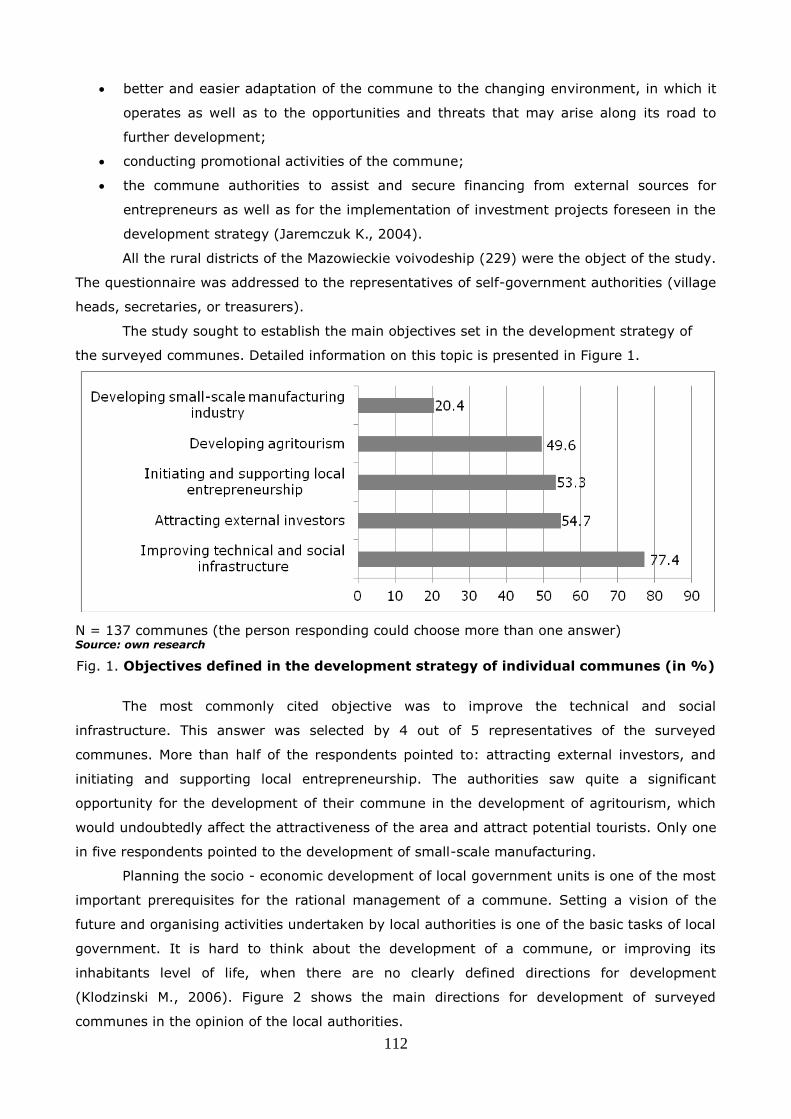
112
better and easier adaptation of the commune to the changing environment, in which it
operates as well as to the opportunities and threats that may arise along its road to
further development;
conducting promotional activities of the commune;
the commune authorities to assist and secure financing from external sources for
entrepreneurs as well as for the implementation of investment projects foreseen in the
development strategy (Jaremczuk K., 2004).
All the rural districts of the Mazowieckie voivodeship (229) were the object of the study.
The questionnaire was addressed to the representatives of self-government authorities (village
heads, secretaries, or treasurers).
The study sought to establish the main objectives set in the development strategy of
the surveyed communes. Detailed information on this topic is presented in Figure 1.
N = 137 communes (the person responding could choose more than one answer) Source: own research
Fig. 1. Objectives defined in the development strategy of individual communes (in %)
The most commonly cited objective was to improve the technical and social
infrastructure. This answer was selected by 4 out of 5 representatives of the surveyed
communes. More than half of the respondents pointed to: attracting external investors, and
initiating and supporting local entrepreneurship. The authorities saw quite a significant
opportunity for the development of their commune in the development of agritourism, which
would undoubtedly affect the attractiveness of the area and attract potential tourists. Only one
in five respondents pointed to the development of small-scale manufacturing.
Planning the socio - economic development of local government units is one of the most
important prerequisites for the rational management of a commune. Setting a vision of the
future and organising activities undertaken by local authorities is one of the basic tasks of local
government. It is hard to think about the development of a commune, or improving its
inhabitants level of life, when there are no clearly defined directions for development
(Klodzinski M., 2006). Figure 2 shows the main directions for development of surveyed
communes in the opinion of the local authorities.
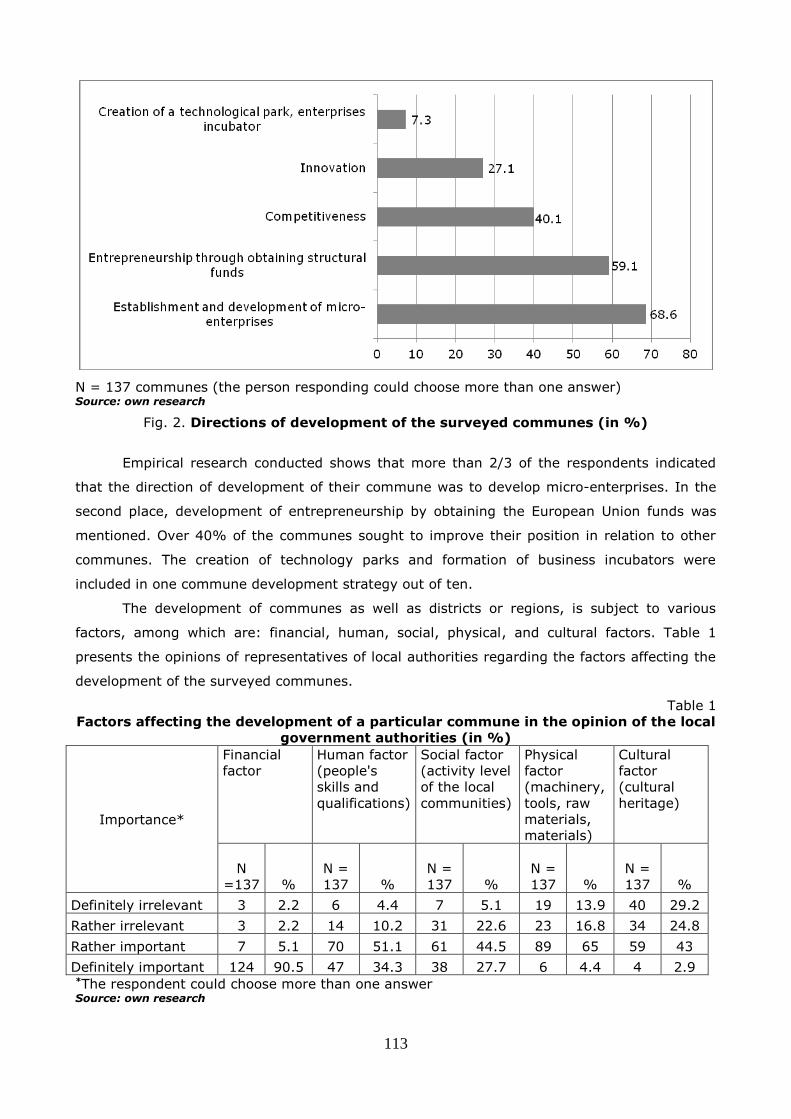
113
N = 137 communes (the person responding could choose more than one answer) Source: own research
Fig. 2. Directions of development of the surveyed communes (in %)
Empirical research conducted shows that more than 2/3 of the respondents indicated
that the direction of development of their commune was to develop micro-enterprises. In the
second place, development of entrepreneurship by obtaining the European Union funds was
mentioned. Over 40% of the communes sought to improve their position in relation to other
communes. The creation of technology parks and formation of business incubators were
included in one commune development strategy out of ten.
The development of communes as well as districts or regions, is subject to various
factors, among which are: financial, human, social, physical, and cultural factors. Table 1
presents the opinions of representatives of local authorities regarding the factors affecting the
development of the surveyed communes.
Table 1
Factors affecting the development of a particular commune in the opinion of the local
government authorities (in %)
Importance*
Financial
factor
Human factor
(people's
skills and
qualifications)
Social factor
(activity level
of the local
communities)
Physical
factor
(machinery,
tools, raw
materials,
materials)
Cultural
factor
(cultural
heritage)
N
=137 %
N =
137 %
N =
137 %
N =
137 %
N =
137 %
Definitely irrelevant 3 2.2 6 4.4 7 5.1 19 13.9 40 29.2
Rather irrelevant 3 2.2 14 10.2 31 22.6 23 16.8 34 24.8
Rather important 7 5.1 70 51.1 61 44.5 89 65 59 43
Definitely important 124 90.5 47 34.3 38 27.7 6 4.4 4 2.9 *The respondent could choose more than one answer Source: own research
114
The vast majority indicated that funding was the most important factor in the
development of their commune. Only six commune representatives saw the financial factor as
irrelevant. More than 85% of respondents considered people's skills and qualifications as an
important factor. The social factor came in the third place with more than 2/3 of respondents
considering it as important or very important. In contrast, the cultural factor was indicated by
three-quarters of respondents as irrelevant in the development of the commune.
Conclusions
The following conclusions can be formulated on the basis of empirical research:
1. The main objectives to be implemented by the local authorities in the surveyed
communes were: improving social and technical infrastructure, attracting outside
investors as well as initiating and supporting local entrepreneurship.
2. Local authorities associated their commune’s direction of development with the
development of small and medium-sized enterprises, while activities focused on
assistance in the creation of business incubators were not an important direction of
development for the surveyed communes. Supporting opening new small and medium-
sized enterprises in the examined districts gives an opportunity to improve the living
conditions of the local communities. This will contribute to, among other things,
creating new workplaces and thus decreasing the unemployment in the examined
districts.
3. The most important factor affecting the development of the surveyed communes was
the financial factor. The self-government authorities considered this factor as the most
important one because the other factors which were covered by the study (human,
social, physical, and cultural factors) depend on financial resources to a great extent.
According to the author, the fundamental tasks carried out by local authorities should
include constant monitoring of the changes both in a district and in its external environment to
make the best use of the chances and to reduce the risks to the minimum.
In summary, it should be stated that the local economy must be supported and
analysed, taking into account the specific local conditions. In their commune development
strategy local authorities should make effective use of the overall local potential and indicate
activities aimed at implementing the primary objectives at a given time. At the same time they
should foresee possible alternative actions in the event of obstacles in the implementation of
primary activities (Bonczyk-Kucharczyk E., Herbst K., Chmura K., 1998).
Bibliography
1. Bienkowska, W. (2013). Activities of Local Authorities in Promoting Entrepreneurship in
Poland: Economic Science For Rural Development. Issue 32. p. 27.
2. Bienkowska-Golasa, W. (2013). Kierunki rozwoju gmin wiejskich województwa
mazowieckiego w zależności od ich poziomu społeczno-gospodarczego (Directions of the
115
Development of Rural Municipalities in Mazowieckie Province, Depending on Their Socio-
Economic Level). Roczniki Naukowe Stowarzyszenia Ekonomistów Rolnictwa i
Agrobiznesu T. 15, nr 4, pp. 57-62.
3. Bonczyk-Kucharczyk, E., Herbst, K., K. Chmura, K. (1998). Jak władze lokalne mogą
wspierać przedsiębiorczość (How Local Authorities Can Promote Entrepreneurship).
Warszawa: Polska Fundacja Pomocy i Rozwoju Małych i Średnich Przedsiębiorstw. p. 91.
4. Drucker, P. F. (1992). Innowacje i przedsiębiorczość. Praktyka i zasady (Innovation and
Entrepreneurship). Practices and Principles. Warszawa: PWE. p. 271.
5. Golasa, P. (2013). Taxes and Social Insurance Contributions Charges of Farms in Poland
in the Years 2004-2008. Economic Science for Rural Development: Production and
Cooperation in Agriculture /Finance and Taxes/ Book Series: Economic Science for Rural
Development. Issue 30, p. 242-247.
6. Jaremczuk, K. (2004). Przedsiębiorczość w procesie funkcjonowania samorządu
terytorialnego (Entrepreneurship in the Functioning of Local Government). Przemysl:
Wyższa Szkoła Administracji i Zarządzania w Przemyslu. p. 52-53.
7. Klodzinski, M. (2006). Aktywizacja społeczno-gospodarcza gmin wiejskich i małych
miast (Socio-Economic Activation of Rural Communities and Small Towns). Warszawa:
IRWiR PAN. p. 24.
8. Nogalski, B. (2003). Przedsiębiorczość – współczesnym wyzwaniem polskiej gospodarki.
[W] Przedsiębiorstwo – przedsiębiorczość – rynek. 50-lecie pracy M. Struzyckiego
(Entrepreneurship - the Contemporary Challenge of Polish Economy. In: Company -
Entrepreneurship - the Market. 50th Anniversary of M. Struzyckiego). Warszawa: SGH.
p. 149.
9. Piecuch, T. (2010). Przedsiębiorczość. Podstawy teoretyczne (Entrepreneurship.
Theoretical Basis). Warszawa: C.H. Beck. p. 9.
10. Strategia Rozwoju Województwa Mazowieckiego do roku 2020 (aktualizacja) (The
Development Strategy for the Mazowieckie Voivodeship till 2020 as amended). (2006).
Warszawa: Samorząd Województwa Mazowieckiego. p. 8.
11. Struzycki, M. (2006). Przedsiębiorczość w procesach rozwoju rynków lokalnych
(Entrepreneurship in the Processes of Development of Local Markets). Warszawa:
Instytut Rynku Wewnetrznego i Konsumpcji. p. 67.
116
ASSESSMENT OF THE IMPORTANCE OF BENEFITS PROVIDED BY RURAL
TOURISM HOMESTEADS IN LITHUANIA
Viktorija Grigaliūnaitė, Lina Pilelienė, PhD; and Arvydas Petras Bakanauskas, PhD
Vytautas Magnus University
Abstract. Tourism industry becomes an increasingly important service sector.
Hence, tourism provides many intangible benefits to consumers. Therefore, the scientific
problem “what intangible benefits are provided by rural tourism homesteads in Lithuania?” is
analyzed in the article. The aim of the research is to determine the intangible benefits, which
should be provided by rural tourism homesteads in Lithuania. As in case of the choice for rural
tourism homestead, all the utilitarian and hedonic benefits can be identified. Thus, the
hypotheses are made that utilitarian and hedonic benefits (savings, quality, convenience,
exploration, and entertainment) have a positive impact on tourists’ perceived total benefits.
Structural equation modelling (SEM) using partial least squares path modelling methodology
(PLS) and Importance-Performance matrix analysis (IPMA) was provided to assess the
importance and performance of every benefit. The analysis of the research results reveal that
the main benefits for the improvement with management activities are convenience and
entertainment; and the enhancement of latter benefits can lead to the gaining of competitive
advantage for the rural tourism homestead in Lithuania. Moreover, the investments into the
benefit of quality might be suspended for the certain period in order to balance investments
while enhancing perceived total benefits regarding the choice of rural tourism homestead in
Lithuania.
Key words: benefits, importance, performance, rural tourism, value.
JEL code: M31, M39.
Introduction
The importance of tourism industry in the world’s economy is hardly deniable. Actually,
tourism as an industry can be divided into few forms that are more precise: local, inbound, and
outbound. Moreover, based on its essence, tourism can be considered as urban or rural.
Žalys L. et al. (2006) state that rural tourism incorporates two forms of tourism – local and
Corresponding author. Tel.: + 370 37 327856; fax: + 370 37 327857.
E-mail address: [email protected].
Proceedings of the 2015 International Conference “ECONOMIC SCIENCE FOR RURAL DEVELOPMENT” No39
Jelgava, LLU ESAF, 23-24 April 2015, pp. 116-123

117
inbound. According to Hui S. and Ning Z. (2014), the development of rural tourism will
promote the rural economy and affect the whole national economy. In the heart of every
industry consumers can be found. Moreover, consumer satisfaction has to be achieved: only
satisfied consumers return to organization, recommend it to others, become loyal. Latter
statements are very important in tourism as well as in all other business sectors.
Consumers do not buy products or services just because they exist, rather to attain some
particular value. Chang C. and Dibb S. (2012) argue that the products and services that
consumers purchase are the outcomes of the consumer buying process during which
individuals assess the benefits and costs of acquiring the required products and services.
Based on the latter point of view, understanding the benefits, which are the most important for
consumers, can help organization improve and emphasize them; thus, proper management of
the most important benefits can help excel in the market.
Tourism is often considered as a part of service sector. Accordingly, it can be stated that in
line with tangibles, tourism provides many intangible benefits to consumers. Therefore, the
scientific problem analyzed in the article is: what intangible benefits are provided by rural
tourism homesteads in Lithuania?
The aim of the research is to determine the intangible benefits, which should be provided by
rural tourism homesteads in Lithuania.
Three objectives are set to achieve the aim:
1. to determine most important intangible benefits for consumers while choosing a rural
tourism homestead;
2. to assess the benefits’ performance from tourist perspective;
3. to provide managerial implications for rural tourism homesteads in Lithuania in terms of
benefit provision.
Research results and discussion
Achieving to reach the aim of the article, questionnaire research was provided to determine
the importance and performance of intangible benefits established in scientific literature.
Consequently, the importance-performance matrix for the analyzed benefits was composed to
reflect the existing situation in rural tourism homestead from consumer perspective.
Scientific substantiation
Customers use or consume products or services because of their benefits and value, not
because of their attributes (Chiu C. et al. 2014). Finding the motivating benefits becomes an
essential task for every organization achieving to gain success in the market, excel among
competitors.
According to Ivanova M. (2012), the purchase decisions of customers and their behaviour
can be explained with utilitarian and hedonic motives. Chiu C. et al. (2014) suggest that
utilitarian and hedonic values (benefits) are always present in all types of consumption;

118
furthermore, utilitarian and hedonic values are the dimensions of the perceived value.
Lim E. A. C. and Ang S. H. (2008) argue that a hedonic benefit claim describes hedonic needs
for sensory pleasure, while a utilitarian claim concerns a pragmatic benefit. Chandon P. et al.
(2000) provide an explanation that utilitarian benefits are primarily instrumental, functional,
and cognitive, whereas hedonic benefits are non-instrumental, experiential, and affective.
In a framework of tourism, consumers have a wide variety of choices. It can be argued that
the choice of tourist destination (rural homestead in this case) will be mainly based on the
offer attractiveness. Only the determination of the most important benefits for the consumer
can lead to their proper management in terms of product portfolio, communication mix, or
adequate pricing.
During the analysis of consumer benefits Chandon P. et al. (2000) established six benefits:
savings, quality, convenience, value expression, exploration, and entertainment. According to
the authors, three of those benefits can be called utilitarian (savings, quality, convenience);
two benefits – exploration and entertainment – hedonic. As in case of the choice for rural
tourism homestead, all the utilitarian and hedonic benefits are pertinent. The assumption can
be made that proper management of these benefits could help in enhancing tourists’ perceived
total benefit of the offering and gaining competitive advantage.
Methodological background
Achieving to determine the intangible benefits, which should be provided by rural tourism
homesteads in Lithuania, questionnaire research was provided. The research was held in
Lithuania in 2014. Only Lithuanian citizens could participate in the research. The sample was
composed to proportionally reflect rural tourism homesteads in all the 10 counties of Lithuania.
The simple random sampling method was applied. The total amount of 350 questionnaires was
distributed and 322 questionnaires were returned; 121 men and 201 women participated in
the research.
The questionnaire was composed to reflect respondents’ opinion about the benefits
motivating them to book their vacation at a rural tourism homestead. There were two main
parts of the questionnaire:
1) benefit-related part, which contained questions-statements about the benefits affecting
the choice of the rural tourism homestead (18 statements: three for each benefit including
perceived total benefits). A Likert scale (with possible answers of: 1 – ‘Totally disagree’, 2 –
‘Disagree’, 3 – ‘Neither agree, nor disagree’, 4 – ‘Agree’, and 5 – ‘Totally agree’) was used to
identify respondents’ agreement or disagreement with the statements provided;
2) socio-demographic part. Respondents were asked to identify their age, gender, family
size, income, and the frequency of visiting rural tourism homesteads in Lithuania.
Consequently, the hypotheses were made that every benefit (savings, quality, convenience,
exploration, and entertainment) have a positive impact on tourists’ perceived total benefits.

119
Structural equation modelling (SEM) using partial least squares path modelling methodology
(PLS) and Importance-Performance matrix analysis was provided to assess the importance and
performance of every benefit; the importance-performance matrix was composed to identify
the main benefits for the improvement with management activities. The assessment builds on
the PLS estimates for the path model relationships and adds an additional dimension to the
analysis that considers the latent variables’ values (performances) (Höck C. et al. 2010).
SmartPLS V.3 (Ringle C. M. et al. 2014) and Matlab R2012b software packages were applied
for the statistical analysis.
Research results
The analysis of the research results revealed that the reflective measurement model was
reliable: indicators’ loadings were above 0.7 and statistically significant; moreover, all of the
Composite Reliability values were higher than 0.7, thus internal consistency reliability of the
measurement model was sufficient. The measurement model was considered as displaying
sufficient degree of convergent validity based on average variance extracted (AVE) values
being above 0.5. Furthermore, discriminant validity of the measurement model was evaluated
based on two criteria: Cross Loadings and Fornell-Larcker criterion. The latent constructs
shared more variance with their assigned indicators than with another latent variable in the
structural model.
The structural model exhibits predictive relevance: Stone-Geissers’ Q2 value for the
endogenous latent variable “perceived total benefits” is above zero. Moreover, predictors’
variables’ variance inflation factor (VIF) is lower than 5, thus, there is no problem of
multicollinearity.
The coefficient of determination (R2) of the endogenous latent variable “perceived total
benefits” is 0.533. Hence, the amount of explained variance is sufficient.
Path coefficients, their statistical significances, and effect sizes are presented below in
Table 1. As it can be seen, variable “convenience” has the highest positive and statistically
significant (p < 0.05) influence on the variable “perceived total benefits”. Moreover, variable
“convenience” has the highest effect size on the endogenous variable “perceived total
benefits”. The second highest impact on the variable “perceived total benefits” is exerted by
variable “entertainment”; furthermore, latter variable has the second highest effect size on the
endogenous variable “perceived total benefits”. The third most influential variable is “savings”
which has moderate, positive, and statistically significant influence on variable “perceived total
benefits”. The last benefit, which has statistically significant impact on variable “perceived total
benefits”, is variable “quality”; latter relationship is statistically significant but the impact of
“quality” on “perceived total benefits” is the lowest when compared with the rest of the
analyzed statistically significant impacts. The variable “exploration” has very low and
statistically non-significant influence on variable “perceived total benefits” regarding the choice
of rural tourism homestead in Lithuania. Accordingly, four hypotheses stating that benefits

120
“quality”, “convenience”, “entertainment”, and “savings” influence Lithuanian tourists’
perceived total benefits for the choice of rural tourism homestead in Lithuania are supported,
while hypothesis stating that benefit “exploration” influences tourists’ perceived total benefits
is rejected.
Table 1
Path Coefficients, statistical significances and effect sizes
Latent Variables Path
Coefficient
Standard
Deviation
T
Statistics
Effect
size (f2)
Quality -> Perceived Total Benefits 0.174* 0.0441 3.9419 0.043
Convenience -> Perceived Total Benefits 0.293* 0.0459 6.3877 0.105
Exploration -> Perceived Total Benefits 0.034 0.0440 0.7792 0.002
Entertainment -> Perceived Total Benefits 0.250* 0.0372 6.7184 0.092
Savings -> Perceived Total Benefits 0.214* 0.0476 4.4877 0.056
*p < 0.05 Source: elaborated by authors
As the structural model did not contain indirect effects, all of the path coefficients are equal
to the total effects, presented below in Table 2. Total effects represent the importance of the
each benefit on the tourists’ perceived total benefits offered by the rural tourism homestead in
Lithuania. The index values represent the performance of the each of the benefits from the
tourists’ perspective. The computation of index values is carried out by means of rescaling the
latent variable scores to a range of zero and 100 (Höck C. et al. 2010). As it can be seen in
Table 2, the performance of the perceived total benefits is the lowest when compared with the
separate benefits.
Table 2
Total Effects and Index values
Latent Variables Total Effect
(Importance)
Index value
(Performance)
Quality -> Perceived Total Benefits 0.174 68.084
Convenience -> Perceived Total Benefits 0.293 55.464
Exploration -> Perceived Total Benefits 0.034 58.498
Entertainment -> Perceived Total Benefits 0.250 63.194
Savings -> Perceived Total Benefits 0.214 63.064
Perceived Total Benefits - 54.106 Source: elaborated by authors
The assumed reason explaining the low performance of tourists’ perceived total benefits is
that the benefits with the lowest importance for the perceived total benefits have the highest
performance and vice versa. The importance-performance matrix for the variable “perceived
total benefits” was composed and is presented in Figure 1.
As it can be seen in Figure 1, variable “convenience” has the highest importance for the variable
“perceived total benefits”. Nevertheless, latter variable has the lowest performance level. This
benefit is essential for the enhancement of the perceived total benefits, and there is high necessity
for the proper management of this benefit in order to gain competitive advantage.

121
The benefit “exploration” has statistically non-significant impact on “perceived total
benefits” but latter benefit has higher performance level when compared to the benefit
“convenience”. Hence, the investments should be relocated from the benefit “exploration” to
the benefit “convenience”. Moreover, benefit “quality” has the highest level of performance,
although it is only in the fourth place regarding the importance for the “perceived total
benefits”. The investments into the benefit “quality” might be suspended for the certain period
in order to balance investments while enhancing perceived total benefits regarding the choice
of rural tourism homestead in Lithuania.
Source: elaborated by authors
Fig. 1. Importance-Performance matrix for the variable “Perceived Total Benefits”
Benefits “savings” and “entertainment” have similar levels of performance, though benefit
“entertainment” is more important for the “perceived total benefits”. Consequently, it could be
stated that the benefit of savings might not compensate the lack of the benefit of
entertainment, thus, latter benefit is worth investments and promotion.
The main benefits for the improvement with management activities are convenience and
entertainment; and the enhancement of latter benefits can lead to the gaining of competitive
advantage for the rural tourism homestead in Lithuania. As these two benefits represent both
utilitarian and hedonic benefits, there is a necessity for the rural tourism homestead in
Lithuania to provide benefits that are primarily instrumental, functional, and cognitive as well
as benefits that are non-instrumental, experiential, and affective.
Conclusions, proposals, recommendations
1. The most important benefits for consumers while choosing a rural tourism homestead in
Lithuania are convenience and entertainment. These two benefits represent both

122
utilitarian and hedonic benefits; hence, Lithuanian tourists value cognitive as well as
affective benefits provided by rural tourism homestead in Lithuania. The benefits of
savings and quality are less important for the perceived total benefits regarding the
choice of rural tourism homestead in Lithuania. Moreover, benefit of exploration is the
least important for the perceived total benefits regarding the choice of rural tourism
homestead in Lithuania; the investments into the latter benefit most likely would not
pay off.
2. From tourist perspective, benefit of quality has the highest level of performance, while
benefit of convenience has the lowest level of performance, although latter benefit is the
most important for consumers while choosing a rural tourism homestead in Lithuania.
The investments into the benefit of quality might be suspended for the certain period in
order to balance investments while enhancing perceived total benefits regarding the
choice of rural tourism homestead in Lithuania. Furthermore, as benefit of exploration
has higher performance level when compared to the benefit of convenience, hence, the
investments should be relocated from the benefit of exploration to the benefit of
convenience. Benefits of savings and entertainment have similar levels of performance,
though benefit of entertainment is more important for the perceived total benefits.
Consequently, it could be stated that the benefit of savings might not compensate the
lack of the benefit of entertainment, thus, latter benefit is worth investments and
promotion.
3. Marketing and management investments should be relocated from the benefits that
have average / high performance levels and low impacts for the perceived total benefits
to the benefits that have average / high impacts for the perceived total benefits and low
performance levels. Latter strategy could lead to the enhanced tourists’ perceived total
benefit of the offering regarding the choice of rural tourism homestead in Lithuania.
Consequently, this could contribute in gaining competitive advantage.
Bibliography
1. Chandon, P., Wansink, B., Laurent, G., (2000). A Benefit Congruency Framework of Sales
Promotion Effectiveness. Journal of Marketing, Volume 64, Issue 4, pp.65-81.
2. Chang, C., & Dibb, S. (2012). Reviewing and Conceptualising Customer-perceived Value.
Marketing Review, Volume 12, Issue 3, pp. 253-274.
3. Chiu, C., Wang, E., Fang, Y., & Huang, H. (2014). Understanding Customers' Repeat
Purchase Intentions in B2C e-Commerce: The Roles of Utilitarian Value, Hedonic Value and
Perceived Risk. Information Systems Journal, Volume 24, Issue 1, pp. 85-114.
4. Höck, C., Ringle, C. M., & Sarstedt, M. (2010). Management of Multi-Purpose Stadiums:
Importance and Performance Measurement of Service Interfaces. Int. J. Services Technology
and Management, Volume 14, Issue 2/3, pp. 118-207.
5. Hui, S., & Ning, Z. (2014). Study on Consumer Decision Making in Rural Tourism Based on
Factor Analysis Model. Journal Of Chemical & Pharmaceutical Research, Volume 6, Issue 10,
pp. 722-726.

123
6. Ivanova, M. (2012). A Benefit-Based Approach for Increasing the Effectiveness of
Promotions. Scientific Annals of the „Alexandru Ioan Cuza” University of Iaşi Economic
Sciences, Volume 59, Issue 2, pp. 67-82.
7. Lim, E. A. C., & Ang, S. H. (2008). Hedonic vs. Utilitarian Consumption: a Cross-Cultural
Perspective Based on Cultural Conditioning. Journal of Business Research, Volume 61, pp.
225–232.
8. Ringle, C. M., Wende, S, & Becker, J.-M. (2014). Smartpls 3. Hamburg: SmartPLS.
Retrieved from http://www.smartpls.com.
9. Žalys L., Žalienė I., Iždonaitė I. (2006). Lietuvos kaimo turizmo charakteristika ir plėtros
politika (Characteristics of Lithuanian Tourism and its Development Policy). Ekonomika ir
vadyba: aktualijos ir perspektyvos, Volume 2, Issue 7, pp. 180-188 (In Lithuanian).

124
Proceedings of the 2015 International Conference “ECONOMIC SCIENCE FOR RURAL DEVELOPMENT” No39 Jelgava, LLU ESAF, 23-24 April 2015, pp. 124-133
BUSINESS INCUBATORS AS A FINANCIAL INSTRUMENT FOR NEW
BUSINESS DEVELOPMENT
Iveta Puķīte1,*, Mg.sc, PhD Student, Ineta Geipele2, Prof., Dr.oec.
1,2Institute of the Civil Engineering and Real Estate Economics,
Faculty of Engineering Economics and Management,
Riga Technical University
Abstract. The state in facilitating the development of a successful national economy needs to
address the issue of support for small and medium-sized enterprises in order to improve their
competitiveness internationally, as well regards overall economic development and growth.
Latvian entrepreneurs in seeking to raise their competitiveness, need to focus on new
technologies, products and service solutions. Taking into account changes in the political
environment, as well as membership in the European Union, businesses must be ready to accept
the challenges of a changing environment: to achieve higher productivity, to achieve greater
added value, to enter new markets and to develop new products. There are a variety of support
activities to promote new business development in Latvia, which may be financed by the
government and EU structural funds, by private investors, investment funds and organizations.
One financial instrument co-financed BY EU structural funds relates to business incubators which
are national or regional economic and social development bodies whose mission is to assess and
support new business start-ups and provide opportunities for their growth. The aim of this article
is to clarify the nature of a business incubator, its importance in setting up a new company in
Latvia, including use of European Union structural funds. This paper addresses the following
issues: business incubator core, availability of EU structural funds, as well as a framework for
results based on the support received.
Keywords: Business incubators, European Union Structural Funds, small and medium-sized
enterprises, entrepreneurship.
JEL code: M130; M21; G23
Introduction
To insure company’s financial performance it is vital to think about how to attract funds and
as well as create a reasoned financial structure so that the enterprise may work making a profit.
It is important to choose the most appropriate and most effective method for attracting financial
sources. Especially at the business start-up stage, there is an abundance of ideas but little
funding.
When assessing the extent of initial financial investment, the following factors are most
important: which objectives require investment funds, how long will they be tied up and can the
125
necessary resources be found within the company or it is necessary to rely upon other sources
(Rurāne M., 2006).
The aim of this research is to study the nature of business incubators, their importance in
setting up new companies, including use of EU structural funds. The importance of this question
is stated, as well as the direction of future research. The study gives recommendations for future
incubator development. The object of this research object is business incubators in Latvia. The
task of this is to investigate the essential features of incubators, to develop theoretical
understanding, clarify the nature of support from EU funds and to analyze results achieved.
Research covers the period September 2009 – September 2014. Statistical data analysis,
qualitative research methods (expert interviews), compilation and analysis of data gathered
have all been used in this study. The object of this research is “business incubators as support
for small and medium-sized enterprises”.
Research hypothesis: support for business incubators provides entrepreneurs with
development opportunities when starting a new business.
Competition for investment is intensifying globally, and a business environment offering
competition on an equal basis, with minimal distortion resulting from the grey economy and
corruption, plays an increasingly important role in decision-making. Any robust business
environment must be internationally accessible.
Theoretical aspects – an overview
Any robust business environment promotes development of businesses, attracts new
companies and investments and involves the general population in addition to the workforce and
new employers. A clear and comprehensible business environment serves as a guarantee for
personal income for everyone and revenue for the state. Under such conditions, businesses
recognize the importance of corporate social responsibility and operate in a responsible manner
towards society and the environment (Latvijas Nacionālais attīstības plāns 2014. - 2020.gadam,
2012 Latvijas Nacionālais attīstības plāns 2014. - 2020.gadam, 2012).
The Latvian economy mainly consists of SMEs, 99.4%, of which, the majority are micro
enterprises. The leading institution for promotion of innovation and policy development, the
Ministry of Economics needs a clear vision about targeting financial support for SMEs and
knowledge enhancement. Actions executed thus far have been limited and did not provide result
in an overwhelmingly positive impact (Lukjanska R., 2011).
One of the financial instruments co-financed by the European Union Structural Funds is that
for business incubators; these entities for national or regional economic and social development,
with the added mission of evaluating and supporting creation and growth of new businesses. The
main task of an incubator is to create successful new businesses, ones which, after leaving the
incubator, will be financially self-sufficient. Business incubators create jobs, promote social

126
activity, commercialization of new technologies and create wealth both locally and nationally
(Pukite I., 2014). Ten incubators opened in 2009 in Latvia, financed by EU Structural Funds.
Many new business start-ups are faced with the problem of insufficient initial capital,
difficulties in attracting financial support, poor management or marketing skills and technical
support, and lack of information.
From the theoretical point of view business incubators are institutions, which nurture, foster
and create a supportive environment for selected, businesses with high potential. During the late
1970s business incubators in industrially developed countries became a tool for improving
regional and national competitiveness. The regional factor is important in the sense that
incubators can serve important economy development role for regions in decline. Historically,
incubators have developed through several generations, starting from simple space and
motivation provision and ending with so-called “new economy’’ incubators (Zeps and Avotins
(2010)) concentrating only on new technology-based firms. Wigins and Gibson (2003; p. 58-62.)
found that the main benefits due to incubators are business assistance and training, networking
and credibility (Lukjanska R., Zeps V., 2011).
As defined by Allen & McCluskey (Allen & McCluskey, 1990), business incubators can be
defined as organizations that provide office space and central services at a favorable price to
firms that are often recently set up (Ebbers J., 2014).
Business incubators nurture the development of early-stage and new companies, helping
them to survive and grow during the start-up period, when they are most vulnerable. The most
common goals of incubation programs include creating jobs in a community, enhancing a
community’s entrepreneurial climate, retaining businesses in a community, building or
accelerating growth in a local industry, and diversifying local economies (Umpqua business
centre, 2014).
A business incubator is a commercial entity that supports and encourages any form of
business operation in any sector of the economy. Its basic function is to encourage creation of
new innovative companies, during the incubation period providing these companies with
facilities, services and consulting business on core issues.
Global experience shows that the performance and success of business incubators is directly
dependent on the performance and development of business that exit the incubator. A successful
business incubator is characterized by a high survival rate post the incubation stage. It is equally
important to ensure the vitality and development of incubated businesses, thus demonstrating
the incubator’s sustainable economic impact on the development of the region (Pukite I., 2014).
Incubators have become a ubiquitous phenomenon in many parts of the world and are viewed
as a tool for promoting the development of technology-based growth firms. Considering the
large faith and considerable amounts of money invested in incubators, the identification of best
practice incubator models is of importance (Bergek A., Norrman C., 2008).
The principal aim of a business incubator is not only limited to improve quality of services to
the new firms, but also move towards sustainability. To measure the success rate of incubators
127
researchers often take variables such as incubator occupancy rate, tenant survival as well as
growth of the tenant (Basu R., Biswas D., 2013).
Incubation can be divided into three stages:
1. Pre-incubation period, where the future company needs support in making of business
plan, market research. Traditionally special knowledge skills are important at this stage. In
Latvia the operator may apply at this stage to various non-governmental organizations,
universities, participate in seminars and training courses.
2. Incubation period – During the incubation phase, Latvian incubators offer significant
financial support, make available of infrastructure, expert services, as well as support for new
product development, also support for the cost cutting, which is also the services offered by the
business incubators.
3. The post-incubation stage, when a company already has the ability to operate
continuously without support. At this stage, the a strategic plan for business development is
important, the availability of technology and experts is vital (Vanaga A., 2011).
The first incubator was established in 1959 in New York, USA. Charles Mancuso leased
premises he owned in an industrial center to small businesses that had just commenced
operations and guided them during the growth process. This incubator was unique up until
1970. Incubator precursors were essentially focused on technology or administrative support,
an incubator combined both forms of support. Since 1970, business incubators began to
spread around the world (Albert P., Gaynor L., 2001).
Originally, incubators differed from existing industrial parks and real estate agencies, due to
the fact that they, in addition to leasing space, also provided subsidized added-value business
services. The National Association of Business Incubators was founded in 1985 with initially 40
members. Currently, worldwide there are approximately 4,000 business incubators, of which
1/3 are located in North America, 30% in Europe, while the remaining 40%, in developing
countries (Laiviņa S., 2012).
The most recent and mid-term state policy to start “Business incubation’’ was launched in
Latvia at the beginning of 2009 by the Latvian Ministry of Economics as continuation of previous
activities launched, in a fragmented manner from 2005 onwards. The previous initiatives to
support business incubators were isolated, short term focused and usually terminated without
extension (based on PHARE support, budget fund shortfall, etc.) (Lukjanska R., Zeps V., 2011).
Business incubators provide an excellent opportunity for new entrepreneurs by helping then
to realize their ideas in real life. Business development whilst situated in an incubator gains from
a mutual learning and exchange of views between several companies. Often Businesses are able
in a collaborative way to solve many common problems. Each company is focused on something
different; they may become partners or customers who use one another's services. Each person
who wishes to place his newly formed company in a business incubator has different life, work
experience, education and skills. Therefore, a synergy effect may emerge based on correlation
with the several parties involved.

128
Discussion of Findings
With a view to promote formation and development of micro, small and medium-sized
businesses, the Latvian Investment and Development Agency is implementing a European
Regional Development Fund co-financed project, “Business incubators in Latvia”. This project
seeks to facilitate emergence of viable and competitive businesses to the benefit of the
development of regions in Latvia, providing them with the necessary business environment and
consultancy services. An incubated merchant is a new merchant who receives services from the
business incubator operator and/or is located within the facilities of the business incubator
facilities. Services are available up to a maximum period of four years (LIAA, 2014). This project
directly addresses the challenges of the unbalanced development of the market, with a number
of companies and stimulating business activity in the regions.
This support program was created for the following reasons: the low relative number of
companies in Latvia, which was three times lower than the EU average expressed per 1000
population, and the fact that most companies are concentrated in Riga, which only adds to
unequal development between the regions of Latvia. Business incubators in the country seek to
reduce regional inequalities and promote business development in those regions of the country
where there is high unemployment and low economic activity (Pukite I., 2014).
Co-financing at 85% for all projects is by the European Regional Development Fund and with
a state budget contribution of 15%. The total available public financing is 28 754 248.70 euro.
The target group addressed by the European Regional Development Fund are new companies,
ones that have been registered in the Latvian commercial register no earlier than two years
previous, that correspond to small enterprise status; businesses may receive incubator services
for no longer than four consecutive years and corresponds to the business incubator operator
requirements (Cabinet of Ministers, 2008).
Activities within the business incubator include provision of at least the following services:
1. Rent management (equipped or non-equipped workplace for rent (electricity, gas, water,
janitor, security, waste management)).
2. Communication services (Internet, phone, address), secretarial services.
3. Business management (support) consulting, business plan evaluation and preparation of
advice (financial planning).
4. Attracting additional financing sources (bank loans, venture capital).
5. Additional support facilities (information and advice on other support tools, such as EEN
(Enterprise Europe Network), the NSP (National Support Program).
6. Sales and marketing consulting (market identification).
7. Legal services (drafting contracts with local suppliers or customers, and national suppliers
and customers; to promote export; employment contracts and the drafting contracts in foreign
languages), accountancy services.
8. Cooperation at local and international level (networking services).

129
9. Human Resource services (Cabinet of Ministry, 2008).
If a company enters a business incubator during the first year after it being registered in the
commercial register, the business incubator operator can, based on its remit, cover the
following, in the proportions stated: up to 85 % during the first year; up to 60 % during the
second year; to 40 % during the third year; up to 10 % during the fourth year. The Project
implementation period terminated 31December 2014 (Cabinet of Ministry, 2008).
This Program comprises the Ministry of Economic Affairs as the ultimate responsible
authority, the Latvian Investment and Development Agency, as a collaborative body acting in
direct contact with incubators and the donor community. Data to evaluate the performance of
business incubators was obtained from the Ministry of the Economy covering financial
performance incubators from beginning 2009 to 31 September 2014.
Based on data o on progress of performance of incubators and their importance for the
national economy, as well as implementation of EU Structural Funds, has led to the following
findings:
1. Nine business incubators operated in 22 Latvian cities and one creative business
incubator in Riga.
2. 603 entities received support from incubators, of those virtual incubation accounted for
265 cases.
3. Enterprises launched this way have provided 1364 vacation places.
4. Number of companies, which have exited from business incubators – 694.
5. New products created by these companies – 864.
6. Premises rented out to companies – 16502.
Good results have been achieved during the period from inception of incubators through to 31
September 2014. General information is shown in Table 1.
Table 1
Incubator performance results from year 2009 till 31 September 2013
Performance indicators Incubator amount
of performance
indicators
Total turnover of merchants from incubators inception EUR 139,54 mill.
Total amount of taxes paid by merchants EUR 14,19 mill.
Total export volume EUR 30,83 mill.
Incubator businesses provided services support amount EUR 12,14 mill.
Total merchant number of jobs created 1578
Source: author’s construction based on Ministry of Economics, 2014
Based on the data shown in Table 1 we may conclude that during the period of providing
incubator services the state budget received 14,19 million euro in taxes, while the merchants
provided services amounting to 12,14 millions euro. These data can be described as positive, as
the majority of services provided were paid by the Structural Funds. From this data, it can be

130
seen that in practice public money invested in businesses has paid off. The incubators were small
and medium-sized enterprises, and the number of job places created was 1578 (to 31
September 2013) (Figure 1), which can be seen as a good performance.
Source: author’s construction based on Ministry of Economics, 2014
Fig.1. Number of jobs created by Businessmen
Given the success of business incubators in general activity, as well as the fact that at the end
of 2014 from EU financing where left unused 4, EUR 13 million, the Ministry of the Economy
decided to extend funding until the end of 2015, dividing all amounts evenly to all regions and all
10 incubators.
One of the aims of Latvian economic recovery is to support export of goods or services by
local businesses, and, as can be seen from the performance indicators, incubators of existing
businesses has made a major contribution to exports, amounting to 30.83 million euro.
One important indicator is the number of new businesses, which means job creation. Business
incubators have resulted not only in the number of new enterprises, but also demonstrated the
role that industry played in the operation of new companies and development of their products
or services.
Businesses that have benefitted from incubators in Latvia provide advanced services, such as
textiles, organic products, graphic design, information technology products, fitness equipment
products, accessories, apparel, innovative mobile catering equipment design, energy,
construction design and construction, mechanical engineering, tourism industry, cosmetics
manufacturing, food production, bio fuel production, etc. (Pukite I., 2014).
The most popular business areas for incubators, according to data provided by Lursoft, are
computer programming, accounting, bookkeeping and auditing services, as well as advertising
agencies. Among all the incubators, work of the Riga Region business development incubator in
the Riga Region should be highlighted. Where new companies often came from two sectors -
fertilizers and nitrogen compounds, as well as production of wood products (Lursoft, 2014).
131150
201
237
74
140 138
166184
157
0
50
100
150
200
250
Nu
mb
er o
f jo
bs
crea
ted
Latvian Business incubators

131
The fact that the incubator services to new entrepreneurs can only be used for a maximum of
4 years has to be taken into account. After this period, they must move out of the incubator.
According to data provided by Lursoft, not all new companies who exited from incubators, have
been successful later. After leaving the incubator, an entrepreneur has to face higher costs for
rental of premises, accounting services, and further advisory services. Some companies have
been able to develop successfully and gain the necessary experience in order to survive under
highly competitive conditions/ Those who have not been able to accept the new rules of the
game choose to apply for insolvency or corporate liquidation.
According to calculations made by Lursoft, at the moment 3% of all incubated businesses
have been liquidated. Most liquidated businesses (8.5%) come from the Kurzemes Business
incubator. On the other hand, the Riga and Jelgava incubators have seen no liquidated
businesses. It should be noted that there no correlation was found between other liquidations in
various sectors of activity to conclude a retarding sectoral effect on incubated businesses.
Companies have gone insolvent in many sectors – setting-up internet portals, equipment
manufacturing, food service and public relations (Lursoft, 2014).
The author of this article conducted interview with a representative of the Ministry of
Economics, A. Jansons, who works with management of the business incubator program. This
interview sought to discover what problems have already been identified, and which may be an
impediment to future successful operation of the business incubator program. The most
important factors mentioned were:
1. Insufficient flow of quality business ideas, lack of technology-intensive ideas.
2. Failure to ensure that research and development results are effectively commercialized
and a need to promote work of the business and scientific sectors.
3. The authors of business ideas lack of business skills, insufficient knowledge and skill in
the field of fund-raising, bad development of business plans.
4. Insufficient access to quality incubation and mentoring services.
5. There is no support available for pre-incubation services.
The previous planning period had identified such failures as due to poor knowledge and
experience in business plan development. It would be necessary for the new programming
period 2014 - 2020 to provide financial support for support prior to the incubation period - that
is, pay more attention to direct business plans. As the current data shows new businesses, based
on a poor business plan fail to survive once they have exited from business incubators and are
no longer supported. This indicates that some of the young entrepreneurs have not made those
detailed economic calculations, which are an essential prerequisite for the star-up of any
successful business.
Greater attention should be paid to developing advice offered to new enterprises, marketing
and services. It is necessary to think about how to get more feedback concerning the financial
support provided. It is necessary to develop quality performance indicators - ones that could be

132
used to assess the effectiveness of new entrepreneurs that have taken advantage of support
from business incubators.
Business incubators would need to define each stage in the development of a company,
dividing both forms of action and expressing it in the form of cash. n During the new support
period, in order to increase the viability of new companies, it is important to support companies
prior to the incubation period, delivering professional expert advice by participating in a business
plan development.
Conclusions and recommendations
1. Support for new business start-up entrepreneurs is viewed as essential, and this is
especially true for entrepreneurs who are launching their own business for the first time and who
lack the necessary knowledge, contacts and experience.
2. The advantage of a business incubator is the so-called synergy effect. Companies are
located in a common building, managers and specialists meet all the time developing contacts
and sharing information and experience, which contributes to the development of ideas and new
products. Business incubators should not only be located in business centers but also in rural
areas, thus contributing to development of business not only in large urban areas but also in the
rural areas of Latvia.
3. Business incubators provide a good way to start up a new business. Overall, they
promote development of the social mission — stimulating creation of new businesses. Most
importantly, new companies in an incubator do not receive money but services that help them to
grow and make a profit.
4. The overall conclusion is that business incubators as a tool of regional development in
Latvia operate successfully, and the results achieved can be assessed as positive.
5. The research hypothesis has been confirmed - business incubator support gives an
entrepreneur development opportunities when starting a new business.
6. EU Structural Funds ought to contribute to financing of new entrepreneurs not only
during the start-up period (the incubation period), but also to support them in the pre-incubation
period. In addition, incubators need to work more closely with universities and local
governments.
7. The main business incubator effectiveness ratio is a relative number of how many
companies continue to successfully work after leaving the business incubator. It is recommended
that the Ministry for the Economy, as the responsible institution for providing development,
develop key performance indicators that reflects the ability of companies to operate successfully
after leaving an incubator.
8. Business incubators should actively assist in establishing a professional management
team. In many cases the authors of business ideas lack business skills and knowledge.

133
Bibliography
[1] Latvijas Nacionālais attīstības plāns 2014. - 2020. gadam. (2012). [Latvian National
Development Plan 2014-2020] Retrieved: http://www.varam.gov.lv/lat/pol/ppd/ilgtsp_att/
?doc=13858 Access: 05.12.2014.
[2] Noteikumi par darbības programmas “Uzņēmējdarbība un inovācijas” papildinājuma
2.3.2.1.aktivitāti “Biznesa inkubatori”: Ministru kabineta 2008.gada 30.oktobra noteikumi
Nr.835. (2008) [Regulation No. 835 (2008) for activity 2.3.2.1 “Business incubators” of the
program “Business and innovation” adopted 30 October 2008 by the Council of Ministers .
Retrieved: http://likumi.lv/doc.php?id=183034 Access: 12.12.2014.
[3] Rurāne, M. (2006). Finanšu menedžments, [Financial management] Rīga: RSEEBAA. 172
lpp. ISBN 9984-7051-2-9.
[4] Albert, P., Gaynor, L. (2001). Incubators: Growing Up, Moving Out, Cahiers de
Recherché, Arpent.
[5] Basu R., Biswas D. A study on Indian higher educational institute based business
incubators/ Journal of Enterprising Culture. Jun2013, Vol. 21 Issue 2, p199-225. 27p. ISSN:
0218-4958; DOI: 10.1142/S021849581350009X.
[6] Ebbers, Joris J. Networking Behavior and Contracting Relationships Among Entrepreneurs
in Business Incubators. / Entrepreneurship: Theory & Practice. Sep2014, Vol. 38 Issue 5, p1159-
1181. 23p. ISSN: 1042-2587, DOI: 10.1111/etap.12032
[7] Lukjanska R. Innovation capacity – problems and solutions for successful development/
Library Review. Feb 2011, Vol. 60 Issue 1, p68-79. 12p. ISSN: 0024-2535 , DOI:
10.1108/00242531111100586
[8] Lukjanska R, Zeps V., Regional innovation support infrastructure – case of Latvia/ Human
Resources: The Main Factor of Regional Development. 2011, Issue 5, p177-187. 11p. ISSN:
2029-5103
[9] Pukite, I. (2014). Business incubator importance and support through the European
Union's structural funds. „The Baltic States in the European Union: ten years as Member States”.
[10] Umpqua business center. (2012). What is a business incubator? Retrieved:
http://umpquabusiness.com/what-is-a-business-incubator/ Access: 12.12.2014.
[11] Laiviņa, S. (2012). Kur meklējami biznesa inkubatoru pirmsākumi? [The search for
precursors to business incubators] Retrieved: http://www.naudabiznesam.lv/blogs/kur-
meklejami-pirmsakumi/ Access: 14.12.2014.
[12] LIAA. (2014). Biznesa inkubatori. [Business incubators] Retrieved:
http://www.liaa.gov.lv/lv/biznesa-abc/biznesa-inkubatori. Access: 15.12.2014.
[13] Vanaga, A. (2011). Teorētiski par biznesa inkubāciju un inkubatoriem. [The theory of
business incubation and incubators] Retrieved: Retrieved: http://www.d-
fakti.lv/lv/news/article/31464 Access: 14.12.2014.
[14] Lursoft press release. (2014). Inkubatoru uzņēmumi: no individuālajiem komersantiem ar
vienu darbinieku līdz uzņēmumiem ar vairāku miljonu eiro apgrozījumu. [Incubated companies:
comprising single workers as well as with annual turnover of several million Euro] Retrieved:
http://www.lursoft.lv/press/2014/06/25/Inkubatoru-uznemumi-no- individualajiem-
komersantiem-ar-1-darbinieku-lidz-uznemumiem-ar-milj-apgrozijumu. Access: 15.12.2014.
134
FARMERS’ COOPERATIVE IN THE CONTEXT OF ECONOMIC
TRANSFORMATIONS IN LITHUANIA
Jadvyga Ciburiene, PhD/ professor
Kaunas University of Technology, Lithuania
Abstract. Lithuania farmers’ farms are amongst the most important producers of
agricultural products in Lithuania. During the analyzed period of 2005-2014 small farms are
dominating in the structure of agricultural products. Because of the rising standard of living
and increasing need of quantity and quality of agricultural products, including food, both at
global and regional level, attention should be given to the growth of the agricultural production
productivity.
The aim of the study: to analyze the role of farmers’ cooperatives in the context of
economic transformation in Lithuania. Objectives of the study: to characterize the economic
transformations in Lithuania; to discuss the changes of farmers’ cooperative importance in
country economy development, as a smart, sustainable and inclusive growth; to characterize
the farmers’ cooperative as one of ways for the modernization of agriculture sector. The
analysis shows that economic transformation in Lithuania is related to the restitution of the
private property rights in 1990, when the farmers’ farms began to settle. Planned economy
system and its structure collapsed. Collective farms in the agricultural sector were gradually
completely eliminated. The number of small farmers’ farms increased in the period of 2005-
2014 by 12.1% and their agricultural land increased by 29%. The level of education of young
farmers is very poor and can cause problems by implementing innovations, new organizational
forms of different activities and services. The investigation reveals that in Lithuania the level of
farmers’ farms cooperation is small and the market share is low, unlike in Europe and the
world's developed countries such as Japan, the United States of America (USA).
Key words: agriculture, farmers’ farms, economic development, sustainable development,
farmers’ cooperative.
JEL code: Q10, Q13, Q01.
Corresponding author. Tel.: + (370613 43624); fax: + (370 208757).
E-mail address: ([email protected]).
Proceedings of the 2015 International Conference “ECONOMIC SCIENCE FOR RURAL DEVELOPMENT” No39
Jelgava, LLU ESAF, 23-24 April 2015, pp.134-141

135
Introduction
In the conditions of European integration and globalization in Lithuania, as in all the 28
European Union Member States (EU-28), the role of agriculture is important but the share of
this sector decreases in the structure of economy of each country and in generally in all the
EU-28. The scientific research shows the significance of agriculture and its relevant role in the
export in objective to increase the competitiveness of the country and to help ensure
sustainable territorial development. Rural Lithuanian territories consist of 33.4% of total
population of the country, which is continuing to decrease. All of the Lithuanian population,
including the rural population, is ageing. Other, 25% of rural population, is above 60 years of
age. The employment rate in rural areas is smaller in comparison with urban areas and the
average disposable income of rural population is considerably lower – by 24.7% than urban
population (Rural Development Programme …, 2010). The small farmers (farm size 0-5 ha of
agricultural land) in the year 2015 accounted for 57.6% of the total number of farmers and
produced about 72.7% of the total agricultural production (Rural Holdings Register Information
System, 2015).
One way to increase employment and to improve productivity and enlarge disposable
income is to use different organizational forms in agriculture, including the farmers’
cooperatives. The farmers’ cooperatives in Lithuania in the year 2010 produced about 8.5% of
all of the agricultural production (Bijman, J. C. et al., 2012). The share of the agricultural
products market of the farmers’ cooperatives in the EU countries is considerably higher than in
Lithuania, for example, in Finland 74%, in the Netherlands – 68%, in Denmark – 66%, in
Sweden and Ireland – 59%, in Germany and Spain - 47% and so on. The average share of
agricultural product market of the farmers’ cooperatives of the EU-27 in the year 2010 was
40% (Bijman, J. C. at al., 2012).
Agricultural cooperatives are widely applied both in Japan and in the United States (US). For
example in year 2007 Japan created yields in farmers’ cooperatives which were about USD 90
bill. and united 91% of all the country farmers, at the same period in the US, 30 thous.
farmers’ cooperatives provided more than 2 mill. jobs (Co-operative Identity ..., 2015).
Not all rural residents are equally characterized by entrepreneurship, and have a capacity
for initiative, thus, the promotion of entrepreneurship can be encouraged focusing on the
development of cooperation in the Lithuanian countryside. This form of agriculture could
become an effective instrument for maintaining employment, generally by farmers; addressing
topical issues with cooperative forces of economic activity, such as: purchase of new
equipment, better organization of sales of manufactured products or services. The article
analyzes one of the ways to increase the effectiveness of agricultural activities – though
cooperative development processes in different activities of the agricultural sectors. Analysis of
scientific literature and statistical data of the European Union (EU) Member States and
economically developed countries in the world show that cooperation can be developed in any

136
of the food supply chain’s structural element: in the manufacture, supply or intermediation of
agricultural products; in the reprocessing of agricultural products and in their consumption.
The farmers’ cooperative enhances the operational performance of agriculture and facilitates a
balanced agricultural sector and the whole economy of the country as well as the economy in
the global level.
The object of this study: farmers’ cooperative in the economy.
The aim of the study: to analyze the role of farmers’ cooperatives in the context of
economic transformation in Lithuania.
Objectives of the study: to characterize the economic transformations in Lithuania; to
discuss the changes of farmers’ cooperative importance in the country economy development,
as a smart, sustainable and inclusive growth; to characterize the ways for the modernization of
agriculture using farmers’ cooperation. The methods of research: analysis of scientific
literature, statistical classification and comparison, logical comparative analysis and synthesis.
Research results and discussion
In the conditions of growing global and regional economy, the consumption of food has an
increasing tendency. According to the OECD data, food consumption will grow by 60% by the
year 2050. Consequently it is really important to increase agricultural productivity of farmers’
farms, as they are the most important producers of agricultural products in Lithuania. The
analysis of scientific literature (Von Braun, J., 2008) shows that the development of family
farms cooperatives is a significant instrument to increase its viability and further development.
The importance of the role of cooperatives is based on the principles of self-help, self-
responsibility, democracy, equality, equity, and solidarity. This form of labour organization is
used worldwide and it is set out that over one billion people are members of cooperatives.
Moreover, cooperatives of all economic sectors create over 100 mill. jobs around the world,
which creates 20% more new workplaces than the multinational enterprises (Agricultural
Cooperatives ..., 2012). The International Cooperative Alliance characterizes cooperative as
“autonomous association of persons united voluntary to meet their common economic, social,
and cultural needs and aspirations through a jointly-owned and democratically controlled
enterprise” (Co-operative Identity ..., 2015).
The satisfaction of farmers’ economic, social, and cultural needs requires developing their
abilities and initiatives. These factors – abilities and initiatives – are one of the main, which
affect the level of entrepreneurship of rural population (Vaznonis, V., Ciutaite, D., 2010). Other
authors characterize the entrepreneurship of farmers due to the food supply chain, ranging
from agricultural production to final products to consumers (Vavilov, O., 2008 recited from
Ramanauskiene J., Gargasas A., 2012). They substantiate that the level of entrepreneurial
professionalism of farmers is based on the four elements (related with the traditional food
supply chain elements) which are: sales, financial, industrial, and innovative activity. Some
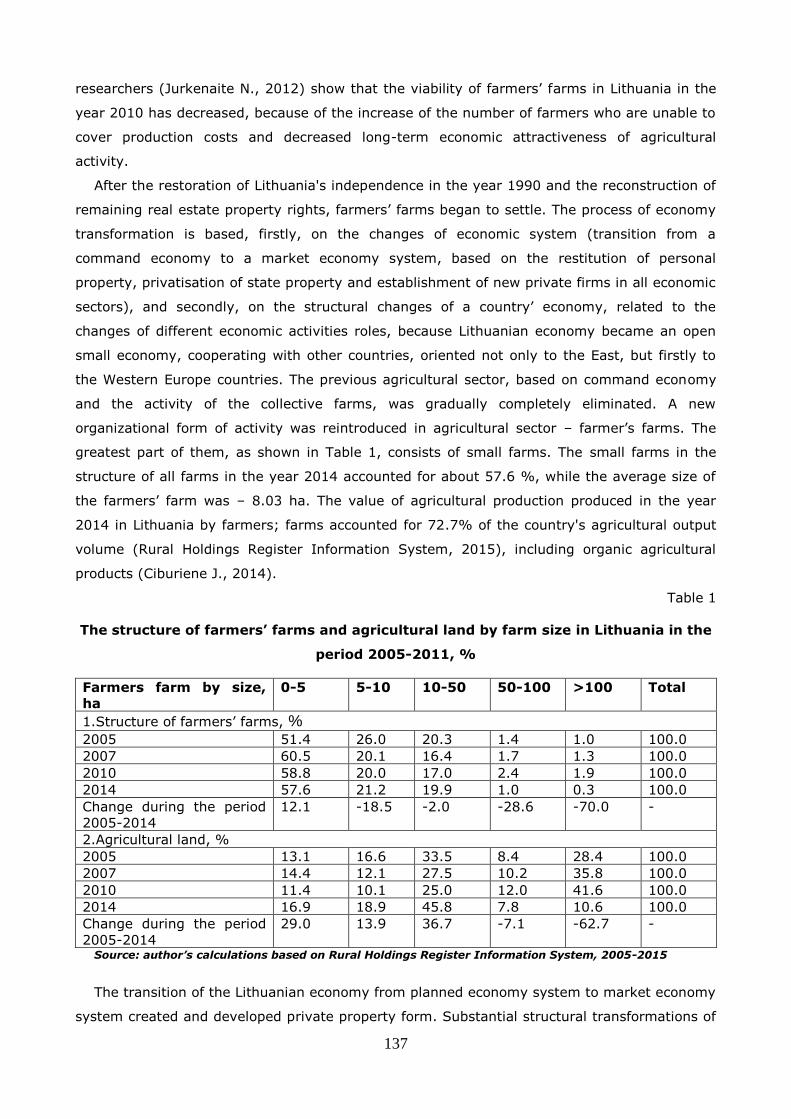
137
researchers (Jurkenaite N., 2012) show that the viability of farmers’ farms in Lithuania in the
year 2010 has decreased, because of the increase of the number of farmers who are unable to
cover production costs and decreased long-term economic attractiveness of agricultural
activity.
After the restoration of Lithuania's independence in the year 1990 and the reconstruction of
remaining real estate property rights, farmers’ farms began to settle. The process of economy
transformation is based, firstly, on the changes of economic system (transition from a
command economy to a market economy system, based on the restitution of personal
property, privatisation of state property and establishment of new private firms in all economic
sectors), and secondly, on the structural changes of a country’ economy, related to the
changes of different economic activities roles, because Lithuanian economy became an open
small economy, cooperating with other countries, oriented not only to the East, but firstly to
the Western Europe countries. The previous agricultural sector, based on command economy
and the activity of the collective farms, was gradually completely eliminated. A new
organizational form of activity was reintroduced in agricultural sector – farmer’s farms. The
greatest part of them, as shown in Table 1, consists of small farms. The small farms in the
structure of all farms in the year 2014 accounted for about 57.6 %, while the average size of
the farmers’ farm was – 8.03 ha. The value of agricultural production produced in the year
2014 in Lithuania by farmers; farms accounted for 72.7% of the country's agricultural output
volume (Rural Holdings Register Information System, 2015), including organic agricultural
products (Ciburiene J., 2014).
Table 1
The structure of farmers’ farms and agricultural land by farm size in Lithuania in the
period 2005-2011, %
Farmers farm by size,
ha
0-5 5-10 10-50 50-100 >100 Total
1.Structure of farmers’ farms, %
2005 51.4 26.0 20.3 1.4 1.0 100.0
2007 60.5 20.1 16.4 1.7 1.3 100.0
2010 58.8 20.0 17.0 2.4 1.9 100.0
2014 57.6 21.2 19.9 1.0 0.3 100.0
Change during the period
2005-2014
12.1 -18.5 -2.0 -28.6 -70.0 -
2.Agricultural land, %
2005 13.1 16.6 33.5 8.4 28.4 100.0
2007 14.4 12.1 27.5 10.2 35.8 100.0
2010 11.4 10.1 25.0 12.0 41.6 100.0
2014 16.9 18.9 45.8 7.8 10.6 100.0
Change during the period
2005-2014
29.0 13.9 36.7 -7.1 -62.7 -
Source: author’s calculations based on Rural Holdings Register Information System, 2005-2015
The transition of the Lithuanian economy from planned economy system to market economy
system created and developed private property form. Substantial structural transformations of

138
different industries shares occurred in Lithuanian economy over the period 1990-2014. The
transition process created the conditions for the emergence of farmers’ farms.
Farmers' education structure is classified according to three age groups, which are
presented in Table 2. The data show that the share of the undergraduates university degree
both of young farmers (under 40 years of age) and both of farmers over the age of 65, in the
year 2010 slightly increased compared to the year 2007, accordingly, by 11.8% and 5.5%.
However, the share of young farmers with minimum vocational education increased up to
49.1%, while the middle-age group of farmers rose to 19.5%. These changes indicate that
young farmers’ education level is very poor and can cause problems by implementing
innovations, new organizational forms of different activities and services. The share of young
farmers' in the total farm structure in the year 2014 accounted for 17%; the farmers of the
middle age group accounted for 47%, while the group over 60 years – 36% in the total farm
structure (Rural Holdings Register Information System, 2015).
Table 2
Lithuanian farmers’ structure by education level in the period 2007-2010, %
Education level Young farmers (< 40 years old)
Farmers 40-65 years old
Farmers >65 years old
2007 2010 chan-ge
2007 2010 chan-ge
2007 2010 chan-ge
University education 6.8 7.6 11.8 14.5 13.7 -5.5 11.7 12.6 7.7
College 2.1 1.7 -19.0 5.3 4.8 -9.4 4.7 5.0 6.4
Post- secondary tertiary 24.3 15.8 -35.0 42.4 39.8 -6.1 29.1 30.4 4.5
Vocational 31.6 25.8 -18.4 20.6 22.3 7.8 12.5 12.7 1.6
Minimum professional 35.2 49.1 39.5 17.1 19.5 13.4 42.0 39.3 -6.4
Total 100.0 100.0 - 100.0 100.0 - 100.0 100.0 - Source: author’s calculations based on Rural Holdings Register Information System, 2005-2015
Moreover, both in the short food supply chain and in the traditional food supply chain, the
farmers play a meaningful role. Many individual farmers often fail to reduce transaction costs
purchasing agricultural machinery, grain drying equipment or other, selling for wholesale or
retail trade agricultural products. It is necessary to develop farmers’ cooperation in order to
increase the competitiveness of the small farmers' farms, which are poorly prepared for the
farming and have weak bargaining power.
Scientific literature studies show that the main goals in foreign countries of the organization
and development of cooperatives are: satisfying of its member’s economic, social, cultural
needs; and obtainment profit from agricultural activity and securing sustainability. The practice
shows, than farmers’ cooperatives play fewer roles in the new EU countries, including
Lithuania, compared to the old EU Member States, as shown in Table 3 (Peters, R., 2013). The
market share of agricultural cooperatives in separate countries’ relevant agricultural sector
considerably differs. Statistical data shows, that the weakest agricultural cooperatives are in
Lithuania, because statistical data is submitted only for one sector – dairy, which covers 25%
of all sector market. The farmers’ cooperation level per all agricultural sectors in Lithuania is
only 8.5%.

139
Latvia and Estonia have achieved a higher level of farmers’ farms cooperation in the dairy
sector than Lithuania, and it accordingly consists of 33% and 35% of the market share. In
these countries, the cooperatives also operate in different agriculture sectors and take their
place in the shared market, for example, in Latvia sheep meat (6%), fruit and vegetables
(F&V, 12%) and cereals (38%); in Estonia – pig meat (1%), F&V (4%) and cereals (10%)
sectors. The level of farmers’ farm cooperation in the various sectors of agricultural production
is bigger in the older EU Member States, for example, in the dairy sector the largest market
share of cooperated farms is in Ireland (99%), Finland (97%), Denmark (96%), etc.
The total agricultural product value of Latvia and Estonia farmers’ cooperatives is, 28.5%
and 19% of their market shares respectively. The data show that the farms cooperation level
of the previous planned economies countries is significantly lower than in West European
countries.
Table 3 Market share of cooperatives per agricultural sectors and market share of
cooperatives per country in the EU-27 in 2010, %
Country Share of cooperatives per agricultural sectors Agricultural
cooperatives
market share dai-
ry
pig
meat
sheep
meat
wine oli-
ves
F&V* sugar cere-
als
per
country
compa-
rison, in
times
Estonia 35 1 4 10 19 2.2
Denmark 96 86 >50 66 7.8
Finland 97 81 40 49 74 8.7
France 55 94 38 35 62 74 55 6.5
Germany 65 20 33 40 50 47 5.5
Hungary 31 25 20 9 18 30 12 18 2.1
Ireland 99 59.5 7
Italy 42 52 5 50 20 27 38.5 4.5
Latvia 33 6 12 38 28.5 3.4
Lithuania 25 8.5 1
Netherlands 90 95 100 55 68 8
Slovakia 25 11 10 16 16 1.9
Spain 40 25 25 70 70 50 28 35 47 5.5
EU-27 57 27 4 42 37 42 27 34 40 4.7 *F&V – fruit and vegetables Source: author’s calculations based on Bijman, J. C. at all, 2012; Peters, R., 2012
In Latvia and Estonia the farmers’ cooperative created value is 3.4 and 2.2 times bigger
than in Lithuania. Finland achieved the highest overall level of cooperative farms (74%), the
Netherlands (68%), Denmark (66%). This means that the market share in these countries is
bigger, accordingly by 8.7; 8 and 7.8 times in comparison with Lithuania’s farmers’ farms
cooperative market share.
140
Conclusions
1. Over the period of 1990-2014 substantial structural transformations of different economic
activities occurred, including agriculture in Lithuanian economy. The transition process in the
agricultural sector from command economy to market economy created the conditions for the
emergence of farmers’ farms. Since this is a relatively new form of agriculture development,
mainly small farmers operate in Lithuania (farm size 0-5 ha of agricultural land) and in year
2014 they accounted about 57.6 % of the total number of all farmers.
2. The farmers’ farms in Lithuania have produced about 72.7% of the country's agricultural
output in the year 2014. The big problem is that the share of young farmers with minimum
vocational education increased up to 49.1%, while the middle-age group of farmers rose to
19.5%. These changes indicate that young farmers’ education level is very poor and can cause
problems by implementing innovations, new organizational forms of different activities and
services and at last to affect the competitiveness of this sector. The fall of the competitiveness
level of small farmers’ farms can reduce the already small market share of farmers’
cooperatives per agricultural sector and per country.
Young farmers’ higher level of education can promote the modernization of manufacture
processes, create more work places and increase cooperation in different agricultural sectors.
Such changes can cause smart, sustainable and inclusive growth in agriculture.
3. The investigation revealed that in Lithuania, unlike in the Western Europe countries, or
the old EU Member States, and in the other developed countries, for example, in Japan, in the
USA, the level of farmers’ farms cooperation is small. These countries are more developed
economically, and their agricultural sector has a higher productivity than the Lithuanian
agricultural sector. One of the main ways for the modernization of Lithuanian agriculture
sector, creating more possibilities for farmers to invest, avoiding the risks, and increasing the
yield of the agricultural products, is the enlargement of farmers’ cooperatives.
Bibliography
1. Agricultural Cooperatives: Key to Feeding the World. FAO, Italy: Rome , 2012. Retrieved:
http://www.un-ngls.org/spip.php?page=article_s&id_article=4135. Access: 05.01.2015.
2. Bijman, J. C., Iliopoulos, K.J., Poppe, C., Gijselinckx, K., Hagedorn, M., Hanisch, G.W.J.,
Hendrikse,R., Kühl, P., Ollila, P., Pyykkönen, P., van der Sangen, G. (2012). Apoyo a las
Cooperativas de Agricultores. Informe Final. Wageningen: Wageningen UR. Retrieved: http://
www.agro-alimentarias.coop/ficheros/doc/03962.pdf. Access: 15.12.2014.
3. Ciburiene, J. (2014). Organic Agriculture for Sustainable Rural Development: Lithuanian
Case. Rural Development, No. 36, pp. 51-574. Retrieved: http://llufb.llu.lv/conference
/economic_science_rural/2014/ESRD_36_2014_Integrated_Sustainable.pdf. Access:
15.12.2014.
4. Peters, R. (2013). EU Rural Review. A Publication from the European Network for Rural
Development, European Commission, No 17, pp.1-40. Retrieved: http://enrd.ec.europa.eu/
app_templates/enrd_assets/pdf/publications-and-media/eu-rural-review/PublicationENRD
periodical-17_en.pdf. Access: 15.12.2014.

141
5. Cooperative Identity, Values and Principles (2015). International Cooperative Alliance.
Retrieved: http://ica.coop/en/whats-co-op/co-operative-identity-values-principles. Access:
05.01.2015.
6. Jurkenaite, N. (2012). Comparative Analysis of Lithuanian Family Farms’ Economic Viability.
Agricultural Sciences, T.19, No. 4, pp. 288–298. Retrieved: http://www.lmaleidykla.
lt/ojs/index.php/zemesukiomokslai/issue/view/239. Access: 15.12.2014.
7. Ramanauskiene, J., Gargasas, A. (2012). Formation of an Entrepreneurship for Rural
Inhabitants as a Factor of Preparation for Business Activity. Management Theory and Studies
for Rural Business and Infrastructure Development, No. 3 (32), pp.118-129. Retrieved:
http://vadyba.asu.lt/32/ManagKaunas3%2832%29_20_1.pdf. Access: 15.12.2014.
8. Rural Development Programme Summary Information of Lithuania (2010). European
Network for Rural Development, pp. 1-10. Retrieved: http://enrd.ec.europa.eu/enrd-
static/fms/ pdf/D4B20011-D231-F786-F133-D12FD2C7AAC6.pdf. Access: 05.01.2015.
9. Rural holdings register Information system. (2005-2015). Retrieved:
http://www.vic.lt/?mid=213. Access: 05.01.2015.
10. Vaznonis V., Ciutaite, D., (2010). Economic Competitiveness of Rural Areas and Local
Residents Entrepreneurship Interfaces. Management Theory and Studies for Rural Business
and Infrastructure Development, No. 22 (3), pp.1-9. Retrieved:http://www.asu.lt/vadyb
/lt/33180. Access: 15.12.2014.
11. Von Braun, J. (2008). Food and financial crises: implications for agriculture and the poor.
Food policy report, Washington, D.C.
12. Vavilov, O. (2008). Predprinimatel kak Objekt Socialno-Ekonomitseskogo Issledovanija.
Avtoreferat Dissertacii na Soiskanie Ucionoj Stepeni Kandidata Socialnix Nauk. Moskovskij
Gosudarstvennij Universitet imeni M.V.Lomonosova.

142
MANAGEMENT OF PRIVATE FORESTS AND ALTERNATIVES FOR ITS
IMPROVEMENT IN LATVIA
Zinta Zalite*, MBA; Anda Zvaigzne2, Dr.oec.; Inese Saulaja3, Mg.oec. and Dzesija
Zeiferte4, Mg.oec.
1,2,3,4 Latvia University of Agriculture, Faculty of Economics and Social Development
2 Rezekne Higher Education Institution, Research Institute for Regional Studies, leading
researcher in economics
Abstract. Forest resources as the main source of employment and income in rural areas
and in the entire country have historically always been important in Latvia’s socio-economic
development. Previous studies have not contributed to finding a positive solution to the
problems of owners of private forests. The research aim is to examine the management of
private forests in Latvia, to identify the most important factors affecting the management of
forests and to define the key alternatives for improving the situation. According to experts, the
most important factors affecting the management of private forests by their owners are the
sufficiency of resources, the availability of consultancy services for forest owners, the use of
technologies, the availability of education and the quality of education. The experts rated the
following factors as insufficient: availability of the EU financial assistance, sufficiency of the EU
co-funding, availability of non-timber products, and performance and activities of
nongovernmental organisations (NGOs). The most effective alternatives for more productive
management of private forests are the multi-industrial and concentric diversification of
business activity of forest owners as well as cooperation. The present research employed the
monographic and descriptive methods as well as analysis and synthesis, the graphic method,
document analysis, data grouping and a sociological research method – a survey of experts.
The SPSS program, Kendall’s W (concordance) test and the analytic hierarchy process were
employed to process the survey data.
Key words: private forests, management, affecting factors, diversification, cooperation
JEL code: Q23
Introduction
Forests are a significant income source for many residents of Latvia and considerably
contribute to the national economy, as Latvia is ranked fourth, in terms of forest cover, in the
Corresponding author * Zinta Zalite , E-mail address: [email protected]
Proceedings of the 2015 International Conference “ECONOMIC SCIENCE FOR RURAL DEVELOPMENT” No39
Jelgava, LLU ESAF, 23-24 April 2015, pp. 142-152

143
European Union behind Finland (77%), Sweden (76%), and Slovenia (63%). On average, 41%
of the European Union Member States’ territory is covered by forests. Latvia’s forest cover was
only 27% in 1923; since then it has almost doubled, reaching 52% (Summary on the Forest
Management..., 2014a).
In recent years, several Latvia’s scientists and forestry professionals have researched the
forest economy (Zalitis P., 2001; Iesalnieks J., 2002; Klauss K., 2014; Dubrovskis D., et al.,
2007 and 2011; and others), while foreign scientists have researched this field since the
middle of the 19th century until present (Faustmans M. 1849; Markus, R. 1967;
Klemperer, W. D. 1996; Gilles, J. K. 2003; and others). Previous studies have not contributed
to finding a positive solution to the problems of owners of private forests; for this reason, it is
still urgent to identify the problems in the management of private forests and the affecting
factors in order to come up with proposals for improving the situation.
The research aim is to examine the management of private forests in Latvia, to identify the
most important factors affecting the management of forests and to define the key alternatives
for improving the situation.
To achieve the aim, the following research tasks were set:
to examine the trends in the management of private forests in Latvia;
to identify the most significant factors affecting the management of private forests by
their owners in Latvia;
to define the key alternatives for improving the situation in the management of private
forests in Latvia.
The present research employed the monographic and descriptive methods as well as analysis
and synthesis, the graphic method, document analysis, data grouping and a sociological
research method – a survey of experts. The SPSS program, Kendall’s W (concordance) test
and the analytic hierarchy process were employed to process the survey data.
Research results and discussion
1. Trends in the management of private forests in Latvia
The distribution of forest area by type of ownership changed every year in the period 2008-
2014, as the area of state-owned forests decreased by 17.7 thousand ha in 2014 compared
with 2008, while the area of forests of other ownership types increased by 285.9 thousand ha
(Summary on the Forest…, 2014b).
In 2014 in Latvia, almost half of forests were owned by the state, while the other half, more
than 1.7 million ha or 53.7% of their total area, were owned by private forest owners,
enterprises, municipalities, and other persons (Forest by Ownership…, 2014).
In Latvia, the largest forest owners, in terms of size of forest area, are the JSC Latvijas
Valsts mezi (JSC LVM) (1.51 million hectares), which manages the forests owned by Latvia’s
government, i.e. almost half of the total forest area in Latvia; the second largest group is
natural persons that own a 15 percentage point smaller forest area than the JSC LVM or

144
Latvia’s government. Legal persons own 13% and municipalities 2% of the total forest area.
The largest management companies of private forests are Bergvik Skog Ltd
(0.1 million hectares), Rigas mezi (0.067 million hectares), Skogssallskapet Ltd
(0.06 million hectares), Foran Real Estate Ltd (0.056 million hectares) and others. The
Reserve Land Fund holds 0.1% of the total forest area of Latvia. This is the forest area having
no owner after the land reform. The number of private forest owners is one of the largest in
Europe, accounting for about 7.5% of the total population. The average size of forest holdings
in Latvia is 8.4 ha. The most fragmented forest holdings are reported in Latgale region.
In Latvia, private forest holdings are fragmented, which decreases the efficiency of forestry.
Most private forest owners (90%) own less than 20 ha of forest, and such forest holdings
make up more than 40% of the total area of private forests. According to information available
in the State Forest Register, this category of forest holdings has the largest growing stock
being mature or overgrown. According to the 2010 survey of forest owners "Assessment of the
Potential Contribution of Private Forests to the Timber Industry in Latvia in 2011-2015", 15%
of the forest owners were not interested in managing their forest holdings; consequently,
these forest areas were not engaged in the industry’s business. Over the past 10 years, forest
holdings with a size of 5-20 ha had not performed any economic activity in a 20-30% area of
their forest property. The proportion of such area was less than 12% for the forest holdings of
greater size, while the proportion for the forest holdings sized more than 100 ha did not
exceed 1%. Even though the extent of management of young forest stands gradually
increases, yet, these activities in private forests are not performed at sufficient extent and
quality. A measure of the Rural Development Programme 2007-2013 has considerably
increased the extent of management of private young forest stands. Since 2005 it has risen
3.5 times. Nevertheless, part of the private forests is still managed inefficiently. An increase in
the efficiency of management of small and medium forest holdings may be achieved by
expanding cooperation among forest owners as well as by informing and educating them.
Cooperation among forest owners is one of the most effective solutions to the responsible and
productive management of private forests. The need for cooperation among forest owners is
indicated by the percentage distribution of forest owners in Latvia (Figure 1).

145
Source: authors’ construction (Based on Assessment of the Development of the Forest…, 2013)
Fig.1. Percentage distribution of private forest holdings by size in Latvia in the period
2003-2013
In Latvia, the year 2013 was the first year of establishment of forestry services cooperative
societies (FSCS) – six cooperatives were established and started their operation. Two FSCSs
were founded in 2012 and four in 2013. The year 2012 may be regarded as the year of revival
of cooperation among forest owners when the first FSCS, named "Mezsaimnieks", was founded
in Alsunga. Grigorijs Rozentals – the generator of the idea and the founder – mentioned the
fact that many private forests need responsible owners as one of the reasons for his initiative.
This was evidenced both by many instances of sales of forest holdings and by the lack of any
management activity in forests.
Forestry services cooperative societies in Latvia (in the period 2012-2013):
FSCS "Mezsaimnieks" (Alsunga, 2012);
FSCS "Vidzeme"(Madona, 2012);
FSCS "L.V. Mezs" (Incukalns, 2013);
FSCS "Vidzemes ekomezs" (Ligatne, 2013);
FSCS "Beverinas zeme" (Trikata, 2013);
FSCS "Tukuma mezipasnieki" (Tukums, 2013);
FSCS "Usins" (Ogre, 2014) (Development of Private Forestry…, 2014).
Joining forestry cooperatives, private forest owners enhance their competitiveness and
acquire additional knowledge on forest management and business. If the activity of forestry
cooperatives increases, the amount of logging in private forests could rise. In the period
2009-2013 in Latvia, the total amount of logging in Latvia was volatile, but it tended to
increase.
An analysis of the amounts of logging by type of ownership reveals that the logging in
state-owned forests decreased by 27.9%, while in other forests it increased by 102.7%, which
indicates that economic activity in private forests has increased (Harvest Volume…, 2014).
Further, the research identifies the most significant factors affecting the management of
private forests by their owners in Latvia.

146
2. Most important factors affecting the management of private forests by
owners in Latvia
The state JSC LVM implements national interests in maintaining, restoring, and managing
state-owned forests. It holds and finances scientific research on increasing the value of forest
capital. The JSC LVM performs its economic activity in accordance with a long-term
development plan, using its available funds. The JSC LVM has examined the factors affecting
the management of forests in Latvia; therefore, a study on the factors affecting the
management of private forests by their owners is needed as well (Annual Accounts…, 2010).
A survey of experts was carried out to identify the key affecting factors of private forest
management in Latvia.
In total, 37 factors, the importance of which was determined by five experts (Table 1), were
suggested by the authors.
Table 1
Characteristics of the experts
Experts Status Length of service
Association with the field to be expert evaluated
A Department manager at an institution associated with forestry
4 years Direct association with forest management
B Professional in logging and planning More than
10 years
Direct association with forest
management
C Professional regarding forest resources 9 years Direct association with forest management
D Doctor of silviculture More than 10 years
Direct association with forest management
E Private forest owner More than 10 years
Direct association with forest management
Source: authors’ construction
To identify the key factors affecting the situation in the management of private forests by
their owners, the factor ratings of the experts were evaluated according to the concordance of
expert opinions. In case of direct assessment of parameters, the degree of concordance of
expert opinions is evaluated by means of Kendall’s W or the coefficient of concordance W
according to Equation 1 (Kendall, 1955, Diakov and Krug, 1966):
)(
)1(2
112
32
1 1
2
nnm
nmr
W
n
i
m
j
ij
(1)
where:
W – coefficient of concordance;
n – number of factors to be rated;
m – number of experts;
rij – rank for the i-th object based on the j-th expert’s opinion.

147
The values of the concordance coefficients Wt and Wp vary within a range of 0≤W≤1,
besides, W=0 if there are no causal relationships between the ranks and W=1 if all the experts
have ranked the objects equally. A concordance coefficient of W≥0.5 is assumed to be
sufficient because experts’ unanimity is sufficiently high (Kendall, 1955;
Diakov and Krug, 1966).
After evaluating the criteria, the data were processed by the SPSS program. Factor ratings
were ranked and average ranks were computed to perform a Kendall’s W test; the most
important and most fully developed factor was identified based on the average ranks.
According to the experts, the factors with the highest ranks are as follows: sufficiency of
resources (average rank-30.40), availability of consultancy services for forest owners (average
rank-33.60), use of technologies (average rank-30.40), availability of education (average
rank-33.60), and quality of education (average rank-33.60).
The experts rated the significance of each factor on a scale from 1 to 3:
1- insignificant for the industry;
2- quite significant for the industry;
3- very significant for the industry.
The experts also rated each factor on a scale from 1 to 5:
1- insufficient/nonexistent/unprovided in the industry;
2- sufficient/existent/provided in the industry to a small extent;
3- partially sufficient/existent/provided in the industry;
4- almost fully sufficient/existent/provided in the industry;
5- fully sufficient/existent/provided in the industry.
The experts rated the following factors as insufficient: availability of the EU financial
assistance, sufficiency of the EU co-funding, availability of non-timber products, and NGO
performance and activities. The activities that depend on the performance of national or local
governments should be carried out to improve the management performance of private forest
owners, for instance, the availability of the EU financial assistance for forestry has to be
improved.
Using various support mechanisms, the national government has to stimulate the activity of
NGOs and the foundation of new private forest owner cooperatives, which would contribute to
the development of an economically sustainable forest industry.
The following hypotheses were set to identify the experts’ unanimity:
H0:W=0 experts’ opinions are unanimous
H1:W≠0 experts’ opinions are different
The Kendall’s concordance (unanimity) coefficient W=0.816; p=0.000> α=0.05.
The null hypothesis (H0) may not be rejected (=0.05). The experts’ unanimity is
statistically significant. In accordance with the Kendall’s W test: 0 means no agreement at all,
and 1 means full unanimity. A coefficient of 0.816 indicates that the experts’ unanimity is high.

148
3.Improvement of the situation in the management of private forests by their
owners
The analysis performed in the research leads to a conclusion that strategies for improving
the management of private forests have to be designed in Latvia. During the course of the
research, the experts defined several alternatives for improving the situation in the
management of forests. In order to understand how to tackle the problems of forest
management, the authors employed the analytic hierarchy process (Saaty, T. L., 1996).
A hierarchy consists of four levels:
Level 1 – the overall problem – how to improve the situation in the management of private
forests – is defined.
Level 2 – criteria groups. The criteria groups were identified according to the stakeholder
groups that could be interested in the defined criteria. The stakeholders were as follows: the
state, forest owners, the public and municipalities. At this level, the authors defined four
groups of interests: national interests, owner interests, public interests, and municipal
interests.
Level 3 – evaluation criteria. At this level, the authors defined evaluation criteria for each
stakeholder group.
Level 4 – scenarios. The research suggests four scenarios for improving the situation in the
management of private forests by their owners.
The hierarchy of evaluation criteria is presented in Figure 2.
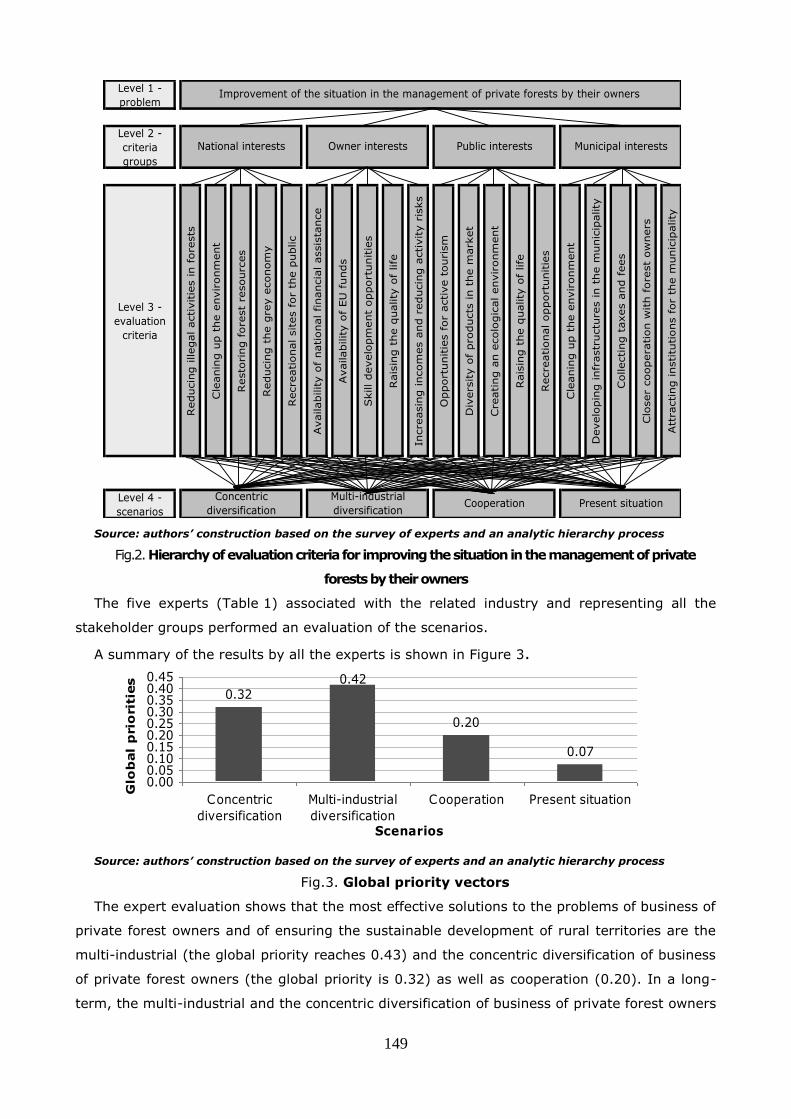
149
Level 1 -
problem
Level 2 -
criteria
groups
Level 3 -
evaluation
criteria
Reducin
g illegal activitie
s in f
ore
sts
Cle
anin
g u
p t
he e
nvironm
ent
Resto
ring f
ore
st
resourc
es
Reducin
g t
he g
rey e
conom
y
Recre
ational sites f
or
the p
ublic
Availability o
f national financia
l assis
tance
Availability o
f EU
funds
Skill develo
pm
ent
opport
unitie
s
Rais
ing t
he q
uality
of
life
Incre
asin
g incom
es a
nd r
educin
g a
ctivity r
isks
Opport
unitie
s f
or
active t
ourism
Div
ers
ity o
f pro
ducts
in t
he m
ark
et
Cre
ating a
n e
colo
gic
al environm
ent
Rais
ing t
he q
uality
of
life
Recre
ational opport
unitie
s
Cle
anin
g u
p t
he e
nvironm
ent
Develo
pin
g infr
astr
uctu
res in t
he m
unic
ipality
Collecting t
axes a
nd f
ees
Clo
ser
coopera
tion w
ith f
ore
st
ow
ners
Att
racting institu
tions f
or
the m
unic
ipality
Level 4 -
scenarios
Concentric
diversification
Multi-industrial
diversificationCooperation Present situation
Improvement of the situation in the management of private forests by their owners
National interests Owner interests Public interests Municipal interests
Source: authors’ construction based on the survey of experts and an analytic hierarchy process
Fig.2. Hierarchy of evaluation criteria for improving the situation in the management of private
forests by their owners
The five experts (Table 1) associated with the related industry and representing all the
stakeholder groups performed an evaluation of the scenarios.
A summary of the results by all the experts is shown in Figure 3.
0.320.42
0.20
0.07
0.000.050.100.150.200.250.300.350.400.45
Concentric
diversification
Multi-industrial
diversification
Cooperation Present situation
Scenarios
Glo
bal
prio
rit
ies
Source: authors’ construction based on the survey of experts and an analytic hierarchy process
Fig.3. Global priority vectors
The expert evaluation shows that the most effective solutions to the problems of business of
private forest owners and of ensuring the sustainable development of rural territories are the
multi-industrial (the global priority reaches 0.43) and the concentric diversification of business
of private forest owners (the global priority is 0.32) as well as cooperation (0.20). In a long-
term, the multi-industrial and the concentric diversification of business of private forest owners

150
have opportunities to expand more efficiently and to exploit the available forest resources at a
higher return. The diversification of business of private forest owners will provide various
opportunities to:
fully exploit forest resources in order to increase the total revenue of private forest
owners by expanding economic activity in another industry, for instance, tourism;
exploit the available forest resources more efficiently, at a higher return, in
producing other (non-wood) products, for example, linden blossom honey, wine from
birch-tree juice, facial creams from lichens and other products from resources to be
collected in forests;
reduce the risks of economic failure for private forest owners that are created by
intermittent and often unfavourable climatic conditions in Latvia (storms etc.) as well
as volatile prices and other external threats.
Cooperation among private forest owners will contribute to stabilising the timber market and
establish a stable and predictable timber flow from private forests, which, in its turn, will
provide regular and greater revenues for the forest owners. The cooperatives of private forest
owners will be able to hire professionals to work for them and the owners will participate both
in managing their cooperatives and in distributing their revenues.
Conclusions, proposals, recommendations
1. According to the expert evaluation, the factors affecting the management of private
forests by their owners with the highest average rank (the most developed ones) are as
follows: sufficiency of resources, availability of consultancy services for forest owners, use of
technologies, availability of education and quality of education. The Kendall’s W coefficient of
concordance is equal to 0.816.
2. The experts rated the following factors as insufficient: availability of the EU financial
assistance, sufficiency of the EU co-funding, availability of non-timber products and NGO
performance and activities. The production of innovative non-wood products is one of the fields
where private forest owners could expand their business by attracting investors and using the
EU funds.
3. The activities that depend on the performance of national and local governments have
to be carried out to improve the management performance of private forest owners, for
instance, the availability of the EU funds has to be facilitated.
4. Using various support mechanisms, the national government has to stimulate the
activity of NGOs and the foundation of new private forest owner cooperatives, which would
contribute to the development of an economically sustainable forest industry.
5. The most effective alternatives, according to the experts, for the productive
management of private forests by their owners and for ensuring the sustainable development
of rural territories are the multi-industrial and the concentric diversification of business of
private forest owners as well as cooperation.

151
Bibliography
1. Annual Accounts for the Year 2010. JSC “Latvijas valsts mezi”. Retrieved:
http://www.lvm.lv/lat/lvm/finansu_informacija/?doc=13785 Access: 12.11.2014.
2. Assessment of the Development of the Forest Industry in 1990-2013 (in Latvian).
Ministry of Agriculture of the Republic of Latvia. Retrieved:
https://www.zm.gov.lv/public/ck/files/ZM/mezhi/politikas_doki/1_Pielikums_MSNP%2020
20_061214.pdf (Annex to the Framework for Developing the Forest and Related
Industries) Access: 06.12.2014.
3. Development of Private Forestry. Proposals for the Rural Development Plan 2014-2020
(in Latvian). Retrieved: http://www.laukutikls.lv/sites/laukutikls.lv/files/
article_attachments/privatas_mezsaimniecibas_attistiba_zinojums_2014.pdf. Access:
10.12.2014.
4. Diakov, N., Krug, G. (1966). Use of Rank Correlation Methods in Processing Qualitative
Information (in Russian): Research papers of the Moscow Power Engineering Institute of
the Order of Lenin, Volume 69, Moscow, pp. 7-28.
5. Dubrovksis, D. (2007). Theoretical and Practical Foundation and Models of Value Balance
Method in Forest Management: doctoral dissertation for a scientific degree of doctor of
silviculture, subdivision of forest ecology and forestry. Jelgava: LLU, p. 138.
6. Dubrovskis, D., Dagis, S., Smits, I. (2012). Determination of the Value of Forest
Resources (in Latvian). Retrieved: http://www.mf.llu.lv/uploads/File/lapas/409/Latvijas
%20meza %20resursu %20vertibas %20noteiksana.pdf Access: 15.09.2014.
7. Forest by Ownership Form in Latvia in 2008-2014. Central Statistical Bureau of Latvia.
Retrieved: http://data.csb.gov.lv/pxweb/lv/lauks/lauks__ikgad__mezsaimn/MS150.px/
?rxid=cdcb978c-22b0-416a-aacc-aa650d3e2ce0 Access: 06.12.2014.
8. Gilless, K. J. (2003). Decision Methods for Forest Resource Management. Academic Press,
p. 111.-112.
9. Harvest Volume of Felling By Form of Ownership in Latvia in 2009-2013. Central
Statistical Bureau of Latvia. Retrieved: http://data.csb.gov.lv/pxweb/lv/lauks/lauks
__ikgad__mezsaimn/?tablelist=true&rxid=cdcb978c-22b0-416a-aacc-aa650d3e2ce0
Access: 10.12.2014.
10. Iesalnieks, J. (2002). Basics of forest Economics. Riga: Et cetera, p. 92.
11. Kendall, M. G. (1955). Rank Correlation Methods. New York: Hafner Publishing Co.
12. Klauss, K. (2014). Latvian Forest Development Strategy (in Latvian). Retrieved:
http://ilga.cs.llu.lv/uploads/File/MF%20Konference%202014/Kristaps_Klauss.pdf Access:
10.12.2014.
13. Klemperer, W. D. (1996). Forest Resource Economics and Finance. Economics of
Forestland Use and Even-age Rotations. New York: McGraw-Hill, Inc., p. 202.
14. Markus, R. O. (1967). Relative Forest Rent Theory. BLV Baierischer Landwirtshaftsvelrlag
Gmbh, München Basel Wien, p. 128.
15. Saaty, T. L. (1996). Decision Making with Dependence and Feedback: The Analytic
Network Process (Second ed.). Pittsburgh, USA: RWS Publications, p. 356.
16. Summary on the Forest Management Plan for North Kurzeme Forest Territory in 2015-
2019 (in Latvian). (2014a). JSC "Latvijas Valsts Mezi": LVM Mezsaimnieciba, p. 12.
17. Summary on the Forest Management Plan for North Kurzeme Forest Territory in 2015-
2019 (in Latvian). (2014b). JSC "Latvijas Valsts Mezi": LVM Mezsaimnieciba, p. 14.
18. The Faustmann Model. Introduction to Forestry, Forest Policy and Economics. Retrieved:
http://foper.unu.edu/course/?page_id=167 Access: 16.09.2014.

152
19. Zalitis, P. (2001). Economic, Ecological and Social Values of Forests as an Irreplaceable
Element of Biosphere in Latvia (in Latvian). Journal Mezzinatne, Volume 11, Salaspils.
pp. 125-151.

153
Proceedings of the 2015 International Conference “ECONOMIC SCIENCE FOR RURAL DEVELOPMENT” No39
Jelgava, LLU ESAF, 23-24 April 2015, pp. 153-163
PERFORMANCE EXPECTATIONS AND EVALUATIONS IN BUSINESS
START
Biruta Sloka1, Dr.oec. professor+
Inara Kantane2, Dr.admin. researcher, assistant professor
Elita Jermolajeva3, Dr.oec., associate professor
Valdis Avotins4, Dr.chem., associate professor
1 University of Latvia 2 University of Latvia; University College of Economics and Culture
3 Latvia University of Agriculture 4 Ventspils University College, VIRAC
Abstract. Successful entrepreneurship represents the basis for the growth of national
economy. In the scientific publications it is indicated that performance expectations influence
business decisions such as investment decisions, product innovation particularly in small
companies. The aim of this paper is to analyse performance expectations of entrepreneurs in
business start, evaluate relations between performance expectations and entrepreneur’s
motivation to start business, success factors and barriers. Tasks of the current research:
analysis of theoretical findings in scientific publications; evaluation of entrepreneur’s views on
business success and main influencing factors; analysis of entrepreneur’s evaluations on
performance expectations; application of multivariate statistical analysis for entrepreneur’s
evaluations on performance expectations. The results of empirical studies are compared with
the research results in the USA, Canada and Mexico. Methods used in the research: analysis of
scientific literature, survey of starting entrepreneurs (survey was conducted in October 2013 –
February, 2014). For most of the statements evaluations in scale 1 – 5 were used – to
compare with similar research results in other countries. The performance expectations criteria
and performance evaluations criteria are used the same as in research in the USA, Canada and
Mexico. For survey data analysis descriptive statistical analysis, cross tabulations, correlation
analysis as well as the method of multivariate statistical analysis – factor analysis was applied.
The main findings of the current research indicate that Latvian entrepreneurs rated their
business level of success lower than Canadian, USA and Mexican entrepreneurs, personal
satisfaction was the highest rated factor of analysed expectations of entrepreneurs in Latvia.
Key words: business start, performance expectations, performance evaluations,
entrepreneurs.
JEL code: M13; D21
+ + Corresponding author. Tel.: + (371 29244966); fax: +(371 - 670343835).
E-mail address: ([email protected]). Authors express thanks to Anete Brauča for significant contribution in survey realisation with starting entrepreneurs

154
Introduction
Successful entrepreneurship represents the basis for the growth of national economy. In the
scientific publications there are theoretical findings and empirical confirmation that
performance expectations influence business decisions such as investment decisions, product
innovation particularly in small companies.
The small company success and ability to respond to customers’ needs for radical product
innovation has a positive influence on performance expectations (Verhees, et al., 2010).
The aim of this paper is to analyse performance expectations of entrepreneurs in business
start stage, evaluate relations between performance expectations and entrepreneur’s
motivation to start business, business success factors and barriers. Tasks of the current
research: analysis of theoretical findings in scientific publications; evaluation of entrepreneurs
views on business success and main influencing factors; analysis of entrepreneur’s evaluations
on performance expectations; application of multivariate statistical analysis of entrepreneur’s
evaluations on performance expectations. The results of empirical studies are compared with
the research results in USA, Canada and Mexico.
Research methods applied: analysis of scientific literature, survey of starting entrepreneurs
(survey was conducted in October 2013 – February, 2014). In the questionnaire for most of
the questions’ it was used evaluation scale 1 – 5, this scale was used also in questionnaire in
USA, Canada and Mexico. The performance expectations variables, performance evaluations
variables, motivation variables, success factors and barriers were used the same as in research
in USA, Canada and Mexico.
Theoretical background All entrepreneurs starting their business expect that it will be successful and that
entrepreneur will benefit from the business, besides the personal motivation of entrepreneurs
also the whole society is interested in successful entrepreneurship as the successful and
efficient entrepreneurship represents the basis for the growth of the national economy. On
mentioned above issues several specialised international research journals with respected
international editorial boards are created which often are very popular by academic
researchers. It is indicated in the numerous scientific publications that performance
expectations influence business decisions such as investment decisions, product innovation
particularly in small companies, including success factors and support implications where big
role plays the founders personal background and experience as well as early problems
encountered in running a business (Watson, et al., 1998). On agenda of real business persons
as well as academic researchers often there are questions on start or not start business
(Townsend, et al., 2010), researchers are interested on issues on entrepreneur’s mode to
entry business as well as better choice: business take-over or new ventures start (Parker and
van Praag, 2012) as well as on entrepreneur forecast performance in new firms (Cassar,
155
2014). Academic discussions are performed towards definition of business performance
measurement system (Franco-Santos, et al., 2007). Question on creativeness in business start
is a question often appearing on minds of business starters as well as academic researchers
(Scott, 1999). Intellectual capital in many cases is an important aspect of business success
extent to which IC assets are associated with new firm survival and growth. Results of
researcher from Spain Inaki Pena suggest that the human capital of the entrepreneur
(education, business experience and level of motivation), organizational capital (firm capacity
to adapt quickly to changes and the ability to implement successful strategies), and relational
capital (development of productive business networks and an immediate access to critical
stakeholders) are important intangible assets, which seem to be related positively to new
venture performance (Pena, 2002). Detailed analysis is performed in a country/national
prospective, gender prospective, like why farm-based entrepreneurs start additional business
activities (Alos, et al., 2003). Issues on business start-up and “pre‐start” activity in the new
venture creation dynamic - the pre‐start framework identify how individuals progress towards
start‐up, and could be used as the basis to encourage individuals to move through each step
towards engagement in business start‐up. The research results on movement from step to step
can also be used to assess overall levels of preparation for entrepreneurship within the wider
population, and so has the potential to become as useful indicator of overall levels of
entrepreneurial orientation (Atherton, 2007). More theoretical approaches to start-up issues
are covered also in many other research, including decision theoretical approach (Czhwolka &
Raith, 2012), relationship between quality management practices and performance in small
businesses (Anderson, et al., 1999). More and more entrepreneurs are concerned on business
activities influence on environment and apply “green approaches”- researchers Jodyanne
Kirkwood and Sara Walton in their detailed research have found that so called ecopreneurs are
those entrepreneurs who start for‐profit businesses with strong green values and who sell
green products or services (Kirkwood and Walton, 2010). They have stated that it is an
emerging field where research is still in its infancy and more research is on a way. Research
has been called for to understand the factors that motivate these ecopreneurs to start
businesses – and that focus of the study – the mentioned above researchers compared the
findings on entrepreneurial motivations with results of results published in scientific literature
(Kirkwood and Walton, 2010). Researchers have applied different advanced research methods
(Gruber, et al., 2010). Gender issues of entrepreneurs and relation to business performance in
enterprise start-up indicate that some aspects are stronger for female entrepreneurs (Anna, et
al., 2000) but on those issues more detailed and deeper research would be useful and could be
on research agenda in the future for many researchers.

156
Research results and discussion
The survey of starting entrepreneurs was conducted by interviewing entrepreneurs in their
business start phase from October 2013 to February 2014. In the empirical research were used
survey realised in web, by telephone and paper version of the questionnaire. For most of the
statements evaluations were in five-point Likert scale. The same evaluation scales were used
in Canada, USA and Mexico.
For survey data processing was used descriptive statistical analysis, cross tabulations,
correlation analysis as well as factor analysis. Business success was measured using the five-
point evaluation scale. The evaluation 1 would rate as unsuccessful, 2 as below average, 3 as
average, 4 as very successful, 5 as extremely successful.
Most of small entrepreneurs evaluated their business successes as average successful or
very successful, approximately 50% of entrepreneurs evaluated business success as average
successful, approximately 34% as very successful but 5% as extremely successful. Only
approximately 1.6% of entrepreneurs evaluated their business as unsuccessful and 9% – as
below average successful (see Figure 1).
Source: author construction based on entrepreneurs survey conducted in October 2013 - February 2014 (n=209), evaluation scale 1 – 5, where 1 – unsuccessful; 5 – extremely successful
Fig. 1. Entrepreneur evaluations of business success
The majority of entrepreneurs evaluated business success as rather successful (mode 3),
half of entrepreneurs evaluated business success as average successful or below average
successful (median 3), and arithmetic mean evaluations of entrepreneurs was 3.3. The
evaluations were quite homogenous (standard deviation 0.8, coefficient of variation 24%). The
main statistical indicators are reflected in Table 1.

157
Table 1
Main statistical indicators on entrepreneur evaluations of business successes
No. Statistical indicators Values of statistical indicators
1. Mean 3.3
2. Median 3
3. Mode 3
4. Standard Deviation 0.8
5. Minimum 1
6. Maximum 5
Source: author calculations based on entrepreneurs survey conducted in October 2013 - February 2014 (n=209), evaluation scale 1 – 5, where 1 – unsuccessful; 5 – extremely successful
Latvian entrepreneurs rated their success lower than Mexican, Canadian, USA (means,
standard deviations – Mexico 3.4, 0.8; Canada 3.8, 0.8; USA 3.7, 0.7).
The satisfaction with business successes entrepreneur’s evaluated higher than business
successes. About 58% of entrepreneurs were very satisfied or extremely satisfied with
business success, 28% – somewhat dissatisfied but approximately 14% dissatisfied or very
dissatisfied (see Figure 2). The evaluation scale used for assessment of satisfaction with
business success was: 1 as very dissatisfied, 2 as dissatisfied, 3 as somewhat dissatisfied, 4 as
very satisfied, 5 as extremely satisfied.
Source: author construction based on entrepreneurs survey conducted in October 2013 - February 2014
(n=209), evaluation scale 1 – 5, where 1 – very dissatisfied; 5 – extremely satisfied
Fig. 2. Entrepreneur evaluations of satisfying with business success
The biggest share of entrepreneurs evaluated satisfaction with business success on a very
high level (mode 4), half of entrepreneurs as very satisfied or extremely satisfied (median 4),
arithmetic mean evaluations of entrepreneurs was 3.5. The evaluations were homogeneous
(characterised by standard deviation 0.9, coefficient of variation 26%). The main statistical
indicators of entrepreneur’s evaluations with business success are reflected in Table 2.

158
Table 2
Main statistical indicators on entrepreneur evaluations of satisfaction with business
success
No. Statistical indicators Values of statistical indicators
1. Mean 3.5
2. Median 4
3. Mode 4
4. Standard Deviation 0.9
5. Minimum 1
6. Maximum 5
Source: author calculations based on entrepreneurs survey conducted in October 2013 - February 2014 (n=209), evaluation scale 1 – 5, where 1 – very dissatisfied; 5 – extremely satisfied
Latvian respondents rated their satisfaction with business success lower than Mexican,
Canadian and USA respondents (means, standard deviations – Mexico 3.6, 0.9; Canada 3.9,
0.9; USA 3.7, 0.9)
The performance expectations were measured by six variables. The evaluation 1 would rate
as unimportant, 2 as not very important, 3 as almost important, 4 as very important and 5 as
extremely important. The personal satisfaction was the highest rated aspect of starting
entrepreneur - most of starting entrepreneurs evaluated personal satisfaction as very
important (mode 4), half of entrepreneurs as very important or extremely important (median
4), arithmetic mean of the entrepreneur evaluations 4.4 and no one of starting entrepreneurs
has given the lowest evaluation. The evaluations were quite homogeneous (standard deviation
0.7, coefficient of variation 15.9%). The second higher evaluated aspect of performance
expectation was financial returns - profits and sales (median – 4.3, mode – 4, arithmetic mean
– 4.3) and no one of starting entrepreneurs has given the lowest evaluation, the evaluations
were quite homogeneous (standard deviation 0.7, coefficient of variation 16.3%). Main
statistical indicators of entrepreneur evaluations of performance expectation variables are in
Table 3.

159
Table 3
Entrepreneur evaluations of performance expectations, main statistical indicators
No Performance
expectation variables Mean Median Mode
Standard
Deviation Minimum Maximum
1. Financial returns -
profits and sales 4.3 4 5 0.7 2 5
2. Money drawn from the
business 3.9 4 4 0.9 1 5
3. Achieving work-family
balance 4.1 4 4 0.9 1 5
4. Reaching personal or
organisation goals 4.2 4 4 0.7 2 5
5. Being recognized by
clients 3.9 4 4 0.9 1 5
6. Personal satisfaction 4.4 4 5 0.7 2 5
Source: author calculations based on entrepreneurs survey conducted in October 2013 - February 2014 (n=209), evaluation scale 1 – 5, where 1 – unimportant; 5 – extremely important
The data of the Table 3 indicate that starting entrepreneurs made their evaluations which
cover almost all evaluation scale as a result average evaluations were high with rather small
variability indicators. Surprisingly – the difference was bigger in Latvia on “personal
satisfaction” which indicated the highest importance of this aspect for starting entrepreneurs
(with arithmetic mean 4.4, mode 5 and median 4 and with standard deviation 0.7). For
starting entrepreneurs aspects of “money drawn from the business” and “being recognised by
the clients” in Latvia had the lowest average evaluations (arithmetic mean 3.9, mode 4,
median 4). The starting entrepreneurs had rather similar views as the indicators of variability
were relatively low (for both statements standard deviation 0.9). The performance
expectations’ evaluation of respondents of Latvia, Canadian, USA and Mexico were similar.
Canadian and USA respondents have evaluated higher the performance expectations –
financial returns – profits and sales but Mexican respondents – reaching personal or
organisation goals. Personal satisfaction was the second highest rated factor of respondents in
Canadian, USA and Mexico.
For identifying the key performance expectations factors and determining the mutual
statistical relations of the factors was used multivariate statistical analysis - factor analysis.
The six initial factors (personal satisfaction, reaching personal or organisation goals, being
recognised by clients, money from the business, financial returns – profits and sales, achieving
work – family balance) are chosen for the factor analysis. As a result of the factor analysis the
initial six factors through three iterations (by using the Varimax rotation with Kaizer
normalization converted in 3 iterations) are grouped in two complex factors. The results of
factor analysis are included in Table 4.

160
Table 4
Entrepreneurs Performance expectations factor analysis
(complex factor matrix after rotation)
No. Performance expectation variables Factors
F1 F2
1. Personal satisfaction 0.779 -0.044
2. Reaching personal or organisation goals 0.723 0.184
3. Being recognized by clients 0.649 0.171
4. Money drawn from the business -0.134 0.822
5. Financial returns - profits and sales 0.195 0.675
6. Achieving work-family balance 0.297 0.557
Extraction Method: Principal Component Analysis Rotation Method: Varimax with Kaiser Normalization Rotation converged in 3 iterations Source: author calculations based on entrepreneurs survey conducted in October 2013 - February 2014 (n=209), evaluation scale 1 – 5, where 1 – unimportant; 5 – extremely important
The interpretation of the identified complex factors with regard to the indicators with which
the initial indicators have relatively high burdens (respective coefficients of correlation between
the complex factors and initial factors):
1) Complex factor F1 – personal and organisation goals. The factor has relatively high
burdens on the following indicators: personal satisfaction, reaching personal or organisation
goals, being recognized by clients;
2) Complex factor F2 – financial returns and achieving work-family balance. The factor has
relatively high burdens on the following indicators: money drawn from the business, financial
returns - profits and sales, achieving work-family balance.
The correlation analysis has shown – there were relationships between performance
expectations considered as important by entrepreneurs and several motivation variables to
engage in business. The positive significant correlations are between performance expectation
variable “Personal satisfaction” and motivation variables “For my own satisfaction” (Spearman
correlation coefficient r = 0.419; p = 0.00) and “Have fun” (r = 0.421; p = 0.00);
performance expectation variable “Reaching personal or organisation goals” and motivation
variable “For my own satisfaction” (r = 0.345; p = 0.00); performance expectation variable
“Being recognized by clients” and motivation variable “Gain public recognition” (r = 0.444; p =
0.00); performance expectation variable “Financial returns - profits and sales” and motivation
variable “Increase sales and profits” (r = 0.394; p = 0.00); performance expectation variable
“Achieving work-family balance” and motivation variables “Be closer to my family” (r = 0.498;
p = 0.00) and “Provide jobs for family” (r = 0.311; p = 0.00) The relations between the
entrepreneurs performance expectations and their motives also were found in Canadian, USA
and Mexico.
161
For assessment factors influencing business success and barriers, the evaluation 1 would
rate as unimportant, 2 as not very important, 3 as medium important, 4 as very important and
5 as extremely important.
As the main factors, influencing business success, entrepreneurs mentioned: good client
service, honesty reputation, charisma and friendliness with clients, good management abilities.
Factor “good client service” as extremely important were evaluated by half of respondents
(median 5), most of respondents gave evaluation extremely important (mode 5), arithmetic
mean – 4.6, the evaluations were quite homogeneous (standard deviation 0.7, coefficient of
variation 14%) which indicates that views of entrepreneurs do not differ on great extent. The
evaluations of factors honesty reputation, charisma and friendliness with clients; good
management abilities were similar.
As the main barriers entrepreneurs mentioned: unreliable employees (median – 4, mode –
5, arithmetic mean – 4, standard deviation 1.2), complex and confusing tax system (median –
4, mode – 5, arithmetic mean – 3.8, standard deviation 1.2), weak economy (median – 4,
mode – 4, arithmetic mean – 3.7, standard deviation 1.1), availability of long-term financial
capital (median – 4, mode – 4, arithmetic mean – 3.7, standard deviation 1), too much state
interference/bureaucracy (median – 4, mode – 5, arithmetic mean – 3.7, std. deviation 1.2),
availability of short-term capital (median – 4, mode – 4, arithmetic mean – 3.6, standard
deviation 1). The analysis of empirical results indicate that in Latvia entrepreneurs starting
their business have alike expectations of business development as it is mentioned and stressed
in scientific publications and in general do not differ in comparison with the situation in other
countries.
Conclusions, proposals, recommendations
1. The expectations of entrepreneurs for business start are very similar world-wide what is
recognised in scientific publications as well as empirical research in different countries,
including in Latvia and do not differ in comparison with the situation in many other
countries.
2. Highest evaluations of business performance expectations starting entrepreneurs from
Latvia gave for personal satisfaction; then followed by financial returns – profits and
sales. Nobody from starting entrepreneurs gave the lowest evaluation for both higher
evaluated aspects of business performance expectations, the evaluations are quite
homogenous as the indicators of variability are relatively small.
3. Starting entrepreneurs from Latvia gave lowest evaluations of business performance
expectations to “money drawn from the business” and “being recognized by clients”
which are lower than in other countries.
4. The business start performance expectations by entrepreneurs measured by six
variables were personal satisfaction, financial returns - profits and sales, reaching
personal or organisation goals, achieving work-family balance, money drawn from the
162
business, being recognized by clients.
5. Starting entrepreneurs in Latvia gave their evaluations of business success covering
almost all evaluation scale. Average evaluations were high with rather small indicators
of variability.
6. Multivariate statistical analysis - factor analysis has indicated that the identified
complex factors have relatively high burdens with the initial indicators: Complex factor
F1 – personal and organisation goals has relatively high burdens on the following
indicators: personal satisfaction, reaching personal or organisation goals, being
recognized by clients; Complex factor F2 – financial returns and achieving work-family
balance has relatively high burdens on the following indicators: money drawn from the
business, financial returns - profits and sales, achieving work-family balance.
7. Correlation analysis of different motivating factors of starting business persons has
shown – there were statistically significant relationships with high probability between
performance expectations considered as important by entrepreneurs and several
motivation variables to engage in business.
Bibliography
1. Anderson, M, Sohal, A.S (1999). A Study of the Relationship between Quality
Management Practices and performance in Small Businesses, International Journal of
Quality and Reliability Management, Volume 16, Issue 9, pp. 859-877.
2. Anna, A.L., Chandler, G.N., Jansen, E., Mero, N.P. (2000). Women Business Owners in
Traditional and Non – traditional Industries, Journal of Business Venturing, Volume 15,
Issue 3, pp. 279-303.
3. Alsos, G.A., Ljunggren, E., Petterssen, L.T. (2003). Farm‐based Entrepreneurs: what
Triggers the Start‐up of New Business Activities, Journal of Small Business and Enterprise
Development, Volume 10, Issue 4, pp. 434-443.
3. Atherton, A. (2007). Preparing for Business Start‐up: “Pre‐start” Activities in the New
Venture Creation Dynamic, Journal of Small Business and Enterprise Development, Volume
14, Issue 3, pp. 404-417.
5. Cassar, G. (2014). Industry and Startup Experience on Entrepreneur Forecast
Performance in New Firms, Journal of Business Venturing, Volume 29, Issue 1, pp. 137-151.
6. Chwolka, A., Raith, M.G. (2012). The Value of Business Planning Before Start – up – a
Decision – Theoretical Perspective, Journal of Business Venturing, Volume 27, Issue 3, pp.
385 – 399.
7. Franco-Santos, M., Kennerley, M., Micheli, P., Martinez, V., Mason, S., Marr, B., Gray, D.,
Neely, A. (2007). Towards a Definition of a Business Performance Measurement System,
International Journal of Operations & Production Management, Volume 27, Issue 8, pp. 784-
801.
8. Gruber, T., Henneberg, S.C., Ashmai, B., Naude, P. (2010). Complaint Resolution
Management Expectations in an asymmetric Business-to-Business Context, Journal of
Business and Industrial Marketing, Volume 25, Issue 5, pp. 360–371.
9. Kirkwood, J., Walton, S. (2010). What Motivates Ecopreneurs to Start Business?
International Journal of Entrepreneurial Behaviour & Research, Volume 16, Issue 3, pp. 204-
228.

163
10. Parker, S.C., van Praag, C.M. (2012). The Entrepreneur’s Mode of Entry: Business
Takeover or New Venture Start? Journal of Business Venturing, Volume 27, Issue 1, pp. 31-
46.
11. Pena I. (2002). Intellectual Capital and Business Start‐up Success, Journal of Intellectual
Capital, Volume 3, Issue 2, pp. 180-198.
12. Scott, D. (1999). Do you Need to be Creative to Start a Successful Business,
Management Research News, Volume 3, Issue 2, pp. 180-198.
13. Townsend D.M., Businuitz, L.W., Arthurs, J.D. (2010). To Start or not to Start: Outcome
and Ability Expectations in the Decision to Start a New Venture, Journal of Business
Venturing, Volume 25, Issue 2, pp. 192-202.
14. Verhees, F.J.H.M., Meulenberg, M.T.G., Pennings, J.M.E. (2010). Performance
Expectations of Small Firms Considering Radical Product Innovation, Journal of Business
Research, Volume 63, pp. 772-777.
15. Watson, K., Hogarth-Scott, S., Wilson, N. (1998). Small Business Start‐ups: Success
Factors and Support Implications, International Journal of Entrepreneurial Behaviour &
Research, Volume 4, Issue 3, pp. 217-238.

164
ANALYSIS OF ECONOMIC ASPECTS OF LEADER PROJECTS IN LATVIA
Agnese Krievina1, Dr.oec. ; Ieva Leimane1, Mg.oec.; and Ligita Melece 1, Dr.oec.
1 Latvian State Institute of Agrarian Economics
Abstract. Facilitation of economic activity is often not the main objective of the LEADER
approach, at the same time, business development is a very important prerequisite for the
viability of Latvian rural area as it faces general depopulation trend. Therefore, the objective of
this paper is to assess the role of the LEADER approach implementation to employment and
income generation in Latvian rural area. The paper examines the role and thematic scope of
the LEADER approach implementation, analyses the results of LEADER projects related to rural
economy, and evaluates economic impact of LEADER projects in terms of maintained and
created jobs as well as investment-generated and employment-generated income. The authors
use complex methodological approach and apply both quantitative and qualitative methods.
The analysis of the economic aspects shows that LEADER projects have impact on the
development of economic activity, and to enhance the impact, implementation of business
related projects could be stimulated, as they contribute to job maintenance and creation the
most. Also, the acquisition of goods and services of local origin in LEADER projects could be
stimulated as they generate income in the local economy through demand.
Key words: LEADER, local action groups, employment, income generation.
JEL code: O150, O180
Introduction
LEADER has been used as a tool and an innovative approach to solve the European Union
rural development problems by initiating the development and its implementation at local rural
community level since 1991. LEADER is aimed at improving the quality of life in the rural area,
considering economic and social improvements as well as environment preservation. The
LEADER approach covers all aspects of welfare, and unlike other public funding activities it
seeks solutions close to the local area. Consequently, it is expected that these solutions will be
innovative, original and suited to a particular situation.
Most of Latvian rural area faces depopulation problem. According to the CSB of Latvia, since
2007 only in few municipalities (13 out of 110) of Pieriga region the population has been
Corresponding author. Tel.: + 371 67167913; fax: + 371 67541789.
E-mail address: [email protected].
Proceedings of the 2015 International Conference “ECONOMIC SCIENCE FOR RURAL DEVELOPMENT” No39
Jelgava, LLU ESAF, 23-24 April 2015, pp. 164-175

165
increasing; in other municipalities population has decreased – even by 19% over seven years.
Job availability and the possibility to earn an income close to the place of residence is one of
the most important prerequisites for the territory viability (LSIAE et al., 2012; Krievina et al.,
2012). Therefore, it is a challenge to develop the rural area as an attractive living and working
space, by using all local resources and potential for the growth, including the LEADER
approach.
The objective of this paper is to assess the role of the implementation of the LEADER
approach to employment and income generation in Latvian rural area. To achieve the
objective, the following tasks have been set: 1) to analyse the role of the LEADER approach
and the thematic scope of implemented LEADER projects; 2) to assess the results of the
implemented LEADER projects related to rural economy, including social entrepreneurship; and
3) to evaluate the impact of the LEADER approach on the maintenance and creation of jobs as
well as income generation, both from investments and employment.
The study analyses LEADER projects implemented within the Latvian Rural Development
Programme 2007-2013 (hereinafter - RDP 2007-2013) under Measure 4.1.1. "Improving
Competitiveness of Local Development Strategies in the Territory" (data on 387 projects from
the Rural Support Service (hereinafter - RSS) database obtained on July 22, 2014), and
Measure 4.1.3. "Diversification of Rural Economy and Quality of Life for the Promotion of Local
Development Strategies in the Territory" (data on 3216 projects from the RSS database
obtained on January 30, 2014). Overall, the study covers 3603 projects, the implementation of
which attracted EUR 30.5 million of public funding.
Previous studies of the LEADER approach, its results and impact in different EU Member
States are generally based on qualitative analysis, using data obtained from questionnaires or
interviews (Schiller, 2009; Exodea Consulting, 2013, the ENRD, 2013). These studies provide
insight into the quality aspects of the LEADER approach and share the opinion that it is often
rather difficult to evaluate the LEADER results because of implementation of the so-called soft
projects with immaterial results (ENRD, 2013).
The economic results of the LEADER approach have not been analyzed in Latvia. Therefore,
this study is innovative; by using complex methodological approach, considering limitations of
the available data as well as on the basis of assumptions that allow this information to
generalize, the authors provide the evaluation of the economic aspects of the LEADER projects,
focusing on the employment development and income generation opportunities in Latvian rural
area.
A broad study of the economic effectiveness of the LEADER approach, using both qualitative
and quantitative methods, has been carried out in the UK in 2011 (Ekosgen, 2011). The
authors of this paper have adapted part of Ekosgen methods to the local conditions and
availability of the information.
Part of the results of LSIAE study “LEADER Measure and Measure 3.2.1 - Results and their
Impact on Business Development in Latvian Rural area” (with the participation of the authors)
166
have been used for this paper. The main sources of data for the study are the RSS data, local
action group (hereinafter - LAG) survey (evaluation of maintained and created jobs, the
probability of project implementation without the support - dead-weight; the survey covers
information about 38% of projects and 44% of the acquired RDP 2007 -2013 LEADER public
funding), the CSB of Latvia, the SRS data, etc. Considering various impact directions of
LEADER projects, all projects were grouped in three main thematic groups according to their
purpose: rural economy; development of society; and rural infrastructure and basic services.
This grouping allowed to analyse similar projects and to evaluate and compare the results as
well as to determine the thematic focus of the LEADER projects in Latvia. Classification system
was established, based on the European Commission methodological materials for the
assessment of the impact of LEADER measure on the quality of life (DG Agri, 2010a; DG Agri,
2010b).
Data used in the economic evaluation have been obtained from the LAG survey, hence,
there are objective constraints in their use due to subjective interpretation of survey
questions, when assessing the impact of implemented projects on the local level. However, as
the survey respondents are local experts, it is the best expert evaluation of the projects that
was available.
Research results and discussion
1. Role and thematic scope of LEADER approach implementation
In the previous studies, many researchers welcome the LEADER approach as a tool to deal
with rural development challenges, however, the conclusions about its practical implications
and the role tend to be contradictory. Considering that the LEADER approach has been
implemented for more than 20 years, its territorial expansion and financial capacity has
consistently increased, it can be concluded that in general the EU rural development policy-
makers are convinced of the positive impact the LEADER approach has on rural development.
It has been noted that the LEADER, unlike other public funding measures, values the role of
social capital and focuses on the enhancement and use of its potential at the local level (Buller,
2000; Shortalls, 2008), allowing to maintain the regional diversity in the EU - local traditions,
lifestyle, cultural, historical, and natural values (Becerra, Lastra-Bravo, 2010) and contributing
to the learning of new skills, exchange of experience and improvement in cooperation as well
as reducing the indifference (Bruckmeier, 2000; ÖIR, 2004; Wellbrock et al., 2013). With
regard to the entrepreneurship, the role of the LEADER approach for the development of new
generation rural enterprises has been emphasized by some authors. At a time when agriculture
is losing its dominance in income generation and employment in rural areas, it is particularly
important to establish companies, which are closely connected with the local area, for their
existing resources and development potential, found in the history, culture and nature, and
which are multi-sectoral, dynamic, and innovative, and have collaborative networks (van der
Ploeg, 2006). Whereas there are authors increasingly mentioning the social network as

167
important factor fostering innovation and entrepreneurship (Grimaldi et al., 2011; Leyden et
al., 2013). The LEADER approach contributes to the endogenous development of the territory
based on local resources and the bottom-up approach to the development planning (Kis et al.,
2012), promotes collaboration and cooperation between entrepreneurs. Expansion and
diversification create additional jobs as well as the multiplier of these activities at the regional
level is higher than the one of classical, specialized farming (Heiman et al., 2002).
The LEADER approach is based on the local development strategies, implemented by the
LAG, intended to solve the local problems and to determine priorities for local development of
the area. Some researchers emphasize the role of LAGs by naming them a spatial organizing
force and the institution which on the local level implements and coordinates the rural
development process (Kis et al., 2012; Falkowski, 2013). However, the European Court of
Auditors in its 2010 report No 5 for the LEADER approach in rural areas devotes some criticism
towards LAG activities. With regard to the implementation of the projects, the main criticism is
devoted to the deficiencies in the project content – in practice only a small number of projects
demonstrate innovation and interaction; in most cases they are only slightly different from
other public funding activities or traditional municipality functions. It is also observed that
quite often LEADER projects simply address the individual needs of beneficiaries, rather than
contribute to the increase of welfare in general (European Court of Auditors, 2010).
The thematic analysis of the RDP 2007-2013 LEADER projects implemented in Latvia shows
that in terms both the number and the approved public funding most projects can be
attributed to the group - development of society. According to the classification developed in
the study, these are the projects that focus on the development of mental and physical
capabilities of humans, including the necessary infrastructure and equipment. The second most
important thematic group is rural infrastructure and basic services, i.e. the projects that focus
on convenience, environmental appeal and improvement of living conditions of local residents.
The share of rural economy-related project in Latvia on average is about a fifth of the total
approved projects and the amount of funding (Figure 1).

168
Source: authors’ construction based on RSS and OCMA data
Fig. 1. Public funding structure of approved LEADER projects (RDP 2007-2013)
by thematic groups in Latvian regions
In the regional context, the smallest share of the rural economy group projects in the total
approved public funding can be observed in Kurzeme region (Figure 1), while Zemgale region
has the highest proportion as well as there is also a high level of public funding per inhabitant
in Zemgale region, on average of almost two times the rate of other regions.
2. Analysis of rural economy projects
Facilitation of economic activity is only one of the objectives of the LEADER approach, and it
is often not the main objective, though, in Latvia, particularly in rural area, where there is
general depopulation trend, the business development is very important aspect.
In total, 801 projects of the RDP 2007-2013 LEADER approach could be attributed to the
rural economy thematic group - projects directly related to the business, development of
entrepreneurial infrastructure, availability of business consulting and training. For reaching the
goal of economic activity facilitation in LAG areas, in Latvia EUR 5.7 on average are approved
as public funding per capita (LAG areas). Compared to projects in other groups, projects in
rural economic group were financially less intensive, which may be explained by the support
rate ceiling which for commercial projects is significantly lower than for public benefit projects.
In the group of rural economy, the majority (74%) are commercial projects (Table 1),
covering all projects applied by entrepreneurs, farms or the self-employed. Projects of
societies and unions are included in this group if the service or the product is intended to be
sold on the market (rather than as a service to members).
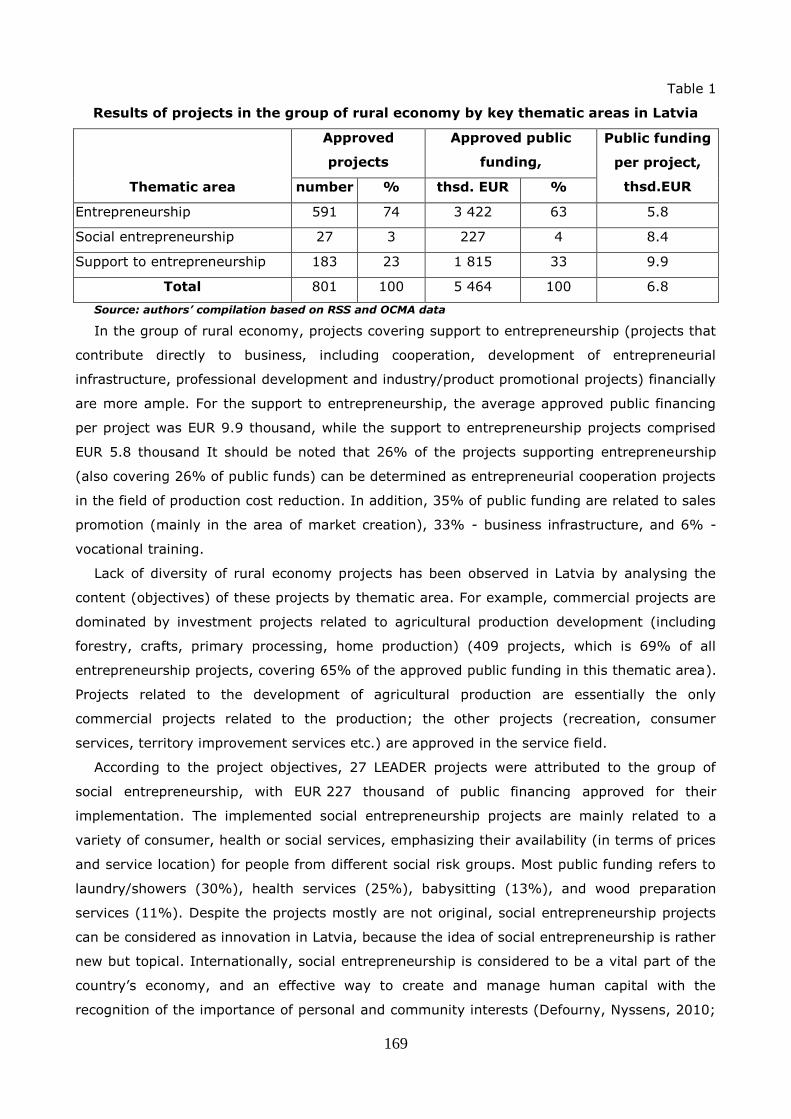
169
Table 1
Results of projects in the group of rural economy by key thematic areas in Latvia
Thematic area
Approved
projects
Approved public
funding,
Public funding
per project,
thsd.EUR number % thsd. EUR %
Entrepreneurship 591 74 3 422 63 5.8
Social entrepreneurship 27 3 227 4 8.4
Support to entrepreneurship 183 23 1 815 33 9.9
Total 801 100 5 464 100 6.8
Source: authors’ compilation based on RSS and OCMA data
In the group of rural economy, projects covering support to entrepreneurship (projects that
contribute directly to business, including cooperation, development of entrepreneurial
infrastructure, professional development and industry/product promotional projects) financially
are more ample. For the support to entrepreneurship, the average approved public financing
per project was EUR 9.9 thousand, while the support to entrepreneurship projects comprised
EUR 5.8 thousand It should be noted that 26% of the projects supporting entrepreneurship
(also covering 26% of public funds) can be determined as entrepreneurial cooperation projects
in the field of production cost reduction. In addition, 35% of public funding are related to sales
promotion (mainly in the area of market creation), 33% - business infrastructure, and 6% -
vocational training.
Lack of diversity of rural economy projects has been observed in Latvia by analysing the
content (objectives) of these projects by thematic area. For example, commercial projects are
dominated by investment projects related to agricultural production development (including
forestry, crafts, primary processing, home production) (409 projects, which is 69% of all
entrepreneurship projects, covering 65% of the approved public funding in this thematic area).
Projects related to the development of agricultural production are essentially the only
commercial projects related to the production; the other projects (recreation, consumer
services, territory improvement services etc.) are approved in the service field.
According to the project objectives, 27 LEADER projects were attributed to the group of
social entrepreneurship, with EUR 227 thousand of public financing approved for their
implementation. The implemented social entrepreneurship projects are mainly related to a
variety of consumer, health or social services, emphasizing their availability (in terms of prices
and service location) for people from different social risk groups. Most public funding refers to
laundry/showers (30%), health services (25%), babysitting (13%), and wood preparation
services (11%). Despite the projects mostly are not original, social entrepreneurship projects
can be considered as innovation in Latvia, because the idea of social entrepreneurship is rather
new but topical. Internationally, social entrepreneurship is considered to be a vital part of the
country’s economy, and an effective way to create and manage human capital with the
recognition of the importance of personal and community interests (Defourny, Nyssens, 2010;

170
Moskvina, 2013). In Latvia, the role of social entrepreneurship is underestimated so far but
can contribute to job creation in the coming years (Dobele L., Dobele A., 2014).
3. Evaluation of economic impact of LEADER projects
- Investment and the income generated
By purchasing goods and services (through investment) within the public co-financed
projects, income is generated for the owners of production factors used in the production of
the goods or service bought that in turn through demand of other goods and services is basis
for further income generation.
Total eligible costs representing acquisitions of goods and services of all analysed LEADER
projects (gross investment) by adjusting the project specific dead-weight (obtained from
surveys of the LAGs), the share of local origin goods and services and respecting the
multiplier, the total net income of local producers and service providers is obtained, including
extra income due to the multiplier effect. To evaluate the income, income multiplier 1.3 is
used, calculated according to the methodology used in the RDP 2007-2013 mid-term
evaluation (Auzina, 2010). Import and local investment ratio is derived from the analysis of
the procurement documentation of LEADER projects through random sample survey in
different regional RSS units, covering all thematic project groups.
The evaluation shows that the implementation of the LEADER projects has impact on the
business development, i.e. the projects create demand for local goods and services (some
projects during implementation provided also jobs), generating income for local producers of
approximately EUR 13.3 million. Respecting multipliers, this income creates additional income
to the local economy of approximately EUR 4 million. The particular importance of the
implementation of the LEADER approach has been in generating the demand for local
handicraft masters, furniture manufacturers and playground element producers. Particularly
noteworthy are the national costumes and their elements, the producers of which with the help
of LEADER projects were able to earn about EUR 1.5 million that otherwise would not be
possible (dead-weight for these projects is 27%).

171
0.002.00
4.006.008.00
10.0012.00
14.0016.00
gross
investment
total net
income
gross
investment
total net
income
gross
investment
total net
income
Rural economy Development of society Rural infrastrukture and
basic services
mil
lion
EU
R
gross investment net income additional income due to multiplier
Source: authors’ calculations based on RSS data (including project procurement information), LAG
survey, and CSB of Latvia data
Fig. 2. LEADER project investments and the investment-generated income by the
main thematic groups in Latvia
Figure 2 depicts the investments of LEADER project and the net income generated to the
local producers by them (respecting also multiplier), broken down by project thematic groups.
Investments made in LEADER projects related to the development of society presents the
greatest overall potential for income generation, though the investments in these projects
were larger than in projects of other thematic groups, especially rural economy. The income
generation potential of rural economic project is the smallest, both due to the relatively small
total amount of investments made, and because most of these projects have acquired
technological equipment necessary for modernization what is not produced in Latvia, and thus,
these projects participate less in demand for locally originated goods and services.
- Maintained and created jobs and income generated
Evaluation of maintained and newly created jobs in full-time equivalent (due to the
implementation of LEADER projects) for the needs of this study is derived from the LAG
survey. This information is used both as a direct impact on business activity indicator as well
as to evaluate the potential impact of the maintained and created jobs on local economy in the
form of income (such as wages and salaries), and to determine the ratio of incomes created by
maintained and new jobs (FTEs) to the public funds. It is assumed that after the
implementation of the project the new or maintained jobs are paid for and exist at least three
years (Ekosgen, 2011), and thus, generate income - wages and salaries over the next three
years (but jobs existing during the implementation of project correspond to the actual period
of employment).
According to the evaluation, due to the public funding allocated to the implementation of the
LEADER 2007-2013 projects, the following net (considering project dead-weight) results could
be achieved in the surveyed LAGs in relation to employment and income generation potential:
• during project implementation, 39.9 (FTE) jobs ensured;
• as a project result, 81.6 direct and 121.5 indirect jobs maintained (FTE);
• as a project result, 101.4 direct and 102.4 indirect jobs created (FTE);

172
• as the result of maintained and created jobs, in the next three years the expected income
as wages and salaries could be EUR 4.9 million;
• EUR 1 of public funding invested could bring a return in the form of wage and salaries (for
period of 3 years) of EUR 0.49 respectively.
0.00
0.50
1.00
1.50
2.00
2.50
total entrepreneurship support to
entrepreneurship
Rural economy Development of
society
Rural
infrastructure
mil
lio
n E
UR
0.00
0.50
1.00
1.50
2.00
crea
ted
EU
R p
er s
up
po
rt
EU
R
created income as wages and salaries (for period of 3 years) created income per support EUR
* Social entrepreneurship included under entrepreneurship Source: authors’ calculations based on LAG survey and SRS data
Fig. 3. Employment-generated income and support return in the implemented
projects of surveyed LAGs by thematic groups
According to the projects implemented by the surveyed LAGs, projects relating to the
development of society had the greatest impact on indirect job maintenance and creation
(22% of the number of jobs), while the entrepreneurship Leader projects had the greatest
impact on direct job safeguarding and creation (40%). Overall entrepreneurship projects
contributed to the facilitation of the employment the most (29% of the total number of
maintained and created jobs), and thus, also to the possible formation of incomes (in the form
of wages and salaries), and consequently, the highest potential return of EUR 1 invested has
been observed in this thematic group (Figure 3).
Attributing the LAG survey data to all LEADER approach projects implemented in Latvia (all
public funding), the authors obtained the net results of total invested public funding to the
local economy, which is achieved by facilitating employment and potential income generation:
• 0.7 thousand jobs maintained and 0.7 thousand - created in FTE (including 300 new direct
jobs);
• possible income as wages and salaries – EUR 15.6 million (within 3 years);
• the expected income generated from the maintained and created jobs (as wages and
salaries for the period of 3 years) offsets approximately half of the invested public funding
(one euro invested could generated income EUR 0.51 as wages and salaries over three years).
Conclusions, proposals, recommendations
1. The approved projects and public funding structure show that the most important
benefits of the implementation of the LEADER approach in Latvia are linked to the

173
development of society, followed by improvements in the rural infrastructure and basic
services. Projects related to business development (group of rural economy) make up about a
fifth of the total approved RDP 2007-2013 LEADER projects and public funding.
2. Most of the rural economy projects are directly related to business development but there
is lack of diversity in project objectives (mainly agricultural production, home produced goods,
crafts, rarely - recreational and consumer services) as well as commercial projects have high
dead-weight. At the same time, some projects were implemented in the field of social
entrepreneurship what can be considered innovation at Latvia level.
3. Investments in the approved LEADER projects created demand for domestic goods and
services, generating income for the local producers around EUR 17.3 million. Although the
estimated investment-generated income effect is not large, the implementation of the LEADER
approach has been particularly significant in creating demand for local handicraft masters,
furniture manufacturers and playground element producers. By contrast, in the rural economy
projects, almost two-thirds of the investment was associated with foreign origin, as the
technical equipment is often not manufactured in Latvia.
4. Evaluation shows that the income generated by the maintained and newly created jobs
(due to the implementation of the LEADER projects) could offset at least half of the amount of
public funds spent on LEADER projects. In general, entrepreneurship projects have the
greatest impact on employment development and hence the potential employment-generated
income. The greatest impact on direct job retention and creation has been due to
entrepreneurship projects, and on indirect jobs - due to the development of society projects.
5. The analysis of the economic aspects shows that the LEADER projects have impact on the
development of economic activity; to enhance the economic impact, implementation of
business related projects could be stimulated, as they contribute to job maintenance and
creation the most. In other LEADER projects, the acquisition of goods and services of local
origin could be stimulated which generates income in the local economy through demand.
Acknowledgements
The paper was supported by the National Research Program 5.2.1. SUSTINNO.
Bibliography
1. Auzina, A. (2010). The Impact of Rural Support Payments on Regional Economic
Development Assessment through Regional Multipliers. Unpublished material.
2. Becerra, A. T., Lastra-Bravo, X. (2010). Planning and Neo-Endogenous Model for a
Sustainable Development in Spanish Rural Areas. Int. J. of Sustainable Society, Volume 2,
Issue 2, pp.156-176.
3. Bruckmeier, K. (2000). Leader in Germany and the Discourse of Autonomous Regional
Development. Sociologia Ruralis, Volume 40, Issue 2, pp.219-227.
4. Buller, H. (2000). Re-creating Rural Territories: LEADER in France. Sociologia
Ruralis, Volume 40, Issue 4, pp. 190-199.

174
5. Defourny, J., Nyssens, M. (2010). Conceptions of Social Enterprise and Social
Entrepreneurship in Europe and the United States: Convergences and Divergences. Journal
of Social Entrepreneurship, Volume 1, Issue 1, pp. 32-53.
6. DG Agri (2010a). Approaches for Assessing Impacts of the Rural Development Programmes
in the Context of Multiple Intervening Factors. Working Paper. Retrieved:
http://enrd.ec.europa.eu/enrd-static/evaluation/library/evaluation-helpdesk-
publications/en/evaluation-helpdesk-publications_en.html#guidance. Access: 20.12.2014
7. DG Agri (2010b). Capturing Impacts of Leader and of Measures to Improve Quality of Life
in Rural Areas. Working Paper. Retrieved: http://enrd.ec.europa.eu/enrd-
static/fms/pdf/EB43A527-C292-F36C-FC51-9EA5B47CEDAE.pdf. Access: 20.12.2014
8. Dobele, L., Dobele, A. (2014). Economic Gains from Social Entrepreneurship Development
in Latvia. Regional Formation and Development Studies, Issue 3 (14), pp. 30-39.
9. European Court of Auditors (2010). Implementation of the Leader Approach for Rural
Development. Special Report, No 5/2010. Luxembourg: Publications Office of the European
Union. p. 100.
10. European Network for Rural Development (ENRD) (2013). Summary of the Outcomes of
the 11th LEADER Sub-Committee 11.11.2013. Brussells, Belgium. Retrieved:
http://enrd.ec.europa.eu/enrd-static/app_templates/enrd_assets/pdf/11thLeaderMeeting/
11th_LSC_memo_final_for_upload.pdf. Access: 20.12.2014
11. Ekosgen (2011). National Impact Assessment of LEADER: Impact Report – FINAL (UK).
Retrieved: http://randd.defra.gov.uk/. Access: 20.10.2014
12. Exodea consulting (2013). LEADER: Impact Research (IE). Research Report. Retrieved:
http://www.nrn.ie/wp-content/uploads/2013/12/LEADER-Impact-Research.pdf. Access:
22.12.2014
13. Falkowski, J. (2013). Political Accountability and Governance in Rural Areas: Some
Evidence from the Pilot Programme LEADER in Poland. Journal of Rural Studies, Volume
32, pp. 70-79.
14. Grimaldi, R., Kenney, M., Siegel, D.S., Wright, M. (2011). 30 Years after Bayh-Dole:
Reassessing Academic Entrepreneurship. Research Policy, Volume 40, pp. 1045-1057.
15. Heiman, W.J.M., Hubregtse, H.M., Ophem, J.A.C. (2002). Regional Economic Impact of
Non-Standard Activities on Farms: Method and Application to the Province of Zeeland in the
Netherlands. Agric.Econ.-Czech, Volume 48 (4), pp. 155-160.
16. Kis, K., Gil, J., Veha, A. (2012). Effectiveness, Efficiency and Sustainability in Local Rural
Development Partnerships. Applied Studies in Agribusiness and Commerce, Volume 06,
Issue 3-4, pp. 31-38.
17. Krievina, A., Leimane, I., Miglavs, A. (2012). The Role of Agribusiness in Maintenance of
Future Rural Employment in Latvia. Proceedings of Latvia University of Agriculture, Volume
28 (323), pp. 29-38.
18. Leyden, D. P., Link, A.N., Siegel, D.S. (2013). A Theoretical Analysis of the Role of Social
Networks in Entrepreneurship. Research Policy, Volume 43, Issue 7, pp. 1157-1163.
19. LSIAE, Edo Consult Ltd, LUA, LU, Latvian Rural Advisory and Training Centre Ltd, (2012).
Development of Rural Space in Latvia and Its Possible Future Scenarios. Research Report.
Retrieved: http://laukutikls.lv. Access: 22.12.2014
20. Moskvina, J. (2013). Social Enterprises as a Tool of Social and Economic Policy. Lithuanian
Case. Entrepreneurship and Sustainability Issues, Volume 1, Issue 1, pp. 45-54.
21. Österreichisches Institut für Raumplanung (ÖIR) (2004). Methods for and Success of
Mainstreaming Leader Innovations and Approach into Rural Development Programmes.
Final Report. Retrieved: http://ec.europa.eu/agriculture/eval/reports/leader/full.pdf.
Access: 22.12.2014

175
22. van der Ploeg, J.D. (2006). Rural Development and the Mobilisation of Local Actors.
Discussion paper. Retrieved:
http://ec.europa.eu/agriculture/events/salzburg/panels/ploeg.pdf. Access: 27.12.2014
23. Schiller, S. (2009). Leader Evaluation in Baden-Württemberg: Exploring the Interface of
Self-Evaluation and External Evaluation (DE). Retrieved: http://www.rudi-
europe.net/uploads/media/Case-study_Germany_2_01.pdf. Access: 27.12.2014
24. Shortall, S. (2008). Are Rural Development Programmes Socially Inclusive? Social
Inclusion, Civic Engagement, Participation, and Social Capital: Exploring the Differences.
Journal of Rural Studies, Volume 24, pp. 450-457.
25. Wellbrock, W., Roep, D., Mahon, M., Kaiyte, E., Nienaber, B., Garcia, M.D.D., Kriszan, M.,
Farrell, M. (2013). Arranging Public Support to Unfold Collaborative Modes of Governance
in Rural Areas. Journal of Rural Studies, Volume 32, pp. 420-429.

176
Proceedings of the 2015 International Conference “ECONOMIC SCIENCE FOR RURAL DEVELOPMENT” No39 Jelgava, LLU ESAF, 23-24 April 2015, pp. 176-185
IS VENTURE CAPITAL THE SOURCE OF FINANCING FOR MICRO-ENTERPRISES?
Anatolijs Prohorovs *, Dr. sc. administer., Lecturer,
Riga International School of Economics and Business Administration;
Ingrida Jakusonoka, Dr. oec., Professor,
Latvian University of Agriculture;
and Ilona Beizitere, PhD student,
Riga International School of Economics and Business Administration
Abstract. The current article examines the issue of financing the micro-enterprises of
Latvia by venture capital funds. It considers the number of applications submitted by
enterprises to venture capital funds, the number of investments and the amount of financing
granted to enterprises in general and to micro-enterprises in particular. These indicators are
compared with the indicators of micro-enterprise financing by commercial banks. The main
research methodology is based on questionnaires, interviews, a survey and descriptive
statistics. The research results demonstrate that venture capital is not a popular and available
financial instrument for micro-enterprises. Nevertheless in 2013-2014, the share of micro-
enterprises constituted 81.8% of the number and 60.4% of the amount of venture fund
investments. But the sum of venture capital fund investments in micro-enterprises constituted
about оne рercent in 2013 and about two percent in 2014 of the total amount of micro-
enterprise financing by banks in Latvia.
Key words: venture capital, micro-enterprises, small business, financing.
JEL code: G21, G24, G28, G32, L25, M13
Introduction
The majority of new enterprises are micro-enterprises (Central Statistical Bureau, 2014).
According to the World Bank, micro-enterprises (hereinafter referred to as MEs) in Latvia are
the most rapidly growing segment of the economy (in terms of the number) (Financial Sector
Assessment…, 2012). By the end of 2013, the number of commercial MEs in Latvia was 72 881
or 85% of the total number of commercial companies†. The main reason for MEs discontinuing
their activities is lack of funding. Lack of funding may be caused by an inadequate amount of
equity capital and by lack of opportunities to attract subsequent financing. Mainly because of
their small size, MEs have a slim chance to issue bonds or to be listed on a stock exchange at
the beginning of their activities. As a result, MEs are forced to rely on such sources of financing
* Corresponding author. Tel.: +371 29544764.
E-mail address: [email protected] † Commercial companies are economically active enterprises excluding self-employed persons, individual
merchants, peasant and fishermen's farms (Central Statistical Bureau..., 2014)

177
as state or regional financial instruments, bank financing, non-bank lending and informal
investors, which do not belong to the category of venture capital. MEs may also try to attract
venture capital from venture capital funds (hereinafter referred to as VCFs) or informal venture
capital (financing from business angels). As the sources of financing MEs are scarce and there
is an urgent need for ME financing, we consider that it is important to demonstrate the role of
VCFs in financing MEs. For this reason, we have analysed the data of ME applications for
financing to all six VCFs of Latvia as well as the number of applications and the amount of
financing granted to MEs. As according to the data at our disposal, bank financing is currently
the main source of ME financing, we have identified a volume of bank funding for MEs in
Latvia. We have compared the data of VCF financing with the data of bank financing for MEs in
order to identify a specificity and a share of VCFs in funding ME in Latvia.
Brief literature review
There are some authors who have examined the issues of ME financing. The majority of
authors consider that lack of availability to finance is a major impediment to the growth of
micro, small, and medium enterprises (e.g. Wright M., et al., 2015; International Finance
Corporation, 2013). Researchers and various institutions analyse different sources of ME
financing. Thus, the World Bank regards that credit unions have a better ability than
commercial banks to serve the growing number of MEs (Financial Sector Assessment…, 2012).
For example, Joanna Duda (2013) is of the opinion that most commercial banks do not supply
sufficient crediting to MEs. Due to the high risk posed by MEs, banks require three years of
credit histories and collateral to 120%-150% of the credit value. The high costs of bank credits
are another barrier to small and medium sized enterprises. The credits offered to MEs bring in
higher interest than those available to small and medium-sized enterprises. Some micro-
entrepreneurs try to compensate for the scarcity of capital by borrowing from natural persons
(Duda J., 2013). The World Bank considers that the commercial banks of Latvia lack the
products as well as strategic interest in financing MEs (Financial Sector Assessment…, 2012).
Christopher J. Green and some other specialists hold the view that the growth of MEs is mainly
hindered by lack of access to finance. They note that the financial services provided have been
changing in the last 50 years and in particular provision mechanisms have shifted from credit
schemes to financial services, including micro-finance (Green C. J., Kirkpatrick C. H., Murinde
V., 2006).
A. Prohorovs regards that informal venture capital in a number of Central and Eastern
Europe countries including Latvia has not been sufficiently developed and in the majority of
instances it cannot be an essential source of ME financing (Prohorovs A., 2014a). Besides, the
existing data about the number of informal private investors in some countries including Latvia
have been largely overstated (Prohorovs A., Fainglozs L., 2014).
A number of researchers note that a ME may be established for various reasons. For
example, it has been marked that sometimes the purpose of establishing a ME may be
178
attributed to a wish for additional income or a desire to maintain the customary living standard
(Cabinet of Ministers…, 2009). S. Parth and some other researchers consider that the objective
of establishing a ME may be the wish to create an enterprise which has the potential for rapid
growth (e.g. Tewari P. S., Skilling D., Kumar P., Wu Z., 2013). In A. Prohorovs’ and I.
Jakusonoka’s (2012) opinion, new innovative MEs having the potential for rapid growth are
consistent with the paradigm of innovative development of the country. That is why this type
of MEs needs specific forms of financing including venture capital (Prohorovs A., Jakusonoka I.,
2012).
A. Reid and P. Nightingale (2011) consider that new innovative companies are interested
both in bank financing and VCF financing. In the opinion of Parth S. Tewari and other
researchers, the main issue in this connection is that government policies should focus on
enabling high potential enterprises to grow rather than merely increasing the number of
companies (Tewari P. S., Skilling D., Kumar P., Wu Z., 2013). A. Reid and P. Nightingale hold
the view that the rapid growth of new enterprises in emerging sectors makes them particularly
vulnerable to market failures due to asymmetric information, uncertainty, lack of collateral for
R&D intensive companies, absence of reputation and lack of historical relationships with banks,
market uncertainty (Reid, A. and Nightingale, P. (eds.), 2011).
Data and methodology
The authors used the following methodology for conducting the research and obtaining the
processed data. All data refer to the Republic of Latvia. The quantifying indicators of MEs for
2013-2014 have been obtained from the data base of the Central Statistical Bureau of Latvia
and Lursoft IT, Ltd. The data of the Latvian Guarantee Agency (hereinafter referred to as LGA),
the Association of Commercial Banks of Latvia, the Financial and Capital Market Commission of
Latvia (hereinafter referred to as FCMC) have been also used. The data on the number of
enterprise applications submitted to VCFs, as well as on the number of VCF investments in MEs
and other enterprises were received from all six VCFs which participated in the investment
cycle in 2013 -2014. The data were obtained from a special survey, conducted with the help of
the LGA on each VCF separately and then generalised by the authors of the present article. We
attributed to MEs only those enterprises which comply with the European definition of micro-
sized enterprises (Europe Commission, 2003). In the research, we used the data only on those
MEs which are commercial companies, namely economically active enterprises excluding self-
employed persons, individual merchants, peasant and fishermen's farms (Central Statistical
Bureau…, 2014). In order to list all VCFs registered in Latvia, we had interviews with the board
members of the Latvian Venture Capital Association and LGA (acting as a fund-of-funds
investing in VC funds targeting SMEs). The data on the investments of the Corporate Venture
Capital Fund of Lattelecom, Ltd. were not included in the research, as the main challenge of
corporate venture capital funds is usually the acquisition of technology companies in order to
obtain advanced technologies. The data on private equity (PE) fund financing were not

179
included in the research either, as the PE funds usually finance other types of enterprises
which do not belong to MEs. The main research methodology was based on descriptive
statistics, questionnaires, a survey and interviews.
Research results and discussion
The data obtained in the research and reflected in Table 1 demonstrate that in 2014 in
comparison with 2013, the number of applications for financing increased by almost 50%, and
what is more, the number of MEs which were granted funding doubled.
Table 1
Projects and micro-enterprise funding considered by venture capital funds in Latvia
in 2013–2014*
Indicators/Years 2013 2014 2013 2014 2013–
2014
2013–
2014
Number and amount number
amount
(EUR, m) number
amount
(EUR, m)
Applications
(by enterprises) 439 648 - - 1 087 -
Financed enterprises 23 54 5.5 8.9 77 14.4
Including micro-enterprises (of
the total number of all financed
enterprises)
21 42 2.5 6.2 63 8.7
Micro-enterprises financed by
VCFs of the total number of
enterprises which have been
granted VCF financing, %
91.3 77.8 45.4 69.7 81.8 60.4
Source: Developed by the authors based on the authors’ survey obtained on venture capital funds in Latvia
Table 1 indicates that in the period of 2013–2014, the total sum of VCF investments in MEs
increased 2.5 times. The total number of VCF investments in MEs increased from 45.4% to
69.7%. In order to balance potential specific fluctuations between 2013 and 2014, the average
data on the listed indicators for two years have been also included in the table. As a result, we
may come to the conclusion that in 2013-2014 the share of VCF investments in MEs in Latvia
amounted to 60.4% of the total sum of VCF investments. We consider that this proportion
shows that MEs are not discriminated by the VC funds because of the small size of these
enterprises but, on the contrary, the VC funds prioritise them for investments.
In 2013, 72 881 commercial MEs (Central Statistical Bureau…, 2014) were active in Latvia.
Within the period of two years, 1.5% of Latvian MEs turned for financing to the VCFs.
According to Nikolaos Daskalakis as to equity financing, companies rely heavily on their own
funds, they do not wish to raise new equity from sources outside their companies (venture
capital, business angels and so on) (Daskalakis N., 2010).
Out of the commercial MEs which applied to VCFs for financing 7.1% received it. This is a
very high indicator testifying to the fact that only those MEs were granted VCFs financing
* The data summary includes the data on six venture capital funds (Imprimatur Capital Seed Fund, Imprimatur
Capital Technology Venture fund, Fly Cap, Expansion, ZGI 3 and BatlCap).
180
which met their requirements and had high quality projects. However, international practice
shows that not more than 0.5% of ME applications are granted VCF financing. Therefore the
fact that fourteen times more applications have been granted financing in international practice
may point either to the low quality of project selection by the VC funds in Latvia or to an
insufficient number of projects to be financed and invested in (pursuant to the provisions of
European co-financing) in a short term. It has to be noted that VC funds usually finance new
innovative companies having the potential for rapid growth (e.g. Kitsing M., 2013; Prohorovs
A., 2014b). We consider that the majority of MEs in Latvia do not aim at turning into
innovative enterprises having the potential for rapid growth. This is the main reason why they
cannot be considered for VC fund financing. It means that the potential of VC fund financing
may be limited due to the aforementioned reason, namely, due to the lack of a sufficient
amount of deals (e.g. Groh A., 2010; Prohorovs A., 2013). Among the factors limiting the flow
of deals, we can mention the low level of innovations in the country (Prohorovs A., Pavlyuk D.,
2013) and lack of private and foreign VC funds in the market specialising in financing the early
stages of enterprise development (e.g. Fraser S., Bhaumik S., Wright M., 2015; Prohorovs,
2014b). The flow of deals may be low due to the underdeveloped institution of informal
investors and business angels (e.g. Mason C., Botelho T., Harrison R., 2013), insufficient public
support in pre-seed and seed stages of company development and some other reasons.
In order to compare the ratio of VCF investments to bank investments in MEs, we have used
the data on bank corporate financing of MEs. In 2013, the total sum of ME financing by banks
in Latvia constituted EUR 586.9m, but in 2014, it was EUR 341.6m, and the total sum of
corporate crediting was accordingly EUR 1 965m (in 2013) and EUR 1 231.9m (in 2014)
(Association of Commercial Banks…, 2014; Financial and Capital Market…, 2014)*.
On the basis of these data, we calculated that the share of MEs in the total bank corporate
crediting in 2013–2014 constituted 29.1% (Figure 1). Comparing these data with the data of
VCF investments in Latvia, we found that the share of MEs in the portfolio of VCFs amounted to
twice the sum of bank financing (Figure 1).
* In order to adjust the data for 2013 and 2014, the funding of the State-owned JSC "Latvian Development
Finance Institution Altum" was added to bank financing, as in 2013, Altum funding was included in the total sum of bank financing.

181
Source: Developed by the authors based on the authors’ survey obtained from LGA and data from FCMC
Fig. 1. The share of corporate financing for MEs in VCFs and banks in Latvia in 2013–
2014
Though in 2013-2014, VCF investments amounted only to 0.5% of the bank corporate
financing, the share of VCFs in financing MEs in comparison with bank financing increased
twice and amounted to almost one percent. Obviously for this reason, the Ministry of
Economics of Latvia plans to increase MEs financing with the support of venture capital
investments to 29% of MEs financing needs in 2016-2020, i.e., to EUR 65–118m. (Ministry of
Economics…, 2014). Comparing the project of the Ministry of Economics with VCF investments
in MEs in 2013–2014, we see a substantial increase. However, in order to increase the share of
VC in financing MEs to the planned 29%, it is necessary to substantially expand the number of
ME applications (proceeding from the fact that in 2013, 72 881 commercial MEs functioned in
Latvia, and only about 1.5% of them applied for VCF financing). Probably, the current venture
financing instruments of state support do not suit MEs, which explains the small number of
applications for VCF investments in Latvia.
Table 2
Average sums of financing one enterprise and one micro-enterprise by VCFs and
banks in Latvia in 2013–2014
Тype of organisation Commercial banks Venture capital funds
Average sum for financing all
enterprises, EUR 257 830 201 985
Average sum for financing
micro-enterprises, EUR 148 571 133 415
Source: Developed by the authors based on the authors’ survey obtained from LGA and data from FCMC
The data in Table 2 show that the average sum of bank corporate crediting exceeds the VCF
financing by 27.6%. However, if we compare the indicators of micro-enterprises, we see that
the difference amounts only to 11.4%. Disregarding the size of the enterprise, the amounts of
VC fund and bank financing granted to one enterprise converge in the end. The average sum
of ME crediting by banks of EUR 148.6 thousand may be explained by the fact that the banks
do not have mass products for MEs, among them the so called micro-credits. Nikolaos

182
Daskalakis also acknowledges that companies are faced with restricted access to debt
financing. They would have preferred to make more use of the borrowing, especially long-term
debt. Thereby it demonstrates a gap in the long-term financing needs of the companies
(Daskalakis N., 2010). Parmendra Sharma and Neelesh Gounder, on the basis of
questionnaires distributed to 77 MEs, show that 97% of the surveyed enterprises indicated
that banks were a very important source of funds for the operation and growth of their
businesses. Nevertheless, 90% of the enterprises having secured a bank loan indicated that
they would have preferred to borrow from other lenders than a bank. They were of the opinion
that banks should establish a specialised internal micro-finance unit for management of ME
and small enterprise financing (Sharma P., Gounder N., 2012).
In order to establish qualitative MEs indicators in the national economy of Latvia, we
compared the volume of MEs assets with the total assets of the commercial companies in
Latvia. According to our calculations, with MEs assets of 12077.9 million euros as at the end of
year 2013 (based on collected data by LURSOFT, 2015), the share of MEs assets amounted to
31.7%. To proceed, the share of MEs assets taken against the total assets of Latvian
companies was compared by bank and VCF financing to MEs and commercial companies. It
turned out that the share of bank financing of MEs was smaller by 8%, and VCFs financing was
larger by 90.5% (in relation to the share of MEs assets in the total assets of commercial
companies of Latvia).
Hence, we could draw a conclusion that in absolute figures the banks had not only
decreased their financing to Latvian MEs, but they were also far from the average financing per
asset unit. It was estimated that the average value of assets of commercial ME was 138.7
thousand euros and established that the average bank loan (148.6 thousand euros) to ME
exceeded the average asset value of ME. According to research calculations, the share of bank
financing in ME’s assets amounted to 2.7% or 3.7 thousand euros per Latvian ME. The
acquired data demonstrate that the majority of ME bank loans are granted to larger MEs. It
substantiates our conclusion that it is necessary to stimulate the banks to finance MEs or
activate the avenues of non-banking financing, including micro-lending.
The share of VCFs financing taken against the assets of Latvian MEs confirms the significant
role (and to a certain extent – the role compensating for the deficit of other financing
instruments) of VCFs in financing MEs. Moreover, it has to be taken into account that VCFs
finance the companies with a fast growth potential, i.e. companies of better quality and high
importance for the economic development of the state.
The presented data prove that smaller MEs are the first to be left without adequate
financing, including recently established innovative MEs without sufficient collateral and
turnover which, as a rule, are being financed by their owners, informal investors, venture
capital and other non-banking financing instruments.
The acquired data enable us to draw a conclusion of the importance and necessity to
develop various venture capital instruments, including VCF.

183
Conclusions and recommendations
We have examined whether VC funds are a financing instrument for micro-enterprises. We
have analysed new data on the number of applications submitted for financing, the number of
commercial MEs which have received VCF investments, the share of MEs in the total number of
projects financed by VCFs. We have also analysed the data on corporate credits and ME
financing by banks and have compared the data on ME financing by VCFs with the data on
bank financing.
We have shown that VCFs are not a large-scale and popular source of ME financing in
Latvia in comparison with bank financing. The share of VCF financing constitutes only 0.5% of
bank corporate financing in Latvia. However, comparing the ME financing by banks with ME
financing by VC funds, the share of VCFs has doubled and reached almost one percent. We can
conclude that MEs are not discriminated by VC funds because of the small size of the
enterprises but, on the contrary, the VC funds prioritise them for investments.
Only 1.5% of the total number of commercial MEs has applied to VCFs for financing. We
assume that the majority of MEs in Latvia do not aim at turning into innovative enterprises
having the potential for rapid growth, this being the reason why they cannot be considered for
financing by VC funds. It means that the potential of VCF financing may be limited due to the
lack of a flow of deals including the underdeveloped institution of informal investors and
business angels and insufficient public support in pre-seed and seed stages of company
development.
The average amount of ME financing by banks and by VCF almost does not differ– bank
financing exceeds VCF financing only by 11%. The average sum of ME crediting by banks of
EUR 148.6 thousand may be explained by the fact that the banks do not have mass products
for MEs, including the so called micro-credits.
Considering the fact that in absolute figures the share of ME financing by VCFs constitutes
slightly less than 1%, the governmental and public institutions should pass appropriate
measures for increasing the share of venture capital in MEs financing.
These factors must be taken into account by public institutions and politicians responsible
for determining the choice of financial instruments for MEs.
The results obtained in the research are based on data generated in the last two years
which may be insufficient for drawing the final conclusions. Besides, all VCFs of Latvia are
hybrid funds. Four out of six funds analysed are fully subsidised by the state. Therefore the
conclusions made in our research may be insufficient for application in other countries of
Central and Eastern Europe and emerging markets.
The data obtained by us will be useful for state institutions and politicians in making well-
grounded decisions on the financial instruments for micro-enterprises and public support to
venture capital. The model offered by the authors of the research will make it possible in the
future to expand the geography of research to other countries in order to verify the
conclusions made by the authors.

184
Acknowledgements
We thank Judit Karsai, Dr., Senior Research Fellow, Hungarian Academy of Sciences
Institute of Economics, Research Centre for Economic and Regional Studies for helpful
comments and suggestions. Ilona Beizītere owes special thanks to the company "ZGI Capital"
for support in preparing this article.
Bibliography
1. Association of Commercial Banks of Latvia. (2014). Indices of bank activities in the 3rd
quarter of 2014. Retrieved: http://www.bankasoc.lv/en/statistics/banks.html. Access:
18.12.2014
2. Cabinet of Ministers of the Republic of Latvia. (2009). Latvijas Republikas Ministru kabineta
2009.gada 30.oktobra rīkojums Nr.748 (Order No 748 of the Cabinet of Ministers of the
Republic of Latvia of 30 October 2009). Par Koncepciju par mikrouzņēmumu atbalsta
pasākumiem. (For the Concept of Micro-enterprises Support Measures.) Latvijas Vēstnesis, 182
(4168), 17.11.2009. Retrieved: http://m.likumi.lv/doc.php?id=200709. Access: 09.01.2015
3. Central Statistical Bureau of Latvia. (2014). Statistical Enterprise Register. Retrieved:
http://data.csb.gov.lv/pxweb/en/uzreg/uzreg__ikgad/?rxid=cdcb978c-22b0-416a-aacc-
aa650d3e2ce0. Access: 18.12.2014
4. Daskalakis, N. (2010). Financing Practices and Preferences for Micro and Small Firms. Small
Enterprises Institute GSEVEE (IME GSEVEE), 2010. Retrieved:
http://papers.ssrn.com/sol3/papers.cfm?abstract_id=1683182. Access: 16.12.2014
5. Duda. J. (2013). The Role of Bank Credits in Investment Financing of the Small and
Medium-sized Enterprise Sector in Poland. Managerial Economics, 2013, No. 13, pp. 7–20.
Retrieved: http://dx.doi.org/10.7494/manage.2013.13.7. Access: 16.12.2014
6. Europe Commission. (2003). Commission Recommendation of 6 May 2003 concerning the
definition of micro, small and medium-sized enterprises (2003/361/EC), Annex, Articles 2-
3. Official Journal of the European Union, 20.5.2003. Retrieved: http://www.reach-
compliance.eu/english/REACH-ME/engine/sources/regulations/launch-2003-361-EC.html.
Access: 01.11.2014
7. Fraser, S., Bhaumik, S., Wright, M. (2015). What Do We Know About Entrepreneurial
Finance and Its Relationship with Growth? International Small Business Journal 33(1): pp.
70–88. ISSN 1741-2870
8. Financial and Capital Market Commission of Latvia. (2014). Monthly Reports. Retrieved:
http://www.fktk.lv/en/commission/about_us/2014-01-
08_the_financial_and_capital_market_commission/. Access: 19.12.2014
9. Financial Sector Assessment, Latvia, (2012) SecM2012-0291, World Bank. July 2012.
Retrieved:
http://lnweb90.worldbank.org/FPS/fsapcountrydb.nsf/(attachmentwebFSA)/Latvia_Develop
mentModule_FSA_web.pdf/$FILE/Latvia_DevelopmentModule_FSA_web.pdf. Access:
16.12.2014
10. Green, Christopher J., Kirkpatrick, Colin H., Murinde, Victor. (2006). Finance For Small
Enterprise Growth And Poverty Reduction In Developing Countries. Journal of International
Development J. Int. Dev. 18, 1017–1030, Published online in Wiley InterScience,
(www.interscience.wiley.com) DOI: 10.1002/jid.1334
11. Groh, A. (2010). The Capital Flow from Institutional Investors to Entrepreneurs, Retrieved:
http://papers.ssrn.com/sol3/papers.cfm?abstract_id=1547791. Access: 19.12.2014
12. International Finance Corporation (2013). IFC Financing to Micro, Small and Medium
Enterprises Globally (FY2013). Retrieved:
http://www.ifc.org/wps/wcm/connect/industry_ext_content/ifc_external_corporate_site/ind

185
ustries/financial+markets/publications/ifc+financing+to+micro+small+and+medium+enter
prises+-+fy2013. Access: 16.12.2014
13. Kitsing, M. (2013). Government as a Venture Capitalist: Evidence from Estonia, Submission
to Industry Studies Association Annual Conference May 28-31, 2013.
14. Latvian Guarantee Agency, Ltd. (2014). Retrieved:
http://www.lga.lv/index.php?id=25&L=1. Access: 09.12.2014
15. Lursoft IT, Ltd. (2015). Statistics of Commercial Register. Retrieved:
https://www.lursoft.lv/en/statistics. Access: 09.01.2015
16. Mason, C., Botelho, T., Harrison, R. (2013). The transformation of the Business Angel
Market: Evidence from Scotland. 2013. Retrieved:
http://www.gla.ac.uk/schools/business/staff/colinmason/#tabs=1. Access: 16.12.2014
17. Ministry of Economics of the Republic of Latvia. (2014). Access To Finance. Ex Ante
Assessment. Latvia, EM, November 24, 2014 (unpublished working paper)
18. Prohorovs, A. (2013). The Problem of Capital Attraction into Venture Capital Funds of
Latvia. Journal of Business Management, Issue No.7, pp. 16 – 41, ISSN 1691-5348
19. Prohorovs, A. (2014a). Quantitative and Qualitative Analysis of the Informal Venture
Capital in Latvia. Journal “Economics and Rural Development”, Vol. 10 No 1 , pp. 47- 68,
ISSN 1822-3346 / e ISSN 2345-0347
20. Prohorovs, A. (2014b). The Volume of Venture Capital Funds of Latvia and Their Financing
Sources. Journal of China-USA Business Review, Volume 13, Number 4, April 2014 (Serial
Number 130), pp. 217 – 234, ISSN 1537-1514
21. Prohorovs, A., Fainglozs, L. (2014). Problems of Data Collection, Processing and Use of
Informal Venture Capital. Journal “Procedia - Social and Behavioral Sciences”, Issue 150C,
pp. 87 – 95, ISSN 1877-0428, Elsevier
22. Prohorovs, A., Jakusonoka, I. (2012). Financing of Innovation System Development and
Attraction of Private Capital, Financing of Innovation System Development and Attraction of
Private Capital. Economic Science for Rural Development 2012 Conference Proceedings,
Issue 28, pp. 219 – 224, Jelgava (Latvia)
23. Prohorovs, A., Pavlyuk, D. (2013). Analysis of Economic Factors Influencing Venture Capital
Investment in European Countries. Socialiniai tyrimai (Social Research), Nr. 4 (33), 2013
pp. 111 – 118, ISSN 1392-3110
24. Reid, A. and Nightingale, P. (eds.) (2011). The Role of Different Funding Models in
Stimulating the Creation of Innovative New Companies. What is the Most Appropriate Model
for Europe? A Report to the European Research Area Board. Study funded by the European
Commission, DG Research. Retrieved: http://ec.europa.eu/research/erab/pdf/erab-study-
venture-capital-2011_en.pdf. Access: 01.12.2014
25. Sharma, P., Gounder, N. (2012). Obstacles to Bank Financing of Micro and Small
Enterprises: Empirical Evidence from the Pacific with Some Policy Implications. Asia-Pacific
Development Journal, Vol. 19, No. 2, December 2012. pp. 49-75.
(ssrn.com/abstract=2187212 )
26. Tewari, P., S., Skilling, D., Kumar, P., Wu, Z. (2013). Competitive Small and Medium
Enterprises. A Diagnostic to Help Design Smart SME Policy. World Bank. May 2013.
Retrieved: http://documents.worldbank.org/curated/en/2013/05/18487507/competitive-
small-medium-enterprises-diagnostic-help-design-smart-sme-policy . Access: 16.12.2014
27. Wright, M., Roper, S., Hart, M., Carter, S. (2015). Joining the dots: Building the Evidence
Base for SME Growth Policy. International Small Business Journal, 2015, Vol. 33(1), pp.3-
11

186
FACTORS AFFECTING THE PERFORMANCE OF ACCOMMODATION
ENTERPRISES IN LATVIA
Aina Muška1, Dr.oec.; Anita Auziņa2, Dr.oec.
1, 2 Latvia University of Agriculture, Faculty of Economics and Social Development
Abstract. Tourism, including the accommodation industry, is a significant source of export
revenues. The research aim is to examine the factors affecting the performance of
accommodation enterprises in Latvia. The research novelty involves the factors affecting the
performance of accommodation enterprises, which were identified and analysed employing
correlation analysis. In the present research, the authors found that the global economic crisis
significantly influenced the accommodation industry’s growth in Latvia, especially in 2009; yet,
in 2010 the situation stabilised. In 2011, the accommodation industry started growing.
However, the pre-crisis indicators have not yet been reached in this industry, and its growth is
moderate. The key factors affecting such indicators of enterprises of the accommodation
industry as turnover, value added and net income or losses of businessmen are (1) number of
foreign tourists serviced at accommodation establishments in Latvia; (2) number of domestic
tourists serviced at accommodation establishments; (3) number of overnight (day and night)
stays by foreign tourists in Latvia and (4) number of overnight (day and night) stays by
domestic tourists in Latvia. Most of the individuals serviced at Latvia’s tourist accommodations
were foreign tourists, the proportion of which at Riga’s tourist accommodations exceeded even
70%. Outside Riga region, more than 70% of the visitors of tourist accommodations were
domestic tourists, mainly business tourists. The greatest share of the accommodation
industry’s value added and turnover was provided by the regions of Riga and Pieriga. The
contribution of the other regions was insignificant.
Key words: accommodation industry, affecting factors, hospitality industry.
JEL code: M21, R11
Introduction
Latvia’s government policy documents: the National Development Plan of Latvia for 2014-
2020 and the Guidelines on Promoting Exports of Latvian Goods and Services and Attracting
Foreign Investments for 2013-2019 define that exports are the key driver of Latvia’s economic
Corresponding author. Tel.: + (371 63023773); fax: + 371 630 84987.
E-mail address: [email protected].
Proceedings of the 2015 International Conference “ECONOMIC SCIENCE FOR RURAL DEVELOPMENT” No39
Jelgava, LLU ESAF, 23-24 April 2015, pp. 186-197
187
growth. Tourism is one of the leading export industries in the world. It is also one of the most
competitive sectors of Europe’s economy (Ministry of Economics, 2014).
In Latvia, too, tourism is regarded as one of the country’s economic development
opportunities and priorities for the sector of services, as it is a significant source of export
revenues, considerably contributing to the country’s GDP. In 2012 in Latvia, the value of
tourism services sold totalled EUR 580.5 million, comprising 16.5% of the total value of
exports of services and 4.3% of the total value of exports of goods and services (Ministry of
Economics, 2014). The tourism industry has a large multiplier effect – its growth stimulates the
demand for public catering, transport, health care, entertainment and trade services.
A significant component of any tourism industry is hospitality industry, which is comprised of
providers of public catering and accommodation services. For this reason, it is important to
ascertain what factors determine the performance of accommodation enterprises.
The research hypothesis is as follows: the number of domestic tourists makes a greater effect
on the performance indicators of accommodation enterprises than the number of foreign
tourists serviced at tourist accommodations. The research aim is to examine the factors
affecting the performance of accommodation enterprises in Latvia.
Based on the research aim, the following specific research tasks were set: (1) to examine
changes in the performance indicators of accommodation enterprises in Latvia; (2) to identify
the factors affecting the performance of accommodation enterprises; (3)to analyse the factors
affecting the performance of accommodation enterprises.
The research object is businessmen providing accommodation services. The research
subject is the affecting factors. The period of analysis was from 2008 (the base year and the
pre-crisis year) to 2013.
The present research is based on the CSB survey data. The documents produced by the
Ministry of Economics as well as Eurostat data were used to achieve the aim, execute the tasks
and prove or reject the hypothesis. The following research methods were employed: the
monographic method, statistical analysis methods, synthesis and analysis, Pearson’s correlation
analysis.
The research novelty involves the factors affecting the performance of accommodation
enterprises, which were identified and analysed employing correlation analysis.
Research results and discussion
1. Statistical analysis of the performance indicators of accommodation
enterprises
One of the indicators showing the situation with accommodation enterprises is their number
that moderately (less than 10% a year) grew from 681 in 2008 to 765 in 2012 in the period of
analysis. As the number of enterprises grew, the number of bed places also increased from
29 591 in 2008 to 36 901 in 2012.

188
In general, the local hotel market is clearly dominated by local hotel operators and has only
four international hotel chains present: Rezidor, Wyndham, Choice Hotels and Best Western
(Colliers International, 2014).
After analysing the regional locations of tourist accommodations and bed places, one has to
conclude that differences exist. Tourist accommodations mainly concentrate in Riga and its
vicinity and along the Baltic seashore, the river of Gauja and two key Panbaltica tourism roads
(Via Baltica and Via Hanseatica). Rural tourist accommodations are mostly offered next to
water basins and at places of beautiful landscape (Ministry of Economics, 2014).
Micro-enterprises mostly dominate in the accommodation industry in Latvia, and during the
economic recession, especially in 2009, their number and proportion increased (Figure 1).
7783 86 84 85
1914 12 13 12
33234
0%
20%
40%
60%
80%
100%
2008 2009 2010 2011 2012Micro (0-9) Small (10-49)
Medium (50-249) Large (250+)
2028 29
23 24
3732
36
36 30
38 3530
3136
5 5 510 10
0%
20%
40%
60%
80%
100%
2008 2009 2010 2011 2012
Micro (0-9) Small (10-49)
Medium (50-249) Large (250+)
Number of enterprises Number of employed individuals Source: authors’ construction based on the Central Statistical Bureau of Latvia, 2014
Fig.1. Percentage distribution of the numbers of enterprises and employed individuals
in the accommodation industry in Latvia in the period 2008-2012
The authors explain an increase in the number of micro-enterprises by a reduction of formal
bureaucratic procedures for this category of enterprises when the standards regarding
providing public catering services at rural tourist accommodations set by the Food and
Veterinary Service and the hygiene standards for bathrooms of rural tourist accommodations
were eased (Ministry of Economics, 2014). The rising standards after Latvia’s accession to the
European Union on 1 May 2004 were an essential hindering factor for the tourism industry
(Millere, 2009).
In 2009 and 2010, the number and proportion of small and medium enterprises decreased.
As shown in Figure 1, the number and proportion of small and medium enterprises were
insignificant. At the beginning of the period of analysis, only one large accommodation
enterprise operated in Latvia, while in 2011 there were two such enterprises.
In the period 2008-2012, accommodation micro-enterprises employed, on average, 25% of
the total employees in this industry (Figure 1).
189
In 2009 and 2010, the number of employed individuals in the industry declined by 19%
(1312 individuals) and 5% (254 individuals), respectively; in micro-enterprises, the number of
employed individuals rose by 12% (or 157 individuals) and 1% (or 20 individuals). In this
period, the number of employees in enterprises of the other size categories decreased,
especially in the category of medium enterprises. On average, 34% of the total employees
were employed in the categories of medium and small enterprises.
In 2011, a considerable increase in the number of employees was observed in the category
of large enterprises (132%) because, as mentioned before, one more large business entity
entered the market. It is also reflected in the increase in the proportion of employees of the
category of large enterprises in 2011. In 2011 and 2012 in the industry, on the whole, the
number of employees rose in Latvia, reaching 5 654 and 5 964 individuals, respectively.
A similar percentage distribution of employees by size category of enterprises in the
accommodation industry might be observed in the European Union (EU-27): of the total
number of employees engaged in the accommodation industry, 24.0% were employed in
micro-enterprises, 32.4% in small, 24.5% in medium and 19.1% in large enterprises (2010
data) (Eurostat, 2013).
In 2010, 267 thousand businessmen operated in the accommodation industry in the EU-27,
which employed 2.3 million individuals or almost a fourth (23.0 %) of the employees employed
in the hospitality industry (Eurostat, 2013). In the period of analysis in Latvia, almost a fifth
(on average, 20%) of the employees employed in the hospitality industry were engaged in the
accommodation industry, which totalled 5 865 individuals on average.
After comparing the numbers of employees in the industry in 2012 and 2008, one can
conclude that the numbers of employees exceeded the level of 2008 only in the categories of
micro- and large enterprises, reaching 106% and 173%, respectively. In the category of small
enterprises, the number of employees in 2012 stood only at 70% of the level of 2008; the
situation for the category of medium ones was slightly better, 84%. In 2012 in the country, on
the whole, employment in the industry reached only 88% of the level of 2008. A similar trend
was characteristic of the tourism industry in the entire world: in 2009, the flow of international
tourism decreased by 4% and almost 5 million jobs were liquidated in the tourism industry,
whereas after growth for three years only 4 million new jobs were created in this industry
(Ministry of Economics, 2014).
Value added is also an indicator showing the industry’s growth. Value added shows an
increase in the market value of a product, which resulted from economic activity. It is
calculated by deducting the value of goods and services used in production (Central Statistical
Bureau of Latvia, 2014) (Figure 2)

190
-47.71
16.221.79
1.68
22.81
-2.33
2008 2009 2010 2011 2012 2013
1.76
-19.38
-4.65
8.65
5.293.22
2008 2009 2010 2011 2012 2013
-35.15
21.87
12.12
18.98
-4.02 -3.45
2008 2009 2010 2011 2012 2013
Value added Number of employed individuals Value added per employee
Source: authors’ calculations based on the Central Statistical Bureau of Latvia, 2014
Fig.2. Annual changes in the indicators of the accommodation industry in Latvia in the
period 2008-2013
A decrease in value added in Latvia started already in 2008 when most of the indicators of
the industry presented growth. The decrease in value added was determined by a 4.88%
decline in the number of domestic travellers. A significant decrease in value added, 47.71%,
was observed in 2009, too, when the domestic demand for tourism services fell owing to the
economic crisis and the declining purchasing power of domestic residents and businessmen;
consequently, the number of domestic tourists serviced at tourist accommodations decreased
by more than 41.10% in 2009, i.e. two times more than that of foreign visitors in Latvia
(20.20%).
Since 2010, this indicator has gradually increased in Latvia, especially in 2011 and 2013, as
from that year onwards a stable surge in the numbers of foreign and domestic tourists has
been observed in the country. Also in 2012 the small increase in value added may be explained
by the authors by the moderate increase in the number of visitors.
In the period of analysis, the accommodation industry in Latvia created 35.6% on average
of the value added of the hospitality industry, while in 2010 in the EU-27 the accommodation
industry contributed to almost a third (32.4%) of the hospitality industry’s value added
(Eurostat, 2013).
Similar trends were observed also for the indicator “turnover” – the revenue from sales of
goods and services less discounts as well the value added tax and other direct taxes on sales
(Central Statistical Bureau of Latvia, 2014).
An analysis of the indicator “value added per individual employed in the industry” reveals
that it tended to decrease by 3.45% in 2012, as an increase in the value-added chain lagged
behind the increase in the number of individuals employed in the industry.
The indicator “turnover” did not reach the level of 2008 neither in 2012 nor in 2013, while
the indicator “value added per individual” in the accommodation industry exceeded the 2008
level by 2% in 2013 (Figure 3).

191
Source: authors’ construction based on the Central Statistical Bureau of Latvia, 2014
Fig.3. Average value added per employee (or labour productivity) in the
accommodation industry and the industry of catering services in Latvia in the period
2008-2013, EUR
Labour productivity in the accommodation industry in the EU-27 in 2010 reached EUR
27 200 per employee, which was significantly above labour productivity in the hospitality
industry (EUR 19 300). As shown in Figure 3, over the entire period of analysis, labour
productivity in the accommodation industry in Latvia was higher than in the industry of public
catering services. The low labour productivity in the European Union and Latvia in part was
associated with a trend of part-time employment dominance in the industry (Eurostat, 2013).
In 2010, labour productivity in the accommodation industry in Latvia was 2.7 times lower
than in the EU-27 on average.
An analysis of the changes in value added and in the number of employees in Latvia’s
regions in 2012 compared with 2008, shows that the increases of both indicators were
observed only for Zemgale region. The increases are not shown in Figure 4, as the increases
were impressive: the change in value added was 496%, while that in the number of employed
individuals was 349%. In 2012, compared with the base year (2008=100), an increase in the
number of employed individuals was observed in Pieriga region, while an increase in value
added was reported in Latgale region. In the other regions of Latvia (Riga, Kurzeme and
Vidzeme), the indicators analysed did not reach the level of 2008. A very large decrease was
observed in Vidzeme region.
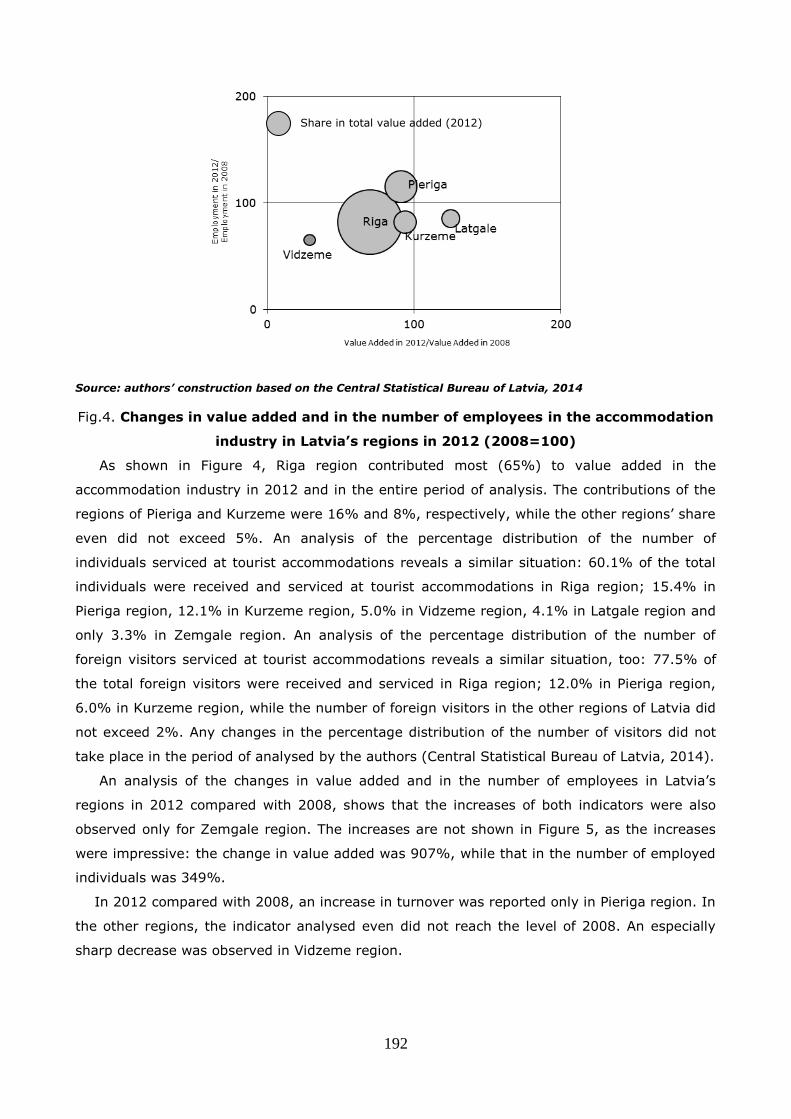
192
Source: authors’ construction based on the Central Statistical Bureau of Latvia, 2014
Fig.4. Changes in value added and in the number of employees in the accommodation
industry in Latvia’s regions in 2012 (2008=100)
As shown in Figure 4, Riga region contributed most (65%) to value added in the
accommodation industry in 2012 and in the entire period of analysis. The contributions of the
regions of Pieriga and Kurzeme were 16% and 8%, respectively, while the other regions’ share
even did not exceed 5%. An analysis of the percentage distribution of the number of
individuals serviced at tourist accommodations reveals a similar situation: 60.1% of the total
individuals were received and serviced at tourist accommodations in Riga region; 15.4% in
Pieriga region, 12.1% in Kurzeme region, 5.0% in Vidzeme region, 4.1% in Latgale region and
only 3.3% in Zemgale region. An analysis of the percentage distribution of the number of
foreign visitors serviced at tourist accommodations reveals a similar situation, too: 77.5% of
the total foreign visitors were received and serviced in Riga region; 12.0% in Pieriga region,
6.0% in Kurzeme region, while the number of foreign visitors in the other regions of Latvia did
not exceed 2%. Any changes in the percentage distribution of the number of visitors did not
take place in the period of analysed by the authors (Central Statistical Bureau of Latvia, 2014).
An analysis of the changes in value added and in the number of employees in Latvia’s
regions in 2012 compared with 2008, shows that the increases of both indicators were also
observed only for Zemgale region. The increases are not shown in Figure 5, as the increases
were impressive: the change in value added was 907%, while that in the number of employed
individuals was 349%.
In 2012 compared with 2008, an increase in turnover was reported only in Pieriga region. In
the other regions, the indicator analysed even did not reach the level of 2008. An especially
sharp decrease was observed in Vidzeme region.
Share in total value added (2012)

193
Source: authors’ construction based on the Central Statistical Bureau of Latvia, 2014
Fig.5. Changes in turnover and in the number of employees in the accommodation
industry in Latvia’s regions in 2012 (2008=100)
As shown in Figure 6, Riga region contributed most (61%) to turnover in the
accommodation industry in 2012 and in the entire period of analysis. The contributions of the
regions of Pieriga and Kurzeme were 22% and 7%, respectively, while the other regions’ share
even did not exceed 4%.
The global economic crisis significantly affected the profit or loss of businessmen doing
business in the accommodation industry. On the whole, this industry suffered losses already in
2008, even though in 2007 the industry made a profit of EUR 33.7 million. In 2009, the losses
reached a maximum level – EUR 48.2 million – in the period of analysis. In the next years, the
losses decreased, and in 2013 the industry made a small profit (Statistical Bureau of Latvia,
2014).
2. Correlations between and the analysis of the affecting factors
To identify the factors being able to affect the performance indicators of enterprises of the
accommodation industry: turnover; value added; number of individuals employed in the
accommodation industry and net profit or loss of businessmen, the authors performed a pair
correlation analysis. The following indicators were assumed as dependent variables: (1)
number of foreign tourists serviced at tourist accommodations in Latvia; (2) number of
domestic tourists serviced at tourist accommodations; (3) number of overnight stays by
foreign tourists in Latvia; (4) number of overnight stays by domestic tourists in Latvia; (5)
expenses of Latvia’s tourists on recreational trips in Latvia (thousand EUR); (6) expenses of
Latvia’s tourists on business trips in Latvia (thousand EUR); (7) expenses of foreign tourists in
Latvia (million EUR); (8) number of employees in Latvia; (9) net average monthly wage of
employees in Latvia (EUR). The main results of the correlation analysis are presented in Table
1.
Share in total turnover (2012)

194
Table 1
Correlation analysis results for the period 2005-2013
Indicator Turnover Value added Number of
employees
Profit or loss
of
businesses
Number of foreign tourists in Latvia
Correlation coefficient 0.734 * 0.245 0.454 0.097
P-value (2 tailed) 0.024 0.525 0.220 0.818
Number of domestic tourists
Correlation coefficient 0.913 ** 0.848** 0.020 0.725*
P-value (2 tailed) 0.001 0.004 0.959 0.042
Number of overnight stays by foreign tourists in Latvia
Correlation coefficient 0.801** 0.326 0.455 0.182
P-value (2 tailed) 0.009 0.393 0.218 0.666
Number of overnight stays by domestic tourists in Latvia
Correlation coefficient 0.733* 0.930** -0.020 0.744*
P-value (2 tailed) 0.025 0.000 0.960 0.034
Number of employed individuals in Latvia
Correlation coefficient 0.228 0.708* -0.187 0.587
P-value (2 tailed) 0.555 0.033 0.630 0.126 ** - Correlation is significant at the 0.01 level; * - Correlation is significant at the 0.05 level
Source: authors’ calculations using SPSS
The correlation coefficients indicate that there is a strong positive linear relationship between
the turnover and such factors as the number of foreign tourists in Latvia (r=0.734), the
number of domestic tourists (r=0.913), the number of overnight stays by foreign tourists in
Latvia (r=0.801) and the number of overnight stays by domestic tourists in Latvia (r=0.733),
which means that an increase in each independent variable leads to an increase in the
industry’s total turnover. The p-values indicate that the differences between the groups
researched are statistically significant.
As shown in Table 1, there is a strong positive correlation between the value added and such
factors as the number of domestic tourists (r=0.848), the number of overnight stays by
domestic tourists in Latvia (r=0.930) and the number of employees in Latvia (r=0.708). This
means that an increase in each independent variable results in an increase in vale added. The
p-values indicate that the differences between the groups researched are statistically
significant.
The correlation coefficients indicate that there is no strong positive relationship between the
number of individuals employed in the accommodation industry and the factors selected by the
authors but there is a medium strong positive linear correlation between such factors as the
number of foreign tourists in Latvia (r=0.454) and the number of overnight stays by foreign
tourists in Latvia (r=0.455), while the p-values indicate that the differences between the
groups researched are not statistically significant.
Table 1 data show that there is a strong positive relationship between the profit or loss of
businessmen and such factors as the number of domestic tourists (r=0.725) and the number
of overnight stays by domestic tourists in Latvia (r=0.744). This means that an increase in

195
each independent variable leads to an increase in businessmen’s profit or loss as well. The p-
values show that the differences between the groups researched are statistically significant.
Among the factors that were selected as dependent variables but were not presented in Table
1, there is a weak and insignificant relationship, while the p-values indicate that the
differences between the groups researched are not statistically significant.
3. Analysis of the affecting factors
After Latvia’s accession to the European Union, the number of tourists serviced at tourist
accommodations in Latvia gradually rose and reached almost 1.6 million in 2008, whereas in
2009 this number fell by 28%.
In the period 2008-2013, on average, 66% of the individuals serviced at tourist
accommodations were foreign tourists. This means that, on average, only 34% were domestic
tourists.
The proportion of foreign tourists serviced at tourist accommodations in Riga even exceeded
77%, while that of foreign tourists in the rest of Latvia was 23% on average in the period of
analysis. It means that outside Riga region, more than 75% of the visitors registered at tourist
accommodations were domestic tourists.
In the period 2008-2013, no significant changes took place in the percentage distribution of
the number of individuals serviced at tourist accommodations, while in 2009 the share of
foreign tourist increased owing to considerable changes in the number of domestic tourists.
An analysis of the number of overnight stays (every night a visitor actually spends (sleeps
or stays) or is registered at a collective or private tourist accommodation) (Tourism in
Latvia..., 2014k) reveals similar trends.
In the period of analysis on average 60% of the total overnight stays in Latvia took place
at tourist accommodations in Riga. The greatest share of the total overnight stays in Latvia
was composed of overnight stays by foreign visitors. In the period of analysis, most of the
foreign visitors stayed overnight at tourist accommodations in Riga. This means that outside
the country’s capital city, mainly domestic tourists used to stay overnight. It is also important
to examine the kinds of tourist accommodations local tourists prefer (Table 2).

196
Table 2
Percentage distribution of the number of overnight stays by domestic tourists by
place of stay in Latvia in the period 2008-2013
Indic
ato
rs
2008 2009 2010 2011 2012 2013 Recre
ational
and o
ther
pers
onal tr
ips
Busin
ess t
rips
Recre
ational
and o
ther
pers
onal tr
ips
Busin
ess t
rips
Recre
ational
and o
ther
pers
onal tr
ips
Busin
ess t
rips
Recre
ational
and o
ther
pers
onal tr
ips
Busin
ess t
rips
Recre
ational
and o
ther
pers
onal tr
ips
Busin
ess t
rips
Recre
ational
and o
ther
pers
onal tr
ips
Busin
ess t
rips
Tourist
accommo-dations
10 57 10 60 13 82 12 83 12 70 13 73
Private lodgings for
the night 90 43 90 40 87 18 88 17 88 30 87 27
Source: authors’ calculations based on the Central Statistical Bureau of Latvia, 2014
Table 2 data show that in the period of analysis, on average, 12% of the recreational trips
with overnight stays were registered at tourist accommodations, while, on average, 88% at
private lodgings for the night. In contrast, 29% of the business trips were registered at private
overnight lodgings. According to Table 2, in the period of the crisis, business tourists mainly
stayed at tourist accommodations rather than at private overnight lodgings. It means that
most of the domestic visitors serviced at Latvia’s tourist accommodations were business
tourists. This also explains the fact why there is a strong correlation between the independent
variable “value added” and the number of employees in Latvia (r=0.708).
Conclusions, proposals, recommendations
1. The global economic crisis significantly influenced the accommodation industry’s growth in
Latvia, especially in 2009; yet, in 2010 the situation stabilised. In 2011, the
accommodation industry started growing. However, the pre-crisis indicators have not yet
been reached in this industry, and its growth is moderate.
2. In Latvia in the accommodation industry, micro-enterprises dominate, which employ, on
average, 25% of the total employees in this industry. The number and proportion of small
and medium enterprises, which employ, on average, 68% of the total employees in the
industry, are small.
3. The key factors affecting such indicators of enterprises of the accommodation industry as
turnover, value added and net income or losses of businessmen are (1) number of foreign
tourists serviced at accommodation establishments in Latvia; (2) number of domestic
tourists serviced at accommodation establishments; (3) number of overnight (day and
night) stays by foreign tourists in Latvia and (4) number of overnight (day and night) stays

197
by domestic tourists in Latvia. The research failed to identify the factors affecting the
indicator “number of individuals employed in the accommodation industry”.
4. Most of the individuals serviced at Latvia’s tourist accommodations were foreign tourists,
the proportion of which at Riga’s tourist accommodations exceeded even 70%. Outside
Riga region, more than 70% of the visitors of tourist accommodations were domestic
tourists, mainly business tourists. The greatest share of the accommodation industry’s
value added and turnover was provided by the regions of Riga and Pieriga. The contribution
of the other regions was insignificant.
5. To foster the growth of the accommodation industry in Latvia, the government, the tourism
industry’s public organisations and entrepreneurs have to carry out more active marketing
campaigns, especially in the domestic market in order to contribute to the development of
domestic recreational tourism.
Bibliography
1. Central Statistical Bureau of Latvia (2014). Statistics Database. Retrieved:
http://www.csb.gov.lv/en/dati/statistics-database-30501.html. Access: 30.12.2014 (Tables
NBG082, TIG112, TIG111, TUG091 TIG131, TIG122, UFG021, UFG022, ISG02)
2. Colliers International (2014). Hotel Market Overview. Annual Report. Latvia 2014.
Retrieved: http://www.colliers.com/lv-lv/latvia/insights#.VKLuUsABY. Access: 30.12.2014
3. Cross-Sectoral Coordination Centre (2012). National Development Plan of Latvia for 2014–
2020. Retrieved:
http://www.pkc.gov.lv/images/NAP2020%20dokumenti/NDP2020_English_Final.pdf.
Access: 30.12.2014
4. Eurostat (2013). Accommodation statistics. Retrieved:
http://ec.europa.eu/eurostat/statistics-explained/index.php/Accommodation_statistics_-
_NACE_Rev._2. Access: 30.12.2014
5. Millere, I. (2009). The Activity Process in Catering Businesses in Latvia’s Regions. The
Doctoral Thesis for the Scientific Degree Dr oec. Jelgava, LUA.
6. Ministry of Economics (2013). Framework of Promoting Exports of Goods and Services from
Latvia and of Attracting Foreign Investment for 2013– 2019. Retrieved:
http://polsis.mk.gov.lv/view.do?id=4376. Access: 30.12.2014
7. Ministry of Economics (2014). Framework of Tourism Development in Latvia for 2014–
2020. Retrieved: http://polsis.mk.gov.lv/view.do?id=4823. Access: 30.12.2014

198
Proceedings of the 2015 International Conference “ECONOMIC SCIENCE FOR RURAL DEVELOPMENT” No39
Jelgava, LLUESAF, 23-24 April 2015, pp. 198-207
REGIONAL DIFFERENTIATION OF MILK PRODUCTION QUOTA
IN POLAND AND ITS INFLUENCE ON THE MILK MARKET
Bartosz Mickiewicz*, PhD, Professor; Antoni Mickiewicz†, PhD, Professor
West Pomeranian University of Technology in Szczecin, Faculty of Economics
Abstract. The paper characterizes the milk market in Poland taking its limitation with quota
use into consideration. The task of the milk market regulation was implemented by the
Agricultural Market Agency, which specified direct suppliers and laid down the limits of
wholesale quotas. It resulted in the identification of the regions in the country with the high
concentration of milk production. In 2004 – 2013, there was a noticeable increase in cows'
milk yield and, on the contrary, there was an increasing concentration of production, which
enabled the reduction of unit production costs. Although the number of entities purchasing
milk did not change (over 300), there emerged the consortia that dominated on the market.
The departure from the policy of milk quota in 2015 will increase its supply, which may result
in the decrease of milk prices for the producers.
Key words: milk quota, milk production level, entity purchasing milk
JEL code: Q18
Introduction
Rice, wheat and milk are placed among the three most significant agricultural products in the
world. The production of cow's milk demonstrated high dynamics. On a global scale, the
production of milk between the years 2000 and 2011 increased from 490.4 million tonnes to
614.3 million tonnes, in other words, by 25.3%. The share of the European Union in this
production amounted to 149.7 million tonnes (24.3%), including the Polish share of 12.4
million tonnes (8.3% in the EU). Despite the substantial world's population growth in the
period mentioned above, the production of cow milk per capita also increased from 82.0 kg to
88.1 kg (7.4%). Milk is characterised by properties, which do not have their equivalents in
other agricultural products. Considering the process of its daily collection, it is an invaluable
source of protein, fat, carbohydrates, vitamins, and other nutrients (minerals). Milk is suitable
for processing into butter, cream, cottage cheese as well as to a different kind of dairy
products like yogurt, kefir, or milk drinks. Milk production is also important for farmers who,
taking ruminants in their pens, can make use of plant waste products such as sugar beet
Corresponding author. * Bartosz Mickiewicz. Tel.: +48 9144 96980; fax: +48 9144 96980.
E-mail address: [email protected]

199
leaves or silage for grazing on marginal lands. In the market system, farmers obtain monthly
payments, significant for the family budget (Seremak-Bulge, 2014).
It should be taken into consideration that the milk market in the EU is one of the most
protected markets. The system of milk production limitation constituted the basic instrument
ensuring the balance on this market. It was introduced at the beginning of the 1980s to limit
the increasing milk production. The main advantages of milk production limitation system were
above all the reduction of milk production, stabilization of milk prices, acceleration of the
process of production concentration and stabilization of farms as well as the increase in the
consumption of milk and its products. Obviously, setting milk production quotas is one of the
intervention methods of different countries on the agricultural markets.
The dairy sector is a complex system consisting of different economic entities and economic
links which exist between them. It encompasses milk producers, milk producers' service, milk
processing companies, milk processing service, distribution, retail and wholesale trade,
science, milk processing mass media, administration and, finally, milk products consumers.
There are complex and various business, economic, legal and social links between the
economic entities mentioned above (Sznajder, 2010).
Material and the scope of the study
The process of integrating Polish dairy industry into the EU structures required a substantial
investment and organizational effort from the agricultural market. The restructuring process
eliminated small farms with small herds of cows from the market, whereas, other farms were
required to ensure high sanitary and hygienic standards, specified by clearly defined legal
regulations. In Poland, administrative functions of dairy production limitation system were
entrusted to the Agricultural Market Agency. Milk production limitation was introduced with the
act from 2001 on the regulation of milk and milk products market. The act defined the most
important concepts of milk quotas, it specified the scope of activities and obligations for public
administration units, entities purchasing milk, milk producers and direct suppliers of milk
products to the market.
The aim of the paper was to present the situation of the milk market in the situation when
the process of milk quota is coming to an end. The system of milk quota was analysed in
individual provinces, taking into consideration the changes in the level of cows’ milk yield and
milk purchase organization. The research was carried out on the basis of the statistical data
from the Central Statistical Office (GUS) and the Agricultural Market Agency.
The issue of milk production quota in the light of the EU legislation
The EU legislation on the agricultural market regulates agricultural production regarding
turnover consistently and on a long-term basis. The purpose of the common organisation of
agricultural markets was to increase the strength of influence on agricultural markets by
broadening the range of forms and methods of market intervention. Different legal bases,

200
mechanisms of action as well as legal and economic instruments were developed for the
organisation system of individual markets. Legal and economic instruments for exerting
influence on agricultural markets involved mainly agricultural prices, limitation of agricultural
production, production quotas, bonuses and surcharges, or intervention purchase of
agricultural products. The most important instruments of internal market prevention in trade
with the third countries included compensation, export refunds, customs duties, or quotas.
Agricultural prices were the most important financial instruments used in the EU. These prices
were established at a relatively high level (higher than the world prices), which were set to
guarantee producers an adequate income. Among other instruments, intervention purchase of
agricultural products was used to prevent agricultural prices from decreasing below certain
threshold. They also involved, among others, limitation of agricultural production, introduced
via the system of trade quotas, the system of products withdrawal from the market as well as
exemption of agricultural land from cultivation (Berkowska, 1997).
In the European Union, the milk and milk products market was not only strongly supported
but also underwent the process of regulation. In 1984, there was an introduction of the system
of milk quotas (individual referential amounts) as well as the mechanisms of market
intervention. Milk production limitation was set to ensure a specific level of production and
consumption of milk products as well as to constrain the rise in expenditure from the EU
agricultural budget on market intervention. Each EU Member State could produce and
introduce a specific amount of milk and milk products to the market in the so called “national
quota”. Overproduction and exceeding the limit of milk sale by the authorized producers led to
charging penalties, which had to be paid to the EU budget.
The European Community elaborated and introduced a wide range of precise legal
regulations concerning all agricultural markets. Their considerable part concerned the
conditions of cattle (ruminants) raising, production and milk processing as well as marketing of
raw milk and dairy products. The European Union regulations permitted for sale only the milk
containing no more than 100 thousand microorganisms and no more than 400 thousand
somatic cells per millilitre. That milk had to come from farms, which had been under veterinary
supervision and complied with structural sanitary requirements (Council Regulation (EC),
2007).
Implementation of the mechanism of milk production quota on a
national scale
As a result of the implementation of the programme tasks supported by the subsidized
interest rates of loans by the ARMA, milk processing plants and production holdings underwent
the process of modernization prior to the accession. Moreover, quality and health standards of
products were introduced to market turnover. For the purpose of adjusting milk market to the
European Union standards, legal as well as technical and technological norms were introduced
and adjusted to the Accession Treaty requirements.
201
Veterinary Inspection (District Veterinarian) played a fundamental role in assessing the
extent to which veterinary and quality requirements were met. Due to the fact that a
considerable group of farms and milk processing plants did not complete structural
adjustments in the first years of the EU functioning when introducing milk to market turnover,
Poland negotiated in the Accession Treaty the transitional periods for meeting these
requirements until the end of 2006.
The first measure initiated by the AMA prior to the integration with the European Union was
milk production limitation. On the basis of production in the reference year covering the period
from 1 April 2002 to 31 March 2003, the Agency issued administrative decisions for milk
producers, authorising them to produce milk. The Agency issued over 355 thousand decisions
concerning granting the milk production limit for wholesale suppliers and over 78 thousand
decisions for direct suppliers. Nearly 7.5 billion kilograms of milk were divided among
wholesale suppliers in the first allocation. Moreover, the suppliers were divided into wholesale
and direct ones. If the manufacturer produced milk on his own and sold it to purchasers, he
was considered a wholesale supplier. However, if a milk producer introduced milk directly to
the market (e.g. he sold it at markets), then he was considered a direct supplier.
In 2003, the Sejm of the Republic of Poland amended the act on the regulation of milk and
milk products market. The act brought about several significant changes for milk producers. It
enabled direct suppliers to introduce to market turnover not only milk products but also milk
that can be directly consumed. Moreover, the legislator extended the period for submission of
applications concerning the granting of individual milk quota. This quota was determined on
the basis of milk cows’ number and the average milk yield from a cow in the herd, calculated
on the basis of the assessment made by the National Animal Breeding Centre.
The act of 2004 on the regulation of milk and milk products market obliges the Agricultural
Market Agency to administer these milk instruments. The act was developed with the
assumption that the milk market in the European Union belongs to the most protected
markets. The fundamental instrument ensuring the balance on the market and milk sector
development was the system of milk production limitation. Milk quotas system was one of the
basic elements of milk market regulation under the Common Agricultural Policy of the
European Union. The high quality of raw milk constituted the requirement for its technological
suitability as well as the adequate quality and shelf life of dairy products. The need to reach
quality standards of the European Union was the main challenge for milk producers. This
requires not only compliance with health and hygiene rules when producing milk but also with
equipping cowsheds with suitable milking parlours and refrigerators. It was also required from
the farms to have adequate equipment to prepare, preserve, and store feed for animals. Apart
from that, it was essential to supply the farm with water suitable for consumption and ensure
the appropriate way of waste and sewage treatment (The Act, 2004).
During the accession negotiations in the EU in the area of agriculture, a total milk quota was
negotiated in the amount of 9380 000 tonnes, including a wholesale quota amounting to 8500

202
000 tonnes and direct sale quota in the amount of 464 000 tonnes. Moreover, Poland was
granted a restructuring reserve of 416 000 tonnes. The reserve allowed to take into account
the increase in market demand on milk as a result of the reduction of milk consumption
directly in the farms. The main result of setting milk production quotas for milk producers was
the change in conditions of functioning and development of agricultural farms, whose growth
was administratively limited by the sales limit. The quotas set led to the necessity of changes
in production management, costs calculation, long-term planning, and balancing of supplies
with the granted limit.
Table 1.
Changes in the wholesale milk quotas and the cow population
in the years 2004-2012
Province
Wholesale
milk quota in
thousand
tonnes
The number
of wholesale
suppliers
Difference
2012/200
4 in %
The cow
population in
thousands
Difference
2012/200
4 in % 2004 2012 2004 2012 2004 2012
Dolnoslaskie 165.4 152.3 4815 1318 27.3 55.7 47.0 84.4
Kujawsko-
pomorskie 580.7 694.3 16250 8654 53.3 160.7 177.0 110.1
Lubelskie 615.0 524.1 49909 20144 40.4 233.4 187.3 80.2
Lubuskie 91.6 90.7 1587 626 39.4 28.9 28.4 98.3
Lodzkie 742.6 757.6 47627 24731 51.9 235.8 216.1 91.6
Malopolskie 170.1 143.0 22371 7953 35.5 170.2 112.6 66.1
Mazowieckie 1713.
6 1896.6 75834 37606 49.6 565.7 543.4 96.1
Opolskie 205.1 210.4 4313 1651 38.3 51.2 48.3 94.3
Podkarpackie 128.7 102.5 18348 6075 33.1 129.5 74.6 57.6
Podlaskie 1500.
6 1788.9 42679 24870 58.3 376.9 457.7 121.4
Pomorskie 225.1 237.9 4230 2411 56.9 78.6 75.8 96.4
Slaskie 180.5 182.6 10000 4931 49.3 70.5 53.9 76.4
Swietokrzyskie 186.5 165.5 19826 7151 36.1 105.8 79.4 75.1
Warminsko-
mazurskie 649.3 730.2 14436 8542 59.2 183.0 207.9 113.6
Wielkopolskie 1057.
6 1299.7 20942 12660 60.4 305.8 304.5 99.6
Zachodniopomor
skie 134.2 132.3 2079 783 37.7 44.3 43.4 97.9
Total 8346.
6 9108.6
35524
6
17010
6 47.9 2796.0 2657.3 95.0
Source: unpublished data of the AMAand the NAC (National Agricultural Census) 2010.

203
In the years 2004-2012, there were significant changes in the area of milk production and
marketing consisting in the fact that the number of wholesale suppliers decreased by 58.1%,
whereas the number of direct (individual) suppliers dropped by 84.7%. The number of cows
decreased in all provinces except for Kujawsko-Pomorskie (110.1%), Podlaskie (121.4%) and
Warminsko-Mazurskie (113.6%) province.
The process of milk production concentration in the regions of advantageous environmental
and economic conditions has been observed for over a decade in Poland. In 2012, milk
purchase in three provinces (Mazowieckie, Podlaskie and Wielkopolskie) constituted almost
51% of the total milk purchase in the country. In another four provinces (Lodzkie, Warminsko-
Mazurskie, Lubelskie and Kujawsko-Pomorskie) the total purchase constituted about 30%,
which was over 80% of the national production. Despite the fact that in the recent years the
amount of granted quotas for producers has risen by almost 16% on the national scale, the
structure of milk purchase has not changed. The system of quotas transfer, adopted in Poland,
in which quotas relate to individual regions, was particularly unfavourable for milk production
development and it inhibited the progressive regional specialisation. This system inhibited
market mechanisms, which forced the transfer of milk production to regions of favourable
environmental and economic conditions, where it was more cost-effective. It resulted in the
reduction of competitiveness of Polish dairy industry on a national and a micro scale because
the system affected both milk farms located in the regions of favourable conditions and the
producers in the regions with unfavourable conditions (AMA Report, 2013).
Changes in milk production level in individual provinces
Regulations in milk production quotas have contributed to restructuring changes in
agricultural farms which consisted in the reduction of the number of farmers maintaining cows,
the increase in the population of livestock as well as the increase in milk yield and commercial
production. Milk production diversification was particularly visible when the authors took
different provinces into account. General milk production only insignificantly dropped (by
6.6%) between the years 2004 and 2012, however, the decrease was noted in 10 out of 16
provinces with the highest in Podkarpackie (59.3%), Malopolskie (41.4%), Lubelskie (29.2%)
and Dolnoslaskie (21.2%) province. The increase in milk production, which was noted in 6
provinces, was observed among others in Podlaskie (69.7%), Mazowieckie (129.8%) and
Wielkopolskie (129.8%) provinces.
The process of milk production changes can be also analysed by calculating the production
rate achieved by farms per 1 ha. In this scope, there was a specific interrelationship consisting
in the fact that farmers, focused on milk production, achieved specific results related to the
substantial increase in this production. This growth reached 44.2% in Podlaskie province,
38.2% in Mazowieckie province, and 24.4% in Wielkopolskie province. The measurable result
of this dairy industry policy was the increase in milk yield from one cow per year. With the rise

204
by 18.7% on a national scale, the biggest increase in cows’ milk yield was noted in
Mazowieckie (40.9%), Wielkopolskie (35.4%) and Kujawsko-Pomorskie (22.9%) province.
Table 2.
The level of milk production and annual yield of milk from 1 cow in the years 2004-
2012
Province
Milk production in
million litres
Production per 1 ha
UAA in litres
Yearly milk yield
per 1 cow in litres
2004 2012 2004 2012 2004 2012
Dolnoslaskie 243.5 191.7 225 201 4228 4465
Kujawsko-
pomorskie 678.2 844.1 642 836 4178 5138
Lubelskie 1055.8 746.8 626 531 3901 4350
Lubuskie 137.1 116.3 256 240 4525 4032
Lodzkie 1101.6 942.9 916 956 4152 4555
Malopolskie 648.5 381.9 819 666 3539 3820
Mazowieckie 2051.0 2662.1 957 1323 3666 5166
Opolskie 320.1 262.7 526 507 5391 5493
Podkarpackie 579.9 236.3 605 388 3534 3709
Podlaskie 1339.3 2271.7 1454 2097 4240 4914
Pomorskie 345.5 329.7 432 441 4463 4325
Slaskie 321.4 241.6 613 640 4558 5065
Swietokrzyskie 446.7 313.5 683 629 4006 4287
Warminsko-
Mazurskie 747.7 948.4 825 914 4708 4442
Wielkopolskie 1294.1 1625.6 726 903 4259 5767
Zachodniopomorskie 216.5 183.0 209 211 4885 4390
Total 11526.9 12298.8 703 822 4082 4845
Source: Annals of Agriculture of the Central Statistical Office from the years stipulated in the table.
It is assessed that the greatest biological and technical progress was noted in the production
in agricultural farms with the introduced quotas. On one hand, the increase in milk yield was
observed and breeding conditions improved and on the other hand, there was increasing
production concentration, which allowed to reduce individual production costs. As a result of
these processes, farmers achieved added value on a significantly higher scale than in other
production sectors. The significance of milk market production increased, constituting 17% of
the general market agricultural production.

205
Description of entities purchasing milk
In the past, milk purchase market was fragmented as regards the entities from this area of
economic activity. They were usually regional dairy cooperatives located in almost every gmina
or poviat that collected milk from farmers using primitive means (carters). Currently, milk
production requires producers to maintain suitable sanitary and veterinary conditions in a
cowshed, ensure high level of animal welfare, appropriate feeding of cows and to have
correctly functioning milking and milk cooling system. Road tankers are used to collect milk
directly from a producer and they not only help to reduce purchase costs but also to maintain a
suitable temperature as well as physical and chemical properties of milk. Despite using modern
means of milk collection and transport, there is still a risk of deterioration of its quality
connected with inappropriate work organization during collection.
The accession of Poland to the European Union has led to far-reaching consolidation and
restructuring of milk market, which contributed to the elimination of small and outdated dairy
cooperatives. Emerging entities had to lower costs to withstand the competition from
successful, international companies on the common market. According to the data from the
register of milk collectors conducted by the AMA, the number of entities purchasing milk
between 2004 and 2013 insignificantly changed on a national scale, however, in certain
provinces the number changed substantially. The increase in the number of entities purchasing
milk was noted in 5 provinces, whereas the decrease was observed in the remaining provinces.
The highest decrease was noted in Dolnoslaskie province (by 40%). According to the data of
the Agricultural Market Agency, in 2013 there were 307 entities purchasing milk in the
register, including 163 dairy cooperatives, 98 commercial companies, 42 natural persons
conducting business activities, 3 branches of foreign companies and 1 agricultural industry
grouping. There were some changes in entities purchasing milk. In 2013, 29 new purchasing
entities were entered into the register, 9 entities were deleted and there were 2 cases of
consolidation of entities purchasing milk. In the ranking of large entities purchasing milk one
can distinguish Mlekpol (Grajewo), Mlekovita (Wysokie Mazowieckie), Lowicz, Piatnica or
Hochland Polska.
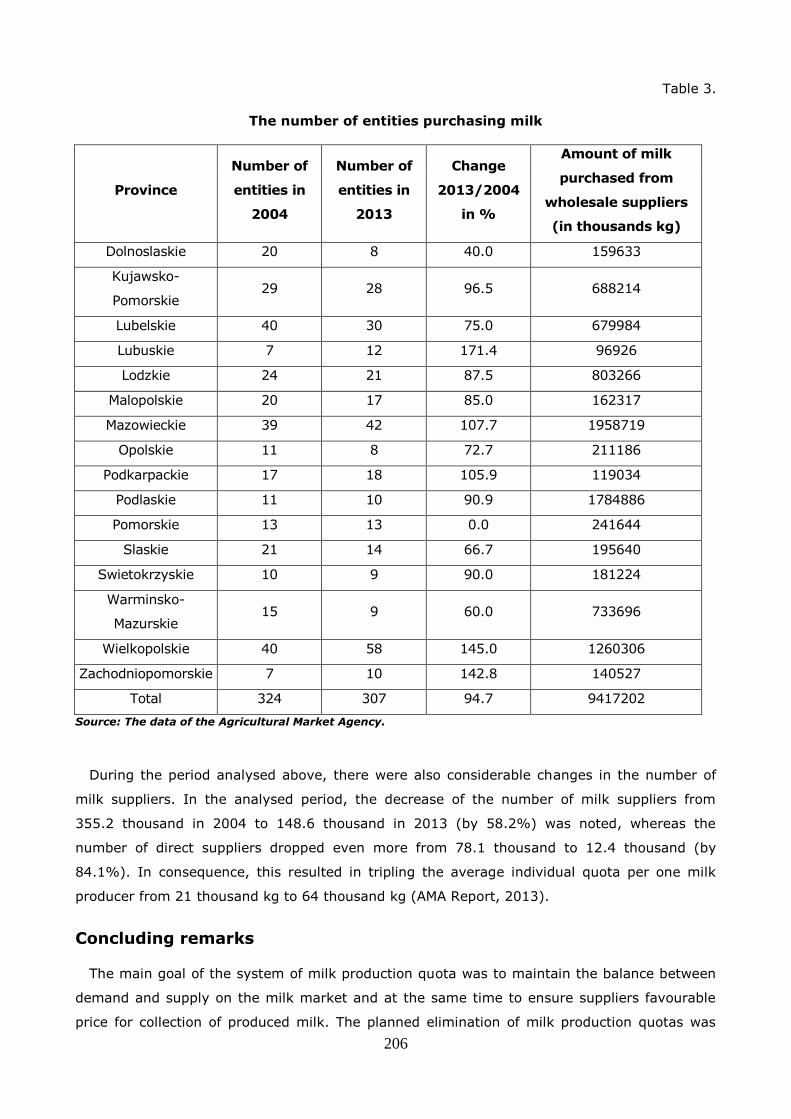
206
Table 3.
The number of entities purchasing milk
Province
Number of
entities in
2004
Number of
entities in
2013
Change
2013/2004
in %
Amount of milk
purchased from
wholesale suppliers
(in thousands kg)
Dolnoslaskie 20 8 40.0 159633
Kujawsko-
Pomorskie 29 28 96.5 688214
Lubelskie 40 30 75.0 679984
Lubuskie 7 12 171.4 96926
Lodzkie 24 21 87.5 803266
Malopolskie 20 17 85.0 162317
Mazowieckie 39 42 107.7 1958719
Opolskie 11 8 72.7 211186
Podkarpackie 17 18 105.9 119034
Podlaskie 11 10 90.9 1784886
Pomorskie 13 13 0.0 241644
Slaskie 21 14 66.7 195640
Swietokrzyskie 10 9 90.0 181224
Warminsko-
Mazurskie 15 9 60.0 733696
Wielkopolskie 40 58 145.0 1260306
Zachodniopomorskie 7 10 142.8 140527
Total 324 307 94.7 9417202
Source: The data of the Agricultural Market Agency.
During the period analysed above, there were also considerable changes in the number of
milk suppliers. In the analysed period, the decrease of the number of milk suppliers from
355.2 thousand in 2004 to 148.6 thousand in 2013 (by 58.2%) was noted, whereas the
number of direct suppliers dropped even more from 78.1 thousand to 12.4 thousand (by
84.1%). In consequence, this resulted in tripling the average individual quota per one milk
producer from 21 thousand kg to 64 thousand kg (AMA Report, 2013).
Concluding remarks
The main goal of the system of milk production quota was to maintain the balance between
demand and supply on the milk market and at the same time to ensure suppliers favourable
price for collection of produced milk. The planned elimination of milk production quotas was

207
one of the elements of the reform of milk market functioning under the common agricultural
policy. The amount of milk, which an individual Member State could place on the market
without bearing financial consequences, was specified within the framework of milk production
quota system. Within nine years of the functioning of milk production quota system in Poland,
the national quota increased by 11%, from 8.96 billion kg in the quota year 2004/2005 to 9.96
billion kg in the quota year 2012/2013.
The European Commission announced in advance the elimination of quotas from 2015.
Poland was negatively inclined towards such a decision, however, it did not gain support
among other Member States. At the same time, in the European Union the aid package for
milk producers was prepared that aimed at mitigating adverse effects of the reform.
Elimination of milk quotas is assessed from different points of view. The positive results include
the rise of milk supply, which will have an impact on the decrease of milk prices and the
increase of its consumption. Moreover, market liberalisation will exert a positive impact on the
effectiveness and competitiveness of dairy industry.
Liberalised system of market regulation enhances the possibilities of increasing the
production scale by large and medium farms and allows the return to milk production for other
farms. In other words, the system will enable the farmers eliminated from the market to return
to milk production. It will also have a positive influence on the process of concentration as
Polish dairy industry is still characterised by the high degree of fragmentation. The increase in
production concentration will allow to benefit from the effects of scale and it will be possible to
fully exploit the potential of the agricultural sector.
Bibliography
1. Berkowska, E. (1997). Regulacja Rynku Rolnego w Unii Europejskiej i w Polsce (Regulation
of Agricultural Market in the European Union and in Poland), Biuro Studiow i Ekspertyz Sejmu
(The Research and Expertise Office of the Sejm), no 489, Warsaw.
2. Council Regulation (EC) no 1234/2007 as of 22 October 2007 establishing a Common
Organisation of Agricultural Markets and Specific Provisions for Certain Agricultural Products.
3. Seremak-Bulge, J. (2014). Spozycie Mleka i Jego Przetworow (The Consumption of Milk and
its Products), Rynek Mleka (Milk Market), no 46.
4. Report on the Operations of the Agricultural Market Agency, 2013, AMA, Warsaw.
5. Sznajder, M. (2010). Skutki Likwidacji Kwot Mlecznych dla Polskiego Rolnictwa (The
Influence of Milk Quotas Elimination on Polish Agriculture), Biuro Analiz i Dokumentacji Senatu
(The Analyses and Documentation Office of the Senat in the Republic of Poland), Warsaw.
6. The Act of 11 March 2004 on the Establishment of the Agricultural Market Agency and the
Organization of Some Agricultural Markets.
7. The Act of 20 April 2004 on the Organisation of Milk Market and Milk Products.

208
Proceedings of the 2015 International Conference “ECONOMIC SCIENCE FOR RURAL DEVELOPMENT” No39
Jelgava, LLU ESAF, 23-24 April 2015, pp. 208-217
ANALYSIS OF ACTIVITIES IMPLEMENTED WITHIN THE AXIS III “THE QUALITY OF LIFE IN RURAL AREAS
AND DIVERSIFICATION OF THE RURAL ECONOMY” RURAL DEVELOPMENT PROGRAMME 2007-2013
Bartosz Mickiewicz*, PhD, Professor; Antoni Mickiewicz†, PhD, Professor
West Pomeranian University of Technology in Szczecin, Faculty of Economics
Abstract. The article deals with the authors’ discussion on the activities defined in the third
priority axis of the RDP 2007-2013. The mentioned axis included the implementation of four
activities which were directed at the diversification of rural areas economy and quality
improvement of rural inhabitants functioning in these areas. The aim of the paper was
presentation of research on the third priority axis in quantitative terms and the rate of the EU
funds implementation. The research was conducted taking into account the implementation of
tasks in quantitative and material (financial) terms. The comparison of the number of tasks in
the programme was made with reference to the number of decisions issued and it was
demonstrated that no task was fully implemented at the beginning of 2014. Better
performance of planned activities was noticed with measures realized by the Marshal’s Offices
of Poland’s provinces.
Key words: the quality of life, microenterprises, services for inhabitants, village renewal.
JEL code: Q18
Introduction
The quality of life improvement in rural areas is the aim, which is connected with both the
basic directions of economic and social development of agricultural farms through the
strengthening of economic potential, restructuring and modernization as well as with good life
conditions as far as the quality of environment, landscape, social and technical infrastructure is
concerned. These issues were also the goals of measures under some other funds, apart from
the EAFRD, like for instance the Cohesion Fund. The new EU policy in the scope of rural
development consisted in the preservation of the valuable factors influencing agrarian
changes, and the characteristic feature was that on the one hand the continuity was preserved
and on the other hand specific changes were implemented. The range of financial means was
still offered so the Member States could choose and obtain financial help from the integrated
Corresponding author. * Bartosz Mickiewicz. Tel.: +48 9144 96980; fax: +48 9144 96980.
E-mail address: [email protected]
209
rural development programmes. The way of developing these programmes was changed
through supporting the strategies and sustainable development of rural areas. To achieve this
aim, the policy of rural development concentrated on three, jointly determined main goals
focusing on improving agricultural competitiveness, supporting land management, and
improving natural environment condition. Each of the main goals was assigned to one thematic
axis. Such an approach allowed the EU co-financing of rural development to focus on the union
priorities, commonly agreed within the framework of the four thematic axes. Adopting the rural
development programme within priority axes ensured the freedom of determining measures at
Member States level. As a result, it was possible to achieve the balance between the sectoral
(agricultural restructuring), territorial (land management) and socio-economic dimension
(Mickiewicz, 2011).
Material and scope of research
The legal basis for adopting the programme of rural development was based on Council
Regulation (EC) No 1698/2005 on support for rural development by the European Agricultural
Fund for Rural Development (EAFRD) (Council Regulation (EC), 2005). The detailed principles
of implementing this regulation were established by the European Commission in 2006
(Commission Regulation (EC), 2006). In Poland, the legal basis for shaping rural areas was
adopted in accordance with the Act of 2007 on support for rural development financed by the
EAFRD (the Act, 2007). The act provided for the realization of 22 measures as well as technical
support. The rural development programme in 2007-2013 adopted the form of four priority
axes and involved the measures consistent with the logic of grouping the goals and tasks,
aiming at solving the problems faced by the Common Agricultural Policy. Under the RADP
2007-2013, the third thematic axis was subject to research which, on account of the number
of activities and the level of financial support, constituted the instrument aiming at increasing
the production potential and achieving added value. In terms of the sum of financial support
from public expenditure in the general amount of EUR 17.1 billion, EUR 3.4 billion (20.0%)
were earmarked for the third axis. Four measures (operations) constituted 18.2% of all
measures under the RDP.
The novelty of research results from a comprehensive evaluation of all activities included in
the third axis, which in Polish literature were not published and are available only in the
internal materials agricultural agencies and rural development. The authors based on the
materials presented a comprehensive assessment of the measures included in the third axis of
the RDP.
The research on the third priority axis was carried out in quantitative terms as well as taking
the rate of the EU funds implementation into consideration. The analysis was conducted on the
basis of the rural development programme and the data from the Management Information
System of the ARMA.

210
General characteristics of the third priority axis “The Quality of Life in Rural Areas and Diversification of the Rural Economy”
The third priority axis is not uniformed in terms of the analysed factors. The first group of
activities was related to the diversification of economic activities and the support for micro-
enterprises. In Poland, these activities constituted huge opportunities for the inhabitants of
rural areas, mainly due to large human resources and high unemployment level. The main
tasks included the development of non-agricultural activities and increasing added value to
products, for instance, by generating new job places, stimulating local and regional products
market, tourism, trade, advisory services and other services or the use of alternative energy
(Mickiewicz, 2014).
In this context, the measure aiming at guaranteeing jobs and income through the
development of non-agricultural activities constituted the priority. It was generally known that
agriculture will absorb increasingly smaller workforce and the strategic vision assumed
maintaining the vitality of rural areas. Therefore, non-agricultural activities should take the
burden of employing rural labour force. From that point of view, particularly essential was
comprehensive support for the process of creating off-farm job places in rural areas and
facilitating the employment in the local urban centres for people from rural areas. Tackling
unemployment in rural areas was undertaken by improving qualifications, facilitating access to
the labour market as well as creating off-farm jobs in rural areas. These activities constituted
one of the most important challenges for politics of rural development in the context of social
capital analysis. The support for enterprises providing forestry services, constituting in some
regions of the country an essential forest sector, was crucial for the development of non-
agricultural forms of activity in rural areas.
The second group constituted instruments designed to improve the quality of life in rural and
urban areas. They were related to village renewal, the improvement of cultural and natural
heritage condition as well as the improvement of rural infrastructure through the provision of
services for inhabitants. The measures fully took into account significant social and cultural
functions that certainly contributed to improving the quality of life and constituted an
additional factor, shaping structural changes, and they even created a sense of identification of
rural inhabitants with their region with its traditions and values. In Poland, both the
instruments for job creation and improving the quality of life were related to each other and
implemented with the preservation of complementarity with the measures under other funds,
for instance, the Cohesion Fund (RDP).
The specific nature of measures involved in the third thematic axis of
the RDP 2007-2013
The characteristics of measures within the framework of the third axis indicate various
reactions of beneficiaries on the proposals of submitting applications, which were announced
by the Agency for Restructuring and Modernization of Agriculture. The measure “Diversification
towards Non-agricultural Activity” was given priority in the third RDP axis. The aim of the

211
measure was to diversify agricultural activity to initiate or develop activities outside agriculture
by farmers or members of their family, which aimed at the creation of non-agricultural sources
of income and promoting employment outside agriculture but in rural areas (RDP, 2007). In
accordance with the regulation of the Minister for Agriculture and Rural Development as of 17
October 2007, a farmer, a member of his family or a farmer’s wife could apply for aid within
the meaning of law regulations on social insurance of farmers. A beneficiary had to meet
certain requirements, e.g. he had to live in rural areas and be adult but below 60. Another
requirement, among others, was that a beneficiary could not apply for obtaining structural
rents. The financial aid, which a beneficiary obtained, had the form of refund of some costs of
qualified operations. The maximum amount of aid granted to one beneficiary in agricultural
enterprise, in the period of programme implementation, could not exceed PLN 100 thousand
(EUR 25 616.1). The level of financial aid amounted to a maximum 50% of eligible costs of
operations (MARD Regulation, 2007).
Another goal of the third RDP axis related to supporting the economic competitiveness in
rural areas, developing entrepreneurship and job market and, consequently, increased
employment in rural areas. Under this measure financial aid was granted to entities for
investments related to the creation or development of micro-enterprises. The implementation
of “Formation and Development of Micro-enterprises” measure created conditions for
diversification of economic activity and improvement of employment opportunities, thus,
contributing to sustainable socio-economic development of rural areas. The aid was granted to
entities for investments related to creation or development of micro-enterprises that provided,
among others, services for agricultural enterprises or forestry, services for people,
construction, tourism or transport services as well as wholesale and retail sale. The MARD
Regulation as of 17 July 2008 stipulated specific conditions and procedures for the granting of
financial aid. A microentrepreneur was considered an entrepreneur within the meaning of the
European Commission Recommendation 2003/361/EC as of 6 May 2003 concerning the
definition of small and medium-sized enterprises. However, to calculate the average annual
employment and estimate the net turnover, aiming at determining the status of a
microentrepreneur related to the granting of aid, the regulations on freedom of economic
activity were applied. Any individual or entities living in rural or rural-urban gminas could apply
for aid (MARD Regulation, 2008). In order to facilitate the access to the measure, a new MARD
regulation on 24 March 2010 was issued that specified the requirements concerning job places
planned for the creation and functioning of micro-enterprise.
The aid had the form of refund of some part of operational costs. The amount of the aid
granted for the implementation of operations could not exceed 100 thousand zlotys if the
business plan provided for the creation of 1 or 2 job places, calculated as full time annual
average equivalents, PLN 200 thousand for 2-5 job places and PLN 300 thousand if at least 5
job places were created (RDP, 2007). Under this measure, 45.4 thousand applications were
submitted, from which 12.6 thousand (27.7%) were approved by the Agency.
212
Another measure related to the removal of barriers in rural areas through the formation of
basic technical infrastructure elements, such as construction of waterworks or sewerage, the
development of waste segregation system and energy production from renewable sources
(RES). The criterion for aid obtaining was the place of operations (investment) implementation,
according to which the aid could be granted for the operation implemented in a location
belonging to rural or rural-urban gmina. Aid applications were accepted and processed by
Marshal’s Offices of the Poland’s provinces. The score-based assessment of the planned
investment was the criterion for the granting of aid in which basic gmina’s income, the
unemployment rate and the regional criterion, established by the Management Board of the
Province Marshal’s Office, were taken into account. In order for an operation to be qualified, it
had to obtain minimum 4 points in the case of investments related to water and sewage
management or 3 points for investments related to the creation of the system of collection,
segregation or export of municipal waste. With regard to operations related to basic services
for economy and rural inhabitants, 21.2 thousand contracts were provided for acceptance. In
the end, the criterion was met by 5.4 thousand entities (25.5%). As a result, 3.9 thousand
contracts (73.3%) were signed.
The assumption of the measure “Village Renewal and Development” was the creation of
conditions for the development of socio-economic rural areas and stimulation of rural areas
residents through investment support, granted for the implementation of operations related to
space management, including maintaining, restoration and improvement of the condition of
cultural and natural heritage as well as increasing the tourist attractiveness of rural areas.
Moreover, the aim of the measure was to improve the quality of life in rural areas through
meeting social and cultural needs of rural inhabitants. The aid was granted to gminas, cultural
institutions, churches or non-governmental organisations of the public benefit status. The
amount of aid could not exceed PLN 500 thousand and could not be smaller than PLN 25
thousand for one measure. Aid applications were accepted by Marshal’s Offices of the Poland’s
provinces. The score-based assessment of the planned operation (investment) was essential
for the granting of aid and it was issued taking into account gmina’s tax income, the rate of
unemployment of the given gmina’s poviat as well as the regional criterion. The new criterion,
for which an operation could get an additional point, was declaration that the amount
requested on each stage of investment realization will not exceed 50% of the eligible costs.
6.3 thousand (74.6%) out of 8.5 thousand applications were approved by Marshal’s Office.

213
Table 1
The number of measures to be implemented and completed
under the third RDP axis 2007-2013
Name of the
third axis
measure
Planned
number of
measures
(operations)
to be
realised
Number of
submitted
applications
The percent
of submitted
applications
in relation
to the plan
Number of
decisions
issued
The
percent of
issued
decisions in
relation to
submitted
application
s
Who was
responsible
for the
realisation of
measures
Diversification
towards non-
agricultural
activity
19 750 30 029 152.0 15 087 50.2 ARMA
Formation and
development
of micro-
enterprises
27 300 45 454 166.5 12 573 27.7 ARMA
Basic services
for the rural
economy and
inhabitants
21 210 5 402 25.5 3 959 73.3 Province self-
governments
Rural
development
and renewal
9 670 8 467 87.5 6 315 74.6 Province self-
governments
Axis 3 in total 77 930 80 885 103.8 37 934 46.9
Source: The RDP 2007-2013 and the ARMA Management Information System
For the total number of planned measures (operations) under the third RDP axis at the level
of 77.9 thousand, the potential beneficiaries submitted 80.9 thousand (103.8%) applications,
indicating at the same time the willingness to participate in competitions announced by the
Agency. The relative high level of acceptance (over 73%) was gained by the applications
submitted to Marshal’s Offices of the Poland’s provinces mainly by the local action groups. The
correlation between the measures and the local community brought tangible results for bigger
communities. At the lower level, however, the completion of activities was noted in the case of
the measures realized by the ARMA (38.9% on average) due to high formal requirements and
the need to make a business plan by future entrepreneurs.

214
The financial aspect of the completion of measures under the third RDP axis 2007-2013
Initially, a total of EUR 4 799.3 million, including EUR 3 430.2 million of European sources
(EAFRD) as well as EUR 1 369.2 million of own funds, were earmarked for the implementation
of the third RDP axis in 2007-2013. In 2011, the budget was amended by increasing the
resources for the measure related to the services for rural inhabitants from EUR 1 471.4
million to EUR 1 614.0 million (by 8.8%). There was a close link between the measures under
the third axis and another Leader Axis 4. The implementation of measures under the third axis
aimed at the diversification of rural economy and improvement of rural quality of life through
the support for creation and development of non-agricultural activity as well as products and
tourist infrastructure. Moreover, the measures realised were directed at ensuring the basic
services for rural areas and the related small infrastructure. They also involved projects and
investments connected with the programme of improving the quality of life in rural areas. The
improvement of the quality of life in rural areas was the aim related to the basic directions of
economic and social development of agricultural farms through the strengthening of economic
potential, restructuring and modernization. The synergy consisted in combining good life
conditions in rural areas with the quality of environment and landscape as well as social and
technical infrastructure. The instruments available under the third axis are complementary to
the priorities defined under the first two axes and may together positively influence the rural
population. It was expected that the stimulation of economic activity in rural areas will
indirectly influence the possibility of concentration of agricultural production and the transfer of
many people involved in agriculture to work in other sectors of economy. The activities were
designed in such a way to create conditions for changes in the agricultural sector, including in
particular the reduction of hidden unemployment rate, extension of agricultural land, its
modernization, and improvement of competitiveness and market orientation of production. The
essence of the measures in the third axis consisted in transferring the activities to local action
groups and only in that way one could apply for financial support.
The Structural Funds granted to Poland were in euro, and thus, there was a need to annually
convert them to PLN in accordance with the exchange rate specified by the European Central
Bank. In the individual years Euro exchange in accordance with the European Central Bank
was as follows:
2007 2008 2009 2010 2011 2012 2013
3.773 3.396 4.229 3.984 4.405 4.019 4.185
The average Euro exchange rate converted to Polish zloty in the years 2007-2013 was PLN
3.999, which was rounded to PLN 4.0, and the conversion in the table below was based on this
exchange rate.
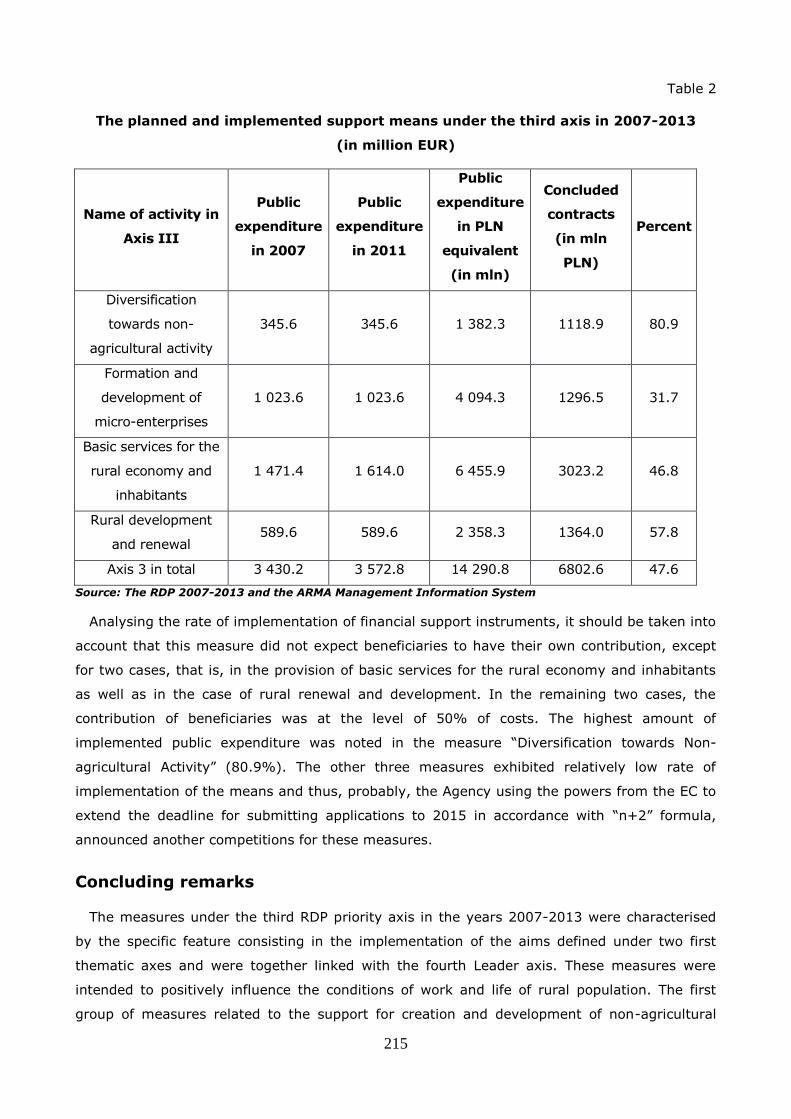
215
Table 2
The planned and implemented support means under the third axis in 2007-2013
(in million EUR)
Name of activity in
Axis III
Public
expenditure
in 2007
Public
expenditure
in 2011
Public
expenditure
in PLN
equivalent
(in mln)
Concluded
contracts
(in mln
PLN)
Percent
Diversification
towards non-
agricultural activity
345.6 345.6 1 382.3 1118.9 80.9
Formation and
development of
micro-enterprises
1 023.6 1 023.6 4 094.3 1296.5 31.7
Basic services for the
rural economy and
inhabitants
1 471.4 1 614.0 6 455.9 3023.2 46.8
Rural development
and renewal 589.6 589.6 2 358.3 1364.0 57.8
Axis 3 in total 3 430.2 3 572.8 14 290.8 6802.6 47.6
Source: The RDP 2007-2013 and the ARMA Management Information System
Analysing the rate of implementation of financial support instruments, it should be taken into
account that this measure did not expect beneficiaries to have their own contribution, except
for two cases, that is, in the provision of basic services for the rural economy and inhabitants
as well as in the case of rural renewal and development. In the remaining two cases, the
contribution of beneficiaries was at the level of 50% of costs. The highest amount of
implemented public expenditure was noted in the measure “Diversification towards Non-
agricultural Activity” (80.9%). The other three measures exhibited relatively low rate of
implementation of the means and thus, probably, the Agency using the powers from the EC to
extend the deadline for submitting applications to 2015 in accordance with “n+2” formula,
announced another competitions for these measures.
Concluding remarks
The measures under the third RDP priority axis in the years 2007-2013 were characterised
by the specific feature consisting in the implementation of the aims defined under two first
thematic axes and were together linked with the fourth Leader axis. These measures were
intended to positively influence the conditions of work and life of rural population. The first
group of measures related to the support for creation and development of non-agricultural

216
activity. The second group constituted instruments aiming at improving the quality of life. They
were related to village renewal, the improvement of cultural and natural heritage as well as
facilitating the access to public utility services, such as water and renewable energy supply,
waste collection and waste management. At least two basic aims under the third axis were
realized, namely the diversification of rural economy and the improvement of rural population’s
quality of functioning.
According to the authors the assessment of the functioning of measures under the third RDP
axis 2007-2013 should be considered in the context of the Council Regulation (EC) from 2005
and the Commission Implementing Regulation from 2006 and it should be stated that this
priority axis met the requirements of the European Union. Four measures, intended to
influence one another synergically and lead to new developments in agriculture and rural
areas, were involved in the measures related to the quality of life in rural areas. The Member
States could develop their own measures meeting their needs, while at the same time
maintaining general objectives of the Common Agricultural Policy (CAP). The amount of
granted aid was EUR 3.4 billion, which constituted 18.2% of the total amount in the adopted
rural development programme.
In authors’ opinion the advantage of the analysed measures was that the programmes were
available in the whole country. Moreover, it was possible to allocate the means in different
axes and measures. Submission of applications and the rate of implementation of the
European funds were not always in accordance with the programmes’ assumptions. The third
and fourth measure was assessed to have been well implemented in quantitative and financial
terms. However, future beneficiaries were not always prepared in organizational terms and
mentally to meet the challenges related to programmes of creating micro-enterprises. The
confirmation of the need for changes was the measure undertaken by the Monitoring
Committee, which made allocations in axes and measures, aiming at taking full advantage of
the instruments of financial aid of the RADP 2007-2013.
Bibliography
1. Council Regulation (EC) No 1698/2005 as of 20 September 2005 r. on Support for Rural
Development by the European Agricultural Fund for Rural Development (EAFRD).
2. Council Regulation (EC) No 1974/2006 as of 15 December 2006 r. laying down detailed
rules for the application of Council Regulation (EC) no 1698/2005 on Support for Rural
Development by the European Agricultural Fund for Rural Development (EAFRD).
3. Mickiewicz, A. (2011). Przebieg i realizacja dzialan w ramach I i II filara wspolnej polityki
rolnej (The Course and Implementation of the Activities under the First and Second Pillar
of the Common Agricultural Policy), Szczecin: ZUT (WPUT).
4. Mickiewicz, B. (2014). Analiza porownawcza Programu Rozwoju Obszarow Wiejskich 2007-
2013 w stosunku do PROW 2014-2020 (Comparative Analysis of the Rural Development
Programme 2007-2013 in Relation to the RDP 2014-2020), Warszawa: Marketing I Rynek,
nr. 10/2014

217
5. Program Rozwoju Obszarow Wiejskich (Rural Development Programme), (2007).
Ministerstwo Rolnictwa i Rozwoju Wsi (Ministry of Agriculture and Rural Development),
Warsaw. Retrieved: http://www.minrol.gov.pl/Wsparcie-rolnictwa-i-rybolowstwa/PROW-
2007-2013/Dokumenty-analizy-raporty.
6. Regulation of the Minister for Agriculture and Rural Development as of 17 October 2007 on
the Detailed Conditions and Procedures for the Granting of Financial Assistance under the
Measure "Diversification towards Non-agricultural Activity" under the Rural Development
Programme in 2007-2013.
7. The Act as of 7 March 2007 r. on Support of Rural Development Financed by the European
Agricultural Fund for Rural Development (EAFRD).
8. The ARMA Regulation as of 17 July 2008 on the Detailed Conditions and the Mode of
Granting and Paying Financial Support under the Action “Formation and Development of
Micro-enterprises” under the RDP 2007-2013.

218
Proceedings of the 2015 International Conference “ECONOMIC SCIENCE FOR RURAL DEVELOPMENT” No39
Jelgava, LLU ESAF, 23-24 April 2015, pp. 218-226
INSTRUMENTAL VALUE OF CULTURAL HERITAGE AS A PROMOTER OF
SME IN RURAL TERRITORIES
Laura Jeroscenkova*, Phd student; Maiga Kruzmetra2, assistant professor emeritus; Baiba
Rivza3, professor; Vilija Alekneviciene4, professor ; Agnieszka Parlińska5, assoc.professor 1,2,3 Faculty of Economics and Social Development, Latvia University of Agriculture
4 Faculty of Economics and Management , Aleksandras Stulginskis University 5 Faculty of Economic Sciences, Warsaw University of Life Sciences
Abstract. The modern world is characterised by two trends: globalisation and accentuation of
cultural heritage, which are quite closely interrelated. The more the similar features become
apparent under globalisation, the more people tend to show their local distinctions. At the
same time, a distinctive feature caused by causal relationships may be observed as well:
owing to the interaction of the mentioned trends, favourable conditions emerge for the
development of small entrepreneurship and crafts. The authors conducted a survey of young
individuals (aged 15-24) in Poland (n=200), Lithuania (n=100) and Latvia (n=174) and came
to a conclusion that the demand for the instrumental value of cultural heritage might be
assumed as one of the factors promoting small entrepreneurship and crafts, to a greater or
smaller extent, in all the countries involved in the present research.
Key words: cultural heritage, instrumental value, small entrepreneurship, crafts.
JEL code: M31, L83
Introduction
Rural development problems are a persistent focus for both political and economic bodies of
the European Union. The EU Rural Development Policy 2007-2013 was focused on improving
the competitiveness of the agricultural and forestry sector, the environment, the quality of life
in rural areas and encouraging diversification of the rural economy (Rural Development....).
The Parliament of the European Union has appealed to continue this policy in the second
decade of the 21st century promoting the rural area as a place for diverse and inclusive
development of economic and living space to maintain rural communities (European Parliament
resolution (2010/2054(INI)). It has to be taken into consideration that rural areas represent
93% of the territory of the EU-27, with 20% of the population living in predominantly rural
areas and 38% in significantly rural areas (ECORYS. Study on..., 2010). As the number of
individuals employed in agriculture declines owing to agricultural production modernisation, an
* Corresponding author. Tel.: (+371 20255259).

219
essential role is played by the diversification of economic activities in rural areas, and small
entrepreneurship and crafts obviously emerge as one of such economic pathways, which
exploit cultural heritage as a product (both as a good and as a service). The aim of the
research: to assess the prospects for preserving the cultural heritage from the viewpoint of
young members of society. To achieve the aim, the authors set three tasks: to identify
similarities and differences in the viewpoints of young individuals regarding the cultural
heritage as a value; to locate the places for obtaining information on the phenomenon
examined and to assess the opportunities for the development of small entrepreneurship and
crafts in rural areas. The method of research: a survey of 15-24 year-old youths (n=200 from
Poland, n=100 from Lithuania and n=171 from Latvia) was conducted to obtain information.
The data acquired in the survey give insight into the attitudes to cultural heritage among the
general public and within each respondent group and reveal the key activities for raising the
popularity of cultural heritage both among the general public and especially among the youth.
The data were processed employing the methods of descriptive statistics.
Methodology of the research. Theories on globalisation and cultural capital served as the
theoretical basis. One of the major changes taking place on the global scale is designated as
globalisation. Economists (Reinert E.S., Frankel J.A.), sociologists (Gidens A., Castells M.,
Jameson F., Luke M., Steger M. B.) and national identity researchers (Tomlinson J., Popovic
D.M., Muizniece L.) write about globalisation as an important phenomenon. All the authors
designate globalisation as the modern world’s development process that is characterised by
the interaction of all spheres and expansion beyond the national boundaries. One of the
leading researchers of globalisation, Manfred Steger, underlines that „the transformation
powers of globalisation reach deeply into all dimensions of contemporary social life” (2013).
Globalisation is characterised by two trends of change. The first one is the growing flow of
goods, services, capital, money and individuals among countries, the trend of equalisation that
emerges from the transfer of techniques and technologies from others, which is usually viewed
as a positive trend. However, a number of negative effects of this process are highlighted,
especially in the social sphere – the increasing geographical movement of labour force and the
formation of ethnically and nationally mixed societies (Reinert E.S., Castells M., 1997). John
Tomlinson writes that “globalization has been associated with the destruction of cultural
identities, victims of the accelerating encroachment of a homogenized, westernized, consumer
culture” (Tomlinson J., 2003:269).
Consequently, as a response process to this second globalisation trend, the trend of
preserving and strengthening the national identity and of appreciating the cultural heritage
emerges to ensure their transfer to next generations, stressing the role of cultural heritage in
preserving the local identity. The national identity is strongly associated with the national
country, a single ethnic community and a single culture, whereas globalisation erases these
traditional boundaries, supposing that national identity and cultural uniqueness are possible

220
only in relation to some locality, whereas globalisation as deterritorisation (decreasing the role
of territory) melts national uniqueness (Muizniece L., 2005).
The concept of heritage leads us to a discussion of the continuity between past and present.
Heritage provides historical depth and a permanent pattern in a perpetually changing world.
Heritage is part of the present, and at the same time holds promises for the future; the
problem of the past is a modern one (Besiere J., 1998). Cultural heritage valuation is based
on two main categories – cultural-historical values and socio-economic values (Szmelter I.,
2013).
The European Heritage Days forum (2008) initiated by the European Council/ European
Commission declares that the concept of cultural heritage continues developing and the totality
of the elements that relate to cultural heritage expands and points that heritage is a mediator
to support identity but heritage is also part of everyday life (European Heritage Days).
In this regard, the European Expert Network on Culture has prepared a report on
publications that focus on analyses of social and economic values of cultural heritage. This
document points that many authors distinguish the difference between the intrinsic value of
heritage as collective memory of the society and its instrumental value, which is expressed in
the social and economic value of cultural heritage (European Expert Network on Culture).
Having the main aim of the present research – to explain the prospects for the cultural
heritage from the viewpoint of young members of society –, it is understandable that the
research focuses mostly on the prospects of the socio-economic value of cultural heritage,
which helps build smart living territory. Earlier research studies conducted in Latvia presented
a close interaction of the cultural heritage with small entrepreneurship and crafts
(Jeroscenkova L., Kruzmetra M., Rivza B.). The purpose of the authors is to assess this
phenomenon in a broader territory, which opens up possibilities for comparison – the
identification of similarities and differences as well as of pathways for the perfection of
processes.
Especially this activity expanded with initiating the government-funded research project “Rural
and Regional Development Processes and Opportunities in the Context of Knowledge Economy”
whose one of the key goals is the development of a strategy for smart rural and regional
development to obtain an integral vision, including social and economic values of cultural
heritage (EKOSOC-LV 5.2.3.).
Research results and discussion
In identifying opinions, young individuals’ choices are examined by an objective factor – this
segment of society will shape and determine future processes both in general and in individual
spheres of life. In the present research, this refers to the prospects of preserving the cultural
heritage as a value.

221
1. Similarities and differences in the viewpoints of young individuals
regarding cultural heritage as a value
In all the three countries, all the youths surveyed, without exception, recognised cultural
heritage as a value to be preserved. Yet, among the youths, cultural heritage is dually
perceived, which is outlined as a research problem by a relatively large number of scientists
(Dümcke C., Gnedovsky M.). One of these aspects is the classification of cultural values into
intrinsic and instrumental values, in which the former ones are understood as historical values
that mainly serve for the purpose of preserving both the ethic and territorial identity, while the
latter ones mostly pursue contemporary socio-economic values oriented towards practical uses
(Szmelter I.).
Table 1
Percentage distribution of the assessments of cultural heritage
Country Cultural heritage as a
value
Including as an:
intrinsic value instrumental
value
Poland 100.0 19.5 63.0
Lithuania 100.0 34.0 57.0
Latvia 100.0 28.7 37.4 Source: authors’ calculations based on the survey data
According to the survey, the youths in all the three countries mainly focus on cultural
heritage as a usable value. Unfortunately, the level slightly differs in each country, with the
maximum observed in Poland and the minimum in Latvia. Even though the instrumental value
of cultural heritage is preferred, at the same time, the youths are quite interested in cultural
heritage as a factor shaping individuals’ sense of belonging.
2. Information on the space for acquiring cultural heritage
On the one hand, a huge increase in cultural activities is observed in an information society,
in which individuals are presently living; culture becomes increasingly important to the modern
society. On the other hand, the role of ICT (information and communication technologies) in
spreading information and in contributing to the exchange of cultural riches increases (Castells
M., 2000). Today, mass media play a tremendous economic role in the field of cultural heritage
as well. The more information and more explicit and specific information the sources of
information have, the better people understand and the greater interest they have in this
phenomenon. If information seekers are interested in the instrumental value of culture, the
available information makes a link between the demand for instrumental cultural heritage and
the supply of existing or potential business flows.

222
Table 2
Percentage distribution of the sources of information on cultural heritage (several
replies possible)
Internet
portals
TV
channels
Various
newspapers
Advertising
stands
Web
pages
Lectures
Latvia
All respondents 60.2 74.5 33.0 40.1 16.3 25.2
incl. men 68.3 75.0 38.3 13.3 23.3 23.3
women 58.1 74.4 31.6 47.0 14.5 25.6
Poland
All respondents 88.0 62.5 13.5 20.0 36.0 30.5
incl. men 88.9 33.1 14.8 17.3 30.9 25.9
women 87.3 68.9 12.6 21.9 39.5 33.6
Lithuania
All respondents 43.0 62.0 13.0 18.0 23.0 53.0
incl. men 42.9 42.9 14.3 28.6 42.9 42.9
women 43.5 65.9 12.9 16.5 20.0 55.3 Source: authors’ calculations based on the survey data
The data obtained in the survey show that the youths use a wide range of sources to get
information on cultural heritage as a value, preferring such modern information sources as TV
shows and Internet portals. This is possible due to quite good ICT available in all the three
countries where the youths were surveyed for the present research (Measuring…). To get
information on cultural heritage values, far fewer youths use traditional sources such as
newspapers, adverting stands and lectures, which are usually the information channels
preferred by older individuals.
Yet, the youths quite critically assess the information available in information sources,
saying that, first, it is insufficient (47.4% in Latvia, 26.5% in Poland and 31.0% in Lithuania),
second, advertisements are too monotonous/unattractive (36.3% in Latvia, 47.5% in Poland
and 17.0% in Lithuania) and, third, the advertisements are ineffective from the perspective of
marketing (64.9% in Latvia, 53.0% in Poland and 43.0% in Lithuania). In general, the youths
would wish more information on cultural heritage products and particular purchase sites of
goods/services, the available assortment, specifics of goods or services and the development
of the goods and services offered. These demands confirm the increasing interest of the new
generation in the instrumental side of cultural heritage values.
3.Interest in cultural heritage and in opportunities for developing small
entrepreneurship and crafts in rural territories
If the society, including the community of young people, is interested in the instrumental
values of cultural heritage, there is an opportunity to offer these values to the society as goods
or services. Analysing the purchase sites of cultural heritage products mentioned by the
respondents, two nuances may be observed; first, various fairs prevail and, second, purchase
sites of products related to gastronomic interests, including sales held directly on farms, are
significant.

223
Table 3
Purchase sites of cultural heritage products
Country At
specialised
stores
At the
market
place
At a
supermarket’s
section for
organic goods
From
farmers
At a
green
fair
Latvia 23.4 33.3 8.8 24.6 43.9
Poland 16.0 40.0 18.0 21.0 4.5
Lithuania 27.0 35.0 16.0 17.0 39.0 Source: authors’ calculations based on the survey data
Farmer’s markets play an increasingly greater role in purchasing healthy food but healthy
food, to a great extent, is a product with cultural heritage specifics that has been consumed
before various modern additives were introduced in production (Vecchio R.). Farmer’s markets
or green fairs play also an economic role. Scientist Alicia Miller writes that “for most small-
scale farmers and producers, the local farmers’ market is the engine of their business. The
opportunity to sell direct to customers offer not only a fair price for their products, but also a
chance to develop personal relationships with their customer base, many of whom will
return week on week. (Miller A.).
If taking into consideration that a great deal of the respondents who used the shopping
sites mentioned in Table 3 recommend them to other individuals, usually to their relatives and
acquaintances, one can predict an increase in activities of small entrepreneurship and food
crafts in rural territories. Youths in Lithuania are most proactive towards attracting new
purchasers (79.9%). Youths in Latvia and Poland present lower readiness for such an activity,
yet, of the surveyed youths, 40.0% in Poland and 52.6% in Latvia are ready to do it.
Table 4
Readiness to recommend other members of society to buy cultural heritage products,
%
Country Total Including
men women
Latvia 52.6 46.3 54.9
Poland 40.0 40.7 39.5
Lithuania 79.0 71.4 80.2 Source: authors’ calculations based on the survey data
Women present slightly greater interest in cultural heritage as a value and in the
instrumental value of it, which might be explained by the gastronomic part of cultural heritage
that was in the spotlight of public attention due to the increasing popularisation of healthy
lifestyle. The survey results confirm that this fact corresponds to the opinions of youths in all
the three countries.
Conclusions, proposals, recommendations
1. In the opinion of youths from all the three countries, cultural heritage as a value is
important, which one more time confirms the known fact – the increasing role of

224
cultural heritage is the overall trend on the global scale. At the same time, there are
several distinctions, which, as one can see, are determined by individuals’ sense of
belonging to a particular territory. The cultural and historical approach is mainly
specific to Lithuania (34.0%), while the instrumental one is observed in Poland
(63.0%). However, in Latvia, a great deal of youths (33.9%) had no opinion on the
dual perception of cultural heritage values.
2. Just like in any sphere of activity, in the field of cultural heritage, too, the
information base providing accessible, broad in scope and interesting information,
given the demands of information users, plays an essential role. The survey data
make us think that the present quantity of information and the quality of it do not
fully satisfy youths in any of the countries researched. Information is needed in
greater quantities and of higher quality, which sets certain standards for information
systems in Poland, Lithuania and Latvia as well.
3. An important precondition for economic growth is the equilibrium of demand and
supply. In the community of youths, an increase in the demand for cultural heritage
as a product indicates greater opportunities for small entrepreneurship and crafts, as
particularly demand contributes to starting up a business or its expansion. There are
special opportunities for food crafts, the expansion of which is very important for the
rural territories with small agricultural holdings.
4. It would be useful to expand research on this problem in order to, first, explain the
opinions of different generations by analysing in detail the opinions both on the
historical aspect of the value of cultural heritage and on the socio-economic vision on
the value of cultural heritage. Besides, no less important is to examine how small
entrepreneurship and food crafts develop if using cultural heritage as a product.
Acknowledgments
The preparation of the paper was supported by the National Research Programm 5.2.
Economic Transformation, Smart Growth, Governance and Legal Framework for the State and
Society for Sustainable Development-a New Approach to the Creation of a Sustainable
Learning Community, Project EKOSOC_LV
Bibliography
1. Bessiere, J. (1998). Local Development and Heritage: Traditional Food and Cuisine as
Tourist Attraction in Rural Areas. Sociologia Ruralis. Vol.38, No 1. pp. 21 – 34.
2. Castells, M. (1997). The Power of Identity, vol. II The Information Age: Economy,
Society and Culture. Oxford: Blackwell. p.538.
3. Castells, M. (2000). The Role of the Network Society, vol.I. The Information Age:
Economy, Society and Culture. Malden: Blackwell. p.594.
4. Dümcke, C., Gnedovsky, M. (2013). The Social and Economic Value of Cultural
Heritage: literature review. EENC Paper, July 2013 Retrieved:

225
http://www.eenc.info/wp-content/uploads/2013/08/CD%C3%BCmcke-MGnedovsky-
Cultural-Heritage-Literature-Review-July-2013.pdf. Access: 15.12.2014.
5. ECORYS (2010). Study on Employment, Growth and Innovation in Rural Areas. Main
Report. [ESEGIRI] Retrieved:
http://ec.europa.eu/agriculture/analysis/external/employment/full-text_en.pdf. Access:
17.12.2014.
6. European Commission. (2011). Survey and Outcomes of Cultural Heritage Research
projects Supported in the Context of EU Environmental Research Programmes. From
5th to 7th Framework Programme. European Union. p.56.
7. European Expert Network on Culture. (2013). The Social and Economic Value of
Cultural Heritage: literature review by Cornelia Dumske and Mikhail Gnedovsky. EENC
Paper, July 2013. p.145.
8. European Heritage Days. (2008). A Joint Action of the Council of Europe and the
European Commission. First European Heritage Forum on “Heritage and Dialogue”.
Brussels (Belgium), 23-24 October 2008. General Rapporteur François Matarasso ‘Open
Doors and Open Minds. Strasbourg: Council of Europe / European Commission (32
pp.) Retrieved:
http://www.coe.int/t/dg4/cultureheritage/heritage/ehd/DGIV_PAT_JEP2008_20rev_E_fi
nalreport_MATARASSO.pdf. Access: 17.12.2014.
9. European Parliament Resolution on the Role of Women in Agriculture and Rural Areas
(2010/2054(INI)). Retrieved:
http://eurlex.europa.eu/LexUriServ/LexUriServ.do?uri=OJ:C:2012:296E:FULL:LV:PDF.
Access: 19.12.2014.
10. Frankel, J.A. (2000). Globalization of Economy. National Bureau of Economic Research,
Working Paper 7858. Cambridge. Retrieved: www.nber.org/papers/w7858.pdf.
Access: 25.12.2013.
11. Jameson, F., Miyoshi, M. (Eds.) (1998). The Cultures of Globalization. London: Duke
University Press. p.393.
12. Jeroscenkova, L., Kruzmetra, M., Rivza, B. (2013). Enhancing the competitiveness of
tourism through cultural heritage as a tourism product. Rural Development 2013:
Innovations and Sustainability. Proceedings of the 6th International Scientific
Conference. Kaunas: Akademija. Vol. 6, Book 1, pp.163 -167.
13. Kruzmetra, M., Rivza, B., Jeroscenkova, L. (2013). Culture Heritage as a Product of
Rural/Farm Tourism: the Case of Latvia. Proceedings of the 14th International Joint
World Cultural Tourism Conference. World Cultural Tourism Association, pp.27-37.
14. Kruzmetra, M., Rivza, B., Rivza, L. (2013). Culture Heritage as an Important Product of
Rural Tourism. Rural Development and Entrepreneurship. Marketing and Sustainable
Consumption. Proceedings of the International Scientific Conference „Economic Science
for Rural Development” No 32, pp.83-88.
15. Luke, M. (2010). The Sociology of Globalization. Cambridge: Polity Press. p.366.
16. Measuring the Information Society Report 2014. ITU Geneva, Switzerland. Retrieved:
http://www.itu.int/en/ITUD/Statistics/Documents/publications/mis2014/MIS2014_witho
ut_Annex_4.pdf. Access: 19.12.2014.
17. Miller, A. (2014). Making Markets Mainstream. Retrieved:
http://sustainablefoodtrust.org/articles/farmers-market-moving-it-mainstream. Access:
19.12.2014.
18. Muizniece, L. (2005). National Identity in the Context of Globalisation. Globalisation and
Global Politics. National research programme “National Identity” (in Latvian). Zinatne,
Riga. pp. 42-59. Retrieved:
www.president.lv/images/modules/.../item_1696_Globalizacija_Gunda.pdf. Access:
3.01.2015.
226
19. Popovic, D. M. Globalisation (Possibility and Deficiency) – National Identity in Threat?
Retrieved: http://www.grupa.org.yu/globalizacija.html. Access: 14.12.2013.
20. Reinert, E.S. (2008). How Rich Counties Got Rich... and Why Poor Countries Stay Poor.
Public Affairs. p.400.
21. Rural Development policy 2007-2013. Retrieved:
http://ec.europa.eu/agriculture/rurdev/index_en.htm. Access: 14.12.2013.
22. Steger, M.B. (2010). Globalization. Sterling Publishing Company. p.178.
23. Szmelter, I. (2013). New Values of Cultural Heritage and the Need for a New Paradigm
Regarding its Care. Retrieved: http://ceroart.revues.org/3647. Access: 10.12.2013.
24. Tomlinson, J. (1999). Globalisation and Culture. University of Chicago Press. p.238.
25. Tomlinson, J. (2003). Globalization and Cultural Identity. Retrieved:
http://www.polity.co.uk/global/pdf/gtreader2etomlinson.pdf. Access: 17.12.2013.
26. Vecchio, R. (2009). European and United States farmers’ markets: similarities,
differences and potential developments. Retrieved:
http://ageconsearch.umn.edu/bitstream/58131/2/Vecchio.pdf. Access: 17.12.2013.

227
Proceedings of the 2015 International Conference “ECONOMIC SCIENCE FOR RURAL DEVELOPMENT” No39
Jelgava, LLU ESAF, 23-24 April 2015, pp. 227-234
SOCIAL COOPERATIVES AS SOCIAL ECONOMY ACTORS IN THE
DEVELOPMENT OF ENTREPRENEURSHIP-BASED ON THE EXAMPLE OF THE KUJAWSKO-POMORSKIE VOIVODESHIP
Małgorzata Zajdel*, PhD; Małgorzata Michalcewicz-Kaniowska†, PhD
University of Technology and Life Sciences in Bydgoszcz, Poland, Faculty of Management
Abstract: Social cooperatives, which serve both economic and social purposes, play
a significant role in the development of the social economy sector. They function as enterprises
and conduct business activities. This study was carried out in 2013 in the Kujawsko-Pomorskie
Voivodeship, Poland. The survey research was conducted in 2013 among the whole population
(42 units) encompassing all units of the statistical population under study. Thirty
questionnaires were returned, accounting for 71% of the general population. Its objective was
to assess the role of social cooperatives as social economy actors. The specific objective of the
study was to evaluate legal conditions that regulate the functioning of social cooperatives,
assess the way social cooperatives operate and identify problems connected with forming and
day-to-day running of such organisations. The results indicate that social cooperatives
contribute to stimulating entrepreneurship by operating on the market. Social cooperatives
demonstrate richly varied organisational and human resources potential. The majority of them
continue to expand their business portfolios and create new jobs. Therefore, it is of vital
importance to provide financial support for such organisations as well as to ensure transfer of
best practices and expertise between them and institutions with considerable experience in this
area.
Key words: social cooperatives, social economy, entrepreneurship, social entrepreneurship,
regional development
JEL code: R11
Introduction
The significance of social cooperatives sector stems from the fact that such organisations
may become permanent elements of a social and occupational reintegration system. They
present people, especially the long-term unemployed and people with disabilities with
opportunities to find a job. At the same time, they may contribute to the regional
development. The notion of a social cooperative is by no means a new one - it has been in use
in the European Union for many years. Public administration institutions in many EU Member
Corresponding author.
*Małgorzata Zajdel Tel.: + 48 52 340 81 76
E-mail address: [email protected]
228
States support social cooperatives contributing to the creation of even more workplaces. From
the theoretical point of view, a social cooperative is an association of socially excluded people
or groups threatened by marginalisation who jointly conduct business activities on the basis of
their own work for the benefit of social and occupational reintegration of its members
(Krasuska B., 2009). Experiences of other countries significantly contribute to the development
of the social economy sector in Poland. Social cooperatives are especially widespread and well-
developed in Italy and in the countries of Northern Europe. Finland stands out among other
European countries in this respect. In the 1980s its high unemployment levels drove an
increase in civic initiatives dedicated to job creation, also in terms of jobs for people with
disabilities. Cooperatives that were formed there in the 1990s have been exerting quantifiable
economic, social and psychological effects (Les E, 2012/2013).
Social economy actors perform not only business but also social actions in the course of their
entrepreneurial activities. This process takes place under specific socio-economic and political
conditions and stimulates economic growth (Zuzek D., Mickiewicz B., 2013).
A social enterprise, or a social economy enterprise, is an organisational unit that conducts
business activities. The optimisation of profit is by no means its main objective and it earmarks
any financial surplus for social purposes. According to Duraj and Papiernik, such organisations
can usually be regarded as partnerships and they acknowledge the need to take certain
business risks. At the same time, they rely on volunteer work and give jobs to those socially
excluded and threatened by marginalisation (Duraj J, Papiemik - Wojtera M., 2010). Business
activities carried out by social economy actors are connected with voluntary, free and
deliberate work, which goes far and beyond any family and work relationships or friendships,
for the benefit of others or a whole community. As research conducted by Zajdel and
Michalcewich-Kaniowska indicates, over 80% of the organisations under study rely on help
from people who do not receive remuneration for their efforts (Zajdel M, Michalcewicz-
Kaniowska, 2014).
Social cooperatives operating in Poland as social enterprises are the subject of this study and
the Kujawsko-Pomorski region serves as a case in point. The objective of the study is to assess
the operation of social economy actors.
The specific objective of the study was to conduct an analysis in terms of:
legal conditions regulating functioning of social cooperatives;
the way social cooperatives operate;
problems connected with the formation and day-to-day running of such organisations.
In 2013 in Poland there were 751 social cooperatives entered into the National Court
Register (Ogolnopolski Katalog Spoldzielni Socjalnych), out of which 42 were registered in the
Kujawsko-Pomorskie Voivodeship. The survey research was conducted in 2013 among the
whole population encompassing all units of the statistical population under study. Thirty
questionnaires were returned, accounting for 71% of the general population.

229
The survey questionnaire consisted of a series of questions focusing on several issues,
including the legal form of the organisation, its cooperation with other entities, ways
of acquiring funds, area of business, its needs and problems. The questionnaire was divided
into two parts. The main part comprised twenty-four questions, including four open-ended
questions, twelve closed-ended dichotomous questions, one multiple choice question with one
answer to be selected (so-called disjunctive cafeteria), one multiple choice question with many
answers to be selected (so-called conjunctive cafeteria), four semi-opened questions and two
interval questions with a one-to-five rating scale. There were seven questions in the
demographics section.
Results and discussion 1. Social cooperatives as business entities - theoretical background
Effective support of entrepreneurship is closely related with a holistic view on the operation
of an organisation which has to adjust to the ever-changing external conditions (Zuzek D.,
2006). Support is especially important as far as social cooperatives are concerned, as they
form an integral part of social policy, social security system and labour market policy. It is
assumed that the role social cooperatives play in the development of local communities will
continue increasing in the following years. There are nearly 900,000 social enterprises in the
European Union. They produce close to 10% of GDP and employ 10% of the working age
population. Social economy is one of the main priorities of the EU policy and an essential part
of a socio-economic model for the future EU (Roelants B., 2012).
In Poland, in compliance with the Act of 27 April 2006 on Social Cooperatives, the object of
activities of a social cooperative is to run a joint business based on the individual work of its
members (Dz. U. Nr 96, poz. 873, z pozn. zm.2). Furthermore, the legislation specifies that in
addition to running a profit-oriented business, a cooperative is obliged to carry out activities
for the benefit of social reintegration of its members. It may also perform social, cultural and
educational activities for the benefit of its members and its local environment as well as
socially useful public activities as per the Act of 24 April 2003 on Public Benefit Activities and
Volunteer Work. A relatively new form of business activity, social enterprise achieved
popularity in the late 1990s. Its distinguishing feature is combining non-profit work for the
public benefit with profit-generating business activities (Glinka B, Gudkova S., 2011). The
literature distinguishes 3 models of European social entrepreneurship:
a cooperative model, in which the social enterprise is a cooperative committed to
serving social purposes;
a company model, associated with non-profit organisations competing with for-profit
organisations and public sector institutions to fulfil commercial purposes;

230
an open-form model, in which the objectives of a social enterprise are clearly set along
with the freedom of choice regarding the legal form of its future business activity
(Luczak P., 2011).
According to Szewczykowski, Sobota, Bojar and Zajdel, popularisation of methods such as
Design Thinking may contribute to the growth of both social and human capital among all the
stakeholders in the region. Its importance cannot be underestimated, as effective
implementation of an idea often predetermines the level of market success, and,
as a consequence, a decrease in the level of unemployment, which in turn can be treated
as a quantifiable ratio of the intensification of regional development (Szewczykowski P., Sobota
D., Bojar W., Zajdel M., 2014).
2. Assessment of the role of social cooperatives as social economy actors –
the results of the author’s own research study
Social cooperatives operate as enterprises and conduct business activities. Cooperatives may
be formed by both natural and legal persons. Eighty seven percent of social cooperatives under
study were established by natural persons, while the remaining thirteen percent were created
by legal entities. As far as the number of their Management Board members is concerned,
73% of the cooperatives have a Management Board consisting of 3 people, 13% of 2 people,
7% of 5 people and 7% of 1 person. As regards the main areas of social cooperatives statutory
activities, 67% of them are dedicated to social integration and activation, 56% aid the
unemployed and socially excluded, 44% are involved in activities concerning the labour market
and activities for the benefit of children, women and people with disabilities. Each cooperative
under study enumerated at least two areas of its business activities. The most common
services included catering (33%) and care for the elderly and people with disabilities (27%).
Twenty percent of the respondents provide greenery maintenance services. Fourteen percent
of the cooperatives offer services such as cleaning, running nursery schools and creating
websites. In single cases business portfolios included the following services: tailoring, legal
representation, construction and renovation services, roofing services, running a beauty
parlour, running a holiday centre and organising residential school trips.
The number of Management Board members in such organisations ranges from 1 person to 5
people. Most commonly, the Board consists of 3 (73%) or 2 (13%) members, the majority of
them being women. The profiles of the studied entities reveal that in the Kujawsko-Pomorskie
Voivodeship the majority of their members and managers are women (87%). The number of
full-time employees in the cooperatives under study is extremely varied. It ranges from 4 to
50 employees. One cooperative does not have any full-time employees at all - its employees
signed contracts for specific work or contracts for mandate.
Only 33% of the studied cooperative leaders had previous experience in managing
an enterprise or ran their own business at some point. It should be pointed out that 67%
of the founders of social cooperatives had no experience in running a business at all. It should

231
be borne in mind, however, that 87% of them try to gain supplemental education connected
with management. Promoting social cooperatives at every stage of their development is
so important that all of the studied organisations participate in various trade fairs, conferences,
seminars etc. As few as 8% of the respondents do not use any form of advertising. However,
online presence is so vital that all cooperatives have their own websites. The respondents
emphasised the need for appropriate marketing of their services in order to gain new
customers on the local and regional market.
The founders of social cooperatives had to prepare business plans as part of the
establishment process. Ninety three percent of the respondents complied with this obligation.
Research indicates that in 47% of the studied organisations the business plan was
subsequently adjusted in order to enable unimpeded operation of the cooperative.
As far as their coverage is concerned, 60% of the studied organisations are active locally,
7% nationally, 13% regionally, and 20% provide their services in their poviats. The evolution
of each organisation entails expansion of its business scope and addition of new services to its
portfolio in response to the emerging needs of the customers. Not surprisingly, over 30% of
the organisations are willing to extend their coverage to other regions in addition to offering
their services locally.
In view of such a level of interest in widening their scope of operation, it seems necessary to
disseminate information concerning such possibilities and to offer good examples. Research
suggests that the great majority of organisations, i.e. 80%, obtain outside funds to finance
their operation. The sources of funding are extremely varied and include e.g.: funds from
community offices and other public institutions, the EU subsidies, grants etc.
The cooperatives under study also presented ways in which they cooperate with non-
governmental organisations and other social enterprises in their local environment. The
responses included: transfer of experiences, exchange of information concerning their current
activities and cooperation in carrying out specific tasks. The research helped the authors
to identify the areas that need special attention. For instance, the respondents signalled mainly
their need for aid in obtaining funds for investment, legal counselling and financial support
(Figure 1).

232
Source: author’s construction based on own study Fig 1. Identified areas in which social cooperatives require support
Research demonstrates that social cooperatives were beneficiaries of the aid offered by the
following institutions: Social Economy Support Centre (Osrodek Wsparcia Ekonomii Spolecznej)
(67%), Kujawsko-Pomorski Centre for Social Economy Support (Kujawsko – Pomorski Osrodek
Wspierania Ekonomii Spolecznej) (80%), City Hall (80%), Regional Centre of Social Policy
(47%), Voivodeship Labour Office (20%) and Poviat Labour Office (60%). The degree
of cooperation between the cooperatives and their environment was also investigated. The
results imply that cooperatives collaborate with the local self-government, local media, local
businesses as well as multi-level institutions, and the average grade awarded to these
organisations in terms of their engagement was higher than 3.5. Ministries and central offices,
regional and national media as well as voivodeship offices received lower grades (average
lower than 3) insofar as their collaboration with social cooperatives was concerned.
Sixty-seven percent of the studied cooperatives generate profit by regularly conducting
market research. The cooperatives were asked to identify problematic areas connected with
running a business. The respondents provided the following answers: finding customers,
competition, business partners, insufficient degree of cooperation with the city hall, human
resources problems. Some cooperatives hint at the insufficient level of knowledge among its
members regarding broadly understood management as well as the lack of local customers
and services sale teams. The leaders of the cooperatives were asked if they adopt any
professional enterprise management methods in the course of their work. “Professional” being
understood here not only as learned but also in terms of knowledge gained from books or
methods developed as a result of their own experiences and length of employment as a
manager. Eighty percent of the respondents declare to be adopting professional enterprise
management methods, while 20% replied that they do not use any proven management
methods in their relations with co-workers and subordinates. Despite the fact that 80% of the
respondents utilise professional management methods, as many as 73% claim to still need
233
support in terms of developing their managerial skills. They were also asked for how long they
had held managerial positions, not only in the cooperative but also in other organisations or
enterprises. Only one leader had experience extending 21 years, while 14% of the respondents
held such positions for 10 years only. The managerial experience of the other leaders lasted
between 3 to 5 years. The study also set out to identify problems connected with establishing
and running social cooperatives. The obtained results indicate that at the stage of establishing
a social cooperative the respondents encountered problems while registering with the National
Court Register and with finding their first customers. Other mentioned issues include the lack
of financial support, insufficient knowledge of the rules that apply to the operation of such
organisations, also among organisations which oversee the process of establishing
cooperatives, the lack of actual support from institutions as well as the lack of understanding
on the part of their local environment. The respondents also suggested possible solutions to
such problems: greater aid from the government, less red tape (simpler accounting rules for
social cooperatives), use of social clauses in Polish public procurement law, change of name
from a "social" to e.g.: "community" cooperative (to avoid associations with socially excluded
people), inclusion of country dwellers into the groups legally allowed to form cooperatives,
creation of a professional factual support system, facilitation of the registration process with
the National Court Registry. The respondents also enumerated current internal and external
problems connected with running a cooperative. The most common issues include: the lack of
knowledge concerning facilities available to social cooperatives and varying degree of their
members' engagement in their activities. They also mentioned difficulties in maintaining the
right balance between their mission of social reintegration and willingness to be economically
efficient. The most common external problems included the lack of understanding and interest
in social cooperatives among the state authorities, organisational problems connected with
human resources, inability to use available facilities, internal conflicts and huge competition on
the market, as well as problems with obtaining funds.
Conclusions
Social cooperatives operating in the Kujawsko-Pomorskie Voivodeship demonstrate richly
varied organisational and human resources potential and are able to further develop and
expand the scope of services they provide. Not only do they require appropriate tools and
specialist services in order to fulfil this potential but they also need to obtain funds for their
day-to-day business activities. The research emphasizes certain barriers and limitations.
In order to improve their situation, it is of vital importance to provide social cooperatives with
financial support as well as to ensure transfer of best practises and expertise between them
and institutions with considerable experience in this area. Social cooperatives try to adjust
their business activities to the emerging needs of the customers by expanding their business
portfolios and through cooperation with other entities and institutions operating on the market.
234
Bibliography
1. Luczak P., (2011), Changes of the Scope of Social Entrepreneurship in: Annals Of
Agricultural Economics And Rural Development, (Zmiana zakresu przedsiebiorczosci
spolecznej [w:] Roczniki Ekonomikii Rolnictwa i Rozwoju Obszarow Wiejskich) Annals
(rocznik) XXXVIII nr 2, s. 11.
2. Szewczykowski P., Sobota D., Bojar W., Zajdel M., (2014) Design Thinking as a Method
of Regional Development Intensification, (Design Thinking jako metoda intensyfikacji
rozwoju regionalnego), Marketing and Market (Marketing i rynek), nr 10, s. 183-189.
3. Zajdel M., Michalcewicz-Kaniowska M., (2014), Development Of Kujawsko- Pomorskie
Region In The Context Of The Functioning Of Social Economy Entities - Results Of
Research, (Rozwoj regionu kujawsko-pomorskiego w aspekcie funkcjonowania
podmiotow Ekonomii Spolecznej– wyniki z badan), Europa Regionum Tom XXI, ss 154-
163
4. Zuzek D., Mickiewicz B., (2013), Opportunities and Barriers for Development of
Entrepreneurship in Rural Areas in Poland, Warsaw Agricultural University Scientific
Papers "Economics and Organization of Food Economy", No. 101, s.41-51, (Szanse i
bariery rozwoju przedsiebiorczosci na obszarach wiejskich w Polsce, Zeszyty Naukowe
SGGW „Ekonomika i Organizacja Gospodarki Zywnosciowej”, nr 101, s.41-51).
5. Zuzek D., (2006), Small and Medium Companies as Being of Regional Entrepreneurship,
[in:] Acta Agraria et Silvestri, Vol. XLVI / 1 (Economic Section), Pub. Polish Academy of
Sciences, Krakow, pp. 254 – 262, (Male i srednie przedsiebiorstwa jako istota
przedsiebiorczosci regionalnej, [w:] Acta Agraria et Silvestria, Vol. XLVI/1 (sekcja
ekonomiczna), Wyd. PAN w Krakowie, Krakow, s. 254 – 262).
6. Duraj J., Papiernik - Wojtera M, (2010), Entrepreneurship and innovation,
(Przedsiebiorczosc i innowacyjność), Difin, s. 25-26.
7. Glinka B., Gudkovam S., (2011), Entrepreneurship (Przedsiebiorczosc), JAK, s.22-23.
8. Les E., (2012/13), European Experience on the Social Entrepreneurship on the Example
of Italy and Finland,: Social Assistance From Clientelism to Participation (Europejskie
doswiadczenia w sprawie przedsiebiorczosci spolecznej na przykladzie Wloch i Finlandii,:
Pomoc spoleczna os klientyzmu do partycypacji), pod. red.. E. Les, s. 387.
9. Roelants B., (2012) Prague, Social Economy, First European Conference on Social
Economy in Central and Eastern Europe, a Preparatory Document, CECOP, pp. 3 (Praga
Ekonomia Spoleczna, Pierwsza Europejska Konferencja na temat Ekonomii Spolecznej w
Europie Srodkowo-Wschodniej, dokument przygotowawczy), CECOP, s.3.
10. The amended Act of 24 April on Public Benefit Activity and Voluntary service (AA, No. 96,
pos. 873) (Ustawa z dnia 24 kwietnia 2003 r. o dzialalnosci pozytku publicznego i o
wolontariacie (Dz. U. Nr 96, poz. 873, z pozn. zm.2).
11. Krasuska B., (2009), Spoldzielnia socjalna jako forma dzialalnosci gospodarczej s.5,
http://wupwarszawa.praca.gov.pl/documentss
12. Directory of Social Cooperatives (Ogolnopolski katalog Spoldzielni Socjalnych)
http://www.spoldzielniesocjalne.org/wielkopolskie.htm

235
WOMEN EMPLOYMENT IN LATVIA:
THE EFFECT OF FLEXICURITY PRINCIPLES INTEGRATED IN ECONOMIC POLICY
Agnese Vaivade1, MSc.; Edgars Brēķis1, Dr.Oec. Associated Professor;
Economics and Business Administration;
1 University of Latvia
Abstract. During the global economic crisis, the employment rates decreased, thus, newly
implemented labour market policies became more important. Flexicurity is a new concept for
labour market improvements in the European Union by promoting flexibility combined with
employment security. One approach to enhance the flexicurity is through part-time and fixed-
term employment expansion. The aim of the paper is to analyse women employment to argue
for flexicurity in the labour market in Latvia. The descriptive-analytical study of data of Latvian
Labour Force Survey (2007 to 2013) is given. During the economic crisis in the years 2009 to
2010, part-time and fixed-term employment rates increased to historically highest levels in
Latvia. As it evident, in the part-time and fixed-term employment mostly women with primary
education or lower and general secondary education are involved. Together with fact that
women in part-time or fixed-term work receive the income corresponding to lowest income
group, it is possible to argue that increase in part-time and fixed-term employment has not
been simultaneous with the increase in employee security. Flexicurity through flexibility has
increased not because a focused labour market policy has been directed but because of the
involuntary adjustments in the labour market during the global economic crisis and period of
recovery.
Key words: women employment, flexibility, part-time work, flexicurity
JEL code: J01, E24, K31
Introduction
During the global economic crisis and period of recovery, Latvia met high unemployment rates,
and increase of flexibility of the labour market was needed to secure jobs and income for
inhabitants. The hypothesis is that to curb the adverse effect on Latvia’s labour market of the
economic crisis, flexicurity has been promoted.
The flexicurity concept is relatively new. In 1990, it was first developed in the Netherlands
when it was utilised in labour market reforms and resulted in the Act on Flexibility and Security
that entered into force on January 1, 1999. Many changes were needed because of the high
unemployment and low growth level in the Netherlands as well as rising inflation that was
Corresponding author. Agnese Vaivade Tel.: +37127842737.
E-mail address: [email protected]
Proceedings of the 2015 International Conference “ECONOMIC SCIENCE FOR RURAL DEVELOPMENT” No39
Jelgava, LLU ESAF, 23-24 April 2015, pp. 235-245

236
compensated by wage increases. Government started the working time reduction through
flexibility, which provided different forms to be chosen at branch and company level. As
follows, the average working week hours decreased from more free days, some days not
scheduled, regular afternoon free, etc. The part-time work was promoted for women with
children that increased the participation rate of women significantly, and the external flexibility
was introduced by more temporary (fixed-term) contracts and broader use of Dispatched Work
Agencies services. In 1998 only 56% of the workforce had a regular full-time job, 37% worked
part-time (75% of them – women) and 13% had fixed-term contracts. Unemployment was
reduced from 9.3% in 1985 to 4% in 1999 (van Voss G., 2000).
To test the hypothesis, following tasks were defined: to analyse the changes in flexibility by
changes in part-time or temporary employment; to analyse the social groups who were most
likely to engage in part-time or temporary employment during the period of recession. There is
yearly 2007 to 2013 data used from Latvian Labour Force Survey.
Research is based on descriptive statistics of women part-time employment and employment
based on fixed-term contracts in Latvia, depending on women education level and family
conditions, also looking to their distribution in wage groups.
The part-time and fixed-term employment in Latvia has slightly increased since 2009. In 2007
and 2008 only 5% of men and 8% of women worked part-time, while these rates increased to
7% and 12% respectively in 2012. However, as it evident from the Labour Force Survey. The
main reason for working part-time from 2009 was an impossibility to find full-time work, which
was not so widespread problem in 2007 and 2008. 40% of part-time employees were
involuntary employed part-time in 2013. More than quarter of women with secondary
education or lower worked part-time in the period from 2007 to 2013; while less than 10% of
women with the highest education worked part-time. The main finding is that however part-
time and fixed-term employment has increased, it was mainly involuntary, and it does not
promote a flexicurity so that the hypothesis could be rejected.
Literature review
In 2000, the Lisbon Strategy for growth and jobs was signed. Revised in 2005 it incorporated
Integrated Guidelines for growth and jobs for the period 2005 – 2008. The flexicurity principle
there was first encouraged at the European Union level by the following guideline: “Promote
flexibility combined with employment security and reduce labour market segmentation, having
due regard to the role of the social partners (Integrated Guideline No 21)” (European
Commission, 2005). The strongest driving force for implementing the flexicurity in Europe
were actions taken by the European Commission that based on the report “Flexicurity
Pathways: Turning hurdles into stepping stones” done by a European Expert Group on
Flexicurity in 2007, where four precisely defined flexicurity policy components were presented
(European Commission, 2007): flexible and reliable contractual arrangements; comprehensive
lifelong learning; effective active labour market policies; and modern social security systems.

237
Low population growth and ageing population are also challenges Europe must meet (European
Foundation for the Improvement of Living and Working Conditions, 2007). Improving
productivity and increasing employment will guarantee a long-term growth and social
cohesion. Often the first flexicurity principle of flexibility is described by part-time and
temporary (fixed-term) employment rates. Many studies are focused on researching the part-
time labour market creation. In the 1990s surveys were done to analyse whether the part-time
employment has increased because of substitution for full-time employment. This hypothesis
was rejected by Tilly (1991), whose study results suggest that part-time employment has
increased because of the changing needs and strategies of employers. The survey conducted
by Lei Delsen (1995) shows that: in 41% of cases part-time jobs were created because of
management needs; in 36% of cases - by employees demand; and just in 22% of cases as
consensus of employers and employees (Tijdens K., 2002). Findings of Tijdens (2002)
contradict the results of data analysis for Latvia (2007 – 2013), where involuntary part-time
employment has increased substantially during the global economic crisis and simultaneously
with overall employment decrease.
Some empirical evidence and studies suggest that education attainment positively correlates
with female participation in the labour market. From the World Bank ILO KILM database –
World Development Indicators, in 2013 female to male primary education enrolment rates has
reached 94% even in the least developed countries. This ratio is 97% for the secondary
education and women are more likely to be enrolled in tertiary studies than men. Therefore,
the gender gap in education is closing and there would be expected the decreasing gender
employment gap as well as decreasing gender wage gap. Blossfeld and Hakim (1997)
suggested that the higher a woman’s level of education, more profitable an extra hour of paid
work is for her, compared to an hour of household work. Thus, well-educated women will
consider outsourcing household duties and extending their working hours but women with
lower education will more often work shorter hours as well as engage in part-time
employment. This inference applies to Latvia too, where part-time and fixed-term employment
is more spread among women with secondary or lower education. The share of women
involved in part-time and fixed-term employment is higher in the lowest income group.
However, during global economic crisis the part-time and fixed-term employment increased in
all women groups by education level.
Part-time work is assumed to be viewed as a solution to balancing work with family
responsibilities especially for women. By Duflo (2012) women’s ability to participate on the
labour market is constrained by their higher allocation of time to unpaid work. In the OECD
countries, each day women spend about 2.5 hours more than men on unpaid work (including
care work) regardless of the employment status of their spouses (Aguirre D., 2012). In Great
Britain for women with no children, full-time employment is the norm throughout, but
particularly when they are in their 20s (Connolly and Gregory., 2009). Around 80% of childless
women in their 40s are in full-time employment but just 40% of women with children. There is

238
evidence for family size to reduce participation in full-time work. Only 20% of British women
with three or more children at age 30 are employed full-time, and just over 30% of those with
two children are in full-time work. However, it is important to mention that part-time
participation will increase just where part-time jobs are perceived to be of high quality (Del
Boca D. et al., 2009). In the OECD Employment Outlook (1999) it is said that in general, the
higher the proportion of women working part-time in any country, the smaller the percentage
of them who say they would prefer to work full-time (lower share of involuntary part-time
employment). However, this is not applicable for Latvia during the period of global economic
crisis and period of recovery, when involuntary part-time employment increased from 21% in
2007 to 43% in 2009.
Data and descriptive statistics
For the analysis the Latvian Labour Force Survey for the period from 2007 to 2013 is used,
which is a quarterly survey done by the Central Statistic Bureau of Latvia. The following
indicators are used for the analysis: year, sex, number of children aged 0 to 17 living in
household, highest level of education or training successfully completed, active and inactive
population, professional status in main job, statistical region of main job local unit, economic
activity of main job local unit, full-time or part-time employed in main job, reason for working
part-time, job/work contract of unlimited or limited duration, and last month’s net (after taxes)
wage and salaries from the main job.
Women employment and its flexibility in Latvia
In 2004, Latvia joined the European Union and from the year 2014 it has also joined the Euro
Zone as the 18th country with the euro currency. One of the most important political objectives
of Latvia when becoming a Member State of the European Union was to protect the
independence of the country, to increase wealth and prosperity, social security and to facilitate
the consolidation of Latvia’s international positions (Ministry of Foreign Affairs of the Republic
of Latvia., 2005). The wealth and prosperity can be reached by higher employment rates,
productivity and wage increase, which follows from many aspects both human and physical
capital in the region, country or the union. It is broadly discussed that gender equality is a
fundamental need in order to reach any of the European Union 2020 targets and targets by
each Member State. Therefore, several measures are developed to compare women and men
positions within work and society.
In the European Union the Gender Equality Index (GEI) was drawn up to have one multi-
dimensional measurement for gender equality issues in six different sectors: work, money,
knowledge, time, power and health. By the year 2010, the gender equality in Latvia has been
lower than on the average in the European Union, and the biggest differences are identified in
the work, money and health sectors. The score can have values from 0 (total inequality) to
100 (complete equality) in each of sub-components as well as in the total.

239
Table 1
Global Equality Index, 2010
Total score Work Money Knowledge Time Power Health
Latvia 44.4 54.9 42.0 38.8 35.2 38.6 77.1
European Union - 27 54.0 69.0 68.9 48.9 38.8 38.0 90.1
Source: Global Equality Index by the European Union
The “Work” indicator in GEI consists of two sub-domains – participation (two components);
segregation and quality of work (four components). In Latvia the participation for women in
full-time-equivalent employment rate (in percentage of total population in age from 15 and
more) is higher than the EU-27 average – 44.5% and 41.0%. This can be partly explained by
lower part-time and full-time employment intensity in Latvia as well as set working time in the
country, which is 40 hours a week. The part-time employment rate in Latvia is lower than in
the EU-27, 9.4% and 19.9% in 2012. At that year 11.6% of women and 7.1% men were
having part-time employment contracts. Also, the duration of work life in years for women in
Latvia is longer than in the EU-27 on average – 33.4 years and 31.6.
The difference in employment rates by gender in Latvia has decreased since the year 2007,
however, mainly because of the faster decrease of men employment than of women
employment during the global economic crisis. The highest women employment rate was in
2008 – 65.2% and 71.5% for men. Employment was the lowest in 2010, when it was 57.9%
for men and 59.0% for women, and the overall employment rates were higher for women than
for men in the years 2009 and 2010. Employment rates for men exceeds the employment
rates for women again since the year 2011, also the difference in employment levels has
increased, however, not as great as before the crisis (see Table2: Women and Men
Employment Rate Ratio).
Table 2
Employment rate in Latvia by gender in the age group 15 to 64, in percentage
2007 2008 2009 2010 2011 2012 2013
Men 72.7 71.5 60.3 57.9 61.5 64.4 66.8
Women 63.9 65.2 60.4 59.0 60.2 61.7 63.4
Women and Man Employment
rate ratio
0.879 0.912 1.002 1.019 0.979 0.958 0.949
Source: Central Statistical Bureau of Latvia
The total employment during crisis decreased for both men and women, but in the period of
recovery the women employment has restored the before crisis level, while men employment
in 2013 is still well below the levels of 2007 and 2008. Since 2009 part-time employment has
risen for both men and women. Share of women employed part-time from total part-time
employment is above 60% in the most of the years. The total part-time employment
decreased in 2013. For a group of people employed temporary or having a fixed-term contract

240
the pattern has been different. During the crisis the women fixed-term employment share of
the total fixed-term employment has increased steadily (with a little reverse only in 2012)
from 30% in 2008 to 42% in 2013, with the highest peak of 44% in 2011. Table 3 shows the
changes in flexible employment characteristics in Latvia caused by the global economic crisis
and in the period of recovery. Even the total women employment was less affected during the
economic crisis; in the recovery period since 2011 the share of women working part-time or
fixed-term again increased. This shows that flexible work arrangements increase during
tension economic periods and do not characterize labour market as flexible from the economic
policy point of view.
Table 3
Part-time and fixed-term employment in Latvia, in percentage
Year Share of employed
men, working
Share of employed
women, working
Women share from total flexible
employment, in
Part-time Fixed- term Part-time Fixed- term Part-time Fixed- term
2007 4.84 5.45 8.01 2.91 61.19 34.89
2008 4.47 4.75 8.17 1.95 63.91 29.63
2009 7.48 5.68 10.14 2.91 58.86 36.62
2010 7.83 8.88 11.44 4.95 60.98 38.48
2011 7.34 7.94 10.93 5.45 61.45 43.61
2012 7.10 6.23 11.61 3.34 62.92 37.02
2013 6.07 5.27 10.02 3.57 62.97 42.32
Source: author’s calculations based on the Labour Force Survey data
When analysing the reasons for working a part-time job, in 2007 and 2008 most often answers
were “other reasons” or “school education, training of field practice” or “could not find full-time
job”, but in 2010 and 2011 - “could not find full-time job” and “due to economic reasons”.

241
Table 4
Reasons for working part-time in Latvia, in percentage
School
education,
training or
field
practice
Own
illness,
disability
Could not
find a
full-time
job
Did not
want a
full-time
job
Due to
economic
reasons
Other
reasons
No
answer
2007 18.88 6.08 20.95 16.87 0.00 36.59 0.62
2008 14.72 5.01 27.12 18.64 0.00 34.52 0.00
2009 11.02 3.96 43.07 10.59 0.00 31.36 0.00
2010 7.62 2.24 41.25 7.39 22.78 18.33 0.39
2011 6.54 3.39 39.96 11.46 20.41 18.24 0.00
2012 8.57 3.08 41.08 14.17 10.73 22.37 0.00
2013 8.93 3.12 38.00 21.35 7.05 21.54 0.00
Source: author’s calculations based on the Labour Force Survey data
The involuntary part-time employment is reflected in surveys as the reason for working part-
time because the person “could not find full-time job”. Involuntary part-time employment
share of the total part-time employment was 21% in 2007 and 27% in 2008. This reason
sharply increased during the crisis to at least 40%. The average involuntary part-time
employment in the EU was less than 30% in 2013.
The country with one of the highest part-time employment rates is the Netherlands, where
flexicurity concept is developed since early 1990s. In the Netherlands almost half of the
employment is part-time, and women constitutes approximately 75% of part-time employees.
In 2013 involuntary part-time employment affected less than 10% of part-time employees in
the Netherlands.
The part-time work is the least spread among women with higher education while more than
15% of women with primary education or lower and more than 10% of women with general
secondary education work part-time. After the global economic crisis, part-time employment
also increased for women with higher and vocational education. There is a similar pattern of
fixed-term employment by educational distribution.

242
Table 5
Share of women working flexible work by corresponding educational level
Part-time (%) Fixed-term (%)
Higher
education
Vocational
education
General
secondary
education
Primary
education
or lower
Higher
education
Vocational
education
General
secondary
education
Primary
education
or lower
2007 5.64 6.25 10.14 16.45 1.22 2.97 3.28 8.10
2008 6.64 7.06 9.43 14.96 0.89 1.66 2.22 6.93
2009 8.19 8.84 12.45 18.07 1.02 2.54 3.93 11.07
2010 10.00 10.82 12.89 18.11 2.53 4.61 7.10 13.97
2011 9.50 11.73 11.51 14.71 2.34 6.08 7.93 16.10
2012 8.79 12.76 14.63 16.18 1.59 4.11 3.98 11.82
2013 8.10 11.73 10.90 13.00 2.08 2.92 4.99 14.97
Source: author’s calculations based on the Labour Force Survey data
Most women in part-time of fixed-term work are employed in the agriculture and fishery
industries, which are considered as relatively low-skill industries; however, also the financial
and commercial sectors are based on more fixed-term contracts since 2010.
As flexible employment is most frequent in the group of women with low education, it is no
surprise that most often part-time and fixed-term employment for women is characterized by
low-income levels. More than 15% of women with salaries less than EUR 284.57 worked part-
time, while in the salary group from EUR 284.58 to 426.86 already less than 4.5% women
were employed part-time. During the period of crisis the part-time employment increased in all
groups but steadily in income group EUR 711.45 to 1422.87 per month from 0.11% in 2008 to
3.07% in 2009. In 2012 and 2013 part-time employment has also appeared in the income
group above EUR 1422.88. Large fluctuations in fixed-term employment during the period of
economic crisis and recovery have been in all income groups with the highest rates in the
years 2010 and 2011, followed by decrease in 2012 and 2013. This again shows that fixed-
term working arrangements are not so much the result of flexible labour market policy but
rather adaption to economic and employment changes.

243
Table 6
Share of women working flexible work by corresponding income level, in percentage
EUR 284.57
EUR 284.58 –
426.86
EUR 426.87 –
711.44
EUR 711.45 –
1422.87 ≥ EUR 1422.88
Part-
time
Fixed-
term
Part-
time
Fixed-
term
Part-
time
Fixed-
term
Part-
time
Fixed-
term
Part-
time
Fixed-
term
2007 10.34 3.28 2.30 1.46 1.21 0.53 0.28 5.43 0.00 10.76
2008 14.57 3.35 2.92 0.81 1.98 0.55 0.11 1.27 0.00 0.00
2009 17.44 4.98 3.12 0.81 1.45 0.74 3.07 2.02 0.00 0.00
2010 16.90 5.83 3.46 1.69 1.54 1.88 2.07 3.04 0.00 0.00
2011 17.62 6.90 3.58 1.78 1.79 1.76 1.08 3.36 0.00 6.87
2012 19.68 4.80 4.46 1.29 1.89 0.92 1.12 1.94 1.58 1.66
2013 18.79 4.99 2.23 2.05 1.68 0.74 1.59 1.81 1.08 0.00
Source: author’s calculations based on the Labour Force Survey data
There is no definite pattern for women working part-time because of increasing number of
children in their family, while this is true for women working fixed-term. Women with two or
more children are working temporary more often than women with no or one child.
Table 7
Women part-time and fixed-term employment by number of children, in percentage
Share of women part-time employment
from total women employment
Share of women fixed-term employment
from total women employment
No Children 1 Child 2 or more
Children
No Children 1 Child 2 or more
Children
2007 8.55 7.02 7.89 2.86 2.61 3.57
2008 8.60 6.74 9.03 1.70 1.71 3.09
2009 9.96 9.54 11.64 2.53 2.40 4.88
2010 10.67 11.72 13.26 4.52 4.62 6.71
2011 10.83 11.96 9.57 4.81 5.69 7.13
2012 12.04 11.08 10.89 3.49 2.47 4.29
Source: author’s calculations based on the Labour Force Survey data
Conclusions
1. In a global crisis, employed men were more affected by job loss or switching to a part-time
job than women. Therefore, the share of women working flexible work (part-time or fixed-
term) fluctuated. Only in 2009 and 2010 women employment rates in total exceeded men
employment rates. The share of women in part-time employment decreased by the year 2011,
later it reversed as the total employment situation improves.
2. When analysing the gender equality, the participation of women in full-time-equivalent
employment rate in Latvia is higher than in the EU-27. This could be explained by lower part-

244
time employment and longer working hours as well as longer duration of work life in years.
However, gender equality is high, flexible working arrangements are not accessible by
personal wish but rather is involuntary in the result of global economic crisis and tense periods
in the labour market. Involuntary part-time employment has increased during the economic
crisis from 20% in 2007 to 43% in 2009. It is more common for men than women. Involuntary
part-time employment in Latvia was 40% in 2013, significantly above the EU average level of
30%.
3. Most women in part-time or fixed-term work are employed in the agriculture and fishery
industries. More fixed-term contracts are used in the financial and commercial sectors since
2010. More part-time contracts were used in financial and commercial sectors in 2008 and
2009. Part-time and fixed-term employment are more likely for women with primary or lower
and general secondary education but less likely for women with vocational and higher
education. The highest share of part-time and fixed-term women employment is within the
lowest income group. Therefore, it is possible to argue that increase in flexibility during crisis
(increase in part-time and fixed-term employment rates) has not been simultaneous with the
increase in employee’s security. Flexicurity through flexibility has increased because of
involuntary adjustments in the labour market during the global economic crisis and period of
recovery, and not because of focused labour market policy.
Bibliography
1. Aguirre, D. (2012). Empowering the Third Billion. Women and the World of Work in 2012.
[online] Booz & Company. Available at:
http://www.strategyand.pwc.com/media/file/Strategyand_Empowering-the-Third-
Billion_Briefing-Report.pdf [Accessed 2 Jan. 2015].
2. Blossfeld, H. and Hakim, C. (1997). Between equalization and marginalization. New York:
Oxford University Press.
3. Connolly, S. and Gregory, M. (2009). Dual tracks: part-time work in life-cycle
employment for British women. J Popul Econ, 23(3), pp.907-931.
4. Del Boca, D., Pasqua, S. and Pronzato, C. (2008). Motherhood and market work
decisions in institutional context: a European perspective. Oxford Economic Papers,
61(Supplement 1), pp.i147-i171.
5. Delsen, L. (1995). Atypical employment. Groningen: WoltersgroepGroningen.
6. Duflo, E. (2012). Women Empowerment and Economic Development. Journal of
Economic Literature, 50(4), pp.1051-1079.
7. EIGE, (2015). Gender Equality Index. [online] Available at:
http://eige.europa.eu/content/gender-equality-index#/ [Accessed 2 Jan. 2015].
8. Europa.eu, (2015). Employment policy guidelines (2005-2008). [online] Available at:
http://europa.eu/legislation_summaries/employment_and_social_policy/community_employm
ent_policies/c11323_en.htm [Accessed 2 Jan. 2015].
9. European Commission, (2007). Towards Common Principles of Flexicurity: More and
Better Jobs Through Flexibility and Security. Directorate-General for Employment, Social
Affairs and Equal Opportunities Unit D.2.
10. European Foundation for the Improvement of Living and Working Conditions, (2007).
Approaches to Flexicurity: EU Models. Luxembourg: Office for Official Publications of the
European Communities.
11. Ministry of Foreign Affairs of the Republic of Latvia, (2005). Latvia - the European Union.
[online] Available at: http://www.am.gov.lv/data/visit/09-latvija-es.pdf [Accessed 2 Jan.
2015].

245
12. OECD, (1999). Employment Outlook. Paris: Organization for Economic Cooperation and
Development.
13. Tijdens, K. (2002). Gender Roles and Labor Use Strategies: Women's Part-Time Work in
the European Union. Feminist Economics, 8(1), pp.71-99.
14. Tilly, C. (1991). Reasons for the Continuing Growth of Part-Time Employment. Monthly
Labor Review, 114(3), pp.10-18.
15. van Voss, G. (2000). The Flexibility and Security Act. Peer Review, [online] DP. Available
at: http://pdf.mutual-learning-employment.net/pdf/ind-exp-paperNL1000.pdf [Accessed 2 Jan.
2015].

246
Proceedings of the 2015 International Conference “ECONOMIC SCIENCE FOR RURAL DEVELOPMENT” NO39
Jelgava, LLU ESAF, 23-24 April 2015, pp. 246-252
THE IMPORTANCE OF SMALL AND MEDIUM-SIZED ENTERPRISES IN
THE DEVELOPMENT OF THE REGION ON THE EXAMPLE OF THE MALOPOLSKA PROVINCE
Dagmara K. Zuzek*, PhD
Agricultural University in Cracow, Faculty of Economics
Abstract. Small and medium-sized enterprise sector is one of the main factors of
competitiveness of regions and their economic growth rate. Małopolska region is attractive for
investors and entrepreneurs from the SME sector which is mainly related to spatial planning
and advancement of urban processes. The local character of small and medium-sized
enterprises leads to close relationship between the development of this sector and the local
and regional development. A higher level of economic development increases the
competitiveness of a local network, which facilitates further economic development. The main
aim of the research was to present the role and importance of the SME sector in the
development of Małopolska region and its investment attractiveness. The research study was
carried out in 2014. It reveals that Małopolska region is favourable to the development of the
SME sector, which is reflected, among others, by the fact that it has the competitive advantage
as regards the labour resources and costs as well as activities directed at investors.
Key words: Small and medium-sized enterprises, regional development, entrepreneurship
JEL code: R11
Introduction
Small and medium-sized enterprises constitute a most important element of each
economy. The highest increase in newly created jobs is noted in this sector, and also such
firms lose work much slower in case of the market collapse than larger businesses. The
condition for efficient operating of the market is economy to a great extent based on a big
number of small firms (Zuzek D., 2014).
The role that small and medium enterprises play in the market economy is significant.
They bring in many opportunities for entrepreneurship development and growth of economy
competitiveness and regional development (Zuzek D., 2011).
Regional policy is an essential element of the social and economic policy pursued by
Poland. The aim of the regional policy is to create competitiveness of the regions and
counteracting the marginalisation of certain areas in such a way to foster long-term economic
* Corresponding author. Tel.: +48 126623452; fax: +48 126623452, E-mail address: [email protected]

247
development of the country, its economic, social and territorial cohesion as well as integration
with the European Union. Regional policy is the field of public intervention increasingly gaining
in importance, and the assistance for the SME sector constitutes its part.
The SME sector is one of the main factors of the competitiveness of regions and their
economic growth rate. It is essential to regard it as one of the development priorities when
planning the operations of regional policy (Small and medium-sized…, 2001).
The main aim of the research was to present the role and importance of the SME sector
in the development of Małopolska region and enhancing its investment attractiveness. The
author’s own study was carried out with the participation of 245 entrepreneurs from the
Małopolska Province. The collected results were subjected to statistical analysis using the
Kruskal-Wallis rank method and rank correlation gamma method. The results presented were
carried out in 2014 and are part of the research project funded by the National Science Centre.
Results and discussion
1. Small and medium-sized enterprises in the theories of regional development
The role that small and medium enterprises play in the market economy is significant.
They bring in many innovation creation opportunities, thereby opportunities for
entrepreneurship development and growth of economy competitiveness. The high share the
sector holds in GDP formulation is a reason for strengthening the foundations of the sector
operation and facilitating access to innovative solutions. A modern enterprise ought to become
an innovative organization, open to novelties, perceiving the internal and external environment
from different perspectives, and at the same time sensitive to market signals and expectations
as well as being ready to implement changes (Zuzek D., 2011).
Small and medium-sized enterprises in Poland do not develop as dynamically as in
other European Union countries (Woźniak M., 2010). The reason behind this is the presence of
numerous barriers, among others technological, organizational, market, tax or financial ones,
hindering their functioning and development. The assessment of the condition of this sector
indicates that financial barrier is of highest significance. Therefore, the entities governing the
country should focus on overcoming those barriers so that national enterprises could develop
more dynamically.
Small and medium-sized enterprises are usually of the local character. There exist two
kinds of interactions between enterprises from the SME sector and from the local market. The
enterprise on the local market is not only supplied with production materials and uses local
labour resources but it also sells its products and services. Moreover, enterprises easily adjust
to local environment as they find there more favourable development conditions (Stużycki M.,
2004).
Local character of small and medium-sized enterprises results in the close relationship
between the development of this sector and the local and regional development. Higher level

248
of economic development increases competitiveness of the local network which fosters further
economic development. Apart from that, economic development contributes to an increase in
employment and thus to a decrease in unemployment. It results in more funds in local
budgets, satisfies the living needs of inhabitants, decides about competitiveness of the whole
region as well as influences the quality of inhabitants’ life (Small and medium-sized…, 2001).
There are a lot of theories of regional development which account for the causes of
irregular and different level of development in the perspective of space, time and between
entities. At the same time, each of the theories indicates specific aspects of economic activity
which bring the most positive developmental results through specific behaviour of economic
entities contributing to the prosperity of the region.
The process of regional development is the result of the influence of three groups of
factors (Small and medium-sized…, 2001):
1. internal ones (endogenous) constituting usually the beginning of economic and social
transformation. Three most important factors in this group include:
the application of new technological solutions imported from the outside,
entrepreneurship development,
development of specific local resources,
2. external ones (exogenous) – location in the region of new production plants, belonging
to external entrepreneurs, which affect the changes in the local production structure,
3. reactions on external changes (technological, organizational) – the result is the creation
of various projects of development at the local level that are based on the cooperation and
joint action of entrepreneurships, entrepreneurships and public institutions or that are created
only in the public sector; this kind of factor also belongs to external ones.
Facilitating development forces public authorities to exert influence on the appropriate
combination of exogenous and endogenous factors. It leads to the need of developing suitable
models of intervention policy. In economic practice, the implementation of a chosen model
usually gives rise to various fields of activity of small and medium-sized enterprises.
One of the most effective policies of regional development is the policy aiming at the
creation of geographically concentrated and cooperating units of business entities (clusters),
located close to research centres and universities, which may attract most creative and
innovative entities. It is a policy, which supports small and medium-sized enterprises and the
creation of territorial production systems, described in theory.
2. The importance of small and medium-sized enterprises in the local
and regional development – the results of the author’s own research study
As a result of creating a number of aid programs for the analysed sector of SME’s,
specific instruments for supporting growth have become available. They are meant to serve as
external sources, formalized streams of value, chiefly of a resource nature, stimulating

249
qualitative and/or quantitative changes (depending on the approach to defining organization
growth) leading to SME’s growth (Zuzek D., Mickiewicz B., 2013)
Enterprises from the sector of small and medium-sized enterprises are generally of the
local character. There are two kinds of interactions between the SME and a local market. A
company in the local market is not only supplied with production materials and uses local
resources but also sells its products and services. Small enterprises adjust to local
environment very quickly because they find there favourable development conditions. The
character of companies from the SME sector leads to close relationship between the
development of enterprises and the local and regional development. A high level of regional
development increases competitiveness of the local system and facilitates further economic
development. Moreover, economic development largely contributes to increasing the number
of work places and decreasing unemployment. It also fosters increasing local budget, decides
about competitiveness of the whole region, satisfies the living needs of inhabitants and
improves their lives (Stużycki M., 2004).
The experience of highly developed countries shows and confirms that small and
medium-sized enterprises play an important role in the economy of the region and the whole
country by influencing economic growth, meeting consumers’ needs by providing high quality
products and services as well as contributing to higher employment rate. It can be stated that
companies from the SME sector constitute the major factors of social and economic growth in
the country and are the incentive to economic development (Huczek M., 2008). However,
companies from the SME sector encounter developmental barriers, which they have to face to
survive on the market.
The results of the author’s own studies show that the most cumbersome barriers
include: high taxes and payments provided for by the law (44%) as well as bureaucracy and
complicated legal regulations (around 39% of the enterprises under study). Less significant
barriers according to entrepreneurs are: demand on the local and regional market (27%),
competitiveness of large companies (20%), high costs of labour and insufficient qualifications
of employees (around 20%) as well as difficulties with the access to external sources of
financing (13% of companies under study).
The number or the potential of enterprises are frequently regarded as indicators of the
level of economic development. Their activities and functioning reflect the entrepreneurial skills
of the society. Literature on the subject reveals that “the main source of entrepreneurship are
people, their relationships with other people and the environment. Although entrepreneurship
is of general social and general economic nature, its fate is determined at the level of a single
enterprise and by individual people. Successes of individual people contribute to general
success” (Koźmiński A., 2004).
The data demonstrated show that around 78% of the entrepreneurs under study plan
new investments in their company. Therefore, it can be stated that companies’ owners are

250
very entrepreneurial. It can be the result of the fact that Poles become increasingly aware how
much on the road to success depends on their action.
The results of the conducted study confirm that small and medium-sized enterprises are
characterized by a dynamic approach to the economic environment. Companies from this
sector quickly react to the changing environment and the needs and preferences of the
potential clients. They also have a good knowledge of the market situation. It is connected
with the fact that they undertake new projects and investments more easily, and thus have a
competitive edge over big enterprises, for which it is more difficult to focus on small, local
markets and quickly adjust their offers to even slight changes in consumer preferences. It is
usually unprofitable for them. Therefore, enterprises from the SME sector dominate small and
local markets (Huczek M., 2008).
The fundamental elements constituting the region are: the territory of a given region
and the population inhabiting this area. A region can be described in territorial and formal
terms. “A region is a conventionally designated area, relatively homogenous, characterized by
different natural qualities than in neighbouring areas or by features created in such a way to
meet the economic, social or administrative needs”
(https://umcs.lublin.pl/articles.php?aid=2337. Access: 2.05.2014).
A region can also be understood in a way defined by the Assembly of European
Regions: “it is a political-territorial-administrative unit placed directly after the central state
authority, having the elected or appointed political representation, with the Regional Council,
constituted by the lower, subordinated territorial units” (http://enrd.ec.europa.eu/pl/home-
page_pl.cfm. Access: 2.05.2014)
In the light of the definitions presented above, a region becomes an increasingly
important public good for local and regional population in the context of globalization and
integration. A region can discourage or attract investors depending on the competitiveness and
attractiveness of its economic, social or natural environment space. The opportunity of regional
development lies in the possibilities of providing potential investors with highly qualified labour
resources, modern communication infrastructure, strong scientific and research facilities, an
extensive network of institutions that support entrepreneurship as well as friendly official and
administrative procedures (Ignatiuk S., 2011).
About 56% of enterprises under study claims that Małopolska region is attractive for
investors who are planning to establish a company (31% claimed they “do not know”, whereas
13% answered that the Małopolska Province is not a good place to carry out business activity).
The relationship between the attractiveness of a region for investors and factors that influence
it is presented in fig. 1.

251
Source: author’s own study. Fig. 1. Factors influencing the attractiveness of Małopolska for investors planning to
establish a company
The survey respondents underlined that spatial planning and advancement of urban
processes are the main decisive factors of attractiveness of Małopolska region. In particular, it
is connected with well developed agglomeration of the so called suburbs – well developed
neighbouring towns and gminas, to which some economic functions can be delegated. The
attractiveness is also related to the distribution of main communication routes and the level of
transport infrastructure development. There are also a lot of other criteria, which seem most
important for some investors (e.g. labour force potential). On the basis of the remaining
respondents answers, the following conclusions concerning the investment attractiveness of
the Małopolska Province can be drawn:
Investment attractiveness is highly related to the level of economic development and
therefore, the Małopolska Province was rated very high by the respondents.
Recently, investment attractiveness of the Małopolska Province has increased which
may be connected with infrastructure expenditure.
Małopolska has big cities or former voivodship cities which act as the engine of
development. Industrial centres and tourist centres are also attractive.
In the local scale, sub-zones of special economic zones play a crucial role in shaping
investment attractiveness, particularly if there are also other forms of entrepreneurship
support (industrial parks, science and technology parks, business incubators). Such
development conditions exist in the Małopolska Province.
Conclusions
1. Modern approach to economic development is mainly connected with searching for
sustainable and safe bases for development of regions. Regional and local economic
programmes focused on entrepreneurship, transfer and commercialisation of technology
as well as on increasing competitiveness require professional institutional reconstruction.

252
In economic practice, it involves the need to create institutions of local development. The
system of supporting entrepreneurship and enterprises in Poland includes the entities
acting on 3 levels: national, voivodship and local.
2. The conducted research study confirms the opinion that Małopolska region is friendly for
the development of the SME sector which is reflected, among others, by its competitive
edge in labour resources and costs as well as activity with regard to investors
(investment offer in particular).
3. In recent years, attractiveness of the region has increased in terms of attracting
technologically advanced activities. In the light of structural diversification of economy
and weak dependence on foreign demand, Małopolska is quite resilient to negative
external influences, which is also a significant asset in the development of the SME
sector.
Bibliography
1. Ignatiuk, S. (2011). Wpływ przedsiębiorstw z sektora MSP na rozwój gospodarczy
północno-wschodniego regionu kraju (The influence of enterprises from the SME sector
on the economic development of the north-west region of the country), Oficyna
Wydawnicza Politechniki Białostockiej (Publishing House of the Białystok University of
Technology), Białystok, pp. 7-20
2. Huczek, M. (2008). Wspieranie rozwoju małych i średnich przedsiębiorstw przez Unię
Europejską na przykładzie Małopolski (Supporting the development of small and
medium-sized enterprises by the European Union on the example of Małopolska),
Zeszyty Naukowe Wyższej Szkoły Humanitas (Scientific Journals of Humanitas
University), no 2, Sosonowiec, pp.9-29
3. https://umcs.lublin.pl/articles.php?aid=2337. Access: 2.05.2014
4. http://enrd.ec.europa.eu/pl/home-page_pl.cfm. Access: 2.05.2014
5. Małe i średnie przedsiębiorstwa a rozwój regionalny (Small and medium-sized
enterprises and the regional development), M. Bąk et al., 2001, Warsaw, pp.23- 34
6. Woźniak, M. (2010). System wspierania małych i średnich przedsiębiorstw w
Małopolsce
(The system of supporting small and medium-sized enterprises in Małopolska), Wyd.
AGH, Kraków. Retrieved: http//www.gate.com.pl/fabrykanauki/plik/full10268.pdf.
Access: 4.03.2014
7. Zuzek, D. 2014, Barriers to development of the innovation potential in the small and
medium – sized enterprises in Poland, (Bariery rozwoju innowacyjności w małych i
średnich przedsiębiorstwach w Polsce), Economic Science For Rural Development,
Jelgava, No. 35, s. 105 – 111
8. Zuzek, D. Mickiewicz, B. (2013). Support instruments for the small and medium
enterprises sector, with a particular focus on areas, (Instrumenty wsparcia dla sektora
małych i średnich przedsiębiorstw, ze szczególnym uwzględnieniem obszarów
chronionych) Rural Development and Entrepreneurships Marketing and Sustainable
Consumption, Jelgava, no. 32, pp. 14-18
9. Zuzek, D. (2011). Problemy w finansowaniu przedsięwzięć innowacyjnych w małych
i średnich przedsiębiorstwach (Problems in financing innovative project in small and
medium enterprises). Polskie Stowarzyszenie Zarządzania Wiedzą, Studia
i Materiały, nr 43, Bydgoszcz, pp 191 – 201.

253
Proceedings of the 2015 International Conference “ECONOMIC SCIENCE FOR RURAL DEVELOPMENT” No39
Jelgava, LLU ESAF, 23-24 April 2015, pp. 253-263
ELECTRIC POWER SECTOR DEVELOPMENT POTENTIAL
Vladimir Jefremov Dr. oec., Head Lecturer at Baltic International Academy, Riga, Latvia
Aleksandrs Rubanovskis Dr. oec., as. prof. at Baltic Psychology and Management Uni-
versity College, Riga, Latvia
Abstract. The author of this article characterizes the energy sector, describes the EU energy
policy and the Latvian electric power market, defines the role of certain renewable energy
resources and related innovative solutions, draws attention to the safe and sustainable
electricity supply; and provides a descriptive analysis of energy resources. The author used the
following scientific research methods: synthesis; method of hypothesis; concretization; system
oriented analysis; functional and value analysis; economic analysis; generalization. The main
research findings are summarized as conclusions and proposals.
Key words: Latvia, high voltage electric power sector, electric power policy, power resources,
safe power supply
JEL code: L94, Q28
Introduction
Electric power is indispensable in modern society and economy. Because of the
population growth and improvement of living standards we will need even more energy in the
future. The increase of interest in sustainable energy sources in different countries around the
world is also closely linked to a constant decrease of fossil energy sources and ecology
degradation linked to gas emissions leading to greenhouse effect. Additionally, energy
business exists in a dynamic environment, constantly changing under the influence of political,
ecological, geopolitical, economic and social factors.
Growing demand on SES in industrially developed countries leads to cost reduction
because of production development; which makes it easier for the developing countries to get
access to the projects on SES application.
The goal of the research - to determine the Latvian electricity sector development
potential.
The tasks of the research: to describe the energy sector and the electric power market
in Latvia, to feature the EU policy in the sector of electric power and to determine the
significance of innovative solutions related to the renewable energy resources, thus promoting
the solution of the problem of safe and sustainable power supply.
The object of research– Latvian electric power sector.
The subject of research – generation of electric power and the development of the
security of the electric power supply.

254
The novelty of the research: the author has carried out an integrated research and
estimative analysis of not only well known, but also innovative approaches to the solution of
problems related to electric power generation and supply.
The methods of research: method of synthesis allows the researched object and its
elements being analysed as a whole and separately, how these elements integrate and
interwork; method of hypothesis is applied to investigate processes and phenomena, based on
the adopted working hypothesis; method of concretization is applied to investigate processes
on the basis of their real eksistence; system oriented analysis is applied to investigate
processes assuming that the object of investigation is a complex problem existing in an
integrated process; functional and value analysis is applied to investigate processes through
their functions and values; economic analysis is applied to study the investigated object as a
complicated part of the whole and from the standpoint of economics; method of generalization
is applied to move from particular facts to generalized conclusions.
The author of the present research puts forward the following hypothesis: by using
available energy resources and developing them, using potentially advantageous
interconnections supplying electric power through the EU overall electric power system, and
developing electricity market mechanisms, Latvia can be provided with safe and sustainable
supply of reguired amount of electric power.
Major information resources – EU directives, specialized literature, statistical data.
Due to the limited size of the present article, its primary focus is mostly on the electric
power sector.
Brief assessment of electric power industry
Electric power is a basic industry with a huge volume of capital investment, production
density, a high level of mechanization and automation of production processes. As an industrial
branch, energy sector has a pronounced effect on the performance of all other industries both
production and service.
Electric power complex features a huge industry which includes extraction and
processing of energy sources, their transportation, generation of electricity and heating
energy, their distribution and consumption.
Historically the sector of electric power developed alongside with the growth of
production and consumption. However, the development within the EU caused dramatic
changes which led to the subsequent changes in energy supplier and consumer relations,
energy supply market monopolization, introduction of competition elements and, as a result,
electricity market democratization. Eventually, all the points mentioned will create a united
European electric energy market. Figure 1 shows the relations among energy producers and
consumers, suppliers (including residential sector) and the external environment.

255
Source: author’s construction based on publications in the journal JSC Latvijas Gaze No.1/2008
Fig. 1. Relations of energy producers with the external environment
Energy can be generated by Daugava HESs, smaller HESs, wind farms, power
generators from biomass and others. The formation of the consolidated EU energy sector is
assisted by EU regulation documents.
Basic tools of electric power policy in the EU
Part of the Latvian politicians and some scientists believed that it is possible to buy
profitable on Russian energy and electricity. As a result, the Riga thermal power plants
generate electricity and heat from the Russian gas. However, experience shows that in recent
years, such a choice was wrong. Russia is using its energy resources to political pressure. So it
can be said that Latvia has to join the EU common energy policy which focuses on independent
energy resources, the diversity of sources of supply, the free energy market and sustainable
natural resources to produce electricity.
The policies of the EU member states in the power industry sector, including electric
power, are regulated by the EU. The use of primary and secondary energy sources became the
responsibility of separate EU member states, which can determine possibilities, structures of
primary sources and energy processing cycles at their own discretion.
In the context of this article the relevant EU framework documents are the Directive
2002/91/EC of the European parliament and of the Council of 16 December 2002 on the
energy performance of buildings, European Council Directive 93/76/EEC to limit carbon dioxide
emissions by improving energy efficiency (SAVE), the Directive 2003/55/EC of the European
Parliament and of the Council of 26 June 2003 concerning common rules for the internal
market in natural gas, the Directive 2003/54/EC of the European parliament and of the Council
of 26 June 2003 concerning common rules for the internal market in electricity, European
Parliament legislative resolution of 17 December 2008 on the proposal for a directive of the
European Parliament and of the Council on the promotion of the use of energy from renewable
sources.
The principles of energy policy for Europe were elaborated by the European Commission
in the document “European strategy for sustainable, competitive and secure energy” published
on 8 March 2006 and referred to as “green paper”.
Electric power producers
Fuel
markets Consumers
Material markets
Other markets Financial markets State
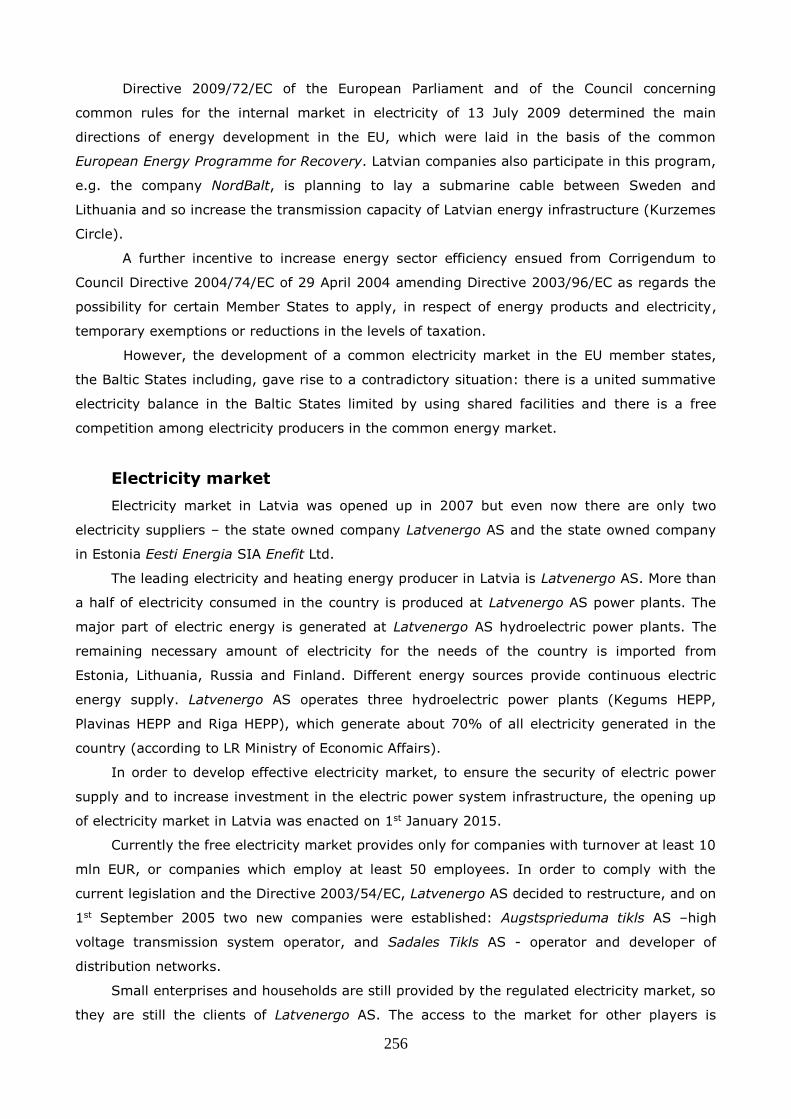
256
Directive 2009/72/EC of the European Parliament and of the Council concerning
common rules for the internal market in electricity of 13 July 2009 determined the main
directions of energy development in the EU, which were laid in the basis of the common
European Energy Programme for Recovery. Latvian companies also participate in this program,
e.g. the company NordBalt, is planning to lay a submarine cable between Sweden and
Lithuania and so increase the transmission capacity of Latvian energy infrastructure (Kurzemes
Circle).
A further incentive to increase energy sector efficiency ensued from Corrigendum to
Council Directive 2004/74/EC of 29 April 2004 amending Directive 2003/96/EC as regards the
possibility for certain Member States to apply, in respect of energy products and electricity,
temporary exemptions or reductions in the levels of taxation.
However, the development of a common electricity market in the EU member states,
the Baltic States including, gave rise to a contradictory situation: there is a united summative
electricity balance in the Baltic States limited by using shared facilities and there is a free
competition among electricity producers in the common energy market.
Electricity market
Electricity market in Latvia was opened up in 2007 but even now there are only two
electricity suppliers – the state owned company Latvenergo AS and the state owned company
in Estonia Eesti Energia SIA Enefit Ltd.
The leading electricity and heating energy producer in Latvia is Latvenergo AS. More than
a half of electricity consumed in the country is produced at Latvenergo AS power plants. The
major part of electric energy is generated at Latvenergo AS hydroelectric power plants. The
remaining necessary amount of electricity for the needs of the country is imported from
Estonia, Lithuania, Russia and Finland. Different energy sources provide continuous electric
energy supply. Latvenergo AS operates three hydroelectric power plants (Kegums HEPP,
Plavinas HEPP and Riga HEPP), which generate about 70% of all electricity generated in the
country (according to LR Ministry of Economic Affairs).
In order to develop effective electricity market, to ensure the security of electric power
supply and to increase investment in the electric power system infrastructure, the opening up
of electricity market in Latvia was enacted on 1st January 2015.
Currently the free electricity market provides only for companies with turnover at least 10
mln EUR, or companies which employ at least 50 employees. In order to comply with the
current legislation and the Directive 2003/54/EC, Latvenergo AS decided to restructure, and on
1st September 2005 two new companies were established: Augstsprieduma tikls AS –high
voltage transmission system operator, and Sadales Tikls AS - operator and developer of
distribution networks.
Small enterprises and households are still provided by the regulated electricity market, so
they are still the clients of Latvenergo AS. The access to the market for other players is

257
hurdled also because the electricity companies Sadales tikls AS and Augstsprieguma tikls AS
are separated from Latvenergo AS only formally and still operate as Latvenergo AS
subsidiaries. This situation was partly changed in 2013 by the introduction of the EU Third
Energy Package in Latvia, which advised ownership unbundling, i.e. the separation of
companies’ generation and sale operations from transmission networks.
Sustainable energy sources
Latvia stated the aim to achieve the level of 40% of all generated electricity from
sustainable energy sources. Application of “new” sustainable energy sources, such as biogas
and wind comprises only 1% of the whole volume of electricity produced. The development of
“new” sustainable energy sources is hurdled by a vague legislation and insufficient government
support in this field. From the point of view of the government with regard to activities in the
field of sustainable energy, the most perspective kinds of “green” energy in Latvia are biomass
(Biomass Energy Centre (2012); Boundy B. et al (2011); Darby, T. (2014); Klass D.L. (1998)
and biogas (Quaak P. et al (2009). These particular directions are likely to be strongly
supported by the state in the foreseeable future. Table 1 shows the dynamics in the electricity
capacity of electricity plants and cogeneration plants operating on sustainable energy
resources.
Table 1
Electricity capacity of power plants and cogeneration plants using sustainable
energy resources, MW
1990 1995 2000 2010 2011 2012 2013
Total 1 487 1 508 1 515 1 622 1 642 1 701 1 755
Hydro electrical power plants 1 487 1 507 1 513 1 576 1 576 1 576 1 580
Wind power plants - 1 2 30 36 59 67
Electricity plants operating on
biomass and cogeneration
plants
- - - 5 5 23 55
Biogas cogeneration plants - - - 11 25 43 53 Source: https://www.em.gov.lv/lv/nozares_politika/atjaunojama_energija_un_kogeneracija/.
The content of Table 1 allows coming to the following conclusions:
1. For the period of 23 years electric power capacity increased in total by 18%, HES
capacity increase by 6.3% including.
2. The electricity capacity of the wind, biomass, biogas and cogeneration power stations
has begun to grow steadily since 2010 and currently their performance is viewed as
promising.
The major companies in the energy industry of Latvia according to net turnover are
presented in Table 2.
Currently the energy infrastructure is being reorganized and developed by means of EU co-
financing. Latvenergo AS is implementing a building project of a new energy network with

258
voltage about 330 kV (total length 330 km and capacity - 800 MW), the so called Kurzemes
Circle (Kurzemes Loks): Grobina – Ventspils- Tume – Imanta (Riga) – TEPP 1 (Riga). Building
of powerful networks in the region will allow wind power plants to develop both on land and
sea. In 2014 the research was undertaken on the building of trans-border gas pipes for
liquefied natural gas (LNG), which would make Latvia less dependable on the gas supply from
Russia and also possibly would make Latvia the centre of gas supply in the region.
Table 2
Major companies in the energy industry
No Company Activities Net
turnover in
2013
million EUR
Net
turnover in
2012
million EUR
Turnover
change,
from 2012
to 2013, %
Profit in
2013,
million
EUR
Staff in
2013,
people
1. Latvenergo AS electricity
production
867.60 811.54 7% 28. 9 1 387
2. Sadales tikls AS electricity
supply
299.57 355.51 -16% - 2 820
3. Baltenergotra-
de Ltd
electricity
supply
28.10 52.19 -46% 1.68 4
Source: LR Central Statistical Department of Latvia.
As it is seen from Table 2 Latvenergo AS and its subsidiary Sadales tikls AS monopolize
the electric power sector of Latvia.
Innovative solutions
Currently, in Latvia more and more attention is paid to such an innovative solution, as
sustainable energy source utilization. In this respect biomass is considered to be one of the
most important directions of development. The notion “biomass” is related to any substances
of plant origin, which can be used to generate energy, including wood, grass, plant and wood
waste and many others. Biomass energy has significant advantages compared to fossil types of
fuels. The basic advantages of biomass are:
- easy accessibility even in distant places: biomass fuel is accessible everywhere where the
trees and agricultural plants grow as well as where people process food products and
fibres;
- good storability: biomass is the source of energy that can be stored and used at any
moment when energy generation becomes necessary; other sustainable sources are
unstable and/or seasonal;
- versatility: biomass is a potential source of basic energy products in many forms – liquid,
gas, heat and electricity;
- ecological safety: provided that the process of generation and consumption are ecologically
friendly biomass energy does not cause a change in climate and greenhouse effect;
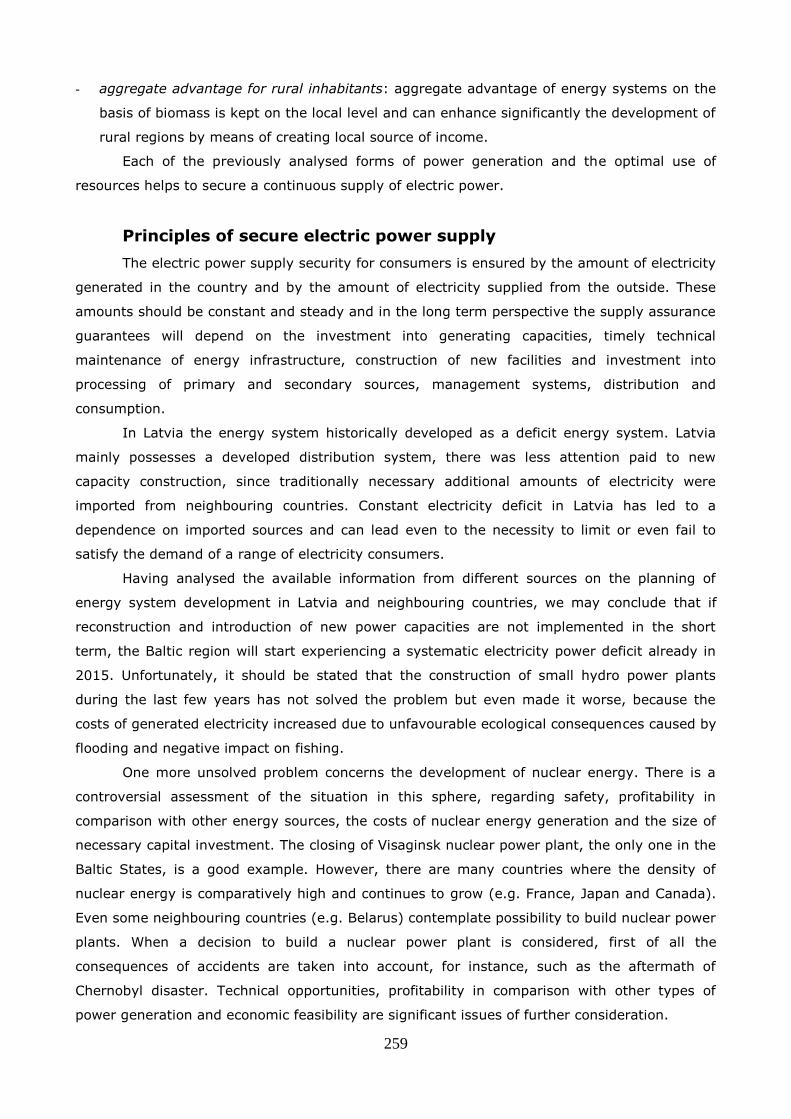
259
- aggregate advantage for rural inhabitants: aggregate advantage of energy systems on the
basis of biomass is kept on the local level and can enhance significantly the development of
rural regions by means of creating local source of income.
Each of the previously analysed forms of power generation and the optimal use of
resources helps to secure a continuous supply of electric power.
Principles of secure electric power supply
The electric power supply security for consumers is ensured by the amount of electricity
generated in the country and by the amount of electricity supplied from the outside. These
amounts should be constant and steady and in the long term perspective the supply assurance
guarantees will depend on the investment into generating capacities, timely technical
maintenance of energy infrastructure, construction of new facilities and investment into
processing of primary and secondary sources, management systems, distribution and
consumption.
In Latvia the energy system historically developed as a deficit energy system. Latvia
mainly possesses a developed distribution system, there was less attention paid to new
capacity construction, since traditionally necessary additional amounts of electricity were
imported from neighbouring countries. Constant electricity deficit in Latvia has led to a
dependence on imported sources and can lead even to the necessity to limit or even fail to
satisfy the demand of a range of electricity consumers.
Having analysed the available information from different sources on the planning of
energy system development in Latvia and neighbouring countries, we may conclude that if
reconstruction and introduction of new power capacities are not implemented in the short
term, the Baltic region will start experiencing a systematic electricity power deficit already in
2015. Unfortunately, it should be stated that the construction of small hydro power plants
during the last few years has not solved the problem but even made it worse, because the
costs of generated electricity increased due to unfavourable ecological consequences caused by
flooding and negative impact on fishing.
One more unsolved problem concerns the development of nuclear energy. There is a
controversial assessment of the situation in this sphere, regarding safety, profitability in
comparison with other energy sources, the costs of nuclear energy generation and the size of
necessary capital investment. The closing of Visaginsk nuclear power plant, the only one in the
Baltic States, is a good example. However, there are many countries where the density of
nuclear energy is comparatively high and continues to grow (e.g. France, Japan and Canada).
Even some neighbouring countries (e.g. Belarus) contemplate possibility to build nuclear power
plants. When a decision to build a nuclear power plant is considered, first of all the
consequences of accidents are taken into account, for instance, such as the aftermath of
Chernobyl disaster. Technical opportunities, profitability in comparison with other types of
power generation and economic feasibility are significant issues of further consideration.

260
For Latvia it is necessary to evaluate the amount of power energy necessary for a stable
development of national economy; to foresee repercussions of energy supply shortage; to
consider import opportunities, price fluctuations and other factors that may endanger a secure
and stable electric power supply.
The main problem is a signify-cant deterioration of power plant equipment and the
possibility of their closing in the period of up to 2025.
Energy source characteristics
In Latvia various resources for building new electric power plants are potentially
accessible: solar, wind, hydro, wood and coal. (Journal “Energy and Automation” No
(02)2008).
In order to solve the problem of secure power supply and enter the EU common energy
market on conditions of equality, Latvia needs to solve the following problems:
- to restructure the systems of generation, supply and distribution of electricity;
- to provide a technical capacity of commutation among the electric networks in the
common EU energy system when necessary;
- to regulate market mechanisms for making the best use of the energy market.
Table 3
Advantages and disadvantages of various energy sources
Energy
type
Advantages Disadvantages
Solar
energy
1. Perennial or permanent source
2. Low cost of maintenance
3. Long term (about 25-30
years).
1. Low power, especially in winter
2. Significant investments
3. The uneven proportion of "solar" weather.
Wind
energy
1. The presence of the wind
climate (usually the seaside)
2. Endless resource
3. Low cost of maintenance.
1. The source is not stable and predictable;
2. Not evenly placed;
3. The production technology is very
expensive;
4. Optimum wind velocity is 10-15 m/s
(average rate in Latvia 6 m/s);
5. Land areas excluded from use.
Hydro
energy
1. No hazardous waste
2. Cheapest source of energy
3. Low operating costs
4. High efficiency.
1. Negative impact on the environment
(flooding, fish migration)
2. Changes of waterfront line
3. High financial costs and investment in
technology
4. Shallowing of rivers.
Wood
1. Use of sustainable resources
2. Low production costs.
1. The possibility of increasing the sources
2. High investment costs on infrastructure
3. Fluctuations in consumption are difficult to
control.
Coal
1. Large selection of suppliers
2. Lower cost, especially in
comparison with natural gas.
1. Environmentally unfriendly
2. Pollution
3. Dependence on imports. Source: author’s construction based on journals Energy and Automation No (01)2008; Energy and World
No. (1) 2008)
261
The first problem has been successfully approached by adopting the EU Directives and
starting the process of restructuring the systems of generation, supply and distribution of
electric power. The other two tasks remain relevant and their technical, legal and economic
solutions are still in the making.
Conclusions and suggestions
The hypothesis is proven.
The primary objective of electric power industry development is to provide quality,
sufficient, reliable and sustainable sources of electricity for the national economy and general
population
EU directives are driven electricity sector to a liberal market.
The responsibility for efficient use of primary and secondary energy sources rests fully
with the EU member states, which define the structure and shape of their national power
industry on the basis of their capabilities and preferences.
Opening up the energy market in Latvia was connected with considerable difficulties
because of the monopolistic position of the state owned company Latvenergo AS.
After adopting the EU directives in the field of energy, Latvia successfully started the
process of opening up the energy market, although there are still the following problems that
remained to be solved :
- electricity production, supply and distribution structure reorganization (the solution of
the problem is at the final stage);
- development of technical capacity to commute between energy networks in Latvia and
other EU member states;
- development of market mechanisms which allow acting to the best national advantage
at the energy markets of the EU countries.
Secure electricity supply is based on the principle of continuous generating of domestic
production supplemented by long term and secure energy import. Developing new energy
capacity it is essential to estimate accessibility, efficiency and other parameters of a
corresponding energy source be it solar, hydro, wood, coal or any other source of energy.
Utilization of sustainable energy sources has a range of obvious advantages compared
with traditional energy sources:
- it lowers the damage to the environment and reduces the costs of recycling power industry
waste;
- sources of renewable energy are inexhaustible;
- pay-back period of energy facility construction based on sustainable energy sources is
significantly shorter than that of fossil fuel power plants;
- the costs of providing decentralized consumers and smaller regions with energy are lower;
- sustainable energy sources are closer to the consumer, which reduces transportation costs;

262
- energy systems based of renewable energy sources enhance sustainable development of
economics and environment protection.
Apart from numerous advantages there are certain restrictions arising from the nature
of sustainable energy sources:
- the construction of wind farms needs large spaces and significant capital
investments as wind power by nature is capital intensive;
- for electric power plants using sustainable sources of energy, such as biomass,
wood remains the largest biomass energy source to date but burning it produces
air pollution;
- the capacity of producing electricity from solar energy depends mostly on the
amount of sunlight and cost of equipment. Long winter periods and moderate
solar activity which are explained by Latvia’s geographical location are limiting
factors in this respect.
Literature sources
1. Council Directive 1993/76/EEC to limit carbon dioxide emissions by improving energy
efficiency (SAVE) http://eur-lex.europa.eu/legal-content/EN/TXT/?uri=CELEX:31993L0076
2. Council Directive 2002/55/EC on the marketing of vegetable seed http://eur-
lex.europa.eu/legal-content/en/ALL/?uri=CELEX:32002L0055
3. Council Directive 2002/91/EC on the energy performance of buildings http://eur-
lex.europa.eu/legal-content/EN/TXT/?uri=CELEX:32002L0091
4. Council Directive 2003/54/EC concerning common rules for the internal market in electricity
http://eur-lex.europa.eu/legal-content/en/ALL/?uri=CELEX:32003L0054
5. Council Directive 2003/96/EC restructuring the Community framework for the taxation of
energy products and electricity http://eur-
lex.europa.eu/LexUriServ/LexUriServ.do?uri=OJ:L:2003:283:0051:0070:EN:PDF
6. Council Directive 2004/8/EC on the promotion of cogeneration based on a useful heat
demand in the internal energy market http://eur-lex.europa.eu/legal-
content/EN/TXT/?uri=CELEX:32004L0008
7. Council Directive 2004/74/EC amending Directive 2003/96/EC as regards the possibility for
certain Member States to apply, in respect of energy products and electricity, temporary
exemptions or reductions in the levels of taxation (OJ L 157, 30.4.2004) http://eur-
lex.europa.eu/eli/dir/2004/74?locale=LV
8. Council Directive 2005/32/EC establishing a framework for the setting of ecodesign
requirements for energy-using products http://eur-
lex.europa.eu/LexUriServ/LexUriServ.do?uri=OJ:L:2005:191:0029:0058:en:PDF
9. Council Directive 2009/72/EC concerning common rules for the internal market in electricity http://eur-lex.europa.eu/LexUriServ/LexUriServ.do?uri=OJ:L:2009:211:0055:0093:EN:PDF
10. Biomass Energy Centre (2012). Retrieved from http://www.biomassenergycentre.org.
uk/portal/page?_pageid=76,15049&_dad=portal&_schema=PORTAL
11. Boundy B., Diegel S.W., Wrightn L., Davis S.C. (2011) Biomass Energy Data Book.
Retrieved from http://cta.ornl.gov/bedb

263
12. Darby, T. (2014). What Is Biomass? Retrieved from
http://www.realworldenergy.com/what-is-biomass-renewable-energy/
13. Energetika un automatizacija: zurnals par energetikas nozari. (Energy and Automation:
Power Industry Journal) - Nr.(01)2008
14. Energija un Pasaule: zurnals par energetikas nozari. (Energy and the World: Power
Industry Journal)- Nr. (1) 2008
15. Energetikas attistibas pamatnostadnes 2007.-2016. gadam (Informativa daļa) Riga:
Latvijas Republikas Ekonomikas ministrija, 2006. (Energy Development Guidelines for 2007 –
2016, Informational Part. Riga: LR Ministry of Economic Affairs, 2006)
16. Klass D.L. (1998). Biomass for Renewable Energy, Fuels, and Chemicals. Academic
Press, p. 651, ISBN: 978-0-12-410950-6
17. Kurzemes loks (Kurzemes circle).
http://www.ast.lv/lat/par_ast/parvades_tikls/kurzemes_loks
18. LR CSP (LR Central Statistical Department) http://www.csb.gov.lv/.../energetika-
galvenie -raditaji
19. Latvijas Republikas Ekonomikas ministrija (LR Ministry of Economic Affairs)
https://www.em.gov.lv/lv/nozares_politika/atjaunojama_energija_un_kogeneracija/
20. Quaak P., Knoef H., Stassen H. (2009). Energy from Biomass, A Review of Combustion
and Gasification Technologies, World Bank Technical Paper No. 422, Energy Series, The World
Bank, Washington, USA.