Embed Size (px)
Citation preview

Economic Stabilization in the Post-Crisis World: Are Fiscal Rules the Answer?
March 18, 2014
U. Michael Bergman Michael Hutchison Institute of Economics Department of Economics, E2 University of Copenhagen University of California, Santa Cruz Øster Farimagsgade 5, Building 26 Santa Cruz, CA 95064 USA Copenhagen K, Denmark [email protected] [email protected]
Abstract
This paper investigates the efficacy of fiscal rules in reducing the procyclical nature of fiscal policy. Fiscal rules have been an increasing popular mechanism by which to frame fiscal policy, but relatively little cross-country empirical work has investigated its effectiveness, especially in emerging and developing economies. We investigate whether fiscal rules help to reduce the extent of policy procyclicality—how government expenditure policy responds to GDP-- in a panel framework with 81 advanced, emerging and developing countries over 1985-2012. We develop unique fiscal rule indices and investigate whether rules help to dampen procyclical policies. We condition our empirical specifications on the degree to which governments appear able to manage and enforce fiscal rules. We find that national fiscal rules are very effective in reducing pro-cyclicality of policy once a minimum threshold of government efficiency/quality has been reached. Government efficiency alone is not enough to reduce procyclicality of fiscal policy, but high government efficiency combined with fiscal rules is a potent combination that greatly reduces procyclicality and, at a particular threshold levels of rules and government efficiency, may induce counter-cyclical policy responses to GDP movements. We also find evidence that supranational rules are mainly effective in reducing procyclicality in countries with quite weak government efficiency. _____________________________________________________________________________ This paper was prepared for the Journal of International Money and Finance / University of Southern California conference, “Financial adjustment in the aftermath of the global crisis 2008-9: New global order?” April 18-9, 2014.
0

1. Introduction
The “Great Moderation”—the reduction of business cycles amplitudes around the world
during the two decades prior to the global financial crisis-- lulled many academics, policymakers
and practitioners into thinking that extreme fluctuations in GDP growth, unemployment and the
real economy were no longer serious problems, and that the traditional focus of macroeconomic
policy as a force to counteract business cycles was anachronistic. This changed overnight with
the global financial crisis (GFC) and attempts at governments to stimulate economies that in
many cases were facing the largest economic downturns since the 1930s. With monetary policies
constrained at lower zero interest rate boundaries, a critical issue that arose in tandem with large-
scale fiscal expansions was whether these policies would compromise longer-term sovereign
debt solvency, and in many cases governments were constrained by increased financing costs to
fund deficit-based fiscal expansions because of the lack of market confidence in new sovereign
debt issues. Many advanced economies, including a number in the EU and the United States, saw
credit ratings on their sovereign debt reduced by credit rating agencies following large deficit
stimulus packages and political turmoil. This is also a key element in the debate over whether
emerging/developing economies should employ contractionary or expansionary monetary and
fiscal policies when facing a financial crisis and deep recessions (see Stigliz, 1999a,b, and
Fischer, 1998, for contrasting views that in part reflected different viewpoints of the World Bank
and the IMF in the aftermath of the 1997-98 Asian Financial Crisis).
In this context the question arises over how countries can pursue activist fiscal stabilization
policies during economic downturns while at the same time keeping policies, and government
debt growth in particular, on sustainable longer-term trajectories. Not surprisingly, an
approximate mechanical solution to achieve debt sustainability is that countries pursuing fiscal
stimulus measures during downturns in the business cycle are followed by fiscal contractionary
(and debt reducing or moderating) measures during upturns in the business cycle, i.e. counter-
cyclical fiscal policy.
Activist countercyclical policies would seem desirable for debt management as well as output
stabilization purposes. For example, the theoretical contributions of Christiano, Eichenbaum and
Rebelo (2011) and Nakata (2011) suggest that the optimal fiscal policy in a stochastic model
with sticky prices is countercyclical. Both papers show that countercyclical fiscal policy is even
more effective when monetary policy has become powerless because the policy interest rate has
1

hit the zero bound. Why then is fiscal policy observed to be procyclical in so many countries,
especially in emerging and developing economies? In the Tornell and Velasco (1999) model, for
example, several policy makers interacting strategically may create a “voracity effect” that
causes procyclicality of fiscal policy. If fiscal policy is decided on a decentralized basis, with
many interest groups vying for their share of the local spoils, standard smoothing behavior
breaks down, and groups spend too large share of temporary positive income shocks — that is,
they save too little during booms. Of course, the political economy plausibly unfolds differently
under different political arrangements or institutions.1
Although this seems a seemingly straight-forward economic solution to the debt
sustainability/business cycle stabilization conundrum, the political and institutional environments
facing many countries has complicated the task. This has led to renewed emphasis over fiscal
rules and institutions (e.g. fiscal councils), especially after the Global Financial Crisis (GFC) and
in the context of the European sovereign debt crisis (European Commission, 2012; Bergman, et
al., 2013). This discussion has encompassed advanced, emerging and developing economies
(IMF, 2009), and focuses on how fiscal institutional frameworks may shape the evolution and
effectiveness of fiscal policy and economic outcomes.
Although the popularity of fiscal rules, essentially guiding and also constraining fiscal policy
actions, has increased markedly in recent years, relatively little work on the functioning and
effectiveness of rules has been undertaken, especially for emerging and developing economies.
This is in stark contrast to the large volume of work on the popularity and role of monetary rules,
and inflation targeting in particular, on the conduct of monetary policy and economic
performance (inflation, output, and so on). Moreover, the work on fiscal rules in advanced
economies has largely focused on European countries that are members of the EU. Bergman et
al. (2013), for example, discuss the balance between market pressure and fiscal rules in order to
keep public finances on a sustainable path in the European context. They provide empirical
evidence on market assessments of sovereign default risk to economic news, announcements of
national austerity programs, EU programs designed to support government finances, and banking
fragility emanating from several countries in the euro area affected by the European sovereign
debt crisis. They conclude that the quality of market signals is an insufficient indicator alone to
1 Cespedes and Velasco (2014) review this literature.
2

accurately guide the conduct of fiscal policy, particularly during the crisis period. They suggest
that market signals should be used to complement fiscal rules rather than serving as a substitute.
This paper evaluates fiscal rules and evaluates their effectiveness in helping to dampen the
procyclical nature of fiscal policies, potentially leading to less pronounced business cycle
fluctuations. By investigating the operational characteristics, functionality and effectiveness of
fiscal rules, our work is a natural complement to the large body of literature on monetary rules.
Our work extends previous work on fiscal rules by addressing the issue for emerging and
developing economies as well as advanced economies, considering the role of supranational
rules as well as national fiscal rules, examining the interactions among fiscal rules and the
efficiency of government. Including emerging and developing economies in our investigation is
important because business cycles are generally more volatile in emerging market and
developing economies than advanced economies and, in addition, fiscal policies are generally
procyclical in emerging and developing economies, i.e. stimulus policies followed during
upswings in the business cycle and contractionary policies during downturns, with this
characteristic less pronounced or absent in advanced economies.2,3 The immediate policy
concern, of course, is that procyclical macroeconomic policies may have significantly
contributed to the high volatility of business cycles in emerging and developing economies,
especially relative to the business cycles in advanced economies.
An important aspect of our work is the focus on the extent to which the effectiveness of fiscal
rules in generating counter-cyclical policy responses is conditional upon the effectiveness of
government administration. The “efficiency” of government has been investigated by a number
of researchers in various contexts. Calderón et al. (2012), in a recent paper, consider the role of
government administrative quality in shaping fiscal outcomes. Using a world sample of 115
advanced, emerging and developing countries for 1984-2008, they find that the level of
institutional quality plays a key role in countries' ability to implement counter-cyclical
macroeconomic policies. The results show that countries with strong (weak) institutions adopt
2 See, for example, Balassone and Kumar (2007), Ilzetzki and Vegh (2008), Kaminski et al. (2004), Hausmann and Stein (1996), Gavin and Perotti (1997), Talvi and Vegh (2005), Melitz (2000), and Gali and Perotti (2002). Cespedes and Velasco (2014) find evidence of reduced fiscal pro-cyclicality in a number of countries. 3 Frankel et al. (2012) argue that a number of emerging markets have “graduated” to the fiscal procylical group over the past decade. They point to Chile as a particularly successful case. Chile has followed a fiscal rule since 2001 that has a structural (i.e., cyclically-adjusted) fiscal balance as its target. By construction, such a rule ensures that temporarily high fiscal revenues are saved rather than spent.
3

counter- (pro-) cyclical macroeconomic policies, reflected in extended monetary policy and
fiscal policy rules. The threshold level of institutional quality at which monetary and fiscal
policies are a-cyclical is found to be similar. In this context, we seek to determine whether fiscal
rules are significant determinant of countries’ abilities to implement counter-cyclical fiscal
policy once controlling for institutional quality, and whether the effectiveness of fiscal rules is in
fact enhanced when employed in environments associated with strong institutions.
More specially, we investigate fiscal policy rules and government expenditures for 81
countries over 1985-2012. We evaluate the effectiveness of rules, both national and
supranational, in generating counter-cyclical government expenditure responses within the
context of a dynamic panel fixed-effects regression model. To this end, we develop a unique
fiscal rules index, varying across countries and over time, based on 28 specific characteristics of
rules using the IMF FAD data base as our underlying data source on legislative and practical
constraints on government fiscal policy. We also examine the connection between government
expenditure policy cyclicality, fiscal rules and the efficiency of government. Higher quality of
government has been found to be correlated with less procyclicality of fiscal policy. Our focus
here is on whether the effectiveness of fiscal rules in reducing procyclicality is related to how
well they are enforced, where enforcement is measured by the efficiency of government
bureaucracy. Pursuing this avenue of research, we employ the World Bank “efficiency of
government bureaucracy” index, part of the World Bank “Worldwide Governance Indicators,
2013 Update” (WGI) project research dataset. This indicator measures perceptions of the quality
of public services, the quality of the civil service and the degree of its independence from
political pressures, the quality of policy formulation and implementation, and the credibility of
the government's commitment to such policies.
Previewing the results, we find that national fiscal rules are highly effective in reducing the
procyclicality of government expenditure policy. We also find that measuring the interaction of
fiscal rules and bureaucratic efficiency is complicated by their high correlation—countries with
stronger rules also tend to have more efficient government bureaucracies. Separating the sample
into four categories of government efficiency—low, moderate, good and high—we find that
rules are not effective in the lowest category, but highly and at least equally effective at reducing
procyclicality once government efficiency reaches the moderate threshold. We also find that
4

supranational rules are only effective when combined with high level of government efficiency
in which to enforce the rules.
Section 2 describes the data employed in the paper, especially the construction of fiscal rules
and government efficiency. Section 3 presents some descriptive material and statistics on fiscal
institutions and rules in emerging and developing economies. We demonstrate that fiscal rules
have become increasingly popular over the past two decades. In addition, we present some
statistics on the real GDP fluctuations and the cyclical of fiscal. Section 4 presents the empirical
results. Section 5 concludes.
2. Data
This section describes briefly the definition and sources of the data used in our empirical
analysis. Further details on data sources, description and construction are provided in the Data
Appendix. We employ annual data for a large sample of advanced, emerging and developing
economies. (Quarterly data is generally not available for fiscal policy indictors for emerging and
developing economies.) The availability of data on fiscal rules, also only available on an annual
basis, restricts our country sample to 81 countries for the period 1985-2012.
Our fiscal rule composite measure is an index measuring the overall strength of fiscal rules in
a given country in a given year. The underlying source of the various fiscal rule components is
from the “Fiscal Rules Dataset, 2012” (FAD) from the Fiscal Affair Department of the
International Monetary Fund. Schaechter, Kinda, Budina, and Weber (2012) discuss the
construction and details of the dataset. The dataset includes information about national (applied
on central of general government) and supranational fiscal rules for 81 countries that are
members of the IMF. Fiscal rules are defined as longer-lasting constraints on fiscal policy
through numerical limits on budgetary aggregates. The data is available from 1985-2012 and
includes information on 28 characteristics of national rules in the following categories4: (i) Type
of rule, (ii) Year of implementation and year of major revisions, (iii) Number of rules, (iv) Legal
basis, (v) Coverage---level of government, (vi) Monitoring procedures, (vii) Enforcement
procedures, (viii) Institutional supporting features (Multi-year expenditure ceilings; Fiscal
responsibility laws; independent council providing budget assumptions; independent council
4 We do not employ data on supranational rules as they often overlap with national rules and, most importantly, only apply in monetary unions.
5

monitoring implementation), and (ix) Stabilization features (Budget balance rule accounting for
the cycle; investment excluded). We employ two measures of rules: the number of national fiscal
rules and the strength of national fiscal rules.
We develop a composite fiscal rules indicator from the IMF database using a similar
procedure as Schaechter, Kinda, Budina and Weber (2012). We follow their method and
construct indices that incorporate five main characteristics (monitoring, enforcement, coverage,
the legal basis and escape clauses) for each of the four types of fiscal rules (budget balance rules,
debt rules, expenditure rules, and revenue rules).5 In addition to these characteristics we also add
information about supporting procedures and institutions (multi-year expenditure ceilings
implemented at the aggregate level, by ministry of by line item), whether there is an independent
body setting budget assumptions, information about transparency and accountability, whether a
balanced budget target is defined and whether there are rules excluding public investments or
other priority items from the ceiling. This adds eight characteristics to the 20 mentioned above,
for a total of 28 characteristics.
To construct an overall index measuring the strength of national fiscal rules (NFRI) we first
normalize all 28 sub indices to lie between 0 and 1.6 Then we sum over all characteristics to
obtain a total index capturing the strength of national fiscal rules in each country using equal
weights. Finally, we normalize such that this index lies between 0 and 4 the former implies that
there are no national fiscal rules implemented in a country whereas the latter implies maximum
strength.
We construct two indices on rules, one for national rules (NFRI) and one for supranational
rules (SFRI). Some countries have national balanced budget rules and debt rules that also are
supranational rules, e.g. countries such as Austria and Spain, supranational rules were introduced
first and then national balanced budget and debt rules followed. Details on the nature of
supranational fiscal rules are given in appendix A-2. We construct an index capturing the
5 It is difficult to know whether monitoring is effective and to what extent escape clauses are used, as discussed in Schaechter et.al. (2012). Unlike Schaechter et al., we include these features when constructing the overall index of fiscal strength. 6 All indicators are 0-1 dummies in the database except for coverage that can take on three values: 2: General government or wider; 1: central government; 0 if there is no coverage and adjusted upward by 0.5 to account for similar rules applying to different levels and legal basis that can take on numbers between 0 and 5; 5: Constitutional; 4: International Treaty, 3: Statutory; 2: Coalition agreement; 1: Political commitment. In case multiple statutory bases apply the higher statutory basis is used. These two indices are normalized to numbers between 0 and 1.
6

strength of the supranational fiscal rules by taking the sum of sub-indices measuring monitoring,
enforcement coverage, legal basis and whether there are well-defined escape clauses for each
type of fiscal rules (budget balance rules, debt rules, expenditure rules, and revenue rules), a total
of 20 characteristics using equal weights and rescaling the total index to lie between 0 and 4.
The “government efficiency” index is from the World Bank “Worldwide Governance
Indicators, 2013 Update” (WGI) project research dataset. This dataset is comprised of data on the
quality of governance provided by a “large number of enterprise, citizen and expert survey
respondents in industrial and developing countries. These data are gathered from a number of
survey institutes, think tanks, non-governmental organizations, international organizations, and
private sector firms.” The WGI consists of aggregate indicators of six broad dimensions of
governance: (i) Voice and Accountability, (ii) Political Stability and Absence of
Violence/Terrorism, (iii) Government Effectiveness, (iv) Regulatory Quality, (v) Rule of Law,
and (vi) Control of Corruption. For our research, we employ the “Government Efficiency”
indicator that reflects perceptions of the quality of public services, the quality of the civil service
and the degree of its independence from political pressures, the quality of policy formulation and
implementation, and the credibility of the government's commitment to such policies. The
government efficiency indicator ranges from -2.5 to 2.5, with higher values indicating greater
government efficiency.
Another variable is the proxy for fiscal policy. A countercyclical fiscal policy involves
lower (higher) government spending and higher (lower) tax rates in good (bad) times. This is
termed a countercyclical because it would tend to stabilize the business cycle (i.e., fiscal policy is
contractionary during expansions and expansionary during contractions). A procyclical is the
opposite, tending to exacerbate the business cycle with expansions in good times and
contractions in bad times. An acyclical fiscal policy involves government spending and tax rates
that do not vary systematically with the business cycle, neither reinforcing nor stabilizing the
business cycle.
In principle one could look at both real government expenditures and tax rates to measure
the cyclicality of policy. Given the difficulty of observing tax rate indicators for a broad group of
countries over time, we focus on real government expenditures. This follows the norm in the
literature (e.g. Kaminsky et al., 2005; Frankel et al., 2011; Calderón et al., 2012; Céspedes and
7

Velasco, 2014)7. Kaminsky et al. (2005) discuss various measures of fiscal policy and argue that
real government expenditures and tax rates are preferable, as an indicator for the cyclicality of
policy, to other indicators such as tax revenues, primary balance, expenditures to GDP ratio, and
the revenue to GDP ratio.8 The advantage of government expenditures is that co-movements
with GDP are able to clearly distinguish between counter-cyclical, procyclical or acyclical fiscal
policy.
3. Methodology
The basic dynamic panel model is estimated as equation (1):
(1) 𝐺𝐸𝑋𝑃𝑖𝑡 = 𝛽0 𝐺𝐸𝑋𝑃𝑖𝑡−1 + 𝛽1 𝐺𝐷𝑃𝑖𝑡 + 𝛽2(𝐺𝐷𝑃𝑖𝑡 ∗ 𝑁𝐹𝑅𝐼𝑖𝑡) + 𝜇𝑖 + 𝜀𝑖𝑡
where 𝛽3 measures the marginal effect of effect of national fiscal rules (NFRI) on cyclical
expenditure (GEXP). 𝜇𝑖 estimates country fixed effects and 𝜀𝑖𝑡 is the error term. 𝛽1 + 𝛽2 ∗
(𝑁𝐹𝑅𝐼𝑖𝑡) is the net procyclicality of fiscal rules (for any given level of rules, 𝑁𝐹𝑅𝐼𝑖𝑡). The model
is a dynamic panel, estimated using Arellano-Bond one-step GMM estimation with country fixed
effects, where we reported coefficient estimates and clustered (around countries) and robust
standard errors. We also report tests of autocorrelation of both first and second order, Hansen J
test statistic for overidentifying restrictions and the Hansen C test statistic test statistic
(difference-in-Hansen) of the null hypothesis that the iv-style instruments are exogenous.
A potential problem when implementing the GMM methods is that the number of
instruments explodes with 𝑇, overall the number of instruments is quadratic in 𝑇. This is also a
potential problem in our panel. Roodman (2009b) discusses many of the potential pitfalls of
instrument proliferation and its consequences, including over fitting of endogenous variables,
bias in estimates and the weakening of Sargan tests.
These issues have not been fully analyzed in the literature and there exists very little
guidance on how to handle this problem in GMM estimation of dynamic panel data models, see
the discussions in Hall and Peixe (2003), Roodman (2009b) and Bontempi and Mammi (2012).
Roodman (2009b) suggests either that the number of instruments is limited to certain lags or a
7 Several papers employ additional fiscal policy indictors. 8 In their own work they point out that there is no systematic data on tax rates, leaving government spending as the best indicator in practice. They show that government spending is able to discriminate among pro-cyclical, counter-cyclical and acyclical policy.
8

method of collapsing the instruments by having separate moments for each lag instead of for
each lag and time period. We will use the latter approach in our empirical application.9
An additional issue is the potential endogeneity issues. The Arellano-Bond GMM estimator
allows us to handle endogeneity using internal instruments. We will assume that GDP is
endogenous and include this variable as a GMM-style instrument (in addition to government
expenditures). All other explanatory variables are assumed to be exogenous and are therefore
included as iv-style instruments.
A similar equation (equation 2) and interpretation of coefficients is estimated to measure the
impact of government efficiency:
(2) 𝐺𝐸𝑋𝑃𝑖𝑡 = 𝛽0 𝐺𝐸𝑋𝑃𝑖𝑡−1 + 𝛽1 𝐺𝐷𝑃𝑖𝑡 + 𝛽2(𝐺𝐷𝑃𝑖𝑡 ∗ 𝐺𝐸𝑖𝑡) + 𝜇𝑖 + 𝜀𝑖𝑡
Finally, to address whether the effectiveness of fiscal rules in reducing procyclicality depends on
the level of government bureaucratic efficiency, we estimate (3):
(3) 𝐺𝐸𝑋𝑃𝑖𝑡 = 𝛽0 𝐺𝐸𝑋𝑃𝑖𝑡−1 + 𝛽1 𝐺𝐷𝑃𝑖𝑡 + 𝛽2(𝐺𝐷𝑃𝑖𝑡 ∗ 𝑁𝐹𝑅𝐼𝑖𝑡) + 𝛽3(𝐺𝐷𝑃𝑖𝑡 ∗ 𝐺𝐸𝑖𝑡) +
𝛽4(𝐺𝐷𝑃𝑖𝑡 ∗ 𝑁𝐹𝑅𝐼𝑖𝑡 ∗ 𝐺𝐸𝑖𝑡) + 𝜇𝑖 + 𝜀𝑖𝑡
where the (𝐺𝐷𝑃𝑖𝑡 ∗ 𝑁𝐹𝑅𝐼𝑖𝑡 ∗ 𝐺𝐸𝑖𝑡) term allows us to measure the interaction of both national
rules and government efficiency together in reducing procyclicality. To measure the net effect of
fiscal rules on procyclicality we need to control both for the level of rules and level of
government efficiency. This net effect is given by: 𝛽1 + 𝛽2 ∗ (𝑁𝐹𝑅𝐼𝑖𝑡)+ 𝛽3(𝐺𝐸𝑖𝑡) +
𝛽4(𝑁𝐹𝑅𝐼𝑖𝑡 ∗ 𝐺𝐸𝑖𝑡). In other equations we also include supranational rules.
4. Statistical Contours
This section reports some basic statistics on fiscal rules, fiscal outcomes, institutional quality,
features of business cycles for averages of the 81 countries in our sample, and the relationship
between fiscal policies, fiscal rules, government efficiency and business cycles.
Table 1 presents our sample of countries, along with a designation of whether the country
had in place, in 2012, a supranational rule but not a national rule. (There are many other
countries with national rules but not a supranational rule, and both national and supranational
rules. The sample is roughly divided between advanced, emerging and developing economies.
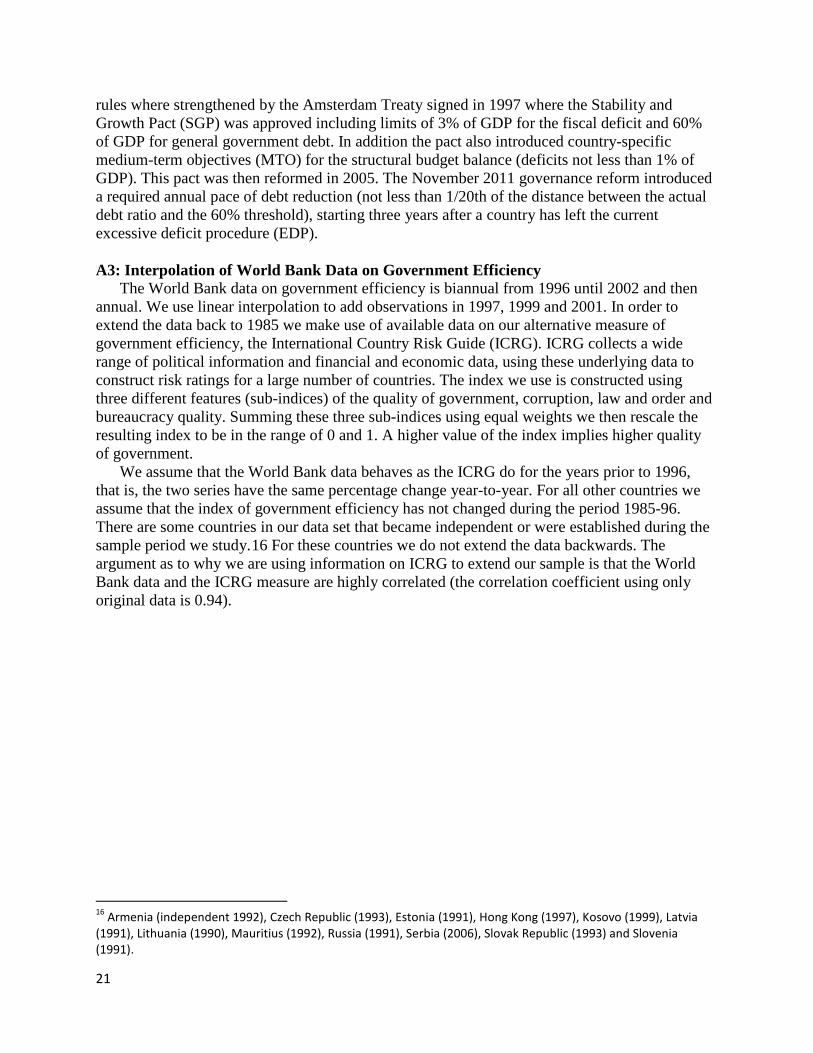
Table 2 reports summary statistics and the number of missing observations from each series. The
real GDP (GDP) and real government expenditure (GEXP) series are the cyclical components
9 The Stata command xtbond2 written by Roodman (2009a) implements both these methods
9

from the HP-filter trend estimates of the log series (with λ equal to 100). Most missing values are
from the government expenditure series at the beginning of the sample period.
By construction the mean values of GDP and GEXP are zero, but it is noteworthy that the
standard deviation of the cyclical component of the GEXP series is almost twice that of the
cyclical component of the GDP series. The mean value of the government efficiency index (GE)
is 0.44 (median 0.35) with a standard deviation of 1.44. (Maximum value is 2.36; minimum -
2.56). The average over the sample period (across time and countries) of the national fiscal rule
index is 0.23 (with a minimum of zero and a maximum value of 1.89). The average number of
rules (the average across countries) for the entire sample period is 0.46 (standard deviation equal
to 0.81), with a minimum of zero and maximum of 4 national rules. Figure 1 shows the evolution
of the average number of national fiscal rules over time. National fiscal rules has grown
substantially over the sample period, form an average of about 0.2 in 1985 to almost 1.0 in 2012,
reflecting the increasing popularity of fiscal rules as providing guidelines and constrains on
policy actions. Moreover, after a short lull, the popularity of fiscal rules—judging both by the
number and strength of fiscal rules-- grew following the GFC.
Figure 2 presents our fiscal strength index for a diverse group of countries—United
Kingdom, Bulgaria, Chile and Kenya. This is illustrative as it shows the evolution of rules over
time and circumstances that might change the rules index. For example, the national fiscal
strength index for the UK dropped in 2009. Prior to this drop, during the period 1997-2008, the
UK had a golden rule (a balanced budget rule); general government borrowing was only allowed
for investment, not to fund current spending. This rule was evaluated using the average surplus
on the current budget as a percentage of GDP over the economic cycle. The UK also had an
investment rule (classified as a debt rule) where public sector net debt as a proportion of GDP
should be stable over the economic cycle. Other things equal, net debt was to be maintained
below 40 percent of GDP over the economic cycle. These two rules were abandoned in 2009 and
replaced by a new balanced budget and debt rules. During 2010 there was a new balanced budget
rule to achieve cyclically adjusted current balance by the end of the rolling, five-year forecast
period. This rule was then replaced by a new rule from 2011 when the government introduced a
new framework, the charter for Budget Responsibility, which is a forward-looking target to
achieve cyclically adjusted current balance by the end of the rolling, five-years forecast period.
This rule is in effect until 2016. A new debt rule stipulating that public sector net debt must be
10

falling as a percentage of GDP by 2015-16. The framework for monitoring and enforcement was
changed in 2011.
The average for supranational rules is 0.39, with a standard deviation of 0.62 and minimum
and maximum values of 0 and 2, respectively. The increasing popularity of supranational fiscal
rules is also shown in Figure 1. 53 countries out of 81 have imposed national fiscal rules whereas
47 out of 81 had some form of supranational rule during the sample. The minimum NFRI is 0
and maximum is 1.88, and for SFRI minimum is 0 and maximum is 1.56. The mean (computed
as the mean across time for all countries) is 0.23 for NFRI and 0.39 for SFRI. Though not using
the same scale-- NFRI is based on 28 rules whereas SFRI is based on 22 rules—both are
normalized to be in the [0, 4] range.10
Table 3 reports basic correlations among the variables, cyclical values of GDP and GEXP,
and levels of the National Fiscal Rules Index (NFRI), Supranational Fiscal Rules Index (SFRI)
and the Efficiency of Government Index (GE). Significant levels are reported using Sidak
adjusted significance levels. GDP is positively correlated with government expenditure, as well
as negatively correlated with GE and SFRI (reflecting that higher income economies, with
generally slower average growth rates, tend to have higher GE and are in monetary unions such
as the EU with stronger supranational rules). The strength of NFRI is positively correlated with
the GE (correlation of 0.28) and SFRI. SFRI is also positively correlated with GE. These
correlations make the independent contribution of GE with fiscal rules problematic, an issue we
address in our empirical results section.
The left-hand-side of Figure 3 shows simple plot of fiscal cyclicality and the level of rules.
Country specific regressions over the full sample have been employed to calculate the degree of
cyclicality (based on the parameter from a regression of the cyclical value of GE on the cyclical
value of GDP), and the parameters are plotted against the level of the fiscal rule index. The plot
shows a negative correlation between cyclicality of policy and fiscal rules. The plot on the right-
hand-side of Figure 3 shows same country-specific cyclical policy parameter plotted against the
interaction of GE*NFRI. This measures the combination of good government and fiscal rules.
Again, there is a distinct negative correlation indicating that the combination of good
government and strong fiscal rules reduces the degree of policy cyclicality.
10 NFRI has 1607 observations equal to zero, and SNFRI has 1600 observations equal to zero. There are 178 obs > 1 for NFRI and 626 obs > 1for SNFRI. This explains why the average of SNFRI is larger than the average of NFRI, even though max NFRI > max SNFRI.
11

5. Empirical Results
Table 4 shows the basic model results using the cyclical component of GDP and
GEXP.11 Strong procyclicality estimated, significant at the 1 percent level of confidence. A one
percent rise in the GDP “output gap” leads to a 0.59-0.86 cyclical rise in real government
expenditure. Rules are associated with a significant reduction in procyclicality—a one unit rise in
the national fiscal rules index reduces expenditure cyclicality by 0.697—significant at the 1
percent level of confidence. In order to illustrate the effects of national fiscal rules on the
cyclicality of GDP in Table 4 we compute the marginal effects (and 95% confidence bands)
using the estimates in column (2). This allows us to measure how the strength of fiscal rules
affects the cyclicality in more detail. Figure 4 shows the cyclicality of GDP as a function of the
fiscal strength measure. These are all short-term, that is we do not take the lag of GEXP into
account, don’t know if we need to say this. The fiscal strength index is in the range of 0 and 4
but the maximum value is 1.80 and therefore we only plot the cyclicality for the range 0 to 1.80
in the graph. Increasing the fiscal strength tends to reduce the cyclicality of GDP. The graph
indicates that a NFRI index of about 1.25 is sufficient to reduce cyclicality to zero, i.e. no
cyclical response of government expenditure to a rise in cyclical GDP.
It is interesting to consider specific examples. A country with “average” national fiscal rules
strength (0.23, e.g. Armenia in 2012) has estimated net expenditure procyclicality of 0.70, while
the country with the strongest rules (United Kingdom at 1.885 in 2012) has estimated counter-
cyclicality of -0.45, i.e. a one percent rise in (cyclical) GDP would lead to a decline of (cyclical)
government expenditure of -0.45 percent. Australia with strong fiscal rules (1.485 in 2012) is
estimated to have counter-cyclicality of -0.17 percent, while the U.S. with moderate fiscal rules
(0.87) would have modest procyclicality of 0.25 percent. Greece, with no national fiscal rules,
has an estimated fiscal procyclicality of 0.86 percent.
Table 5 investigates how fiscal rules interact with government efficiency, as well as the
interaction with national fiscal rules. We estimate four regressions evaluating whether fiscal
rules are most effective when applied in tandem with higher government efficiency. We find that
higher bureaucratic efficiency alone does little to reduce procyclicality, shown in column (1).
11 We also estimated the basic model with these variables in first-difference form and the results were almost identical. These results are omitted for brevity but are available from the authors upon request.
12

However, when government efficiency is combined with fiscal rules (column 2) we find a highly
significant and economically important effect, i.e. higher government efficiency in tandem with
stronger rules significantly reduces procyclicality of fiscal policy (coefficient value of -0.74).
This finding is consistent with the plots shown on the right side of Figure 3. And this effect is
robust to the inclusion of separate interaction terms (columns 3 and 4).
As above, we can use the estimates in Table 5 to measure how the cyclicality varies with the
strength of national fiscal rules as well as with government efficiency. Using the estimates in
column 2 we illustrate how the cyclicality varies in two dimensions, variation due to NFRI
holding government efficiency constant and the variation due to government efficiency holding
NFRI constant. For expository purposes, we assume that government efficiency takes on either
the sample average (NFRI=0.44) or the average of the quintile with highest government
efficiency (GE=1.80), whereas we let NFRI vary between its minimum value (0) and its
maximum value (1.88). These results are presented in Figure 5. There is a negative relation in
both graphs indicating that increasing the strength of the fiscal rules tends to reduce the
cyclicality. However, for countries with average government efficiency, fiscal policy is still
procyclical unless national fiscal rules are very strong. For countries with high government
efficiency, only moderate levels of strength are required before fiscal policy turns procyclical. In
terms of specific examples, a country with average government efficiency (0.44) and average
national fiscal rules (0.23) has strong procyclicality (0.74), while at the high end a country such
as the U.K. with high GE (1.53) combined with high NFRI (1.89) has strongly counter-cyclical
policy (-1.33). Chile is also at the higher end of the spectrum, with rather strong fiscal rules
(0.73) and high government efficiency (1.25), so that the estimated policy response is almost
acyclical (0.13).
The empirical evidence in Table 5 suggests a linkage between government efficiency, the
strength of national fiscal rules and the cyclicality of fiscal policy. However, the measure that we
are using for government efficiency-- the World Bank government efficiency measure-- is not
especially nuanced and varies little over time. As argued by Charron, Lapuente and Rothstein
(2010), it is not possible to distinguish, for example, between Sweden and Denmark, between
Chile and Italy, or between Brazil and Bulgaria using the World Bank measure. Instead they
suggest that the countries should be clustered with respect to their relative quality of government
instead of using the World Bank index for each country. We follow their suggestion and
13

decompose the 81 countries into quartiles based on the average of the World Bank index for each
country. This provides us with four groups of countries each with approximately the same
number of countries. Table A-1 in the Appendix show the four clusters of countries divided into
high, good, moderate and low efficiency of government. Table A-2 shows descriptive statistics
for these four groups. From this table it is clear that cyclicality as well as the strength of national
fiscal rules is positively associated with efficiency of government. Countries with high efficiency
of government tend to have more countercyclical fiscal policy and also stronger national fiscal
rules. Countries with low efficiency of government have highly procyclical fiscal policy and lax
national fiscal rules.12
Recognizing the limitations of government efficiency measures, we group the countries as
above into four clusters reflecting the efficiency of government and add these as interactive
dummy variables together with GDP*NFRI in regression estimates presented in column (1) of
Table 6. The value of each term listed would be GDP*NFRI if it falls in the designated cluster
(e.g. moderate GE), and zero otherwise. Combined with the direct interaction term GDP*NFRI,
we are able to calculate the cyclicality of policy given a level of fiscal rules and conditional upon
its degree (cluster group) of government efficiency. (The excluded group, captured in the basic
interaction term, is the low level of government efficiency).
The results in Table 6 suggest strong effects from government efficiency, making rules much
more effective when combined with even moderate levels of government efficiency. All the
terms are statistically significant at the 1% level of confidence and economically meaningful. We
illustrate the results in Figure 6 using the estimates from the “high” quality cluster and the
“moderate” quality cluster estimates from Table 6. Again, the procyclicality of policy is reduced
as the fiscal rule strength rises. But the effect is much greater and sharper in the case with high
GE. In particular, policy moves from pro- to counter-cyclical (i.e. acyclical) at a fiscal rules
index of 1.0 for the moderate GE cluster of countries but at a threshold of only 0.5 for the high
GE cluster of countries.
12 It is noteworthy, however, that this relation does not hold for supranational fiscal rules. Low efficiency of government countries have stronger supranational fiscal rules than countries with moderate efficiency of government. The reason for this is that many countries having low efficiency of government also are members of monetary unions, i.e., members of The Central African Economic and Monetary Community and the West African Economic and Monetary Union.
14

Columns (2)-(3) of Table 6 introduce supranational rules (SFRI) into the empirical analysis.
The basic results of our earlier analysis on national fiscal rules are robust to changes in
regression specifications shown in the table. However, there is no evidence that supranational
fiscal rules reduce procyclicality (columns 2 and 3) unless conditioned by the degree of
government efficiency (column 4). Controlling for national rules, the marginal effect of
supranational rules for the low GE cluster is -0.56 (the default group) and the estimate is
significant at the 1 percent level of confidence. Interpreting the marginal effect for the average of
NFRI and SFRI for the low GE cluster, at values of 0.06 and 0.39 respectively, gives a net
procyclical effect of 0.84. By contrast, taking into account the NFRI and SFRI levels of the high
GE cluster, at 0.50 and 0.62 respectively, gives a net countercyclical effect of -0.24.
Supranational rules for the moderate and good GE clusters, by contrast, appear to reduce the
counter-cyclical nature of policy. That is, national fiscal rules appear to be working strongly in
reducing procyclicality in these groups but supranational rules appear to be pulling policy in the
opposite direction. On balance, supranational fiscal rules appear to be very helpful in
circumstances when government efficiency is quite low.
6. Conclusion
Procyclical fiscal policy contributes to wider swings in business cycles—extra fiscal stimulus
during economic upturns and contractionary policy during downturns-- and to unstable debt
dynamics as many countries have great difficulty in running surpluses in good economic times to
balance against deficits incurred during bad economic conditions. This paper investigates the
efficacy of fiscal rules in reducing the procyclical nature of fiscal policy. Fiscal rules have been
an increasing popular mechanism by which to frame fiscal policy, but relatively little cross-
country empirical work has investigated its effectiveness, especially in emerging and developing
economies. This contrasts markedly with the voluminous literature on monetary policy rules.
We investigate whether fiscal rules help to reduce the extent of policy procyclicality—how
government expenditure policy responds to GDP-- in a panel framework with 81 advanced,
emerging and developing countries over 1985-2012. We develop a unique national
(supranational) fiscal rule index based on 28 (20) distinct characteristics of actions, legislative or
procedural, that constrain fiscal policy actions in each country at each point in time. The
underlying source of the data is the IMF Fiscal Affairs Division database. We investigate the
15

effects of both national and supranational fiscal rules, as well as condition on the degree of
government efficiency in how well governments are able to manage and enforce fiscal rules.
We find that national fiscal rules are very effective in reducing procyclicality of policy once
a minimum threshold of government efficiency/quality has been reached. Government efficiency
alone is not enough to reduce procyclicality of fiscal policy, but high government efficiency
combined with fiscal rules is a potent combination that greatly reduces procyclicality and, at a
particular threshold levels of rules and government efficiency, may induce counter-cyclical
policy responses to GDP movements. We also find evidence that supranational rules are mainly
effective in reducing procyclicality in countries with quite weak government efficiency.
16

References Arellano, M. and S.R. Bond (1991) “Some Tests of Specification for Panel Data: Monte Carlo Evidence and an Application to Employment Equations”, Review of Economic Studies, 58: 277-297. Balassone, F. and M. Kumar (2007). “Cyclicality of Fiscal Policy”, Chapter 3 in Manmohan S. Kumar and Teresa Ter-Minassian (editors), Promoting Fiscal Discipline, International Monetary Fund (Washington, D.C., pp. 19-35. Bergman, M., M. Hutchison and S. Jensen (2013). “Do Sound Public Finances Require Fiscal Rules Or Is Market Pressure Enough?” European Commission, European Economy, Economic Papers No. 489 (April). Blundell, R.W. and S.R. Bond (1998), “Initial Conditions and Moment Restrictions in Dynamic Panel Data Models”, Journal of Econometrics, 87: 115-143. Bontempi, M.E. and I. Mammi (2012), “A Strategy to Reduce the Count of Moment Conditions in Panel Data GMM,” MPRA Paper No. 40720. Budina, N., T. Kinda, A. Schaechter and A. Weber (2012). "Fiscal Rules at a Glance: Country Details from a New Dataset", IMF Working Paper WP12/273, and background document update “Fiscal Rules at a Glance” October 2013. Calderón, César, Roberto Duncan and Klaus Schmidt-Hebbel (2012). “Do Good Institutions Promote Counter-Cyclical Macroeconomic Policies?” Federal Reserve Bank of Dallas Globalization and Monetary Policy Institute, Working Paper No. 118 (June). Céspedes, F. and A. Velasco (2014). “Was this time different?: Fiscal policy in commodity republics”, Journal of Development Economics 106, 92–106. European Commission (2012). “Report on Public Finances in EMU: 2012”, European Economy (4). Charron, N., V. Lapuente and B. Rothstein (2010), "Measuring the Quality of Government and Subnational Variation", Report for the European Commission Directorate-General Regional Policy Directorate Policy Development. Fischer, S., 1998. In defense of the IMF: specialized tools for a specialized task. Foreign Affairs 77 (4), 103–107. Frankel, J. (2011). "A Solution to Fiscal Procyclicality: the Structural Budget Institutions Pioneered by Chile," Journal Economía Chilena (The Chilean Economy), Central Bank of Chile, vol. 14(2), August, pages 39-78. Issued as NBER Working Paper No.16945 (April 2011). Frankel, J., C. Vegh and G. Vuletin (2011). “On graduation from fiscal procyclicality,” NBER Working Paper No. 17619 (November). Gali, J. and R. Perotti. (2002). `Fiscal Policy and Monetary Integration in Europe', CEPR Discussion Papers, Vol. 3933.
17

Gavin, M. and R. Hausmann. (1998). `Macroeconomic Volatility and Economic Development', Proceedings of the IEA, Conference, Vol. 119, pp. 97-116. Gavin, M. and R. Perotti. (1997). `Fiscal Policy in Latin America', In: NBER Macroeconomics Annual, MIT Press, Cambridge and London, pp. 11-61. Hall A.R. and F.P.M. Peixe (2003), “A Consistent Method for the Selection of Relevant Instruments,” Econometric Reviews, 22:269-287. Hausmann, R., and E. Stein. (1996). `Searching for the Right Budgetary Institutions for a Volatile Region', Inter-American Development Bank Working Paper No. 315. Ilzetzki, E. and C. Vegh (2008). “Procyclical Fiscal Policies in Developing Countries: Truth or Fiction”, NBER Working Paper 14191 (July). International Monetary Fund (2009), “Fiscal Rules—Anchoring Expectations for Sustainable Public Finances”, IMF Policy Paper December 16, 2009. International Monetary Fund (2013). “The Functions and Impact of Fiscal Councils,” IMF Policy Paper July 16, 2013. Kaminsky, Graciela , Carmen Reinhart and Carlos A. Vegh (2004). “When It Rains It Pours: Procyclical Capital Flows and Macroeconomic Policies”, .in NBER Macroeconomics Annual, edited by Mark Gertler and Kenneth Rogoff, Cambridge, MA: MIT Press. Lane, P.R. (2003). `Business Cycles and Macroeconomic Policies in Emerging Market Economies', International Finance, Vol. 6, pp. 89-108. Melitz, J. (2000). `Some Cross-Country Evidence about Fiscal Policy Behaviour and Consequences for EMU', European Economy, Vol. 2, pp. 3-21. Mohanty, M. S., and M. Klau. (2004). `Monetary policy rules in emerging market economies', BIS Working Paper No. 149. Ravn, M. and H. Uhlig, 2002. “On adjusting the Hodrick-Prescott filter for the frequency of observations,” Review of Economics and Statistics, vol. 84(2), pages 371-375. Roodman, David, 2009a, “How to do xtabond2: An instroduction to difference and system GMM in Stata,” Stata Journal, Vol. 9, No. 1, pp. 86–136. Roodman, D.M. (2009b), “A Note on the Theme of Too Many Instruments,” Oxford Bulletin of Economics and Statistics, 71:135-158.
18

Schaechter, A., T. Kinda, N. Budina and A. Weber (2012). “Fiscal Rules in Response to the Crisis—Toward the “Next-Generation” Rules. A New Dataset”, International Monetary Fund Working Paper No. WP/12/187 (July). Stein, E., E. Talvi. and A. Grisanti. (1998). `Institutional Arrangements and Fiscal Performance: The Latin America Experience', NBER Working Paper No. 6358. Stiglitz, J., 1999a. Responding to economic crises: policy alternatives for equitable recovery and development. The Manchester School 67 (5), 409–427. Stiglitz, J., 1999b. Begger thyself vs. begger-thy-neighbor: the dangers of intellectual incoherence in addressing the global financial crisis. Southern Economic Journal 66 (1), 1–38. Talvi, E., and C. Vegh. (2005). `Tax Base Variability and Procyclical Fiscal Policy', Journal of Development Economics, Vol. 78, pp. 156-90. Tornell, A., Velasco, A. (1992). Why does capital flow from poor to rich countries? The tragedy of the commons and economic growth.” J. Polit. Econ. 100 (December).
19

A1. Data Appendix Variable Definition and Source Fiscal rules Information about 28 characteristics of national fiscal
rules and 22 characteristics of supranational fiscal rules., “Fiscal Rules Dataset, 2012” (FAD) from the Fiscal Affair Department of the International Monetary Fund, Schaechter, Kinda, Budina, and Weber (2012).
GDP Real GDP, WEO database Government expenditures
Nominal government expenditures deflated using the GDP deflator, WEO database
Government efficiency
World Bank “Worldwide Governance Indicators, 2013 Update” (WGI) project research dataset
A2. Appendix: Supranational Fiscal Rules
The FAD data base also includes data on 22 characteristics of supranational fiscal rules. As already mentioned above, the IMF database also includes supranational fiscal rules. Such rules usually apply to members of monetary unions. The implementation of supranational fiscal rules in EU and EMU is not unique; other monetary unions have also implemented such rules on member countries even if the nature of these rules differs. The Central African Economic and Monetary Community (CEMAC) has a balanced budget rule that was introduced in 2002 stipulating that the basic fiscal balance, defined as total revenue net of grants minus total expenditure net of foreign-financed capital spending, should be in balance or in surplus. From 2008 two additional rules were introduced: (i) the basic structural fiscal balance in percent of nominal GDP should be in balance or surplus—this concept is derived from the main criterion by replacing actual oil revenue with its three-year moving average; and (ii) the non-oil basic fiscal balance in percent of non-oil GDP should be in balance or in surplus.13 CEMAC also has a debt rule: The stock of external plus domestic public debt should be kept below 70% of GDP. The West African Economic and Monetary Union (WAEMU) introduced supranational balanced budget and debt rules in 2000.14 The balanced budget rule requires a balanced budget excluding foreign-financed capital expenditures or in surplus and the debt rule is that public debt shall not exceed 70 of GDP. Finally, the Eastern Caribbean Currency Union (ECCU) has a debt rule where member countries should aim at reducing public debt to 60% of GDP by 2020.15 Before the revision of the rules in 2006, ECCU also had a balanced budget rule of an overall deficit target of 3% of GDP.
The Maastricht Treaty, signed in February 1992, defines the supranational fiscal rules applied to EU countries. Both budget deficit and debt rules were introduced in the Treaty. In 1997, these
13 Members of CEMAC are Cameroon, Central African Rep, Chad, Equatorial Guinea, Gabon, and the Republic of Congo. 14 Members of WAEMU are Benin, Burkina Faso, Cote d'Ivoire, Guinea-Bissau, Mali, Niger, Senegal, and Togo. 15 Member countries are Antigua and Barbuda, Dominica, Grenada, St. Kitts and Nevis, St. Lucia, St. Vincent and the Grenadines, and Anguilla and Montserrat.
20
rules where strengthened by the Amsterdam Treaty signed in 1997 where the Stability and Growth Pact (SGP) was approved including limits of 3% of GDP for the fiscal deficit and 60% of GDP for general government debt. In addition the pact also introduced country-specific medium-term objectives (MTO) for the structural budget balance (deficits not less than 1% of GDP). This pact was then reformed in 2005. The November 2011 governance reform introduced a required annual pace of debt reduction (not less than 1/20th of the distance between the actual debt ratio and the 60% threshold), starting three years after a country has left the current excessive deficit procedure (EDP).
A3: Interpolation of World Bank Data on Government Efficiency
The World Bank data on government efficiency is biannual from 1996 until 2002 and then annual. We use linear interpolation to add observations in 1997, 1999 and 2001. In order to extend the data back to 1985 we make use of available data on our alternative measure of government efficiency, the International Country Risk Guide (ICRG). ICRG collects a wide range of political information and financial and economic data, using these underlying data to construct risk ratings for a large number of countries. The index we use is constructed using three different features (sub-indices) of the quality of government, corruption, law and order and bureaucracy quality. Summing these three sub-indices using equal weights we then rescale the resulting index to be in the range of 0 and 1. A higher value of the index implies higher quality of government.
We assume that the World Bank data behaves as the ICRG do for the years prior to 1996, that is, the two series have the same percentage change year-to-year. For all other countries we assume that the index of government efficiency has not changed during the period 1985-96. There are some countries in our data set that became independent or were established during the sample period we study.16 For these countries we do not extend the data backwards. The argument as to why we are using information on ICRG to extend our sample is that the World Bank data and the ICRG measure are highly correlated (the correlation coefficient using only original data is 0.94).
16 Armenia (independent 1992), Czech Republic (1993), Estonia (1991), Hong Kong (1997), Kosovo (1999), Latvia (1991), Lithuania (1990), Mauritius (1992), Russia (1991), Serbia (2006), Slovak Republic (1993) and Slovenia (1991).
21

Table 1: Sample of countries. Antigua and Barbuda* Estonia Namibia Argentina Finland Netherlands Armenia France New Zealand Australia Gabon* Niger* Austria Germany Nigeria Belgium Greece* Norway Benin* Grenada* Pakistan Botswana Guinea Bissau* Panama Brazil Hong Kong SAR Peru Bulgaria Hungary Poland Burkina Faso* Iceland Portugal* Cameroon* India Romania Canada Indonesia Russia Cap Verde Ireland* Senegal* Central African Republic* Israel Serbia Chad* Italy* Slovak Republic Chile Jamaica Slovenia Colombia Japan Spain Congo* Kenya Sri Lanka Costa Rica Kosovo St. Kitts and Nevis* Cote d'Ivoire* Latvia* St. Lucia* Cyprus Lithuania St. Vincent and the Grenadines* Czech Republic* Luxembourg Sweden Denmark Mali* Switzerland Dominica* Malta* Togo* Ecuador Mauritius United Kingdom Equatorial Guinea* Mexico United States Note: * denotes countries with a supranational fiscal rule, but without a national fiscal rule.
22
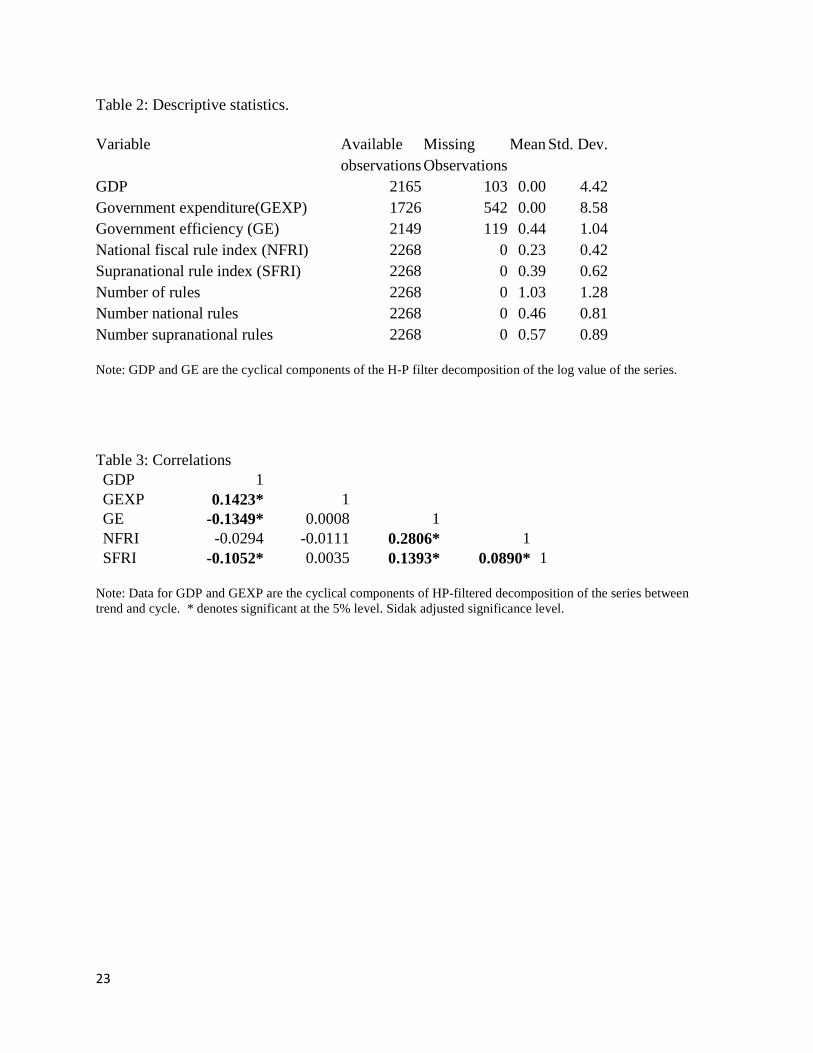
Table 2: Descriptive statistics. Variable Available Missing Mean Std. Dev. observations Observations
GDP 2165 103 0.00 4.42 Government expenditure(GEXP) 1726 542 0.00 8.58 Government efficiency (GE) 2149 119 0.44 1.04 National fiscal rule index (NFRI) 2268 0 0.23 0.42 Supranational rule index (SFRI) 2268 0 0.39 0.62 Number of rules 2268 0 1.03 1.28 Number national rules 2268 0 0.46 0.81 Number supranational rules 2268 0 0.57 0.89 Note: GDP and GE are the cyclical components of the H-P filter decomposition of the log value of the series. Table 3: Correlations GDP 1
GEXP 0.1423* 1 GE -0.1349* 0.0008 1
NFRI -0.0294 -0.0111 0.2806* 1 SFRI -0.1052* 0.0035 0.1393* 0.0890* 1
Note: Data for GDP and GEXP are the cyclical components of HP-filtered decomposition of the series between trend and cycle. * denotes significant at the 5% level. Sidak adjusted significance level.
23

Table 4: Cyclicality of Fiscal Policy and Fiscal Rules
(1) (2) GEXP(-1) 0.167* 0.253*** (0.088) (0.048) GDP 0.594*** 0.864*** (0.215) (0.114) GDP*NFRI
-0.697***
(0.214)
#obs 1564 1564 #instruments 52 54 AR(1) 0 0.001 AR(2) 0.11 0.207 Hansen 0.136 0.133 Hansen diff1 na 0.787
Note: Arellano-Bond one-step difference GMM estimation. Clustered and robust standard errors are shown within parentheses below each point estimate. *** denotes significance at the 0.01 level, ** at the 0.05 level and * at the 0.10 level. GDP is assumed to be endogenous while all other explanatory variables are assumed to be exogenous. When applicable we also include NFRI and/or GE as iv-style instruments. Hansen is a test for over identification and Hansen(iv) is a test of exogeneity of iv-style instruments.
24
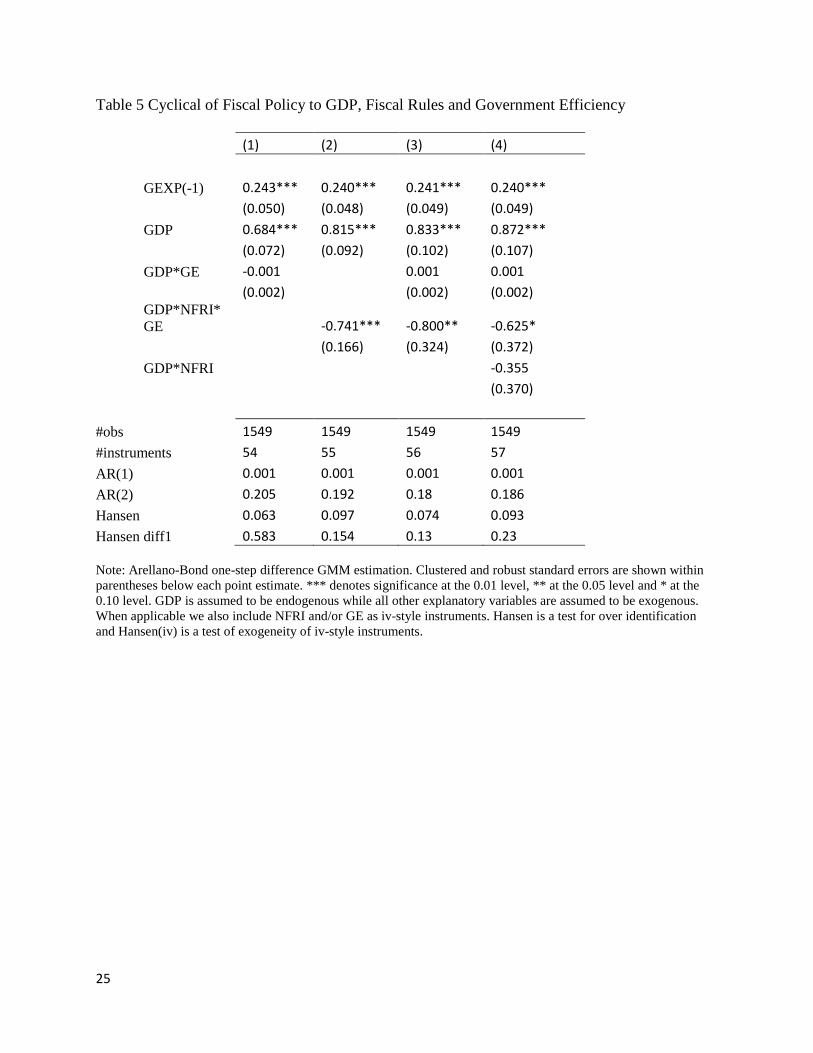
Table 5 Cyclical of Fiscal Policy to GDP, Fiscal Rules and Government Efficiency
(1) (2) (3) (4)
GEXP(-1) 0.243*** 0.240*** 0.241*** 0.240***
(0.050) (0.048) (0.049) (0.049)
GDP 0.684*** 0.815*** 0.833*** 0.872***
(0.072) (0.092) (0.102) (0.107)
GDP*GE -0.001
0.001 0.001
(0.002)
(0.002) (0.002)
GDP*NFRI*GE
-0.741*** -0.800** -0.625*
(0.166) (0.324) (0.372)
GDP*NFRI
-0.355
(0.370)
#obs 1549 1549 1549 1549 #instruments 54 55 56 57 AR(1) 0.001 0.001 0.001 0.001 AR(2) 0.205 0.192 0.18 0.186 Hansen 0.063 0.097 0.074 0.093 Hansen diff1 0.583 0.154 0.13 0.23 Note: Arellano-Bond one-step difference GMM estimation. Clustered and robust standard errors are shown within parentheses below each point estimate. *** denotes significance at the 0.01 level, ** at the 0.05 level and * at the 0.10 level. GDP is assumed to be endogenous while all other explanatory variables are assumed to be exogenous. When applicable we also include NFRI and/or GE as iv-style instruments. Hansen is a test for over identification and Hansen(iv) is a test of exogeneity of iv-style instruments.
25

Table 6: Cyclicality of fiscal policy, National Rules, Supranational Rules and Government Efficiency
(1) (2) (3) (4) GEXP(-1) 0.255*** 0.246*** 0.240*** 0.253***
(0.049) (0.048) (0.047) (0.047)
GDP 0.854*** 0.736*** 0.844*** 0.986***
(0.112) (0.071) (0.081) (0.131)
GDP*GE*NFRI
-0.940***
(0.212)
GDP*GE*SFRI 0.052 0.209**
(0.128) (0.100)
GDPNFRI 1.473***
1.354**
(0.623)
(0.636)
GDPNFRI Moderate GE -2.250***
-2.333***
(0.641)
(0.648)
GDPNFRI Good GE -1.847***
-1.793***
(0.623)
(0.662)
GDPNFRI High GE -3.114***
-2.547***
(0.689)
(0.718)
GDPSFRI
-0.561***
(0.151)
GDPSFRI Moderate GE
0.826**
(0.368)
GDPSFRI Good GE
0.462**
(0.186)
GDPSFRI High GE
-0.044
(0.274)
#observations 1564 1549 1549 1564 #instruments 57 55 57 62 AR(1) 0.001 0.001 0.001 0.001 AR(2) 0.207 0.177 0.227 0.31 Hansen 0.092 0.051 0.078 0.141 Hansen(iv) 0.074 0.399 0.17 0.621 Notes: Arellano-Bond one-step difference GMM estimation. Clustered and robust standard errors are shown within parentheses below each point estimate. *** denotes significance at the 0.01 level, ** at the 0.05 level and * at the 0.10 level. GDP is assumed to be endogenous while all other explanatory variables are assumed to be exogenous. NFRI is included as iv-style instruments. Hansen is a test for over identification and Hansen(iv) is a test of exogeneity of iv-style instruments.
26

Figure 1: Average number of national and supranational fiscal rules.
Figure 2: National fiscal rule index for selected countries
27

Figure 3: Cross-correlations of cyclicality of fiscal policy, fiscal rule index and efficiency of government
Figure 4
Note: calculated from column (2) of table 4.
28

Figure 5
Note: calculated from column (2) of table 5.
29

Figure 6
Note: Calculated from column (4) of Table 7 (or column (1) of Table 6)
-1.5
-1-.5
0.5
1M
argi
nal e
ffect
of G
DP
on
gove
rnm
ent e
xpen
ditu
res
0 .5 1 1.5 2NFRI
Moderate government efficiency
-3-2
-10
1M
argi
nal e
ffect
of G
DP
on
gove
rnm
ent e
xpen
ditu
res
0 .5 1 1.5 2NFRI
High government efficiency
30

Table A-1: Clusters of countries based on quartiles of government efficiency High GE Good GE Moderate GE Low GE Australia Antigua and
Barbuda Argentina Benin
Austria Botswana Armenia Burkina Faso Belgium Chile Brazil Cameroon Canada Cyprus Bulgaria Central African
Republic Denmark Czech Republic Cape Verde Chad Finland Dominica Colombia Congo France Estonia Costa Rica Cote d'Ivoire Germany Greece Grenada Ecuador Hong Kong SAR
Hungary India Equatorial Guinea
Iceland Israel Jamaica Gabon Ireland Italy Mexico Guinea Bissau Japan Latvia Namibia Indonesia Luxembourg Lithuania Panama Kenya Netherlands Malta Peru Kosovo New Zealand Mauritius Romania Mali Norway Poland Senegal Niger Sweden Portugal Sri Lanka Nigeria Switzerland Slovak Republic St. Kitts and Nevis Pakistan United Kingdom
Slovenia St. Lucia Russia
United States Spain St. Vincent and the Grenadines
Serbia
Togo Note: The grouping of countries is based on quintiles of sample average of the efficiency of government for each country.
31

Table A-2: Descriptive statistics for groups of countries based on quartiles of efficiency of government. High GE countries Mean St. Dev. Min Max GDP -0.32 0.27 -0.73 0.33 GEXP -0.52 0.32 -1.10 0.15 GE 1.80 0.18 1.40 2.04 NFRI 0.50 0.30 0.00 1.20 SFRI 0.62 0.52 0.00 1.07 Good GE countries GDP 0.44 0.53 -0.16 1.98 GEXP 0.25 0.74 -0.69 2.50 GE 0.78 0.24 0.44 1.17 NFRI 0.15 0.19 0.00 0.51 SFRI 0.42 0.34 0.00 1.07 Moderate GE countries GDP 0.42 0.67 -1.09 2.02 GEXP 0.27 0.70 -1.51 1.49 GE 0.01 0.20 -0.30 0.43 NFRI 0.20 0.19 0.00 0.61 SFRI 0.16 0.25 0.00 0.60 Low GE countries GDP 0.91 1.63 -2.76 3.69 GEXP 0.92 1.38 -1.56 3.13 GE -0.81 0.35 -1.45 -0.36 NFRI 0.06 0.12 0.00 0.45 SFRI 0.39 0.29 0.00 0.61
32