Embed Size (px)
Citation preview
Sept 2019 http://eadiv.state.wy.us Contact: Dr. Wenlin Liu, Chief Economist ([email protected]) Page 1
-5.0
-4.0
-3.0
-2.0
-1.0
0.0
1.0
2.0
3.0
4.0
1Q15 3Q15 1Q16 3Q16 1Q17 3Q17 1Q18 3Q18 1Q19
Source: U.S. BLS and Wyoming DWS
Annual Percent Change in Non-Farm Employment
U.S. WY
3.0
3.5
4.0
4.5
5.0
5.5
6.0
6.5
1Q15 3Q15 1Q16 3Q16 1Q17 3Q17 1Q18 3Q18 1Q19
Source: U.S. Bureau of Labor Statistics
Seasonally Adjusted Unemployment Rate (%)
U.S. WY
0.4%
1.8%
0.7%
-0.2%
2.3%
-0.6%
-1.9%
3.2%
0.1%
1.6%
4.6%
10.1%
1.1%
Government
Other Services
Leisure & Hospitality
Educ. & Health Serv.
Prof. & Busi.Serv.
Financial Activities
Information
Transport and Utilities
Retail Trade
Wholesale Trade
Manufacturing
Construction
Mining & Logging
Source: U.S. BLS and Wyoming DWS
Percent Change in Wyoming Employment by Industry:2nd Quarter 2018 to 2nd Quarter 2019
300
300
270
-70
430
-70
-70
470
30
130
430
2,030
230
Government
Other Services
Leisure & Hospitality
Educ. & Health Serv.
Prof. & Busi.Serv.
Financial Activities
Information
Transport and Utilities
Retail Trade
Wholesale Trade
Manufacturing
Construction
Mining & Logging
Source: U.S. BLS and Wyoming DWS
Numerical Change in Employment by Industry:2nd Quarter 2018 to 2nd Quarter 2019
Economic Summary: 2Q2019 Wyoming Department of Administration & Information Economic Analysis Division
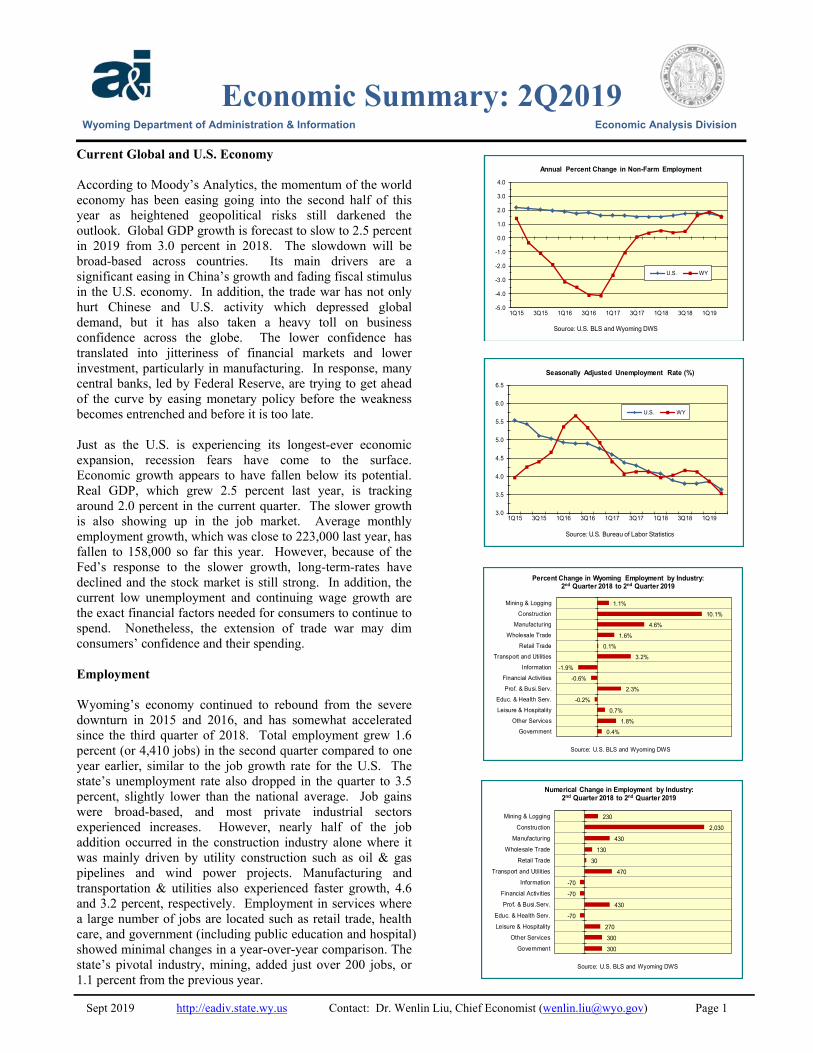
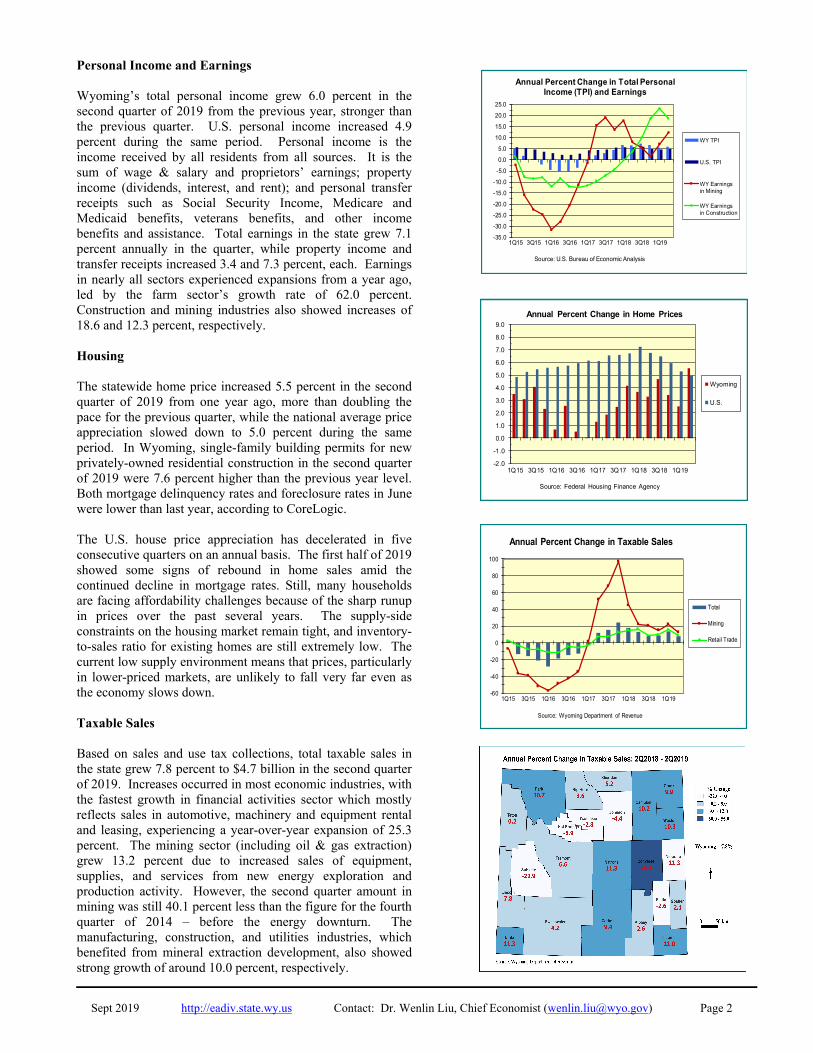
Current Global and U.S. Economy According to Moody’s Analytics, the momentum of the world economy has been easing going into the second half of this year as heightened geopolitical risks still darkened the outlook. Global GDP growth is forecast to slow to 2.5 percent in 2019 from 3.0 percent in 2018. The slowdown will be broad-based across countries. Its main drivers are a significant easing in China’s growth and fading fiscal stimulus in the U.S. economy. In addition, the trade war has not only hurt Chinese and U.S. activity which depressed global demand, but it has also taken a heavy toll on business confidence across the globe. The lower confidence has translated into jitteriness of financial markets and lower investment, particularly in manufacturing. In response, many central banks, led by Federal Reserve, are trying to get ahead of the curve by easing monetary policy before the weakness becomes entrenched and before it is too late. Just as the U.S. is experiencing its longest-ever economic expansion, recession fears have come to the surface. Economic growth appears to have fallen below its potential. Real GDP, which grew 2.5 percent last year, is tracking around 2.0 percent in the current quarter. The slower growth is also showing up in the job market. Average monthly employment growth, which was close to 223,000 last year, has fallen to 158,000 so far this year. However, because of the Fed’s response to the slower growth, long-term-rates have declined and the stock market is still strong. In addition, the current low unemployment and continuing wage growth are the exact financial factors needed for consumers to continue to spend. Nonetheless, the extension of trade war may dim consumers’ confidence and their spending. Employment Wyoming’s economy continued to rebound from the severe downturn in 2015 and 2016, and has somewhat accelerated since the third quarter of 2018. Total employment grew 1.6 percent (or 4,410 jobs) in the second quarter compared to one year earlier, similar to the job growth rate for the U.S. The state’s unemployment rate also dropped in the quarter to 3.5 percent, slightly lower than the national average. Job gains were broad-based, and most private industrial sectors experienced increases. However, nearly half of the job addition occurred in the construction industry alone where it was mainly driven by utility construction such as oil & gas pipelines and wind power projects. Manufacturing and transportation & utilities also experienced faster growth, 4.6 and 3.2 percent, respectively. Employment in services where a large number of jobs are located such as retail trade, health care, and government (including public education and hospital) showed minimal changes in a year-over-year comparison. The state’s pivotal industry, mining, added just over 200 jobs, or 1.1 percent from the previous year.
Sept 2019 http://eadiv.state.wy.us Contact: Dr. Wenlin Liu, Chief Economist ([email protected]) Page 2
-2.0
-1.0
0.0
1.0
2.0
3.0
4.0
5.0
6.0
7.0
8.0
9.0
1Q15 3Q15 1Q16 3Q16 1Q17 3Q17 1Q18 3Q18 1Q19
Source: Federal Housing Finance Agency
Annual Percent Change in Home Prices
Wyoming
U.S.
-35.0
-30.0
-25.0
-20.0
-15.0
-10.0
-5.0
0.0
5.0
10.0
15.0
20.0
25.0
1Q15 3Q15 1Q16 3Q16 1Q17 3Q17 1Q18 3Q18 1Q19
Source: U.S. Bureau of Economic Analysis
Annual Percent Change in Total PersonalIncome (TPI) and Earnings
WY TPI
U.S. TPI
WY Earningsin Mining
WY Earningsin Construction
-60
-40
-20
0
20
40
60
80
100
1Q15 3Q15 1Q16 3Q16 1Q17 3Q17 1Q18 3Q18 1Q19
Source: Wyoming Department of Revenue
Annual Percent Change in Taxable Sales
Total
Mining
Retail Trade
Personal Income and Earnings
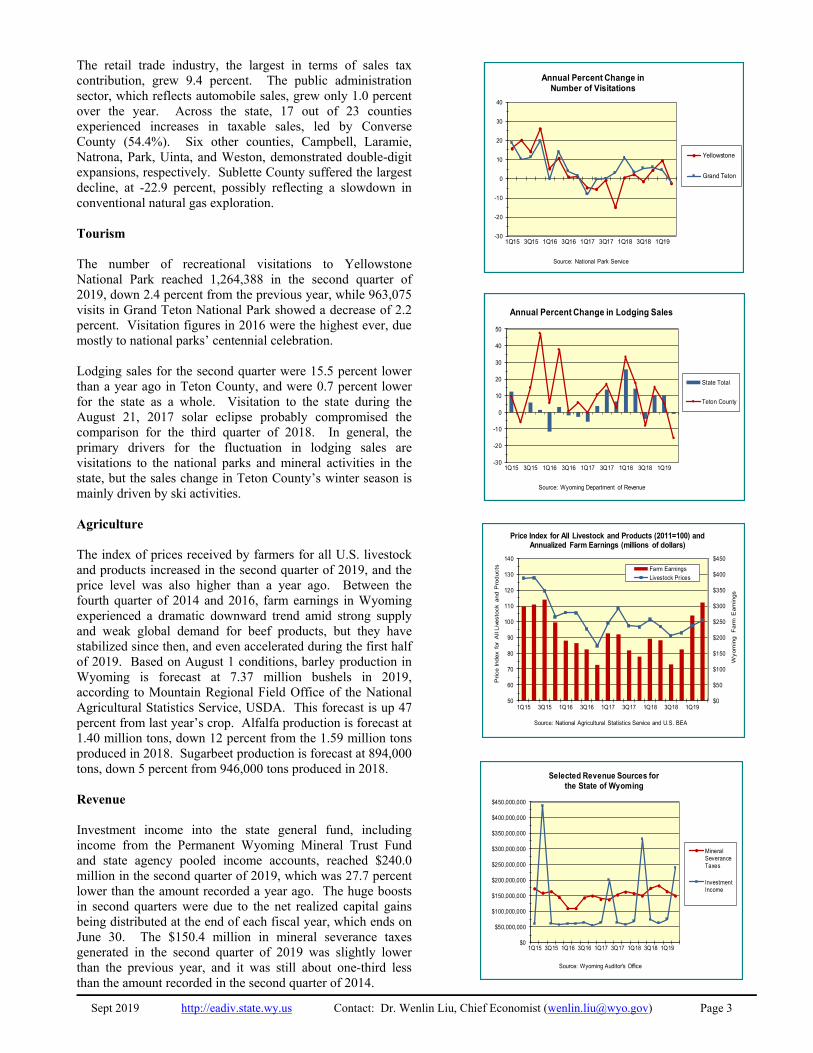
Wyoming’s total personal income grew 6.0 percent in the second quarter of 2019 from the previous year, stronger than the previous quarter. U.S. personal income increased 4.9 percent during the same period. Personal income is the income received by all residents from all sources. It is the sum of wage & salary and proprietors’ earnings; property income (dividends, interest, and rent); and personal transfer receipts such as Social Security Income, Medicare and Medicaid benefits, veterans benefits, and other income benefits and assistance. Total earnings in the state grew 7.1 percent annually in the quarter, while property income and transfer receipts increased 3.4 and 7.3 percent, each. Earnings in nearly all sectors experienced expansions from a year ago, led by the farm sector’s growth rate of 62.0 percent. Construction and mining industries also showed increases of 18.6 and 12.3 percent, respectively.
Housing
The statewide home price increased 5.5 percent in the second quarter of 2019 from one year ago, more than doubling the pace for the previous quarter, while the national average price appreciation slowed down to 5.0 percent during the same period. In Wyoming, single-family building permits for new privately-owned residential construction in the second quarter of 2019 were 7.6 percent higher than the previous year level. Both mortgage delinquency rates and foreclosure rates in June were lower than last year, according to CoreLogic.
The U.S. house price appreciation has decelerated in five consecutive quarters on an annual basis. The first half of 2019 showed some signs of rebound in home sales amid the continued decline in mortgage rates. Still, many households are facing affordability challenges because of the sharp runup in prices over the past several years. The supply-side constraints on the housing market remain tight, and inventory-to-sales ratio for existing homes are still extremely low. The current low supply environment means that prices, particularly in lower-priced markets, are unlikely to fall very far even as the economy slows down.
Taxable Sales
Based on sales and use tax collections, total taxable sales in the state grew 7.8 percent to $4.7 billion in the second quarter of 2019. Increases occurred in most economic industries, with the fastest growth in financial activities sector which mostly reflects sales in automotive, machinery and equipment rental and leasing, experiencing a year-over-year expansion of 25.3 percent. The mining sector (including oil & gas extraction) grew 13.2 percent due to increased sales of equipment, supplies, and services from new energy exploration and production activity. However, the second quarter amount in mining was still 40.1 percent less than the figure for the fourth quarter of 2014 – before the energy downturn. The manufacturing, construction, and utilities industries, which benefited from mineral extraction development, also showed strong growth of around 10.0 percent, respectively.
Sept 2019 http://eadiv.state.wy.us Contact: Dr. Wenlin Liu, Chief Economist ([email protected]) Page 3
$0
$50
$100
$150
$200
$250
$300
$350
$400
$450
50
60
70
80
90
100
110
120
130
140
1Q15 3Q15 1Q16 3Q16 1Q17 3Q17 1Q18 3Q18 1Q19
Wyom
ing
Farm
Earn
ings
Price Index f
or
All
Liv
esto
ck a
nd P
roducts
Source: National Agricultural Statistics Service and U.S. BEA
Price Index for All Livestock and Products (2011=100) and Annualized Farm Earnings (millions of dollars)
Farm Earnings
Livestock Prices
-30
-20
-10
0
10
20
30
40
1Q15 3Q15 1Q16 3Q16 1Q17 3Q17 1Q18 3Q18 1Q19
Source: National Park Service
Annual Percent Change in Number of Visitations
Yellowstone
Grand Teton
-30
-20
-10
0
10
20
30
40
50
1Q15 3Q15 1Q16 3Q16 1Q17 3Q17 1Q18 3Q18 1Q19
Source: Wyoming Department of Revenue
Annual Percent Change in Lodging Sales
State Total
Teton County
$0
$50,000,000
$100,000,000
$150,000,000
$200,000,000
$250,000,000
$300,000,000
$350,000,000
$400,000,000
$450,000,000
1Q15 3Q15 1Q16 3Q16 1Q17 3Q17 1Q18 3Q18 1Q19
Source: Wyoming Auditor's Office
Selected Revenue Sources for the State of Wyoming
MineralSeveranceTaxes
InvestmentIncome
The retail trade industry, the largest in terms of sales tax contribution, grew 9.4 percent. The public administration sector, which reflects automobile sales, grew only 1.0 percent over the year. Across the state, 17 out of 23 counties experienced increases in taxable sales, led by Converse County (54.4%). Six other counties, Campbell, Laramie, Natrona, Park, Uinta, and Weston, demonstrated double-digit expansions, respectively. Sublette County suffered the largest decline, at -22.9 percent, possibly reflecting a slowdown in conventional natural gas exploration. Tourism The number of recreational visitations to Yellowstone National Park reached 1,264,388 in the second quarter of 2019, down 2.4 percent from the previous year, while 963,075 visits in Grand Teton National Park showed a decrease of 2.2 percent. Visitation figures in 2016 were the highest ever, due mostly to national parks’ centennial celebration. Lodging sales for the second quarter were 15.5 percent lower than a year ago in Teton County, and were 0.7 percent lower for the state as a whole. Visitation to the state during the August 21, 2017 solar eclipse probably compromised the comparison for the third quarter of 2018. In general, the primary drivers for the fluctuation in lodging sales are visitations to the national parks and mineral activities in the state, but the sales change in Teton County’s winter season is mainly driven by ski activities. Agriculture The index of prices received by farmers for all U.S. livestock and products increased in the second quarter of 2019, and the price level was also higher than a year ago. Between the fourth quarter of 2014 and 2016, farm earnings in Wyoming experienced a dramatic downward trend amid strong supply and weak global demand for beef products, but they have stabilized since then, and even accelerated during the first half of 2019. Based on August 1 conditions, barley production in Wyoming is forecast at 7.37 million bushels in 2019, according to Mountain Regional Field Office of the National Agricultural Statistics Service, USDA. This forecast is up 47 percent from last year’s crop. Alfalfa production is forecast at 1.40 million tons, down 12 percent from the 1.59 million tons produced in 2018. Sugarbeet production is forecast at 894,000 tons, down 5 percent from 946,000 tons produced in 2018. Revenue Investment income into the state general fund, including income from the Permanent Wyoming Mineral Trust Fund and state agency pooled income accounts, reached $240.0 million in the second quarter of 2019, which was 27.7 percent lower than the amount recorded a year ago. The huge boosts in second quarters were due to the net realized capital gains being distributed at the end of each fiscal year, which ends on June 30. The $150.4 million in mineral severance taxes generated in the second quarter of 2019 was slightly lower than the previous year, and it was still about one-third less than the amount recorded in the second quarter of 2014.