Embed Size (px)
Citation preview

Economic Valuation of Environmental Impacts of a 2D
Seismic Survey in the Marañon River Basin, Peru
By
Liseth Manrique Zeder
Dr. Elizabeth Shapiro, Adviser
April, 2014
Masters project submitted in partial fulfil lment of the
requirements for the Master of Environmental Management degree in
the Nicholas School of the Environment of
Duke University
2014

2
ABSTRACT
This study seeks to estimate in monetary terms the impacts on the ecosystem services of a
2D seismic Project in the rainforest region of Peru. Economic valuation of the
environmental impacts of land use projects is an important part of Environmental Impact
Assessments (EIA) in Peru. EIAs are used to establish a social and environmental base
line, identify impacts, and establish mitigation measures and compensations. Legislation is
very broad in regard to the goals and ways to conduct economic valuations. Assessments
are not comparable and/or use overly general secondary data. In this context, this study
proposes a way to both standardize and improve the economic valuation methods for
EIAs in Peru by using local data on the impacts on the ecosystem services and on the
economy of the people that depend on them and accounting for the impacts after the
project has ended.
The impact of the project on the carbon capture and storage are calculated through
valuation of carbon stocks, deforestation carbon flux loss, and reforestation carbon flux.
The impacts on the economic activities that depend on ecosystem services are also
estimated for agriculture, hunting and fishing. The results of this analysis vary largely from
the ones obtained for the same project using overly generalized data from literature reviews
and research conducted in other parts of the world. This shows the bias that overly
discretionary guidelines generates; it is also a call to the environmental authorities to
establish a common ground for economic valuations in EIA and the benefits that this
could represent for the authorities, local communities and the companies that conduct
projects in Peru.
The first part of this document provides an introduction to the topic, followed by a
description of the methods applied and an identification of the project’s impacts. These
impacts are then assessed by prevention and mitigation measures in the fourth part. The
impacts are classified in potential and residual impacts. The residual impacts after the
mitigation plans are valued using data from local sources, forest inventories, household
surveys and relevant literature.

3
Table of Content
1. Introduction .............................................................................................................................. 5
2. Description of the project ....................................................................................................... 6 2.1. 2D seismic survey ......................................................................................................... 6 2.2. Description of the project activities .......................................................................... 7 2.3. Geo political location of the project ......................................................................... 8 2.4. Description of the project area ................................................................................ 10 2.5. Social Aspects of Block 130 ..................................................................................... 11
2.5.1. Population and households .................................................................................. 11 2.5.2. Ethnic groups ......................................................................................................... 12 2.5.3. Economic Activities .............................................................................................. 12
2.6. Project components ................................................................................................... 15 2.6.1. Seismic lines ............................................................................................................ 15 2.6.2. Infrastructure. ......................................................................................................... 15 2.6.3. Map with the components of the project ........................................................... 17
2.7. Area of intervention ................................................................................................... 18 2.8. Project schedule .......................................................................................................... 19
3. Identification of the project impacts ................................................................................... 19 3.1. Methodology ............................................................................................................... 19 3.2. Description of the types of impacts ........................................................................ 20 3.3. Environmental factors ............................................................................................... 20 3.4. Impacts on the environmental factors according to the activities of the project 21
4. Prevention and mitigation measures .................................................................................... 24 4.1. Environmental management plan ............................................................................ 24 4.2. Identification of the mitigation plans and mitigation measures for each impact 24 4.3. Potential impacts and residuals ................................................................................ 26
5. Valuation of the residual impacts ......................................................................................... 26 5.1. Methodology ............................................................................................................... 26 5.2. Description of the impact ......................................................................................... 28 5.3. Ecosystem services of the forest. ............................................................................. 28 5.4. Analysis of the ES provided by the forest in which the project takes place: .... 29 5.5. Timeline for the impact ............................................................................................. 29 5.6. Valuing the impact ..................................................................................................... 31
5.6.1. Carbon credit prices ............................................................................................... 31 5.6.2. Estimating the stock of carbon for the deforested area ................................... 32 5.6.3. Valuation of the carbon stock (VCS): ................................................................. 33 5.6.4. Calculating the carbon sequestration flux of the forest (FC) .......................... 33 5.6.5. Valuation of the carbon flux (VCF): ................................................................... 33 5.6.6. Calculating the carbon sequestration flux of the forest after the reforestation 35 5.6.7. Valuation of the carbon flux due to the reforestation (PVref): ...................... 37
5.7. Total ES valuation ...................................................................................................... 38 5.8. Valuation of the impacts on economic activities (VEA) ...................................... 38
5.8.1. Valuation of the loss of agriculture plots (VAp) ............................................... 39

4
5.8.2. Valuation of the loss of hunting opportunities for local communities (VH) 40 5.8.3. Valuation of the impacts on fishing (VF) ........................................................... 41 5.8.4. Valuation of the loss of forest product collection for local communities ..... 42
5.9. Total Economic Valuation (TEV) ........................................................................... 43
6. Conclusions and recommendations ..................................................................................... 43
7. Bibliography ............................................................................................................................ 46
Annex 1 ............................................................................................................................................ 48
Annex 2 ............................................................................................................................................ 50
Annex 3 ............................................................................................................................................ 57

5
1. Introduction
According to Peruvian Law, an economic valuation of environmental impacts should be
undertaken every time a project produces negative effects on the environment.
Article 26 of the National Environmental Evaluation System of the Ministry of Energy and
Mining says:
“To estimate an economic value for the environmental impact, the assessment should consider environmental
damage, the cost of mitigation, control, environmental remediation or rehabilitation, and the cost of the
environmental management measures that may be appropriate for compensation…” (Ministerio del
Ambiente, 2001)
The economic valuation of environmental impacts is a very important step to establish
compensations for communities in the influence area of these projects too.
Before any valuation models can be applied, companies in the hydrocarbon sector of Peru
hire consultants to gather information about the Block1 that they are going to work in. A
social, biological and physical baseline have to be elaborated, the last two ones together are
called the Environmental Base Line.
The Environmental Impact Assessment (EIA) of the project also identifies community
territories and environmental factors impacted on the areas of intervention and influence.
With respect to territories superimposed on seismic lines, the company usually negotiates
directly corresponding compensations according to the Community Relations Plan of the
EIA.
This Master’s Project is an alternative to the methodology that is currently used in Peru to
value the environmental impacts of the oil exploration and exploitation projects. Currently
these types of economic valuations are made using studies prepared in other parts of Peru
and the world, adjusting the results due to specific factors such as local GDP, price
indexes, area, etc. In the cases of the environmental services, the results from research
from Brazil or in certain zones of Peru are extrapolated over the area of interest of the
Project in question. My contribution will be the use of real field data to perform an
economic valuation.
1 A Block is a geographic area that the Peruvian state grants in concession for a determined number of years to a qualified company to explore or exploit of hydrocarbons.

6
2. Description of the project
2.1. 2D seismic survey
The main tools used for appraisal are drilling wells and shooting 2D or 3D seismic surveys.
“Seismic survey is traditionally an exploration and appraisal (E&A) tool… that is applied
for assisting in selecting well locations, and even in identifying remaining oil in a mature
field” (Frank & Mark and Graham, 2008)
The method of 2D seismic data acquisition is used to estimate sizes, depths and metrics of
geological structures in the subsurface. This is done using speed analysis and times of
seismic waves that travel through the ground and return to the surface.
The seismic data acquired is used to determine the existence of geological structures that
may contain commercial or noncommercial reserves of hydrocarbons.
For the acquisition of seismic data in the northern part of Block 130, the holes drilled will
be 4 inches in diameter and to a depth of 20 meters. Once drilled, a power source material
will be placed in the bottom and the hole will be filled with compacted soil. On the surface
geophones will be installed to record the reflected seismic waves from the detonations.
Diagram of an Onshore Seismic Survey
(TGS, 2013)
The result from this survey will be processed and analyzed to develop a model of the
structures underground that is the transversal cut of the area of exploration. Geologists are
the professionals that, based on these images as well as through extensive data on the area
and experience, will determine whether there is a probability or not of finding

7
hydrocarbons. The next step would be to conduct a 3D seismic or to drill exploration wells
to confirm the findings.
Example of a Seismic Survey Result
(Searcherseismic, 2013)
2.2. Description of the project activities
For a proper evaluation of the environmental impacts, the activities that will
be developed in the 2D seismic exploration phase have been identified and are
mentioned below (CEPSA Peru, 2012).
Activities of 2D Seismic Prospection
Principal
Phases
Activities
I. Mobilization and
logistics
Mobilization of personnel, equipment, materials and fuel
Transportation and storage of energy source material
(pentolite)
II. Construction of
camps, HP and DZ
Construction of four (04) camp bases and seven (07)
logistics sub bases camps
Construction of Mobile Camps (MC)
Construction of Heliport (HP) and Discharge Zones
(DZ)
III. Train opening and
well drilling
Cut and levelling of trails
Well drilling, loading and sealing of shooting points
8
Principal
Phases
Activities
Planting of geophones and equipment disposition
IV. Seismic -registry Detonation of energy source material (pentolite) and
seismic registry
V. Restoration and
reforestation
Conditioning of land and plantations in areas affected
VI. Demobilization Demobilization of personnel, materials and equipment in
the Mobile Camps (MC), Heliports (HP), Discharge
Zones (DZ) and Logistics base and sub base Camps
(CEPSA Peru, 2012)
2.3. Geo political location of the project
The project that will be the focus of my analysis is a 2D Seismic survey in Block 130 in the
department of Loreto Peru. This project will be conducted by CEPSA. CEPSA is a Spanish
oil company that “has been operating in Peru since 2007. It currently operates three
exploration licenses in an area covering over 22,000 km2 in the Maranon basin (block 130)
in the north of the country and the Ucayali basin in the east (blocks 114 and 131), in which
CEPSA holds a 100%, 60% and 70% stake, respectively” (CEPSA, 2014).
The area of the Project is Block 130 granted in concession by the Peruvian State through
Perupetro for its exploration to CEPSA Company. This Block is located in the Department
of Loreto in Peru.

9
Peru: Contract Block Map, Sedimentary Basin and Natural Protected Areas
(Perupetro, 2014)
Block 130 is in the dotted red circle.
The geo political scope of Block 130 (extension: 1 275 349,404 hectares) is located in the
Loreto region and extends to the provinces and districts that are stated in the following
table.

10
Location of Block 130
Department Provinces Districts
Loreto
Loreto Urarinas
Parinari
Datem del
Marañón
Pastaza
Cahuapanas
Alto Amazonas
Lagunas
Jeberos
SantaCruz
Yurimaguas
TenienteCésarLópezRojas
Balsapuerto
(IGN)
Map of Block 130
(CEPSA Peru, 2012)
2.4. Description of the project area
The department of Loreto is found in the Marañon River basin that forms part of the
Amazon River basin.

11
The Amazon River Basin is one of the most important ecosystems because of its large
biodiversity. The Amazon River Basin is also important because of the ecosystem service it
provides to humanity (Foley, et al., 2007).
The Amazon basin, due to its “space distribution of the geomorphologic characteristics,
the weather, the biological resources and the human population and their activities in this
region so heterogeneous and vast, inevitably lead to an irregular distribution of pressures
and preservation needs”(Josse et al., 2013).
The western portion of the Amazon basin is important because it includes the Eastern
slope of the tropical Andes, it extends to a region known at both worldwide and
continental levels for its richness, level of endemism of vascular plants, birds, amphibians
plus reptiles (Josse, et al., 2013).
The Marañon basin is found in the extreme north east side of the Amazon River basin.
2.5. Social Aspects of Block 130
2.5.1. Population and households
The number of people in the influence area of the project is 57 753, distributed in 22
441 households.
Population and Household Distribution
N° District Town Households 1 Barranca San Jorge 3 2 Jeberos Nuevo Jeberos 400 3 Jeberos Bellavista 63 4 Jeberos Bethel 142 5 Jeberos Anexo Nueva Jordania 18 6 Yurimaguas Vista Alegre de
Curiyacu 21
7 Yurimaguas Santa María 103 8 Yurimaguas Nueva Era 38 9 Yurimaguas Cachihuañusca 48 10 Yurimaguas Santa Rosa 32 11 Yurimaguas Zapatoyacu 65 12 Yurimaguas Apangurayacu 21 13 Yurimaguas Los Tigres 28 14 Yurimaguas Yahuar 36 15 Yurimaguas Vista Alegre 19 16 Yurimaguas Nuevo Horizonte 50

12
N° District Town Households 17 Yurimaguas Chirapa 45 18 Yurimaguas Yurimaguas 20720 19 Yurimaguas Ruiseñor 27 20 Yurimaguas Munichis 550 21 Yurimaguas San Luis 12
(CEPSA Peru, 2012)
2.5.2. Ethnic groups
In the area of the project only two ethnic groups of indigenous people were identified
according to the EIA: Chayahuita and Jebero. The rest of the population is not
considered indigenous.
Indigenous Communities in the Area
District Category Town Ethnic Group
Households
Jeberos
Native Community Nuevo Jeberos
Mixed and Jebero
400
Annex of the Bellavista
Community
Nueva Jordania
Chayahuita 18
Native Community Bellavista Chayahuita 63 Native Community Bethel
Chayahuita 142
(CEPSA Peru, 2012)
2.5.3. Economic Activities
CEPSA conducted a household survey in the area of the Project and identified the
following economic activities in the area and the percentage of households that
perform them. Many households perform more than one activity:
Economic Activities
(In percentages)
Activity Total Area Yurimaguas Sillay-Jeberos
% % % Agriculture 67,4 55,3 98,9

13
Activity Total AreaYurimaguas Sillay-Jeberos
% % % Commerce 30,9 33,8 23,8 Fishing 27,4 19,2 47,2 Hunting 23,1 8,8 59,6Livestock 21,1 5,8 60,4 Handicraft 14,2 2,4 44,2 Timber extraction 4,2 2,4 8,7 Others 24 30 9
CEPSA 2012
a) Agriculture
The most important economic activity in the area of the Project is agriculture, 67% of
the households cultivate plants for consumption and trade.
Most Important Products
(In percentages)
Product Total
AreaYurimaguas Sillay-Jeberos
% % % Manioc 86,3 81,0 94,3 Bananas 68,4 88,6 38,2 Corn 43,1 64,0 11,8 Rice 27,6 42,4 5,3Pineapple 15,9 2,0 36,6
(CEPSA Peru, 2012)
The commerce of these products takes place in most cases in the city of Yurimaguas.
b) Fishing
In the area, fishing is the third most important activity practiced by the people, 26.8%
of the households perform this activity for consumption and trade.

14
c) Livestock
Only 19.2% of the households perform this activity in rural areas, most of them in the
area of Sillay-Jeberos where 60% of the families perform this activity.
d) Hunting
Currently this activity is still practiced in most communities in the area, where people
hunt for consumption and to sell the meat in local markets.
Hunting is currently diminished by the appellant and indiscriminate activity performed
poachers, forest clearing and the noise of the machines loggers.
In this regard, 22.6 % of the population of the areas practiced hunting.
Households that Hunt
(In percentage)
Yurimaguas Jeberos -Sillay
% of Households that Hunt
8.8% 59.6%
CEPSA 2012
This substantial difference between the two zones of influence is because the Sillay-
Jeberos area is largely rural; Yurimaguas is considered mostly as an urban area.
e) Timber extraction
The participation of the residents of the two areas in forest extraction is restricted,
reaching only 4.1% of the households.
f) Handicraft
Handicraft is a traditional activity and part of the culture of indigenous people,
however due to foreign influence only 13.7% of households perform this art craft.

15
g) Trade and Commerce
In this area, trade is an economic activity with relative development, practiced only
20.1% of the households.
h) Collection of forest products
Collection of forest products is done for consumption; trade of these products is very
small. People collect products such as fruit, medicinal plants, leaves, branches, roots,
firewood, etc.
In Yurimaguas only 10.1% of the households participate in this activity while in Jeberos
and Sillay, 65.3% of the households do.
2.6. Project components
Information extracted from the EIA (CEPSA Peru, 2012)
2.6.1. Seismic lines
The twenty six (26) seismic lines of the Project include a total of 642 km distributed in the
following manner:
Sector Sillay-Jeberos: 14 seismic lines
Sector Yurimaguas: 12 seismic lines.
2.6.2. Infrastructure.
Logistics Camp Bases (CB)
The Project also includes the construction of 4 Logistics Camp Bases, distributed in the
following manner:
Sector Sillay-Jeberos: 3 CB
Sector Yurimaguas: 1 CB
The Logistics Camp Bases work as administration and coordination centers of the seismic

16
operation, among which are the programming of helicopters, management and logistics of
mobile camps, daily work control, temporary warehouse of the topography equipment,
drilling, seismic registry, work environments, housing of the “staff” personnel and workers,
bathrooms, storage spaces and distribution of fuels, mechanical, maintenance and repair
shops, among other aspects pertaining to the seismic operations.
Logistics Camp Sub Bases (CSB)
Seven (7) CSB will be constructed in the following manner:
Sector Sillay-Jeberos: 4 CSB
Sector Yurimaguas: 3 CSB
The function of the CSB is to serve as support points to perform the seismic activities,
such as personnel boarding, food storage, heliports, etc.
Mobile Camps (MC)
The MC will be located close to the areas of the work activities. These camps will be
constructed close to the heliports (HP) and seismic lines.
The Project will demand a maximum of 132 Mobile Camps, spaced approx. 5 kilometers in
between each. The approximate dimensions of each mobile camp will be 60m x 40m
(2400m2). It is estimated that each will accommodate 30 people.
Heliports (HP) in the camp operations
Helicopters will be the main source of transportation for the mobilization of the workers,
equipment and supply from each CB or CSB to the field operations. The number of
heliports will mainly depend on the conditions of the land, weather, forest density and
accessibility or topography of the zone.
The distance between the heliports could vary according to the changes in the forest or
topography and factors that cause or affect the daily production or security of the
operators. Normally they are constructed to support the Mobile Camps, for which it is
expected to have approximately 132 heliports.
Discharge Zone (DZ)
The helicopters will also be used for the transportation of geophones, cables and
registration equipment and supplies, as the gathering of information advances along the

17
seismic lines. The helicopters will transport the equipment suspended in the air using a
cable of 25 to 44 meters long (sling) that has an automatic disconnection mechanism.
Characteristics of the DZ
Parameters for DZ Description
Number of DZ. Maximum 1 320
Total unit area. 12m x 12m (144 m²)
Distance. Approximately every 500 meters one DZ.
2.6.3. Map with the components of the project
The following maps shows the locations of the main components of the project, in the
south (Yurimaguas Sector) and in the north of the Block (Jeberos-Sillay):
Yurimaguas Sector

18
Jeberos-Sillay Sector
(CEPSA Peru, 2012)
Note: Mobile camps, drop zones, heliports are not in this map.
2.7. Area of intervention
According to the description of the Project presented by CEPSA, it has been determined
that the areas intervened (deforested and cleared) will be the following:
Summary of Areas of Intervention in the 2D Seismic Survey
Seismic Program Dimensions Total (ha)
Construction of four (04) Logistics Base Camps (CB) and seven (07) Logistics
Sub Base Camps (CSB)
CB
3.0 hectares for CB1 and 3.5 hectares for Logistic Base Camps CB2, CB3 y
CB4
CSB
3 hectares each
34.5
Mobile Camps (132) 60m x 40m 31.7

19
Seismic Program Dimensions Total (ha)
Maximum trail opening – Topography alignment of Seismic Lines (642 km)
642 km x 1,5m 96.3
Heliports (132) 90m x 30m 35.6 Discharge or Drop Zones (1 320) 12m x 12m 19
Total Number of Hectares 217.1 CEPSA Peru 2012
2.8. Project schedule
For each activity the following times are estimated according to the sector where they are
found:
Execution Time for the Seismic Survey
Principal Stages
Sector Sillay
(weeks)
Sector Jeberos
(weeks)
Sector Yurimaguas
(weeks) Mobilization and Logistics 01 01 03 Construction of Camps HP and DZ 02 02 06 Opening of trails and Drilling of Holes 02 04 07 Registry - Seismic 02 04 07 Restoration and Reforestation 03 05 07 Demobilization 04 06 09
CEPSA Peru, 2012
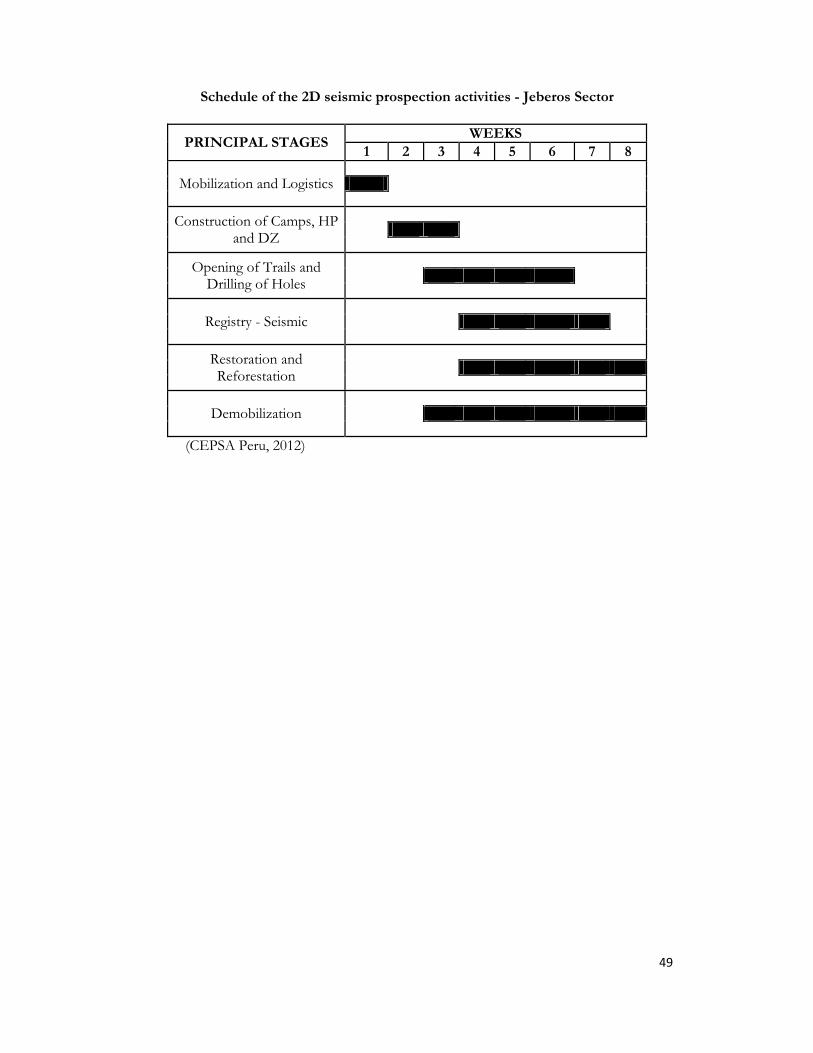
The seismic activities will not be necessarily developed in sequence but rather some of
them will be developed in parallel and others will overlap. In the case of the seismic in the
Jeberos Sector, the seismic will last 8 months, in Sillay 6 months, while in the Yurimaguas
sector it will last 12 months. (See Annex 1)
3. Identification of the project impacts
3.1. Methodology
For the analysis and evaluation of the environmental impacts I considered using a
methodology based on the Leopold Matrix (qualitative assessment) and Methods of
Identification of the Importance and Magnitude of the Environmental Impacts
(quantitative evaluation) according to V. Conesa (year 2010, 4ta edition Methodological
Guide for the Evaluation of the Environmental Impact).

20
3.2. Description of the types of impacts
According to the EIA of the Project (CEPSA Peru, 2012) the most important impacts
during these activities are:
Type of Impact
Deforestation (increase of erosion and temperature in the deforested area).
Potential spillages of oil, fuel and other chemical substances to the soil and air.
Potential emissions of gases from the electricity generators.
Potential noise produced by the Works and displacements that generate inconveniences to
the workers, dwellers and animals.
Potential misplacement of residuals.
Increase of trade.
Potential of social conflict due to the access of personnel alien to the native and local
communities.
Potential for ground compacting and loss of organic matter.
Potential to alter archeological sites.
3.3. Environmental factors
Environmental factors have been identified in such a way so that they may be easily
identifiable, so that they superimpose among themselves and so that they may be easy to
measure. The following table shows the environmental factors identified in the area under
study (Conesa, 2010).
Environmental Factors Identified for the 2D Seismic Prospection
Media Environmental Components Environmental Factors
Phy
sica
l Med
ia
A. Physiography A1. Morphology A2. Drainage A3. Processes
B. Micro climate B1. Temperature B2. Rain
C. Ground C1. Organic layer and mineral soil C2. Ground qualityC3. Ecological function (Bio production)
D. Water D1. Quality of superficial water and water sediment
E. Air E1. Air qualityE2. Level of Noise
Bio
logi
cal
Med
iaF. Land Flora and Fauna
(Flying and Non Flying) F1. Land vegetation (Forest) F2. Land vegetation (Undergrowth)

21
Media Environmental Components Environmental Factors F3. Birds, mammals and reptiles
G. Water Flora and Fauna G1. Fish, plankton and benthos
Per
cept
ion
Med
ia
H. Landscape – Scenery Value
H1. Visual resource (Landscape)
Soci
o E
cono
mic
M
edia
I. Economic I1. Local trade J. Territory J1. Use of the land
K. Population K1. NativeK2. Colonists K3. Local temporary employment
Cul
tura
l M
edia
L. Cultural L1. Archeological sites
CEPSA Peru, 2012
3.4. Impacts on the environmental factors according to the activities of the
project
An identification of the environmental factors according to the Environmental Impact
Assessment in reference is presented below:

Matrix of Identification of Environmental Factors for a 2D Seismic Prospection and Type of Impact
Media Environmental Components
Environmental Factors
Project Activities
1 2 3 4 5 6
Mob
iliza
tion
& L
ogis
tics
Cam
p C
onst
ruct
ion,
H
p Y
Dz
Ope
ning
of
Tra
ils a
nd
drill
ing
Seis
mic
su
rvey
Res
tora
tion
Dem
obili
zing
Phy
sica
l Med
ia
A. Physiography A1. Morphology X A2. Drainage X X A3. Processes X X X
B. Microclimate B1. Temperature X X B2. Rain X X
C. Ground C1. Organic layer and mineral soil X X X X X C2. Quality of ground X X X X X X C3. Ecological function X X
D. Water D1. Quality of superficial water & water sediment X X X X
E. Air E1. Air quality X X X X E2. Level of noise X X X X X
Bio
logi
cal
Med
ia
F. Land Flora & Fauna (Flying & Non Flying)
F1. Land vegetation (forest) X XF2. Land vegetation (undergrowth) X X X F3. Birds, mammals & reptiles X X X X X
G. Water Flora & Fauna
G1. Fish, plankton & benthos X X X X

23
Media Environmental Components
Environmental Factors
Project Activities 1 2 3 4 5 6
Mob
iliza
tion
& L
ogis
tics
Cam
p C
onst
ruct
ion,
H
p Y
Dz
Ope
ning
of
Tra
ils a
nd
drill
ing
Seis
mic
su
rvey
Res
tora
tion
Dem
obili
zing
Per
cept
ual
Med
ia
H. Landscape-Scenery Value
H1. Visual resource (landscape) X X X X X
Soci
o E
cono
mic
M
edia
I. Economic I1. Local trade X X X X X X J. Territory J1. Use of land X X
K. Population K1. Native X X XK2. Colonists X X XK3. Local temporary employment X X X X X X
Cul
tura
l M
edia
L. Cultural L1. Archeological sites X X X
CEPSA Peru, 2012
More information of the impacts for each phase of the project can be found in Annex 2.

4. Prevention and mitigation measures
4.1. Environmental management plan
For each one of the impacts the oil companies seek for solutions. The regulating agencies,
such as OSINERGMIN and OEFA make regular inspections in the sites where the oil
companies perform their activities and seek for them to comply with the preventive
measures presented in the Environmental Management Plans to reduce the impacts and
prevent others.
The environmental impacts that continue in spite of the mitigation and prevention
measures are the residual impacts (Conesa, 2010)
4.2. Identification of the mitigation plans and mitigation measures for each
impact
Analysis of Environmental Impacts and Mitigation Measures
Type of Impact Preventive and Mitigation Measures
Impact Mitigation
Deforestation (increase or erosion and temperature in the deforested area).
Program of Clearing and/or Cutting. Program of Reforestation
Although the impact is temporary over the environmental services of carbon capture, the mitigation measures will enable to reduce the important tasks of clearing and cutting. The reforestation program will enable to recover the area intervened.
Potential oil spills, fuel and other chemical substances to the ground.
Program of Management of Chemical Substances. Program of Management of Transportation Routes. Training Program. Contingencies Program.
The management plans of chemical substances and of transportation routes will enable to reduce the probabilities of contaminating probabilities of contaminating the ground. If chemical or organic contamination should occur, the contingencies plan should be applied to reduce the damages caused.
Potential of air contamination.
Management of Air Plan. Contingencies Plan.
These plans will enable a proper management of the gas emission sources during all of the stages of the Project (construction, operation and abandonment).

25
Type of Impact Preventive and Mitigation Measures
Impact Mitigation
Potential noise produced by the Works and displacements that generate inconveniences to the workers, dwellers and animals.
The Biological Monitoring Plan. Air Management Plan.
The biological monitoring plan will enable the company to evaluate the displacement of the species caused by the uncomfortable noise generated by the operations in the zone. The Air Management Plan is to prevent and mitigate the generation of uncomfortable noise originated by the operations.
Potential misplacement of residuals.
Program of Management of Solid Residuals. Training Program. Contingencies Plan.
This Program of Residuals Management describes the procedures, systems, equipment and specific structures that will be implemented for the correct management and disposal of the residuals identified in the development of the Project.
Potential of social conflicts resultant from the entrance of alien personnel to the native and local communities.
Community Relations Program Compensations Program. Training Program. Community Relations Program. Contingencies Plan.
The Community Relations Program will enable to establish the guidelines under which the trade activities will be made with the communities of the area of influence of the Project so as not to interfere with the normal functioning and avoid potential negative impacts such as lack of supplies in the zone.
The Plan will comprise a series of action programs oriented to promote and maintain a communication flow and positive relations, both with the local population as well as with the company personnel and its sub-contractors. Likewise, the plan will be a tool to prevent and mitigate the possible impacts (social and environmental) of incidents and/or social conflicts with the population that will be within the area of influence of the project.
The loss of hunting opportunities for locals is a possibility.
Potential of ground compacting and loss of organic matter.
Ground Management Program The Ground Management Program will enable to establish measures and techniques to control and prevent the erosion during the development of the Project.

26
Type of Impact Preventive and Mitigation Measures
Impact Mitigation
Potential to alter archeological sites.
Cultural Patrimony Program The Cultural Patrimony Program will enable to locate, identify and register the sites where archeological remnants are found in the area of influence of the Project and will propose protection measures upon evidences of the presence of archeological material in coordination with the Ministry of Culture.
Based on Petrominerales, 2014 and CEPSA, 2012
4.3. Potential impacts and residuals
According to their probability of occurrence, two types of impacts can be distinguished:
The potential impacts are those that may occur as consequences of the project’s
activities. They may be corrected and prevented through the proper execution of
the Environmental Management Plan (Conesa, 2010).
The residual impacts are those whose total correction or prevention is impossible
once the Environmental Management Plan has been applied (Conesa, 2010).
5. Valuation of the residual impacts
5.1. Methodology
The total economic value (TEV) comprises the value of use (VU) and the value of non-use
(VNU) of the resource. It seeks to express in monetary terms the VU and VNU of market
and non-market values, for example ecosystem services.

27
TEV Framework
(DEFRA, 2014)
The value of use, that associates some type of interaction between man and the natural
media has to do with the welfare that such use provides to the economic agents (e.g.,
consumption of commodities produced by ecosystems, the health benefits of clean water,
the avoided impacts of climate change through sequestered carbon to name a few).
The Non Use Value, unlike the previous one does not derive directly from interactions
between man and media, is associated to the intrinsic value of the environment (e.g. the
value in preserving ecosystems for their inherent worth to today’s and future generations).
(See Annex 3 for details)
In this case the residual impact of seismic activity is deforestation and loss of hunting
opportunities for local communities; the following characteristics of the project will be
taken into account for determining the type of value for this resource:
This forest is not used for extracting timber
Communities in the direct influence area of the project get compensation.
Compensation is negotiated taking into account the value of the economic valuation of the
environmental impacts

28
Taking these characteristics into account, the value of economic loss from deforestation
would be the foregone option value for the community of getting into a payment for
ecosystem services program, like REDD+. I will use this as a simulated market to value the
impacts on the ecosystem services (ES).
The next steps will be based on the ones used for valuing tropical forests in Guatemala
(Sencion, 2002).
Steps:
1. Determining the ES of the Forest.
2. Determining which ES will be affected by the residual impacts of the project.
3. Determining the type of value for each ES.
4. Determining the methodology for its valuation.
5. Valuation of the loss of hunting opportunities
5.2. Description of the impact
In the case of the 2D seismic exploration it has been determined that the residual impact
will be the deforestation since it is the only impact that is not avoidable and its mitigation
can reduce it but cannot eliminate it or the loss of hunting opportunities.
5.3. Ecosystem services of the forest.
Following the perspective of United Nations’ Millennium Ecosystem Assessment (2005),
ecosystem services provided (in this case) by the forest can be used as a conceptual
framework to value the forest (Thiaw & Kumar, 2014). According to this analysis
framework the value of an ES for which the market fails to assign a value underlies the
compensation or payment for ecosystem services (PES). Forests provide essential services
to humanity, these are non-market goods.
There are many types of ES; however there are 4 that will be used for estimating the PES
(Wunder, 2008):
1. Carbon sequestration: maintain a forest to store and sequester carbon (Thiaw &
Kumar, 2014).
2. Watershed protection: avoid floods and soil erosion to maintain the quality of aquifers
(Thiaw & Kumar, 2014).
3. Biodiversity protection: biological corridors or a species (Thiaw & Kumar, 2014).

29
4. Landscape beauty: maintain a landscape to promote economic activities like tourism
that generates income (Wunder, 2008).
5.4. Analysis of the ES provided by the forest in which the project takes place:
ES Residual Impact Outcome Carbon
Sequestration There will be 217.1 ha deforested Carbon sequestration
will be affected Watershed protection
More than 50% of the deforestation will take place in forest that is upstream.
The deforestation will take place in small areas that are far apart from each other
No significant impact according to the EIA
Biodiversity protection
There are no endemic species and the impact of the project on the biodiversity
will not be significant since the deforestation will take place in small areas
that are far apart from each other
Loss of hunting forest products
collecting opportunities for
local communities. Agriculture is not
going to be possible in some areas.
Landscape beauty The area of the project has no tourist activities
No impact
From the previous analysis the impact of this project will focus on the ability of the forest
to sequester carbon. The impact on watershed protection is not significant according to the
EIA (CEPSA Peru, 2012) since the deforestation doesn’t take place in a large area all
together but in small parcels that are distant from each other or lines that are 642km long
but only 1.5 m wide.
5.5. Timeline for the impact
The time during which the ES is lost is between the deforestation and the reforestation.
During the reforestation phase the ES will be gradually recovered.


5.6. Valuing the impact
The forest in this area is not used for generating income. It is only used by indigenous
communities mostly for hunting and considered ancestral territory. There are also no
concessions for extracting timber in the area.
This MP considers the income generated by a PES project using the REDD+ methodology
as opportunity cost for the communities in the area.
For the purpose of this MP, the use of allometric equations is too ambitious since the
purposes of this document is to calculate the opportunity cost and compensations for these
communities and not to conduct research to implement a REDD+ project, which demands
a more complex data analysis and deeper field research.
5.6.1. Carbon credit prices
Given the fact that this is a project that will be carried out right after its approval by the
Ministry of Energy and Mining, current carbon market prices can be used to estimate its
valuation.
Even though Peru is not currently a partner country for the REDD+ project, it is right
now in the designing and implementation stage.
For example Disney Corporation paid US$ 8 per carbon credit for a REDD project in the
Alto Mayo Protected Forest, this price was well beyond the market price of US$ 1. The
reason for paying “extra” was that Alto Mayo is a Protected Forest, with a rich biodiversity
and home to indigenous people (Peru21, 2013).
In the case of this project, the biodiversity is very rich and there are indigenous
communities too, however the area is not a national park. Block 130 is also very close to
the Alto Mayo forest.
For valuing this project, the average price between what Disney paid last year and the
market price for carbon offsets will be considered. The total cost for 1 carbon credit is
US$4.5.

32
5.6.2. Estimating the stock of carbon for the deforested area
To estimate the value of the ecosystem services (ES), I will use an available forestry
inventory conducted in the area of the project for the purpose of getting a deforestation
permit required by the Ministry of Agriculture’s department of Forestry. This forestry
inventory has basic but sufficient information to estimate the average carbon storage in
tons per hectare and the flux of carbon storage that will serve as inputs in calculating the
PES.
Where:
CS = Carbon storage per ha
V= Volume of biomass (m3/ha)
BEF= Biomass expansion factor (1.6)
D=Wood Density (0.62 t/m3)
BCC= Biomass to carbon conversion factor (0.5)
The result of this equation is 51.63 tons of Carbon per hectare. 2A quick way to estimate
the CO2 captured by this forest per hectare Conservations International recommends to
multiply the Carbon tons by 3.67 (Conservation International, 2010).
1 3.67
The result for this forest is a total of 189.47 tons of Co2, stored per hectare.
In the REDD+ scheme, each ton is a Carbon credit, so the total amount of carbon credits
per hectare is 189.48. Given that the amount of deforested area is 217.1ha, the number in
equivalent of carbon stock credits (CSC) is:
217.1 189.48 41136.56
2 The carbon captured in tons per hectare for an Amazonia forest is on average 86 and a minimum of 39
(Dauber, Teran, & Guzman, 2006). The obtained result of 51.63 tn C/ha is within this range.

33
5.6.3. Valuation of the carbon stock (VCS):
The total carbon stock stored in the deforested forest is 41, 136.56 tons. Multiplying this
number by the price of the carbon credits per ton gives an amount of US$ 185 114.54 as a
value for the carbon stock.
5.6.4. Calculating the carbon sequestration flux of the forest (FC)
After the deforestation and during a part of the reforestation process the forest will not
have the same carbon sequestration capacity.
According to the IPCC special reports based on the research of several authors, the carbon
in “pristine forests (e.g. in the wet tropics or boreal region) were long believed to be mostly
in a state of equilibrium, such that over a period of several years their carbon balance
would be neutral. This view has been challenged in more recent years by increasing
evidence from sample plot studies that undisturbed areas of forests also sequester carbon
(e.g., Lugo and Brown, 1993; Phillips et al., 1998, for the tropics; Schulze et al., 1999, for the
Siberian boreal forest). These carbon quantities will eventually be returned to the
atmosphere when patches of trees die for biological or climatic reasons, localized natural
disturbance occurs, or compartments of the forest are cleared” (IPCC, 2000)
For low hills forest, the annual total biomass produced in a year per hectare was estimated
to be between 13.6 and 16.9 tn Cha-1 yr-1. (C . A . J . GIRARDIN*, 2010)
To transform the average flux of biomass into carbon this average has to be multiplied by
0.5 and then multiplied by 3.67 to estimate the flux of CO2 captured on average by the
forest per hectare per year.
The result is 27.98 tons of CO2 per year per hectare.
5.6.5. Valuation of the carbon flux (VCF):
A. Base Camps (PVCbc):
The area, except for the base camps, will be reforested one year after the deforestation
takes place. The base camps area is 34.1 ha. This area will not be reforested because it will
be used for other exploratory activities and if hydrocarbons are found will remain

34
deforested due to the activities of the company, which will require that the camps function
for the time the extraction takes place. This could be as much as 20 years or more.
In this case, the assumption is that the area will not be reforested, thus the perpetuity will
be calculated as follows:
Where:
PVCbc=Present value of the carbon sequestration loss due to the permanent deforestation
of base camps
FC=flux of carbon in tons of CO2 per year per ha
ha= number of hectares
P=carbon credit price
d=discount rate
In this case I will use a real discount rate of 10%.
The result for this equation is:
27.98 34.1 4.510%
$42935.31
B. Mobile Camps, Seismic Lines, Heliports and Discharge Zones (PVo):
The area of the mobile camps, seismic lines, heliports and discharge zones is 182.6ha. The
reforestation of this area will start after one year in the worst case according to the EIA
(CEPSA Peru, 2012). This means that the loss in carbon sequestration flux for this area is
equal to the area multiplied by the carbon sequestration flux per year (27.98 tons of CO2
per year per hectare).
The loss in carbon sequestration will last until this ecosystem service is completely
recovered by the reforestation. Using data from the forestry inventory, it is estimated that
the forest will recover its old carbon sequestration capacity in 10 years.
1 1
$173252.16

35
Where:
PVo= Present value of the carbon sequestration loss due to the permanent deforestation of
Mobile Camps, Seismic Lines, Heliports and Discharge Zones
P=carbon credit price
t= time
g= average US Dollar inflation rate
FC=flux of carbon in tons of CO2 per year per ha
ha= number of hectares
d=discount rate
In this case I will use a real discount rate of 10%.
The value for the carbon flux (VCF) is:
$216187.47
5.6.6. Calculating the carbon sequestration flux of the forest after the reforestation
According to the model of von Bertalanffy in Giraldo & Del Valle 2011, the size of the
diameter according to the age of a tropical tree on average looks like the following
function:
Size of Diameter According to the Age of a Tropical Tree
(Giraldo & Del Valle, 2011)
Data from the same authors show that the annual increment in the diameter of the trees
(ICA) is on average 0.35cm until year 20 and 0.45 cm from year 20 to year 40 and then
decreases.
Dia
met
er (c
m)
Years

36
Annual Increment in the Diameter of a Tree
(Giraldo & Del Valle, 2011)
Diameter growth rates, current annual increment (ICA) black line, mean annual increment
(IMA) dotted line, relative increment (IR) dashed line. (Giraldo & Del Valle, 2011)
According to the EIA (CEPSA Peru, 2012), the number of trees planted per hectare is
1,111 (1 tree per 9m2). The same document includes a list of suggested species for
reforestation, which include the species that are often found in the area according to the
inventory.
Extrapolating data from the forestry inventory, the following carbon storage per year
during the reforestation is expected for the first 10 years:
Incr
ease
in
th
e D
iam
eter
(c
m/y
ear)
Years
Rel
ativ
e in
crem
ent

37
The trend line equation for the carbon flux per year is:
427.59 .
Where:
TCF= total carbon flux for the reforested area (183ha) excluding base camps
t=number of years since reforestation
Using this equation, it is possible to interpolate missing data and calculate the storage of
carbon for each year.
5.6.7. Valuation of the carbon flux due to the reforestation (PVref):
Assuming a price increase for carbon credits equal to an average US Dollar inflation rate
(g) 1.13 and a discount rate (d) of 10%, the present value of the discounted cash flow for
the number of years (t) since the reforestation project:
3
∑ 1
1
3 Reforestation will start one year after the deforestation takes place.
y = 427.59x0.3987
0
200
400
600
800
1000
1200
1400
1600
1 2 3 4 5 6 7 8 9 10
tota
l car
bon
flux
year
Carbon Flux per Year
carbon flux per year
trend line

38
Since the mode for the DBH (diameter at breast height) of the forest inventory is 12cm, we
can consider that this is mostly a young forest, thus on average the trees are more or less 10
years old. For the discount of the carbon flux I will consider 10 years, which should be the
estimated time to recover the ES.
The result for this equation is that PVref equals US$ 29 244.88
5.7. Total ES valuation
The value of the carbon flux and the carbon stock are the values of the negative impacts on
this ES, however the reforestation offsets this impact to some degree:
$372057.1
5.8. Valuation of the impacts on economic activities (VEA)
According to the description of the economic activities provided in the second part of this
MP, I identified the following impacts:
Activity Impact
Agriculture Impacted by the loss of agriculture plots Commerce Increase in commerce between the communities and workers
of the project
Fishing Impacted by the increase in traffic in the rivers, that will disturb wildlife
Hunting Impacted by human intervention in the forest
Livestock No impact Handicraft No impact
0100020003000400050006000700080009000
10000
1 2 3 4 5 6 7 8 9 10Pre
sent
Val
ue o
f ca
rbon
flu
x pe
r ye
ar (U
S$)
year
Discounted Flux per Year

39
Activity Impact
Timber extraction No impactForest product extraction Impacted by deforestation
5.8.1. Valuation of the loss of agriculture plots (VAp)
According to the EIA, agriculture is the most important economic activity in the area of the
project. In the Yurimaguas sector, 55% of the households practice this activity while in Sillay-
Jeberos 98.9% of the households practice agriculture (CEPSA Peru, 2012). Agriculture is mostly
“slash–and-burn” which means that people migrate from one plot to the next one in approximately
1 to 3 years (Columbia University, 2005) this type of agriculture and the project will extending
deforestation and reduce land suitable for agriculture..
I will assume for the purpose of this valuation that agricultural plots located in the areas where
seismic lines are located are marginally impacted. I will assume that the agriculture will be affected
in the areas where the company builds its camps. This area is 34.5 ha; the plots are have on average
an extension of 5ha.
Area Number of Base
Camps
Number of Sub Base
Camps
Total number of ha
Yurimaguas 1 (3ha each) 3(3ha each) 12 ha
Jeberos-Sillay 2 (3.5ha each) 4 (3ha each) 19 ha
Total 31ha
According to the same source, the annual income from the trade of agricultural products received
by families in Yurimaguas is in average $18 747 per household, while in Sillay-Jeberos was $10 550.
Since I do not have data on the number of products dedicated to consumption, I will assume
conservatively that 20% of the total harvest was devoted to consumption. These camping areas will
be used for activities in the next stages of the project (3D seismic, drilling of exploration wells, etc.).
According to the EIA, the agriculture in this area is “slash-and-burn”, in this case the soil of the
plots lose their nutrients in approximately for 1 to 3 years (Columbia University, 2005). I will take
the average of this range of years to estimate the value of this impact, 1.5 years.
Due to these activities, these areas will be lost for agriculture for an indeterminate number of years.
For this reason I will assume that this area will be plots lost for agricultural practices.
In the case of Yurimaguas, if $18 747 are produced in 5 ha, then the total income per year from the
12 ha is $ 44 993.14. In the case of Jeberos-Sillay, this amount is $ 40 090 for 19ha per year.
40
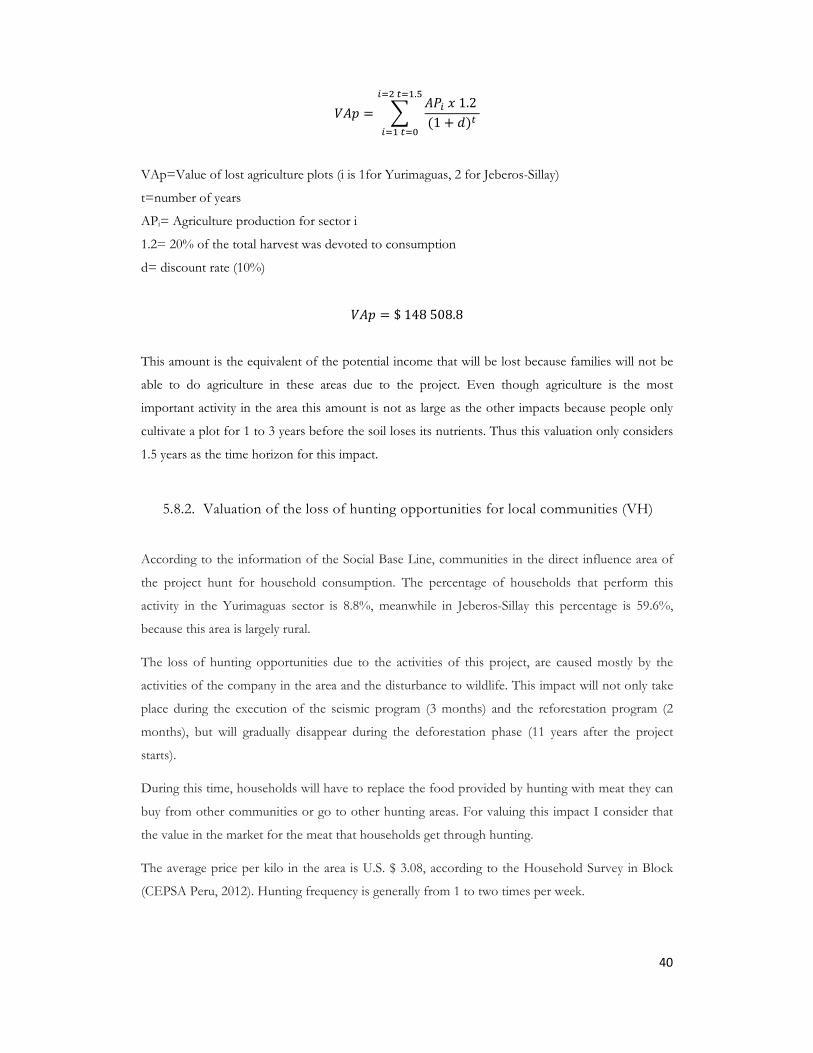
1.21
.
VAp=Value of lost agriculture plots (i is 1for Yurimaguas, 2 for Jeberos-Sillay)
t=number of years
APi= Agriculture production for sector i
1.2= 20% of the total harvest was devoted to consumption
d= discount rate (10%)
$148508.8
This amount is the equivalent of the potential income that will be lost because families will not be
able to do agriculture in these areas due to the project. Even though agriculture is the most
important activity in the area this amount is not as large as the other impacts because people only
cultivate a plot for 1 to 3 years before the soil loses its nutrients. Thus this valuation only considers
1.5 years as the time horizon for this impact.
5.8.2. Valuation of the loss of hunting opportunities for local communities (VH)
According to the information of the Social Base Line, communities in the direct influence area of
the project hunt for household consumption. The percentage of households that perform this
activity in the Yurimaguas sector is 8.8%, meanwhile in Jeberos-Sillay this percentage is 59.6%,
because this area is largely rural.
The loss of hunting opportunities due to the activities of this project, are caused mostly by the
activities of the company in the area and the disturbance to wildlife. This impact will not only take
place during the execution of the seismic program (3 months) and the reforestation program (2
months), but will gradually disappear during the deforestation phase (11 years after the project
starts).
During this time, households will have to replace the food provided by hunting with meat they can
buy from other communities or go to other hunting areas. For valuing this impact I consider that
the value in the market for the meat that households get through hunting.
The average price per kilo in the area is U.S. $ 3.08, according to the Household Survey in Block
(CEPSA Peru, 2012). Hunting frequency is generally from 1 to two times per week.

41
According to the social base line of the EIA, the volume of kilos hunted is: Yurimaguas 598Kg per
year, Jeberos 338kg per year, Sillay 1040kg per year.
The number of families that hunt according to the survey are approximately:
Yurimaguas: 96 (excluding the city of Yurimaguas)
Jeberos and Sillay: 373
Hunting activities will not necessarily be totally affected, since the project doesn’t take place in all of
the hunting territories. According to the EIA, it will only affect 12.92% of the hunting
opportunities, since the area of the project only affects parts of the hunting plots. In this case I will
assume that the percentage of impact will reduce over time as reforestation allows the ES to be
recovered.
With this data the impact of hunting activities can be calculated as follows:
1
Where:
VH= Valuation of loss of hunting opportunities
P=price of meat in local markets
Q= volume of kilos hunted per year
f= number of households
t= period of time for the impact in years
at= percentage of affected hunting opportunities in year t
$346318.82
Even though the impact on hunting is temporary, it is extended throughout the reforestation phase.
The impact will be reduced while the area recovers its forest cover. For this reason the value of the
impact accounts for the reforestation phase and diminishes over time.
5.8.3. Valuation of the impacts on fishing (VF)
According to the EIA fishing is one of the top three economic activities in the area. The
percentage of households that fish are the following in each area:
Yurimaguas Sillay-Jeberos
19.2% 47.2%
(CEPSA Peru, 2012)

42
Most settlements are near rivers because in this area, rivers are used for fishing and
transportation, roads are only available in Yurimaguas. Also the frequency of fishing is
between 1 to 2 times a week in most cases.
According to the Household Survey in the average selling price was $ 1.54 per kilo, and the
volume of weekly fishing is on average: Yurimaguas 403Kg per year, Jeberos 184.6Kg year,
Sillay 586Kg per year. Part of these fish is consumed and the rest is sold.
I will assume that the impacts on fishing will take place during the project plus some
months until the flow of the river restores the normal fishing activities (1year) and during
the reforestation plus a couple of months until the flow of fish is recovered (6 months).
The EIA stated that this impact will be very small and estimates a magnitude for it
equivalent to 7%.
Where:
VF=valuation of the impacts on fishing
P= price per kilo of fish
q= Kg fished per year
t= time
Imag= magnitude of the impact
fam= number of families that fish
$25413.6
Even though, the project doesn’t include seismic lines in the rivers, the increase in
transportation, which will be conducted mostly through rivers, will have a negative impact
on this activity.
5.8.4. Valuation of the loss of forest product collection for local communities
Deforestation will reduce the number of species available for collection. In the area of influence of
the Project villagers collect products such as fruit, medicinal plants, leaves, branches, roots, etc..,
Their diversity varies according to the season (this activity is more frequent in February, August and
December). In the Yurimaguas sector the percentage of households that perform this activity in
10% while in Sillay-Jeberos the percentage is 65.3%. The house hold survey doesn’t have
information in regard to the volume of collected products, uses and trade, for this reason it is not
43
possible to estimate an amount. However, reviewing the forest inventory I couldn’t find the species
that they indicate they collect for food (orange, pineapple, mango, chestnut, etc.) (CEPSA Peru,
2012). Further research could be done on the species included in the forest inventory and their use
for medicinal purposes and timber.
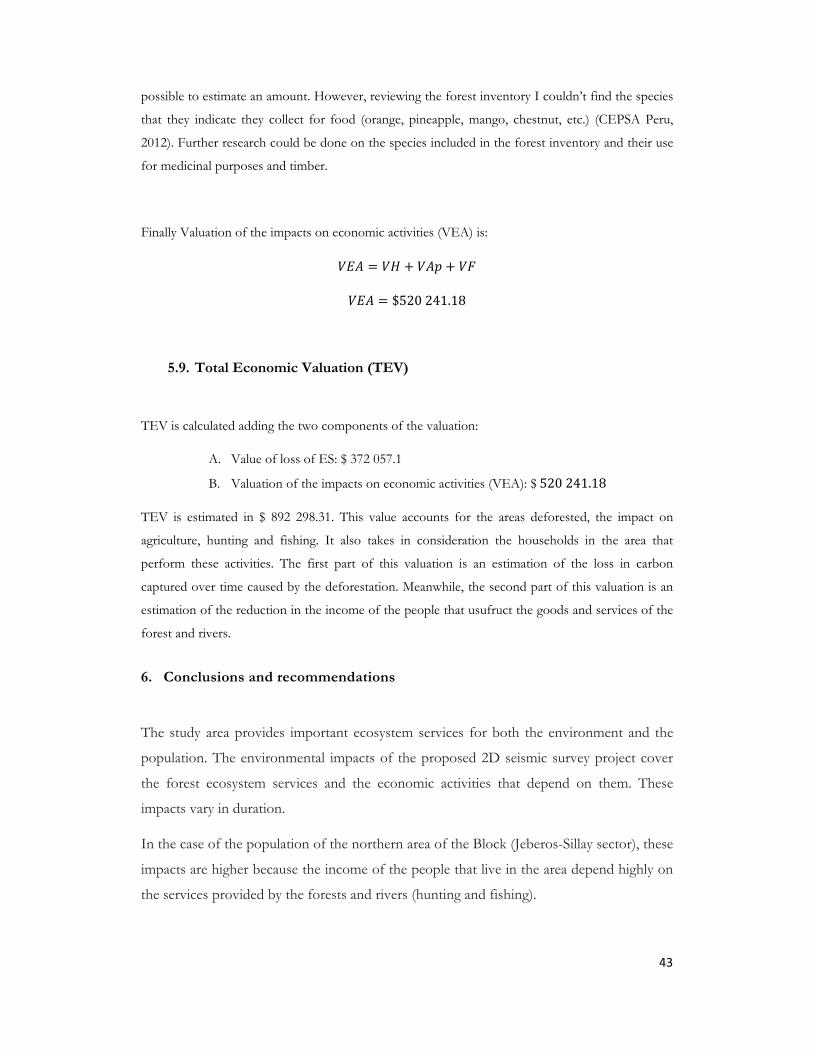
Finally Valuation of the impacts on economic activities (VEA) is:
$520241.18
5.9. Total Economic Valuation (TEV)
TEV is calculated adding the two components of the valuation:
A. Value of loss of ES: $ 372 057.1
B. Valuation of the impacts on economic activities (VEA): $520241.18
TEV is estimated in $ 892 298.31. This value accounts for the areas deforested, the impact on
agriculture, hunting and fishing. It also takes in consideration the households in the area that
perform these activities. The first part of this valuation is an estimation of the loss in carbon
captured over time caused by the deforestation. Meanwhile, the second part of this valuation is an
estimation of the reduction in the income of the people that usufruct the goods and services of the
forest and rivers.
6. Conclusions and recommendations
The study area provides important ecosystem services for both the environment and the
population. The environmental impacts of the proposed 2D seismic survey project cover
the forest ecosystem services and the economic activities that depend on them. These
impacts vary in duration.
In the case of the population of the northern area of the Block (Jeberos-Sillay sector), these
impacts are higher because the income of the people that live in the area depend highly on
the services provided by the forests and rivers (hunting and fishing).

44
In the case of the southern area (Yurimaguas sector) the impacts encompass fewer
inhabitants. This sector has a large urban population; however, seismic lines and other
components of the project are far from urban areas and located in the forest.
The forest provides the service of carbon capture and storage. The impacts extend beyond
deforestation. It was estimated that on average it take 10 years to recover the original
carbon sequestration capacity of the forest. During those years, the reforested area will
capture carbon at increasingly higher rates until the original level is recovered. However,
reforestation fails to compensate for the loss in the flow of sequestration.
Research suggests that reforesting in stages, simulating the natural way in which a forest
restores its original state, takes longer but is highly successful in the recovery of the lost ES
(Gutierrez, 2012). The literature reviewed suggests also that it takes between 3 and 5 years
to recover naturally the soil nutrients (Gutierrez, 2012). It also states that reforestation
should start after this period of time, first planting pioneer local species and after that
introducing the original native species. This process can take up to 62 years but it assigns a
high probability for the recovery of the original biodiversity, nutrients cycle, and other
ecosystem services (Gutierrez, 2012).
In regard to the carbon credit price used in this valuation, Peru isn’t part of a compliance
markets for carbon credits, it only participates in voluntary schemes. For this reason,
payments for carbon credits in Peru are lower than the international average (Murray,
Pendleton, Jenkins, & Sifleet, 2011).
In order to increase the prices of Peruvian carbon it would be necessary to have the auspice
of the UNFCCC or another compliance system. Peruvian environmental institutions are
new and still developing enforcement mechanisms (Moron & Sanborn, 2005). In this
context, creating a compliance market is not going to be possible as long as the institutions
are not strong enough (Moron & Sanborn, 2005). Colombia has a successful command and
control compensation scheme in which the government estimates for each number of
deforested hectares a number of reforestation hectares depending on the biodiversity
richness, rarity, transformation rate, and other factors (Ministerio de Ambiente y Desarrollo
Sostenible, 2012). This compensation is established before the project starts so that the
companies can take this in account when performing cost-benefit analysis. This experience
can be taken in consideration to compensate the lack of compliance markets for carbon

45
credits and strong institutions in Peru. This can also help companies internalize the cost of
the impacts of their projects on the environment.
Even though many environmental and risk management programs exist, not all impacts can
be offset. The time span of the estimated impacts is longer than estimated in the EIA. The
impacts on the economy of the local communities should be considered in the calculation
of the compensations since they depend on the ecosystem services of the forest that will be
affected by the project.
In regard to the application of this findings in the context of the EIA’s in Peru; comparing
the results of this valuation with the results of the valuation presented for the original EIA,
the difference in the methodology and data used make a large difference in the results. The
value for the impacts in the original EIA is one third of the value estimated using this
methodology and data. The most important differences in the calculations are: time span
and use of local data versus literature for different places.
Even though the regulation requires companies to perform economic valuations
considering “environmental damage, the cost of mitigation, control, environmental
remediation or rehabilitation, and the cost of the environmental management measures that
may be appropriate for compensation” (Ministerio del Ambiente, 2001), regulation is very
broad in regard to the methodology, spans of the impacts and data that can be used.
This kind of regulation allows for discretion in choosing data and methodology, therefor it
leads to results and studies that are not comparable, generating conflicts with communities
when they feel they have been treated unequally. In addition, this doesn’t help the
companies internalize the real social, economic and environmental cost of their projects.
The regulation should contain common points for the valuation, as they do in Colombia
where the Ministry developed databases and maps for each ecosystem service and the
characterization of the biodiversity according to different factors (Ministerio de Ambiente y
Desarrollo Sostenible, 2012). Also it is important to establish a baseline for the timespan of
the different impacts using relevant research to reduce the level of discretion allowed.
Finally, it is important to remember that the goal of performing economic valuations of the
environmental impacts for any project should be to internalize the real costs of the project,
taking in account the impacts on all stakeholders and on the environment. Economic
valuations should be tools for companies to help them assign resources for prevention,
mitigation and compensation programs efficiently, thus making their projects sustainable.

46
7. Bibliography
Barbier, E., Brown, G., Dalmazzone, S., Folke, C., Gadgil, M., Hanley, N., . . . Perrings, C. (1994). The Economic Value of Biodiversity. (E. Publications, Ed.) London.
Brasev, R. (2004). Guía Práctica sobre el Uso de Modelos Econométricos para los Métodos de Valoración Contingente y el Costo de Viaje a través del Programa Econométrico LIMDEP.
C . A . J . GIRARDIN*, Y. M. (2010). Net primary productivity allocation and cycling of carbon. Global Change Biology, 1-17.
CEPSA. (2014, 3 27). CEPSA Peru. Retrieved from The company: http://www.cepsa.com/cepsa/Quienes_somos/La_compania/CEPSA_en_el_mundo/Peru/?lang_choosen=en&lang_choosen_furl=es
CEPSA Peru. (2012). Estudio de Impacto Ambiental del Proyecto de Prospeccion Sísmica 2D y PErforación de Cuatro (04) Pozos Exploratorios en el Lote 130. Lima: GEMA.
Columbia University. (2005). ASB. Retrieved from Slash and Burn Agriculture: The Search for Alternatives: http://www.asb.cgiar.org/PDFwebdocs/Slash-and-Burn%20Agriculture-The-Search-for-Alternatives.pdf
Conesa, V. (2010). Guia Metodologica para la evaluación del impacto ambiental. Madrid: Mundi-PResa Libros.
Conservation International. (2010, Mach). El Cambio climatico y la funci'on de los bosques: Manual para la comunidad. Guyana.
DEFRA. (2014, 3 27). Department of Environment, Food and Rural Affairs. Retrieved from http://ec.europa.eu/environment/nature/biodiversity/economics/pdf/valuing_ecosystems.pdf
Foley, J., Asner, G., Costa, M., Coe, M., DeFires, R., Gibbs, H., . . . Snyder, P. (2007). Amazonia revealed:forest degradation andloss of ecosystem goodsand services in de Amazon Basin. Ecol Environ, 5(1), 25-32.
Frank, J., & Mark and Graham, M. (2008). Hydrocarbon Exploration & Production. 194. Oxford.
Giraldo , J., & Del Valle, J. (2011). Estudio del crecimiento de Prioria copaifera (Caesalpinaceae) mediante técnicas dendrocronológicas. Rev. biol. trop , 1813-1831. Retrieved 3 28, 2014, from http://www.scielo.sa.cr/scielo.php?script=sci_arttext&pid=S0034-77442011000400032
Gutierrez, F. (2012). Estrategia de restauración forestalk sostenible ndel bosque reservado de la Universidad Nacional Agraria de la Selva- Tingomaria. Universidad Nacional FEderico Villareal.
IGN. (n.d.). Carta Nacional.
IPCC. (2000). IPCC. Retrieved from Special Report: Land Use, Land-Use Change and Forestry: http://www.ipcc.ch/ipccreports/sres/land_use/index.php?idp=25
47
Josse, c., Young, R., Lyons-Smith, R., Brooks, T., Frances, A., Corner, P., . . . Balslev, B. (2013). Decision-making inputs for the conservation of the western amazon basin. Ecologia Aplicada, 12(1), 45-65.
Leopold. (1971). A procedure for Evaluating Environmental Impact. Geological Survey, 645.
Ministerio de Ambiente y Desarrollo Sostenible. (2012). Minambiente. Retrieved from Manual para la asignación de compensaciones por pérdida de biodiversidad: http://www.minambiente.gov.co/documentos/normativa/resolucion/060214_manual_compensaciones_final.pdf
Ministerio del Ambiente. (2001, Abril 23). Ley Nº27446 Ley del Sistema Nacional de Evaluación de Impacto Ambiental. Lima, Peru.
Moron, E., & Sanborn, C. (2005). IADB. Retrieved from The Pitfalls of Policymaking in Peru:actors, institutions and the rules of the game: http://www.iadb.org/res/laresnetwork/files/pr233finaldraft.pdf
Murray, B., Pendleton, L., Jenkins, W., & Sifleet, S. (2011). Green Payments for Blue Carbon: Economic Incentives for Protecting Threatene Coastal Habitats. Durham: Nicholas Institute of the Environment Duke University.
Pearce, D., & Moran, D. (1994). The Economic Value of Biodiversity. London: Earthscan.
Peru21. (2013, 3 14). Peru21.pe. Retrieved 1 24, 2014, from Disney adquirió US$3,5 millones en bonos de carbono en San Martín: http://peru21.pe/economia/disney-adquirio-us35-millones-bonos-carbono-san-martin-2121712
Perupetro. (2014, 3 27). Perupetro. Retrieved from Block Maps: http://www.perupetro.com.pe/wps/wcm/connect/perupetro/site-en/ImportantInformation/Block%20Maps/Block%20Maps
Petrominerales Ltd. (2014). Estudio de Impacto Ambiental del Proyecto de Exploración Sismica 2D, 3D, Pozos Exploratorios y de Confirmación. Lima: GEMA.
Searcherseismic. (2013). Searcherseismic. Retrieved 4 26, 2013, from Halmahera 2D Non-Exclusive Seismic Survey: http://www.searcherseismic.com/Projects/Indonesia/Eastern_Indonesia/Halmahera.aspx
Sencion, G. (2002). Valoraci'on Econ'omica de un Ecosistema: Bosque tropical Peten, Guatemala. Guatemala: Universidad de la Republica.
TGS. (2013). Seismic Acquisition Basics. Retrieved 4 26, 2013, from http://www.tgs.com/geophysical/onshore-seismic-data/seismic-acquisition-basics.aspx
Thiaw, I., & Kumar, P. (2014). Values , payments and institutions for ecosystem management: a deeloping country perspective. In I. Thiaw, & P. Kumar, Values, Payments and Institutions for Ecosystem Management (pp. 1-15). Cheltenham: UNEP.
Wunder, S. (2008). Payments for environmental services and the poor: concepts and preliminary evidence. Environment and Development economics, 279-297.

48
Annex 1
Schedule of 2D seismic prospection activities - Yurimaguas Sector
PRINCIPAL STAGES WEEKS
1 2 3 4 5 6 7 8 9 10 11 12
Mobilization and Logistics
Construction of Camps, HP and DZ
Opening of Trails and Drilling of Holes
Registry - Seismic
Restoration and Reforestation
Demobilization
(CEPSA Peru, 2012)
Schedule of the 2D seismic prospection activities - Sillay Sector
PRINCIPAL STAGES WEEKS
1 2 3 4 5 6
Mobilization and Logistics
Construction of Camps, HP and DZ
Opening of Trails and Drilling of Holes
Registry - Seismic
Restoration and Reforestation
Demobilization
(CEPSA Peru, 2012)
49
Schedule of the 2D seismic prospection activities - Jeberos Sector
PRINCIPAL STAGES WEEKS
1 2 3 4 5 6 7 8
Mobilization and Logistics
Construction of Camps, HP and DZ
Opening of Trails and Drilling of Holes
Registry - Seismic
Restoration and Reforestation
Demobilization
(CEPSA Peru, 2012)

50
Annex 2
Detailed description of all identified environmental impacts, based on the Identification
Matrix of environmental impacts, extracted from the EIA of the project (CEPSA Peru,
2012):
Mobilization and Logistics
a. Organic and Mineral Soil Layer : The potential negative impact that could occur is the
alteration of the physicochemical properties of the organic layer and mineral soil , caused
by the potential spill of chemicals such as oils , lubricants and fuel during mobilization and
logistics.
b. Soil Quality: The negative impact that could arise is the alteration of soil quality due to
potential spills of oils, fuels and lubricants during their transport when mobilization is
carried out..
c. Quality of surface water and water sediments: The negative impact that could occur is
the alteration of the quality of surface water and water sediments caused by a spillage of
oils, lubricants, fuels , or improper disposal of solid waste on water bodies during
mobilization .
d. Air Quality: The negative impact that could be generated during mobilization and
logistics is the alteration of air quality by the emission of gases from combustion engine
used in the river, air and land transport.
e. Noise Level: Potential negative impacts that could occur include decreased hearing,
irritability and stress on workers, because of increased noise levels caused by the use of
river, air and land transport.
f. Birds, Mammals and Reptiles: The negative impact that could arise is the temporary
absence of birds, mammals and reptiles, due to human presence during mobilization.
g. Fish, plankton and benthos: Possible effects on aquatic organisms could be produced by
the occurrence of a chemical spill such as lubricants, fuel, oils, into water bodies, or poor
disposal of wastes, generated during transport. Another negative impact could be a
reduction of aquatic fauna due to fishing, hunting, transfer or trade of these species.
h. Visual Resource: A possible alteration of the landscape, which could be caused by poor
solid waste disposal.

51
I. Local Trade: A trade growth in the local population would occur due to the purchase of
domestic inputs by local workers who will be working in this activity due to the increase
of their income.
j. Native Population: Probable ethnic cultural conflicts between the native communities of
Jeberos and Sillay.
k. Settlers: Probable cultural conflicts with the population of the towns of the Yurimaguas
sector.
l. Local Temporary Employment: A positive impact will be an increase of economic
income of local workers, who will be working on the project for the mobilization and
logistics stage.
Construction of Camp , HP and DZ
a. Morphology: Changes in the original configuration of geomorphic surfaces due to the
construction of base camps and logistical sub base.
b. Drainage: An interruption of surface water (rivers and streams) could be caused by bad
disposal of cuts of vegetal coverage during construction of logistic camps, fly camps,
heliports and drop zones.
c. Processes: Erosion due to the strong rainfall in the area is likely to occur due to cutting
of vegetation during construction of logistical camps , fly camps , heliports and unloading
areas .
d. Temperature: The variation of microclimate is likely to occur, by increasing the
temperature in the area where the logistical camps, fly camps, heliports and unloading areas
will be constructed due to cutting its vegetation cover.
e. Precipitation: Increased incidence of rainfall typical of this environment could occur in
areas where, logistical camps, fly camps, heliports and unloading areas will be built.
f. Organic layer and Mineral Soil: partial or total disturbances of upper layer of soil (“Top
Soil”) which is the most fertile part of the soil.
g. Soil quality: Possible alteration of soil quality could be caused by poor disposal of
inorganic waste and chemical spills such as grease, oils and fuels, during the construction
of, logistics camps, fly camps, heliports and unloading areas.
h. Ecological Role: there could be a change in the ecological function of the soil, due to a

52
non-ecological use of facilities of infrastructure and the supply of raw materials during the
construction of the logistics camps , fly camps , heliports and unloading areas .
i. Surface water quality and sediments: The negative impact that could occur would be the
alteration of the quality of surface water and sediments of water caused by a spillage of oils
, lubricants, fuels or poor solid waste disposal on water bodies during construction of
logistical camps , fly camps , heliports and unloading areas .
j. Air quality: The impact on this environmental factor is negative and could manifest itself
in the possible alteration of air quality due to gas emission from the engines used for
construction of logistics camps , fly camps , heliports and areas discharge .
k. Noise level: Increased noise levels from the operation of electric generators could cause
hearing loss, irritability and stress on workers and the temporary migration of terrestrial
fauna during construction of logistics camps, fly camps, heliports and unloading areas.
l. Terrestrial Vegetation (Flora): Reduction of plant cover and biomass during construction
of logistics camps, fly camps , heliports and unloading areas .
m. Terrestrial Vegetation ( Underwood ) : Reduction of understory and its biomass and due
to the construction of logistics camps , fly camps , heliports and unloading areas .
n. Birds, mammals and reptiles: The impact on these environmental factors will be negative
because the vegetation will be removed from the area where the logistics camps , fly camps
, heliports and unloading areas will be built , so that wildlife will have to migrate looking
for new shelter and food.
o. Fish, plankton and benthos: Possible effects on aquatic organisms due to occurrence of
chemical spills such as lubricants, fuel, waste disposal etc. into water bodies. Also a
decrease in aquatic fauna could occur due to fishing, hunting, transfer or trade of these
species.
p. Visual resource (landscape): The alteration of the landscape is evident, due to the
construction of logistics camps, fly camps, heliports and unloading areas.
m. Local Commerce: Trade increment in the local population due to the purchase of
domestic supplies by local workers who will be working in this activity.
q. Land use: Alteration of land use in the logistical camps, heliports and unloading areas,
and possible conflicts with local villagers.
n. Native: Probable ethno- cultural conflicts with native communities of the Jeberos, Sillay
sectors, during the construction of the logistics camps, fly camps, heliports and unloading
areas. Resources of subsistence impairment.
o. Settlers: Probable cultural conflicts in the towns of Yurimaguas sector during the

53
construction of, logistics camps, fly camps, heliports and unloading areas. Resources of
Subsistence Impairment.
r. Local Temporary Jobs: Employment generation by hiring local labor in this activity will
be a positive impact.
s. Archaeological sites: The removal of vegetation cover and soil during construction of
logistical camps , fly camps , heliports and unloading areas could alter the archaeological
sites that may exist in the area , which would be a negative impact.
Opening of Trails and drilling of holes
a. Processes : Probable erosion by strong rainfall own medium , due to the cutting of the
undergrowth and soil compaction to open trail and drill holes.
b . Temperature: Variation microclimate temperaturadurante increased opening trails.
c . Precipitation: Increased incidence of rainfall on the floor during the opening of trails
and drill holes.
d . Organic and Mineral Soil Layer : partial or total disturbance of topsoil ( "Top Soil" )
which is the most fertile part of the soil during drilling of the holes.
e. Soil Quality: Soil quality may be altered due to fuel spills during drilling of the holes.
f. Quality of surface water and sediments of water: The negative impact that could occur is
the alteration of the quality of surface water and sediments of water, caused by a spillage of
oils, lubricants, fuels or poor disposal of solid waste on water bodies for the trail opening
and drilling holes.
g. Air quality: Alteration of air quality due to gas emission by combustion engines of
drilling equipment.
h. Noise level: Decreased hearing, irritability and stress on workers and temporary
migration of terrestrial fauna due to increased noise levels from the operation of the rig
holes.
i. Terrestrial Vegetation (Underwood): Reduction of understory and its biomass due to the
opening of trails and drilling holes.
j. Birds, Mammals and Reptiles: Temporary displacement of wildlife in general, caused by
the noise generated by the engines of the hole drilling equipment and human presence.
k. Fish, plankton and benthos: Likely decrease in aquatic fauna due to fishing, hunting,
transfer or trade of these species by the workers.
l. Visual resources: Possible alteration of scenic quality caused by the presence of solid

54
waste in the area, generated by workers in the area. This Impact would occur if the Waste
Management Program is not complied with.
m. Local Commerce: Enhanced Trade in the local population due to the purchase of
domestic supplies by workers who will be working in this activity.
n. Land use: Alteration of land use due to new trails passing by the towns and native
communities. Potential conflicts with local villagers.
o. Native: Probable ethnic - cultural conflicts in native communities of the Jeberos Sillay
sectors, during the opening of trails and drilling of holes. Impairment of subsistence
resources .
p. Settlers: Probable cultural conflicts in the towns of Yurimaguas sector during the
opening of trails and drilling of holes. Impairment of subsistence resources .
q. Local temporary employment: Employment generation by hiring local labor in this
activity will be a positive impact.
r. Archaeological sites: The removal of understory during the opening of the trails could
cause alterations of archaeological sites that may exist, which would be a negative impact.
Log- Seismic
a. Organic and Mineral Soil Layer: partial or total disturbance of topsoil the most fertile
part of the soil - during detonation of energy source ( pentolita ) material.
b. Soil Quality: Soil quality may be altered due to the detonation of the energy source (
pentolita ) material.
c. Noise level: Temporary displacement of wildlife in general due to the sudden increase in
noise levels detonation energy source ( pentolita ) material.
d. Local Commerce: Increased trade in the local population due to the purchase of
domestic supplies by local workers who will be working on the Log- Seismic activity.
e. Local Temporary Employment: Increase of temporary employment in the local
population due to the activity of Log- Seismic.
f. Archeological Sites: Likely disturbance of archaeological sites due to the detonation of
the energy source (pentolita) material.
Restoration and Reforestation
a. Drainage: Recovery of water course and reinjection of surface water (rivers and streams)

55
to near original levels due to the restoration of vegetation cover in, heliports , fly camps ,
drop zones and logistics camps.
b. Processes: The positive impact from this activity will prevent erosion due to the opening
of trails and building logistical camps, flyers, unloading areas and heliports.
c. Organic Layer and Mineral Soil: The impact will be positive because the restoration and
reforestation seek recovery of logged areas . The organic layer will be restored and this will
improve the physical and chemical properties of soil.
d. Soil Quality: The restoration and reforestation generate a positive impact on soil quality
because they seek to recover their physicochemical properties.
e. Ecological Function: This activity will generate recovery of damage caused by
dismantling of the logistics infrastructure in camps and fly camps.
f. Terrestrial Vegetation (Forest and Undergrowth): Reforestation in logistics camps, fly
camps, heliports and unloading areas will be fundamental to return these components back
to their almost original condition.
g. Birds, mammals and reptiles: The potential impact will be positive because reforested
affected areas such as logistics camps , fly camps , heliports and unloading areas , species
recover their shelter and food , thereby facilitating their return.
h. Visual resource (Landscape): The impact will be positive because the restoration of
disturbed areas, the landscape will resemble the originally found.
i. Local Commerce: Increased trade in the local population due to the purchase of domestic
supplies by local workers who will be working in the restoration and reforestation.
j. Local Temporary Jobs: Generating temporary employment for local workers because of
their extensive traditional knowledge of plants in the process of reforestation and soil
restoration.
Demobilization
a. Soil Quality: Soil compaction due to the transfer of personnel, equipment and materials.
b. Quality of surface water and water sediment: The negative impact that could occur is the
alteration of the quality of surface water and sediments of water caused by a spillage of oils,
lubricants or fuels on water bodies when demobilizing personnel, equipment and materials.
c. Air Quality: Impairment of air quality caused by demobilization of personnel, equipment
and machinery, due to the emission of gases generated during river, air and land transport.
d. Noise level: Stress on workers due to increased noise generated during demobilization of
56
personnel, equipment and machinery by river, air and land transport.
e. Birds, Mammals and Reptiles: Temporary deployment of terrestrial fauna in general due
to the demobilization of personnel, equipment and machinery through the river, air and
land transport.
f. Fish, plankton and benthos: Possible involvement of aquatic organisms by the
occurrence of a chemical spill, such as, lubricants, fuel oils in water bodies, or improper
disposal of solid waste generated during the demobilization of personnel, equipment and
machinery. Possible decreased aquatic fauna due to the eventual fishing, hunting, transfer
or trade of these species by the workers.
g. Visual Appeal ( Landscape ) : Possible alteration of the landscape , caused by poor solid
waste disposal .
h. Local Commerce: Increase in local trade due to income generation by local workers who
will be working in this activity.
i. Local Temporary Employment: Increased family income of local workers who will be
working in the demobilization project.
57
Annex 3
The value of use, that associates some type of interaction between man and the
natural media has do to with the welfare that such use provides to the economic
agents. It can be expressed in three ways (CEPSA Peru, 2012):
The value of direct use (VUD) corresponds to taking the most profitable or
most common or most frequent advantage of the resource. It is what when
taking advantage of the natural resources it can be present as raw material
tradable in any of its processing phases, according to the market demands.
But it can also include certain byproducts, considered as solid waste that may
have an economic use, or certain gases potentially recoverable. It should be
mentioned that such direct use may be commercial or non-commercial.
Many of the alternative uses may be important, such as the survival needs of
the local communities or for the mountain sports, or as an exceptional
landscape value, for example. It is therefore not restricted to what the value
represents in terms of private earnings. On the other hand, in the commercial
uses, this may be relevant for the local or international markets. Anyway, the
commercial values are, in general, easier to measure than the non-commercial
values..
The value of indirect use (VUI) corresponds to the ecological or ecosystem
functions, as is proposed by the majority of authors (Pearce et ál., 1994;
Barbier et ál., 1996). These ecological functions play a regulator role or
support to the economic activities that are associated to the resource. The
zone where the natural resource is located may be, for example, part of the
mountain ecosystem balance, or part of an area with high ecological value; or,
in a volcanic area, serve as contention barrier of the lava. The greatest
problem with the indirect use is its practically total absence from the markets,
reason why it is difficult to assign a value and cannot be normally considered
when taking economic decisions.
The value of option (VO) corresponds to what the individuals are willing to
pay to postpone the actual use and enable the future use of the resource. In
other words, not to use it today but rather tomorrow, in any of the
possibilities stated. It is something like an insurance whose purpose is to be
58
cautious upon an uncertain future, but it equally includes its use. Some
authors (Barbier et ál., 1994) also refer it as the quasi option value, to refer to
the specific topic of the information that may be useful today in the planning
of future developments.
The Non Use Value, that unlike the previous one does not involve interactions
between man and media, is associated to the intrinsic value of the environment
and can acquire the following two forms:
The Value of Existence (VE) corresponds to what certain individuals, due to
ethnical, cultural or altruistic reasons, are willing to pay to avoid using the
environmental resource, without relationship with current or future uses. In
other words, the attitude that the worshippers of the savage or native species,
of the natural beauty, or the salvation of the unique ecosystems.
The value of legacy (VL) corresponds to the wish that certain individuals
have to maintain the environmental resources untouchable, to be used by
their heirs and future generations. It does not make reference to definite
future uses by this generation but rather leaves the decision to those that will
come.
Placed as an equation, the Economic Total Value (VET) is expressed in the
following way:
VET = VU + VNU = (VUD + VUI + VO) + (VE + VL)
Where:
VET = Economic Total Value
VU = Value of Use
VNU = Value of Non Use
VUD = Value of Direct Use
VUI = Value of Indirect Use
VO = Value of Option
VE = Value of Existence
VL = Value of Legacy
59
This is the equation that summarizes the most accepted concepts to confront
the economic valuation of the natural resources and the environmental impacts,
their exploitation and their incorporation in the policy of development and
decision taking.
The assumptions of this methodology are:
1. The individual maximizes it’s given profit to a budget restriction given by the
income available, which must render him a greater welfare or at least maintain
the same level as the initial welfare.
2. The behavior of the individual in the hypothetical market is equal to a real
market.
3. The individual must have complete information about the benefit of the
goods to be used, which must include the availability to pay (DAP) or the
total economic value (VET).

Types of Value (Use and Non Use)
Prepared by GEMA using as basis the Practical Guide of Rado Barzev4
4 “Practical Guide about the Use of Econometric Models for the Methods of Contingent Valuation and the Travel Cost through the Econometric Program LIMDEP”, Rado Barzev, July 2004.
Value of Use Value of Non Use Direct Value of Use Indirect Value
of Use Value of Option Legacy Value Existence Value
Wood/Timber Vegetables Animal Food Handicraft Drinking water Water for
agriculture Water for Industry Tourism Pharmaceuticals Construction Raw Material Research Education Repro Species Biomass Medicine Plants Ornamental Plants
Underground Water supplier
Flood Control Sediment
Retention Nutrients
Retention Main. Quality
of Water Biodiversity
Support 02 Production C02 snatches Scenery Beauty Basin
Protection Pollination Reproduction
of Species
Species Habitat
Preservation Biodiversity
Protection Pharmaceutical
Potential Tourist
Potential
Cultural Legacy
Structural Legacy
Historical Inheritance
Generational Inheritance
Species in Extinction
Aesthetics Preservation Video
Consumption